construct accident statistics · construct accident statistics fatal injuries 2008 – 2013 1)...
TRANSCRIPT
CONSTRUCT
ACCIDENT STATISTICS
SEPTEMBER 2014
STATEMENT FROM THE HEALTH AND SAFETY MANAGER TERRY CASBOLT
“Health and Safety is the number one issue for CONSTRUCT and all of its members”
2013 to 2014 has seen the specialist sector of RC Frame Construction grow considerably, which by its very nature has meant the number of people we now have working for us has risen sharply, but once again CONSTRUCT members have risen to meet this challenge face on with their proactive approach to Health, Safety and the Environment, and have achieved excellent results as shown by the accident statistics for 2013. Obviously there is always room for improvement and we must continue to work hard to ensure our industry leads the way in accident prevention.
I hope as you review the accident statistics summarised in this document you reflect on the statement Neil Mitchell, a past CONSTRUCT Chairman, said in a previous Health and Safety Statement “that the main aim and objective of all CONSTRUCT members is that every day we send all who work for us on our sites, home safely to their families”. I, as the current Health and Safety Manager, endorse this statement and believe this to be true of our members today.
1
HEALTH & SAFETY CHARTER
Aims & Objectives:• Eliminateaccidentsandinjuriesonconstructionsites•Advancehighprofessionalstandardsandexcellenceintheconstructionofin-situ
RC frames and other structures•Raisetheprofileofsafetyandhealthintheconstructionindustry
Health & Safety Commitments:•ToleadimprovementsinHealth&Safetyandwelfareinconstruction•Toproactivelyworktoeliminateandreducerisksassociatedwith
construction activities•Toprovideaforumforthediscussionofconstructionrelatedhealth,safety,and
welfare and associated environmental issues•ToreportannuallyonHealth&Safetyperformance•Toleadinbehaviouralchangeonalloursitestoeliminateaccidentsandwork
related ill health•Toachieveafullyqualifiedandcompetentworkforce•Toimprovethequalityandcompetencyoffrontlinesupervision•Promotethebenefitsofworkplacehealthandsafety•Exchangebestpracticeandlessonslearnt•Takecollectiveactiontodriveindustryimprovementsandthemanagementof
construction risks
CONSTRUCT ACCIDENT STATISTICS
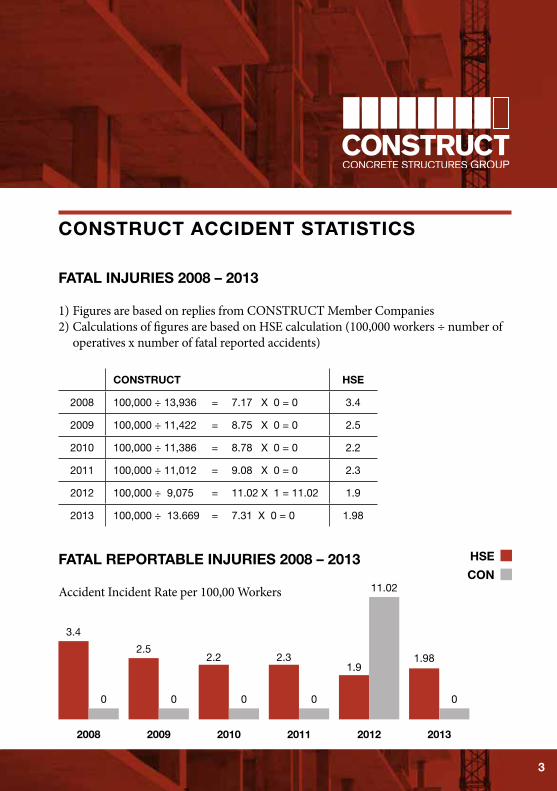
FATAL INJURIES 2008 – 2013
1) Figures are based on replies from CONSTRUCT Member Companies2)CalculationsoffiguresarebasedonHSEcalculation(100,000workers÷numberof
operatives x number of fatal reported accidents)
CONSTRUCT HSE
2008 100,000 ÷ 13,936 = 7.17 X 0 = 0 3.4
2009 100,000 ÷ 11,422 = 8.75 X 0 = 0 2.5
2010 100,000 ÷ 11,386 = 8.78 X 0 = 0 2.2
2011 100,000 ÷ 11,012 = 9.08 X 0 = 0 2.3
2012 100,000 ÷ 9,075 = 11.02 X 1 = 11.02 1.9
2013 100,000 ÷ 13.669 = 7.31 X 0 = 0 1.98
FATAL REPORTABLE INJURIES 2008 – 2013
AccidentIncidentRateper100,00Workers
2008
3.4
1.98
0 0 0 0
11.02
0
2.52.2 2.3
1.9
2009 2010 2011 2012 2013
HSE
CON
3
CONSTRUCT ACCIDENT STATISTICS
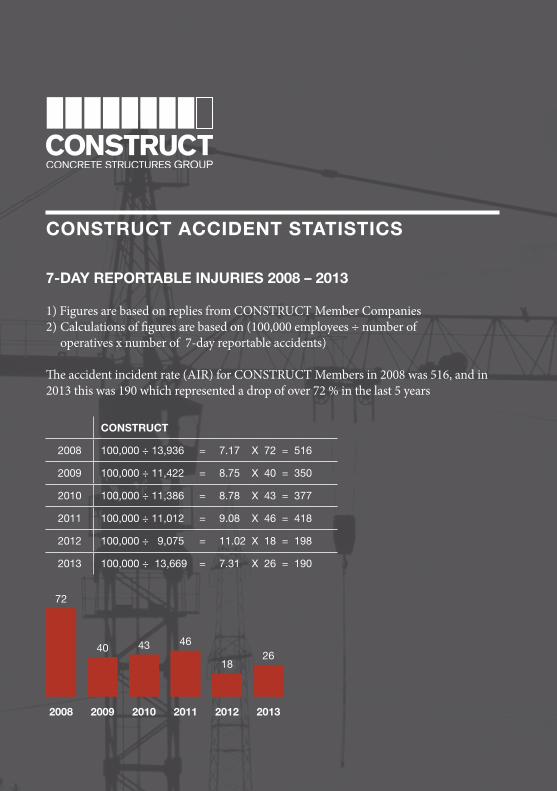
7-DAY REPORTABLE INJURIES 2008 – 2013
1) Figures are based on replies from CONSTRUCT Member Companies 2)Calculationsoffiguresarebasedon(100,000employees÷numberof
operativesxnumberof7-dayreportableaccidents)
Theaccidentincidentrate(AIR)forCONSTRUCT Members in 2008 was 516, and in 2013 this was 190 which represented a drop of over 72 % in the last 5 years
CONSTRUCT
2008 100,000 ÷ 13,936 = 7.17 X 72 = 516
2009 100,000 ÷ 11,422 = 8.75 X 40 = 350
2010 100,000 ÷ 11,386 = 8.78 X 43 = 377
2011 100,000 ÷ 11,012 = 9.08 X 46 = 418
2012 100,000 ÷ 9,075 = 11.02 X 18 = 198
2013 100,000 ÷ 13,669 = 7.31 X 26 = 190
2008 2009 2010 2011 2012
72
40 43 46
18
2013
26
CONSTRUCT MEMBERS
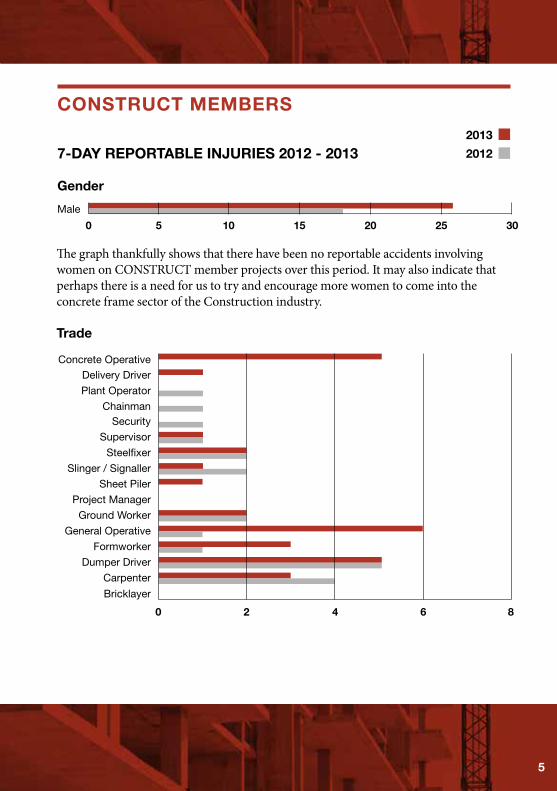
7-DAY REPORTABLE INJURIES 2012 - 2013
Gender
2013
2012
Concrete OperativeDelivery Driver
Plant Operator
ChainmanSecurity
Supervisor
Steelfixer
Slinger / Signaller
Sheet Piler
Project Manager
Ground Worker
General Operative
Formworker
Dumper Driver
Carpenter
Bricklayer
0 8642
Male
0 5 10 15 20 25 30
The graph thankfully shows that there have been no reportable accidents involving women on CONSTRUCT member projects over this period. It may also indicate that perhaps there is a need for us to try and encourage more women to come into the concrete frame sector of the Construction industry.
Trade
5
CONSTRUCT MEMBERS
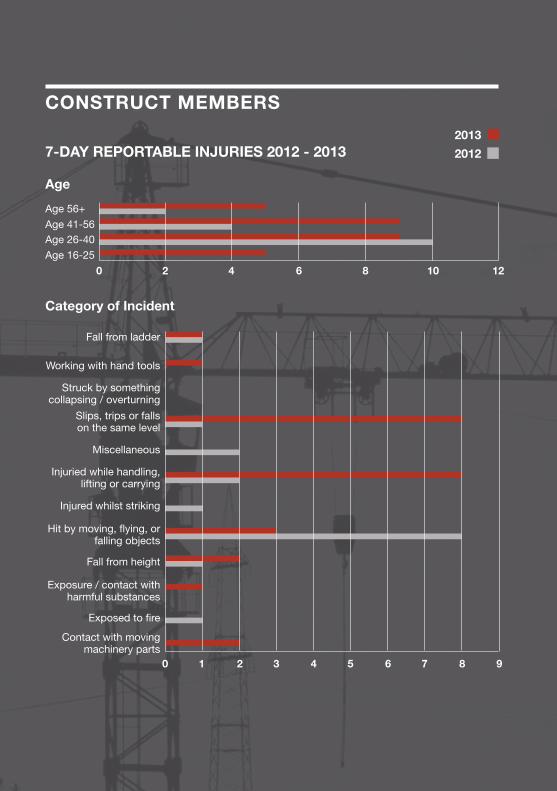
7-DAY REPORTABLE INJURIES 2012 - 2013
Age
2013
2012
Age 56+
Age 41-56Age 26-40
Age 16-25
0 2 4 6 8 10 12
Category of Incident
Fall from ladder
Working with hand tools
Struck by something collapsing / overturning
Slips, trips or falls on the same level
Miscellaneous
Injuried while handling, lifting or carrying
Injured whilst striking
Hit by moving, flying, or falling objects
Fall from height
Exposure / contact with harmful substances
Exposed to fire
Contact with moving machinery parts
0 1 2 3 4 5 6 7 8 9
CONSTRUCT ACCIDENT STATISTICS
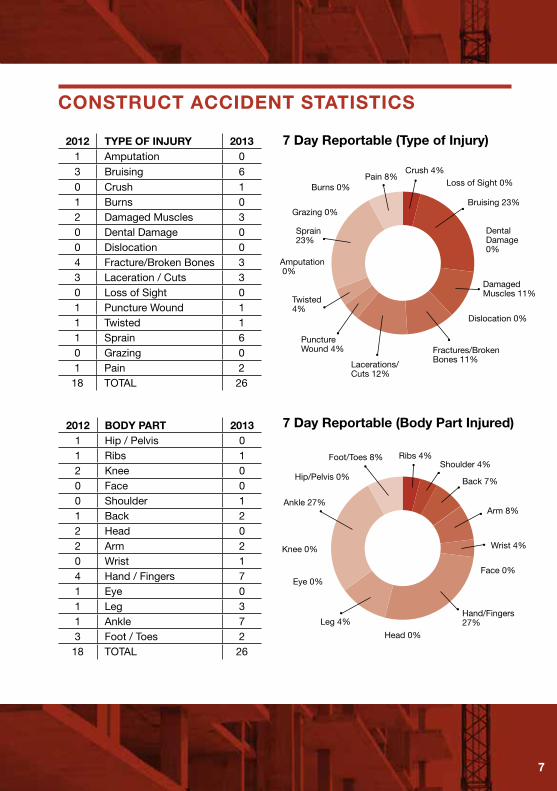
2012 TYPE OF INJURY 20131 Amputation 03 Bruising 60 Crush 11 Burns 02 Damaged Muscles 30 Dental Damage 00 Dislocation 04 Fracture/Broken Bones 33 Laceration / Cuts 30 Loss of Sight 01 Puncture Wound 11 Twisted 11 Sprain 60 Grazing 01 Pain 2
18 TOTAL 26
7 Day Reportable (Type of Injury)
Bruising 23%
Burns 0%
Grazing 0%
Amputation 0%
Damaged Muscles 11%
Fractures/Broken Bones 11%
Dental Damage 0%
Dislocation 0%
Lacerations/Cuts 12%
Puncture Wound 4%
Twisted 4%
Sprain 23%
Pain 8%Crush 4%
Loss of Sight 0%
7
2012 BODY PART 20131 Hip / Pelvis 01 Ribs 12 Knee 00 Face 00 Shoulder 11 Back 22 Head 02 Arm 20 Wrist 14 Hand / Fingers 71 Eye 01 Leg 31 Ankle 73 Foot / Toes 2
18 TOTAL 26
Ribs 4%Foot/Toes 8%
Hip/Pelvis 0% Back 7%
Face 0%
Arm 8%
Wrist 4%
Head 0%
Eye 0%
Ankle 27%
Knee 0%
Leg 4%Hand/Fingers 27%
Shoulder 4%
7 Day Reportable (Body Part Injured)
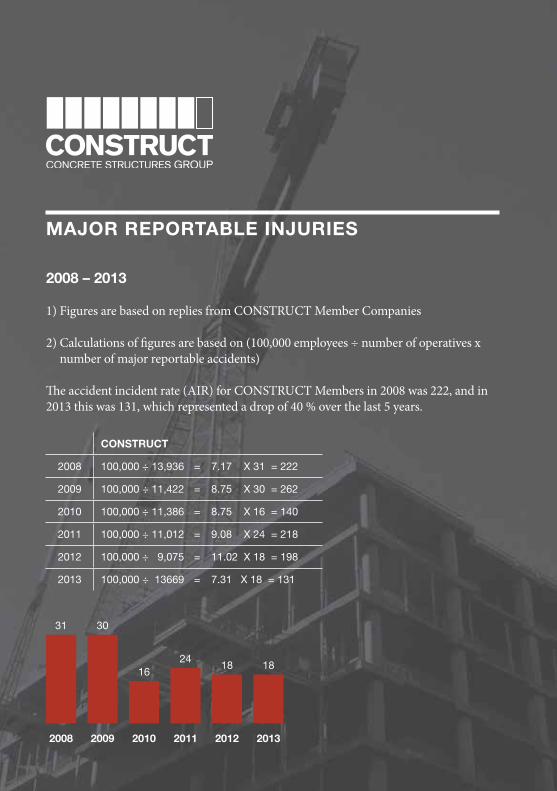
MAJOR REPORTABLE INJURIES
2008 – 2013
1) Figures are based on replies from CONSTRUCT Member Companies 2)Calculationsoffiguresarebasedon(100,000employees÷numberofoperativesx
number of major reportable accidents)
Theaccidentincidentrate(AIR)forCONSTRUCT Members in 2008 was 222, and in 2013 this was 131, which represented a drop of 40 % over the last 5 years.
CONSTRUCT
2008 100,000 ÷ 13,936 = 7.17 X 31 = 222
2009 100,000 ÷ 11,422 = 8.75 X 30 = 262
2010 100,000 ÷ 11,386 = 8.75 X 16 = 140
2011 100,000 ÷ 11,012 = 9.08 X 24 = 218
2012 100,000 ÷ 9,075 = 11.02 X 18 = 198
2013 100,000 ÷ 13669 = 7.31 X 18 = 131
2008 2009 2010 2011 2012
31 30
1624
18 18
2013
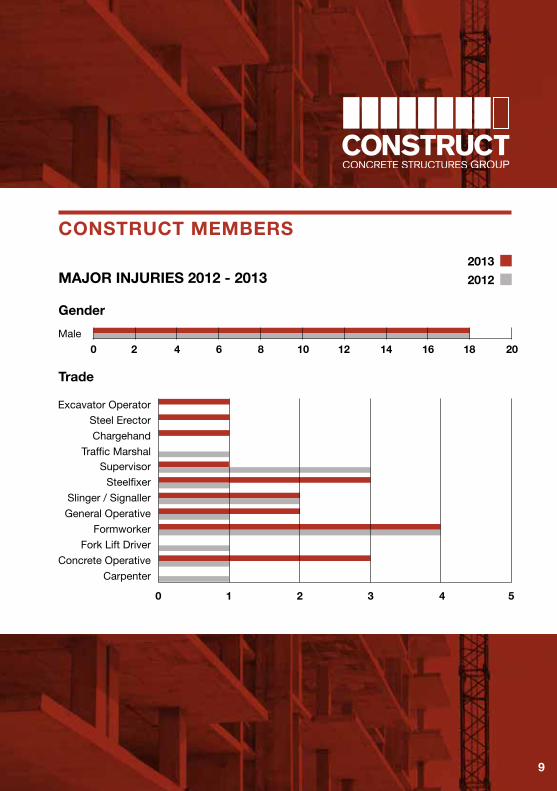
CONSTRUCT MEMBERS
MAJOR INJURIES 2012 - 2013
Gender
2013
2012
Male
0 4 62 8 10 12 14 16 18 20
Trade
Excavator OperatorSteel Erector
Chargehand
Traffic MarshalSupervisor
Steelfixer
Slinger / Signaller
General Operative
Formworker
Fork Lift Driver
Concrete Operative
Carpenter
0 54321
9
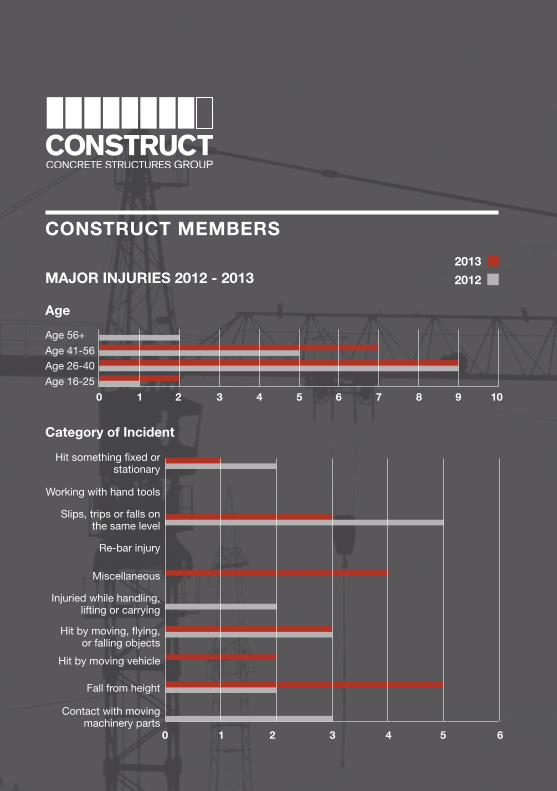
CONSTRUCT MEMBERS
MAJOR INJURIES 2012 - 2013
Age
2013
2012
Age 56+
Age 41-56Age 26-40
Age 16-25
0 2 31 4 5 6 7 8 9 10
Category of Incident
Hit something fixed or stationary
Working with hand tools
Slips, trips or falls on the same level
Re-bar injury
Miscellaneous
Injuried while handling, lifting or carrying
Hit by moving, flying, or falling objects
Hit by moving vehicle
Fall from height
Contact with moving machinery parts
0 1 2 3 4 5 6
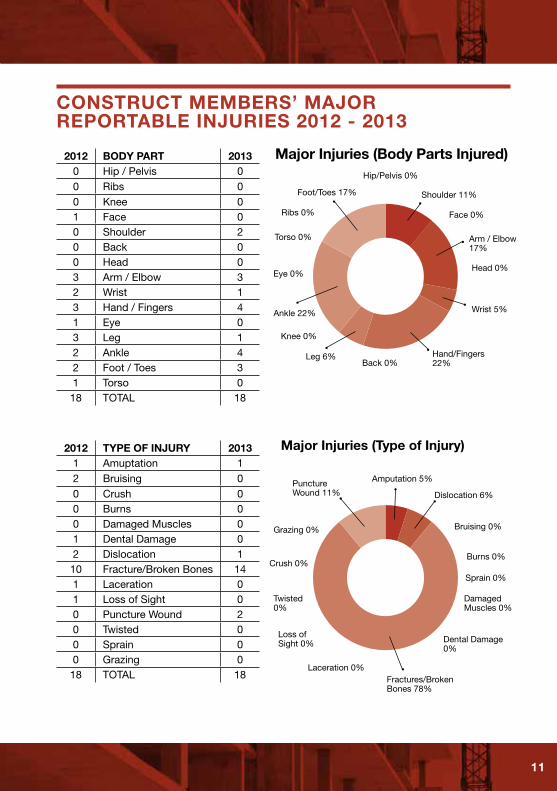
CONSTRUCT MEMBERS’ MAJOR REPORTABLE INJURIES 2012 - 2013
11
2012 BODY PART 20130 Hip / Pelvis 00 Ribs 00 Knee 01 Face 00 Shoulder 20 Back 00 Head 03 Arm / Elbow 32 Wrist 13 Hand / Fingers 41 Eye 03 Leg 12 Ankle 42 Foot / Toes 31 Torso 0
18 TOTAL 18
Major Injuries (Body Parts Injured)
Foot/Toes 17%
Hip/Pelvis 0%
Face 0%
Back 0%
Arm / Elbow 17%
Wrist 5%
Head 0%
Sprain 0%
Crush 0%
Knee 0%
Ribs 0%
Eye 0%
Ankle 22%
Torso 0%
Leg 6% Hand/Fingers 22%
Shoulder 11%
2012 TYPE OF INJURY 20131 Amuptation 12 Bruising 00 Crush 00 Burns 00 Damaged Muscles 01 Dental Damage 02 Dislocation 1
10 Fracture/Broken Bones 141 Laceration 01 Loss of Sight 00 Puncture Wound 20 Twisted 00 Sprain 00 Grazing 0
18 TOTAL 18
Major Injuries (Type of Injury)
Fractures/Broken Bones 78%
Dislocation 6%
Amputation 5%
Bruising 0%
Burns 0%
Puncture Wound 11%
Grazing 0%
Damaged Muscles 0%
Dental Damage 0%
Laceration 0%
Twisted 0%
Loss of Sight 0%
RELEVANT PUBLICATIONS
THE NATIONAL STRUCTURAL CONCRETE SPECIFICATION (3rd Edition) - £20.00
THE NATIONAL STRUCTURAL CONCRETE SPECIFICATION (3rd Edition) - CD £10.00
THE NATIONAL STRUCTURAL CONCRETE SPECIFICATION (4th Edition) - £45.00
GUIDE TO THE SAFE USE OF FORMWORK AND FALSEWORK - £10.00
SAFE ERECTION AND DISMANTLING OF SOFFIT SUPPORT SYSTEMS DVD - £5.00
GUIDE TO THE SAFE TRANSPORTATION OF FORMWORK AND FALSEWORK - £5.00
GUIDE TO FLAT SLAB FORMWORK AND FALSEWORK - £60.00
CONCRETE BUILDINGS - £5.00
PLAIN FORMED CONCRETE FINISHES - £60.00
ECONOMIC CONCRETE FRAME ELEMENTS TO EUROCODE 2 - £25.00
PARTNERING IN THE CONCRETE INDUSTRY - £10.00
LIFTING OPERATIONS PLAN TEMPLATES DVD - £5.00
ENVIRONMENTAL PLAN TEMPLATES - £5.00
HEALTH & SAFETY VIDEO SESSION PRESENTER PACK - FOC
FREE TO DOWNLOAD FROM OUR WEBSITEBEST PRACTICE GUIDES
COMMON BEST PRACTICE GUIDANCE NOTES
CASE STUDIES
For further information on our publications and to download an order form, please go to our website www.construct.org.uk
13
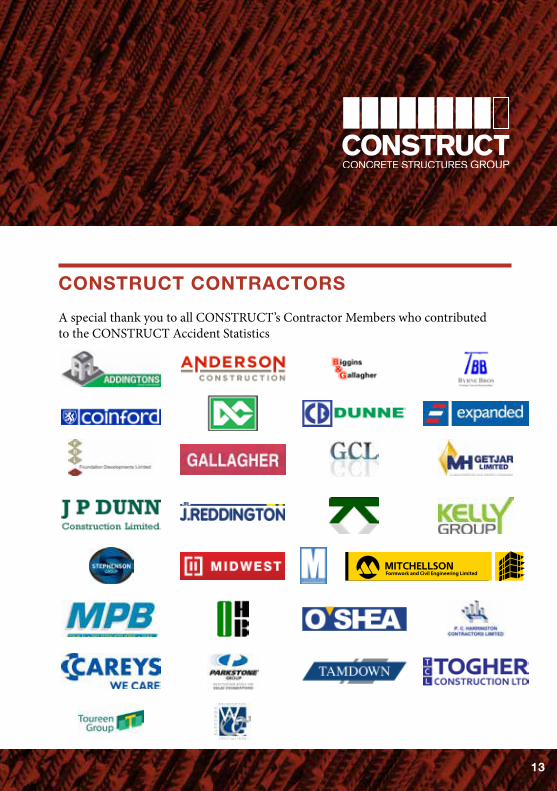
CONSTRUCT CONTRACTORS
AspecialthankyoutoallCONSTRUCT’sContractorMemberswhocontributedtotheCONSTRUCTAccidentStatistics
Formwork and Civil Engineering LimitedMITCHELLSON
13
RiversideHouse|4MeadowsBusinessPark StationApproach|BlackwaterCamberley|SurreyGU179AB
Tel: 01276 38444 | Fax: 01276 600242E-mail:[email protected]:www.construct.org.uk
Partfundedby:
This project has been delivered with support from the CITB Growth Fund, which aims to ensure that the construction industry has the right people, with the right skills,intherightplace,attherighttimeandisequippedto meet the future skills demands of the industry.
Design by:
www.orpendesignsolutions.com