uranium one inc · loans advanced to joint ventures - - (2.8) - interest received 2.3 2.2 4.4 4.2...
TRANSCRIPT

Uranium One Inc.
Consolidated Financial Statements For the three and six months ended June 30, 2012 (Unaudited) (In U.S. dollars, tabular amounts in millions, except where indicated)

CONSOLIDATED INCOME STATEMENTS - UNAUDITED For the three and six months ended June 30, 2012 and 2011
URANIUM ONE INC. Financial Statements 1
THREE MONTHS ENDED SIX MONTHS ENDED NOTES JUN 30, 2012 JUN 30, 2011 JUN 30, 2012 JUN 30, 2011
US$m US$m US$m US$m Revenues 96.8 112.9 192.7 214.8 Cost of sales Operating expense (31.0) (28.5) (56.6) (51.8) Depreciation (25.7) (22.7) (46.7) (50.1) Earnings from mine operations 40.1 61.7 89.4 112.9 General and administrative (11.0) (11.2) (21.2) (23.4) Exploration expense (1.8) (1.2) (2.7) (2.4) Care and maintenance (0.4) (0.4) (0.9) (0.7) Operating earnings 26.9 48.9 64.6 86.4 Finance income 3.1 2.0 5.3 3.8 Finance expense (18.6) (12.1) (35.6) (23.6) Foreign exchange gain / (loss) 16.6 (0.3) 3.8 (5.6) Corporate development expense (0.5) (0.2) (2.4) (0.9) Other 0.1 1.9 1.1 1.7 Earnings before income taxes 27.6 40.2 36.8 61.8 Current and deferred income tax recovery / (expense) 1.6 (10.5) (3.1) (18.1) Net earnings 29.2 29.7 33.7 43.7 Net earnings per share
Basic 0.03 0.03 0.04 0.05 Diluted 0.03 0.03 0.04 0.05
Weighted average number of shares (millions)
Basic 957.2 957.2 957.2 957.2 Diluted 1,039.7 1,049.7 1,039.7 1,049.7
CONSOLIDATED STATEMENTS OF COMPREHENSIVE INCOME / (LOSS) - UNAUDITED For the three and six months ended June 30, 2012 and 2011
THREE MONTHS ENDED SIX MONTHS ENDED NOTES JUN 30, 2012 JUN 30, 2011 JUN 30, 2012 JUN 30, 2011 US$m US$m US$m US$m
Other comprehensive income / (loss) for the period Unrealized (loss) / gain recognized on translation of foreign operations
(22.9) (4.6) (18.7) 11.3
Unrealized fair value adjustments on available for sale securities - - (0.2) -
Unrealized foreign exchange gain on Ruble Bonds 44.9 - 12.0 -
Unrealized fair value loss on Ruble Bonds swap derivative (51.8) - (14.5) -
Total other comprehensive (loss) / income for the period (29.8) (4.6) (21.4) 11.3
Net earnings 29.2 29.7 33.7 43.7
Total comprehensive (loss) / income (0.6) 25.1 12.3 55.0
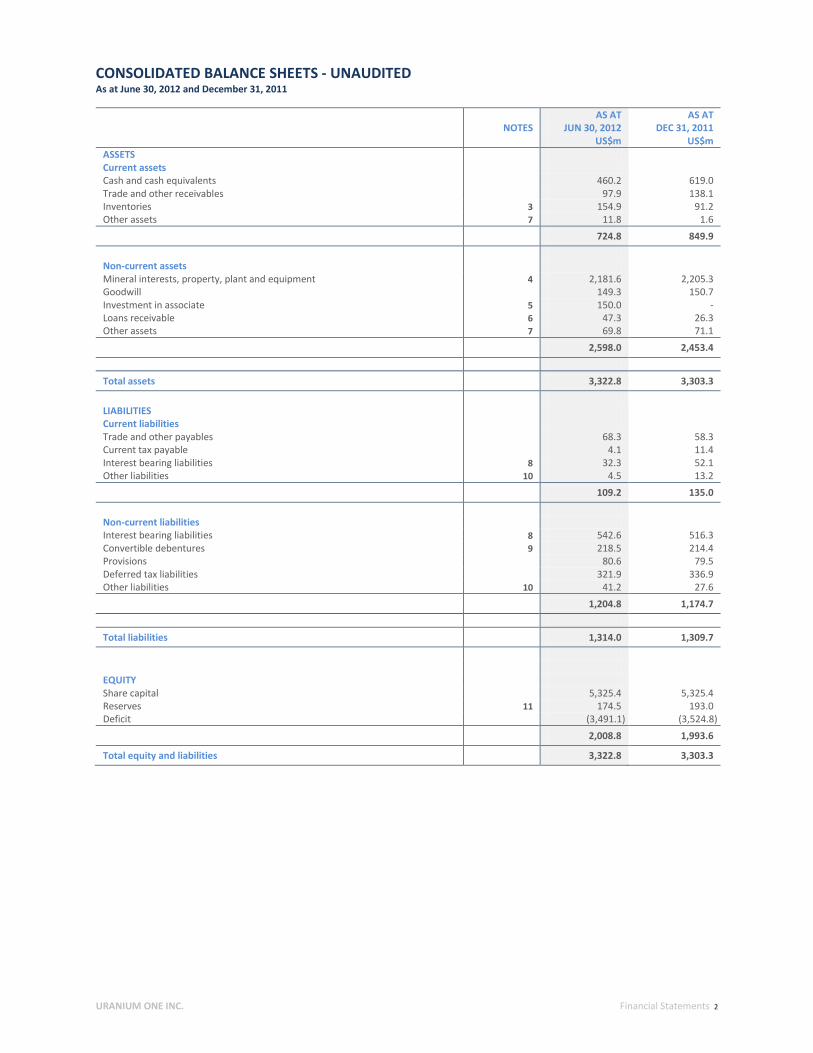
CONSOLIDATED BALANCE SHEETS - UNAUDITED As at June 30, 2012 and December 31, 2011
URANIUM ONE INC. Financial Statements 2
NOTES
AS AT JUN 30, 2012
AS AT DEC 31, 2011
US$m US$m ASSETS Current assets Cash and cash equivalents 460.2 619.0 Trade and other receivables 97.9 138.1 Inventories 3 154.9 91.2 Other assets 7 11.8 1.6
724.8 849.9 Non-current assets Mineral interests, property, plant and equipment 4 2,181.6 2,205.3 Goodwill 149.3 150.7 Investment in associate 5 150.0 - Loans receivable 6 47.3 26.3 Other assets 7 69.8 71.1
2,598.0 2,453.4 Total assets 3,322.8 3,303.3 LIABILITIES Current liabilities Trade and other payables 68.3 58.3 Current tax payable 4.1 11.4 Interest bearing liabilities 8 32.3 52.1 Other liabilities 10 4.5 13.2
109.2 135.0 Non-current liabilities Interest bearing liabilities 8 542.6 516.3 Convertible debentures 9 218.5 214.4 Provisions 80.6 79.5 Deferred tax liabilities 321.9 336.9 Other liabilities 10 41.2 27.6
1,204.8 1,174.7 Total liabilities 1,314.0 1,309.7 EQUITY Share capital 5,325.4 5,325.4 Reserves 11 174.5 193.0 Deficit (3,491.1) (3,524.8)
2,008.8 1,993.6
Total equity and liabilities 3,322.8 3,303.3

CONSOLIDATED STATEMENTS OF CHANGES IN EQUITY - UNAUDITED For the periods ended June 30, 2012 and December 31, 2011
URANIUM ONE INC. Financial Statements 3
NUMBER OF
SHARES SHARE
CAPITAL RESERVES (NOTE 11) DEFICIT TOTAL
(millions) US$m US$m US$m US$m Balance as at January 1, 2011 957.2 5,325.4 236.0 (3,659.7) 1,901.7
Net earnings for the year - - - 88.4 88.4
Stock option expense - - 8.6 - 8.6
2006 Debentures settlement - - (46.5) 46.5 -
Unrealized loss on translation of foreign operations - - (3.1) - (3.1)
Unrealized foreign exchange gain on Ruble Bonds - - 14.3 - 14.3
Unrealized fair value loss on Ruble Bonds swap derivative - - (16.3) - (16.3)
Balance as at December 31, 2011 957.2 5,325.4 193.0 (3,524.8) 1,993.6
Net earnings for the period - - - 33.7 33.7
Stock option expense - - 2.9 - 2.9 Unrealized gain on translation of foreign operations - - (18.7) - (18.7)
Unrealized fair value adjustments on available for sale securities - - (0.2) - (0.2)
Unrealized foreign exchange gain on Ruble Bonds - - 12.0 - 12.0
Unrealized fair value loss on Ruble Bonds swap derivative - - (14.5) - (14.5)
Balance as at June 30, 2012 957.2 5,325.4 174.5 (3,491.1) 2,008.8
Balance as at January 1, 2011 957.2 5,325.4 236.0 (3,659.7) 1,901.7
Net earnings for the period - - - 43.7 43.7
Stock option expense - - 4.1 - 4.1
Unrealized gain on translation of foreign operations - - 11.3 - 11.3
Balance as at June 30, 2011 957.2 5,325.4 251.4 (3,616.0) 1,960.8

CONSOLIDATED STATEMENTS OF CASH FLOWS - UNAUDITED For the three months ended June 30, 2012 and 2011
URANIUM ONE INC. Financial Statements 4
THREE MONTHS ENDED SIX MONTHS ENDED NOTES JUN 30, 2012 JUN 30, 2011 JUN 30, 2012 JUN 30, 2011
US$m US$m US$m US$m Net earnings 29.2 29.7 33.7 43.7 Items not affecting cash: - Depreciation 25.7 22.7 46.7 50.1 - Stock option expense 1.9 1.4 2.9 4.1 - Finance income (3.1) (2.0) (5.3) (3.8) - Finance expense 18.6 12.1 35.6 23.6 - Unrealized foreign exchange (gain) / loss (21.9) (0.1) (7.2) 6.7 - Current income tax expense 3.3 13.1 15.1 26.4 - Deferred tax recovery (4.9) (2.6) (12.0) (8.3) - Other (1.4) (6.7) (0.3) (7.9) Movement in non-cash working capital (9.4) (37.6) 30.3 (24.9) Operating cash flows before interest and tax 38.0 30.0 139.5 109.7 Cash tax paid (22.5) (14.9) (34.2) (28.1) Cash interest paid (24.0) (12.2) (25.6) (13.7) Cash flows (used in) / from operating activities (8.5) 2.9 79.7 67.9 Additions of mineral interests, property, plant and equipment (44.8) (33.6) (83.5) (61.5) Cash receipts / (payments) for other assets 10.6 (7.0) (4.6) (12.7) Investment in associate 5 - - (150.0) - Loans to related parties (5.5) - (17.5) - Loans advanced to joint ventures - - (2.8) - Interest received 2.3 2.2 4.4 4.2 Cash flows used in investing activities (37.4) (38.4) (254.0) (70.0) External loans received by joint ventures, net of issue costs 2.2 - 48.3 (8.6) External loans repaid by joint ventures (0.8) (21.5) (27.8) - Settlement of unfavorable contract 10 (7.8) - (7.8) - Advances received - 3.2 3.6 3.2 Cash flows (used in) / from financing activities (6.4) (18.3) 16.3 (5.4)
Effects of exchange rate changes on cash and cash equivalents 0.3 0.4 (0.8) 1.5
Net decrease in cash and cash equivalents (52.0) (53.4) (158.8) (6.0)
Cash and cash equivalents at the beginning of the period 512.2 371.8 619.0 324.4 Cash and cash equivalents at the end of the period 460.2 318.4 460.2 318.4

NOTES TO THE CONSOLIDATED FINANCIAL STATEMENTS - UNAUDITED As at June 30, 2012 and December 31, 2011
URANIUM ONE INC. Financial Statements 5
1 NATURE OF OPERATIONS
Uranium One Inc. (“Uranium One”, and together with its subsidiaries and joint ventures collectively, the “Corporation”) is a Canadian corporation engaged through subsidiaries and joint ventures in the mining and production of uranium, and in the acquisition, exploration and development of properties for the production of uranium in Kazakhstan, Tanzania, the United States and Australia. The Corporation’s head office address is 333 Bay Street, Suite 1710, Toronto, Ontario, Canada, M5H 2R2. Uranium One is a controlled company, with JSC Atomredmetzoloto (“ARMZ”), a Russian state-owned mining company, owning 51.4% of the outstanding common shares. In Kazakhstan, the Corporation holds a 70% interest in the Betpak Dala joint venture, which owns the Akdala and South Inkai uranium mines, a 50% interest in the Karatau joint venture, which owns the Karatau uranium mine, a 50% interest in the Akbastau joint venture, which owns the Akbastau uranium mine, a 49.67% interest in the Zarechnoye joint venture, which owns the Zarechnoye uranium mine, and a 30% interest in the Kyzylkum joint venture, which owns the Kharasan project. In the United States, the Corporation owns the Willow Creek uranium mine and projects in the Powder River and Great Divide basins in Wyoming. The Corporation owns a 51% interest in the Honeymoon uranium project in Australia. The Corporation became the operator of the Mkuju River project in Tanzania in June 2011 and acquired a 13.9% interest in Mantra Resources Pty Limited (“Mantra”), which owns the Mkuju River project, on March 15, 2012. The Corporation owns, either directly or through joint ventures, uranium exploration properties in the western United States and South Australia. The unaudited condensed interim consolidated financial statements were approved on August 13, 2012 by the Corporation’s Audit Committee.
2 SIGNIFICANT ACCOUNTING POLICIES
STATEMENT OF COMPLIANCE The unaudited condensed interim consolidated financial statements have been prepared in accordance with International Accounting Standard IAS 34 – Interim Financial Reporting. BASIS OF PREPARATION AND CONSOLIDATION The unaudited condensed interim consolidated financial statements, prepared in conformity with IAS 34, follow the same accounting principles and methods of application as the most recent annual consolidated financial statements. Since the unaudited condensed interim consolidated financial statements do not include all disclosures required by the International Financial Reporting Standards (“IFRS”) for annual financial statements, they should be read in conjunction with the Corporation’s annual consolidated financial statements for the year ended December 31, 2011. FUNCTIONAL AND PRESENTATION CURRENCY The unaudited condensed interim consolidated financial statements are presented in US dollars. The functional currency of Uranium One Inc. is the US dollar. CRITICAL ACCOUNTING JUDGEMENTS AND KEY SOURCES OF ESTIMATION UNCERTAINTY The preparation of consolidated financial statements in conformity with IFRS requires the Corporation’s management to make estimates and assumptions about future events that affect the amounts reported in the consolidated financial statements and related notes to the consolidated financial statements. Actual results may differ from those estimates. Information about areas of judgment and key sources of uncertainty and estimation is contained in the accounting policies of the Corporation’s annual consolidated financial statements for the year ended December 31, 2011. EXCHANGE RATES The following exchange rates to the US dollar have been applied in these unaudited condensed interim consolidated financial statements:
AVERAGE AVERAGE CLOSING CLOSING CLOSING
PERIOD ENDED PERIOD ENDED PERIOD ENDED PERIOD ENDED PERIOD ENDED JUN 30, 2012 JUN 30, 2011 JUN 30, 2012 JUN 30, 2011 DEC 31, 2011 Canadian dollar 1.01 0.98 1.03 0.98 1.02 Australian dollar 0.99 0.97 0.99 0.94 0.99 Russian ruble 31.08 28.03 33.07 28.04 32.10 Kazakh tenge 148.18 146.01 149.42 146.25 148.04 Euro 0.78 0.71 0.80 0.70 0.75

NOTES TO THE CONSOLIDATED FINANCIAL STATEMENTS - UNAUDITED As at June 30, 2012 and December 31, 2011
URANIUM ONE INC. Financial Statements 6
3 INVENTORIES
JUN 30, 2012 DEC 31, 2011 US$m US$m Finished uranium concentrates 119.1 57.3 Solutions and concentrates in process 16.0 19.7 Product inventory 135.1 77.0 Materials and supplies 19.8 14.2
154.9 91.2
All operating expenses and depreciation are accounted for as inventory and expensed when the product is sold. The Corporation expensed $55.3 million and $101.0 million of inventory as cost of sales during the three and six months ended June 30, 2012, respectively (year ended December 31, 2011: $267.8 million). The Willow Creek Mine was successfully commissioned during the period and $18.6 million was transferred from mineral interests, property, plant and equipment as the opening inventory balance.
4 MINERAL INTERESTS, PROPERTY, PLANT AND EQUIPMENT
JUNE 30, 2012
MINERAL
INTERESTS
PROPERTY, PLANT AND
EQUIPMENT DEVELOPMENT
EXPENDITURE TOTAL US$m US$m US$m US$m Cost Balance at January 1 1,903.3 507.5 135.9 2,546.7 Additions - 40.0 50.5 90.5 Disposals - (0.3) (1.2) (1.5) Transfers to inventory - - (18.6) (18.6) Currency translation adjustments taken to reserves (18.0) (8.3) 1.2 (25.1) Transfers - 4.8 (4.8) - At the end of the period 1,885.3 543.7 163.0 2,592.0
Accumulated depreciation Balance at January 1 (196.2) (145.2) - (341.4) Charge for the period (38.3) (40.4) - (78.7) Disposals - 0.1 - 0.1 Currency translation adjustments taken to reserves 2.2 7.4 - 9.6 At the end of the period (232.3) (178.1) - (410.4)
Carrying value at June 30, 2012 1,653.0 365.6 163.0 2,181.6
DECEMBER 31, 2011
MINERAL
INTERESTS
PROPERTY, PLANT AND
EQUIPMENT DEVELOPMENT
EXPENDITURE TOTAL US$m US$m US$m US$m Cost Balance at January 1 1,912.9 354.8 127.1 2,394.8 Additions - 114.8 51.8 166.6 Disposals (2.0) (1.7) (0.8) (4.5) Currency translation adjustments taken to reserves (7.6) 22.1 (24.7) (10.2) Transfers - 17.5 (17.5) - At the end of the year 1,903.3 507.5 135.9 2,546.7
Accumulated depreciation Balance at January 1 (129.7) (88.2) - (217.9) Charge for the year (67.8) (57.0) - (124.8) Disposals - 0.7 - 0.7 Currency translation adjustments taken to reserves 1.3 (0.7) - 0.6 At the end of the year (196.2) (145.2) - (341.4)
Carrying value at December 31, 2011 1,707.1 362.3 135.9 2,205.3

NOTES TO THE CONSOLIDATED FINANCIAL STATEMENTS - UNAUDITED As at June 30, 2012 and December 31, 2011
URANIUM ONE INC. Financial Statements 7
5 INVESTMENT IN ASSOCIATE
On March 15, 2012, Uranium One paid $150 million to ARMZ to extend the term of the Mantra purchase option from June 7, 2012 to June 7, 2013 and to acquire a 13.9% stake in Mantra from ARMZ. Although the Corporation owns less than 20% of the equity shares of Mantra, it exercises significant influence by virtue of an agreement which appoints the Corporation as operator of the Mkuju River project, and the Corporation applies equity accounting to its investment as a result.
Summarized information in respect to Mantra is set out below:
JUN 30, 2012 US$m Total assets 1,105.9 Total liabilities (26.5) Net assets 1,079.4 Corporation’s share of net assets of associate 150.0
Since acquisition on March 15, 2012, Mantra has been capitalizing expenditures incurred on the Mkuju River project. 6 LOANS RECEIVABLE
JUN 30, 2012 DEC 31, 2011 US$m US$m
Loans to related parties Mantra 24.2 6.1
24.2 6.1
Loans to joint ventures SKZ-U 23.5 20.7
23.5 20.7 Current portion 0.4 0.5 Non-current portion 47.3 26.3 Total 47.7 26.8 6.1 MANTRA LOAN The Corporation made loans available to Mantra pursuant to its obligation to provide project financing for construction and commissioning of the Mkuju River project. The loan bear interest at 7.64% per annum. The loan have no fixed repayment terms.
JUN 30, 2012 DEC 31, 2011 US$m US$m Opening balance 6.1 - Additions during the period 17.5 6.0 Interest accrued 0.6 0.1
Balance at the end of the period 24.2 6.1 Less: current portion - - Long term portion 24.2 6.1
The loans to Mantra are guaranteed by ARMZ.

NOTES TO THE CONSOLIDATED FINANCIAL STATEMENTS - UNAUDITED As at June 30, 2012 and December 31, 2011
URANIUM ONE INC. Financial Statements 8
6 LOANS RECEIVABLE (CONTINUED) 6.2 SKZ-U LOAN The Corporation made loans available to SKZ-U LLP (“SKZ-U), a joint venture in which the Corporation has a 19% interest, pursuant to its obligation to provide project financing in the amount of $31 million for construction and commissioning of a sulphuric acid plant. The loans bear interest at LIBOR plus 6% per annum, with interest payable on a semi-annual basis.
JUN 30, 2012 DEC 31, 2011 US$m US$m Opening balance 25.6 18.0 Additions during the period 3.5 7.1 Interest accrued 0.8 0.5 Interest received (0.9) - Balance at the end of the period 29.0 25.6 Less: elimination of proportionate share – 19% (5.5) (4.9)
23.5 20.7 Less: current portion (0.4) (0.5) Long term portion 23.1 20.2
The loans to SKZ-U are unsecured.
7 OTHER ASSETS
JUN 30, 2012 DEC 31, 2011 US$m US$m
Current Purchased uranium concentrates 10.0 - Cross currency swap asset (note 10) 0.8 0.8 Current portion of loans receivable 0.4 0.5 Other 0.6 0.3
11.8 1.6 Non-current Borrowed uranium concentrates 10.2 10.4 Asset retirement fund 39.4 41.2 Advances for plant and equipment 14.5 13.8 Other 5.7 5.7
69.8 71.1 Purchased uranium concentrates The purchased uranium concentrates were purchased from the Corporation’s joint ventures and are held in the Corporation’s account. The material will be delivered into a uranium sales contract in July 2012. Borrowed uranium concentrates The Corporation entered into a uranium concentrates borrowing agreement to mitigate the risk of delivery delays, enabling the Corporation to meet its contractual obligations in terms of current uranium sales contracts. The asset represents the borrowed uranium concentrates, which are held at a conversion facility in the Corporation’s account. The asset is recorded at its fair value. The corresponding financial liability of $10.2 million, which is classified as fair value through profit or loss, is also carried at fair value and is included in other liabilities.
NOTES TO THE CONSOLIDATED FINANCIAL STATEMENTS - UNAUDITED As at June 30, 2012 and December 31, 2011
URANIUM ONE INC. Financial Statements 9
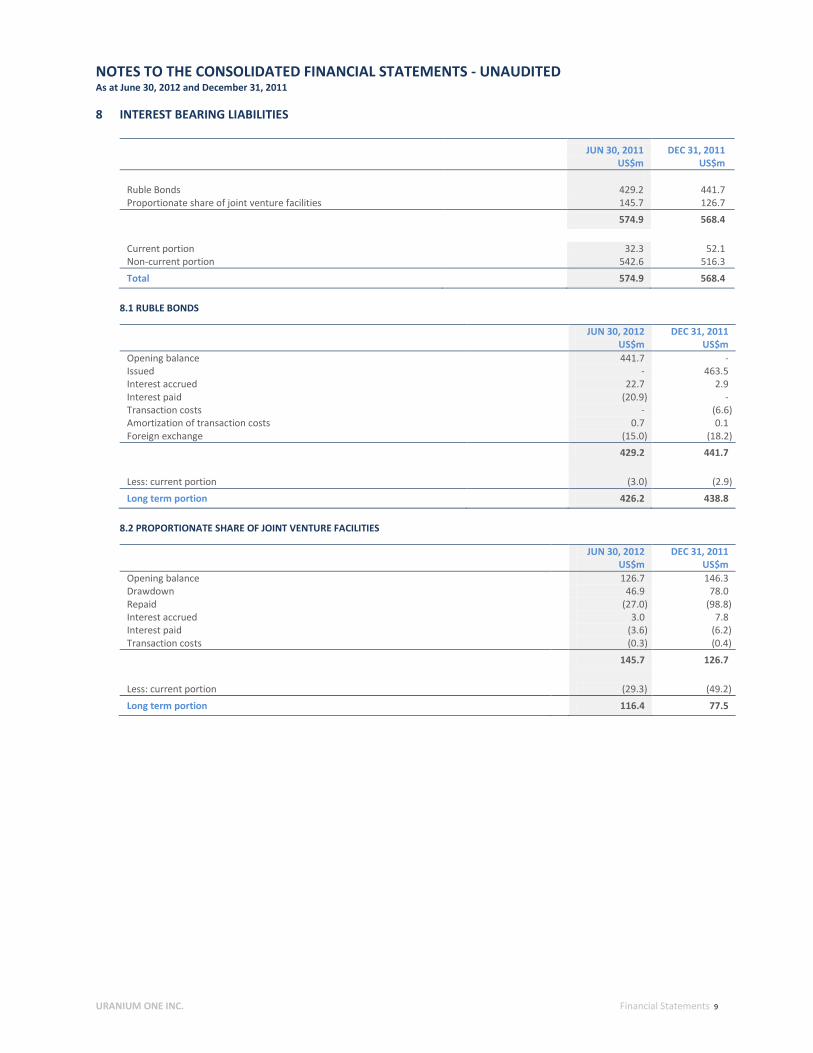
8 INTEREST BEARING LIABILITIES
JUN 30, 2011 DEC 31, 2011 US$m US$m Ruble Bonds 429.2 441.7 Proportionate share of joint venture facilities 145.7 126.7
574.9 568.4 Current portion 32.3 52.1 Non-current portion 542.6 516.3 Total 574.9 568.4
8.1 RUBLE BONDS
JUN 30, 2012 DEC 31, 2011 US$m US$m Opening balance 441.7 - Issued - 463.5 Interest accrued 22.7 2.9 Interest paid (20.9) - Transaction costs - (6.6) Amortization of transaction costs 0.7 0.1 Foreign exchange (15.0) (18.2)
429.2 441.7 Less: current portion (3.0) (2.9) Long term portion 426.2 438.8
8.2 PROPORTIONATE SHARE OF JOINT VENTURE FACILITIES
JUN 30, 2012 DEC 31, 2011 US$m US$m Opening balance 126.7 146.3 Drawdown 46.9 78.0 Repaid (27.0) (98.8) Interest accrued 3.0 7.8 Interest paid (3.6) (6.2) Transaction costs (0.3) (0.4)
145.7 126.7 Less: current portion
(29.3) (49.2)
Long term portion 116.4 77.5

NOTES TO THE CONSOLIDATED FINANCIAL STATEMENTS - UNAUDITED As at June 30, 2012 and December 31, 2011
URANIUM ONE INC. Financial Statements 10
9 CONVERTIBLE DEBENTURES 2010 Debentures On March 12, 2010 the Corporation issued convertible unsecured subordinated debentures for gross proceeds of C$260 million ($253.3 million), including C$10 million taken up under an underwriters’ over-allotment option. The 2010 Debentures have a March 13, 2015 maturity date, with interest payable at a rate of 5.0% per annum, payable semi-annually. The 2010 Debentures are convertible into common shares of the Corporation at a conversion price of C$3.15 per common share, being a rate of 317.46 common shares per C$1,000 principal. The table below indicates the movement in the liability:
JUN 30, 2012 DEC 31, 2011 US$m US$m Opening balance 214.4 208.7 Interest accrued 11.6 23.9 Coupon (6.3) (13.0) Foreign exchange movement (1.2) (5.2) Liability as at the end of the period 218.5 214.4 Current portion - - Non-current portion 218.5 214.4
218.5 214.4 Fair value of convertible debentures 279.4 256.6
10 OTHER LIABILITIES
JUN 30, 2012 DEC 31, 2011 US$m US$m Current Unfavorable contracts - 9.4 Advances received 4.0 3.4 Other 0.5 0.4
4.5 13.2
JUN 30, 2012 DEC 31, 2011 US$m US$m Non-current Uranium concentrates loan 10.2 10.4 Cross currency swap liability 30.8 16.3 Other 0.2 0.9
41.2 27.6
Unfavorable contracts The terms of the sales contract have been amended and the contract price is now market related. As a result, the Corporation settled the liability for an unfavorable contract which was acquired as part of the ARMZ transaction in December 2010 with a cash payment of $7.8 million. Uranium concentrates loan On September 22, 2008, the Corporation entered into a loan agreement to borrow 200,000 pounds of U3O8 to be repaid on September 30, 2010. The maturity of the loan was subsequently extended to September 30, 2013. Under the loan agreement, loan fees of 3.5% per annum are payable based on the value of the borrowed U3O8. In addition to the loan agreement, the Corporation incurred $0.4 million in loan arrangement fees, which have been expensed. The Corporation recognized the borrowed uranium in other assets (note 7). The loan is classified as a financial liability carried at fair value through profit or loss.
NOTES TO THE CONSOLIDATED FINANCIAL STATEMENTS - UNAUDITED As at June 30, 2012 and December 31, 2011
URANIUM ONE INC. Financial Statements 11
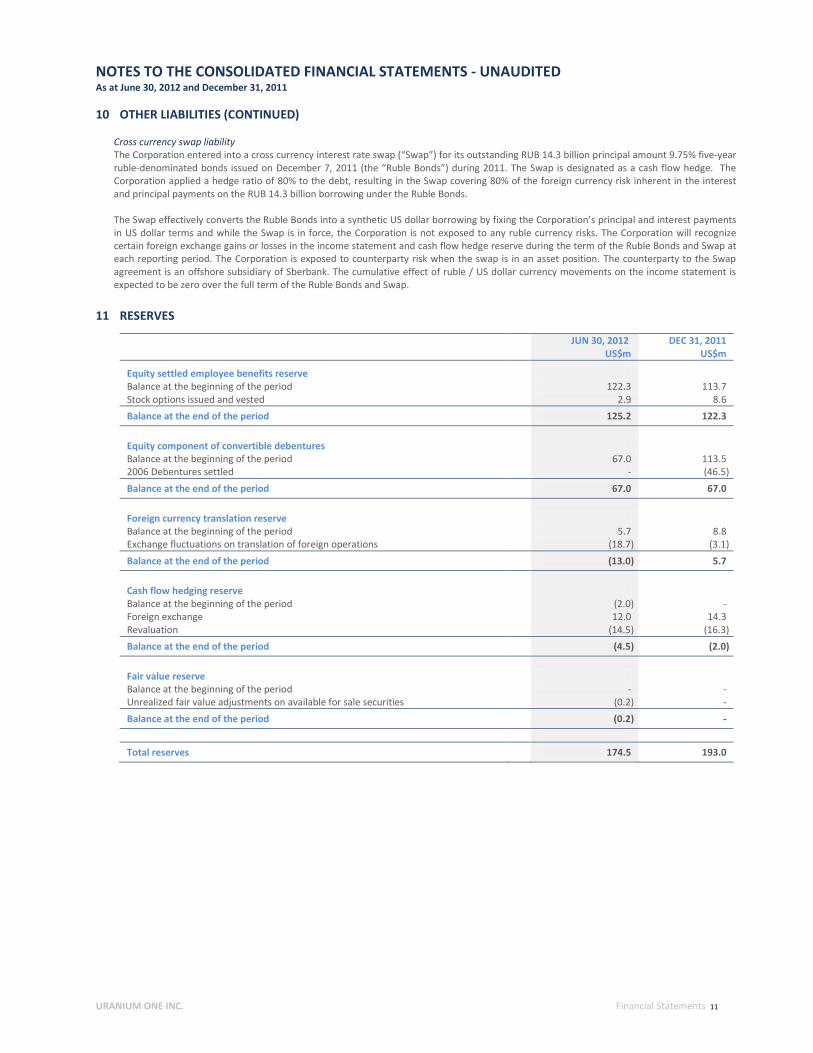
10 OTHER LIABILITIES (CONTINUED) Cross currency swap liability The Corporation entered into a cross currency interest rate swap (“Swap”) for its outstanding RUB 14.3 billion principal amount 9.75% five-year ruble-denominated bonds issued on December 7, 2011 (the “Ruble Bonds”) during 2011. The Swap is designated as a cash flow hedge. The Corporation applied a hedge ratio of 80% to the debt, resulting in the Swap covering 80% of the foreign currency risk inherent in the interest and principal payments on the RUB 14.3 billion borrowing under the Ruble Bonds.
The Swap effectively converts the Ruble Bonds into a synthetic US dollar borrowing by fixing the Corporation’s principal and interest payments in US dollar terms and while the Swap is in force, the Corporation is not exposed to any ruble currency risks. The Corporation will recognize certain foreign exchange gains or losses in the income statement and cash flow hedge reserve during the term of the Ruble Bonds and Swap at each reporting period. The Corporation is exposed to counterparty risk when the swap is in an asset position. The counterparty to the Swap agreement is an offshore subsidiary of Sberbank. The cumulative effect of ruble / US dollar currency movements on the income statement is expected to be zero over the full term of the Ruble Bonds and Swap.
11 RESERVES
JUN 30, 2012 US$m
DEC 31, 2011 US$m
Equity settled employee benefits reserve Balance at the beginning of the period 122.3 113.7 Stock options issued and vested 2.9 8.6 Balance at the end of the period 125.2 122.3 Equity component of convertible debentures
Balance at the beginning of the period 67.0 113.5 2006 Debentures settled - (46.5) Balance at the end of the period 67.0 67.0 Foreign currency translation reserve
Balance at the beginning of the period 5.7 8.8 Exchange fluctuations on translation of foreign operations (18.7) (3.1) Balance at the end of the period (13.0) 5.7 Cash flow hedging reserve
Balance at the beginning of the period (2.0) - Foreign exchange 12.0 14.3 Revaluation (14.5) (16.3) Balance at the end of the period (4.5) (2.0) Fair value reserve
Balance at the beginning of the period - - Unrealized fair value adjustments on available for sale securities (0.2) - Balance at the end of the period (0.2) - Total reserves 174.5 193.0
NOTES TO THE CONSOLIDATED FINANCIAL STATEMENTS - UNAUDITED As at June 30, 2012 and December 31, 2011
URANIUM ONE INC. Financial Statements 12
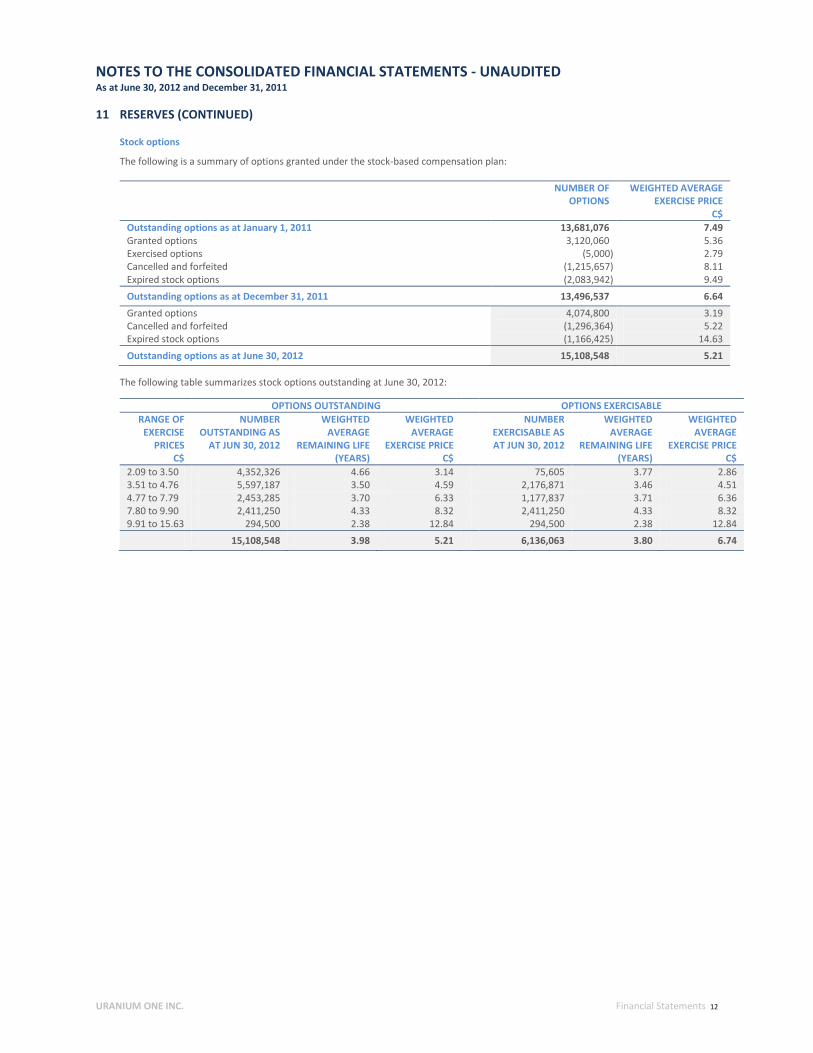
11 RESERVES (CONTINUED) Stock options
The following is a summary of options granted under the stock-based compensation plan: NUMBER OF WEIGHTED AVERAGE OPTIONS EXERCISE PRICE C$ Outstanding options as at January 1, 2011 13,681,076 7.49 Granted options 3,120,060 5.36 Exercised options (5,000) 2.79 Cancelled and forfeited (1,215,657) 8.11 Expired stock options (2,083,942) 9.49 Outstanding options as at December 31, 2011 13,496,537 6.64 Granted options 4,074,800 3.19 Cancelled and forfeited (1,296,364) 5.22 Expired stock options (1,166,425) 14.63 Outstanding options as at June 30, 2012 15,108,548 5.21
The following table summarizes stock options outstanding at June 30, 2012:
OPTIONS OUTSTANDING OPTIONS EXERCISABLE RANGE OF
EXERCISE PRICES
NUMBER OUTSTANDING AS
AT JUN 30, 2012
WEIGHTED AVERAGE
REMAINING LIFE
WEIGHTED AVERAGE
EXERCISE PRICE
NUMBER EXERCISABLE AS AT JUN 30, 2012
WEIGHTED AVERAGE
REMAINING LIFE
WEIGHTED AVERAGE
EXERCISE PRICE C$ (YEARS) C$ (YEARS) C$
2.09 to 3.50 4,352,326 4.66 3.14 75,605 3.77 2.86 3.51 to 4.76 5,597,187 3.50 4.59 2,176,871 3.46 4.51 4.77 to 7.79 2,453,285 3.70 6.33 1,177,837 3.71 6.36 7.80 to 9.90 2,411,250 4.33 8.32 2,411,250 4.33 8.32 9.91 to 15.63 294,500 2.38 12.84 294,500 2.38 12.84
15,108,548 3.98 5.21 6,136,063 3.80 6.74
NOTES TO THE CONSOLIDATED FINANCIAL STATEMENTS - UNAUDITED As at June 30, 2012 and December 31, 2011
URANIUM ONE INC. Financial Statements 13
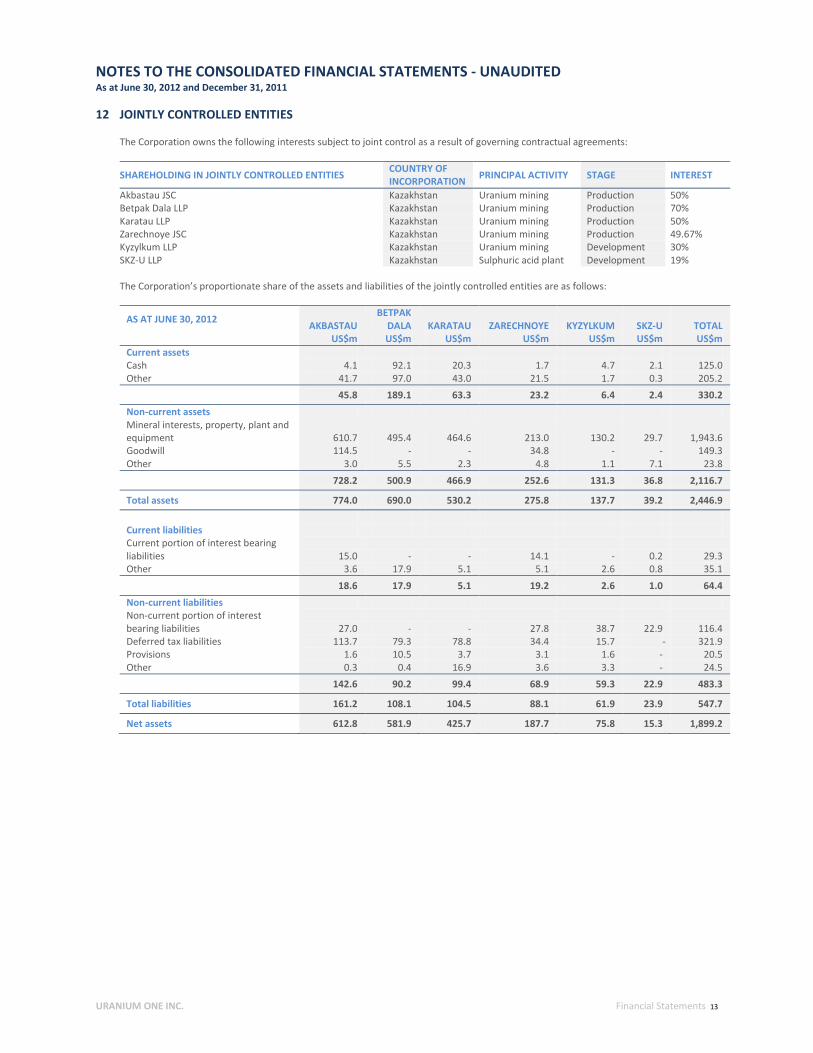
12 JOINTLY CONTROLLED ENTITIES
The Corporation owns the following interests subject to joint control as a result of governing contractual agreements:
SHAREHOLDING IN JOINTLY CONTROLLED ENTITIES COUNTRY OF INCORPORATION PRINCIPAL ACTIVITY STAGE INTEREST
Akbastau JSC Kazakhstan Uranium mining Production 50% Betpak Dala LLP Kazakhstan Uranium mining Production 70% Karatau LLP Kazakhstan Uranium mining Production 50% Zarechnoye JSC Kazakhstan Uranium mining Production 49.67% Kyzylkum LLP Kazakhstan Uranium mining Development 30% SKZ-U LLP Kazakhstan Sulphuric acid plant Development 19% The Corporation’s proportionate share of the assets and liabilities of the jointly controlled entities are as follows:
AS AT JUNE 30, 2012 AKBASTAU BETPAK
DALA KARATAU ZARECHNOYE KYZYLKUM SKZ-U TOTAL US$m US$m US$m US$m US$m US$m US$m Current assets Cash 4.1 92.1 20.3 1.7 4.7 2.1 125.0 Other 41.7 97.0 43.0 21.5 1.7 0.3 205.2
45.8 189.1 63.3 23.2 6.4 2.4 330.2 Non-current assets Mineral interests, property, plant and equipment 610.7 495.4 464.6 213.0 130.2 29.7 1,943.6 Goodwill 114.5 - - 34.8 - - 149.3 Other 3.0 5.5 2.3 4.8 1.1 7.1 23.8
728.2 500.9 466.9 252.6 131.3 36.8 2,116.7
Total assets 774.0 690.0 530.2 275.8 137.7 39.2 2,446.9 Current liabilities Current portion of interest bearing liabilities 15.0 - - 14.1 - 0.2 29.3 Other 3.6 17.9 5.1 5.1 2.6 0.8 35.1
18.6 17.9 5.1 19.2 2.6 1.0 64.4 Non-current liabilities Non-current portion of interest bearing liabilities 27.0 - - 27.8 38.7 22.9 116.4 Deferred tax liabilities 113.7 79.3 78.8 34.4 15.7 - 321.9 Provisions 1.6 10.5 3.7 3.1 1.6 - 20.5 Other 0.3 0.4 16.9 3.6 3.3 - 24.5
142.6 90.2 99.4 68.9 59.3 22.9 483.3
Total liabilities 161.2 108.1 104.5 88.1 61.9 23.9 547.7
Net assets 612.8 581.9 425.7 187.7 75.8 15.3 1,899.2

NOTES TO THE CONSOLIDATED FINANCIAL STATEMENTS - UNAUDITED As at June 30, 2012 and December 31, 2011
URANIUM ONE INC. Financial Statements 14
12 JOINTLY CONTROLLED ENTITIES (CONTINUED)
AS AT DECEMBER 31, 2011 AKBASTAU BETPAK
DALA KARATAU ZARECHNOYE KYZYLKUM SKZ-U TOTAL US$m US$m US$m US$m US$m US$m US$m Current assets Cash 1.6 35.4 3.8 3.4 1.2 1.3 46.7 Other 31.5 116.5 44.9 12.5 1.2 0.2 206.8
33.1 151.9 48.7 15.9 2.4 1.5 253.5 Non-current assets Mineral interests, property, plant and equipment 618.3 507.8 481.5 217.8 124.6 27.4 1,977.4 Goodwill 115.5 - - 35.2 - - 150.7 Other 3.0 4.3 2.3 6.1 0.6 7.1 23.4
736.8 512.1 483.8 259.1 125.2 34.5 2,151.5
Total assets 769.9 664.0 532.5 275.0 127.6 36.0 2,405.0 Current liabilities Current portion of interest bearing liabilities 11.3 - - 22.1 15.8 - 49.2 Other 4.5 12.9 8.3 5.0 2.6 0.9 34.2
15.8 12.9 8.3 27.1 18.4 0.9 83.4 Non-current liabilities Non-current portion of interest bearing liabilities 16.5 - - 17.1 23.6 20.3 77.5 Deferred tax liabilities 115.9 85.8 83.2 36.3 16.0 (0.3) 336.9 Provisions 1.5 10.3 3.6 3.1 1.6 - 20.1 Other 6.0 - 30.5 9.4 2.1 - 48.0
139.9 96.1 117.3 65.9 43.3 20.0 482.5
Total liabilities 155.7 109.0 125.6 93.0 61.7 20.9 565.9
Net assets 614.2 555.0 406.9 182.0 65.9 15.1 1,839.1
The Corporation's proportionate share of revenue, expenses, net earnings / (loss) and cash flows are as follows:
THREE MONTHS ENDED JUNE 30, 2012 AKBASTAU
BETPAK DALA KARATAU ZARECHNOYE KYZYLKUM SKZ-U TOTAL
US$m US$m US$m US$m US$m US$m US$m Revenues 8.5 27.9 35.0 15.0 - - 86.4 Expenses and other income (5.4) (14.0) (16.9) (3.5) (0.7) - (40.5) Foreign exchange (loss) / gain (0.5) 0.3 0.1 (0.4) (0.4) (0.2) (1.1) Earnings / (loss) before income taxes 2.6 14.2 18.2 11.1 (1.1) (0.2) 44.8 Current and deferred income tax (expense) / recovery (0.9) 0.8 (4.0) (0.7) - - (4.8) Net earnings / (loss) 1.7 15.0 14.2 10.4 (1.1) (0.2) 40.0 Cash flows from operating activities 0.6 3.7 27.1 4.1 - - 35.5 Cash flows used in investing activities (7.7) (7.8) (4.2) (4.0) (7.5) (1.4) (32.6) Cash flows from / (used in) financing activities 0.2 - (9.5) 0.6 3.4 - (5.3) Net (decrease) / increase (6.9) (4.1) 13.4 0.7 (4.1) (1.4) (2.4)

NOTES TO THE CONSOLIDATED FINANCIAL STATEMENTS - UNAUDITED As at June 30, 2012 and December 31, 2011
URANIUM ONE INC. Financial Statements 15
12 JOINTLY CONTROLLED ENTITIES (CONTINUED)
SIX MONTHS ENDED JUNE 30, 2012 AKBASTAU
BETPAK DALA KARATAU ZARECHNOYE KYZYLKUM SKZ-U TOTAL
US$m US$m US$m US$m US$m US$m US$m Revenues 18.0 86.7 51.6 20.4 - - 176.7 Expenses and other income (10.5) (44.2) (25.3) (8.6) (0.8) - (89.4) Foreign exchange (loss) / gain (0.3) 0.1 0.1 (0.2) (0.2) (0.2) (0.7) Earnings / (loss) before income taxes 7.2 42.6 26.4 11.6 (1.0) (0.2) 86.6 Current and deferred income tax (expense) / recovery (1.2) (4.4) (3.7) 0.1 (0.1) - (9.3) Net earnings / (loss) 6.0 38.2 22.7 11.7 (1.1) (0.2) 77.3 Cash flows from operating activities 4.4 75.3 36.2 2.0 - - 117.9 Cash flows used in investing activities (11.9) (18.6) (7.2) (6.4) (8.3) (2.7) (55.1) Cash flows from / (used in) financing activities 10.0 - (12.5) 2.7 11.8 3.5 15.5 Net increase / (decrease) in cash 2.5 56.7 16.5 (1.7) 3.5 0.8 78.3
THREE MONTHS ENDED JUNE 30, 2011 AKBASTAU
BETPAK DALA KARATAU ZARECHNOYE KYZYLKUM SKZ-U TOTAL
US$m US$m US$m US$m US$m US$m US$m Revenues 25.1 53.5 10.5 18.5 - - 107.6 Expenses and other income (11.1) (26.5) (6.7) (9.7) - - (54.0) Foreign exchange (loss) / gain (0.1) - - - 0.2 (0.2) (0.1) Earnings / (loss) before income taxes 13.9 27.0 3.8 8.8 0.2 (0.2) 53.5 Current and deferred income tax expense (2.7) (5.5) (1.1) (2.2) - - (11.5) Net earnings / (loss) 11.2 21.5 2.7 6.6 0.2 (0.2) 42.0 Cash flows from operating activities 0.2 49.3 8.9 18.5 - - 76.9 Cash flows used in investing activities (1.9) (6.7) (4.5) (4.6) (3.1) (2.9) (23.7) Cash flows (used in) / from financing activities - (89.8) (7.5) (11.9) (3.4) 2.9 (109.7) Net (decrease) / increase in cash (1.7) (47.2) (3.1) 2.0 (6.5) - (56.5)
SIX MONTHS ENDED JUNE 30, 2011 AKBASTAU
BETPAK DALA KARATAU ZARECHNOYE KYZYLKUM SKZ-U TOTAL
US$m US$m US$m US$m US$m US$m US$m Revenues 33.3 115.7 33.7 23.9 - - 206.6 Expenses and other income (19.7) (52.7) (18.6) (14.8) (0.2) - (106.0) Foreign exchange gain / (loss) 0.1 (0.6) 0.2 0.3 0.9 - 0.9 Earnings before income taxes 13.7 62.4 15.3 9.4 0.7 - 101.5 Current and deferred income tax expense (2.3) (12.5) (4.0) (2.1) - - (20.9) Net earnings 11.4 49.9 11.3 7.3 0.7 - 80.6 Cash flows from operating activities 4.2 92.1 27.6 20.4 - - 144.3 Cash flows used in investing activities (5.8) (11.3) (8.2) (7.6) (7.2) (5.8) (45.9) Cash flows (used in) / from financing activities - (89.8) (18.8) (11.9) 10.9 2.9 (106.7) Net (decrease) / increase in cash (1.6) (9.0) 0.6 0.9 3.7 (2.9) (8.3)
NOTES TO THE CONSOLIDATED FINANCIAL STATEMENTS - UNAUDITED As at June 30, 2012 and December 31, 2011
URANIUM ONE INC. Financial Statements 16
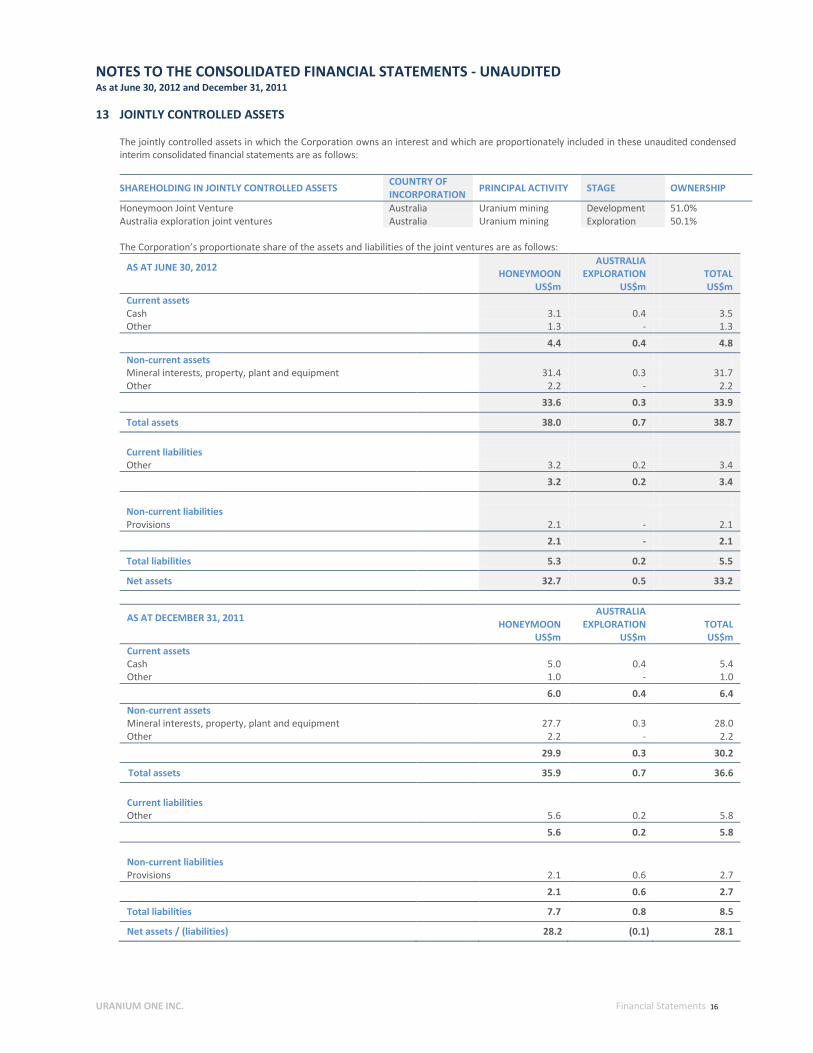
13 JOINTLY CONTROLLED ASSETS
The jointly controlled assets in which the Corporation owns an interest and which are proportionately included in these unaudited condensed interim consolidated financial statements are as follows:
SHAREHOLDING IN JOINTLY CONTROLLED ASSETS COUNTRY OF INCORPORATION PRINCIPAL ACTIVITY STAGE OWNERSHIP
Honeymoon Joint Venture Australia Uranium mining Development 51.0% Australia exploration joint ventures Australia Uranium mining Exploration 50.1%
The Corporation’s proportionate share of the assets and liabilities of the joint ventures are as follows:
AS AT JUNE 30, 2012 HONEYMOON
AUSTRALIA EXPLORATION
TOTAL
US$m US$m US$m Current assets Cash 3.1 0.4 3.5 Other 1.3 - 1.3 4.4 0.4 4.8 Non-current assets Mineral interests, property, plant and equipment 31.4 0.3 31.7 Other 2.2 - 2.2 33.6 0.3 33.9
Total assets 38.0 0.7 38.7 Current liabilities Other 3.2 0.2 3.4 3.2 0.2 3.4 Non-current liabilities Provisions 2.1 - 2.1 2.1 - 2.1
Total liabilities 5.3 0.2 5.5
Net assets 32.7 0.5 33.2
AS AT DECEMBER 31, 2011
HONEYMOON AUSTRALIA
EXPLORATION
TOTAL US$m US$m US$m Current assets Cash 5.0 0.4 5.4 Other 1.0 - 1.0
6.0 0.4 6.4 Non-current assets Mineral interests, property, plant and equipment 27.7 0.3 28.0 Other 2.2 - 2.2
29.9 0.3 30.2
Total assets 35.9 0.7 36.6
Current liabilities Other 5.6 0.2 5.8
5.6 0.2 5.8 Non-current liabilities Provisions 2.1 0.6 2.7
2.1 0.6 2.7
Total liabilities 7.7 0.8 8.5
Net assets / (liabilities) 28.2 (0.1) 28.1

NOTES TO THE CONSOLIDATED FINANCIAL STATEMENTS - UNAUDITED As at June 30, 2012 and December 31, 2011
URANIUM ONE INC. Financial Statements 17
13 JOINTLY CONTROLLED ASSETS (CONTINUED)
The Corporation's proportionate share of revenue, expenses, net loss and cash flows are as follows:
THREE MONTHS ENDED JUNE 30, 2012 HONEYMOON AUSTRALIA
EXPLORATION TOTAL US$m US$m US$m Expenses and other income (0.4) - (0.4) Loss before income taxes (0.4) - (0.4) Current and deferred income tax expense - - - Net loss (0.4) - (0.4) Cash flows (used in) / from investing activities (3.3) 0.1 (3.2) Cash flows from financing activities 2.6 - 2.6 Net (decrease) / increase in cash (0.7) 0.1 (0.6)
SIX MONTHS ENDED JUNE 30, 2012 HONEYMOON AUSTRALIA
EXPLORATION TOTAL US$m US$m US$m Expenses and other income (0.6) - (0.6) Loss before income taxes (0.6) - (0.6) Current and deferred income tax expense - - - Net loss (0.6) - (0.6) Cash flows used in investing activities (6.2) - (6.2) Cash flows from financing activities 4.3 - 4.3 Net decrease in cash (1.9) - (1.9)
THREE MONTHS ENDED JUNE 30, 2011 HONEYMOON AUSTRALIA
EXPLORATION TOTAL US$m US$m US$m Expenses and other income (0.2) - (0.2) Loss before income taxes (0.2) - (0.2) Current and deferred income tax expense (0.2) - (0.2) Net loss (0.4) - (0.4) Cash flows used in investing activities (6.4) (0.1) (6.5) Cash flows from financing activities 2.6 - 2.6 Net decrease in cash (3.8) (0.1) (3.9)
SIX MONTHS ENDED JUNE 30, 2011 HONEYMOON AUSTRALIA
EXPLORATION TOTAL US$m US$m US$m Expenses and other income (0.4) - (0.4) Loss before income taxes (0.4) - (0.4) Current and deferred income tax expense (0.2) - (0.2) Net loss (0.6) - (0.6) Cash flows used in investing activities (11.4) (0.5) (11.9) Cash flows from financing activities 6.6 - 6.6 Net decrease in cash (4.8) (0.5) (5.3)
NOTES TO THE CONSOLIDATED FINANCIAL STATEMENTS - UNAUDITED As at June 30, 2012 and December 31, 2011
URANIUM ONE INC. Financial Statements 18
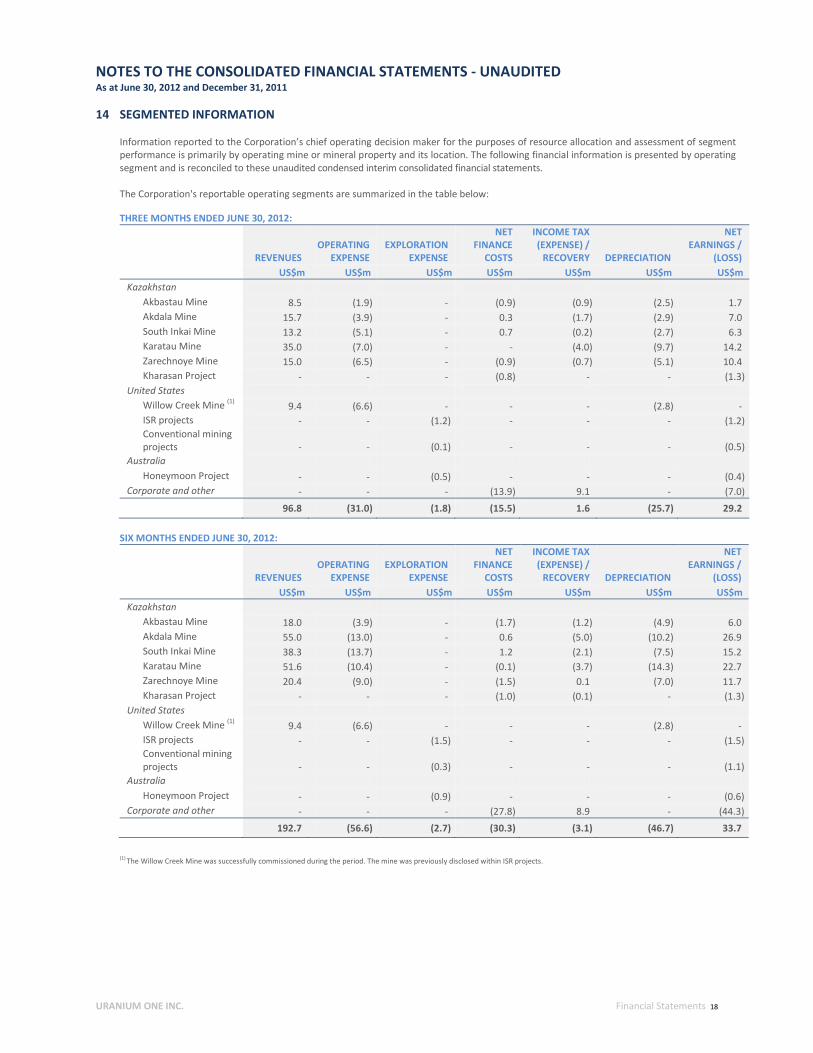
14 SEGMENTED INFORMATION Information reported to the Corporation’s chief operating decision maker for the purposes of resource allocation and assessment of segment performance is primarily by operating mine or mineral property and its location. The following financial information is presented by operating segment and is reconciled to these unaudited condensed interim consolidated financial statements. The Corporation's reportable operating segments are summarized in the table below:
THREE MONTHS ENDED JUNE 30, 2012:
REVENUES OPERATING
EXPENSE EXPLORATION
EXPENSE
NET FINANCE
COSTS
INCOME TAX (EXPENSE) /
RECOVERY DEPRECIATION
NET EARNINGS /
(LOSS) US$m US$m US$m US$m US$m US$m US$m Kazakhstan
Akbastau Mine 8.5 (1.9) - (0.9) (0.9) (2.5) 1.7 Akdala Mine 15.7 (3.9) - 0.3 (1.7) (2.9) 7.0 South Inkai Mine 13.2 (5.1) - 0.7 (0.2) (2.7) 6.3 Karatau Mine 35.0 (7.0) - - (4.0) (9.7) 14.2 Zarechnoye Mine 15.0 (6.5) - (0.9) (0.7) (5.1) 10.4 Kharasan Project - - - (0.8) - - (1.3)
United States Willow Creek Mine (1) 9.4 (6.6) - - - (2.8) - ISR projects - - (1.2) - - - (1.2) Conventional mining projects - - (0.1) - - - (0.5)
Australia Honeymoon Project - - (0.5) - - - (0.4)
Corporate and other - - - (13.9) 9.1 - (7.0) 96.8 (31.0) (1.8) (15.5) 1.6 (25.7) 29.2
SIX MONTHS ENDED JUNE 30, 2012:
REVENUES OPERATING
EXPENSE EXPLORATION
EXPENSE
NET FINANCE
COSTS
INCOME TAX (EXPENSE) /
RECOVERY DEPRECIATION
NET EARNINGS /
(LOSS) US$m US$m US$m US$m US$m US$m US$m Kazakhstan
Akbastau Mine 18.0 (3.9) - (1.7) (1.2) (4.9) 6.0 Akdala Mine 55.0 (13.0) - 0.6 (5.0) (10.2) 26.9 South Inkai Mine 38.3 (13.7) - 1.2 (2.1) (7.5) 15.2 Karatau Mine 51.6 (10.4) - (0.1) (3.7) (14.3) 22.7 Zarechnoye Mine 20.4 (9.0) - (1.5) 0.1 (7.0) 11.7 Kharasan Project - - - (1.0) (0.1) - (1.3)
United States Willow Creek Mine (1) 9.4 (6.6) - - - (2.8) - ISR projects - - (1.5) - - - (1.5) Conventional mining projects - - (0.3) - - - (1.1)
Australia Honeymoon Project - - (0.9) - - - (0.6)
Corporate and other - - - (27.8) 8.9 - (44.3) 192.7 (56.6) (2.7) (30.3) (3.1) (46.7) 33.7
(1) The Willow Creek Mine was successfully commissioned during the period. The mine was previously disclosed within ISR projects.
NOTES TO THE CONSOLIDATED FINANCIAL STATEMENTS - UNAUDITED As at June 30, 2012 and December 31, 2011
URANIUM ONE INC. Financial Statements 19
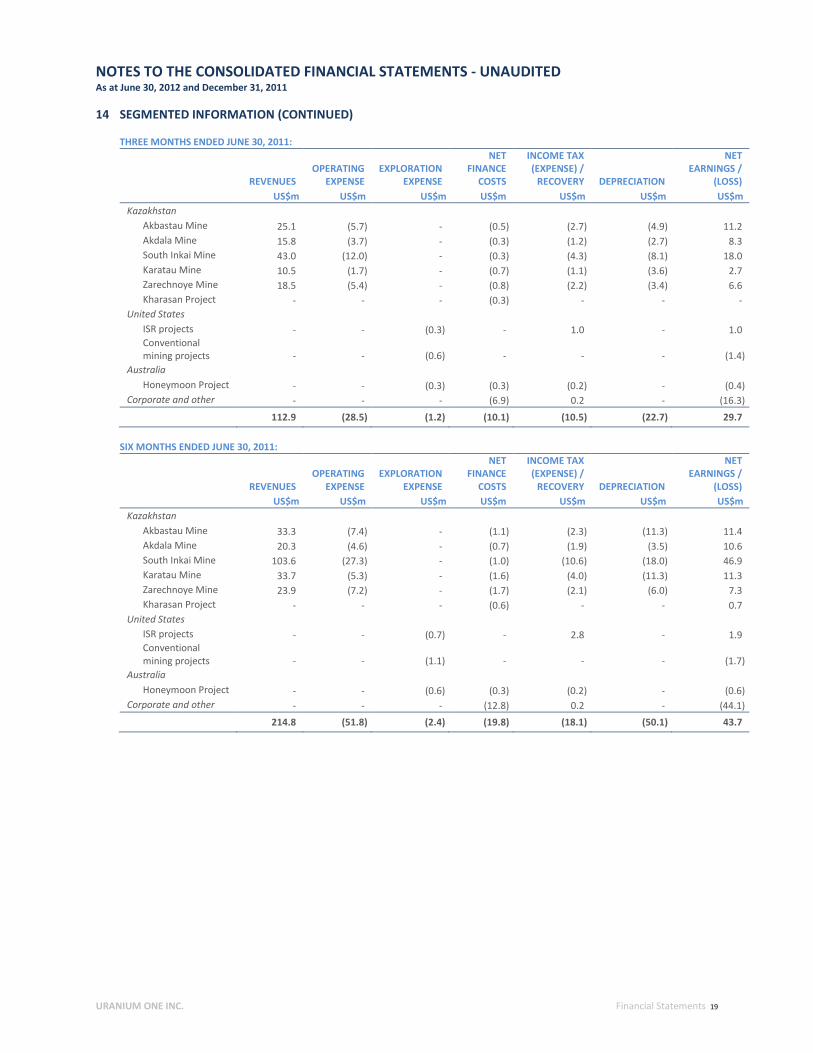
14 SEGMENTED INFORMATION (CONTINUED) THREE MONTHS ENDED JUNE 30, 2011:
REVENUES OPERATING
EXPENSE EXPLORATION
EXPENSE
NET FINANCE
COSTS
INCOME TAX (EXPENSE) /
RECOVERY DEPRECIATION
NET EARNINGS /
(LOSS) US$m US$m US$m US$m US$m US$m US$m Kazakhstan
Akbastau Mine 25.1 (5.7) - (0.5) (2.7) (4.9) 11.2 Akdala Mine 15.8 (3.7) - (0.3) (1.2) (2.7) 8.3 South Inkai Mine 43.0 (12.0) - (0.3) (4.3) (8.1) 18.0 Karatau Mine 10.5 (1.7) - (0.7) (1.1) (3.6) 2.7 Zarechnoye Mine 18.5 (5.4) - (0.8) (2.2) (3.4) 6.6 Kharasan Project - - - (0.3) - - -
United States ISR projects - - (0.3) - 1.0 - 1.0 Conventional mining projects - - (0.6) - - - (1.4)
Australia Honeymoon Project - - (0.3) (0.3) (0.2) - (0.4)
Corporate and other - - - (6.9) 0.2 - (16.3)
112.9 (28.5) (1.2) (10.1) (10.5) (22.7) 29.7
SIX MONTHS ENDED JUNE 30, 2011:
REVENUES OPERATING
EXPENSE EXPLORATION
EXPENSE
NET FINANCE
COSTS
INCOME TAX (EXPENSE) /
RECOVERY DEPRECIATION
NET EARNINGS /
(LOSS) US$m US$m US$m US$m US$m US$m US$m Kazakhstan
Akbastau Mine 33.3 (7.4) - (1.1) (2.3) (11.3) 11.4 Akdala Mine 20.3 (4.6) - (0.7) (1.9) (3.5) 10.6 South Inkai Mine 103.6 (27.3) - (1.0) (10.6) (18.0) 46.9 Karatau Mine 33.7 (5.3) - (1.6) (4.0) (11.3) 11.3 Zarechnoye Mine 23.9 (7.2) - (1.7) (2.1) (6.0) 7.3 Kharasan Project - - - (0.6) - - 0.7
United States ISR projects - - (0.7) - 2.8 - 1.9 Conventional mining projects - - (1.1) - - - (1.7)
Australia Honeymoon Project - - (0.6) (0.3) (0.2) - (0.6)
Corporate and other - - - (12.8) 0.2 - (44.1)
214.8 (51.8) (2.4) (19.8) (18.1) (50.1) 43.7

NOTES TO THE CONSOLIDATED FINANCIAL STATEMENTS - UNAUDITED As at June 30, 2012 and December 31, 2011
URANIUM ONE INC. Financial Statements 20
14 SEGMENTED INFORMATION (CONTINUED) AS AT JUNE 30, 2012:
MINERAL INTERESTS
PROPERTY, PLANT TOTAL DEFERRED TAX TOTAL CAPITAL AND EQUIPMENT ASSETS LIABILITIES LIABILITIES ADDITIONS US$m US$m US$m US$m US$m Kazakhstan
Akbastau Mine 610.7 774.0 113.7 161.2 10.4 Akdala Mine 117.4 156.9 19.9 29.0 5.0 South Inkai Mine 377.3 437.3 59.4 78.1 12.9 Karatau Mine 464.6 530.2 78.8 104.5 7.3 Zarechnoye Mine 213.0 275.8 34.4 88.1 7.7 Kharasan Project 159.9 176.9 15.7 85.8 10.9
United States Willow Creek Mine (1) 116.6 147.5 - 15.4 23.4 ISR projects 54.9 58.5 - 0.4 0.6 Conventional mining projects 22.2 31.1 - 6.1 -
Australia Honeymoon Project 31.7 38.7 - 5.5 9.0
Corporate and other 13.3 695.9 - 739.9 3.3
2,181.6 3,322.8 321.9 1,314.0 90.5 (1) The Willow Creek Mine was successfully commissioned during the period. The mine was previously disclosed within ISR projects. AS AT DECEMBER 31, 2011:
MINERAL INTERESTS
PROPERTY, PLANT TOTAL DEFERRED TAX TOTAL CAPITAL AND EQUIPMENT ASSETS LIABILITIES LIABILITIES ADDITIONS US$m US$m US$m US$m US$m Kazakhstan
Akbastau Mine 618.3 769.9 115.9 155.7 15.8 Akdala Mine 121.5 177.4 22.5 30.1 5.1 South Inkai Mine 385.8 449.2 63.3 65.1 21.6 Karatau Mine 481.5 532.5 83.2 125.6 25.1 Zarechnoye Mine 217.8 275.0 36.3 93.0 18.6 Kharasan Project 152.0 163.6 15.7 82.6 32.0
United States ISR projects 168.9 190.9 - 12.8 44.0 Conventional mining projects 22.2 31.2 - 6.0 -
Australia Honeymoon Project 28.0 36.6 - 8.5 18.0
Corporate and other 9.3 677.0 - 730.3 1.6
2,205.3 3,303.3 336.9 1,309.7 181.8