uranium isotopic ratio determinations in uranium - … · uranium isotopic ratio determinations in...
TRANSCRIPT

Uranium Isotopic Ratio Determinations in Uranium Salts and
Pitchblende
David Urban

Investigation Objectives • Characterise uranium contained in samples in
terms of isotopic abundance and ratios
• Focusing on the isotopes 234U, 235U, 238U are the results from the method sufficiently accurate and reproducible?
• Is it possible to differentiate between samples?
• How can we use this information?
• Opportunity to assess the effectiveness of different digestion methods for pitchblende
2
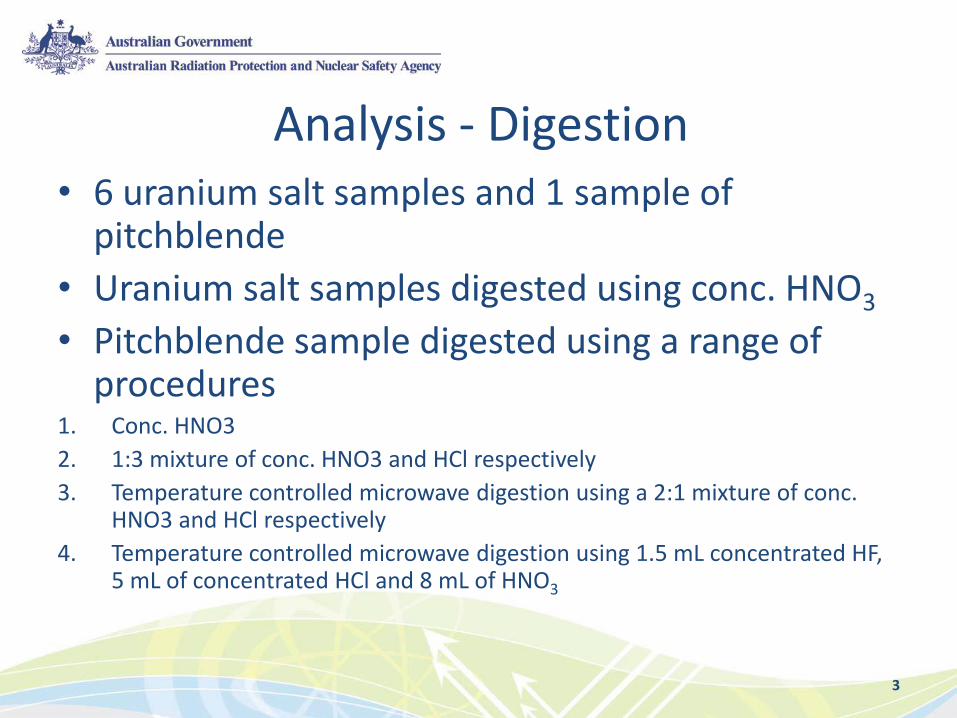
Analysis - Digestion • 6 uranium salt samples and 1 sample of
pitchblende
• Uranium salt samples digested using conc. HNO3
• Pitchblende sample digested using a range of procedures
1. Conc. HNO3
2. 1:3 mixture of conc. HNO3 and HCl respectively
3. Temperature controlled microwave digestion using a 2:1 mixture of conc. HNO3 and HCl respectively
4. Temperature controlled microwave digestion using 1.5 mL concentrated HF, 5 mL of concentrated HCl and 8 mL of HNO3
3
Analysis - Calculations
• Final source to be analysed by AS contained approximately 0.3 Bq of uranium activity - Measurable activity with good resolution and acceptable
uncertainty
- Mass of salt to be digested for desired activity calculated based on an assumption of 100% activity due to 238U – specific activity conversion
4
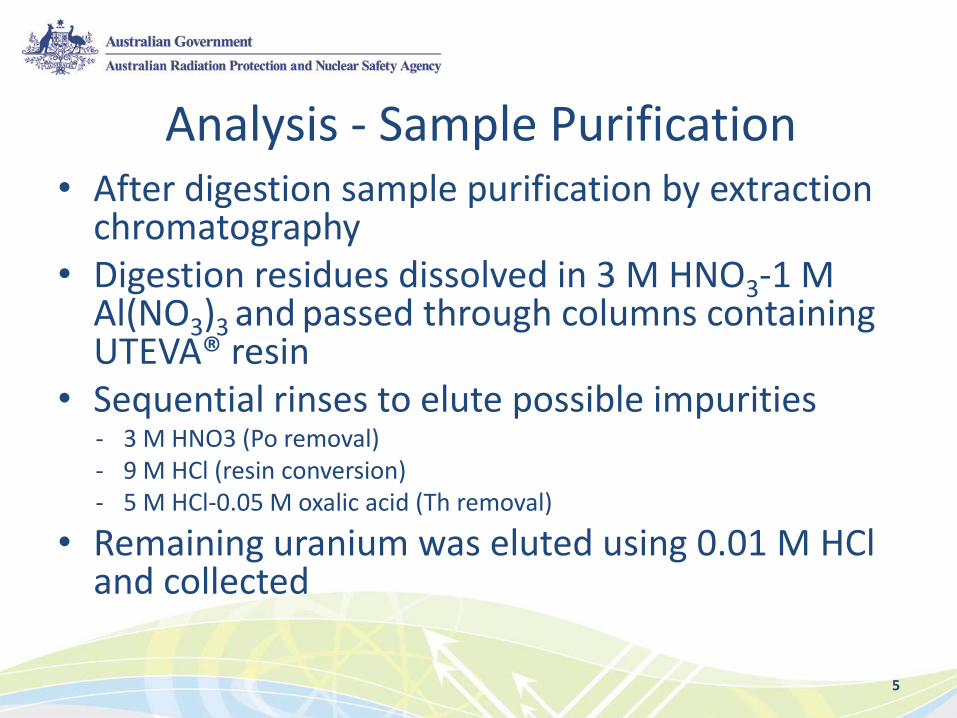
Analysis - Sample Purification • After digestion sample purification by extraction
chromatography • Digestion residues dissolved in 3 M HNO3-1 M
Al(NO3)3 and passed through columns containing UTEVA® resin
• Sequential rinses to elute possible impurities - 3 M HNO3 (Po removal) - 9 M HCl (resin conversion) - 5 M HCl-0.05 M oxalic acid (Th removal)
• Remaining uranium was eluted using 0.01 M HCl and collected
5
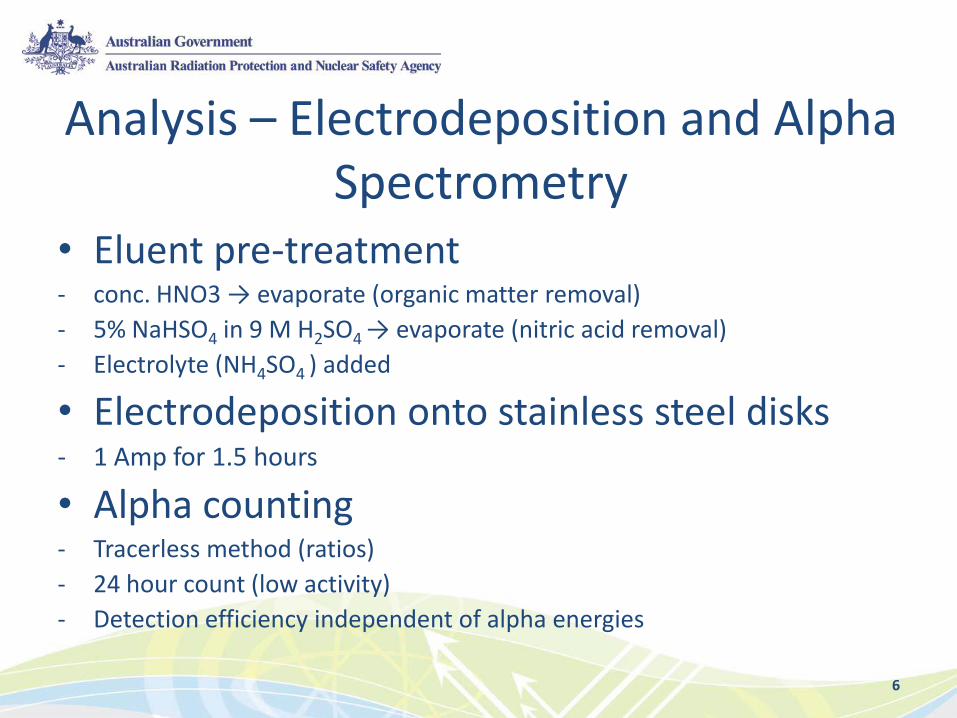
Analysis – Electrodeposition and Alpha Spectrometry
• Eluent pre-treatment - conc. HNO3 → evaporate (organic matter removal)
- 5% NaHSO4 in 9 M H2SO4 → evaporate (nitric acid removal)
- Electrolyte (NH4SO4 ) added
• Electrodeposition onto stainless steel disks - 1 Amp for 1.5 hours
• Alpha counting - Tracerless method (ratios)
- 24 hour count (low activity)
- Detection efficiency independent of alpha energies
6

Quality Control
• All samples analysed in triplicate to determine repeatability
• Pitchblende as quality control - Are the results accurate when compared to published values?
- How effective are the digestion methods in extracting the uranium from the ore? Recoveries of uranium from pitchblende determined as a ratio of the measured activity to the calculated activity in the mass of ore digested
7
0
50
100
150
200
250
300
350
400
450
3900 4000 4100 4200 4300 4400 4500 4600 4700 4800 4900 5000
Co
un
ts
Energy (keV)
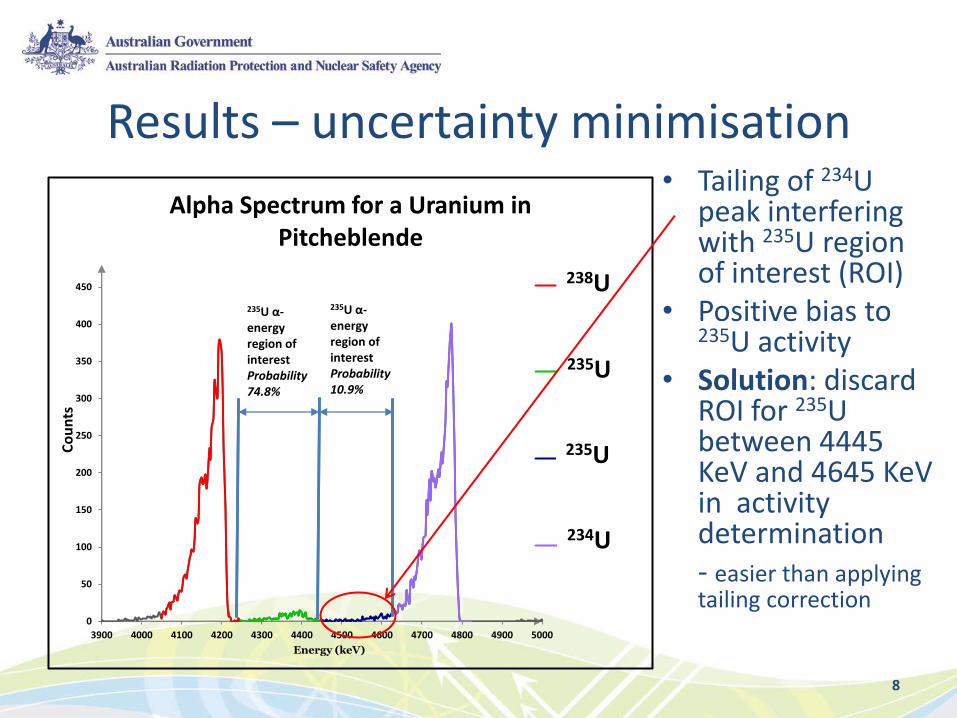
Alpha Spectrum for a Uranium in Pitcheblende
238U
235U
235U
234U
235U α-energy region of interest Probability 10.9%
238U
235U
235U
234U
238U
235U
235U
234U
235U α-energy region of interest Probability 74.8%
Results – uncertainty minimisation • Tailing of 234U
peak interfering with 235U region of interest (ROI)
• Positive bias to 235U activity
• Solution: discard ROI for 235U between 4445 KeV and 4645 KeV in activity determination - easier than applying tailing correction
8
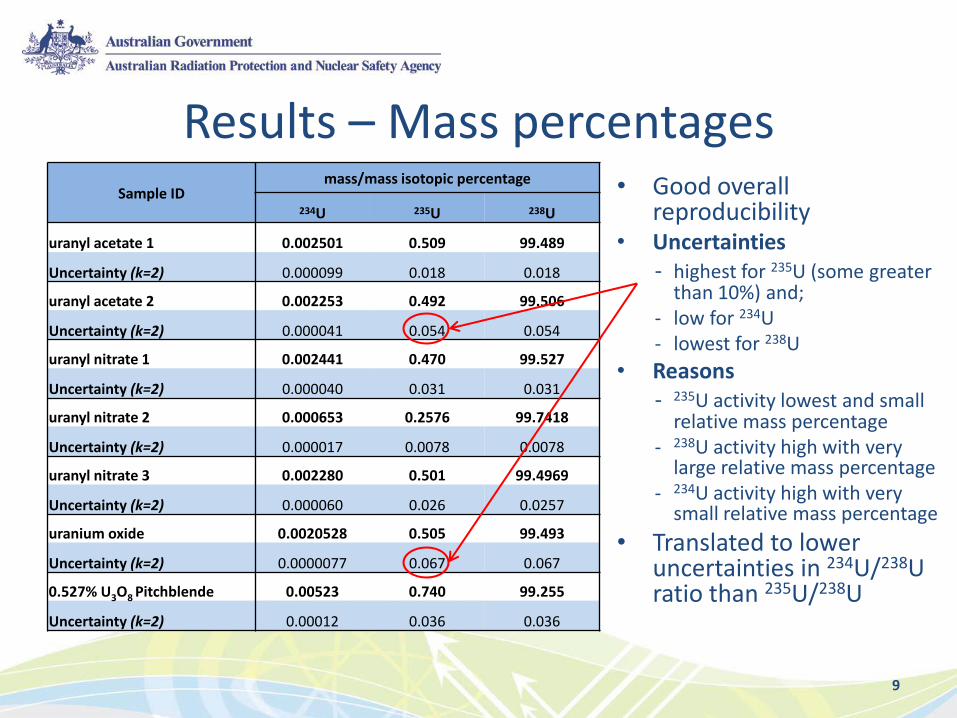
Sample ID mass/mass isotopic percentage
234U 235U 238U
uranyl acetate 1 0.002501 0.509 99.489
Uncertainty (k=2) 0.000099 0.018 0.018
uranyl acetate 2 0.002253 0.492 99.506
Uncertainty (k=2) 0.000041 0.054 0.054
uranyl nitrate 1 0.002441 0.470 99.527
Uncertainty (k=2) 0.000040 0.031 0.031
uranyl nitrate 2 0.000653 0.2576 99.7418
Uncertainty (k=2) 0.000017 0.0078 0.0078
uranyl nitrate 3 0.002280 0.501 99.4969
Uncertainty (k=2) 0.000060 0.026 0.0257
uranium oxide 0.0020528 0.505 99.493
Uncertainty (k=2) 0.0000077 0.067 0.067
0.527% U3O8 Pitchblende 0.00523 0.740 99.255
Uncertainty (k=2) 0.00012 0.036 0.036
Results – Mass percentages • Good overall
reproducibility • Uncertainties
- highest for 235U (some greater than 10%) and;
- low for 234U - lowest for 238U
• Reasons - 235U activity lowest and small
relative mass percentage - 238U activity high with very
large relative mass percentage - 234U activity high with very
small relative mass percentage
• Translated to lower uncertainties in 234U/238U ratio than 235U/238U
9
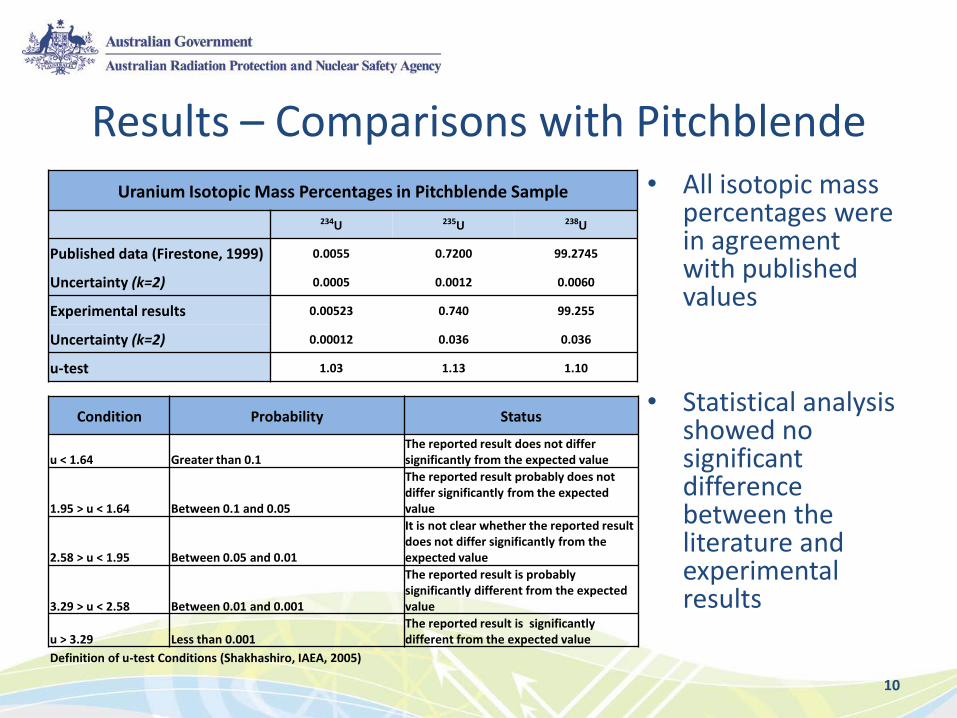
Results – Comparisons with Pitchblende • All isotopic mass
percentages were in agreement with published values
• Statistical analysis
showed no significant difference between the literature and experimental results
10
Condition Probability Status
u < 1.64 Greater than 0.1 The reported result does not differ significantly from the expected value
1.95 > u < 1.64 Between 0.1 and 0.05
The reported result probably does not differ significantly from the expected value
2.58 > u < 1.95 Between 0.05 and 0.01
It is not clear whether the reported result does not differ significantly from the expected value
3.29 > u < 2.58 Between 0.01 and 0.001
The reported result is probably significantly different from the expected value
u > 3.29 Less than 0.001 The reported result is significantly different from the expected value
Definition of u-test Conditions (Shakhashiro, IAEA, 2005)
Uranium Isotopic Mass Percentages in Pitchblende Sample
234U 235U 238U
Published data (Firestone, 1999) 0.0055 0.7200 99.2745
Uncertainty (k=2) 0.0005 0.0012 0.0060
Experimental results 0.00523 0.740 99.255
Uncertainty (k=2) 0.00012 0.036 0.036
u-test 1.03 1.13 1.10
0.00E+00
1.00E-05
2.00E-05
3.00E-05
4.00E-05
5.00E-05
6.00E-05
7.00E-05
23
4U
/23
8U
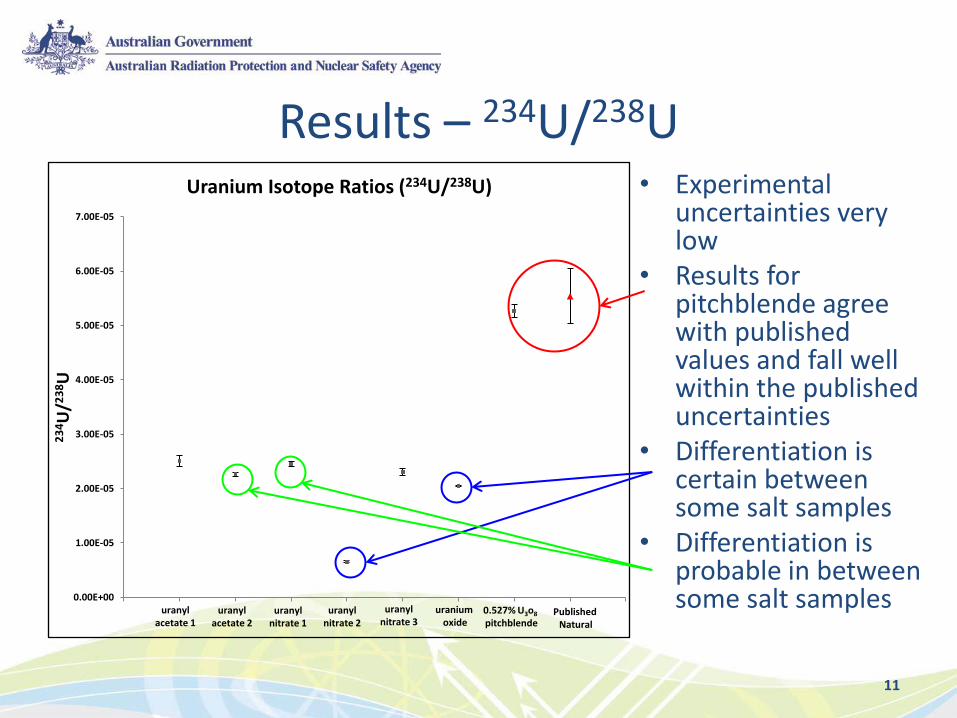
Uranium Isotope Ratios (234U/238U)
uranyl acetate 2
uranyl nitrate 1
uranyl nitrate 2
uranyl acetate 1
uranyl nitrate 3
uranium oxide
0.527% U3o8 pitchblende
Published Natural
Results – 234U/238U • Experimental
uncertainties very low
• Results for pitchblende agree with published values and fall well within the published uncertainties
• Differentiation is certain between some salt samples
• Differentiation is probable in between some salt samples
11
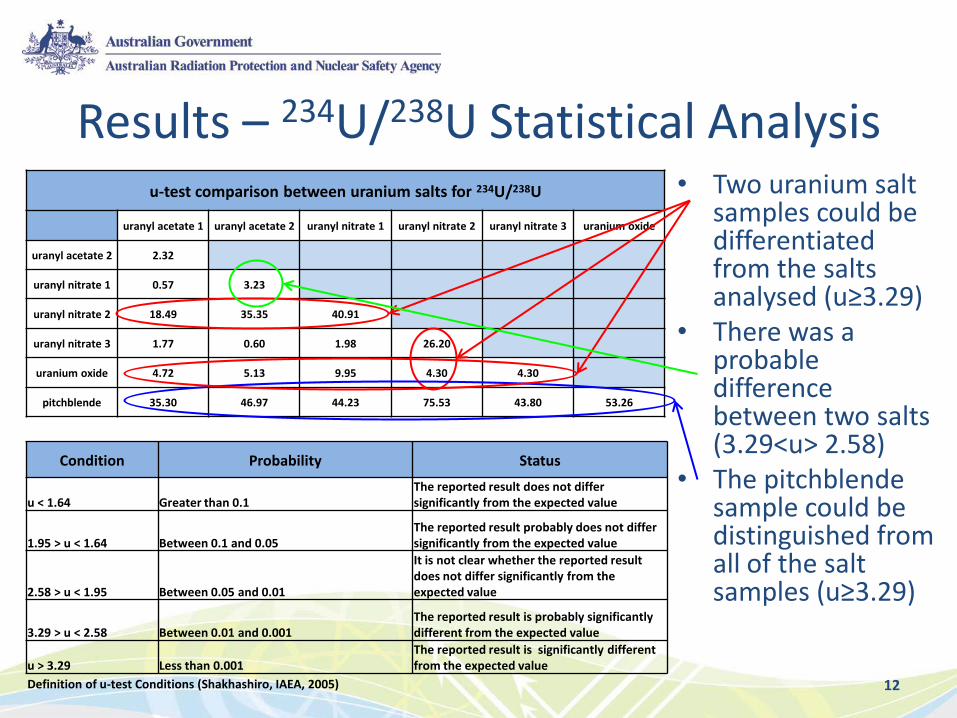
u-test comparison between uranium salts for 234U/238U
uranyl acetate 1 uranyl acetate 2 uranyl nitrate 1 uranyl nitrate 2 uranyl nitrate 3 uranium oxide
uranyl acetate 2 2.32
uranyl nitrate 1 0.57 3.23
uranyl nitrate 2 18.49 35.35 40.91
uranyl nitrate 3 1.77 0.60 1.98 26.20
uranium oxide 4.72 5.13 9.95 4.30 4.30
pitchblende 35.30 46.97 44.23 75.53 43.80 53.26
Results – 234U/238U Statistical Analysis • Two uranium salt
samples could be differentiated from the salts analysed (u≥3.29)
• There was a probable difference between two salts (3.29˂u˃ 2.58)
• The pitchblende sample could be distinguished from all of the salt samples (u≥3.29)
12
Condition Probability Status
u < 1.64 Greater than 0.1 The reported result does not differ significantly from the expected value
1.95 > u < 1.64 Between 0.1 and 0.05 The reported result probably does not differ significantly from the expected value
2.58 > u < 1.95 Between 0.05 and 0.01
It is not clear whether the reported result does not differ significantly from the expected value
3.29 > u < 2.58 Between 0.01 and 0.001 The reported result is probably significantly different from the expected value
u > 3.29 Less than 0.001 The reported result is significantly different from the expected value
Definition of u-test Conditions (Shakhashiro, IAEA, 2005)

0.00E+00
1.00E-03
2.00E-03
3.00E-03
4.00E-03
5.00E-03
6.00E-03
7.00E-03
8.00E-03
9.00E-03
23
4U
/23
8U
Uranium Isotope Ratios (235U/238U)
uranyl acetate 2
uranyl nitrate 1
uranyl nitrate 2
uranyl acetate 1
uranyl nitrate 3
uranium oxide
0.527% U3o8 pitchblende
Published natural
Results – 235U/238U • Experimental
uncertainties much higher
• Results for pitchblende agree with published values BUT in this case the published value falls within the larger experimental uncertainty
• Differentiation is possible with only one salt sample
13
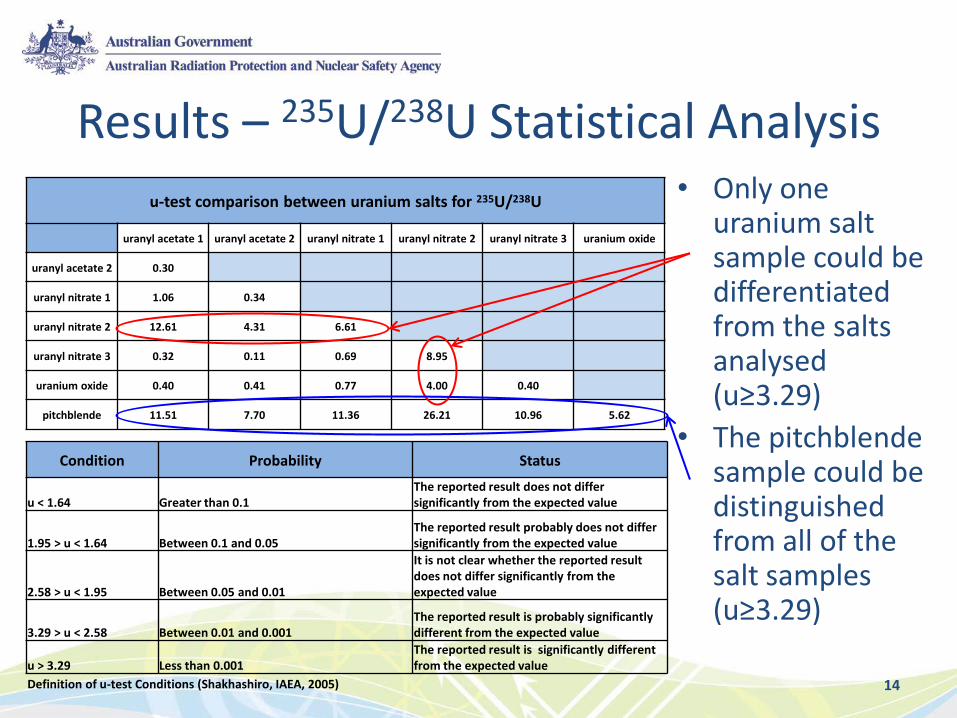
u-test comparison between uranium salts for 235U/238U
uranyl acetate 1 uranyl acetate 2 uranyl nitrate 1 uranyl nitrate 2 uranyl nitrate 3 uranium oxide
uranyl acetate 2 0.30
uranyl nitrate 1 1.06 0.34
uranyl nitrate 2 12.61 4.31 6.61
uranyl nitrate 3 0.32 0.11 0.69 8.95
uranium oxide 0.40 0.41 0.77 4.00 0.40
pitchblende 11.51 7.70 11.36 26.21 10.96 5.62
Results – 235U/238U Statistical Analysis • Only one
uranium salt sample could be differentiated from the salts analysed (u≥3.29)
• The pitchblende sample could be distinguished from all of the salt samples (u≥3.29)
14
Condition Probability Status
u < 1.64 Greater than 0.1 The reported result does not differ significantly from the expected value
1.95 > u < 1.64 Between 0.1 and 0.05 The reported result probably does not differ significantly from the expected value
2.58 > u < 1.95 Between 0.05 and 0.01
It is not clear whether the reported result does not differ significantly from the expected value
3.29 > u < 2.58 Between 0.01 and 0.001 The reported result is probably significantly different from the expected value
u > 3.29 Less than 0.001 The reported result is significantly different from the expected value
Definition of u-test Conditions (Shakhashiro, IAEA, 2005)
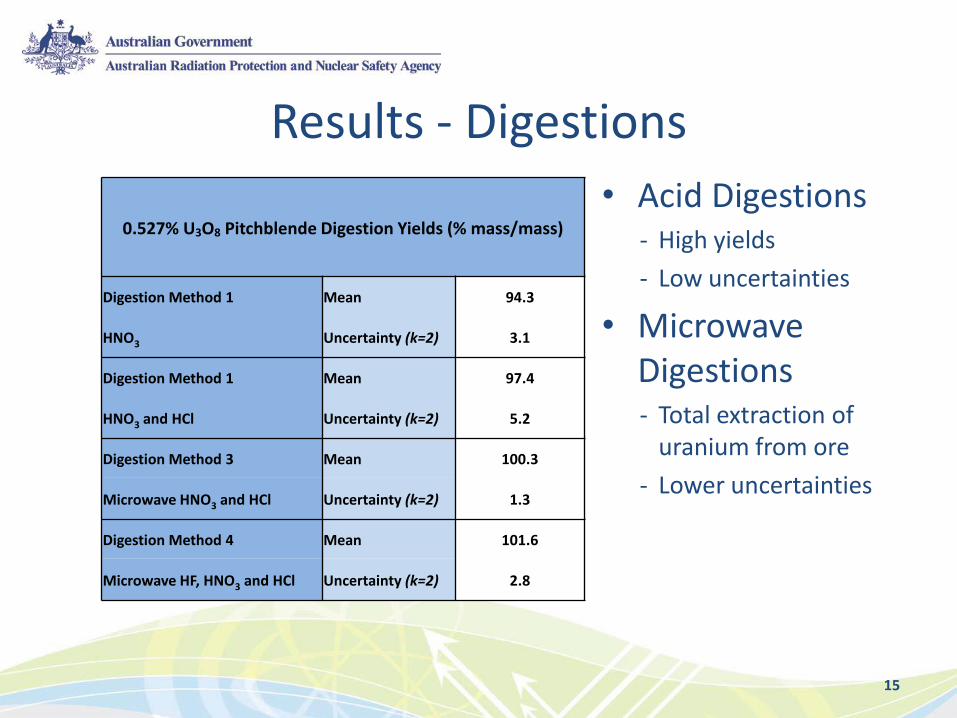
Results - Digestions
• Acid Digestions - High yields
- Low uncertainties
• Microwave Digestions - Total extraction of
uranium from ore
- Lower uncertainties
15
0.527% U3O8 Pitchblende Digestion Yields (% mass/mass)
Digestion Method 1 Mean 94.3
HNO3 Uncertainty (k=2) 3.1
Digestion Method 1 Mean 97.4
HNO3 and HCl Uncertainty (k=2) 5.2
Digestion Method 3 Mean 100.3
Microwave HNO3 and HCl Uncertainty (k=2) 1.3
Digestion Method 4 Mean 101.6
Microwave HF, HNO3 and HCl Uncertainty (k=2) 2.8
Conclusions • The experimental results were both accurate and
repeatable/reproducible • 234U/238U was better than 235U/238U for differentiating
between salt samples • Discrimination was reliant on there being sufficient
difference between the ratios • All the digestion procedures used were effective in
extracting high yields of uranium from the pitchblende ore
• Temperature controlled microwave digestion resulted in total extraction of the uranium in the ore
16

CONTACT ARPANSA
Email: [email protected] Website: www.arpansa.gov.au Telephone: +61 3 9433 2211 Freecall 1800 022 333 General Fax: +61 3 9432 1835 A technical report supporting this presentation can be found on the ARPANSA Website http://www.arpansa.gov.au/Publications/technicalreports/index.cfm
THANK YOU