updates on the automotive industry on the automotive industry • pwc automotive pwc autofacts ® in...
TRANSCRIPT

Updates on the Automotive IndustryPwC Automotive
www.pwc.com
7. June 2017
Automotive Logistics 2017

PwC
7. June 2017
Transformation of the automotive industry
2
Updates on the Automotive Industry • PwC Automotive
PwC Autofacts ®
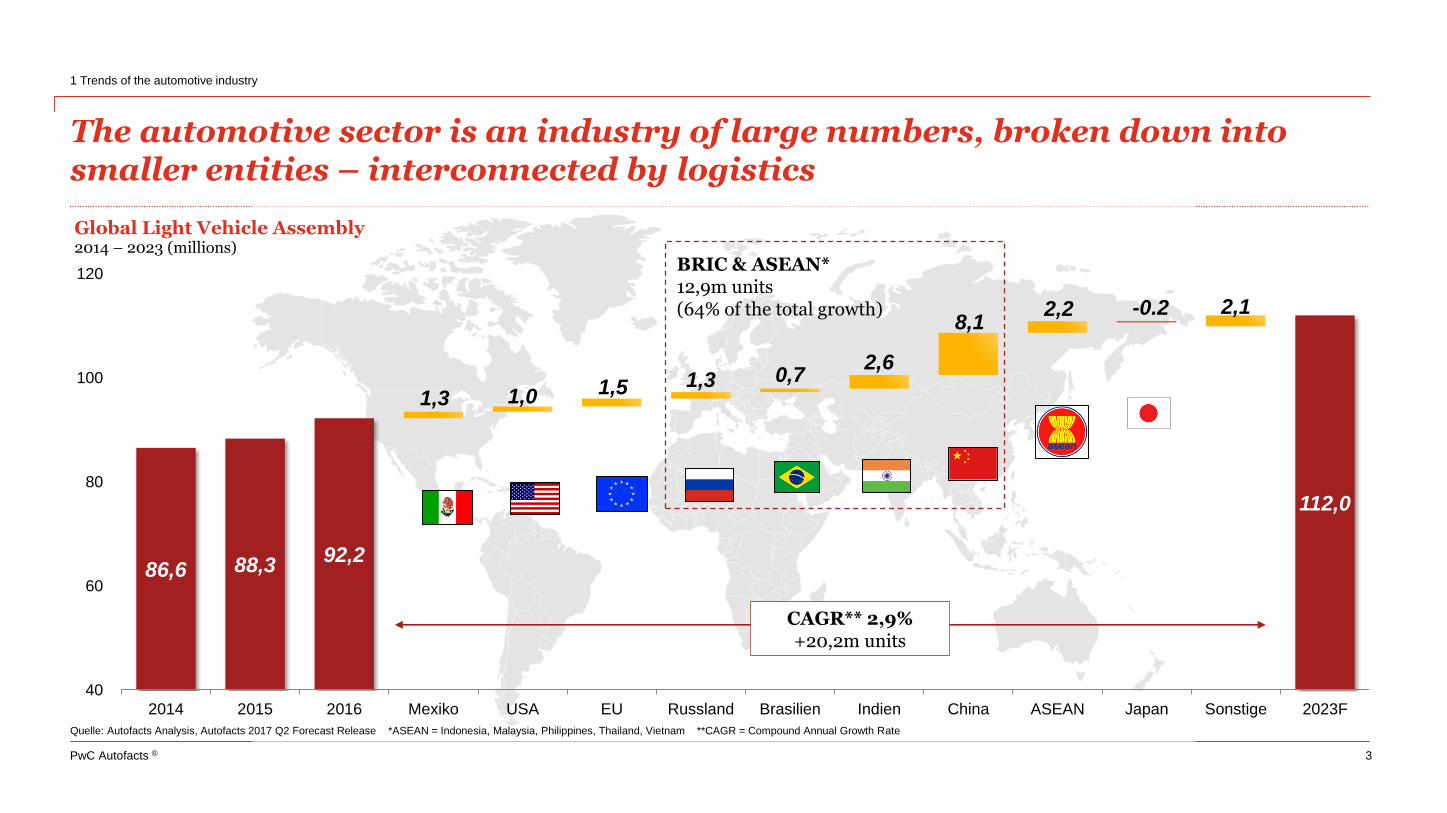
CAGR** 2,9%+20,2m units
BRIC & ASEAN*12,9m units (64% of the total growth)
Quelle: Autofacts Analysis, Autofacts 2017 Q2 Forecast Release *ASEAN = Indonesia, Malaysia, Philippines, Thailand, Vietnam **CAGR = Compound Annual Growth Rate
The automotive sector is an industry of large numbers, broken down into smaller entities – interconnected by logistics
1 Trends of the automotive industry
3
86,6 88,392,2
112,0
1,3 1,0 1,5 1,3 0,72,6
8,12,2 -0.2 2,1
40
60
80
100
120
2014 2015 2016 Mexiko USA EU Russland Brasilien Indien China ASEAN Japan Sonstige 2023F
Global Light Vehicle Assembly2014 – 2023 (millions)

PwC Autofacts ®
electrified
autonomous
shared
connected
yearly updated
The vision is clear: The car of the future is “eascy”
1 Trends of the automotive industry
4
Picture source: Volkswagen
PwC Autofacts ®
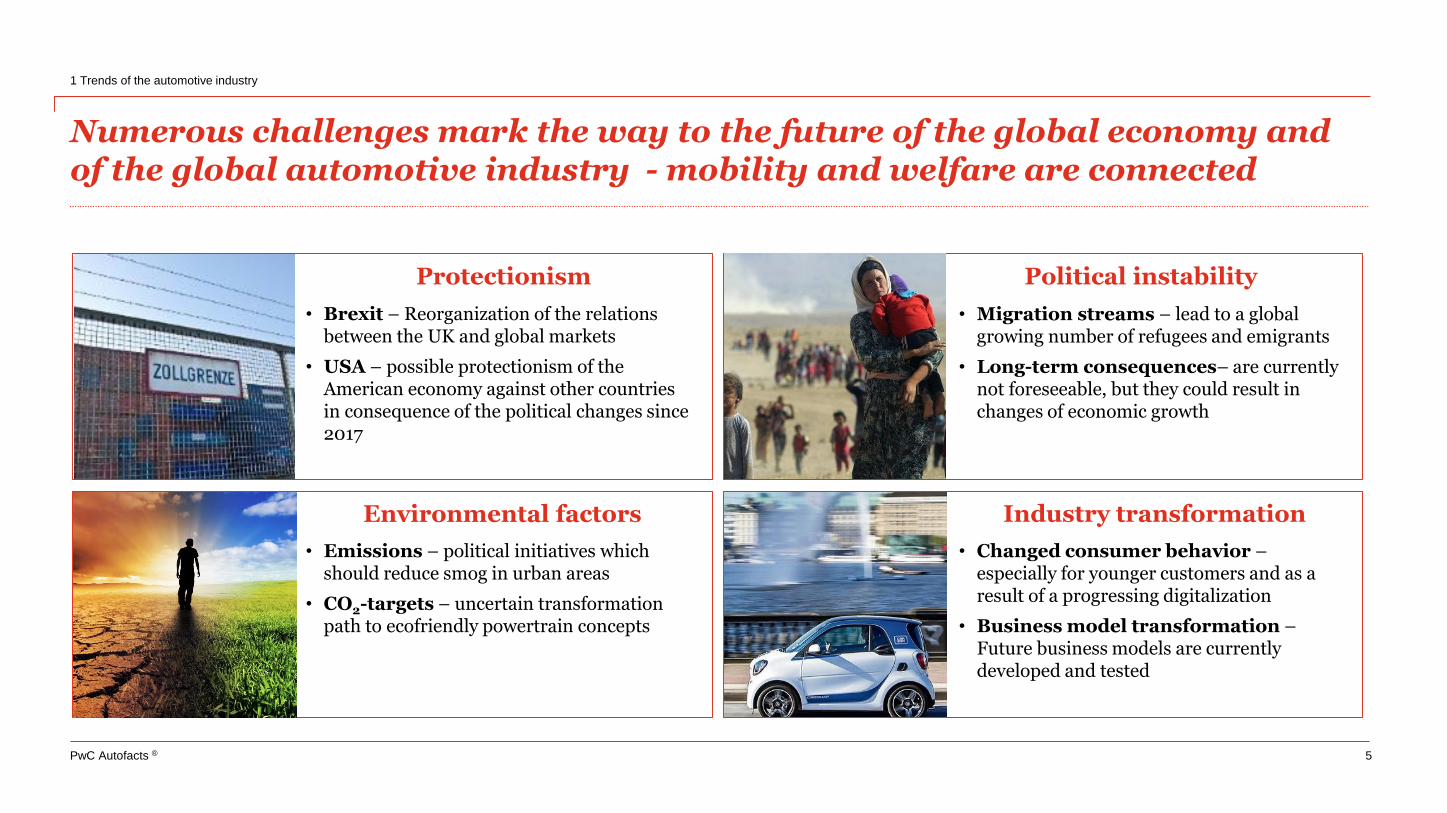
Numerous challenges mark the way to the future of the global economy and of the global automotive industry - mobility and welfare are connected
1 Trends of the automotive industry
5
Protectionism Political instability
Environmental factors Industry transformation
• Brexit – Reorganization of the relations between the UK and global markets
• USA – possible protectionism of the American economy against other countries in consequence of the political changes since 2017
• Emissions – political initiatives which should reduce smog in urban areas
• CO2-targets – uncertain transformation path to ecofriendly powertrain concepts
• Migration streams – lead to a global growing number of refugees and emigrants
• Long-term consequences– are currently not foreseeable, but they could result in changes of economic growth
• Changed consumer behavior –especially for younger customers and as a result of a progressing digitalization
• Business model transformation –Future business models are currently developed and tested

PwC
7. June 2017
Europe sales updates
6
Updates on the Automotive Industry • PwC Automotive
PwC Autofacts ®
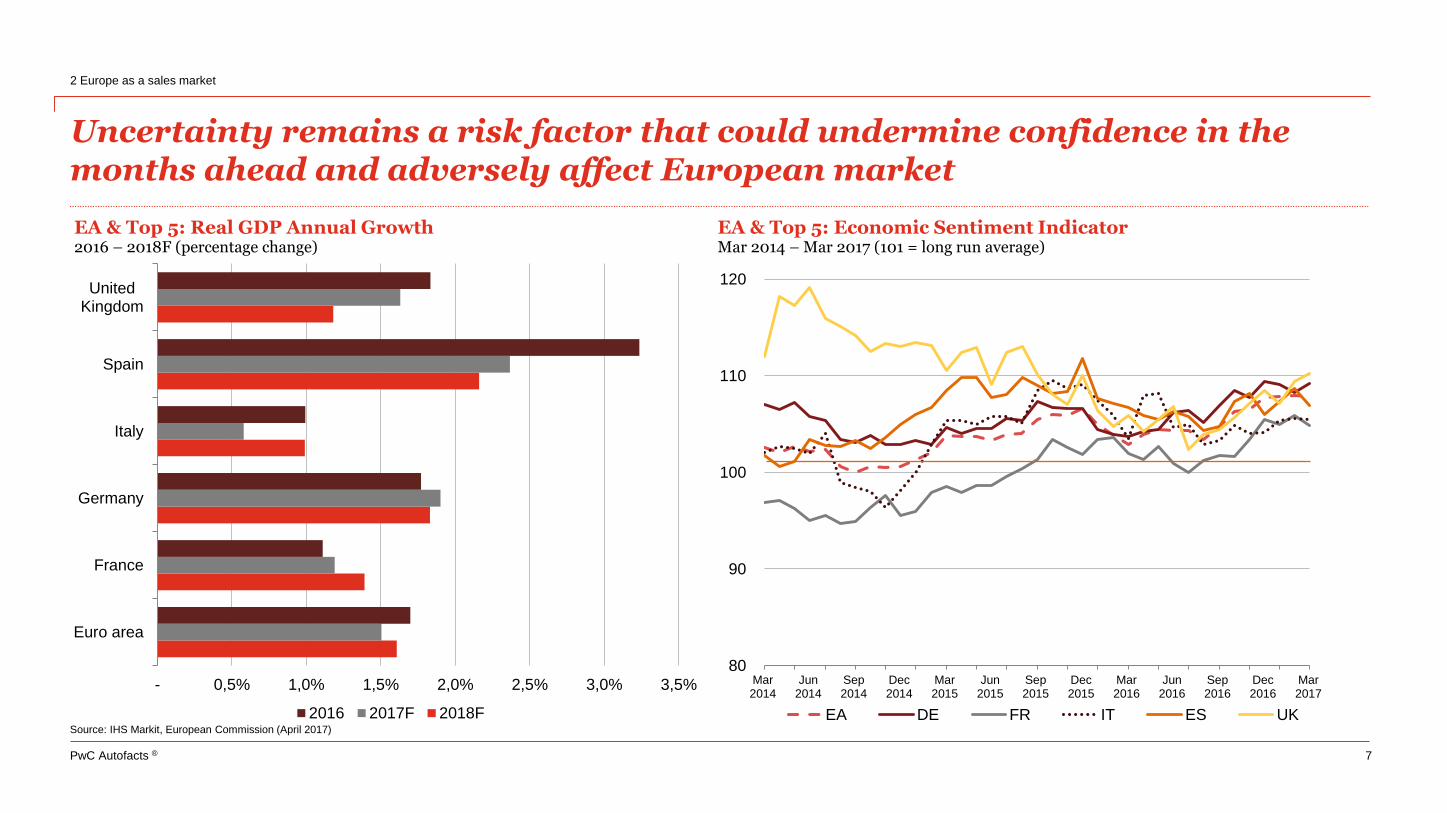
Uncertainty remains a risk factor that could undermine confidence in the months ahead and adversely affect European market
2 Europe as a sales market
7
- 0,5% 1,0% 1,5% 2,0% 2,5% 3,0% 3,5%
Euro area
France
Germany
Italy
Spain
UnitedKingdom
EA & Top 5: Real GDP Annual Growth2016 – 2018F (percentage change)
2016 2017F 2018F
80
90
100
110
120
Mar2014
Jun2014
Sep2014
Dec2014
Mar2015
Jun2015
Sep2015
Dec2015
Mar2016
Jun2016
Sep2016
Dec2016
Mar2017
EA & Top 5: Economic Sentiment IndicatorMar 2014 – Mar 2017 (101 = long run average)
EA DE FR IT ES UKSource: IHS Markit, European Commission (April 2017)

PwC Autofacts ®
Europe’s new passenger car market maintains positive momentum in Q1 and still holds significant structural upside potential
2 Europe as a sales market
8
0
1
2
3
4
5
Germany France UnitedKingdom
Italy Spain Poland CzechRepublic
EU+EFTA: New Car Registration Variance1990 – 2017F (millions)
Source: ACEA, Autofacts Analysis
2016
28-year high
(1990-2017)
28-year low
(1990-2017)
2017F
10
11
12
13
14
15
16
17
Mar2008
Mar2009
Mar2010
Mar2011
Mar2012
Mar2013
Mar2014
Mar2015
Mar2016
Mar2017
EU+EFTA: Rolling 12 Months Car RegistrationsMar 2008 – Mar 2017 (millions)
Rolling 12-Month Car Registrations Annual Registrations

PwC Autofacts ®
Autofacts expects light vehicle registrations to grow by +3.8% to 17.8m in 2017 – with a perspective to higher sales driven by legislation impacts
2 Europe as a sales market
9
Source: ACEA, Autofacts Analysis
(10%)
(6%)
(2%)
2%
6%
10%
-
5
10
15
20
25
2008 2010 2012 2014 2016 2018F 2020F 2022F
EU+EFTA: New Light Vehicle Registrations 2008 – 2023F (millions)
Car Registrations LCV Registratons YOY Change (R-Axis)
PwC
7. June 2017
Europe as a production location
10
Updates on the Automotive Industry • PwC Automotive
PwC Autofacts ®
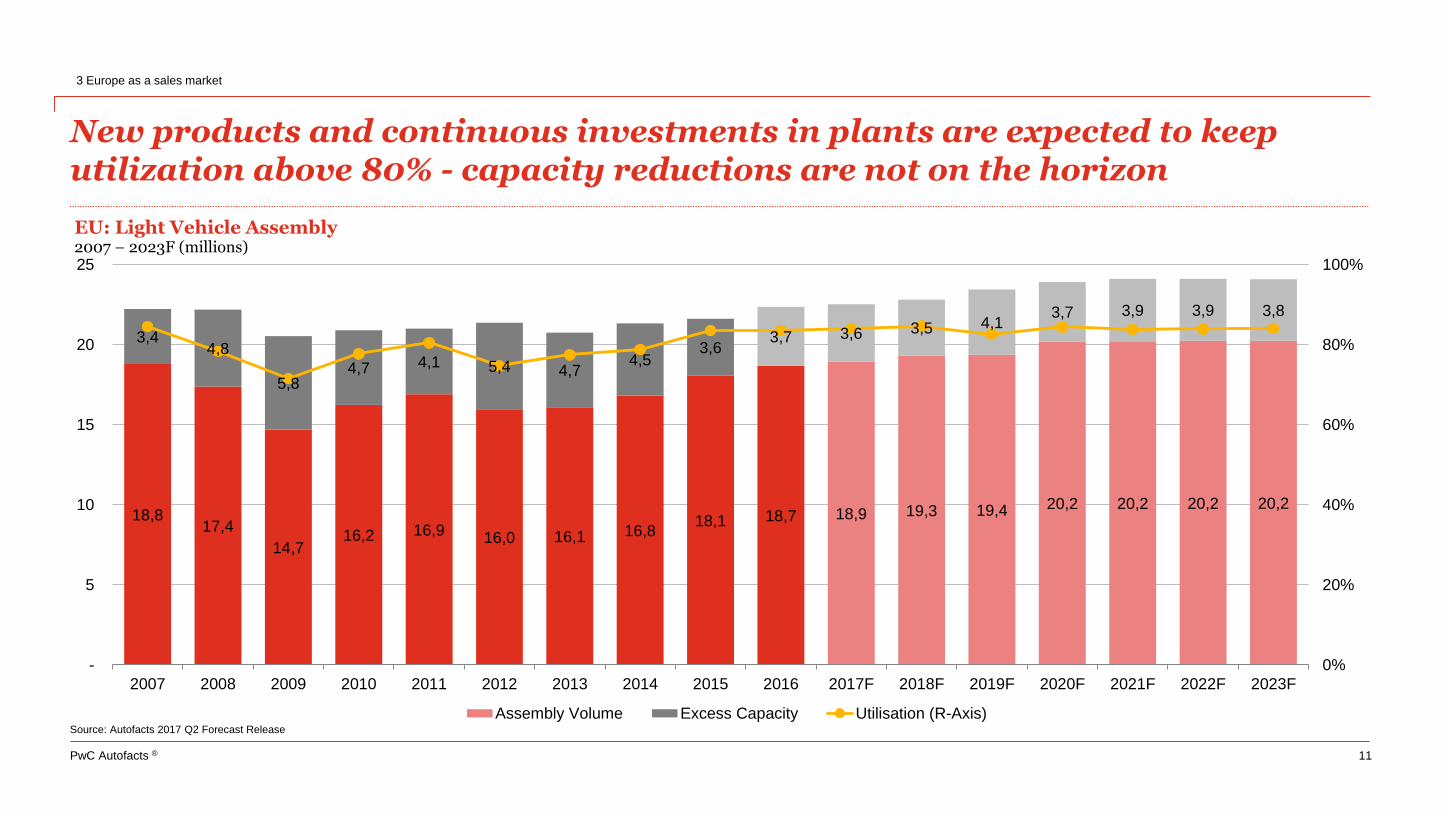
New products and continuous investments in plants are expected to keep utilization above 80% - capacity reductions are not on the horizon
3 Europe as a sales market
11
18,817,4
14,716,2 16,9 16,0 16,1 16,8
18,1 18,7 18,9 19,3 19,4 20,2 20,2 20,2 20,2
3,44,8
5,84,7 4,1 5,4 4,7
4,53,6
3,7 3,6 3,5 4,13,7 3,9 3,9 3,8
0%
20%
40%
60%
80%
100%
-
5
10
15
20
25
2007 2008 2009 2010 2011 2012 2013 2014 2015 2016 2017F 2018F 2019F 2020F 2021F 2022F 2023F
EU: Light Vehicle Assembly2007 – 2023F (millions)
Assembly Volume Excess Capacity Utilisation (R-Axis)Source: Autofacts 2017 Q2 Forecast Release
PwC Autofacts ®
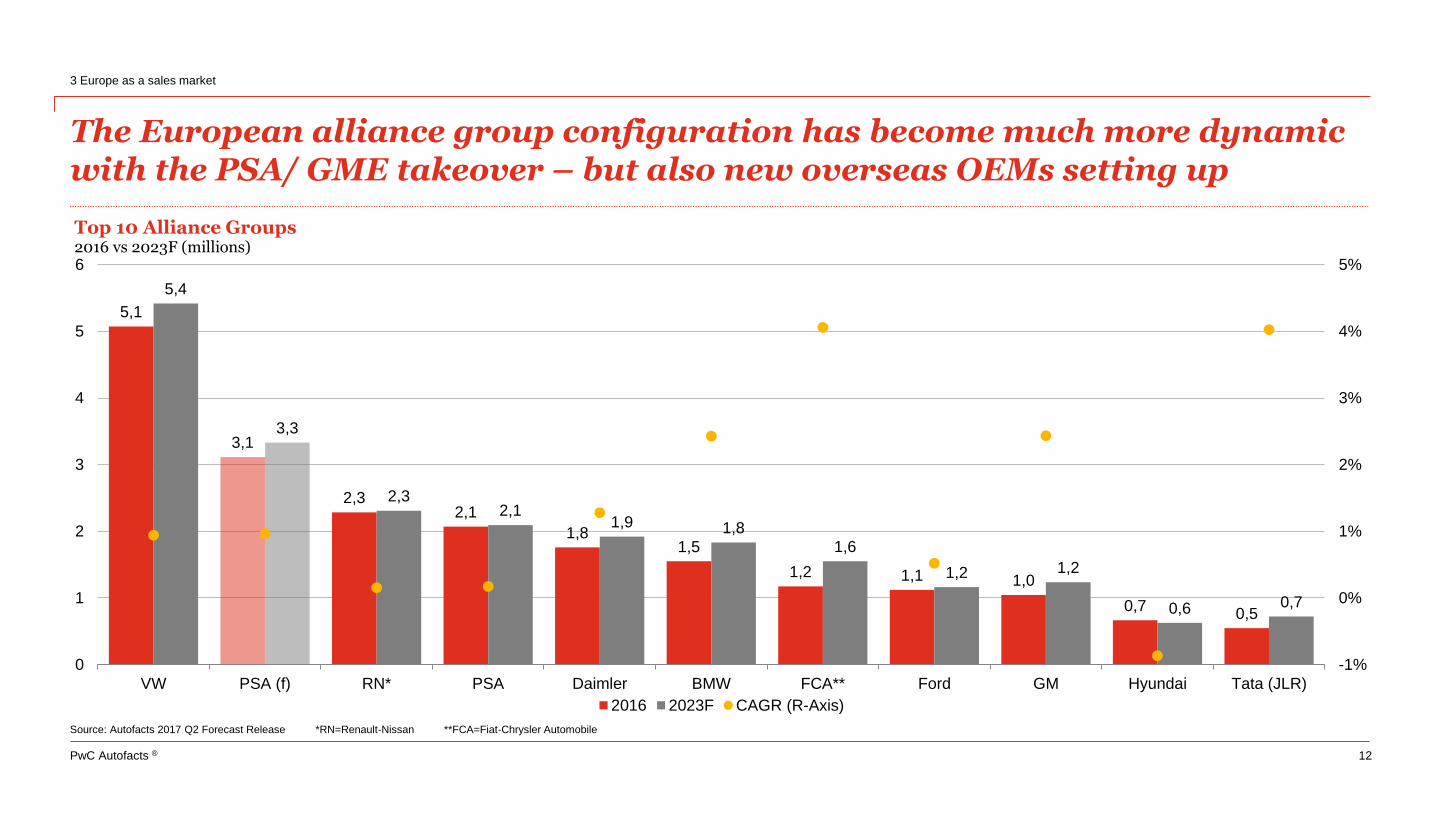
The European alliance group configuration has become much more dynamic with the PSA/ GME takeover – but also new overseas OEMs setting up
3 Europe as a sales market
12
5,1
3,1
2,32,1
1,81,5
1,2 1,1 1,0
0,70,5
5,4
3,3
2,32,1
1,9 1,8
1,6
1,2 1,2
0,6 0,7
-1%
0%
1%
2%
3%
4%
5%
0
1
2
3
4
5
6
VW PSA (f) RN* PSA Daimler BMW FCA** Ford GM Hyundai Tata (JLR)
Top 10 Alliance Groups2016 vs 2023F (millions)
2016 2023F CAGR (R-Axis)
Source: Autofacts 2017 Q2 Forecast Release *RN=Renault-Nissan **FCA=Fiat-Chrysler Automobile
PwC Autofacts ®
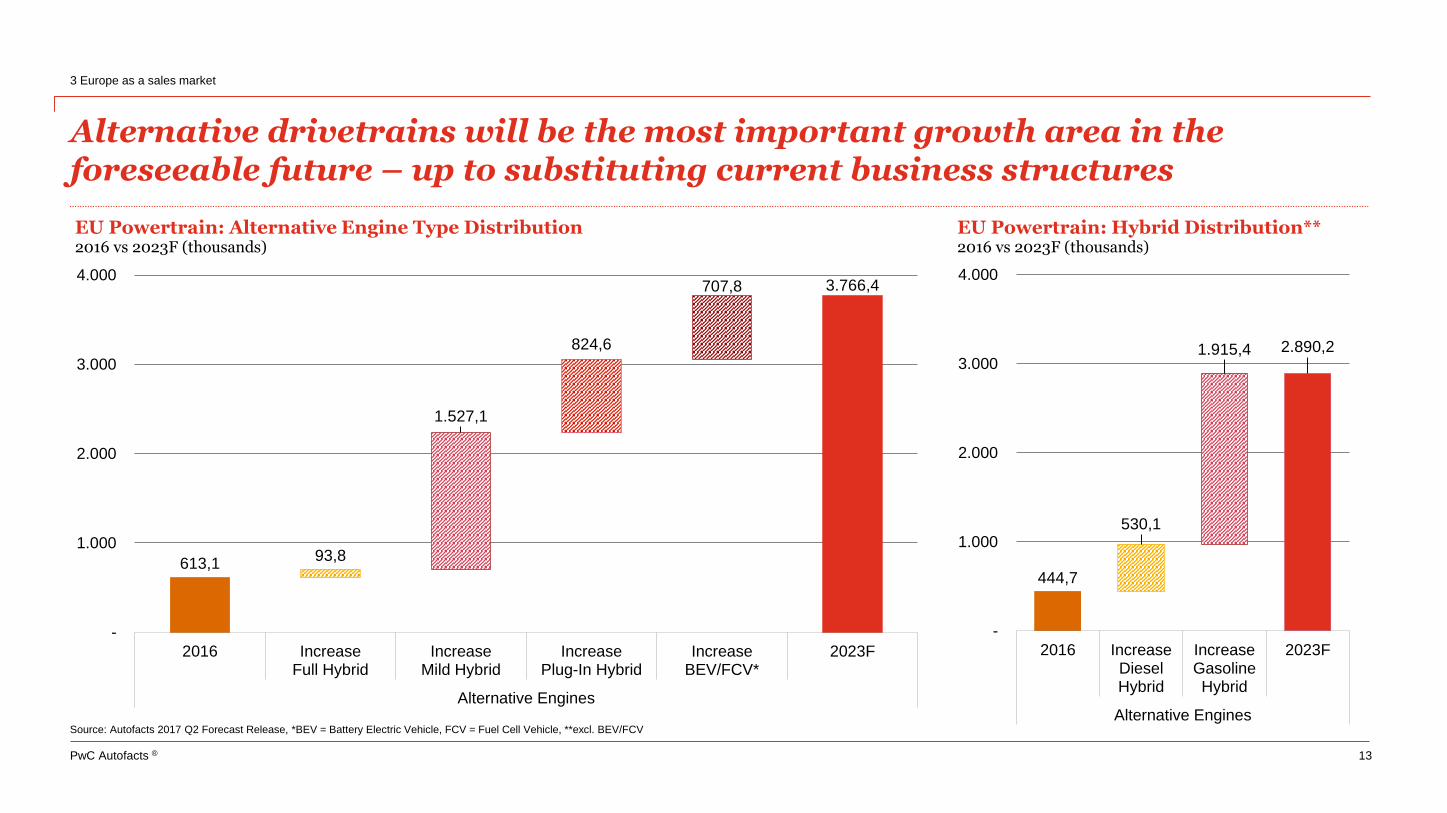
Alternative drivetrains will be the most important growth area in the foreseeable future – up to substituting current business structures
3 Europe as a sales market
13
613,193,8
1.527,1
824,6
707,8 3.766,4
-
1.000
2.000
3.000
4.000
2016 IncreaseFull Hybrid
IncreaseMild Hybrid
IncreasePlug-In Hybrid
IncreaseBEV/FCV*
2023F
Alternative Engines
EU Powertrain: Alternative Engine Type Distribution2016 vs 2023F (thousands)
444,7
530,1
1.915,4 2.890,2
-
1.000
2.000
3.000
4.000
2016 IncreaseDieselHybrid
IncreaseGasolineHybrid
2023F
Alternative Engines
EU Powertrain: Hybrid Distribution**2016 vs 2023F (thousands)
Source: Autofacts 2017 Q2 Forecast Release, *BEV = Battery Electric Vehicle, FCV = Fuel Cell Vehicle, **excl. BEV/FCV
PwC
7. June 2017
Brexit – Whiter Britannia?
14
Updates on the Automotive Industry • PwC Automotive
PwC Autofacts ®
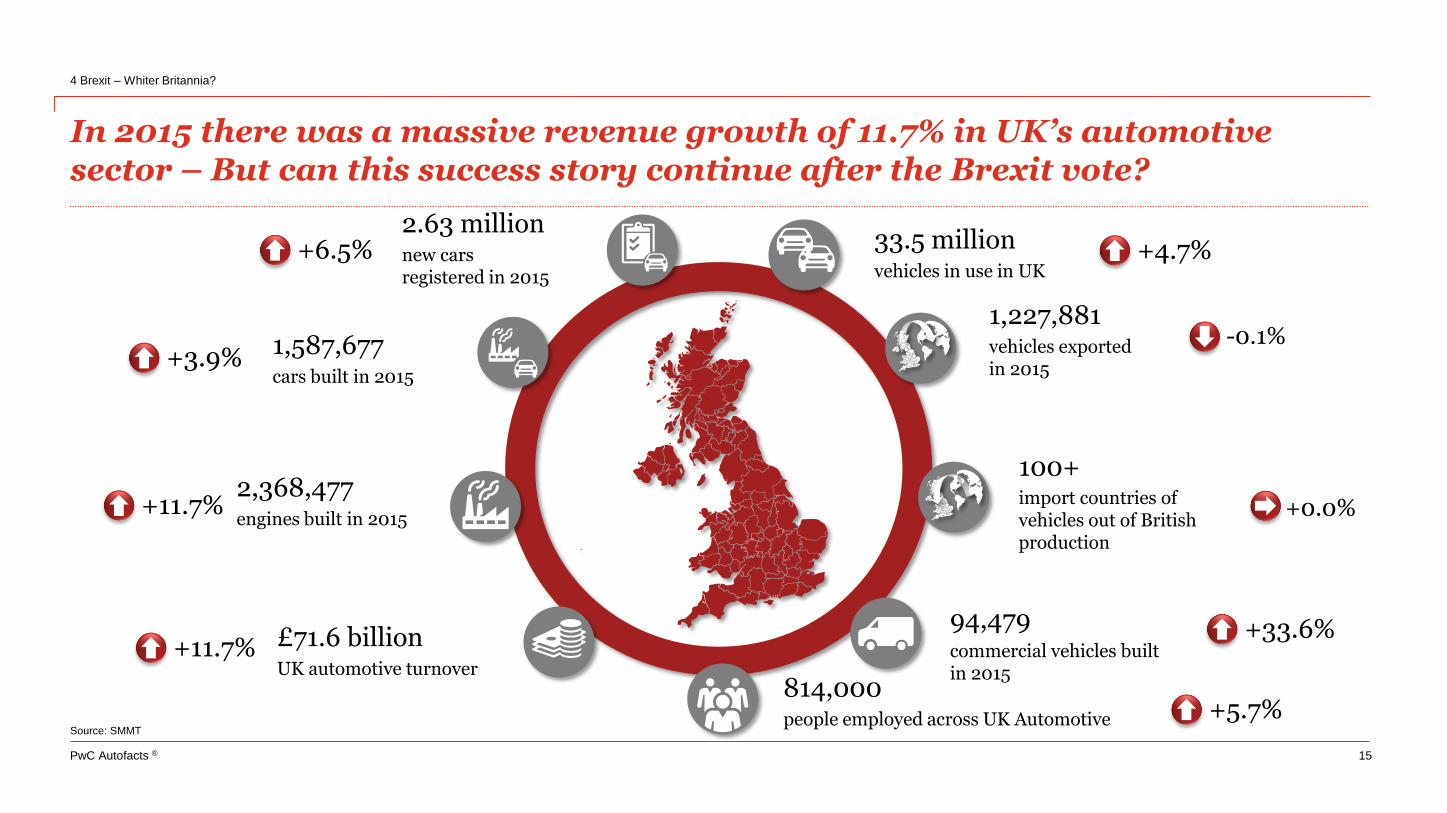
In 2015 there was a massive revenue growth of 11.7% in UK’s automotive sector – But can this success story continue after the Brexit vote?
4 Brexit – Whiter Britannia?
15
Source: SMMT
94,479commercial vehicles built in 2015
2.63 millionnew cars registered in 2015
1,227,881vehicles exportedin 2015
100+import countries of vehicles out of British production
1,587,677cars built in 2015
£71.6 billionUK automotive turnover
814,000people employed across UK Automotive
33.5 millionvehicles in use in UK
2,368,477engines built in 2015
-0.1%
+4.7%
+0.0%
+33.6%
+5.7%
+11.7%
+11.7%
+3.9%
+6.5%
PwC Autofacts ®
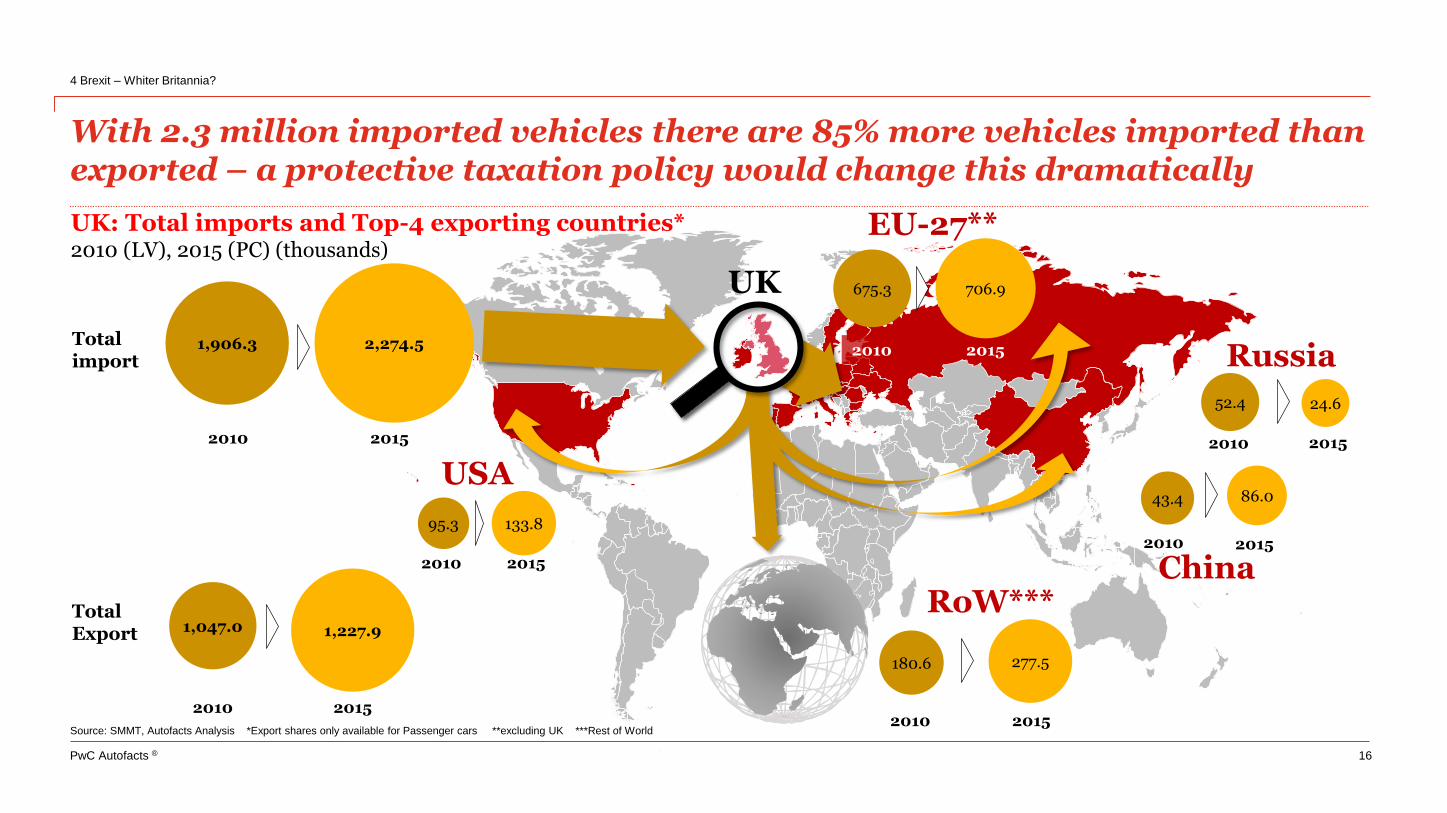
With 2.3 million imported vehicles there are 85% more vehicles imported than exported – a protective taxation policy would change this dramatically
4 Brexit – Whiter Britannia?
16
Source: SMMT, Autofacts Analysis *Export shares only available for Passenger cars **excluding UK ***Rest of World
USA
UK: Total imports and Top-4 exporting countries* 2010 (LV), 2015 (PC) (thousands)
UK
Russia
RoW***
95.3 133.8
2010 2015
TotalExport
Totalimport
2010 2015
1,227.91,047.0
2010 2015
2,274.51,906.3
2010 2015
24.652.4
277.5180.6
2010 2015
2010
China2015
86.043.4
EU-27**
706.9
20152010
675.3

PwC Autofacts ®
2,0
1,6
1,7
1,1
0,5
1,0
1,5
2,0
2,5
2015 2016 2017F 2018F 2019F 2020F 2021F 2022F 2023F
UK: Light vehicle assembly scenarios2015 – 2023 (millions)
In the worst examined case, vehicle production in the United Kingdom would decrease to 1.1 million units by 2023: no FTA and high exchange rate!
4 Brexit – Whiter Britannia?
17
Source: Autofacts 2017 Q2 Forecast Release *Free Trade Agreement
„Turkey Scenario“
„South Korea Scenario“
„Brasil Scenario“
•No FTA* with EU & high exchange rate•Relocation of production capacity to other EU plants
•No investments in R&D•Factory closures
•FTA* with EU & subsidies & low exchange rate •New plants•New R&D investment•New hires
•FTA* with EU & high exchange rate•Most likely under today‘s conditions •Currently planned SOPs take place

PwC Autofacts ®
If decisions were taken today, it would be theoretically possible to shift 2/3 of United Kingdom’s light vehicle assembly volume to the EU by 2020
4 Brexit – Whiter Britannia?
18
Source: Autofacts 2017 Q2 Forecast Release
0,0
0,5
1,0
1,5
2,0
2016 2017F 2018F 2019F 2020F 2021F 2022F 2023F
Effort of assembly shifting to the continent 2016 – 2023 (millions)
No equivalence Equal OEM Equal platform Equal vehicle
UK assembly share
2017 – 2023
49.3%
9.0%
16.9%
24.8%
Transfer to EU from UK
Immediatelyfeasible
Requires plantRefitting (1 years)
BrownfieldSetup (2 years)
GreenfieldSetup (3 years)

Thank you for your attention!
Autofacts®

PwC Autofacts ®
Autofacts contact
20
Christoph StürmerGlobal Lead AnalystPwC Germany (Europe)T: +49 69 9585 6269E: [email protected]
PwC Autofacts ®
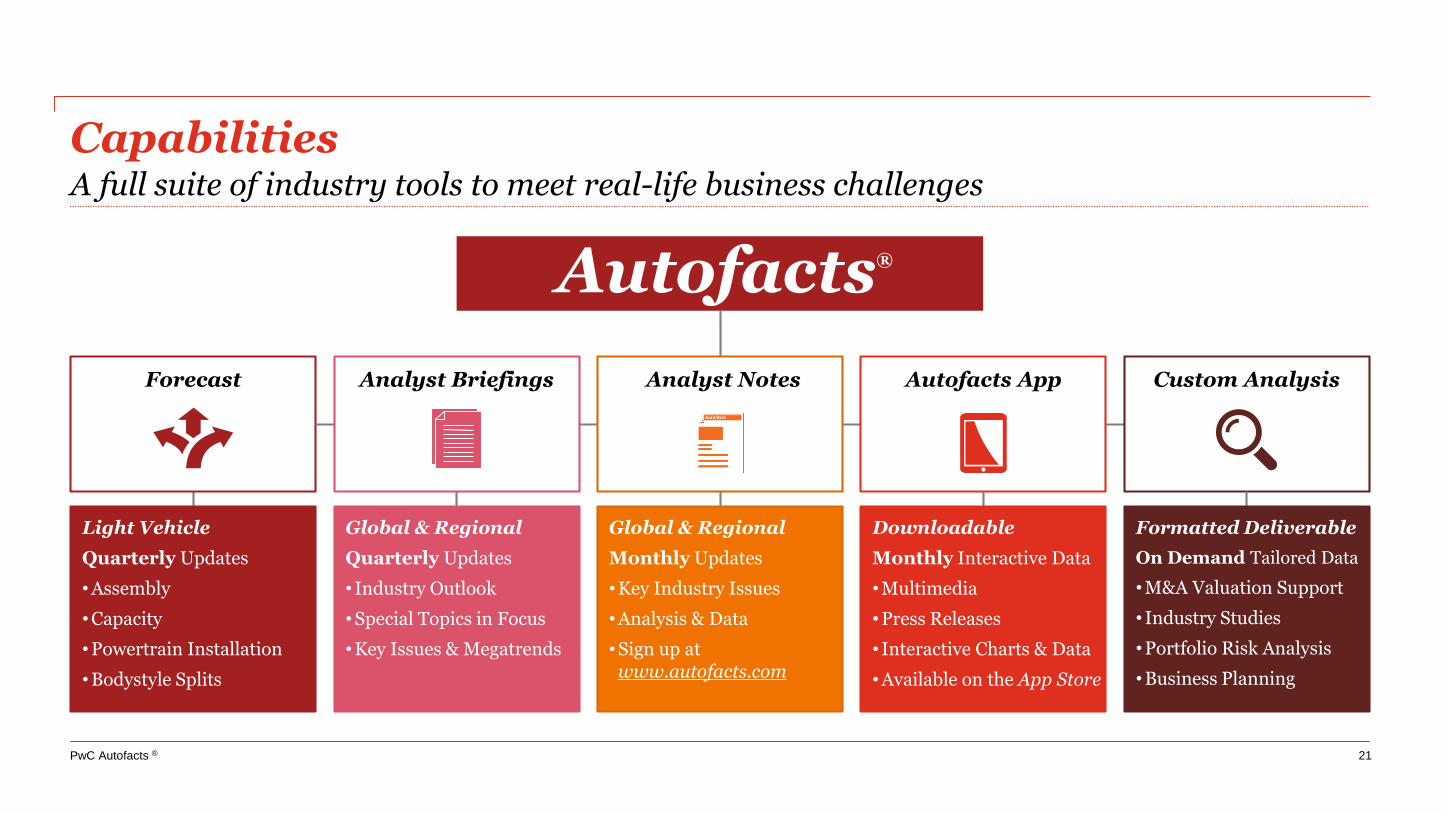
CapabilitiesA full suite of industry tools to meet real-life business challenges
Forecast
Light Vehicle
Quarterly Updates
• Assembly
• Capacity
• Powertrain Installation
• Bodystyle Splits
Analyst Briefings
Global & Regional
Quarterly Updates
• Industry Outlook
• Special Topics in Focus
• Key Issues & Megatrends
Autofacts®
Analyst Notes
Global & Regional
Monthly Updates
• Key Industry Issues
• Analysis & Data
• Sign up at www.autofacts.com
Autofacts App
Downloadable
Monthly Interactive Data
• Multimedia
• Press Releases
• Interactive Charts & Data
• Available on the App Store
Custom Analysis
Formatted Deliverable
On Demand Tailored Data
• M&A Valuation Support
• Industry Studies
• Portfolio Risk Analysis
• Business Planning
21

PwC Autofacts ®
The information contained in this report represents the culmination of proprietary research conducted by Autofacts, an analytical group within PwC. All material contained in this report was developed independently of any
PwC client relationship and does not represent the firm’s view as an auditor to any legal business entity. While every effort has been made to ensure the quality of information provided, no representation or warranty of any
kind (whether expressed or implied) is given by PwC as to the accuracy, completeness or fitness for any purpose of this document. As such, this document does not constitute the giving of investment advice, nor a part of
any advice on investment decisions. Accordingly, regardless of the form of action, whether in contract, tort or otherwise, and to the extent permitted by applicable law, PwC accepts no liability of any kind and disclaims all
responsibility for the consequences of any person acting or refraining from acting in reliance on this document.
©2017 PwC. All rights reserved. “PwC” refers to PricewaterhouseCoopers LLP (a Delaware limited liability partnership) or, as the context requires, other member firms of PricewaterhouseCoopers International Ltd., each of
which is a separate and independent legal entity. “Autofacts” is a globally registered trademark of PwC.
Autofacts®
Autofacts® – Dedicated to the Automotive Industry
22