trends & challenges of the automotive industry & challenges of the automotive industry...
TRANSCRIPT

Autofacts®
Trends & Challenges of the Automotive Industry
www.pwc.com
Automotive Logistics Europe
16 March 2016

PwC Autofacts ®
Global Agenda
1 Global Agenda
2

PwC Autofacts ®
2016 Global CEO Survey: Redefining Business Success In A Changing World
Global business leaders see a more divergent and multi-polar world where technology is transforming the expectations of customers and other stakeholders.
1 Global Agenda
3
Most T&L-CEOs agree that businesss success in the 21st century will be redefined by more
than financial profit.
78%
Corporate SuccessT&L-CEOs
44%
25%
31%
60%
36% 24%33% 32%
36%
13%
17%
45%
41%
36%
2008 2009 2010 2011 2012 2013 2014 2015 2016
Mood BarometerT&L-CEOs
CEOs very confident in business growth prospects
CEOs confident global economic growth will improve
To define a more comprehensive view of how their business operateswith society
To harness technology, innovation and talent to execute strategies that meet grater expectations
To develop better ways to measure and communicate business success
1
2
3
Focus on 3 Core CapabilitiesResult of CEO-Survey
∑
Source: PwC 19th Global CEO Survey: Transportation and logistics industry key findings
PwC Autofacts ®
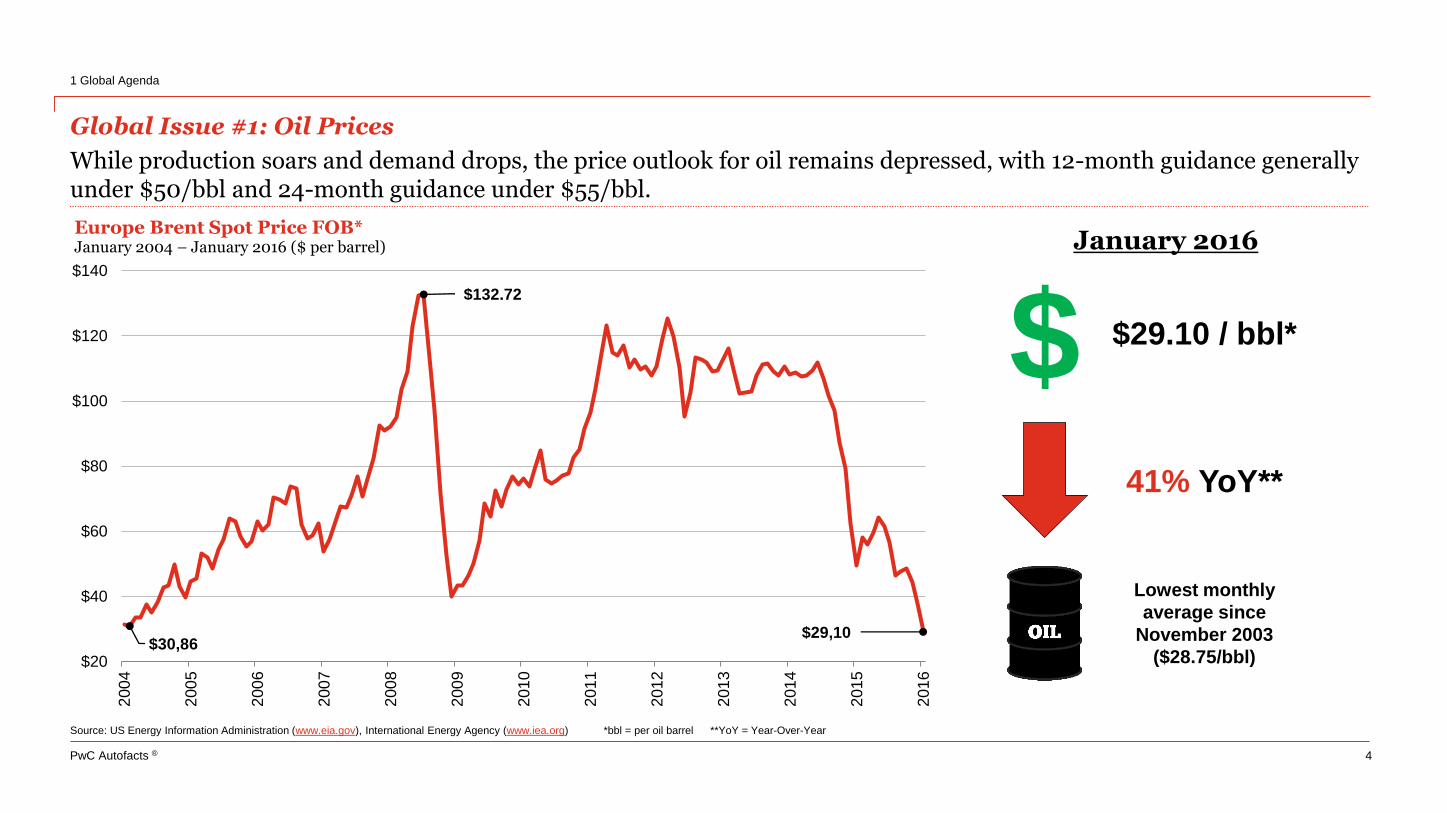
Global Issue #1: Oil Prices
While production soars and demand drops, the price outlook for oil remains depressed, with 12-month guidance generally under $50/bbl and 24-month guidance under $55/bbl.
1 Global Agenda
4
$30,86
$132,72
$29,10
$20
$40
$60
$80
$100
$120
$140
200
4
200
5
200
6
200
7
200
8
200
9
201
0
201
1
201
2
201
3
201
4
201
5
201
6
Europe Brent Spot Price FOB*January 2004 – January 2016 ($ per barrel)
Source: US Energy Information Administration (www.eia.gov), International Energy Agency (www.iea.org) *bbl = per oil barrel **YoY = Year-Over-Year
January 2016
$29.10 / bbl*
41% YoY**
Lowest monthly
average since
November 2003
($28.75/bbl)
$
PwC Autofacts ®
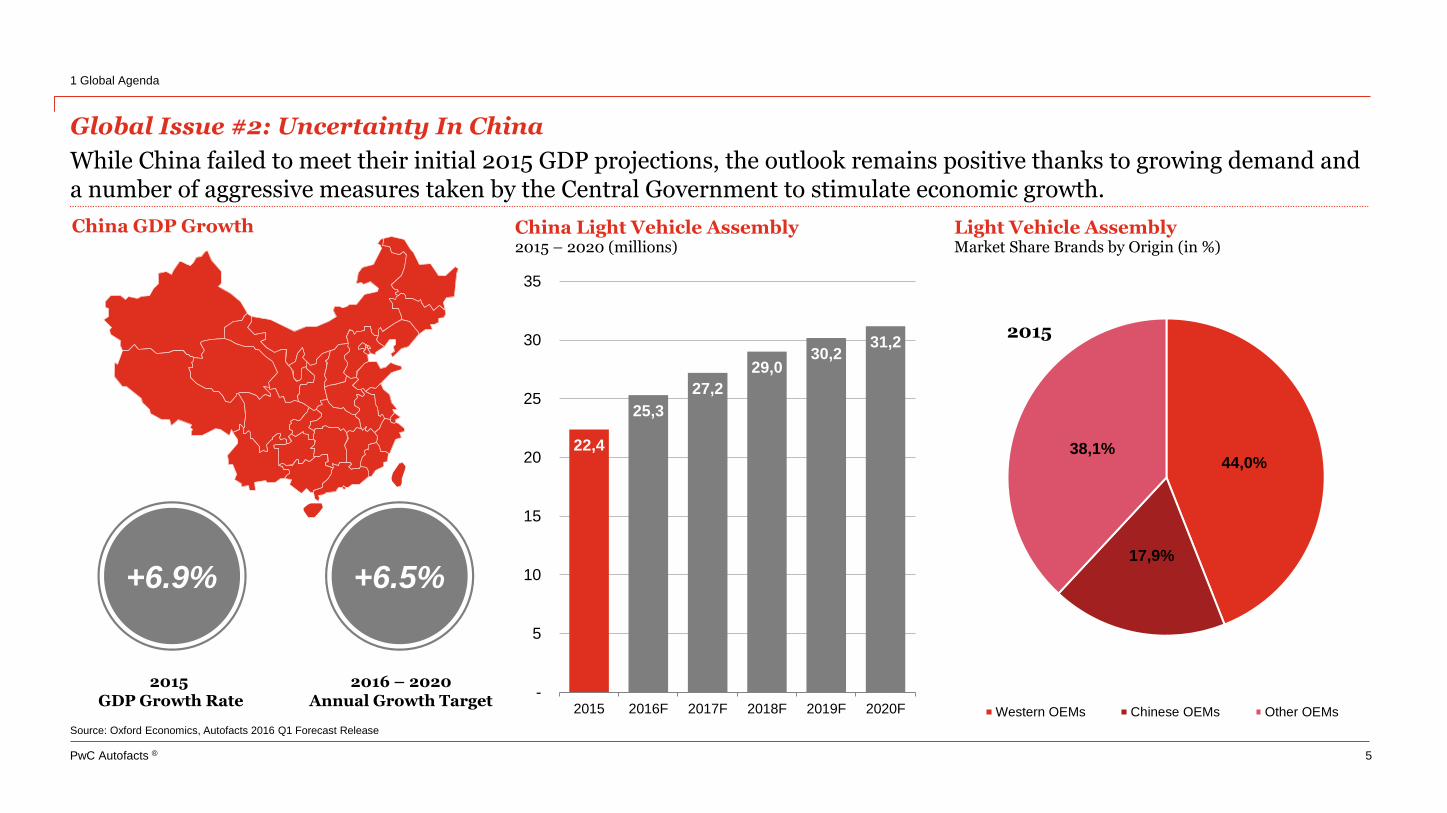
Global Issue #2: Uncertainty In China
While China failed to meet their initial 2015 GDP projections, the outlook remains positive thanks to growing demand and a number of aggressive measures taken by the Central Government to stimulate economic growth.
1 Global Agenda
5
22,4
25,3
27,2
29,030,2
31,2
-
5
10
15
20
25
30
35
2015 2016F 2017F 2018F 2019F 2020F
China Light Vehicle Assembly2015 – 2020 (millions)
44,0%
17,9%
38,1%
Light Vehicle AssemblyMarket Share Brands by Origin (in %)
Western OEMs Chinese OEMs Other OEMs
2015GDP Growth Rate
+6.5%+6.9%
2016 – 2020 Annual Growth Target
Source: Oxford Economics, Autofacts 2016 Q1 Forecast Release
2015
China GDP Growth

PwC Autofacts ®
Change of Dynamics – or not?
2 Change of Dynamics – or not?
6

PwC Autofacts ®
Global Topline
Light vehicle assembly is expected to reach 88.2m units in 2015, representing a 2.1% YoY (year-over-year) increase. Autofacts is forecasting 2022 light vehicle assembly to reach 110.7m units, equating to a 3.6% CAGR* from 2015 – 2021.
2 Change of Dynamics – or not?
7
86,4 88,4 92,8 97,0 101,4 105,5 107,8 109,0 110,7
28,431,9
33,3 33,332,4
30,4 29,5 30,4 28,4
20%
30%
40%
50%
60%
70%
80%
90%
100%
-
20
40
60
80
100
120
140
160
2014 2015 2016F 2017F 2018F 2019F 2020F 2021F 2022F
Light Vehicle Assembly2014 – 2022 (millions)
Assembly Volume Excess Capacity Utilisation (R-Axis)
Source: Autofacts 2016 Q1 Forecast Release *CAGR = Compound Annual Growth Rate **Region size not to scale ***CTG = Contribution to Growth
4.9%
South America
8.1%
Eastern Europe
5.0%
Middle East & Africa
5.5%
European Union
13.6%
North America
(2.3%)
Developed Asia-Pacific
65.2%
Developing Asia-Pacific
3.1m 2.9m 2.1m18.3m17.5m 13.1m31.4m
4.2m 4.7m 3.2m19.5m20.5m 12.6m45.9m
Regional Topline Comparison & Volume Change2015 vs. 2022
+1.1m +1.8m +1.1m+1.2m+3.0 (515k)+14.5m
2015
2022
Americas Europe, Middle East & Africa (EMEA) Asia-Pacific
Regional Contribution to Growth*2015 – 2022 (percentage share)

PwC Autofacts ®
2 Change of Dynamics – or not?
8
Source: Autofacts Analysis, Autofacts 2016 Q1 Forecast Release
Regional Sales and Manufacturing Footprint2015 (units in millions)
NAFTA
17.8m 20.6m
ROW
10.2m 18.5m
South Korea
4.4m
1.8m
Japan
8.6m4.9m
China
23.3m 23.4m
EU-27
18.3m 15.8m
Germany
3.4m6.2m
Assembly
Sales
Comparison: Sales vs. Assembly 2015
Global vehicle production and sales are distributed unevenly and create major trade flows and interconnection between market regions

PwC Autofacts ®
2 Change of Dynamics – or not?
9
Source: Autofacts Analysis, Autofacts 2016 Q1 Forecast Release *estimate
Regional Sales and Manufacturing Footprint2022 (units in millions)
NAFTA
20.6m 21.0m
ROW
19.6m 26.5m
South Korea
4.3m
2.1m*
Japan
8.3m
5.0m
China
32.3m 31.8m
EU-27
19.5m 18.8m
Germany
3.8m6.1m
Assembly
Sales
Forecast 2022
Global net trade flows will become much more balanced between major regions – but net importers will be increasingly disparate and hard to compensate with other freight
PwC Autofacts ®
Growth of EU Market
3 Growth of EU Market
10

PwC Autofacts ®
The European fiscal crisis, though still far from resolved, has faded out of public attention and has currently no impact on consumer and industry sentiment. New challenges: especially the refugee crisis, a potential Brexit and volatility of global economies.
3 Growth of EU Market
11
• Of the 31 EU+EFTA countries, 29 had a positive growth of car sales in 2015. Ireland (29.9%), Portugal (24.9%) and Spain (20.9%) are among the top performers.
• The growth of the Eurozone has continued with YoY GDP growth of 1.6%. This positive development has been driven by increasing private consumption as well as favorablemonetary policies.
• A mix of risks and opportunities influences the European economy: Ongoing fiscal struggles, refugee crises and instability of global economies on the one hand, while on the other hand strengthened demand across Europe, lower inflation rates and dropping oil prices
• Based on the ongoing onslaught of new vehicle and technology launches, a generally positive economic outlook and significant pent-up demand, we expect a positive sales development over the next years.
• A bright spot of electric car building in Europe is the German firm StreetScooter. It was founded in 2010. Deutsche Post integrated and acquired the entire entity in 2014, including technology and production facilities. Annual production volume is expected to reach 5,000 units, with 20,000 earmarked to renew DHL’s delivery fleet
• Audi is expected to start producing its Q6 e-tron quattro in Belgium at the beginning of 2018.
• Additionally, VW is likely to relaunch its upper class sedan, Phaeton, as pure electric vehicle at the end of the decade.
Europe: The Recovery Journey Continues
Overview: EU Development
Source: Autofacts 2016 Q1 Forecast Release

PwC Autofacts ®
EU – 16.6 Million New Light Vehicles Forecasted For 2016
Backed by various supportive factors such as low fuel prices and improving employment expectations, new car sales in the EU are forecasted to grow by 3.7% in 2016, reaching 16.6 million units.
3 Growth of EU Market
12
(10%)
(8%)
(6%)
(4%)
(2%)
0%
2%
4%
6%
8%
10%
12%
-
5
10
15
20
25
200
9
201
0
201
1
201
2
201
3
201
4
201
5
201
6F
201
7F
201
8F
201
9F
202
0F
202
1F
202
2F
202
3F
EU+EFTA: New Light Vehicle Registrations 2006 – 2023 (millions)
Car Registrations LCV Registratons YoY Change (R-Axis)
Key Messages
• Europe continues on its recovery journey: Stimulating increased private consumption and spending are improving employment rates and growing disposable income in most European markets.
• Economic Sentiment continued to improve on a broad base, with the overall Euro Area sentiment crossing the 106-point mark.
• Other factors also remain supportive: generally low credit and financing rates, still decreasing fuel prices, improving employment expectations and an ongoing onslaught of new and attractive products.
• Given that a number of potentially limiting factors, including inflation, unemployment, market saturation, have yet to come to fruition and are being combatted with proactive sales tactics, this growth is expected to continue.
• Additionally, new products in expanding segments like compact SUVs will also help to lure vehicle buyers into the new car market.
• Backed by an even more dynamic LCV market growth of 9.1%, light vehicle sales have reached 16.0m units in 2015, and are expected to reach 16.6m in 2016, driven by further growth of 3.7% of the car sector, and 7.5% of the LCV segment.
Source: Autofacts 2016 Q1 Forecast Release

PwC Autofacts ®
“Brexit”
4 “Brexit”
13

PwC Autofacts ®
The UK As An Important Automobile Country
The UK follows Germany, Spain and France as the 4th biggest Assembler of passenger cars and light commercial vehicles in Europe. In 2015, 1,66 million units has been produced in the UK. The biggest assembler is Nissan with 602k units.
4 “Brexit”
14
Assembly - Global top 15 countries
Rank Country 2014 2015 Change
1 China 22,158,911 23,282,662 5.07%
2 USA 11,540,536 11,917,035 3.26%
3 Japan 8,945,003 8,621,330 -3.62%
4 Germany 5,838,574 6,170,594 5.69%
5 South Korea 4,317,064 4,359,599 0.99%
6 India 3,585,630 3,789,506 5.69%
7 Mexico 3,211,980 3,370,460 4.93%
8 Spain 2,338,396 2,717,948 16.23%
9 Brazil 2,927,307 2,368,581 -19.09%
10 Canada 2,378,983 2,241,073 -5.80%
11 France 1,830,068 2,002,030 9.40%
12 Thailand 1,898,139 1,949,215 2.69%
13 United Kingdom 1,583,892 1,664,568 5.09%
14 Czech Republic 1,156,550 1,319,522 14.09%
15 Russia 1,766,043 1,287,365 -27.10%
Source: SMMT
70,731CVs built 2014
1,528,148cars built in 2014
2.394.668engines built in 2014
2.47 millionnew cars registered in 2014
£64,1 billionamount generated in turnover by UK automotive in 2013
1.228.777vehicle exported in 2014
770.000people employed across UK auto
100+countries worldwide importing UK-built vehicles
32 million+cars currently on UK roads
UK: Market Overview

PwC Autofacts ®
Hypothesis: A “Brexit” Could Take Place in different Shapes and Forms
4 “Brexit”
15
Source:PwC Autofacts Research
ScenariosEUinstitutions
EU law/ regulations
Monetary union
Banking unionSchengen agreement
EC TreatiesInfluence onautomotive industry
Full member ParticipationAutomaticconversion
Euro zoneCommon Banking Supervision
No visa requirements
4 freedoms Optimal scenario
GB today ParticipationAutomaticconversion
X X X 3 freedoms Restricted optimal
“Norway scenario”
Observer statusAutomaticconversion
X XNo visa requirements
4 freedomsLow (positive)effects
“Switzerlandscenario”
Observer status“Autonomousimplementation”
X X Restricted EFTA Low effects
“Turkeyscenario”
In negotiationsSelectiveimplementation
X X X Bilateral treaties Noticeable effects
“Splendid Isolation-Scenario”
No participation No implementation X X X X Significant effects
Possible scenarios of “Brexit”
The EU contract does not include an exit of a member nation – the referendum in Great Britain could lead to a pro-forma withdrawal of the EU.

PwC Autofacts ®
Middle East & Iran
5 Middle East & Iran
16

PwC Autofacts ®
Market Overview – High Potential Goes Hand In Hand With High Volatility
The final conclusion of the Iran nuclear talks after thirteen years could not only be regarded as a victory for diplomacy butcould also support sustainable growth and increasing participation for the Iranian people and the wider region.
5 Middle East & Iran
17
Middle East and
Africa
Positive regional outlook
• After two consecutive years of decline, light vehicle assembly in the ME&A region is back in positive territory in 2015 up 13.8% to 2.1m units over 2014.
• For 2016, Autofacts forecasts a further increase in light vehicle assembly by approximately 7.4% to almost 2.3m units. By 2022, the regional assembly volume is forecasted to reach 3.2 million units.
Iran has reached historic
agreement
• While light vehicle assembly in Iran dropped by 55% from 1.6m units to roughly 730k units from 2011 to 2013, While Iran was again in positive territory with sales assembly growing in the first semester of 2015, it has slightly decreased by 8.0% to 981k units through November 2015.
• For 2016, Autofacts expects light vehicle assembly to grow by 9.2%, and to almost reach 1.2m mark. Until 2022 assembly volume is assumed to increase further to more than 1.8m units.
• South Africa, the second largest market after Iran in regards to assembly and light vehicle sales, has shown a mixed performance in recent months. While new light vehicle and especially car sales are down 4.2% in 2015 with 587k units, light vehicle assembly is up 10.0% to 583k units in the same period driven by increasing vehicle exports (+20.5%), which continue to gain momentum.
• For 2016, Autofacts expects assembly to grow again by 2.6% to 598k units and assembly volume is assumed to increase further to above 672k units by 2022.
Diverse situation in South
Africa (30%)
(25%)
(20%)
(15%)
(10%)
(5%)
0%
5%
10%
15%
20%
25%
30%
-
100
200
300
400
500
600
700
800
900
1.000
1.100
1.200
Morocco Algeria Egypt South Africa Iran
Light Vehicle Sales by CountryYTD Nov 2014 vs. YTD Nov 2015 (thousands)
YTD Nov 2014 YTD Nov 2015 YoY % Change (R-Axis)
Corporate Success

PwC Autofacts ®
Implementation of the JCPOA Marks the Beginning of a New Phase for Iran’s Economy
After the lifting of sanctions, Iran offers fundamental growth potential, but needs significant investments.
5 Middle East & Iran
18
• High inflation rate of currently 13.8%
• High interest rate of over 20%
• High unemployment rate of 11%
• Low car density of about 200 vehicles per 1,000 inhabitants
• Median age of vehicles on the road in Iran is over 20 years
• LV assembly could be above 2.2m units by 2021
• Huge population of around 80 million people
• Young population with 55% under the age of 30
• Sanctions reduced after implementation day in January 2016
General
Economic
Automotive
Overview: Iran
• The implementation of the Joint Comprehensive Plan of Action
(JCPOA) on 16th January 2016 marked the beginning of a new
phase in relation between Iran and the IAEA. Thus, the lifting of
sanctions against Iran was announced.
• Parliamentary elections in 2016 and presidential elections in
2017 mark important miles in the turnaround of Iran’s economic
development
• While light vehicle assembly in Iran dropped by 55% from 1.6m
units to roughly 730k units from 2011 to 2013, While Iran was
again in positive territory with sales assembly growing in the
first semester of 2015, it has slightly decreased by 8.0% to
981k units through November 2015.
• For 2016, Autofacts expects light vehicle assembly to grow by
9.2%, and to almost reach 1.2m mark. Until 2022 assembly
volume is assumed to increase further to more than 1.8m units.
• Despite the expected increase of the Iran market, the market
growth is forecasted not to be booming extremely:
Automotive retail and service structures of Western OEMs virtually inexistent or outdated since 1979
Low oil prices continue to weigh heavy on government finances
Existing, complex economic system will continue Development of financial sector under structural insecurity

PwC Autofacts ®
Comparison: Iran vs. Germany
Although the size of population is nearly commensurate, the German and Iran economics and landscape show wide differences. The current economic situation in Iran is basically depending on the development of the crude oil price.
5 Middle East & Iran
19
Real GDP Growth2015
2.2%New light vehicle sales**2013 vs. 2014
+32.8%
Unemployment Rate2015
11%
LV Production Volume2014 vs. 2015
+6%
Base Interest Rate2015
21%
Internet usersPer 100 people, 2015
35.3Inflation Rate2015
13.8%LV Assembly Capacity Utilisation2015
56%
Mobile phone usersPer 100 people, 2015
86.2
VehiclesPer 1000 inhabitants, 2015
~200
Population under 30 y.2015
>50%
Population2015
78.5mIR 81.5mDE IR DE 672
4.7%IR DE
IR 30%DE
77.6IR DE >85IR DE
IR DE 1.7% IR 0.3%DE IR DE 0.05%
IR +3.2%DE IR DE+14% IR 93%DE
Comparison: Iran vs. Germany

PwC Autofacts ®
Tabriz
MashhadSemnan
Kashan
Shīrāz Bam
BorujedGolpayegan
Tehrān
Total operational capacity~ 2,150k
IRAN
High Potential Automotive Market Growth Dampened By Structural Rigidities
Iran is the Middle East’s largest car producer. The country is significant as sales market and production base for istdomestic market, but also the wider Middle East
5 Middle East & Iran
20
Iran: Assembly Plants 2016
Bahman Group~ 95kTehran
Besturn
Saipa~ 715kTehranKashan
SaipaKiaCitroenNissanRenault
Others* ~ 90kTehranGolpayeganBorujed Great Wall GonowNissan
Mazda
Iran Khodro~ 1,100kTabrizTehranSemnanMashhadShiraz
Peugeot Suzuki
Renault IKCO
Hyundai
Kerman Motor Company~ 150kBam
Jianghuai
Lifan
MVM Great Wall
Hyundai
Source: Autofacts 2016 Q1 Forecast Release *Zagross Khodro, Diar Automobile, Morattab Khodro

PwC Autofacts ®
Russia & Turkey – Risk Profile
6 Russia & Turkey – Risk Profile
21

PwC Autofacts ®
Market Overview – Russia And Turkey
Eastern Europe – The region's biggest market, Russia, decreased by -35.7% for the full year 2015. Turkey, as the region's second biggest market, experienced a turn for the better in 2015 reflecting a sales development of YTD of 26.1%.
6 Russia & Turkey – Risk Profile
22
Regional outlook diverse
•New vehicle sales and registrations within the Eastern European region showed diverse developments during the whole year 2015. Per December, the Russian market declined 35.7%, while the Turkish market expanded by 26.1%.
Demand in Russia collapsing
•Key drivers of the country’s weak economy are low exports, consumer uncertainty, weakness of middle-class demand, and a weak Rubleexchange rate combined with high inflation and excessive interest rates.
•Additionally, the Russian decrease in sales is driven by the political conflicts regarding Ukraine which caused the EU embargo and a rising conflict between Turkey and Russia after Russian’s engagement in the Syrian crisis.
•In Turkey, which is representing around a fourth of Eastern European assembly, the improving consumer sentiment and the connected pent-up demand in the course of a volatile political year led to a significant pick-up in 2015.
•So the market shows a very positive development of YTD 26.1% in December. Until 2022 Turkey's production output is expected to account for more than 1.5m units.
Boost in Turkish LV production and sales
Russia&
TurkeyOil-price crisis
• At the beginning of January the oil-price slipped below $30 to new 12-year low. As Russia is still highly dependent on the energy sector, the oil-price crisis is reflecting an enormous downside risk for the future market development.

PwC Autofacts ®
Assembly Outlook – Measures Need To Be Taken, Especially In Russia
Russia, the dominating production country in the region, is facing political and economic challenges and therefore underutilized plants, excess capacity remains an issue throughout the Eastern European region.
6 Russia & Turkey – Risk Profile
23
0,9 1,0 1,1 1,3 1,4 1,4 1,4 1,4 1,5 1,6 1,6
0,5 0,40,5 0,3
0,30,4 0,5 0,5 0,5 0,4 0,4
0%
20%
40%
60%
80%
100%
0
1
2
3
4
5
2012 2013 2014 2015 2016F 2017F 2018F 2019F 2020F 2021F 2022F
Turkey: Light Vehicle Assembly2014 – 2022 (millions)
Assembly Volume Excess Capacity Utilisation (R-Axis)
2,1 2,01,8
1,3 1,4 1,51,9
2,12,3 2,4 2,5
1,01,4
1,7
2,02,2
2,52,3
2,42,2 2,1 2,0
0%
20%
40%
60%
80%
100%
0
1
2
3
4
5
2012 2013 2014 2015 2016F 2017F 2018F 2019F 2020F 2021F 2022F
Russia: Light Vehicle Assembly2014 – 2022 (millions)
Assembly Volume Excess Capacity Utilisation (R-Axis)
PwC Autofacts ®
Whither from here?
7 Whither from here?
24

PwC Autofacts ®
The Future Paths Of The Automotive Industry Environment: Customer Behaviour And Regulation
7 Whither from here?
25
Source: Re-Inventing the Wheel
Shared mobility
Liberal regulatory environment
Private usage
Restrictive regulatory environment
Self driving accelerates
Connectivity creates new champions
Electric Chauffeurs
Local business models prevail
What is the scenario underlying your corporate plan? How fit are you for a change of coordinate? Can you serve several scenarios at the same time?

PwC Autofacts ®
Thank you for your attention!
Christoph StürmerGlobal Lead AnalystAutofacts
Friedrich-Ebert-Anlage 35-3760327 Frankfurt am Main Phone: +49 69 9585 [email protected]
7 Whither from here?
26

PwC Autofacts ®
Autofacts – CapabilitiesA full suite of industry tools to meet real-life business challenges
Forecast
Light Vehicle
Quarterly Online Access
• Assembly
• Capacity
• Powertrain Consumption
• Bodystyle
Analyst Briefings
Global & Regional
Quarterly Online Access
• Market Outlook
• Special Topics in Focus
• Key Issues & Megatrends
Autofacts®
Analyst Notes
Global & Regional
Monthly Online Access
• Key Industry Issues
• Analysis & Data
• Sign-up at www.autofacts.com
Autofacts App
Downloadable
Monthly Interactive Data
• Multimedia
• Press Releases
• Interactive
Charts & Data
• Available on the App Store
Custom Analysis
Custom Deliverable
On Demand Tailored Data
• M&A Valuation Support
• Industry Studies
• Portfolio Risk Analysis
• Sales / Segment
7 Whither from here?
27
PwC Autofacts ®
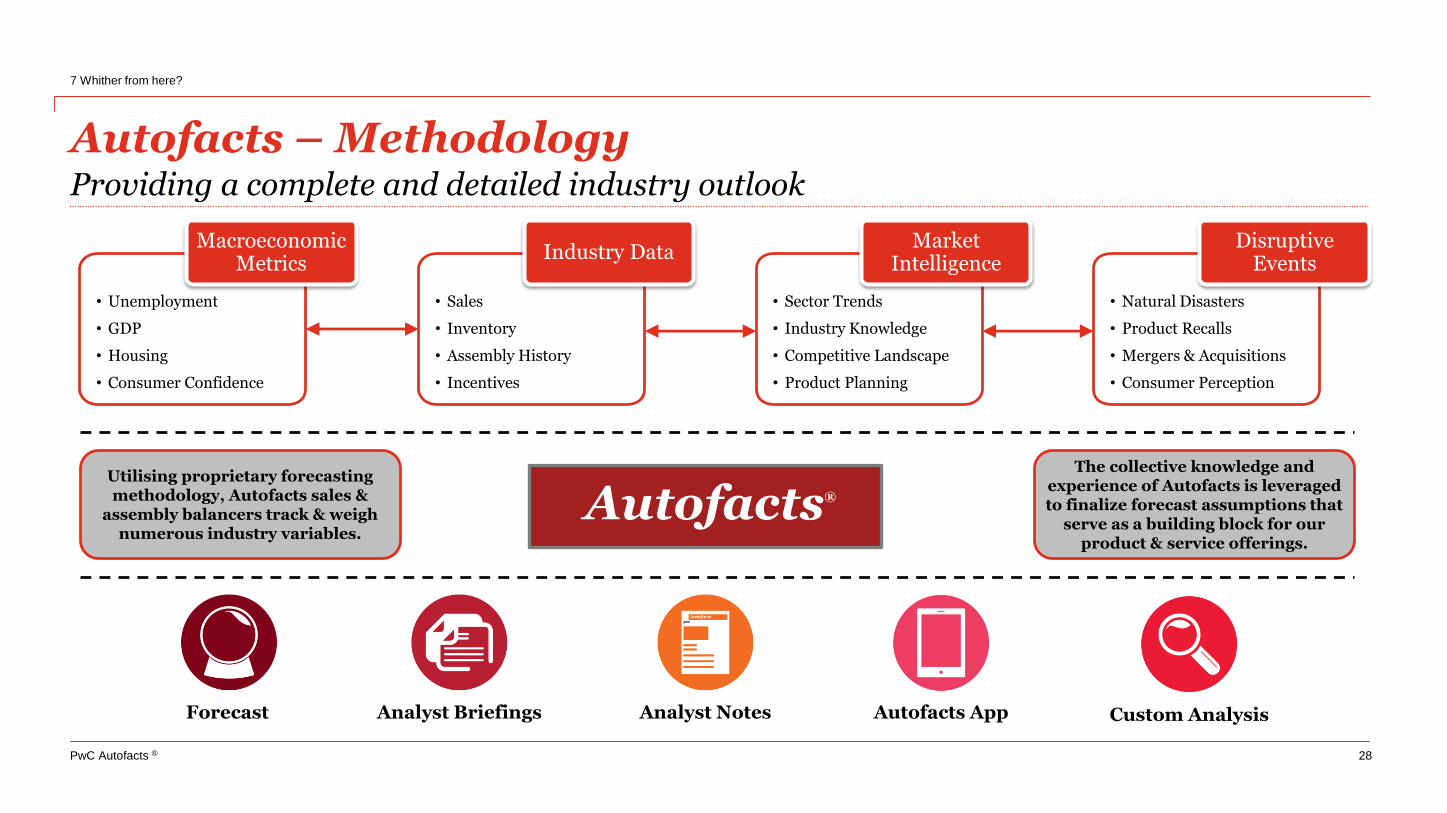
Autofacts – MethodologyProviding a complete and detailed industry outlook
7 Whither from here?
28
• Unemployment
• GDP
• Housing
• Consumer Confidence
Macroeconomic Metrics
• Sales
• Inventory
• Assembly History
• Incentives
Industry Data
• Sector Trends
• Industry Knowledge
• Competitive Landscape
• Product Planning
Market Intelligence
• Natural Disasters
• Product Recalls
• Mergers & Acquisitions
• Consumer Perception
Disruptive Events
Utilising proprietary forecasting methodology, Autofacts sales &
assembly balancers track & weigh numerous industry variables.
The collective knowledge and experience of Autofacts is leveraged to finalize forecast assumptions that
serve as a building block for our product & service offerings.
Autofacts®
Forecast Analyst Briefings Analyst Notes Autofacts App Custom Analysis

PwC Autofacts ®
Autofacts – Dedicated to the Automotive Industry
The information contained in this report represents the culmination of proprietary research conducted by Autofacts, an analytical group within the PwC Data Analytics Organisation. All material contained in this report was
developed independently of any PwC client relationship and does not represent the firm’s view as an auditor to any legal business entity. While every effort has been made to ensure the quality of information provided, no
representation or warranty of any kind (whether expressed or implied) is given by PwC as to the accuracy, completeness or fitness for any purpose of this document. As such, this document does not constitute the giving of
investment advice, nor a part of any advice on investment decisions. Accordingly, regardless of the form of action, whether in contract, tort or otherwise, and to the extent permitted by applicable law, PwC accepts no liability
of any kind and disclaims all responsibility for the consequences of any person acting or refraining from acting in reliance on this document.
©2015 PwC. All rights reserved. “PwC” refers to PricewaterhouseCoopers LLP (a Delaware limited liability partnership) or, as the context requires, other member firms of PricewaterhouseCoopers International Ltd., each of
which is a separate and independent legal entity.
Scan and download the free Autofacts app
8 Autofacts – Dedicated to the Automotive Industry
29