university transportation rfinal research center - region
TRANSCRIPT

University Transportation Research Center - Region 2
Final Report
Business Location Data Analysis and Editing
Interface Tool Development
Performing Organization: The City College of New York/CUNY
April 2021
Prepared for the New York State Department
of Transportation

DISCLAIMER
This report was funded in part through grant(s) from the Federal Highway Administration, United StatesDepartment of Transportation, under the State Planning and Research Program, Section 505 of Title 23,U.S. Code. The contents of this report do not necessarily reflect the official views or policy of the UnitedStates Department of Transportation, the Federal Highway Administration or the New York StateDepartment of Transportation. This report does not constitute a standard, specification, regulation,product endorsement, or an endorsement of manufacturers.
ACKNOWLEDGEMENTS
We would like to recognize and thank the New York State Department of Transportation for theirassistance and guidance, with Jim Davis and Mark Grainer, at the Statewide Policy and PerformanceBureau Policy and Planning Division, as playing a critical role for the successful completion of the project.We appreciate the support provided by Alex Muro and Eric Krans at the University at Albany Visualizationand Informatics Labs (AVAIL).
2

USDOT Form DOT F 1700.7 Technical Report Documentation Page
1. Report No. 2. Government Accession No. 3. Recipient's Catalog No.
4. Title and Subtitle
Business Location Data Analysis and Editing Interface Tool Development
5. Report Date
April, 2021
6. Performing OrganizationCode
7. Author(s): Camille Kamga, David Ng Wu, Sandeep Mudigonda 8. Performing OrganizationReport No. 55513-06-29
9. Performing Organization Name and Address: University Transportation ResearchCenter (UTRC), 160 Convent Avenue, NY, 10031
10. Work Unit No.
11. Contract or Grant No.C-19-02
12. Sponsoring Agency Name and Address: New York State Department ofTransportation, 50 Wolf Road, Albany, NY 12232
13. Type of Report and PeriodCovered
14. Sponsoring Agency Code
15. Supplementary Notes:
16. Abstract
One of the most important aspects of transportation planning is understanding employment information of businessesand organizations. Information such as location of employment, size of organization or business in terms of employees,sales, can provide valuable input to understanding travel patterns and human activities. Visualizing this informationalong with several administrative, transportation and infrastructure facilities provides key contextual information totransportation planning agencies. The objective of this project is to develop an open source software to visualizebusiness location and employment information in the state of New York. The application is also interfaced withtransportation road network, public transit network, various administrative boundaries such as MPOs, counties,municipalities so that the business data can be queried accordingly. Furthermore, the application also provides theability to edit and update the information per the understanding of experts in agencies statewide.
17. Key Words: Transportation Data Visualization,Location Data Analysis, Open Source Software.
18. Distribution Statement
19. Security Classif. (of this report) 20. Security Classif. (of this page) 21. No. ofPages
22. Price
3

Executive SummaryThis project aims to provide a web-based tool to transportation agencies to help understand and
analyze the economic activities and transportation movements across different scale and geographic
regions. This tool seeks to help transportation agencies by simplifying the process of locating businesses
of various types, comparing economic and employment metrics in different locations, which in turn,
helps the agencies in understanding transportation infrastructure needs and impacts without the need
of specialized GIS software. The tool also provides the agencies the ability to export the data for
presentation purposes.
The business location data used in this project is the InfoUSA Marketing, Inc. –(“InfoGroup”)
business records dataset which contains detailed information of business establishments. The business
establishment data and other open data for New York State are combined and housed within open
sourced development framework to allow NYSDOT and related transportation stakeholders to easily
analyze planning metrics such as number of businesses, business volumes, number of employees in
several different ways.
In the development of the tool, popular Javascript frameworks and libraries were chosen to work
on this project such as: NodeJS, LeafletJS (mapping), ExpressJS (server) and PostgreSQL (RDBMS) for
open sourced support and integration. The primary purpose of using open source environments is to
keep the application development process transparent and the tools to be available to other agencies in
the state.
Some of the visualization tools include features such as: layers-based query (zip code, county,
MPO, etc.), query using drawing tools and query around selected road sections. After each query, the
interface provides information such as infoGroup IDs, street addresses, sales volume, employee size,
NAICS and SICS classification codes, and other attributes, as well as, descriptive statistics (average,
summation, etc).
User authentication and access incorporates the different user levels to manage and edit
business information on the platform and to fix errors in the business establishments dataset. Changes
to the dataset are recorded with auditing capabilities for administrators with the required access.
A user manual is provided to get new users started. It serves as a tutorial and a listing of almost
all the features available in the web-application. It is advisable to refer to this manual if users are not
sure how to handle certain tools.
4

Table of Contents
Executive Summary 4
Table of Contents 5
1. Introduction and Problem Statement 6
2. Research Objectives 6
3. Methods 7
3.1 Software tools 7
3.2 Datasets Chosen 10
3.3 Visualization And Querying 13
3.4 Editing 18
3.5 User Authentication 21
4. Setting up 22
5. Conclusion 22
6. Appendix 23
6.1 API End-points 23
6.2 More Info 25
6.3 User Manual 26
5

1. Introduction and Problem StatementOne of the main tasks of transportation agencies is to study and analyze the economic activities
and transportation movements across different geographic regions. Depending on the scale of the
analysis, it is necessary to have information about the diverse categories of business establishments to
understand transportation infrastructure needs and the impacts of various transportation planning
initiatives such as transit-oriented development, roadway maintenance and understanding multimodal
user base, to name a few.
One of the sources of business location data that NYSDOT utilizes for business locations is from
InfoUSA Marketing, LLC (“InfoGroup”). This establishment location dataset contains granular information
of businesses such as, street address, sales volume, employee size, NAICS and SICS classification codes,
and other crucial attributes. The transportation agency planners and modelers need to contextualize
these data to be able to provide analyses on infrastructure needs, evaluate and propose policy
initiatives. A tool that can help extract, visualize and summarize the business establishment data from
the perspective of type of business, number of employees, sales volume, etc. would be very useful in this
regard. Furthermore, as the business establishment data comes from a diversity of sources, it is prone to
contain uncertainty, redundancy and error. Hence, additional functionality to edit erroneous or
inaccurate data can help improve data quality. This tool must also be able to integrate with existing
analytical tools available to NYSDOT for seamless access to users.
Therefore, the goal of this project is to provide the NYSDOT and relevant transportation
stakeholders with a web-based GIS application where users could utilize this dataset for different
operations:
● Data dissemination
● Query, analysis and visualization
● Data maintenance
● Data quality check
In the next section, the Research Objectives of this project are explained in detail. The third
section, Methods, details the choice of tools for this project. Fourth and fifth sections elaborate each of
the functionalities and design aspects of the tool.
2. Research ObjectivesAs mentioned earlier, key functionalities of the tool are to extract, visualize and summarize
business establishment data, ability to ensure data quality and integrate with an existing NYSDOT
open-sourced analytics framework.
To elaborate on each of the objectives for this project, we divide them into four different groups:
1. Visualization Capability: Ability to visualize businesses points on a map, display statistical analysis
and information and easily view key data fields
6

2. Querying:
a. Have predefined GIS layers to query, such as:
i. MPO’s, NYS Counties, DOT regions, Municipalities, etc…b. Querying by Street Names (OSM)
c. Graphically using Geometries
i. Euclidean Distance
ii. Manhattan Distance
d. Non-spatial data
i. Company Name
ii. Employee Size
iii. NAICS, SIC and Match Code
3. Editing: the original business location data collection was performed by people. As a result,
inaccuracy or duplication of data is inevitable. Therefore, there is a need to provide an interface
with:
a. Multi User Editing and Archiving: to be able to correct spotted errors in the dataset.
b. Continuous Versioning and Preserving Editing History: in case we want to refer to the
original or past data.
4. User Authentication: to allow data dissemination and management, it is necessary for users to
have an account to mitigate unauthorized access and also, to differentiate different user
privileges:
a. Normal users
b. Editors: allow for submission of changes to the dataset.
c. Administrator: review and approvals
3. MethodsIn order to achieve the stated objectives appropriate software tools and datasets have to be
chosen. This section explains various tools chosen to integrate data and visualization capabilities.
Furthermore, datasets that are relevant and useful for users of this tool in extracting and visualizing data
are also explained.
Integration of the existing analytics platform is also an important consideration in the
development process of the tool. This would help in seamless transition of existing users and
authorization schema. Thus, all of the tools developed for this application are open sourced. Choice of
open source software also helps in advancing development of the tool in future.
3.1 Software toolsFor the development of this project, popular open source software tools were chosen. As most
of them are widely used by developers, it is fully maintained by the community and also, it is also
convenient to receive support for future capabilities. Moreover, this tool will be able to integrate with
the existing analytical tools as it is also an open source program.
7

By using open source libraries, we could also easily modify some parts of the code to fit our
needs. For instance, when we modified the chosen pie chart library, d3pie.js, to produce a desired
outcome when we select different sections of the chart at the same time (discussed more in detail later.)
● Basic Javascript stack
○ Node.js v12.18.3 LTS. End-of-Life: 2022-04-30
○ ExpressJS v4.16.3
○ EJS templating language
○ PostgreSQL v12.0. End-of-Life: 2024-11-14
3.1.1 Front-end Libraries
Bootstrap v4.5.3 as the general theme of the application and JQuery v3.3.1 to control the
flow/actions. JQuery UI v1.12.1 for the autocomplete/dropdown functionality.
3.1.2 Mapping
LeafletJS v1.7.1 is used as the base library to display the map and the different OSM base layersproviders, along with the basic required tools in GIS applications. (i.e., zoom, select, pan, etc.)
There are couple of plugins added to LeafletJS that provides the functionality to draw figures andfacilitate displaying drawing information:
Plugin Name Description/Purpose Version
Marker Cluster Create clusters of markers to display businesses points. v1.4.1
Leaflet Measure Path Displays measurements of drawn objects. v1.5.0
Leaflet FeatureGroupSubGroup
Allows subgroups for the Marker Cluster plugin. Thishelps grouping correctly when the map is filtered byNAICS or Match code.
v1.0.2
Leaflet Editable Provides tools to draw objects on the map. v1.2.0
3.1.3 Table
All the tables in the application are made using the library: DataTables which is a plugin to
jQuery for tables.
DataTable extensions used:1. Buttons2. Responsive3. Select
3.1.4 Graphs
Pie chart made with a library called d3pie. It is a library built on d3.js to make pie charts easier tomake. The library did not provide functionality for multiple section selections. Therefore, it was slightlymodified to fit for that need.
8

Modifications to the d3pie library includes:1. Added “getOpenSegments()” function to get opened segments.2. Added “closeSegments()” function to close all the opened segments.3. “closeSegment()” method is made synchronous.4. “maybeCloseOpenSegment()” method is modified to allow multiple segment selections.
Histogram and Legend graphs are made using plain d3.js.
3.1.5 Other Front-end library used
Library Name Description/Purpose Version
Momentjs Date formatting for display purposes. v2.24
DOM to Image Main library to convert the DOM to images for the exportfunctionality.
v2.6.0
Html2canvas Secondary library to convert the DOM to images for the exportfunctionality in case the first option fails.
v1.0.0
jsPDF Library to build a PDF document for the export functionality. v1.5.3
jsPDF -AutoTable
Helper library to create tables for the export functionality. v3.5.6
FileSaver.js Solution to saving files on the client-side. v1.3.3
JSZip A library for creating, reading and editing .zip files with JavaScript. v3.1.5
FontAwesome Free solution to provide icons.
PopperJS Required library for bootstrap to display modals. v1.12.9
Turf Solution to process geoJSON geometries in the front end. v5.1.6
3.1.6 Back-end Libraries
Back-end server is set up using NodeJS v12.18.3 LTS with ExpressJS v4.16.3.
List of back-end libraries and middlewares
Library Name Description/Purpose Version
body-parser Middleware to parse JSON bodies. v1.18.2
compression Compress JSON files sent to the client. ^1.7.4
9
ejs Simple templating language to generate HTML markup withplain JavaScript.
^2.7.1
ExpressJS Server framework for Node.js ^4.16.3
express-session Solution to create a user session in express. ^1.17.0
node-env-file Library to facilitate adding an environmental file. ^0.1.8
node-fetch Request library used to make requests to Geocoding API such asNominatim, Mapquest, etc...
^2.6.1
passport Authentication middleware. ^0.4.0
passport-local Local strategy to authenticate users. ^1.0.0
pg Non-blocking PostgreSQL client for Node.js. ^7.12.1
pg-hstore Helper library to create Hstore data type objects. Used mainly inaudit tables.
^2.3.3
session-file-store Solution to store session data in the session file. ^1.3.1
uuid Creates RFC4122 UUIDs for the session ID. ^3.3.3
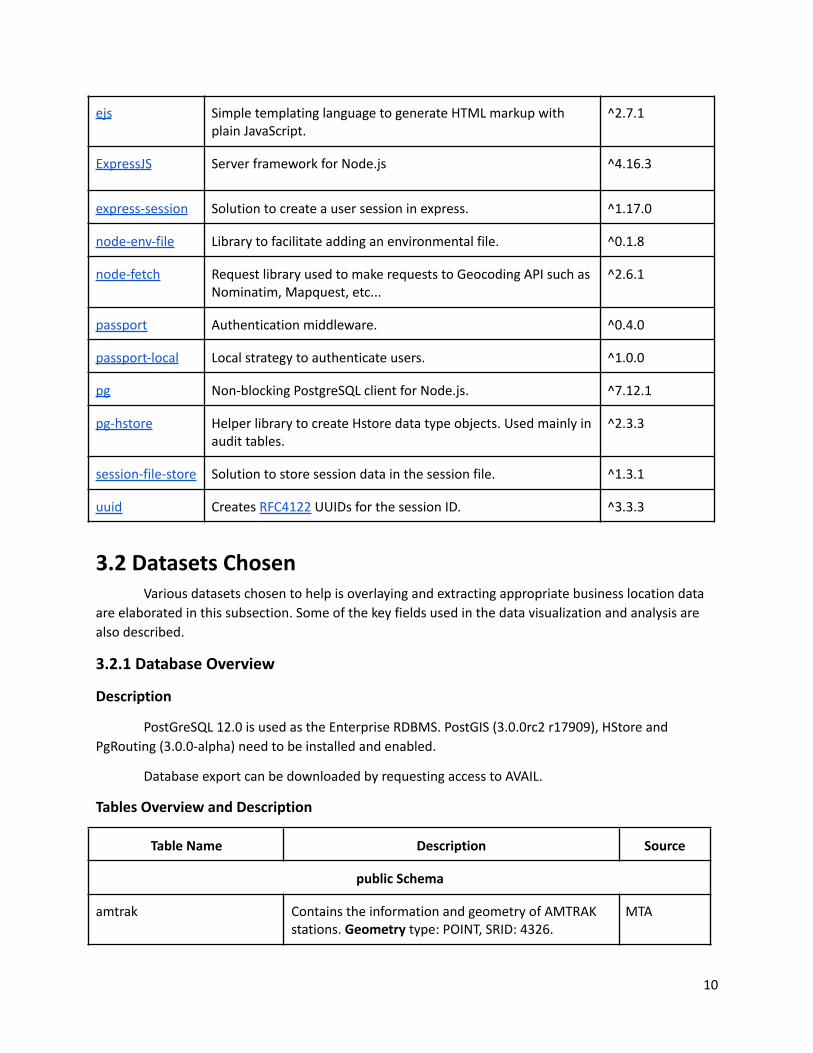
3.2 Datasets ChosenVarious datasets chosen to help is overlaying and extracting appropriate business location data
are elaborated in this subsection. Some of the key fields used in the data visualization and analysis are
also described.
3.2.1 Database Overview
Description
PostGreSQL 12.0 is used as the Enterprise RDBMS. PostGIS (3.0.0rc2 r17909), HStore and
PgRouting (3.0.0-alpha) need to be installed and enabled.
Database export can be downloaded by requesting access to AVAIL.
Tables Overview and Description
Table Name Description Source
public Schema
amtrak Contains the information and geometry of AMTRAKstations. Geometry type: POINT, SRID: 4326.
MTA
10

at_2po_4pgr Table containing routing information for NY state.Geometry type: LINESTRING, SRID: 26918.
OSM
business_edit Contains the status and information of editssubmitted by users of the application.
Generated
businesses Table containing all the information collected. It isconstructed by unifying the businesses locationdatabase for neighboring counties including Canadaand NY State. Geometry type: POINT, SRID: 26918.
Generated
businesses_o Copy of table “businesses” before any made changes.Geometry type: POINT, SRID: 26918.
Generated
businesses_2019 2019 dataset of businesses in NY state. Geometrytype: POINT, SRID: 26918.
InfoGroup
businesses_can 2019 dataset of businesses in Canada. Geometrytype: POINT, SRID: 4269.
InfoGroup
businesses_ct_ma_ny_pa_vt 2019 dataset of businesses neighbouring NY state.Geometry type: POINT, SRID: 4269.
InfoGroup
cities_towns Table containing the information and geometry ofcities and towns in NY state. Geometry type:MULTIPOLYGON, SRID: 26918.
Open Data
counties_neighbor Table containing the information and geometry ofcounties neighboring NY state including Canadadistricts. Geometry type: GEOMETRY, SRID: 26918.
Open Data
counties_shoreline Table containing the information and geometry ofcounties in NY state. Geometry type:MULTIPOLYGON, SRID: 26918.
Open Data
mpo Table containing the information and geometry ofMPO’s in NY state. Geometry type: MULTIPOLYGON,SRID: 26918.
Open Data
mta_li Contains the information and geometry of the LongIsland Railroad stations. Geometry type: POINT, SRID:4326.
MTA
mta_mn Contains the information and geometry of theMetro-North Railroad stations. Geometry type:POINT, SRID: 4326.
MTA
mta_nyc Contains the information and geometry of NYCsubway stations. Geometry type: POINT, SRID: 4326.
MTA
11

prmsic Contains information for the primary StandardIndustrial Classification (SIC) extracted from the“businesses” table.
InfoGroup
roadway Contains road information of NY state. Used by the“search nearby roads” query. Geometry type:MULTILINESTRING, SRID: 26918.
OSM
villages Table containing the information and geometry ofvillages in NY state. Geometry type: MULTIPOLYGON,SRID: 26918.
Open Data
zip Table containing the information and geometry of ZIPcodes in NY state. Geometry type: MULTIPOLYGON,SRID: 4269.
Open Data
audit Schema
business_audit_log Table contains the changes made to the table“business_edit”. It is filled by the trigger function:“log_business_edit()” on Insert and Update.
Generated
logged_actions Contains all the changes made to “businesses” table. Generated
Tables Key Fields
In this project, we are using a wide range of data provided by the businesses table. Some of the
columns mostly utilized/important in this application are the following:
● NAICS code: Standard used to classify business establishments for the analysis of statistical data
describing the U.S. economy.
This table provides all 6 digits NAICS code classification for each business point. However, due to
the extensive amount of categories, we process the displayed data into 2 or 4 digits NAICS code.
This allows us to search businesses type in certain areas with less granularity.
● Primary SIC code: Classification system that uses a four-digit code for classifying a company's
primary industry which is based upon the company’s highest revenue category.
● Match Level code: Indicates the accuracy of the business establishment location collected. They
are matched the following level accuracy:
○ X: matched based on the 5 digits zip code centroid.
○ 4: matched based on the 4 digits zip code centroid.
○ 2: matched based on the 2 digits zip code centroid.
○ P: matched using the Parcel centroid.
○ 0: Site level exact location.
12

● Employee Size: the dataset used provides two columns indicating the employee size of
establishments:
○ Location Employee Size
○ Corporate Employee Size
Both columns are categorized with letters from A to K or none according to their size:
○ A: 1 - 4
○ B: 5 - 9
○ C: 10 - 19
○ D: 20 - 49
○ E: 50 - 99
○ F: 100 - 249
○ G: 250 - 499
○ H: 500 - 999
○ I: 1,000 - 4,999
○ J: 5,000 - 9,999
○ K: 10,000+
3.3 Visualization And Querying
Diagram showing the general flow of how a visualization query is completed
The Leaflet library contains the ability to pan, zoom, select, identify geometry objects contained
in a leaflet map. To facilitate making queries by sight/drawing, Leaflet Editable plugin is added to Leaflet.
This library allows users to easily create drawing objects such as circles, rectangles and linestring to
query businesses around the desired section viewed on the map. Take in account that these drawings are
calculated using the Euclidean distance.
13

A Manhattan Distance functionality is added to the mapping interface in the form of driving
distance, where users create a marker in the desired area and a route is created according to the
specified driving distance. PgRouting is the solution used to implement this calculation, along with road
information provided by OSM.
Searching inside layers in NYS (eg: DOT regions, MPOs, counties, transit lines, etc…), a back-end
API is created to provide this information to the user interface. A request to the desired API is made in
the front-end and then, the returned JSON object is processed to create markers to the map for the
businesses with a specific color and size scheme. Depending on the query, another request is made later
to the server to add an overlay layer to illustrate the search area.
Search areas/layers are not limited to only NYS, as there is data of businesses in counties
neighboring NYS. This includes some of the districts located in lower Canada that were selected because
of its closeness to NYS.
The user interface also contains a data table, which provides detailed information in categories:
● PRIMARY_SIC_DESC
● MATCH_LEVEL_CODE
● NAICS_DESC
● HQ_BRANCH_DESC
and also in quantiles:
● ACTUAL_LOCATION_EMPLOYMENT_SIZE
● ACTUAL_CORPORATE_EMPLOYMENT_SIZE
● ACTUAL_LOCATION_SALES_VOLUME
● ACTUAL_CORPORATE_SALES_VOLUME
● SQUARE_FOOTAGE_CODE/+
● LATITUDE
● LONGITUDE
Previously mentioned information could be used to filter down the desired businesses by making
use of the advanced tab section of the user interface or making a request to the “bysearch” API
endpoint. Furthermore, it has the ability to search in the currently displayed overlay layer to facilitate the
filtering of businesses in search areas that users have created manually using the drawing functionality.
A Multi-search functionality is also incorporated into the mapping interface. This provides the
capability for users to create complex search areas by combining different location layers simultaneously
that could also be merged with user defined drawings objects. Furthermore, pre-defined layers provided
by the database (MPO, county, etc...) are allowed to be modified in this tab, granting users some degree
of freedom designing the query. Note that this custom query could also be filtered using the advanced
tab with the search in current selection feature.
Additionally, the user interface includes a statistics tab consisting of cards and bar charts that
displays descriptive statistics from the record selections. For example, cards containing the count, sum,
mean of company sales and, bar charts illustrating company and employee size distribution in the
selected area.
14

List of the different layers available to query in the application:
● Zip code
● County
● Metropolitan planning organization (MPO)
● NYSDOT Region
● Municipality (Town, City)
● Address (geocoding)
● Train/subway station
● InfoGroup ID
● Road name and signing
● Drawing (bounding box, circle buffer, linestring)
● Driving distance
Basic interface of the application
15
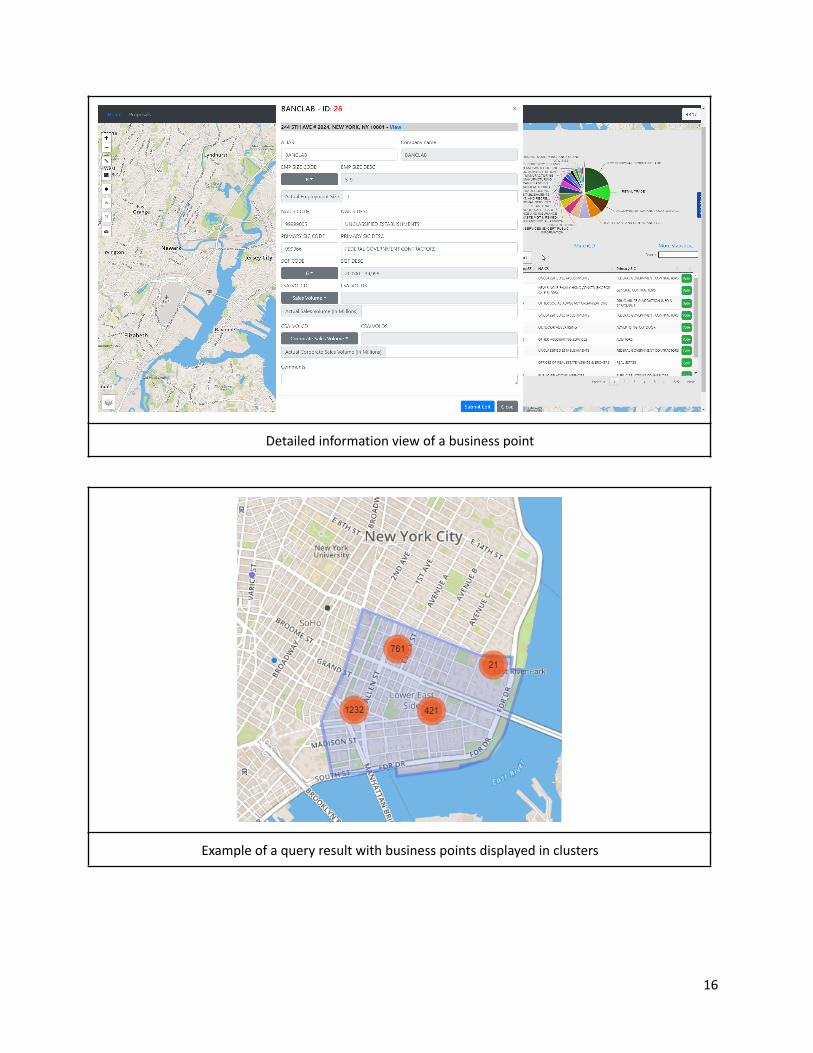
Detailed information view of a business point
Example of a query result with business points displayed in clusters
16
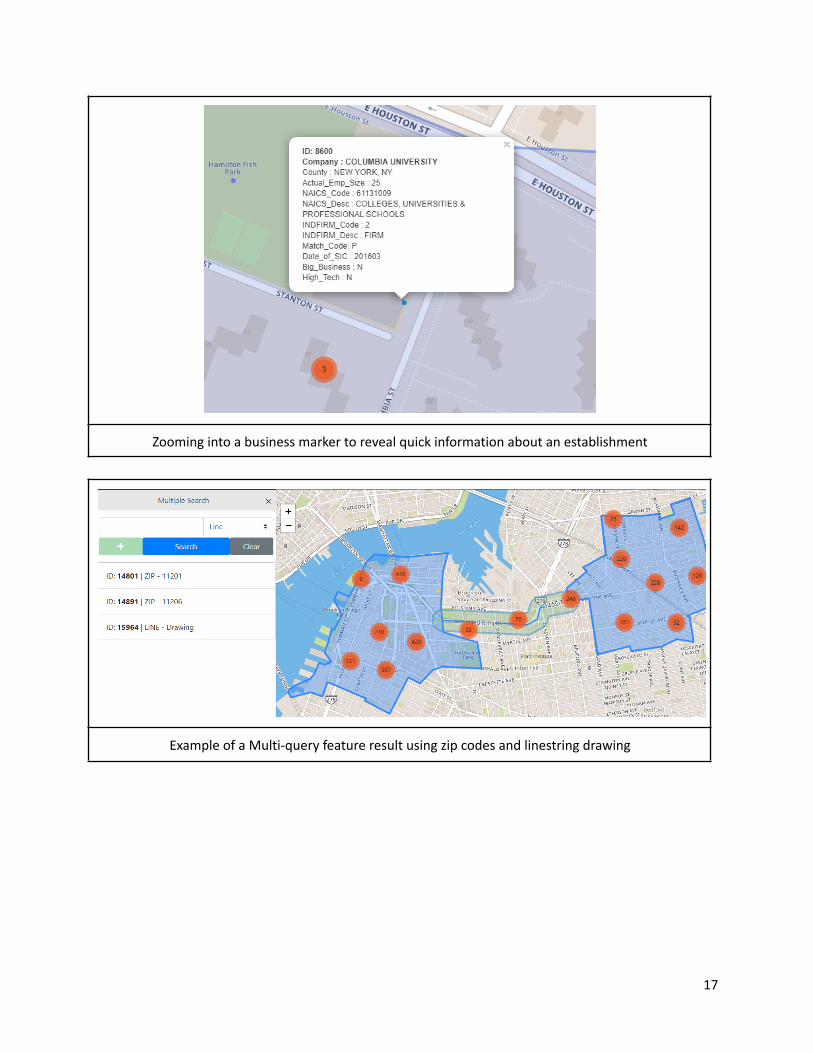
Zooming into a business marker to reveal quick information about an establishment
Example of a Multi-query feature result using zip codes and linestring drawing
17

Statistics tab
3.4 EditingThis project provides a web-based interface for editing and archiving any corrections identified
by the NYSDOT staff to the data.
There are two phases to this procedure:
1. Editing users submit a proposal for the information change.
2. Administrator users are to audit this submission before accepting the change.
Only administrators are allowed to approve changes and users with edit privileges to propose
changes. Accepted changes are to modify the “businesses” table directly and currently irreversible using
the web interface. If users wish to reverse a change, a resubmission with the desired information could
be made to nullify the change. These changes are tracked in the table “logged_actions” in the audit
schema. It logs information of both previous/original data and the changes made along with the
timestamp. This table could be potentially used as a migration table in case the “businesses” table is
reset or a new table is generated.
18

Diagram of users submitting an edit proposal
To keep track of proposals submitted by users and changes by administrators, the table
“business_edit” is provided. Records are tracked using two different fields:
1. Record status code:
○ 0 - PROPOSED
○ 1 - WITHDRAWN
○ 2 - REJECTED
○ 3 - REPLACED
○ 4 - ACCEPTED
2. Status code:
○ 0 - INACTIVE / RETIRED
○ 1 - ACTIVE
The field “record status” determines the current phase of the submitted record and the “status”
field determines if the record is published and if it is shown to users when it is queried. Notice that some
combinations are illegal. For example, a record cannot be “rejected” and “active” or “accepted” and
“inactive/retired” at the same time. Records that are accepted and later taken over by another proposal
are to be considered “replaced” instead of “accepted” and “inactive/retired”
19

Diagram of administrators confirming a business edit proposal.
Any changes made by the administrators, either single or batch, are made in databasetransactions and if an error were to occur in the process, failed transaction records are rolled back. Thisprovides a fail save record change allowing developers to debug the error in case it occurs.
The database also provides a table called “businesses_o” to users that want to access the
original data unchanged. This query is easily made in the web interface by changing the version
dropdown in the navigation bar. Also, could be made to the API endpoint (if session token is provided) by
using the “v” parameter available.
20

Interface for administrators to manage business edit proposals
3.5 User AuthenticationUsers authentication is managed by AVAIL group in Albany. Whenever a user logs in, the
application server makes a request to the AVAIL API endpoint with the provided credentials and awaits
for the response. If the user credentials are valid, Express-session and PassportJS will create a session
and provide a token to the user. Session contains the information of the user provided by AVAIL, which is
processed by a middleware in expressJS to determine the user authentication level.
Different users level code are the following:
● 0 - utrc_general: View users
● 3 - utrc_edit: Edit users with ability to submit changes for approval
● 5 - utrc_admin: Administrators with ability to submit changes and approve/reject proposals
● 10 - utrc_dev: Developers
User levels are assigned by AVAIL group administrators or “utrc_dev” when users are created in
AVAIL. To request an user account please visit: https://availauth.availabs.org/ and register for an
account. Users that are accepted will receive a confirmation email and a link to change the password. By
default, with the current status of the provided AVAIL endpoint, users are not assigned to any “utrc”
group, and a developer level user will be needed to manually assign the desired level to the new user.
Disclaimer: User privileges could be subject to be changed by AVAIL. This application has no
control over those changes. This also applies to user privilege codes, which are used to determine the
user level in the web interface and API endpoints.
21

4. Setting up1. Install PostgreSQL v12.0 or higher. Allow PostGIS and PgRouting to be installed.
2. Download a database dump of this project database.
3. Create the database from the SQL export file.
4. Clone the project repository in Github.
https://github.com/ng9891/infoGroup
5. Create a “.env” environmental file “postgres.env” at repository_name/utils.
6. “.env” file should contain the following:
a. POSTGRES_DB=database_name
POSTGRES_USER=database_user
POSTGRES_PASSWORD=database_password
POSTGRES_NETLOC=PostgreSQL_ip
POSTGRES_PORT=PostgreSQL_port
SECRET=secret_for_the_session
QUERY_DIST=1609
MAPQUEST_KEY=map_quest_api_key_for_reverse_geocoding
7. Run “npm i” in the console to install dependencies.
8. To start the server run: “npm start”.
9. The application should be running at port 3000.
5. ConclusionInformation on local and regional travel patterns is a key component for transportation planners
in their analyses. Studies such as analysis on infrastructure needs, evaluate and propose policy
initiatives, etc. require detailed information on travel demand patterns. Commuting, shopping and
recreation are all significant components of trips in everyday travel. Hence, transportation planners
require detailed information on location of points of interest (offices, businesses, etc.) and volume of
trips, more specifically, the destination of trips and number of trips.
Accurate location of business establishments, size of workforce and sales volume at each
location can provide valuable information for planners. An easy-to-use tool that can query information
from the business establishment data in various methods layering with several other useful data and
visualize key aspects can be very helpful for planners. In this project, we developed a novel software
application that helps query, visualize and also edit any missing or less accurate data of business
establishments. Furthermore, this application is web-based and does not require any software to be
installed locally by NYSDOT planning staff.
22

One of the sources of business location data that NYSDOT utilizes is obtained from InfoUSA
Marketing, LLC (“InfoGroup”). This establishment location dataset contains granular information of
businesses such as, street address, sales volume, employee size, NAICS and SICS classification codes, and
other crucial attributes. In order for planners to contextualize these data, the software tool has the
ability to layer the business establishment data with several other administrative and infrastructure data
such as county, municipality, MPO boundaries, transit lines & station and highways, etc. A tool that can
help extract, visualize and summarize the business establishment data from the perspective of type of
business, number of employees, sales volume, etc. would be very useful in this regard.
In addition, the tool provides several ways to query business location data such as manually
drawn circles (within a certain distance of a point of interest) or polygon of any shape, using
user-selected distance along roadways, and several combinations of these methods. These querying
features are also designed to mirror those available in a standard GIS tool so that the planners can easily
transfer their experience with standard GIS tools.
Furthermore, as the business establishment data comes from a diversity of sources, it is prone to
contain uncertainty, redundancy and error. Hence, additional functionality to edit erroneous or
inaccurate data can help improve data quality.
Lastly, this tool seamlessly integrates with existing analytical framework available to NYSDOT for
easy access to existing user base. The choice of software tools is made in using similar open source tools
used in the analytical framework. Also, this choice gives the flexibility to advance the features of the
tools and add new features.
6. Appendix
6.1 API End-pointsCurrently the application API service is not open to service as it does not provide a token for
users to make requests. Furthermore, users need to be authenticated to be able to access the API.
To make it easier to distinguish the endpoints, the API is divided into two groups:
1. “/by” requests: Queries the businesses points in the project database.
2. “/get” requests: Mainly provides information and geometry of metadata such as: county
names, zip codes, nearby roads from a point, etc…
/by requests
By InfoGroup ID /api/byinfoid/{infousa_id}
By NYSDOT Region /api/byregion/{dotRegion}
23

By Driving Distance /api/bydrivingdist
By Railroad /api/byrailroad
By Polyline String
Geometry
/api/bypolyline
By Geocode /api/bygeocode/{address}
By Search /api/search
By County /api/bycounty/{countyName}
By Radius /api/bydistance
By Business ID /api/byid/{businessID}
By MPO /api/bympo/{mpoName}
By Municipality /api/bymun/{municipalityName}
By Bounding Box /api/byrectangle
By Zip Code /api/byzip/{zipCode}
/get requests
Get Zip Code /api/getzip/{autocompleteZipCode}
Get NYSDOT Region /api/getregion/{regionName}
Get Driving Distance
Geometry
/api/getdrivingdist
Get Railroad /api/getrailroad
24

Get Nearby Roads /api/getnearbyroad
Get Business Name /api/getconame/{autocompleteBusinessName}
Get County /api/getcounty/{autocompleteCountyName}
Get Employment Size /api/getempsize
NAICS Code /api/getindustries/
Get MPO /api/getmpo/{autocompleteMPOName}
Get Municipality /api/getmun/{autocompleteMunicipalityName}
Get Road names /api/getroad
Get Sales Volume
categories
/api/getsalesvolume
Get Primary SIC Code /api/getsic
Get Location Size - Square
Foot Description
/api/getsqfoot
Get Reverse Geocode /api/get/geocode/reverse
6.2 More InfoFor more information about the endpoints, please refer to the documentation.
25

6.3 User Manual
Table of Content
User Manual 26
6.1 Basic Queries 27
6.2 Drawing Queries 40
6.3 Advanced Queries 48
6.4 Multi-Queries 52
6.5 Tips 60
26

6.1 Basic Queries
Different kinds of queries selection.
For optimal search, it is advised to use autocomplete results when performing a query.
27

Database version
Example Query result
28

Businesses spiderfied clusters.
Clicking on a business marker will reveal quick information about the establishment
29

6.1.1 Main Tab
Main tab title contains information about the current query.
6.1.2 Main Tab - Pie section
NAICS pie chart.
30
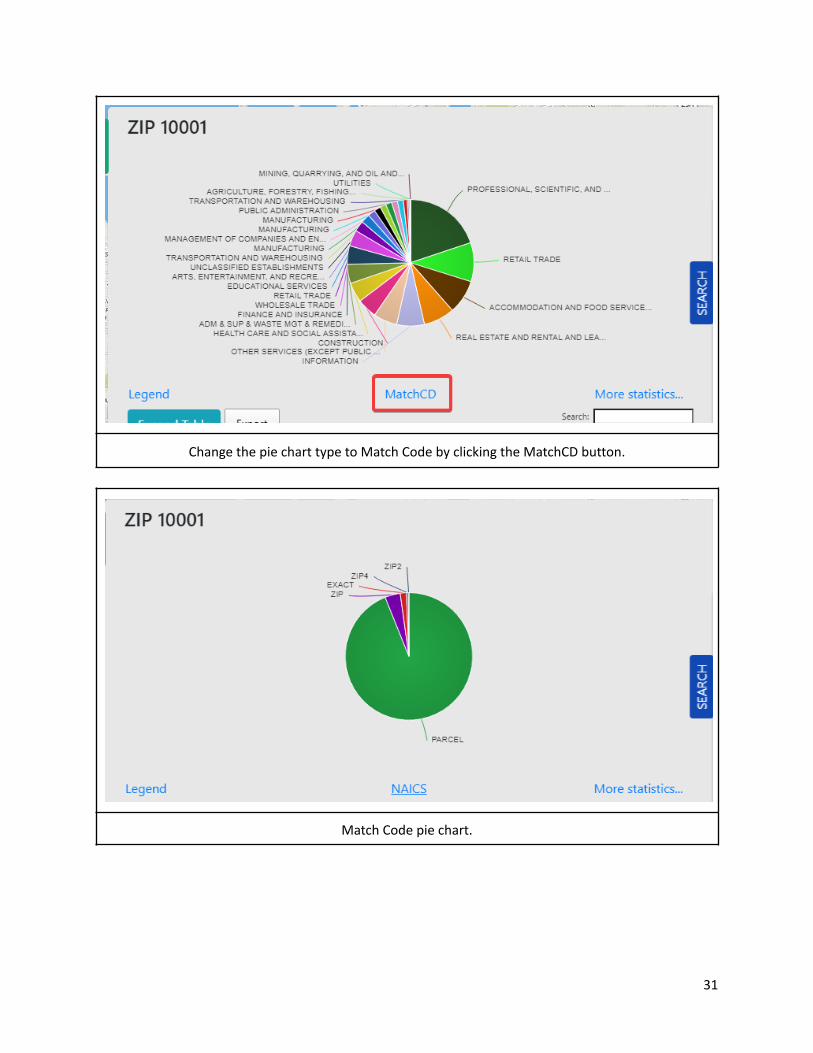
Change the pie chart type to Match Code by clicking the MatchCD button.
Match Code pie chart.
31

Clicking on a section will filter the datatable.
32

Legend tab can be opened by clicking the “Legend” button below the pie chart.
6.1.3 Statistic Tab
To open statistics tab
33

Statistics tab title contains information about the current query.
Brief summary cards of the queried region.
34
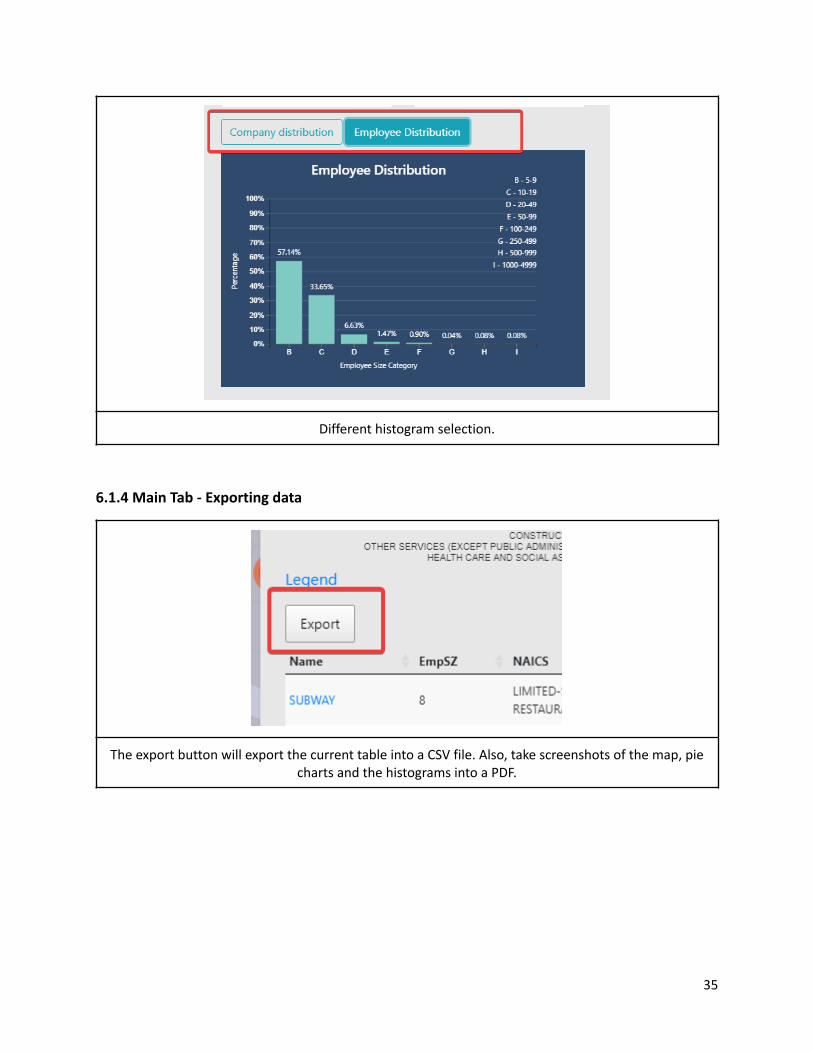
Different histogram selection.
6.1.4 Main Tab - Exporting data
The export button will export the current table into a CSV file. Also, take screenshots of the map, piecharts and the histograms into a PDF.
35

6.1.5 Main Tab - Table section
Table header listing company name, employee size, NAICS description and Primary SIC
Clicking the name of a business on the table will bring the user to the location on the map.
36

Clicking the edit/view button will reveal a new tab with more information
37

6.1.6 Location editing in the edit tab
Drag the red marker to the new location. (Original location represented in blue) and click accept.
38

After changing the latitude and longitude of a business point, if users wish to change the address
also, a button will appear to use the reverse geocode feature.
Reverse Geocode Button appears after changing the latitude and longitude.
A new dropdown will appear with the results of the reverse geocode using the current LAT and LON.
39

6.2 Drawing Queries
Located on the left are all the available drawing queries
Once a drawing is made, a Search button will appear to query the drawing
40

6.2.1 Road Query
A tool to select nearby roads by dropping a marker in a specific location on the map.
New Tool to query nearby roads
Clicking on the map opens a sidebar displaying all the nearby roads found in ~528 ft from the marker.
41

By selecting the desired road from the list, a new sidebar displaying more information about the roadwill open.
Once a road is selected, there are buttons to query businesses around the selected road:
1. Query on Displayed: allows to query around the road from the currently displayed road
section.
2. Query road ID on County: it will query the road ID bounded by the county specified in
the description.
3. Query road ID: it will query the entire road ID. Be aware when querying Interstate roads,
it will take a considerable amount of time to load.
42

Buttons to query businesses in ~0.5 miles from the road.
There are options to change the displayed road section when using the Query on Displayed
feature:
1. Reset Button: resets the displayed road to the originally displayed section.
2. Entire Road: queries the server to load the entire road section.
3. Prune: allows users to draw a rectangle to specify the desired road length of the road
section.
43

Options to change the displayed road sections.
Clicking the Prune button allows users to draw arectangle to shorten the displayed road section.
Once a desired length is drawn, confirm byclicking the Confirm button.
44

Shortened road using Prune. Result from Query on Displayed.
6.2.2 Road Drawing
This feature to query a specific section of a road or a specific route. Default buffer size is 0.5
miles.
Line drawing tool. Drawn specific route on the map.
45

To finish a line drawing, just click the last point of the line once again. Also, keep in mind that a
drawn line can be extended and also partitioned from the middle.
Drawn line partitioned from the middle.
46
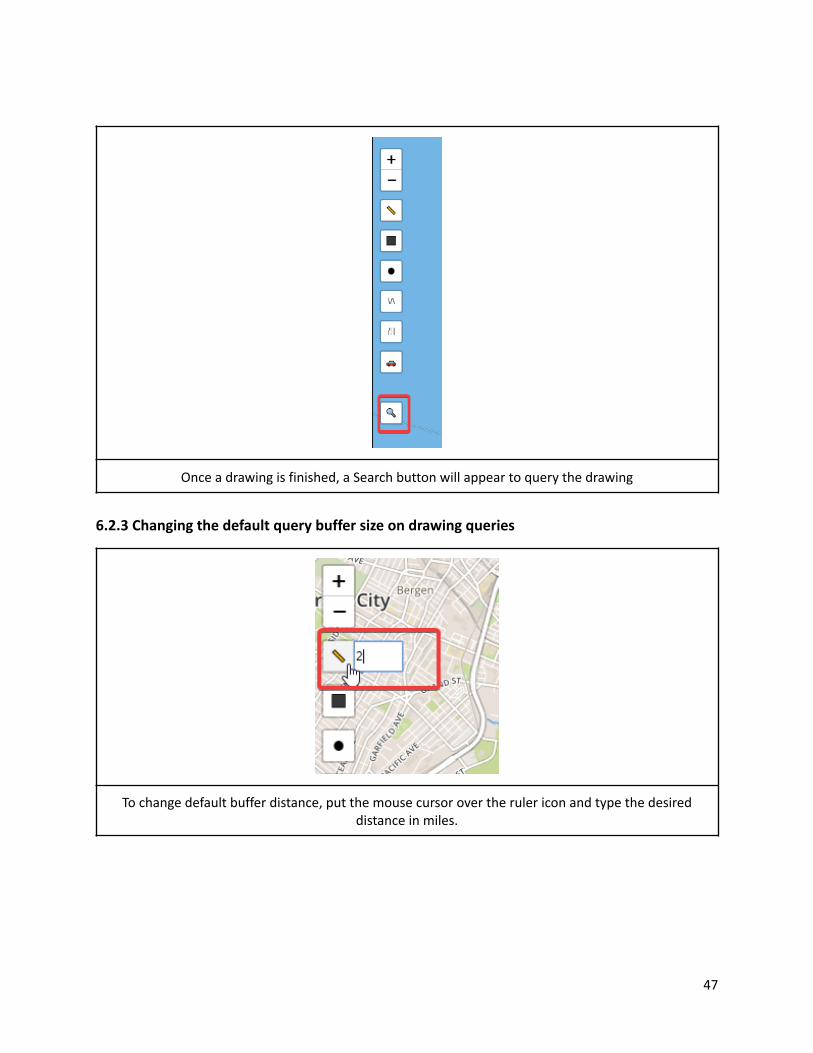
Once a drawing is finished, a Search button will appear to query the drawing
6.2.3 Changing the default query buffer size on drawing queries
To change default buffer distance, put the mouse cursor over the ruler icon and type the desireddistance in miles.
47

Road query results with a default buffer size of0.5 miles
Road query results with a buffer size of 2 miles.
6.3 Advanced Queries
Advanced query tab located at the right side of the main tab.
48
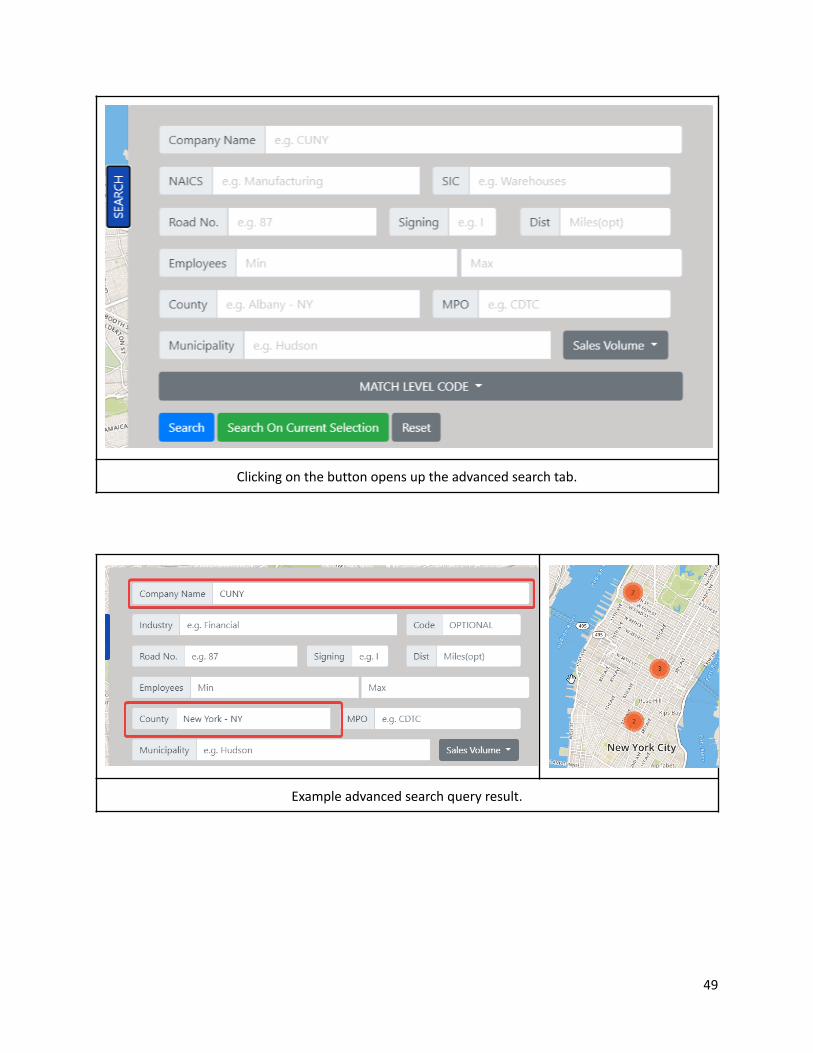
Clicking on the button opens up the advanced search tab.
Example advanced search query result.
49

Road query is also available in advanced query.
6.3.1 Search on current selected layer
It is also possible to make further queries after a basic query has been made. Using the “Search
on current layer button”, it will use the displayed Overlay Layer to query desired businesses.
Basic Query result. Zip 11204
50

Search businesses on the current layer using NAICS code 72. (Accomodation and food)
Result from the search on Current Selection query.
51

6.3.2 Reset fields
Reset the advanced query fields by clicking the reset button.
6.4 Multi-Queries
The Multi-queries feature allows users to create different Overlay layers to query businesses
from. Users will have the ability to combine different base layers such as: Zip code layer, counties, road
sections and user drawings together.
52

Clicking the “+” button on the navigation bar will bring out the multiple search section.
Example of a Multi-Search.
The search section of the Multi-search is similar to the basic query but with more options to adddifferent layers.
53

Multi-search dropdown menu.
Similar to basic query, it has an autocompletefeature.
Once an option is selected, by pressing the “+”button, it will add the layer to the list.
54
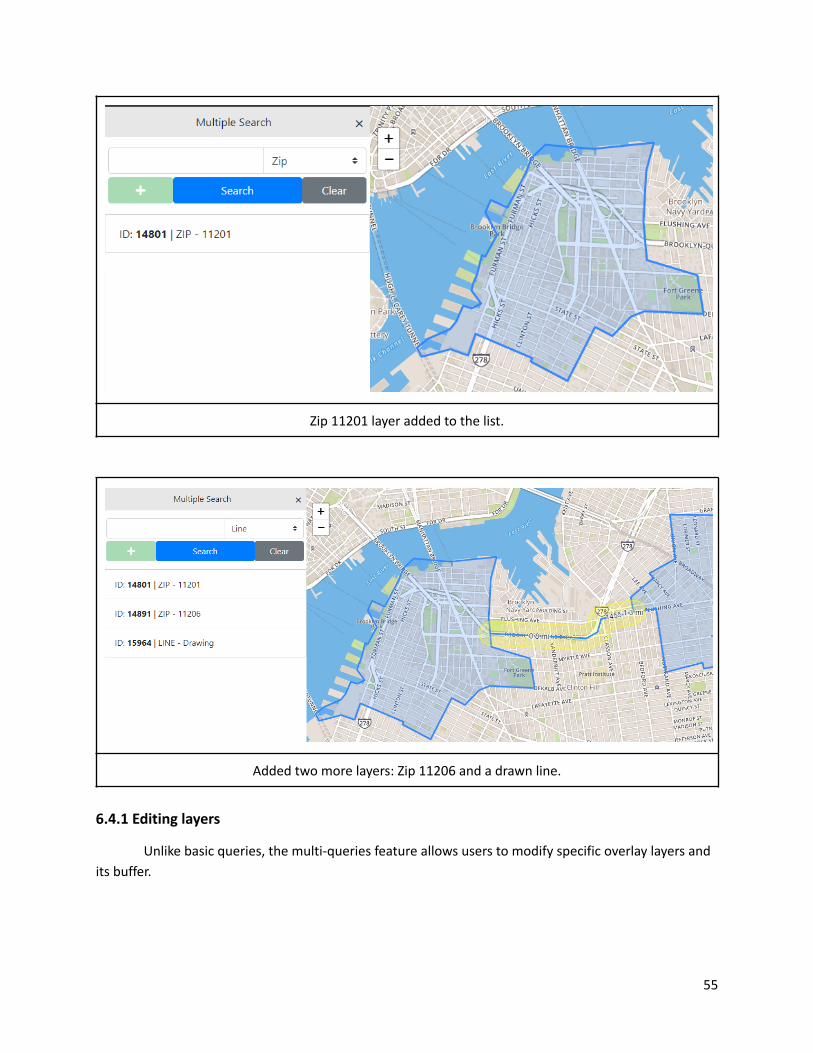
Zip 11201 layer added to the list.
Added two more layers: Zip 11206 and a drawn line.
6.4.1 Editing layers
Unlike basic queries, the multi-queries feature allows users to modify specific overlay layers and
its buffer.
55
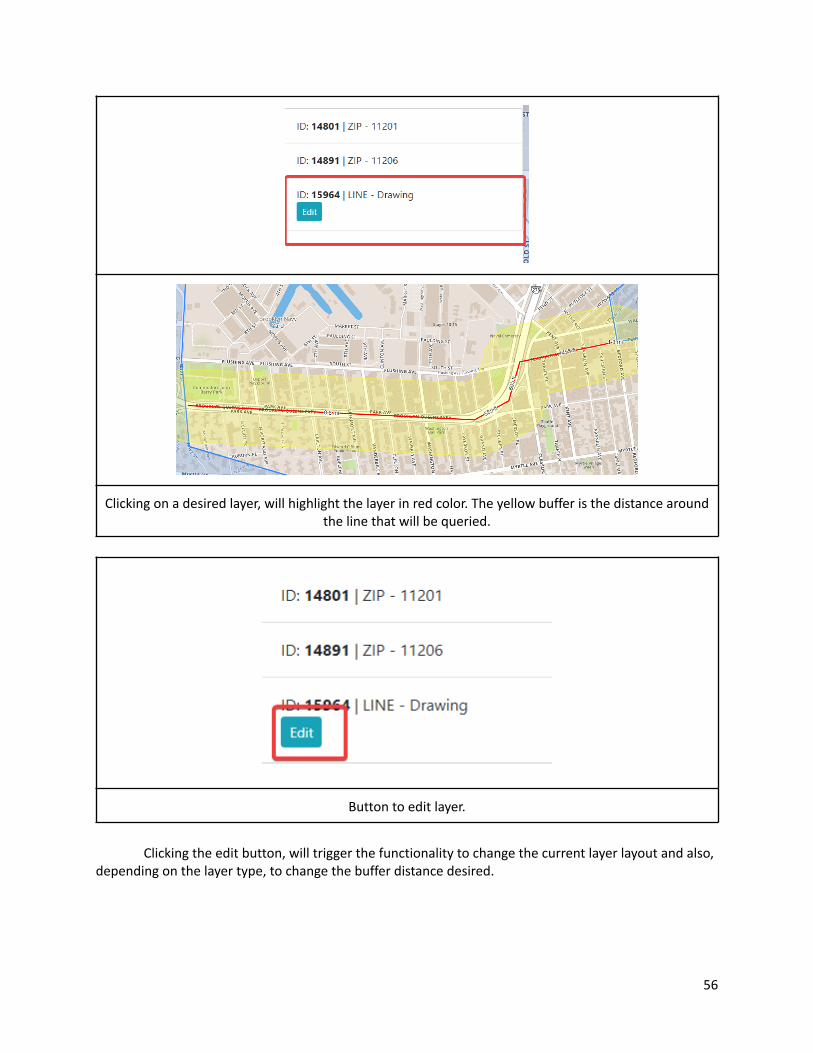
Clicking on a desired layer, will highlight the layer in red color. The yellow buffer is the distance aroundthe line that will be queried.
Button to edit layer.
Clicking the edit button, will trigger the functionality to change the current layer layout and also,depending on the layer type, to change the buffer distance desired.
56

A new input box to change the buffer around thedrawn line.
Highlighted layer. Allowing users to change theshape of the overlay layer.
Buffers are represented around a line with a yellow background.
6.4.2 Search
Once all the desired layers are in the multi-query list, press the Search button to find businesses
inside or around the overlay layer.
57

Search button.
Multi-query result.
If users wish to filter their search on their multi-search overlay, the Advanced queries tab allows
that option with the Search On Current Selection feature.
58

Result from the multi-search filtered with MANUFACTURING only businesses.
6.4.3 Clear layers
To clear undesired added layers, there is an icon in the form of a trash bin that users have access
to when the mouse pointer is hovered on the layer name. There is also a clean button in the search bar
to clear up every layer.
59

Location for the Clear button and the trash bin icon.
6.5 Tips
This section will mention a couple of things to keep in mind while using the application:
In the lower left section of the application, there is a menu to change to different map types and
also, to turn off the different layers displayed on the map.
Menu on the lower left corner.
While using the basic search or multi-search autocomplete, you are able to use the down/up
arrow on your keyboard to preview the layers before selecting it.
60

Preview of Zip code 11203 before selecting it using the down arrow on the keyboard.
The main tab can be closed to have a better look at the map.
Main tab button to close the main tab.
61

The Expand table button is useful if you wish to hide the pie chart.
Hiding the pie chart and expanding the table.
62