university transportation research center - region … transportation research center - region 2 the...
TRANSCRIPT
Final
January 2012
University Transportation Research Center - Region 2
ReportPerforming Organization: Rensselaer Polytechnic Institute
Freight Demand Estimation from Secondary Sources
Sponsor: Research and Innovative Technology Administration / USDOT

University Transportation Research Center - Region 2
The Region 2 University Transportation Research Center (UTRC) is one of ten original University Transportation Centers established in 1987 by the U.S. Congress. These Centers were established with the recognition that transportation plays a key role in the nation's economy and the quality of life of its citizens. University faculty members provide a critical link in resolving our national and regional transportation problems while training the professionals who address our transpor-tation systems and their customers on a daily basis.
The UTRC was established in order to support research, education and the transfer of technology in the ield of transportation. The theme of the Center is "Planning and Managing Regional Transportation Systems in a Changing World." Presently, under the direction of Dr. Camille Kamga, the UTRC represents USDOT Region II, including New York, New Jersey, Puerto Rico and the U.S. Virgin Islands. Functioning as a consortium of twelve major Universities throughout the region, UTRC is located at the CUNY Institute for Transportation Systems at The City College of New York, the lead institution of the consortium. The Center, through its consortium, an Agency-Industry Council and its Director and Staff, supports research, education, and technology transfer under its theme. UTRC’s three main goals are:
Research
The research program objectives are (1) to develop a theme based transportation research program that is responsive to the needs of regional transportation organizations and stakehold-ers, and (2) to conduct that program in cooperation with the partners. The program includes both studies that are identi ied with research partners of projects targeted to the theme, and targeted, short-term projects. The program develops competitive proposals, which are evaluated to insure the mostresponsive UTRC team conducts the work. The research program is responsive to the UTRC theme: “Planning and Managing Regional Transportation Systems in a Changing World.” The complex transportation system of transit and infrastructure, and the rapidly changing environ-ment impacts the nation’s largest city and metropolitan area. The New York/New Jersey Metropolitan has over 19 million people, 600,000 businesses and 9 million workers. The Region’s intermodal and multimodal systems must serve all customers and stakeholders within the region and globally.Under the current grant, the new research projects and the ongoing research projects concentrate the program efforts on the categories of Transportation Systems Performance and Information Infrastructure to provide needed services to the New Jersey Department of Transpor-tation, New York City Department of Transportation, New York Metropolitan Transportation Council , New York State Department of Transportation, and the New York State Energy and Research Development Authorityand others, all while enhancing the center’s theme.
Education and Workforce Development
The modern professional must combine the technical skills of engineering and planning with knowledge of economics, environmental science, management, inance, and law as well as negotiation skills, psychology and sociology. And, she/he must be computer literate, wired to the web, and knowledgeable about advances in information technology. UTRC’s education and training efforts provide a multidisciplinary program of course work and experiential learning to train students and provide advanced training or retraining of practitioners to plan and manage regional transportation systems. UTRC must meet the need to educate the undergraduate and graduate student with a foundation of transportation fundamentals that allows for solving complex problems in a world much more dynamic than even a decade ago. Simultaneously, the demand for continuing education is growing – either because of professional license requirements or because the workplace demands it – and provides the opportunity to combine State of Practice education with tailored ways of delivering content.
Technology Transfer
UTRC’s Technology Transfer Program goes beyond what might be considered “traditional” technology transfer activities. Its main objectives are (1) to increase the awareness and level of information concerning transportation issues facing Region 2; (2) to improve the knowledge base and approach to problem solving of the region’s transportation workforce, from those operating the systems to those at the most senior level of managing the system; and by doing so, to improve the overall professional capability of the transportation workforce; (3) to stimulate discussion and debate concerning the integration of new technologies into our culture, our work and our transportation systems; (4) to provide the more traditional but extremely important job of disseminating research and project reports, studies, analysis and use of tools to the education, research and practicing community both nationally and internationally; and (5) to provide unbiased information and testimony to decision-makers concerning regional transportation issues consistent with the UTRC theme.
Project No: 49111- 18-20
Project Date: January 12, 2012
Project Title: Freight Demand Estimation from Secondary Sources
Principal Investigators: José Holguín-Veras, Ivan Sánchez-Díaz, Carlos A. González-Calderón, Matthew Brom
Performing Organization: Rensselaer Polytechnic Institute
Sponsors: Research and Innovative Technology Administration / USDOT
Disclaimer
The contents of this report re lect the views of the authors, who are responsible for the facts and the accuracy of the information presented herein. The contents do not neces-sarily re lect the of icial views or policies of the UTRC or the Federal Highway Administration. This report does not constitute a standard, speci ication or regulation. This document is disseminated under the sponsorship of the Department of Transportation, University Transportation Centers Program, in the interest of information exchange. The U.S. Government assumes no liability for the contentsor use thereof.
To request a hard copy of our inal reports, please send us an email at [email protected]
Mailing Address:
University Transportation Reserch CenterThe City College of New YorkMarshak Hall, Suite 910160 Convent AvenueNew York, NY 10031Tel: 212-650-8051Fax: 212-650-8374Web: www.utrc2.org

Board of Directors
The UTRC Board of Directors consists of one or two members from each Consortium school (each school receives two votes regardless of the number of representatives on the board). The Center Director is an ex-of icio member of the Board and The Center management team serves as staff to the Board.
City University of New York Dr. Hongmian Gong - Geography Dr. Claire McKnight - Civil Engineering Dr. Neville A. Parker - Civil Engineering
Clarkson University Dr. Kerop D. Janoyan - Civil Engineering
Columbia University Dr. Raimondo Betti - Civil Engineering Dr. Elliott Sclar - Urban and Regional Planning
Cornell University Dr. Huaizhu (Oliver) Gao - Civil Engineering Dr. Mark A. Turnquist - Civil Engineering
Hofstra University Dr. Dilruba Ozmen-Ertekin - Civil Engineering Dr. Jean-Paul Rodrigue - Global Studies and Geography
New Jersey Institute of Technology Dr. Priscilla P. Nelson - Geotechnical Engineering Dr. Lazar Spasovic - Civil Engineering
New York University Dr. Mitchell L. Moss - Urban Policy and Planning Dr. Rae Zimmerman - Planning and Public Administration
Polytechnic Institute of NYU Dr. John C. Falcocchio - Civil Engineering Dr. Elena Prassas - Civil Engineering
Rensselaer Polytechnic Institute Dr. José Holguín-Veras - Civil Engineering Dr. William "Al" Wallace - Systems Engineering
Rochester Institute of Technology Dr. James Winebrake
Rowan University Dr. Yusuf Mehta - Civil Engineering Dr. Beena Sukumaran - Civil Engineering
Rutgers University Dr. Robert Noland - Planning and Public Policy Dr. Kaan Ozbay - Civil Engineering
State University of New York Michael M. Fancher - Nanoscience Dr. Catherine T. Lawson - City & Regional Planning Dr. Adel W. Sadek - Transportation Systems Engineering Dr. Shmuel Yahalom - Economics
Stevens Institute of Technology Dr. Sophia Hassiotis - Civil Engineering Dr. Thomas H. Wakeman III - Civil Engineering
Syracuse University Dr. Riyad S. Aboutaha - Civil Engineering Dr. O. Sam Salem - Construction Engineering and Management
The College of New Jersey Dr. Michael Shenoda - Civil Engineering
University of Puerto Rico - Mayagüez Dr. Ismael Pagán-Trinidad - Civil Engineering Dr. Didier M. Valdés-Díaz - Civil Engineering
UTRC Consortium Universities
The following universities/colleges are members of the UTRC consor-tium.
City University of New York (CUNY)Clarkson University (Clarkson)Columbia University (Columbia)Cornell University (Cornell)Hofstra University (Hofstra)New Jersey Institute of Technology (NJIT)New York University (NYU)Polytechnic Institute of NYU (Poly)Rensselaer Polytechnic Institute (RPI)Rochester Institute of Technology (RIT)Rowan University (Rowan)Rutgers University (Rutgers)State University of New York (SUNY)Stevens Institute of Technology (Stevens)Syracuse University (SU)The College of New Jersey (TCNJ)University of Puerto Rico - Mayagüez (UPRM)
UTRC Key Staff
Dr. Camille Kamga: Director, Assistant Professor of Civil Engineering
Dr. Robert E. Paaswell: Director Emeritus of UTRC and Distinguished Professor of Civil Engineering, The City College of New York
Dr. Claire McKnight: Assistant Director for Education and Training; Associate Professor of Civil Engineering, City College of New York
Herbert Levinson: UTRC Icon Mentor, Transportation Consultant and Professor Emeritus of Transportation
Dr. Ellen Thorson: Senior Research Fellow, University Transportation Research Center
Penny Eickemeyer: Associate Director for Research, UTRC
Dr. Alison Conway: Associate Director for New Initiatives and Assistant Professor of Civil Engineering
Nadia Aslam: Assistant Director for Technology Transfer
Dr. Anil Yazici: Post-doc/ Senior Researcher
Nathalie Martinez: Research Associate
Sundari Prasad: Graphic Intern
Membership as of January 2012
Final Report
Prepared by:
University Transportation Research Center
Freight Demand Estimation from Secondary Sources
José Holguín-Veras, Ph.D., P.E.
Co-Authors:Ivan Sánchez-Díaz
Carlos A. González-Calderón, M.SMatthew Brom, M.S
Rensselaer Polytechnic InstituteDepartment of Civil and Environmental Engineering
January 12, 2012
Center for Infrastructure, Transportation and the EnvironmentDepartment of Civil and Environmental EngineeringRensselaer Polytechnic Institute110 8th Street, Room JEC 4030Troy, NY 12180-3590
TECHNICAL REPORT STANDARD TITLE PAGE1. Report No. 2.Government Accession No. 3. Recipient’s Catalog No.
4. Title and Subtitle 5. Report Date
Freight Demand Estimation From Secondary SourcesJanuary 12, 20126. Performing Organization Code
7. Author(s) 8. Performing Organization Report No.José Holguín-Veras, Ivan Sánchez-Díaz, Carlos A. González-Calderón, Matthew Brom
9. Performing Organization Name and Address 10. Work Unit No.Rensselaer Polytechnic InstituteDepartment of Civil and Environmental Engineering110 8th Street, Room JEC 4030Troy, NY 12180-3590
11. Contract or Grant No.
49111-18-20
12. Sponsoring Agency Name and Address 13. Type of Report and Period Covered
14. Sponsoring Agency Code
15. Supplementary Notes
16. AbstractThis report explains how to estimate freight demand using secondary source of data such as traffic counts. Freight origin-destination (OD) matrices are one of the most important data elements a planner could have, which is why a significant amount of effort, time and money is spent on their estimation. The estimation of OD matrices can be done by: (a) direct sampling methods; and, (b) using secondary data sources such as traffic counts. The latter techniques are referred to here as origin-destination synthesis (ODS).
OD data are obtained by interviewing the participants in the transportation activity and have some well-known limitations: roadside interviews tend to double count trips; on-board interviews may lead to bias in the parameters of random utility models; mail interviews are often biased because the rate of response varies across the population; and home interviews, though able to provide statistically sound estimates of OD, require a great deal of planning, time, effort and money (Ortúzar and Willumsen, 2001).
The proposed ODS procedure permits the estimation of freight OD matrices using secondary sources in Manhattan. The secondary data sources consist of truck traffic counts from 97 intersections in Midtown Manhattan provided by the NYSDOT. The framework developed here will enable NYSDOT, NYMTC and other transportation management agencies to estimate freight OD matrices from traffic counts at a muchreduced cost and with relative good accuracy. The framework will also make it possible to seamlessly integrate freight planning into agencies’ transportation system planning. In ODS, the traffic counts—which are a function of the OD flows—are used to estimate the OD matrices. Since the number of unknowns (OD pairs) exceeds the number of independent traffic counts, the estimation problem is under-specified. This requires the use of analytical techniques to estimate the most likely OD matrix that fits the observed traffic counts. The research on ODS has concluded that, though not a replacement for actual data, it could produce fairly realistic estimates of freight OD matrices. This, in turn, could play a significant role in boosting demand modeling efforts as collecting freight data is extremely time consuming and expensive.
The results of the proposed ODS model could be improved by implementing a multi-path algorithm to assign traffic. The implementation of a multi-path algorithm increases the consistency between observed traffic counts and estimated traffic flows.The lack of data (relatively few traffic counts, spread throughout the traffic network) severely constrains the ability to obtain accurate results. The
research team suggests gathering more traffic counts in Downtown and Uptown Manhattan to obtain more accurate O-D flows estimations. In
essence, using data that cover a broader geographic area enables a better representation of different travel characteristics and patterns in the city.
Freight industry sectors vary from zone to zone, which affects the distribution of freight trips. In fact, data from only one sector of Midtown
Manhattan cannot be used to explain goods movements across the whole city.
17. Key Words 18. Distribution Statement
Origin-destination, origin-destination synthesis, matrices, freight de-mand, freight data
19. Security Classif. (of this report) 20. Security Classif. (of this page) 21. No of Pages 22. Price
Unclassified Unclassified 22Form DOT F 1700.7 (8-69)
University Transportation Research Center, Region 2 - CCNY138th Street, Convent Avenue, Marshak Hall, Suite 910New York, NY 10031

1
FREIGHT DEMAND ESTIMATION FROM SECONDARY SOURCES
Final Report to the University Transportation Research Center
Rensselaer Polytechnic Institute
01/12/2012
Authors:
José Holguín-Veras, Ph.D., P.E. William H. Hart Professor. Director of the Center for Infrastructure, Transportation and the
Environment. Department of Civil and Environmental Engineering, Rensselaer Polytechnic Institute. 110 8th Street, Room JEC 4030, Troy, NY 12180-3590
Phone: 518-276-6221 Fax: 518-276-4833 Email: [email protected]
Ivan Sánchez-Díaz Graduate Research Assistant Center for Infrastructure, Transportation and the Environment Rensselaer Polytechnic Institute. 110 8th Street, Room JEC 4037, Troy, NY 12180, USA
Email:
Carlos A. González-Calderón, M.S.
Graduate Research Assistant Center for Infrastructure, Transportation and the Environment Rensselaer Polytechnic Institute. 110 8th Street, Room JEC 4037, Troy, NY 12180, USA
Email:
Matthew Brom, M.S.
Graduate Research Assistant Center for Infrastructure, Transportation and the Environment Rensselaer Polytechnic Institute. 110 8th Street, Room JEC 4033, Troy, NY 12180, USA.
Email: [email protected]
2
ACKNOWLEDGMENT OF SPONSORSHIP This work was sponsored by the University Transportation Research Center.
DISCLAIMER
This is a draft as submitted by the research team. The opinions and conclusions expressed or implied in the material are those of the research agency. They are not necessarily those of the University Transportation Research Center, or the program sponsors.

3
TABLE OF CONTENTS
I. INTRODUCTION ....................................................................................... 5
II. ORIGIN-DESTINATION SYNTHESIS .................................................... 5
III. ORIGIN-DESTINATION SYNTHESIS IN MANHATTAN .................. 6
3.1 Manhattan Zoning System and Network ................................................... 6
3.2 Manhattan Trip Generation ..................................................................... 10
3.3 Methodology ............................................................................................... 15
3.4 Results ......................................................................................................... 16
IV. CONCLUSIONS ........................................................................................ 19
V. REFERENCES ........................................................................................... 20
VI. APPENDIX ................................................................................................. 21

4
LIST OF FIGURES
Figure 1: Manhattan Route Network for ODS ........................................................................... 7
Figure 2: Manhattan Traffic-Counts Location ........................................................................... 9
Figure 3: Trip Generation at the Establishment Level ............................................................. 12
Figure 4: Plot of the Parameter Optimization .......................................................................... 17
LIST OF TABLES
Table 1: Flow Expansion Factor for Midtown Manhattan ......................................................... 8
Table 2: Flow Expansion Factor using data from Bridge Tolls ................................................. 8
Table 3: Daily Trip Generation by SIC .................................................................................... 11
Table 4: Bridges/Tunnels Connecting Manhattan to External Zones ...................................... 13
Table 5: FTG by Industry Segment in Manhattan ................................................................... 13
Table 6: Freight Trip Generation by Zones in New York City ................................................ 14
Table 7: Link Flows Observed (in trucks) on the Network and Volumes Estimated by the
ODS Procedure ................................................................................................................ 18
Table 8: Model Estimation Errors for Link Flows ................................................................... 18

5
I. SUMMARY
The proposed freight ODS formulation uses a gravity model to estimate trip flows in Manhattan. The resulting total truck trips are assigned to the network to obtain a set of estimated truck traffic volumes, which are compared to the observed truck traffic. At this stage, the parameters of the model are then recomputed to improve the agreement between estimated and observed truck traffic. The process ends once no further improvement is possible.
II. INTRODUCTION
The estimation of future freight transportation requires the use of network and freight demand models. When characterizing freight demand, basic data are sought to appropriately model the decision processes associated with freight generation, distribution and consumption. In this context, freight origin-destination (OD) matrices are one of the most important data elements a planner could have, which is why a significant amount of effort, time and money is spent on their estimation. The estimation of OD matrices can be done by: (a) direct sampling methods; and, (b) using secondary data sources such as traffic counts. The latter techniques are referred to here as origin-destination synthesis (ODS).
Direct sample estimation includes all methodologies in which the OD data are obtained by interviewing the participants in the transportation activity. These approaches have some well-known limitations: roadside interviews tend to double count trips; on-board interviews may lead to bias in the parameters of random utility models; mail interviews are often biased because the rate of response varies across the population; and home interviews, though able to provide statistically sound estimates of OD, require a great deal of planning, time, effort and money (Ortúzar and Willumsen, 2001).
ODS overcomes these limitations by bypassing the need for surveys. This type of demand-modeling may therefore play a significant role in reducing the need for the direct collection of freight data, which is extremely time-consuming and expensive. In ODS, the traffic counts—which are a function of the OD flows—are used to estimate the OD matrices. Since the number of unknowns (OD pairs) exceeds the number of independent traffic counts, the estimation problem is under-specified. This requires the use of analytical techniques to estimate the most likely OD matrix that fits the observed traffic counts. The research on ODS has concluded that, though not a replacement for actual data, it could produce fairly realistic estimates of freight OD matrices. This, in turn, could play a significant role in boosting demand modeling efforts as collecting freight data is extremely time consuming and expensive.
III. ORIGIN-DESTINATION SYNTHESIS
Two approaches have been used to conduct ODS: Structured and Unstructured approaches. The former approach imposes a model structure on the estimation, reducing it to a parameter estimation problem. The latter approach uses general principles, e.g., maximum likelihood, to reduce the feasible space so that the problem has a unique solution (Ortúzar and Willumsen, 2001).
In general terms, ODS models can be classified on the basis of the time-dimension of the estimation process and the characteristics of the underlying traffic assignment model. The former could be subdivided into: a) static estimation –in which the OD matrix is time-invariant; and b)

6
dynamic estimation–in which the resulting OD matrices are time-varying. The techniques can be further classified, depending on the traffic assignment process in: 1) not requiring route choice, i.e., problems in which the route choice process can be disregarded (e.g., when estimating turning movements at intersections); 2) proportional route choice methods, i.e., problems in which the probability of using a given route does not depend upon the OD flows –which implies separability between the route choice and the OD estimation problems; and 3) non-proportional route choice methods, i.e., problems in which route choice and OD estimation are interdependent, thus requiring a joint estimation process involving equilibrium models.
Although there is a vast amount of literature on the subject of passenger ODS, the same cannot be said about freight ODS. The literature review conducted revealed that freight ODS has received relatively little attention from researchers and transportation professionals. After a comprehensive search, only seven formulations were found (Tamin and Willumsen, 1988; Gedeon et al., 1993; List and Turnquist, 1994; Tavasszy et al., 1994; Al-Battaineh and Kaysi, 2005; Holguín-Veras and Patil, 2007; 2008). Tamin and Willumsen, using the gravity-opportunity model (GO), developed a formulation to obtain the parameters of the GO model that best reproduce a given set of traffic counts (Tamin and Willumsen, 1988). Their approach, an example of a structured formulation, requires link volumes and estimates of total tons produced and attracted at each zone. The formulation developed by Gedeon et al. is aimed at obtaining optimal multi-commodity flows in multimodal networks (Gedeon et al., 1993). Since this formulation does not model demand behavior, it will not be further discussed. List and Turnquist developed a formulation to estimate the OD matrix using optimization principles (List and Turnquist, 1994). They formulated the problem as a large-scale linear programming problem in which the decision variables are the OD flows and the objective function is a weighted combination of the deviations of the estimated volumes with respect to the target values. Their formulation was extended to estimate U.S.-Mexico travel patterns using the dollar values of each commodity group and port of entry as the control variables (Nozick et al., 1996). Tavasszy et al. used partial techniques to estimate unobserved elements of the OD matrix, for estimation of interregional freight transport flow (Tavasszy et al., 1994). The formulation by Al-Battaineh and Kaysi uses an input-output formulation to estimate productions and attractions and a Genetic Algorithm to compute the OD matrix (Al-Battaineh and Kaysi, 2005). As in input-output formulations, this formulation uses the value of the goods transported.
IV. ORIGIN-DESTINATION SYNTHESIS IN MANHATTAN
3.1 Manhattan Zoning System and Network New York City is one of the most economically vibrant cities in the world. The city is comprised of five boroughs: The Bronx, Brooklyn, Staten Island, Queens and Manhattan. Manhattan, with over 1.5 million inhabitants, covers around 23 square miles. There are over 40,000 freight-related business establishments with more than 650,000 employees and over 60,000 establishments with 1.4 million employees that are not related to freight(Holguín-Veras and Ban, 2010).Holguín-Veras and Ban (2010)estimate that about180,000truck trips are attracted daily by Manhattan’s freight-related business establishments, which shows the importance of the target area for this study and its potential for implementing an ODS model.
For the study, each of the 41 geographic ZIP codes in Manhattan is used as an internal Transportation Analysis Zone (TAZ). In addition to this, four external zones are considered to account for the interactions between Manhattan and the surrounding region. The external zones considered are:
7
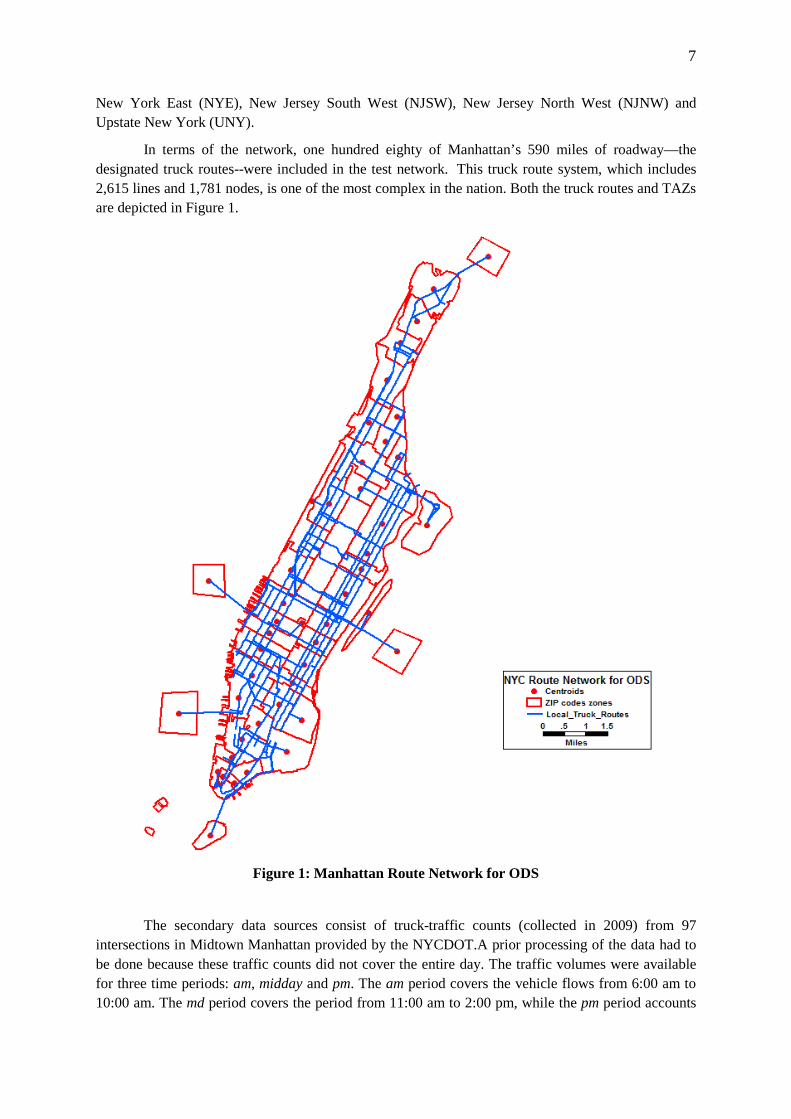
New York East (NYE), New Jersey South West (NJSW), New Jersey North West (NJNW) and Upstate New York (UNY).
In terms of the network, one hundred eighty of Manhattan’s 590 miles of roadway—the designated truck routes--were included in the test network. This truck route system, which includes 2,615 lines and 1,781 nodes, is one of the most complex in the nation. Both the truck routes and TAZs are depicted in Figure 1.
Figure 1: Manhattan Route Network for ODS
The secondary data sources consist of truck-traffic counts (collected in 2009) from 97
intersections in Midtown Manhattan provided by the NYCDOT.A prior processing of the data had to be done because these traffic counts did not cover the entire day. The traffic volumes were available for three time periods: am, midday and pm. The am period covers the vehicle flows from 6:00 am to 10:00 am. The md period covers the period from 11:00 am to 2:00 pm, while the pm period accounts

8
for vehicles from 4:00 pm to 8:00 pm. In essence, traffic counts were available only for 11 hours so that an expansion factor must be applied to convert these flows into daily ones. The expansion factor was determined based on the daily counts of bridges and tunnels connecting Manhattan to the external zones. The traffic volumes on the bridges and tunnels were obtained from NYC Bridge Traffic Volumes 2009(NYC Department of Transportation, 2011) which presents the data for the same year than the truck-traffic data was collected. For matters of consistency both traffic volumes consider small and large trucks, which correspond to classes 4, 5, 6 ,7, 8 , 9, 10, 11, 12 and 13 of the Federal Highway Administration - FHWA Vehicle Classification (FHWA, 2001). The expansion factor estimation procedure is summarized in Table 1. As shown, the link data set has counts for a time interval “t”. Therefore, growth factors are computed as the total volume divided by the total volume in “t” at the aforementioned tunnels and bridges (major flows entering Manhattan where data is available for the whole day). The overall growth factor to be applied to the intersections in Midtown Manhattan was computed as the weighted average of the growth factors computed before.
Table 1: Flow Expansion Factor for Midtown Manhattan
Feature/Direction* EB to M
WB to NJ
EB to B
WB to M
EB to B
WB to M
EB to B
WB to M
EB to Q
WB to M
Volume in "t"** 92 801 447 352 1961 3231 831 519 3269 2691Total Volume*** 286 1455 635 648 2977 4504 1258 776 5489 4336
% Volume during "t" 32% 55% 70% 54% 66% 72% 66% 67% 60% 62%Growth Factor 3.11 1.82 1.42 1.84 1.52 1.39 1.51 1.50 1.68 1.61
Overall Growth Factor
*** Counts include every vehicle with two axles, six tires and larger
1.60* M: Manhattan, NJ: New Jersey, B: Brooklyn, Q: Queens** "t" is the time interval for which volumes in Midtown are available
Holland Tunnel
Brooklyn Bridge
Manhattan Bridge
Williamsburg Bridge
Queensboro Bridge
Table 2: Flow Expansion Factor using data from Bridge Tolls
BB Tunnel
GB GWBL GWBP GWBU Holland Tunnel
Lincoln Tunnel
OBX
Volume in "t"* 560 1948 379 108 4844 749 5315 914Flow from 6am to 7pm 719 2500 473 129 6157 904 6298 1160Total Volume** 860 3493 941 143 9988 1141 7583 2077% Volume during "t" 65% 56% 40% 75% 49% 66% 70% 44%Growth Factor 1.54 1.79 2.48 1.33 2.06 1.52 1.43 2.27Overall GF for "t"* "t" is the time interval for which volumes in Middle Town are available **Counts include every vehicle with two axles, six tires and larger
1.83
As presented in Table 1, the expansion factor found was 1.60. However, the authors underwent a further step and analyzed data collected at eight different bridge toll locations for different week days in two different years (2002 and 2003). This further step confirmed that the percentage of traffic in time “t” varies around 60%. The results from this analysis are presented in Table 2. As the results in Table 2, was based on a more complete dataset for different days of the week, eight bridges/tunnels and for different years, the expansion factor used was 1.83, meaning that each link flow in the study area should be multiplied by 1.83 to expand the volume to a daily one. In essence, this indicates that the volumes provided for Midtown Manhattan represent 56% of the daily traffic.
The factor found was subsequently applied to the traffic counts for the 97 intersections in the city. The expanded traffic volumes were then assigned onto 154 links in Midtown Manhattan. All the

9
counts were not on the truck routes. For that reason, an expanded network was used as test network including all the traffic counts available. Figure 2 shows the links where traffic counts were available (circled) on the new traffic network.
Figure 2: Manhattan Traffic-Counts Location
As shown in Figure 2, all the traffic counts available correspond to Midtown Manhattan. The OD synthesis process makes use of the counts to estimate OD matrices taking into account the productions and attractions of the TAZs as explained below.

10
3.2 Manhattan Trip Generation This section describes the methodology followed to estimate freight trip generation for the study case. The Origin–Destination Synthesis (ODS) approach proposed in this research requires the number of freight trips produced and attracted by each zone as inputs. As Freight Trip Generation (FTG) primary data for Manhattan is not available, trip rates and regression models developed by the authors were applied to estimate FTG(Campbell et al., 2011). In previous research, Freight Generation (FG) and FTG patterns of firms were found to be related to the industry sector to which they belong and the number of employees (Bastida and Holguín-Veras, 2009). In fact, the Standard Industrial Classification (SIC) code assigned to a establishment is a strong predictor for FG and FTG because it classifies establishments in a way that is closely related to the economic and logistic process of firms (Holguín-Veras et al., 2011).
The models used to estimate FTG in Manhattan were calibrated using data collected in 2005; the sample is comprised of 339 carriers and 362 receivers in Manhattan, Brooklyn and New Jersey. The data contain elements such as the number of deliveries received or number of trips made in a typical day, SIC category and number of employees. SICs were grouped into eleven categories according to their sector descriptions. Eight of the eleven categories were defined as freight-related: agriculture, forestry and fisheries; mineral industries; construction industries; manufacturing; transportation, communication and utilities; wholesale trade; retail trade; and food. Due to a lack of data, FTG models could not be estimated for non-freight-related SICs (finance, insurance, real estate; service industries; and public administration); FTG for establishments in these industry sectors will be the subject of further research.
After classifying the establishments by freight-related SIC, statistical models were estimated for the ones having more than five observations. Depending on the industry sector, FTG per establishment is estimated using a constant number of deliveries, an employment-dependent rate, or an ordinary least squares regression model combining constant generation and an employment-dependent term (Holguín-Veras et al., 2011). The criterion used to choose the specification of the model is the Root Mean Square Error (RMSE). Table 3 shows the FTG rates used to calculate both attraction and production per establishment by SIC.
As shown in Table 3, attraction models estimate the number of deliveries received by the establishments, while production models estimate the number of trips produced by them. In this study, a delivery is assumed to generate 2 trips because the truck does not stay permanently in the establishment. In essence, each delivery attracts one trip (with cargo) and produces one trip (which can be loaded or empty).Similarly, each cargo pick-up generates 2 trips (inbound and outbound trips). This idea is illustrated in Figure 3a. From the analysis it follows that trip origins (Os) and trip destinations (Ds
Figure 3
) match exactly for each internal zone. An alternative approach used in the past by the authors is to consider commodity flows only, using a sub-model to account for empty trips. However, this is only possible when FG is available for the studied zones (which is not the case in Manhattan).Future research on the relation between deliveries and trips might result in more accurate ODS results. b shows a possible modeling approach that takes into account the fact that some businesses have their own trucks (private carriers). In these cases one trip inbound and one trip outbound can account for one trip produced (Oi) and one delivery (Di) in zone i. Moreover, implementing a tour-based sub-model for trip distribution based on freight generation would enhance the performance of this model.

11
Table 3: Daily Trip Generation by SIC
del/est del/emp trip/est trip/emp
1Agriculture, forestry, and
fisheries1,2,7,8,9 2.160 2.160
2Mineral
Industries 10,12,13,14 2.160 2.160
Construction 15, 16, 17 2.467 1.081 0.03715 General contractors & operative builders 0.132 2.16017 Special trade contractors 2.508 2.067
Manufacturing 21-39 3.156 1.61123 Apparel & other finished products 3.778 1.61124 Lumber & wood products, except furniture 0.067 1.61125 Furniture & fixtures 1.434 0.207 1.61134 Fabricated metal products 2.875 1.61139 Miscellaneous manufacturing industries 3.377 1.611
5Transportation, Communication
and Utilities40-49 1.000 2.216 0.072
Wholesale Trade 50, 51 2.272 0.069 1.594 0.05750 Wholesale trade - durable goods 3.071 0.054 1.554 0.04051 Wholesale trade - nondurable goods 1.813 0.074 1.992 0.065
Retail Trade 52, 53, 55, 56, 57, 59 3.371 1.72052 Building materials & mobile home dealers 0.353 1.72056 Apparel and accessory stores 1.314 0.032 1.72057 Home furniture, equipt. stores 3.714 1.72059 Miscellaneous retail 2.902 1.720
Food 20, 54, 58 1.826 0.090 1.44420 Food and kindred products 1.609 0.01 1.50054 Food stores 2.764 0.011 1.44058 Eating and drinking places 2.017 0.034 1.440
Truck Trips Produced
Notes: (*) For Groups 1 and 2 these values were assumed from the models estimated for Group 3. (**) For Group 5 the deliveries received were assumed. (***) Some SICs contained in each group have more specific models which may depend or not on business size, or can differ from the group estimate.
3
4
6
7
8
Gr SIC DescriptionDeliveries received
The unit expressing FTG in this study is truck trips; a truck is defined as any vehicle used in the transportation of cargo. The truck definition is not exactly the same as the one used for the traffic counts. However, this difference is not expected to have a big impact on the accuracy of the results, because few automobiles are used to transport cargo.
As discussed in the previous section, the zoning system for the ODS application corresponds to the ZIP codes in Manhattan for the internal zones. To estimate the FTG per zone, the authors used the 2007 County Business Patterns data from the U.S. Census Bureau(U.S. Census Bureau, 2007). The FTG aggregation process is based on the number of establishments and employment level per ZIP code and per SIC according to the methodology proposed by Holguín-Veras et al. (2011).

12
delivery pick-up
empty*
empty
Establishment
pick-up
delivery
Di Oi Di Oi
Di=∑deliveries+∑pi
ck-ups
Oi=∑pick-
ups+∑deliveries
Di=∑deliveries+α*∑
pick-ups
Oi=∑pick-
ups+β*∑deliveries
a. Deliveries and trips produced are independent (different trucks)
b. Some deliveries and some trips are coordinated (same truck)
Notes: (*) Not necessarily empty trip. If delivery is part of a tour the truck, it will still be loaded
Establishment
Establishment
Figure 3: Trip Generation at the Establishment Level
For the external zones, the process followed a different logic. As not all the trips originating from or destined for the external zones are interacting with Manhattan, the external trips were estimated using the volumes on the bridges and tunnels that connect Manhattan to these zones. Moreover, it was assumed that only 25% of the bridge and tunnel traffic is actually destined for Manhattan and the remaining 75% just use the bridges or tunnels to go across the island. The FTG study includes the vehicles classified as trucks or classified in the classes 5 to 13 in the Bridge Traffic Report 2009 (NYCDOT, 2011). In the cases where traffic counts are not available for the whole day an expansion factor is applied; this expansion factor is calculated based on other bridges. Table 4 shows the groups of bridges and tunnels connecting each external zone to Manhattan as well as the daily truck volumes before the through traffic adjustment in both directions.
Table 5 shows daily FTG estimates aggregated by industry segment. The total number of trips attracted and produced by SIC was computed using a dataset that includes the total number of establishments (as well as the number of employees) by SIC in Manhattan, and the models presented in Table 3.The aggregation process was made according to the type of model for each SIC at the 2-digits-level.The 37,045 number of freight-related establishments in Manhattan generate 182,354 trips. As shown in Table 5, wholesale sector represents 41% of the establishments and generates about 40% of the total trips in Manhattan. The food-related sectors represent 25% of the establishments and generate 23% of total trips.

13
Table 4: Bridges/Tunnels Connecting Manhattan to External Zones
From Manhattan To ManhattanRobert F Kennedy Bridge 1,004 1,290 UNYWillis Ave Bridge 2,646 N/A UNYThird Avenue Bridge N/A 3,294 UNYMadison Avenue 1,056 602 UNY145th St Bridge 745 272 UNYMacombs Dam Bridge 680 677 UNYAlexander Hamilton Bridge 9,596 10,243 UNYWashington Bridge 715 528 UNYW 207th ST 582 451 UNYBroadway 400 458 UNYHenry Hudson Bridge (Toll Road) 778 887 UNYGeorge Washinton Bridge 6,682 6,780 NJNLincoln Tunnel 2,444 3,519 NJSHolland Tunnel 345 255 NJSBrooklyn Battery Tunnel 283 396 NYEBrooklyn Bridge 9 76 NYEManhattan Bridge 2,335 4,100 NYEWilliamsburg Bridge 616 251 NYEQueens Midtown Tunnel 1,077 1,271 NYEQueensboro Bridge 4,134 3,482 NYE
ZoneTraffic Volume
Bridge/Tunnel
Table 5: FTG by Industry Segment in Manhattan
Industry Segment SICs Number of Establishments
Trip Production Trip Attraction
Agriculture, forestry, and fisheries
1,2,7,8,9 467 2,161 2,161
Mineral 10,11,13,14 6 28 28 Construction 15,16,17 1,969 8,594 8,594
Manufacturing21,22,23,24,25,26,27,28,29,30,31,32,33,34,35,36,37,38,39
3,881 19,161 19,161
Transport., Comm., and Utilities
40,41,42,43,44,45,46,47,48,49
4,009 22,174 22,174
Wholesale Trade 50,51 15,714 74,063 74,063 Retail Trade 52,53,55,56,57,59 3,122 14,864 14,864 Food 20,54,58 9,877 41,310 41,310
39,045 182,354 182,354 Total
From the work of Holguín-Veras et al. (2011) were calculated the FTG totals for internal and external zones. The FTG totals are presented in Table 6. According to the geographical aggregation process, Manhattan produces and attracts 182,354 truck trips every day. Similarly, the total generation for Manhattan and its external zones is 218,480 truck trips every day.

14
Table 6: Freight Trip Generation by Zones in New York City
ZIP/Zone Trip Production Trip Attraction10001 18,164 18,164 10002 6,371 6,371 10003 7,149 7,149 10004 1,769 1,769 10005 1,054 1,054 10006 935 935 10007 1,825 1,825 10009 1,932 1,932 10010 5,169 5,169 10011 6,832 6,832 10012 6,105 6,105 10013 10,469 10,469 10014 4,449 4,449 10016 9,802 9,802 10017 7,925 7,925 10018 19,318 19,318 10019 8,818 8,818 10020 1,576 1,576 10021 5,845 5,845 10022 9,568 9,568 10023 3,193 3,193 10024 2,632 2,632 10025 2,458 2,458 10026 431 431 10027 1,646 1,646 10028 2,921 2,921 10029 1,530 1,530 10030 275 275 10031 946 946 10032 1,209 1,209 10033 1,674 1,674 10034 948 948 10035 982 982 10036 19,425 19,425 10037 284 284 10038 3,055 3,055 10039 223 223 10040 902 902 10044 103 103 10128 2,292 2,292 10280 150 150
Subtotal 182,354 182,354 NYE 8,909 8,454 NJS 3,511 2,789 NJN 6,307 6,682 NYU 17,400 18,202
Subtotal 36,126 36,126 Grand Total 218,480 218,480
INT
ER
NA
L Z
ON
ES
EX
T.
ZO
NE
S

15
3.3 Methodology The starting point for this research is the multi-commodity ODS formulation developed by team members Holguin-Veras and Patil (2007). However, the data available as input and the geographical context differ from the one used previously(Holguín-Veras and Patil, 2007; 2008). For this reason this section provides a succinct description of the methodology. The model proposed assumes that: (1) estimates of the freight trip productions and freight trip attractions for each of the origin and destination zones are available; (2) the formulation implemented considers trucks transporting a generic commodity; (3) the underlying demand process that determines the freight-related traffic flows could be approximated by a doubly constrained gravity model; and, (4) the flow of empty trips is already considered in the freight generation estimation step. In all cases, the (unknown) parameters of the models are determined during the estimation process.
Define:
ijz = Total number of trips from i to j
Assuming that ijz follows a doubly constrained gravity model, as in equation (1):
ijjijiij fBADOz = (1)
Where:
iO = Production at origin i
jD = Consumption at destination j
ji BA , = Balancing factors to ensure satisfaction of origin and attraction constraints
ijcij ef β= = Impedance function (negative exponential deterrence function)
=ijc Travel cost between i and j
=β Impedance parameter
The impetus for using a gravity model is a pragmatic one because it provides a relatively easy and to a certain extent flexible, way to estimate OD matrices accounting for spatial interactions. Although the authors acknowledge the shortcomings of the gravity model, which were discussed elsewhere (Holguín-Veras and Patil, 2007), it is used as part of the proposed ODS because of its relative computational efficiency. Furthermore, Holguín-Veras and Patil(2007) applied the above formulation (Eq. (1)) to a case study (Guatemala City) for which both the actual OD matrix and traffic counts were known. They found that the model produced reasonable estimates of the true parameters of the underlying models.
In the proposed formulation, freight trip generation (FTG) considers the total flow between an origin i and a destination j as the summation of the corresponding loaded trips and the empty trips.
As in most previous freight ODS formulations, traffic counts are used to obtain estimates of the freight OD matrices. In this context, the problem reduces to the estimation of the parameters of the demand model so that the resulting traffic flows resemble the observed traffic in the network. In terms of the traffic assignment model needed in the ODS procedure, the authors decided to use techniques that are based on route choice that does not change with traffic flows (proportional route choice).

16
Denoting: lijp = Fraction of traffic traveling from i to j using link l e
lV = Estimated truck-traffic on link l
The value of fraction lijp can be estimated using any route choice model including all or nothing,
which is used in this study. Distance in miles is used to represent travel cost ijc . In terms of the
gravity and the empty trip models, the estimated traffic on link l can be observed in equation (2):
∑∑=i j
lijij
el pzV (2)
The objective function used to compute the optimal parameters considers the summation of the squared differences in the observed and estimated total (loaded plus empty) truck-traffic in the links, as shown in equation (3).
( ) ( )∑ −=l
el
olV VVFp 2 ,minarg β (3)
Where:
olV = observed total traffic volume on link l e
lV = estimated total traffic volume on link l
The accuracy of the formulation was assessed in terms of its ability to replicate the observed traffic counts and OD matrices. The objective is to minimize the total traffic error, i.e., equation (3).The parameter β is estimated iteratively using a golden search procedure. The procedure is systematically repeated until convergence is reached.
3.4 Results As mentioned in the methodology, the parameter β is estimated iteratively using a golden section search procedure. For doing this, a computer program was written to perform the calculations. Appendix I shows a description of the used code. The inputs for the code are the total freight trip productions and freight trip attractions of the TAZs, the impedance between zones (given as distance) and the list of the links including the connecting nodes, centroids of the TAZs, direction of the links and traffic counts. The optimization routine only considered internal zones. For external zones, the FTG inferred from the bridges’ traffic volumes was assigned to the network using a stochastic traffic assignment. These truck volumes generated by external zones were subtracted from the observed truck volumes and the result was used as input for the ODS model.
The optimization procedure was systematically repeated until convergence was reached. The process included the optimization of the impedance parameter of the gravity model β, the proportion of empty trips p, and Sum of Square Errors (SSE) between the observed and estimated total traffic volume in all links. After running the code several times, it was found that β = 1.82.The parameter β is closely related to the average distance travelled. The greater β, the less is the average distance travelled. In the Manhattan case, the distance between zones is not so big; therefore a big value for βwas expected. The plot of the parameter optimization is showed in Figure 4. The Sum of Square Errors (SSE) is plotted as a function of the proportion of empty trips and the parameter β of the impedance function of the gravity model. It can be observed in Figure 4 that for a value of β = 1.82, p = 0 and the SSE value is minimal.

17
Figure 4: Plot of the Parameter Optimization
Table 7 shows the link flows estimated by the ODS procedure as well as the observed flows on the network. For most of the links the flow is overestimated. It was not considered a statistical test analysis (such as chi-squared test) to compare both observed and estimated link flows) because it would be biased due to relatively few traffic counts spread throughout all the traffic network and the proportional assignment implemented. The total volume estimated for these links is 350,006 trucks while the observed volume is 100,179 trucks. In terms of accuracy, the Sum of Squared Errors (SSE) is 1.865E+9, that is the minimum of the function obtained using the golden search procedure.
Table 8 summarizes the trucks volume estimation errors by link flows. The links are classified according to the magnitude of the estimation error.
As shown in Table 8, only for 15% of the links the difference between the estimated flow and the observed flow is less than 50%. For another 22% of the links, the flows estimation error is between 50 and 100%. Another interesting finding is that 23% of the links studied had no traffic assigned, and about 40% of the links have an estimation error of more than 100%. This can be explained by the type of proportional assignment implemented (all-or-nothing), where all the users are assumed to use the shortest path. Another reason is the sparse nature of the traffic counts that were only available for midtown Manhattan. It is then evident that implementing a multi-path algorithm to assign traffic and more traffic counts could significantly improve the ODS model performance.

18
Table 7: Link Flows Observed (in trucks) on the Network and Volumes Estimated by the ODS Procedure
Link Observed Estimated Link Observed Estimated Link Observed Estimated732 77 1355 1202 601 3843 1337 248 37739 1062 1620 1203 611 7682 1338 883 40671068 193 2444 1204 508 748 1339 236 8811071 560 607 1205 550 7682 1341 421 8921072 779 1883 1206 610 4590 1343 278 8811073 837 1883 1208 656 7682 1346 544 01074 411 607 1209 553 3897 1356 461 7521077 339 904 1210 487 53 1358 593 5671078 417 1757 1252 61 1513 1383 192 36731089 231 748 1254 156 183 1385 2212 105761093 901 2694 1256 809 6169 1386 152 1021094 720 3241 1257 519 2530 1393 2299 70051096 383 3398 1265 1145 39 1395 566 1191098 399 5063 1268 408 2899 1396 672 1881099 485 7562 1271 139 2617 1398 367 1191108 138 183 1272 552 2899 1400 374 8851110 569 747 1273 615 2796 1401 815 40671117 1151 1608 1274 324 2617 1402 174 42951125 1634 1149 1280 332 5918 1403 1793 76611126 547 211 1281 552 3963 1409 988 6571127 512 447 1285 1528 12842 1414 1870 76611128 1095 16 1296 230 37 1428 665 01129 500 198 1298 1720 19272 1436 1019 7181152 1863 3542 1299 865 39 1437 588 3981156 1663 6455 1300 217 5983 1438 16 1671157 1934 6455 1302 514 3963 1441 1725 6931158 2490 1608 1312 1824 0 1442 93 6561159 312 6198 1313 817 2854 1463 5308 52481160 442 4128 1314 202 2606 1512 2849 81121161 2159 12842 1315 681 0 1518 2915 21162 491 10241 1319 370 643 1519 7672 81121166 1174 16 1321 972 494 1762 896 12441169 2728 3542 1326 112 37 3509 1520 128421171 174 419 1327 581 5613 3639 780 21551172 255 291 1329 619 4784 3643 1711 155921176 1084 168 1330 315 1714 3658 532 4671186 561 3149 1333 350 37 3659 616 3095
Table 8: Model Estimation Errors for Link Flows
Estimation Error Number of cases Percentage of cases<10% 6 4%11%-50% 17 11%50%-100% 34 22%>100% 61 40%Links with no traffic assigned 36 23%Total 154 100%

19
V. CONCLUSIONS
The proposed ODS procedure permitsthe estimation offreight OD matrices using secondary sources in Manhattan. The framework developed here will enable NYSDOT, NYMTC and other transportation management agencies to estimate freight OD matrices from traffic counts at a much reduced cost and with relative good accuracy. The framework will also make it possible to seamlessly integrate freight planning into agencies’ transportation system planning.
The parameter β of the impedance function of the gravity model was estimated iteratively using a golden search procedure. The obtained value of β=1.82 shows that the framework is producing good estimates. The parameter β is closely related to the average distance travelled. The greater β, the less is the average distance travelled, which is what is observed in this study.
The results of the proposed ODS model could be improved by implementing a multi-path algorithm to assign traffic. The implementation of a multi-path algorithm increases the consistency between observed traffic counts and estimated traffic flows.
The lack of data (relatively few traffic counts, spread throughout the traffic network) severely constrains the ability to obtain accurate results. The research team suggests gathering more traffic counts in Downtown and Uptown Manhattan to obtain more accurate O-D flows estimations. In essence, using data that cover a broader geographic area enables a better representation of different travel characteristics and patterns in the city. Freight industry sectors vary from zone to zone, which affects the distribution of freight trips. In fact, data from only one sector of Midtown Manhattan cannot be used to explain goods movements across the whole city.

20
VI. REFERENCES
Al-Battaineh, O. and I. A. Kaysi (2005). "Commodity-Based Truck Matrix Estimation Using
Input-Output Data and Genetic Algorithms." Transportation Research RecordBastida, C. and J. Holguín-Veras (2009). "Freight Generation Models: Comparative Analysis of
Regression Models and Multiple Classification Analysis."
1923: 37-45.
Transportation Research Record: Journal of the Transportation Research Board
Campbell, S., M. Jaller, I. Sanchez-Diaz, J. Holguin-Veras and C. Lawson (2011). Comparison Between Industrial Classification Systems in Freight Trip Generation (FTG) Modeling.
2097(-1): 51-61.
FHWA (2001). Traffic Monitoring Guide. US Department of Transportation. Washington, DC.: 18.
Gedeon, C., M. Florian and T. Crainic (1993). "Determining origin-destination matrices and optimal multiproduct flows for freight transportation over multimodal networks." Transportation Research Part B: Metholodogical
Holguín-Veras, J. and J. Ban (2010). Feasibility Study for Freight Data Collection – Suplemental Report. University Transportation Research Center.
27B(5): 351-368.
Holguín-Veras, J., M. Jaller, L. Destro, X. Ban, C. Lawson and H. Levinson (2011). "Freight Generation, Freight Trip Generation, and the Perils of Using Constant Trip Rates." Transportation Research Record
Holguín-Veras, J. and G. Patil (2007). "Integrated Origin-Destination Synthesis Model for Freight with Commodity-Based and Empty Trip Models."
(in print).
Transportation Research RecordHolguín-Veras, J. and G. Patil (2008). "A Multicommodity Integrated Freight Origin-Destination
Synthesis Model."
2008: 60-66.
Networks and Spatial Economics. <http://dx.doi.org/10.1007/s11067-007-9053-4List, G. and M. Turnquist (1994). "Estimating truck travel patterns in urban areas."
> Transportation
Research RecordNozick, L., M. Turnquist and G. List (1996). Trade pattern estimation between the United States
and Mexico. Transportation Research Board. Transportation Research Circular 459
1430: 1-9.
NYC Department of Transportation (2011). New York City Bridge Traffic Volumes 2009. New York: 256.
NYCDOT (2011). New York City Bridge Traffic Volumes 2009. New York Metropolitan Transportation Council.
Ortúzar, J. D. and L. G. Willumsen (2001). Modelling Transport
Tamin, O. Z. and L. G. Willumsen (1988).
. New York, John Wiley and Sons.
Freight demand model estimation from traffic counts
Tavasszy, L. A., J. E. Stada and R. Hamerslag (1994).
. PTRC Annual Meeting, University of Bath, England.
The Impact of Decreasing Border Barriers in Europe on Freight Transport Flows by Road
U.S. Census Bureau (2007). County Business Patterns. Washington D.C.
. Proceedings of the 36th Annual Conference of the Transportation Research Forum, Florida, USA.
21
VII. APPENDIX DESCRIPTION OF THE CODE
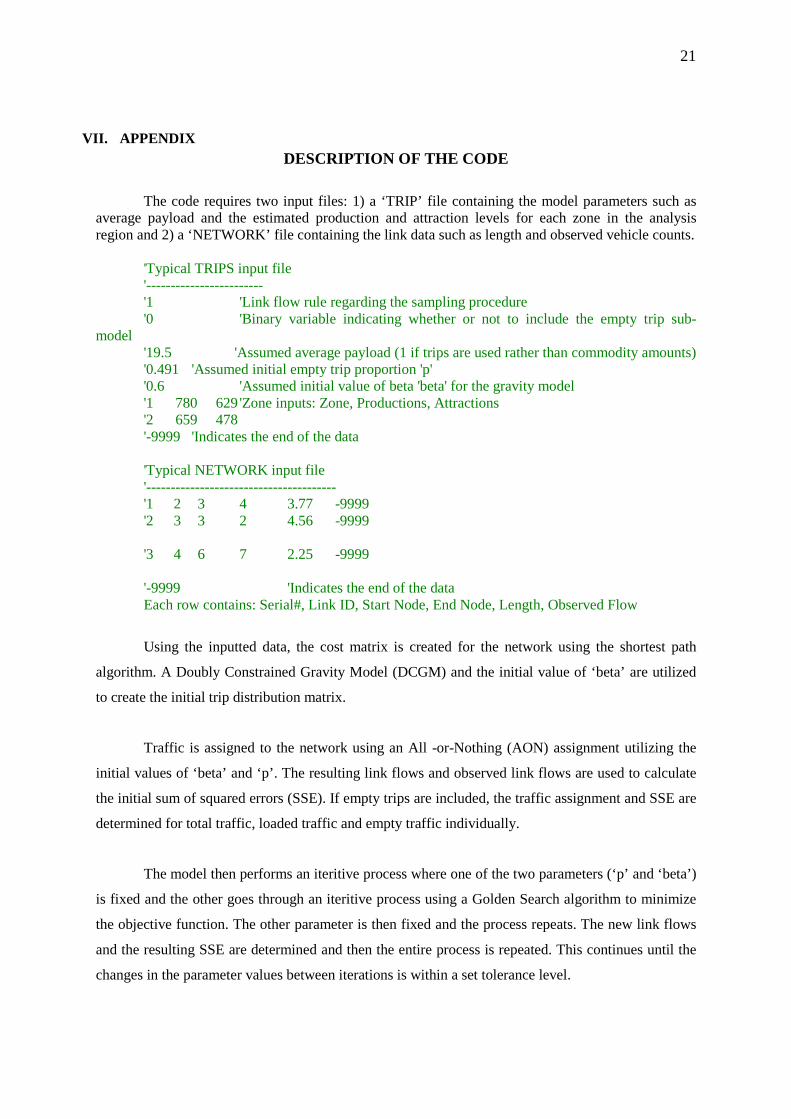
The code requires two input files: 1) a ‘TRIP’ file containing the model parameters such as average payload and the estimated production and attraction levels for each zone in the analysis region and 2) a ‘NETWORK’ file containing the link data such as length and observed vehicle counts.
'Typical TRIPS input file '------------------------ '1 'Link flow rule regarding the sampling procedure '0 'Binary variable indicating whether or not to include the empty trip sub-
model '19.5 'Assumed average payload (1 if trips are used rather than commodity amounts) '0.491 'Assumed initial empty trip proportion 'p' '0.6 'Assumed initial value of beta 'beta' for the gravity model '1 780 629 'Zone inputs: Zone, Productions, Attractions '2 659 478 '-9999 'Indicates the end of the data 'Typical NETWORK input file '--------------------------------------- '1 2 3 4 3.77 -9999 '2 3 3 2 4.56 -9999
'3 4 6 7 2.25 -9999
'-9999 'Indicates the end of the data Each row contains: Serial#, Link ID, Start Node, End Node, Length, Observed Flow
Using the inputted data, the cost matrix is created for the network using the shortest path
algorithm. A Doubly Constrained Gravity Model (DCGM) and the initial value of ‘beta’ are utilized
to create the initial trip distribution matrix.
Traffic is assigned to the network using an All -or-Nothing (AON) assignment utilizing the
initial values of ‘beta’ and ‘p’. The resulting link flows and observed link flows are used to calculate
the initial sum of squared errors (SSE). If empty trips are included, the traffic assignment and SSE are
determined for total traffic, loaded traffic and empty traffic individually.
The model then performs an iteritive process where one of the two parameters (‘p’ and ‘beta’)
is fixed and the other goes through an iteritive process using a Golden Search algorithm to minimize
the objective function. The other parameter is then fixed and the process repeats. The new link flows
and the resulting SSE are determined and then the entire process is repeated. This continues until the
changes in the parameter values between iterations is within a set tolerance level.

Univ
ersi
ty T
rans
port
atio
n Re
sear
ch C
ente
r - R
egio
n 2
Fund
ed b
y the
U.S.
Dep
artm
ent o
f Tra
nspo
rtat
ion
Region 2 - University Transportation Research Center
The City College of New YorkMarshak Hall, Suite 910
160 Convent AvenueNew York, NY 10031Tel: (212) 650-8050Fax: (212) 650-8374
Website: www.utrc2.org