university of groningen genetics of hirschsprung disease … · 7 unidad de gestión clínica de...
TRANSCRIPT

University of Groningen
Genetics of Hirschsprung diseaseSchriemer, Duco
IMPORTANT NOTE: You are advised to consult the publisher's version (publisher's PDF) if you wish to cite fromit. Please check the document version below.
Document VersionPublisher's PDF, also known as Version of record
Publication date:2016
Link to publication in University of Groningen/UMCG research database
Citation for published version (APA):Schriemer, D. (2016). Genetics of Hirschsprung disease: Rare variants, in vivo analysis and expressionprofiling [Groningen]: Rijksuniversiteit Groningen
CopyrightOther than for strictly personal use, it is not permitted to download or to forward/distribute the text or part of it without the consent of theauthor(s) and/or copyright holder(s), unless the work is under an open content license (like Creative Commons).
Take-down policyIf you believe that this document breaches copyright please contact us providing details, and we will remove access to the work immediatelyand investigate your claim.
Downloaded from the University of Groningen/UMCG research database (Pure): http://www.rug.nl/research/portal. For technical reasons thenumber of authors shown on this cover page is limited to 10 maximum.
Download date: 01-11-2018
COMBINED STRATEGIES TO IDENTIFY DISEASE
ASSOCIATED GENES FOR RARE COMPLEX DISEASES;
HIRSCHSPRUNG DISEASE AS A MODEL
Duco Schriemer1, Erwin Brosens2, Hongsheng Gui3,4, Clara S. Tang3, Rutger W.W.
Brouwer5, Marta Bleda6, Wilfred F.J. van IJcken5, Salud Borrego7,8, Isabella
Ceccherini9, Aravinda Chakravarti10, Stanislas Lyonnet11,12, Paul K. Tam3, Maria-
Mercè Garcia-Barceló3, Bart J.L. Eggen1, Robert M.W. Hofstra2,13
1 Department of Neuroscience, section Medical Physiology, University of Groningen, University Medical Center
Groningen, Groningen, The Netherlands
2 Department of Clinical Genetics, Erasmus Medical Center, Rotterdam, the Netherlands
3 Department of Surgery, Li Ka Shing Faculty of Medicine, The University of Hong Kong, Hong Kong, SAR, China
4 Centre for Genomic Sciences, Li Ka Shing Faculty of Medicine, The University of Hong Kong, Hong Kong, SAR,
China
5 Biomics Erasmus Center for Biomics, Erasmus Medical Center, Rotterdam, The Netherlands
6 CIBER de Enfermedades Raras (CIBERER), ISCIII, Seville, Spain
7 Unidad de Gestión Clínica de Genética, Reproducción y Medicina Fetal Hospitales, Universitarios Virgen del Rocío,
Seville, Spain
8 CIBER de Enfermedades Raras (CIBERER), ISCIII, Seville, Spain
9 UOC Genetica Medica, Istituto Gaslini, Genova, Italy
10 McKusick-Nathans Institute of Genetic Medicine, Johns Hopkins University School of Medicine, Baltimore, USA
11 Département de Génétique, Faculté de Médecine, Université Paris Descartes, Paris, France
12 INSERM U-781, AP-HP Hôpital Necker-Enfants Malades, Paris, France
13 Stem Cells and Regenerative Medicine, Birth Defects Research Centre UCL Institute of Child Health, London, UK
Manuscript in preparation
5

CHAPTER 5
130
ABSTRACT
The genetic architecture of common, heritable diseases is complex, with
involvement of both common and rare genetic variants. Association studies for
rare variants are challenging, as the low frequency of rare variants and large
multiple-testing correction require large sample sizes. In this study we focused on
the prioritization of rare variant identified by exome data from 48 Hirschsprung
disease (HSCR) patients and 212 controls. HSCR is a complex genetic disorder that
is characterized by incomplete development of the enteric nervous system (ENS)
in the distal colon.
We sampled almost exclusively extreme phenotypes and selected rare,
pathogenic variants. All variants per gene were collapsed and a meta-analysis was
performed on data from three centers. The burden test we performed gave every
gene a nominal p-value and the 48 most promising genes, with a nominal p-value
<0.01, were subsequently ranked by seven gene prioritization tools.
CELSR1, CLOCK, FASN and CACNA1H were among the top 5-ranked
candidate genes based on average ranking and were among the top 13 genes with
the most significant nominal p-values in the burden test meta-analysis.
Subsequently, gene expression data from the developing mouse gut and ENS
progenitor cells were used to assess whether these candidate genes are
abundantly expressed in the cell types relevant for HSCR. Of these four highly-
ranked candidate genes, Fasn and Cacana1h were expressed by ENS progenitor
cells, but were not differentially expressed between ENS progenitors, gut and
controls tissues. Celsr1 and Clock were expressed at lower levels in ENS progenitor
cells than in the rest of the gut, but Celsr1 expression did increase upon activation
of RET, a receptor in ENS progenitors and the major risk gene in HSCR. Clock, Fasn
and Cacna1h expression was not affected by RET signaling.
In conclusion, we show that burden tests, gene prioritization tools and
gene expression data from a relevant cell type can be used to identify candidate
genes for HSCR in an underpowered genetic study. These genes should be studied
in more detail in further genetic or functional studies to delineate their role in
HSCR.

COMBINED STRATEGIES TO IDENTIFY GENES FOR RARE COMPLEX DISEASES; HSCR AS A MODEL
131
5
INTRODUCTION
Both common and rare variants contribute to the onset of complex genetic
diseases1–4. Common variants (minor allele frequency > 5%) have been found
associated to complex genetic diseases in genome-wide association studies
(GWAS)5,6. Although large GWAS generally uncover multiple disease-associated
loci, the common variants in an associated haplotype contribute but do not cause
the disease. The common variants in GWAS-associated loci collectively explain only
20-60% of the observed heritability7. Part of the missing heritability likely is
explained by rare variants (minor allele frequency < 1%). Resequencing of genes in
GWAS-associated loci has indeed identified rare variants in these genes8–10. In
addition, highly heritable forms of complex diseases can present in families and in
isolated populations, suggesting a role for highly penetrant, rare variants11,12. This
suggests that both common and rare variants in the same gene(s) can contribute to
the development of genetically complex diseases13.
Genome-wide genetic analysis, by array-based genotyping or exome/
genome sequencing, provides an unbiased approach to identify disease-associated
genes. However, this advantage comes at a cost. A multiple-testing correction has
to be applied to the large number of tested loci, thereby reducing the statistical
power of the study. With up to 2.5 million genetic markers, the multiple testing
corrections applied to GWAS are considerable. The number of genotyped bases is
even larger in sequencing studies, as the exome alone contains ~30 million base
pairs. Statistical power in sequencing studies further suffers from the low
frequency of genetic variants. Whereas GWAS make use of common variants to
increase statistical power, sequencing studies capture all genetic variation, most of
which is in fact rare14,15. As a result of the large multiple testing correction and low
allele frequencies, power calculations in exome sequencing studies show that
10,000 to 100,000 individuals are required to find genetic associations of rare
variants, especially in complex disorders16–18.
Several solutions for the lack of statistical power in exome/genome
sequencing studies have been proposed. First of all, rare variants are
overrepresented in extreme disease phenotypes, so sampling of patients with
extreme phenotypes increases the power of finding rare variant associations19,20.
Secondly, case-control analysis can be restricted to genetic variants that (are
predicted to) disrupt protein function. Since (predicted) damaging variants are
likely to be disease-causal, they will be less frequently found in controls due to
CHAPTER 5
132
negative evolutionary selection. Thirdly, all rare variants in a gene or pathway can
be collapsed into a single variable to increase the variant frequency, reduce the
number of association tests and thereby increase the power21. It goes without
saying that meta-analysis of multiple smaller studies can be an effective strategy to
increase the statistical power22,23.
Even when the abovementioned strategies are applied to increase
statistical power, true associations may not reach the significance threshold that is
dictated by multiple testing for 20,000 genes. It has been postulated that such
associations may be uncovered in replication cohorts where only a limited number
of ‘top hits’ are analyzed, leading to a lower multiple testing-corrected significance
threshold24. Top hits can be specified as the associations with the lowest nominal
p-value, and biological plausibility can also be taken into account.
Gene prioritization tools have been developed to identify the disease-
causal gene in a set of candidate genes from genetic studies, using genes that are
known to be relevant to the phenotype as so-called seed genes25,26. Different
strategies can be employed to identify plausible seed or candidate genes. For
example, some gene prioritization tools require the user to specify seed genes27–30,
whereas other tools extract known disease genes from the Online Mendelian
Inheritance in Man (OMIM) database31–35. Similarity measurements between
candidate genes and seed genes can be based on a variety of data sources, such as
functional annotation, protein interactions, co-expression, sequence similarity and
text mining. In addition to gene-level information, variant level information such as
allele frequency and predicted pathogenicity can be used to rank candidate
genes34,35.
In this study, we focused on Hirschsprung disease (HSCR) as an example of
a disease with a complex genetic architecture. HSCR is characterized by the lack of
neuronal innervation in the distal colon, resulting from incomplete colonization of
the bowel by enteric neural crest cells (ENCCs), the progenitor cells of the enteric
nervous system (ENS). The incidence of HSCR is approximately 1 in 3,500 in Asians
and 1 in 6,500 in Caucasians36. Over 15 genes have been linked to HSCR, but these
genes explain only around 25% of the heritability13,36. As in many complex genetic
diseases, identification of new genes in HSCR has initially focused on linkage
analysis in familial cases and isolated populations and revealed a role for the RET
and EDNRB pathways in HSCR37–39. More recently, GWAS on sporadic HSCR
patients have been performed. The genes associated with HSCR in these GWAS are
RET, NRG1 and the SEMA3 gene locus40,41. In addition to the common variants, rare
COMBINED STRATEGIES TO IDENTIFY GENES FOR RARE COMPLEX DISEASES; HSCR AS A MODEL
133
5
variants in these genes and other HSCR-associated genes have been reported13,42,43.
To study the role of rare variants in HSCR on a genome-wide level, we sampled
extreme phenotypes, selected rare pathogenic variants, collapsed all variants per
gene, performed a meta-analysis on data from three different centers and used
gene prioritization tools to analyze exome sequencing data from HSCR patients.
METHODS
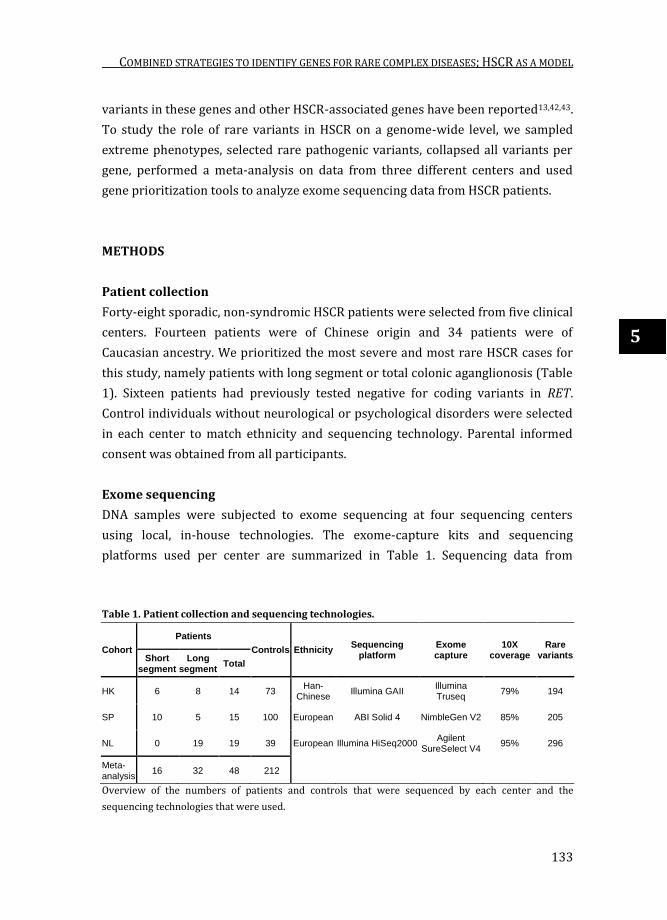
Patient collection
Forty-eight sporadic, non-syndromic HSCR patients were selected from five clinical
centers. Fourteen patients were of Chinese origin and 34 patients were of
Caucasian ancestry. We prioritized the most severe and most rare HSCR cases for
this study, namely patients with long segment or total colonic aganglionosis (Table
1). Sixteen patients had previously tested negative for coding variants in RET.
Control individuals without neurological or psychological disorders were selected
in each center to match ethnicity and sequencing technology. Parental informed
consent was obtained from all participants.
Exome sequencing
DNA samples were subjected to exome sequencing at four sequencing centers
using local, in-house technologies. The exome-capture kits and sequencing
platforms used per center are summarized in Table 1. Sequencing data from
Table 1. Patient collection and sequencing technologies.
Cohort
Patients
Controls Ethnicity Sequencing
platform Exome capture
10X coverage
Rare variants Short
segment
Long segment
Total
HK 6 8 14 73 Han-
Chinese Illumina GAII
Illumina Truseq
79% 194
SP 10 5 15 100 European ABI Solid 4 NimbleGen V2 85% 205
NL 0 19 19 39 European Illumina HiSeq2000 Agilent
SureSelect V4 95% 296
Meta-analysis
16 32 48 212
Overview of the numbers of patients and controls that were sequenced by each center and the
sequencing technologies that were used.

CHAPTER 5
134
two centers with identical sequencing platforms were analyzed together in
downstream analyses. Alignment of Illumina sequencing reads were mapped to the
genome using BWA and Solid sequencing reads were mapped using Bfast44. All
sequencing reads were mapped to the human reference genome version 19 (hg19).
Quality Control (QC) of sequencing data was carried out using the FastQC toolbox,
Picard’s metric summary and the GATK Depth-of-Coverage module. After QC,
sequencing data were preprocessed for local indel realignment, PCR duplicate
removal and base quality recalibration45. SNPs and Indels were called using the
GATK unified Genotyper 2.046 and stored in standard VCF files. Each sequencing
center performed variant calling simultaneously on their respective HSCR patients
and control subjects. KGGSeq47 was used to extract variants that 1) had a
sequencing quality score ≥ 50; 2) mapping quality ≥20; 3) Fisher strand bias score
≤60; 4) genotype quality score ≥20; 5) sequencing depth ≥8; 6) reference allele
ratio <0.75; 7) are exonic; 8) are non-synonymous SNPs or indels; 9) have minor
allele frequency <1% in dbSNP137, 1000 Genomes and NHLBI Exome Sequencing
Project; 10) were successfully genotyped in ≥80% of patients and ≥80% of
controls; 11) were predicted deleterious by KGGSeq’s logistic regression analysis
of dbNSFP v3.0 functional impact scores48.
Burden test
The number of rare variants per gene in patients and controls was analyzed by
three different centers individually, using the same protocol. The Combined
Multivariate and Collapsing (CMC) test in Rvtests package was used to collapse all
variants identified within the same gene21. P-values were calculated by asymptotic
chi-square distribution. Meta-analysis of the summary statistic of three centers
was performed using sample-size weighted z-score.
Candidate gene prioritization
Genes with a nominal association p-value <0.01 in the burden test were selected as
seed genes for downstream candidate gene prioritization. Gene prioritization was
performed in Endeavour Web Server (http://www.esat.kuleuven.be/
endeavour)27,28, ToppGene (http://toppgene.cchmc.org)29, ToppNet (part of the
ToppGene suite29), GPSy (http://gpsy.genouest.org)30, FunSimMat (http://
funsimmat.bioinf.mpi-inf.mpg.de)31–33, Exomiser (http://www.sanger.ac.uk/
science/tools/exomiser)34 and ExomeWalker (http://compbio.charite.de/
ExomeWalker)35. The gene prioritization tools differ in the data sources that are
COMBINED STRATEGIES TO IDENTIFY GENES FOR RARE COMPLEX DISEASES; HSCR AS A MODEL
135
5
used to compare candidate genes to seed genes. For gene prioritization in
Endeavour all 19 available databases in Endeavour were used. ToppGene was run
using default parameters, with ‘Interaction’ as additional training feature and
ToppNet was run using default settings. Moreover, Endeavour, ToppGene and
ToppNet require the user to select a set a genes (specific seed genes) that are
known to be relevant to the disease. For this we assembled a list of 45 seed genes
that are either genetically linked to HSCR in humans, or loss of these genes causes
aganglionosis in mouse models (Supplementary Table 1).
In contrast to a self-made list of genes as required for Endeavour,
ToppGene and ToppNet, GPSy was run using ‘Nervous system’ and ‘Homo sapiens‘
as selected topic and species, respectively, with otherwise default parameters. The
‘disease candidate prioritization’ function in FunSimMat was run using OMIM term
#142623 (Hirschsprung disease) and were ranked by Biological Pathway (BP).
Gene prioritization in Exomiser was performed using the hiPHIVE prioritiser and
Orphanet ID 388 (Hirschsprung disease). OMIM term #142623 (Hirschsprung
disease) was selected as phenotype in ExomeWalker. No variant quality filters
were applied in Exomiser and ExomeWalker, since these were applied in the
upstream filtering and annotation by KGGSeq. Overall gene ranking was based on
the average rank per gene in the different prioritization tools.
Gene expression analysis
Publically available expression data from E14.5 mouse embryos and was combined
with in-house expression data from embryonic mouse gut and ENCCs isolated from
E14.5 mouse embryos that expressed YFP under control of the Wnt1 promoter.
Expression data from control tissues were extracted from the Gene Expression
Omnibus49: testis and ovary (GSE6881), kidney (GSE4230)50, gonad (GSE6916)51
and cardiac tissue (GSE1479)52. Moreover, additional intestinal tissue expression
sets were obtained: stomach, pylorus and duodenum (GSE15872)53. Probe set
summaries from the raw Affymetrix data (cel files) were calculated using BRB-
ArrayTools version 4.5.0 - Beta_2 (http://linus.nci.nih.gov/BRB-ArrayTools.html).
The probes were annotated by Bioconductor (www.bioconductor.org), R v3.2.2
Patched (2015-09-12 r69372) and the annotation package mouse4302.db (version
3.0.0). ‘Just GCRMA’ (GC content – Robust Multi-Array Average) was used from the
‘GCRMA’ package available in Bioconductor. The just GCRMA algorithm adjusts for
background intensities (optical noise and non-specific binding), normalizes each
array using quantile normalization and includes variance stabilisation and log2

CHAPTER 5
136
transformation. Replicate spots within an array were averaged. Genes showing
minimal variation across the set of arrays were excluded from the analysis (if less
than 10% of expression data had at least a 1.5 fold change in either direction from
gene's median value, or at least 50% of arrays had missing data for that gene).
Probes were present on the Affymetrix mouse4302.db chip for 45 of the 48
candidate genes (DEFB132 and OR10K1 do not have a mouse orthologue and Or2d2
does not have probes on the chip). Genes whose expression differed by at least 1.5
fold from the median in at least 20% of the arrays were retained. The minimum
fold change for the class comparisons was set at 1.5, statistics were performed
using a two-sample T-test with random variance model. The permutation p-values
for significant genes were computed based on 10,000 random permutations and
the nominal significance level of each univariate test was set at 0.05.
Power calculations
The Genetic Power Calculator54 was used to calculate the statistical power of the
present study and the number of patient required in a future replication study. The
prevalence of HSCR was set to 0.0002 (1:5000 live born individuals36). D-prime
was set to 0.8, assuming that the sensitivity of detecting variants in exome
sequencing data is 80% (Table 1). Calculations for cohort sizes assumed the same
case : control ratio as for the 48 HSCR cases and 212 controls (1 : 4.417).
Significance levels were set at 0.05 and were not adjusted for multiple testing.
Dominant inheritance was assumed.
RESULTS
Sampling of extreme phenotypes
Rare variants have a relatively large contribution to disease in patients with an
extreme phenotype19,20. Therefore we prioritized the most severe form of HSCR for
exome sequencing. A variable segment of the gut can be aganglionic in HSCR. In
80% of the cases, only a short-segment of the colon is affected, whereas a long-
segment of the colon is aganglionic in the remaining 20%36. Long-segment HSCR
has a high heritability and a dominant mode of inheritance with reduced
penetrance55. Moreover, in long-segment HSCR there is a relative large
contribution of rare variants in RET, the major HSCR gene55,56. Therefore, the
highest contribution of rare variants is expected in patients with long-segment
COMBINED STRATEGIES TO IDENTIFY GENES FOR RARE COMPLEX DISEASES; HSCR AS A MODEL
137
5
HSCR. In three different cohorts, a total of 32 cases of long-segment HSCR were
sampled for exome sequencing and were supplemented with 16 cases of short-
segment HSCR, resulting in 66.7% long-segment cases in our cohort (Table 1).
Exome sequencing and variant filtering
Exome sequencing was performed on 48 sporadic HSCR patients in three different
centers using different sequencing technologies (Table 1). The average 10X
coverage per center ranged from 79% to 95% (Table 1). Rare variants were
selected from the exome sequencing data that lead to a loss of function (nonsense,
splice site and frameshift mutations) or are missense mutations that were
predicted to be deleterious. This yielded between 194 and 296 rare variants per
individual on average per center.
Gene burden test and meta-analysis
The low frequencies of individual rare variants hamper the statistical power to
find a significant association to a disease. Therefore, all rare variants per gene that
were predicted to be pathogenic were collapsed into a single variable; the number
of variants per gene. The statistical power of finding disease-associated genes
depends on frequency at which mutations are found in comparison to a control set
of samples. This frequency varies among genes: 2.4% of all genes carried rare,
damaging variants in ≥5% of the controls, 20.8% of the genes had a variant
frequency of 1-5% in control samples and 27.5% a frequency <1% in our controls.
No rare, damaging variants were found in the controls in the remaining 49.3% of
all genes (Figure 1A).
Given the mutation frequencies per gene, the power of detecting true
associations was calculated for different genotype relative risks. For genes with a
high variant frequency of 5% our study with 48 patients and 212 controls could
detect true associations (at nominal p-value), even at low relative risk (Figure 1B).
Also for genes with a 0.5-1% variant frequency there was sufficient power to
detect damaging variants with a moderate or high relative risk. For genes that
carried rare, damaging variants less frequently in controls, there was limited
statistical power, even at a high relative risk. Increasing the size of the study to for
instance 100 cases and 442 controls would increases the statistical power, but up
to 1000 cases and 4417 controls are required to obtain sufficient power to detect
associations for genes that carry variants in 0.01% of the controls (at nominal p-
value) (Figure 1C,D).

CHAPTER 5
138
The variant frequency per gene was compared between patients and
controls in three independent centers. A meta-analysis was performed on data
from three different sequencing centers, representing different ethnicities and
sequencing technologies. A quantile-quantile plot (QQ-plot) showed that the
Figure 1. Frequency distribution of rare, damaging variants per gene and its effect on statistical
power. A) Histogram displaying the number of genes that carry rare, damaging variants at a specified
frequency in the control population. B) Statistical power of detecting a significant association (at a
nominal p-value of 0.05) in our cohort of 48 HSCR cases and 212 controls, given the genotype relative
risk and frequency of variants in the gene. C,D) Statistical power of detecting significant associations if
cohort sizes would have been increased to 100 cases and 442 controls (C) or 1000 cases and 4417
controls (D).
COMBINED STRATEGIES TO IDENTIFY GENES FOR RARE COMPLEX DISEASES; HSCR AS A MODEL
139
5
observed distribution of p-values followed the expected distribution, for individual
case-controls studies as well as for the meta-analysis (Figure 2). This suggests that
there were no confounding factors producing artificial associations. The most
significant associations in the meta-analysis were found for KLHDC4 (p=1.43x10⁻⁵)
and CR1 (p=2.07x10⁻⁵), but didn’t reach genome-wide significance (2.5x10⁻⁶, after
Bonferroni correction for 20,000 genes) (Table 2).
Candidate gene prioritization
Due to the low power of the rare variant association study, there may have been
real pathogenic variants in genes that did not reach genome-wide significance.
Small-scale replication studies have greater power to detect true associations, but
require a selection of candidate genes to follow up on24.
Gene prioritization tools have been developed to identify plausible genes
in a set of candidate genes and can therefore be used to select the best candidate
genes for follow-up studies25,26. Forty-eight genes had a nominal p-value <0.01 and
were selected to be ranked by seven gene prioritization tools to identify the best
candidate HSCR gene among them. CELSR1 achieved the highest average rank
across seven gene prioritization tools, followed by CLOCK, GRM4, FASN and
CACNA1H (Figure 3A). The overall ranking by the gene prioritization tools was
compared to the nominal p-value of the genes in the burden test meta-analysis and
four of the five highest-ranked genes (CELSR1, CLOCK, FASN and CACNA1H) were
among the 13 most significantly associated genes (Figure 3B). Although these
genes have no known functions in ENS development, biological functions and
expression in neural cells has been reported for CELSR1, CLOCK, FASN and
CACNA1H57–60.
The correlation between ranking results from different gene prioritization
tools varied substantially (Figure 3C). The highest correlation coefficient was
found between Exomiser and ExomeWalker (r = 0.54), but ExomeWalker showed
no correlation to any other tool. Endeavour and ToppGene showed a moderate
correlation with all other tools, except ExomeWalker.
Expression in the gut and in ENCCs
Gene prioritization tools use a variety of data sources to rank candidate genes,
including gene expression data. However, the expression data used in gene
prioritization tools is generally not derived from the cell type studied. As HSCR

CHAPTER 5
140
results from incomplete colonization of the bowel by ENCCs (the progenitor cells
of the ENS), the expression levels of the mouse orthologues of the 48 candidate
HSCR genes obtained in the burden test were analyzed in the developing mouse
gut, and more specifically in the ENCCs. Two genes (DEFB132 and OR10K1) do not
have a mouse orthologue and for one mouse orthologue (Or2d2) there were no
Figure 2. Quantile-quantile plot of the association p-values. The observed p-values follow the
expected distribution, for individual centers and for the meta-analysis. The highest associated genes in
the meta-analysis, KLHDC4 (p=1.43x10⁻⁵) and CR1 (p=2.07x10⁻⁵), are indicated.

COMBINED STRATEGIES TO IDENTIFY GENES FOR RARE COMPLEX DISEASES; HSCR AS A MODEL
141
5
probes on the chip. Of the 45 candidates genes for which expression data were
available, all but one (Cr1) were expressed by ENCCs. Clock, Grm4, Fasn and
Cacna1h, whose human orthologues were highly ranked by the gene prioritization
tools, were not abundantly expressed by ENCCs compared to control tissues
(testis, ovary, heart and kidney), or in the intestinal samples. Celsr1 was not highly
expressed in ENCCs or the gut, but its expression level was increased by activation
of the RET receptor with its ligand GDNF.
Of the 48 candidate genes selected from the burden test, Clstn2, Cdk12,
Cpxm2, Ghdc, D8Ertd82e (mouse orthologue of SGK223) and Mrps34 were higher
expressed in ENCCs than in control tissues. These ENCC-expressed genes, with the
addition of Pprc1 and Ddc, were also expressed at higher levels in intestinal
samples compared to control tissues (Table 3). The remaining candidate genes
from the burden test were expressed by ENCCs (with the exception of CR1), but
were not differentially expressed between ENCCs and the gut. Of the genes that are
highly expressed in the gut, the human orthologue of Ghdc was the seventh most
significantly associated gene to HSCR in the burden test meta-analysis (nominal p-
value: 1.87x10⁻⁴). GHDC (GH3 domain containing) only ranked at position 35 of the
48 candidate genes in the overall gene prioritization. The biological function of
GHDC is unknown and the gene could therefore not be linked to the known ENS
genes. However, Exomiser and ExomeWalker, both taking into account the
pathogenicity score of the identified variants, ranked GHDC at position 6 and 3,
respectively, suggesting that the identified variants in GHDC are highly pathogenic.
Combined with the expression of Ghdc in the developing mouse ENS and the high
rank in the burden test, this makes GHDC an excellent candidate gene for HSCR.
These data indicate that the use of tissue-specific gene expression data is a
complementary approach to identify candidate genes that were not picked up by
the gene prioritization tools due to lack of functional characterization of the gene.
Another potentially interesting candidate gene that was highly expressed
by ENCCs is Cdk12. Cdk12 was ranked as the 10th best candidate gene by the gene
prioritization tools and is involved in neuronal differentiation in the murine CNS61.
Given its high expression in ENCCs, Cdk12 may also be involved in ENS
development and contribute to HSCR. Clstn2, Cpxm2, Mrps34 and D8Ertd82e
(orthologue of SGK223) were highly expressed by ENCCs, but did not rank high in
the gene prioritization and were not among the most significantly associated genes
in the burden test.

CHAPTER 5
142
Table 2. Genes with a nominal p-value of association <0.01.
Gene Description HK SP NL Meta
KLHDC4 kelch domain containing 4 1.09E-03 2.30E-04 1 1.43E-05 CR1 complement component (3b/4b) receptor 1 0.022 9.51E-03 0.011 2.07E-05 ATP13A5 ATPase type 13A5 0.015 0.067 0.011 1.31E-04 FASN fatty acid synthase 0.022 2.30E-04 1 1.58E-04
GPRIN1 G protein regulated inducer of neurite outgrowth 1
0.059 9.51E-03 0.044 1.63E-04
CLOCK clock homolog (mouse) 0.019 9.51E-03 0.148 1.68E-04 GHDC GH3 domain containing 0.022 9.51E-03 0.148 1.87E-04 ZNF76 zinc finger protein 76 (expressed in testis) 0.022 9.51E-03 0.148 1.87E-04 XPO6 exportin 6 1.09E-03 9.51E-03 1 3.01E-04 ZFAND4 Zinc Finger, AN1-Type Domain 4 0.408 2.30E-04 0.148 3.05E-04 ERN2 ER to nucleus signaling 2 0.022 9.51E-03 0.446 6.43E-04
CELSR1 cadherin, EGF LAG seven-pass G-type receptor 1
0.408 5.20E-03 0.039 9.30E-04
CACNA1H calcium channel, voltage-dependent, T type, alpha 1H
1 5.20E-03 2.98E-03 1.11E-03
NINL ninein-like 0.721 1.43E-03 0.062 1.34E-03 POLR1A polymerase (RNA) I polypeptide A, 194kDa 1 1.80E-04 0.148 1.51E-03 ALX3 ALX homeobox 3 0.022 9.51E-03 1 2.26E-03 CDK12 Cdc2-related kinase, arginine/serine-rich 0.022 9.51E-03 1 2.26E-03 DDC dopa decarboxylase 0.022 9.51E-03 1 2.26E-03 HOGA1 4-Hydroxy-2-Oxoglutarate Aldolase 1 0.022 9.51E-03 1 2.26E-03
HSD3B2 hydroxy-delta-5-steroid dehydrogenase, 3 beta- and steroid delta-isomerase 2
0.022 9.51E-03 1 2.26E-03
IMPG1 interphotoreceptor matrix proteoglycan 1 0.022 9.51E-03 1 2.26E-03
OR10K1 olfactory receptor, family 10, subfamily K, member 1
0.022 9.51E-03 1 2.26E-03
APOBEC1 apolipoprotein B mRNA editing enzyme, catalytic polypeptide 1
1 5.85E-06 1 2.58E-03
GPR179 G protein-coupled receptor 179 0.022 0.290 0.039 2.65E-03 RNF17 ring finger protein 17 0.022 0.016 1 3.33E-03
MCM8 minichromosome maintenance complex component 8
1 9.51E-03 0.011 3.41E-03
ACADL acyl-Coenzyme A dehydrogenase, long chain
0.408 9.51E-03 0.148 3.91E-03
CPXM2 carboxypeptidase X (M14 family), member 2 0.408 9.51E-03 0.148 3.91E-03 CLSTN2 calsyntenin 2 0.022 5.20E-03 0.481 4.31E-03 P4HA3 prolyl 4-hydroxylase, alpha polypeptide III 0.019 0.067 0.597 4.78E-03
ACSM5 acyl-CoA synthetase medium-chain family member 5
0.022 0.025 1 4.89E-03
LMOD3 leiomodin 3 (fetal) 0.022 0.025 1 4.89E-03
OR2D2 olfactory receptor, family 2, subfamily D, member 2
0.022 0.025 1 4.89E-03
DEFB132 defensin, beta 132 0.187 0.697 1.82E-06 5.80E-03
DAAM1 dishevelled associated activator of morphogenesis 1
0.187 9.51E-03 0.597 6.18E-03
VTI1B vesicle transport through interaction with t-SNAREs homolog 1B
0.022 9.51E-03 0.481 6.51E-03
TMEM67 transmembrane protein 67 0.022 0.290 0.148 6.64E-03
GABPB1 GA binding protein transcription factor, beta subunit 1
1 9.51E-03 0.039 6.96E-03
MRPS34 mitochondrial ribosomal protein S34 1 9.51E-03 0.039 6.96E-03 NCKAP5L NCK-Associated Protein 5-Like 1 9.51E-03 0.039 6.96E-03 SGK223 homolog of rat pragma of Rnd2 0.620 9.51E-03 0.148 7.05E-03 ZSWIM5 zinc finger, SWIM-type containing 5 0.015 0.637 0.039 7.12E-03
TRPM2 transient receptor potential cation channel, subfamily M, member 2
1 0.025 0.011 7.16E-03
KNTC1 kinetochore associated 1 0.968 9.51E-03 0.062 8.57E-03
PPRC1 peroxisome proliferator-activated receptor gamma, coactivator-related 1
0.187 5.20E-03 1 8.74E-03
DMRT3 doublesex and mab-3 related transcription factor 3
1.09E-03 0.117 0.481 9.36E-03
PRDM7 PR domain containing 7 0.408 2.30E-04 0.481 9.44E-03 GRM4 glutamate receptor, metabotropic 4 0.022 9.51E-03 0.315 9.92E-03
COMBINED STRATEGIES TO IDENTIFY GENES FOR RARE COMPLEX DISEASES; HSCR AS A MODEL
143
5
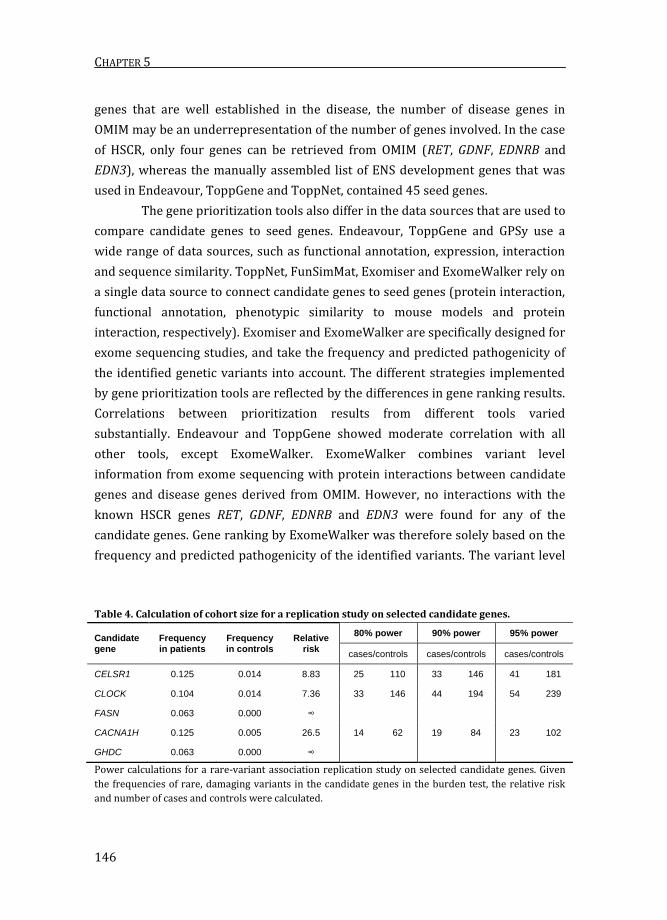
Statistical power of a replication study for selected genes
Using gene prioritization tools and gene expression data from the developing ENS,
we identified CELSR1, CLOCK, FASN, CACNA1H and GHDC as the best candidate
genes for HSCR. However, follow-up experiments are required to establish
whether these genes are involved in HSCR, as our study was underpowered to find
genome-wide significant associations. The data presented in this study were used
to calculate the power of a replication study. Using the variant frequencies per
gene in patients and controls, relative risks were calculated per gene. These ranged
from 7.4 for CLOCK to 26.5 for CACNA1H. Consequently, 14 to 33 unrelated patients
are required to find a significant association of these genes to HSCR with 80%
power and 23 to 41 patients are required for 95% power54 (Table 4). Since no
mutations were found in FASN and GHDC in our control cohort, it was not possible
to calculate the relative risk and required number of patients in a replication study
for these genes.
DISCUSSION
Resequencing studies on GWAS-associated genes or candidate genes from
functional studies has revealed a role for rare, coding variants in complex genetic
diseases, including HSCR41,62. However, the contribution of rare variants to
complex genetic diseases is difficult to study, as statistical power is negatively
affected by locus heterogeneity, low allele frequency and large multiple-testing
correction17. Using HSCR as a model of a complex genetic disease, we combined
several strategies to perform a rare variant (gene) association study.
Burden test
To maximize the statistical power of our rare variant association test, we
prioritized long-segment HSCR cases, collapsed all rare, damaging variants per
gene and performed a meta-analysis on three case-control studies. This approach
gave our study sufficient power to detect associations at nominal p-value for genes
in which variants are relatively abundant or have a high relative risk. However, the
meta-analysis was underpowered to reach genome-wide significance.
Mutations in RET, the main HSCR gene, are normally found in 15-35% of
sporadic HSCR patients63,64. However, we did not find RET or any other known
HSCR genes among the highest associated genes in the burden test. The most

CHAPTER 5
144
Figure 3. Candidate gene ranking results from the gene prioritization tools. A) Gene prioritization
results from the seven tools. Highly ranked genes are shown in dark blue and genes with a low rank in
light blue. Genes are shown by overall rank. B) Relationship between the p-value of association in the
burden test and the overall rank in the gene prioritization. C) Heatmap showing the correlations
between the ranking results of the different tools.

COMBINED STRATEGIES TO IDENTIFY GENES FOR RARE COMPLEX DISEASES; HSCR AS A MODEL
145
5
significantly associated known HSCR gene was NRG1, with a nominal p-value of
0.015. The reason for not finding the HSCR genes is due to the fact that we selected
mainly patients without mutations in the known HSCR genes, this increases the
likelihood of identifying new HSCR genes. Coding mutations in all HSCR genes
other than RET are rare and are mainly associated with syndromic rather than
isolated HSCR13,42,43. Lack of association of these genes with HSCR in our data was
therefore also not unexpected.
Gene prioritization tools
The 48 genes with a nominal p-value <0.01 in the burden test performed, were
selected to be prioritized by seven gene prioritization tools. Different prioritization
tools use seed genes from different sources to look for similarity with candidate
genes. Endeavour, ToppGene and ToppNet require the user to specify genes that
are known to be involved in the disease or underlying biological process27–29. The
benefit of this approach is that the seed genes are very specific for the phenotype.
Other tools lack this user specific input and do not use all known genes that are
critical for ENS development. For example, Hlx65 and Hoxb566,67 are not included as
general ‘nervous system development’ seed genes by GPSy30. GPSy therefore
misses connections with these seed genes. User-specific input also has its
drawbacks as the focus is on ‘known’ genes. GPSy may therefore uncover novel
pathways in ENS development as many genes that are involved in neuronal
development in the CNS might also be relevant to the ENS. FunSimMat, Exomiser
and ExomeWalker extract seed genes from OMIM31–35. Although this yields seed
Table 3. Differentially expression of the 48 candidate genes in E14.5 mouse embryo.
Case Control High expression Low expression
Mouse whole gut Testis, ovary,
heart and kidney
Cdk12, Mrps34, D8Ertd82e,
Ghdc, Zfand4
Gabpb1, Trpm2, Celsr1,
Polr1a, Hoga1, Clock, Grm4,
Daam1, Rnf17
Mouse ENCC Mouse whole gut Cpxm2,D8Ertd82e, Ghdc,
Cdk12, Clstn2, Mrps34
Celsr1, Polr1a, Gabpb1, Grm4,
Kntc1, Clock, Mcm8, Hoga1
Mouse ENCC Testis, ovary,
heart and kidney
Cpxm2, D8Ertd82e, Ghdc,
Cdk12, Clstn2, Mrps34
Celsr1, Polr1a, Gabpb1, Grm4,
Kntc1, Clock, Mcm8, Hoga1
Mouse ENCC +
GDNF
Testis, ovary,
heart and kidney
Cpxm2, Ghdc, D8Ertd82e,
Vti1b, Celsr1, Clstn2, Cdk12,
Mrps34
Kntc1, Gabpb1, Polr1a, Clock,
Hoga1, Grm4, P4ha3, Mcm8
Mouse ENCC +
GDNF Mouse ENCC Celsr1 Ddc
Of the top candidate genes from the gene prioritization tools, Celsr1 and Clock were less abundantly
expressed by ENCCs than in the gut or in control tissues, but Celsr1 expression was upregulated in
ENCCs after activation of the RET receptor by its ligand GDNF.
CHAPTER 5
146
genes that are well established in the disease, the number of disease genes in
OMIM may be an underrepresentation of the number of genes involved. In the case
of HSCR, only four genes can be retrieved from OMIM (RET, GDNF, EDNRB and
EDN3), whereas the manually assembled list of ENS development genes that was
used in Endeavour, ToppGene and ToppNet, contained 45 seed genes.
The gene prioritization tools also differ in the data sources that are used to
compare candidate genes to seed genes. Endeavour, ToppGene and GPSy use a
wide range of data sources, such as functional annotation, expression, interaction
and sequence similarity. ToppNet, FunSimMat, Exomiser and ExomeWalker rely on
a single data source to connect candidate genes to seed genes (protein interaction,
functional annotation, phenotypic similarity to mouse models and protein
interaction, respectively). Exomiser and ExomeWalker are specifically designed for
exome sequencing studies, and take the frequency and predicted pathogenicity of
the identified genetic variants into account. The different strategies implemented
by gene prioritization tools are reflected by the differences in gene ranking results.
Correlations between prioritization results from different tools varied
substantially. Endeavour and ToppGene showed moderate correlation with all
other tools, except ExomeWalker. ExomeWalker combines variant level
information from exome sequencing with protein interactions between candidate
genes and disease genes derived from OMIM. However, no interactions with the
known HSCR genes RET, GDNF, EDNRB and EDN3 were found for any of the
candidate genes. Gene ranking by ExomeWalker was therefore solely based on the
frequency and predicted pathogenicity of the identified variants. The variant level
Table 4. Calculation of cohort size for a replication study on selected candidate genes.
Candidate gene
Frequency in patients
Frequency in controls
Relative risk
80% power 90% power 95% power
cases/controls cases/controls cases/controls
CELSR1 0.125 0.014 8.83 25 110 33 146 41 181
CLOCK 0.104 0.014 7.36 33 146 44 194 54 239
FASN 0.063 0.000 ∞
CACNA1H 0.125 0.005 26.5 14 62 19 84 23 102
GHDC 0.063 0.000 ∞
Power calculations for a rare-variant association replication study on selected candidate genes. Given
the frequencies of rare, damaging variants in the candidate genes in the burden test, the relative risk
and number of cases and controls were calculated.
COMBINED STRATEGIES TO IDENTIFY GENES FOR RARE COMPLEX DISEASES; HSCR AS A MODEL
147
5
information is also used by Exomiser, explaining why ExomeWalker results
correlated with those from Exomiser, but to no other tools tested in this study.
Despite the variable correlations between ranking results, several genes
were consistently highly ranked by the gene prioritization tools. CELSR1, CLOCK,
FASN and CACNA1H were among the top 5-ranked candidate genes based on
average rank and were among the 13 most significant nominal p-values in the
burden test meta-analysis.
Function of the proposed top 4 candidate genes
CELSR1 (Cadherin, EGF LAG Seven-Pass G-Type Receptor 1) is an adhesion
molecule that is involved in planar cell polarity; the organization of cells in a plane
or sheet68. CELSR1 mutations have been associated with the neural tube defect
craniorachischisis in humans, a finding that is corroborated by improper closure of
the neural tube in Celsr1 mouse models68–70. Additionally, Celsr1 is involved in the
directional migration of facial branchiomotor neurons71. Planar cell polarity genes
are involved in ENS development, where Celsr3 and Fzd3 regulate guidance and
growth of neuronal projections72. Ablation of Celsr3 in ENS progenitor cells causes
constriction of colonic segments, distention of the proximal segment, and reduced
gut transit time, symptoms that are all hallmarks of HSCR72. These results
demonstrate a role for planar cell polarity genes in ENS development, making
CELSR1 an excellent candidate gene for HSCR.
CLOCK encodes a core component of the circadian clock. Gastrointestinal
motility follows a circadian rhythm and neurotransmitters that regulate gut
contractility, such as Vip and nNos, are rhythmically expressed in the distal murine
colon73,74. Clock genes are expressed in intestinal epithelial cells and enteric
neurons in mice and may well be responsible for the rhythmic innervation of the
gut73.
FASN (fatty acid synthase) is an enzyme that catalyzes fatty acid synthesis.
In the murine CNS, Fasn is highly expressed in neurogenic areas and is required for
maintenance of neural stem cell pools75. As the development of the ENS depends
on propagation of stem cells, FASN may be involved in ENS development.
The mouse homologue of CACNA1H (Calcium channel, voltage-dependent,
T type, alpha 1H subunit) is expressed by migrating ENCCs76. Although Cacna1h
and other Ca2+ channels are expressed by ENCCs at different developmental time
points, blockage of Ca2+ channels in gut explants does not impair ENCC migration
or neurite outgrowth76.
CHAPTER 5
148
Additional candidate genes
Combining different strategies as proposed in this study reduces the number of
candidate genes dramatically. Ending up with a small number of candidate genes
makes genetic studies surveyable and amenable for functional analysis. However,
it also raises the question whether we do not exclude potentially valid candidates.
For instance, GHDC and to a lesser extent CDK12 are excellent candidates for HSCR
because of their high expression in ENCC, pathogenicity of identified variants and
low nominal p-value in the burden test. Therefore, one should be critical in
excluding genes too easily.
Conclusions
Although our rare variant association study was underpowered to detect genome-
wide associations to HSCR, the study serves as a pilot study to direct future
research. Power calculations for genetic studies rely on prior knowledge of variant
frequencies and effect size, and these parameters can be estimated from the data
presented here. It should be noted that the frequency of variants in a gene is
variable between genes, meaning that for some genes there is higher statistical
power than for others. Therefore our approach will be useful only for genes that
carry relatively many rare, damaging variants in the general population. In
addition to calculating the statistical power for such genes in a small-scale
replication study, we prioritized the top hits from our burden test to select the
most promising candidate genes to follow up on. Only a limited number of
unrelated patients are required in such a follow-up study.
COMBINED STRATEGIES TO IDENTIFY GENES FOR RARE COMPLEX DISEASES; HSCR AS A MODEL
149
5
REFERENCES
1. Iyengar, S. K. & Elston, R. C. The genetic basis of complex traits: rare variants or ‘common gene,
common disease’? Methods Mol. Biol. 376, 71–84 (2007). 2. Bodmer, W. & Bonilla, C. Common and rare variants in multifactorial susceptibility to common
diseases. Nat. Genet. 40, 695–701 (2008). 3. Gibson, G. Rare and common variants: twenty arguments. Nat. Rev. Genet. 13, 135–145 (2012). 4. Saint Pierre, A. & Génin, E. How important are rare variants in common disease? Brief. Funct.
Genomics elu025– (2014). doi:10.1093/bfgp/elu025 5. Stranger, B. E., Stahl, E. A. & Raj, T. Progress and Promise of Genome-Wide Association Studies
for Human Complex Trait Genetics. Genetics 187, 367–383 (2011). 6. Visscher, P. M., Brown, M. A., McCarthy, M. I. & Yang, J. Five Years of GWAS Discovery. Am. J.
Hum. Genet. 90, 7–24 (2012). 7. Lander, E. S. Initial impact of the sequencing of the human genome. Nature 470, 187–197
(2011). 8. Johansen, C. T. et al. Excess of rare variants in genes identified by genome-wide association
study of hypertriglyceridemia. Nat. Genet. 42, 684–687 (2010). 9. Rivas, M. A. et al. Deep resequencing of GWAS loci identifies independent rare variants
associated with inflammatory bowel disease. Nat. Genet. 43, 1066–73 (2011). 10. Beaudoin, M. et al. Deep Resequencing of GWAS Loci Identifies Rare Variants in CARD9, IL23R
and RNF186 That Are Associated with Ulcerative Colitis. PLoS Genet. 9, e1003723 (2013). 11. Easton, D. F., Bishop, D. T., Ford, D. & Crockford, G. P. Genetic linkage analysis in familial breast
and ovarian cancer: results from 214 families. The Breast Cancer Linkage Consortium. Am. J. Hum. Genet. 52, 678–701 (1993).
12. Heutink, P. & Oostra, B. a. Gene finding in genetically isolated populations. Hum. Mol. Genet. 11, 2507–15 (2002).
13. Alves, M. M. et al. Contribution of rare and common variants determine complex diseases-Hirschsprung disease as a model. Dev. Biol. 382, 320–9 (2013).
14. Tennessen, J. A. et al. Evolution and functional impact of rare coding variation from deep sequencing of human exomes. Science 337, 64–9 (2012).
15. Nelson, M. R. et al. An Abundance of Rare Functional Variants in 202 Drug Target Genes Sequenced in 14,002 People. Science (80-. ). 337, 100–104 (2012).
16. Bansal, V., Libiger, O., Torkamani, A. & Schork, N. J. Statistical analysis strategies for association studies involving rare variants. Nat. Rev. Genet. 11, 773–785 (2010).
17. Zhi, D. & Chen, R. Statistical guidance for experimental design and data analysis of mutation detection in rare monogenic Mendelian diseases by exome sequencing. PLoS One 7, (2012).
18. Zuk, O. et al. Searching for missing heritability: designing rare variant association studies. Proc. Natl. Acad. Sci. U. S. A. 111, E455–64 (2014).
19. Kryukov, G. V, Shpunt, A., Stamatoyannopoulos, J. a & Sunyaev, S. R. Power of deep, all-exon resequencing for discovery of human trait genes. Proc. Natl. Acad. Sci. U. S. A. 106, 3871–3876 (2009).
20. Li, D., Lewinger, J. P., Gauderman, W. J., Murcray, C. E. & Conti, D. Using extreme phenotype sampling to identify the rare causal variants of quantitative traits in association studies. Genet. Epidemiol. 35, 790–9 (2011).
21. Li, B. & Leal, S. Methods for detecting associations with rare variants for common diseases: application to analysis of sequence data. Am. J. Hum. Genet. 83, 311–321 (2008).
22. Lee, S., Teslovich, T. M., Boehnke, M. & Lin, X. General framework for meta-analysis of rare variants in sequencing association studies. Am. J. Hum. Genet. 93, 42–53 (2013).
23. Hu, Y.-J. et al. Meta-analysis of gene-level associations for rare variants based on single-variant statistics. Am. J. Hum. Genet. 93, 236–48 (2013).
24. Lipman, P. J. et al. On the follow-up of genome-wide association studies: An overall test for the most promising SNPs. Genet. Epidemiol. 35, 303–309 (2011).
25. Tranchevent, L. C. et al. A guide to web tools to prioritize candidate genes. Brief. Bioinform. 12, 22–32 (2011).
26. Moreau, Y. & Tranchevent, L.-C. Computational tools for prioritizing candidate genes: boosting disease gene discovery. Nat. Rev. Genet. 13, 523–536 (2012).
27. Aerts, S. et al. Gene prioritization through genomic data fusion. Nat. Biotechnol. 24, 537–544
CHAPTER 5
150
(2006). 28. Tranchevent, L. C. et al. ENDEAVOUR update: a web resource for gene prioritization in
multiple species. Nucleic Acids Res. 36, 377–384 (2008). 29. Chen, J., Bardes, E. E., Aronow, B. J. & Jegga, A. G. ToppGene Suite for gene list enrichment
analysis and candidate gene prioritization. Nucleic Acids Res. 37, 305–311 (2009). 30. Britto, R. et al. GPSy: a cross-species gene prioritization system for conserved biological
processes--application in male gamete development. Nucleic Acids Res. 40, W458–65 (2012). 31. Schlicker, A. & Albrecht, M. FunSimMat: A comprehensive functional similarity database.
Nucleic Acids Res. 36, 434–439 (2008). 32. Schlicker, A. & Albrecht, M. FunSimMat update: new features for exploring functional
similarity. Nucleic Acids Res. 38, D244–8 (2010). 33. Schlicker, A., Lengauer, T. & Albrecht, M. Improving disease gene prioritization using the
semantic similarity of Gene Ontology terms. Bioinformatics 26, i561–i567 (2010). 34. Robinson, P. N. et al. Improved exome prioritization of disease genes through cross-species
phenotype comparison. Genome Res. 24, 340–348 (2014). 35. Smedley, D. et al. Walking the interactome for candidate prioritization in exome sequencing
studies of Mendelian diseases. Bioinformatics 30, 3215–22 (2014). 36. Amiel, J. et al. Hirschsprung disease, associated syndromes and genetics: a review. J. Med.
Genet. 45, 1–14 (2008). 37. Angrist, M. et al. A gene for Hirschsprung disease (megacolon) in the pericentromeric region of
human chromosome 10. Nat. Genet. 4, 351–6 (1993). 38. Lyonnet, S. et al. A gene for Hirschsprung disease maps to the proximal long arm of
chromosome 10. Nat. Genet. 4, 346–50 (1993). 39. Puffenberger, E. et al. Identity-by-descent and association mapping of a recessive gene for
Hirschsprung disease on human chromosome 13q22. Hum. Mol. Genet. 3, 1217–1225 (1994). 40. Garcia-Barcelo, M.-M. et al. Genome-wide association study identifies NRG1 as a susceptibility
locus for Hirschsprung’s disease. Proc. Natl. Acad. Sci. U. S. A. 106, 2694–9 (2009). 41. Jiang, Q. et al. Functional loss of semaphorin 3C and/or semaphorin 3D and their epistatic
interaction with ret are critical to Hirschsprung disease liability. Am. J. Hum. Genet. 96, 581–96 (2015).
42. Brooks, A. S., Oostra, B. A. & Hofstra, R. M. W. Studying the genetics of Hirschsprung’s disease: Unraveling an oligogenic disorder. Clin. Genet. 67, 6–14 (2005).
43. Heanue, T. a & Pachnis, V. Enteric nervous system development and Hirschsprung’s disease: advances in genetic and stem cell studies. Nat. Rev. Neurosci. 8, 466–79 (2007).
44. Li, H. et al. The Sequence Alignment/Map format and SAMtools. Bioinformatics 25, 2078–2079 (2009).
45. DePristo, M. A. et al. A framework for variation discovery and genotyping using next-generation DNA sequencing data. Nat. Genet. 43, 491–8 (2011).
46. McKenna, A. et al. The Genome Analysis Toolkit: a MapReduce framework for analyzing next-generation DNA sequencing data. Genome Res. 20, 1297–303 (2010).
47. Li, M.-X., Gui, H.-S., Kwan, J. S. H., Bao, S.-Y. & Sham, P. C. A comprehensive framework for prioritizing variants in exome sequencing studies of Mendelian diseases. Nucleic Acids Res. 40, e53 (2012).
48. Liu, X., Jian, X. & Boerwinkle, E. dbNSFP v2.0: A database of human non-synonymous SNVs and their functional predictions and annotations. Hum. Mutat. 34, 2393–2402 (2013).
49. Barrett, T. et al. NCBI GEO: archive for functional genomics data sets--update. Nucleic Acids Res. 41, D991–D995 (2013).
50. Chen, Y.-T., Kobayashi, A., Kwan, K. M., Johnson, R. L. & Behringer, R. R. Gene expression profiles in developing nephrons using Lim1 metanephric mesenchyme-specific conditional mutant mice. BMC Nephrol. 7, 1 (2006).
51. Small, C. L. Profiling Gene Expression During the Differentiation and Development of the Murine Embryonic Gonad. Biol. Reprod. 72, 492–501 (2005).
52. Tanaka, M. et al. A mouse model of congenital heart disease: cardiac arrhythmias and atrial septal defect caused by haploinsufficiency of the cardiac transcription factor Csx/Nkx2.5. Cold Spring Harb. Symp. Quant. Biol. 67, 317–25 (2002).
53. Li, X. et al. Dynamic patterning at the pylorus: Formation of an epithelial intestine-stomach boundary in late fetal life. Dev. Dyn. 238, 3205–3217 (2009).
54. Purcell, S., Cherny, S. S. & Sham, P. C. Genetic Power Calculator: design of linkage and

COMBINED STRATEGIES TO IDENTIFY GENES FOR RARE COMPLEX DISEASES; HSCR AS A MODEL
151
5
association genetic mapping studies of complex traits. Bioinformatics 19, 149–150 (2003). 55. Badner, J. A., Sieber, W. K., Garver, K. L. & Chakravarti, A. A genetic study of Hirschsprung
disease. Am. J. Hum. Genet. 46, 568–80 (1990). 56. Emison, E. S. et al. Differential contributions of rare and common, coding and noncoding Ret
mutations to multifactorial Hirschsprung disease liability. Am. J. Hum. Genet. 87, 60–74 (2010). 57. Feng, J., Han, Q. & Zhou, L. Planar cell polarity genes, Celsr1-3, in neural development.
Neurosci. Bull. 28, 309–15 (2012). 58. Kimiwada, T. et al. Clock genes regulate neurogenic transcription factors, including NeuroD1,
and the neuronal differentiation of adult neural stem/progenitor cells. Neurochem. Int. 54, 277–85
59. Loftus, T. M. et al. Reduced food intake and body weight in mice treated with fatty acid synthase inhibitors. Science 288, 2379–81 (2000).
60. Chemin, J. et al. Specific contribution of human T-type calcium channel isotypes (alpha(1G), alpha(1H) and alpha(1I)) to neuronal excitability. J. Physiol. 540, 3–14 (2002).
61. Chen, H. R., Lin, G. T., Huang, C. K. & Fann, M. J. Cdk12 and Cdk13 regulate axonal elongation through a common signaling pathway that modulates Cdk5 expression. Exp. Neurol. 261, 10–21 (2014).
62. Gui, H. et al. RET and NRG1 interplay in Hirschsprung disease. Hum. Genet. 132, 591–600 (2013).
63. Attié, T. et al. Diversity of RET proto-oncogene mutations in familial and sporadic Hirschsprung disease. Hum. Mol. Genet. 4, 1381–6 (1995).
64. Hofstra, R. M. et al. RET and GDNF gene scanning in Hirschsprung patients using two dual denaturing gel systems. Hum. Mutat. 15, 418–29 (2000).
65. Bates, M. D., Dunagan, D. T., Welch, L. C., Kaul, A. & Harvey, R. P. The Hlx homeobox transcription factor is required early in enteric nervous system development. BMC Dev. Biol. 6, 33 (2006).
66. Carter, T. C. et al. Hirschsprung’s disease and variants in genes that regulate enteric neural crest cell proliferation, migration and differentiation. J. Hum. Genet. 57, 485–93 (2012).
67. Lui, V. C. H. et al. Perturbation of hoxb5 signaling in vagal neural crests down-regulates ret leading to intestinal hypoganglionosis in mice. Gastroenterology 134, 1104–15 (2008).
68. Curtin, J. A. et al. Mutation of Celsr1 Disrupts Planar Polarity of Inner Ear Hair Cells and Causes Severe Neural Tube Defects in the Mouse. Curr. Biol. 13, 1129–1133 (2003).
69. Allache, R., De Marco, P., Merello, E., Capra, V. & Kibar, Z. Role of the planar cell polarity gene CELSR1 in neural tube defects and caudal agenesis. Birth Defects Res. A. Clin. Mol. Teratol. 94, 176–81 (2012).
70. Robinson, A. et al. Mutations in the planar cell polarity genes CELSR1 and SCRIB are associated with the severe neural tube defect craniorachischisis. Hum. Mutat. 33, 440–447 (2012).
71. Qu, Y. et al. Atypical cadherins Celsr1-3 differentially regulate migration of facial branchiomotor neurons in mice. J. Neurosci. 30, 9392–401 (2010).
72. Sasselli, V. & Boesmans, W. Planar cell polarity genes control the connectivity of enteric neurons. J. Clin. Invest. 123, (2013).
73. Hoogerwerf, W. a. et al. Clock Gene Expression in the Murine Gastrointestinal Tract: Endogenous Rhythmicity and Effects of a Feeding Regimen. Gastroenterology 133, 1250–1260 (2007).
74. Hoogerwerf, W. a. Role of clock genes in gastrointestinal motility. Am. J. Physiol. Gastrointest. Liver Physiol. 299, G549–G555 (2010).
75. Knobloch, M. et al. Metabolic control of adult neural stem cell activity by Fasn-dependent lipogenesis. Nature 493, 226–230 (2012).
76. Hirst, C. S. et al. Ion Channel Expression in the Developing Enteric Nervous System. PLoS One 10, e0123436 (2015).
CHAPTER 5
152
SUPPLEMENTARY INFORMATION
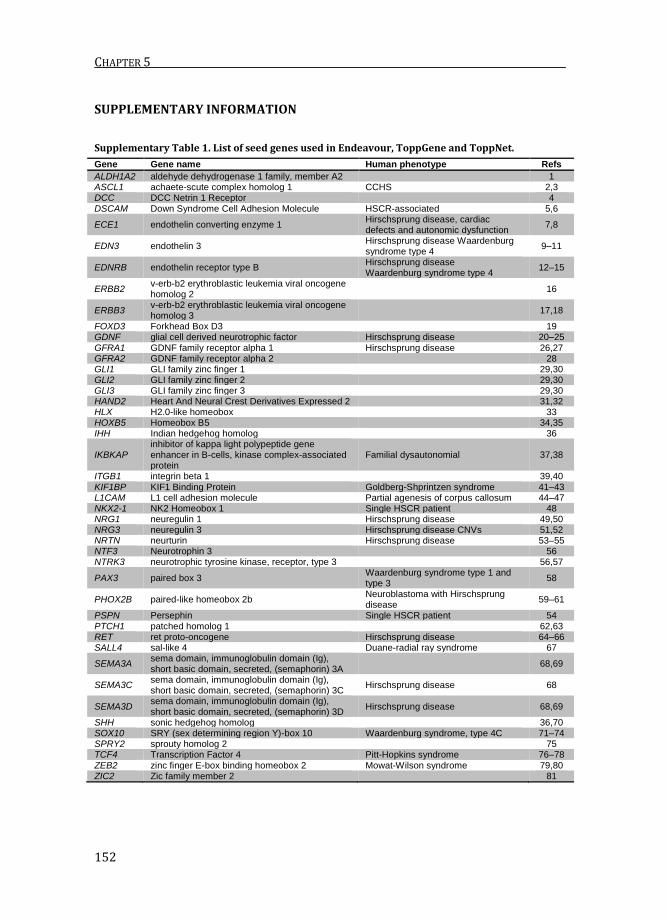
Supplementary Table 1. List of seed genes used in Endeavour, ToppGene and ToppNet.
Gene Gene name Human phenotype Refs
ALDH1A2 aldehyde dehydrogenase 1 family, member A2
1 ASCL1 achaete-scute complex homolog 1 CCHS 2,3 DCC DCC Netrin 1 Receptor
4
DSCAM Down Syndrome Cell Adhesion Molecule HSCR-associated 5,6
ECE1 endothelin converting enzyme 1 Hirschsprung disease, cardiac defects and autonomic dysfunction
7,8
EDN3 endothelin 3 Hirschsprung disease Waardenburg syndrome type 4
9–11
EDNRB endothelin receptor type B Hirschsprung disease Waardenburg syndrome type 4
12–15
ERBB2 v-erb-b2 erythroblastic leukemia viral oncogene homolog 2
16
ERBB3 v-erb-b2 erythroblastic leukemia viral oncogene homolog 3
17,18
FOXD3 Forkhead Box D3
19 GDNF glial cell derived neurotrophic factor Hirschsprung disease 20–25 GFRA1 GDNF family receptor alpha 1 Hirschsprung disease 26,27 GFRA2 GDNF family receptor alpha 2
28
GLI1 GLI family zinc finger 1
29,30 GLI2 GLI family zinc finger 2
29,30
GLI3 GLI family zinc finger 3
29,30 HAND2 Heart And Neural Crest Derivatives Expressed 2
31,32
HLX H2.0-like homeobox
33 HOXB5 Homeobox B5
34,35
IHH Indian hedgehog homolog
36
IKBKAP inhibitor of kappa light polypeptide gene enhancer in B-cells, kinase complex-associated protein
Familial dysautonomial 37,38
ITGB1 integrin beta 1
39,40 KIF1BP KIF1 Binding Protein Goldberg-Shprintzen syndrome 41–43 L1CAM L1 cell adhesion molecule Partial agenesis of corpus callosum 44–47 NKX2-1 NK2 Homeobox 1 Single HSCR patient 48 NRG1 neuregulin 1 Hirschsprung disease 49,50 NRG3 neuregulin 3 Hirschsprung disease CNVs 51,52 NRTN neurturin Hirschsprung disease 53–55 NTF3 Neurotrophin 3
56
NTRK3 neurotrophic tyrosine kinase, receptor, type 3
56,57
PAX3 paired box 3 Waardenburg syndrome type 1 and type 3
58
PHOX2B paired-like homeobox 2b Neuroblastoma with Hirschsprung disease
59–61
PSPN Persephin Single HSCR patient 54 PTCH1 patched homolog 1
62,63
RET ret proto-oncogene Hirschsprung disease 64–66 SALL4 sal-like 4 Duane-radial ray syndrome 67
SEMA3A sema domain, immunoglobulin domain (Ig), short basic domain, secreted, (semaphorin) 3A
68,69
SEMA3C sema domain, immunoglobulin domain (Ig), short basic domain, secreted, (semaphorin) 3C
Hirschsprung disease 68
SEMA3D sema domain, immunoglobulin domain (Ig), short basic domain, secreted, (semaphorin) 3D
Hirschsprung disease 68,69
SHH sonic hedgehog homolog
36,70 SOX10 SRY (sex determining region Y)-box 10 Waardenburg syndrome, type 4C 71–74 SPRY2 sprouty homolog 2
75
TCF4 Transcription Factor 4 Pitt-Hopkins syndrome 76–78 ZEB2 zinc finger E-box binding homeobox 2 Mowat-Wilson syndrome 79,80 ZIC2 Zic family member 2
81

COMBINED STRATEGIES TO IDENTIFY GENES FOR RARE COMPLEX DISEASES; HSCR AS A MODEL
153
5
1. Niederreither, K. et al. The regional pattern of retinoic acid synthesis by RALDH2 is essential for the development of posterior pharyngeal arches and the enteric nervous system. Development 130, 2525–34 (2003).
2. de Pontual, L. et al. Noradrenergic neuronal development is impaired by mutation of the proneural HASH-1 gene in congenital central hypoventilation syndrome (Ondine’s curse). Hum. Mol. Genet. 12, 3173–80 (2003).
3. Guillemot, F. et al. Mammalian achaete-scute homolog 1 is required for the early development of olfactory and autonomic neurons. Cell 75, 463–76 (1993).
4. Jiang, Y., Liu, M. T. & Gershon, M. D. Netrins and DCC in the guidance of migrating neural crest-derived cells in the developing bowel and pancreas. Dev. Biol. 258, 364–384 (2003).
5. Jannot, A. S. et al. Chromosome 21 Scan in Down Syndrome Reveals DSCAM as a Predisposing Locus in Hirschsprung Disease. PLoS One 8, 1–8 (2013).
6. Yamakawa, K. et al. DSCAM: a novel member of the immunoglobulin superfamily maps in a Down syndrome region and is involved in the development of the nervous system. Hum. Mol. Genet. 7, 227–37 (1998).
7. Hofstra, R. M. et al. A loss-of-function mutation in the endothelin-converting enzyme 1 (ECE-1) associated with Hirschsprung disease, cardiac defects, and autonomic dysfunction. Am. J. Hum. Genet. 64, 304–8 (1999).
8. Yanagisawa, H. et al. Dual genetic pathways of endothelin-mediated intercellular signaling revealed by targeted disruption of endothelin converting enzyme-1 gene. Development 125, 825–836 (1998).
9. Edery, P. et al. Mutation of the endothelin-3 gene in the Waardenburg-Hirschsprung disease (Shah-Waardenburg syndrome). Nat. Genet. 12, 442–4 (1996).
10. Hofstra, R. M. et al. A homozygous mutation in the endothelin-3 gene associated with a combined Waardenburg type 2 and Hirschsprung phenotype (Shah-Waardenburg syndrome). Nat. Genet. 12, 445–7 (1996).
11. Baynash, A. G. et al. Interaction of endothelin-3 with endothelin-B receptor is essential for development of epidermal melanocytes and enteric neurons. Cell 79, 1277–1285 (1994).
12. Puffenberger, E. G. et al. A missense mutation of the endothelin-B receptor gene in multigenic hirschsprung’s disease. Cell 79, 1257–1266 (1994).
13. Amiel, J. Heterozygous endothelin receptor B (EDNRB) mutations in isolated Hirschsprung disease. Hum. Mol. Genet. 5, 355–357 (1996).
14. Auricchio, A. Endothelin-B receptor mutations in patients with isolated Hirschsprung disease from a non-inbred population. Hum. Mol. Genet. 5, 351–354 (1996).
15. Hosoda, K. et al. Targeted and natural (piebald-lethal) mutations of endothelin-B receptor gene produce megacolon associated with spotted coat color in mice. Cell 79, 1267–1276 (1994).
16. Crone, S. A., Negro, A., Trumpp, A., Giovannini, M. & Lee, K.-F. Colonic Epithelial Expression of ErbB2 Is Required for Postnatal Maintenance of the Enteric Nervous System. Neuron 37, 29–40 (2003).
17. Riethmacher, D. et al. Severe neuropathies in mice with targeted mutations in the ErbB3 receptor. Nature 389, 725–730 (1997).
18. Chalazonitis, A., D’Autréaux, F., Pham, T. D., Kessler, J. a & Gershon, M. D. Bone morphogenetic proteins regulate enteric gliogenesis by modulating ErbB3 signaling. Dev. Biol. 350, 64–79 (2011).
19. Teng, L., Mundell, N. a, Frist, A. Y., Wang, Q. & Labosky, P. a. Requirement for Foxd3 in the maintenance of neural crest progenitors. Development 135, 1615–1624 (2008).
20. Angrist, M., Bolk, S., Halushka, M., Lapchak, P. A. & Chakravarti, A. Germline mutations in glial cell line-derived neurotrophic factor (GDNF) and RET in a Hirschsprung disease patient. Nat. Genet. 14, 341–344 (1996).
21. Ivanchuk, S. M., Myers, S. M., Eng, C. & Mulligan, L. M. De novo mutation of GDNF, ligand for the RET/GDNFR-alpha receptor complex, in Hirschsprung disease. Hum. Mol. Genet. 5, 2023–2026 (1996).
22. Hofstra, R. M. et al. RET and GDNF gene scanning in Hirschsprung patients using two dual denaturing gel systems. Hum. Mutat. 15, 418–29 (2000).
23. Pichel, J. G. et al. Defects in enteric innervation and kidney development in mice lacking GDNF. Nature 382, 73–76 (1996).
24. Sánchez, M. P. et al. Renal agenesis and the absence of enteric neurons in mice lacking GDNF.
CHAPTER 5
154
Nature 382, 70–73 (1996). 25. Moore, M. W. et al. Renal and neuronal abnormalities in mice lacking GDNF. Nature 382, 76–
79 (1996). 26. Borrego, S. et al. Investigation of germline GFRA4 mutations and evaluation of the involvement
of GFRA1, GFRA2, GFRA3, and GFRA4 sequence variants in Hirschsprung disease. J. Med. Genet. 40, e18 (2003).
27. Enomoto, H. et al. GFR alpha1-deficient mice have deficits in the enteric nervous system and kidneys. Neuron 21, 317–324 (1998).
28. Rossi, J. et al. Alimentary tract innervation deficits and dysfunction in mice lacking GDNF family receptor α2. J. Clin. Invest. 112, 707–716 (2003).
29. Liu, J. A.-J. et al. Identification of GLI Mutations in Patients With Hirschsprung Disease That Disrupt Enteric Nervous System Development in Mice. Gastroenterology (2015). doi:10.1053/j.gastro.2015.07.060
30. Yang, J. T. et al. Expression of human GLI in mice results in failure to thrive, early death, and patchy Hirschsprung-like gastrointestinal dilatation. Mol. Med. 3, 826–35 (1997).
31. Hendershot, T. J. et al. Expression of Hand2 is sufficient for neurogenesis and cell type-specific gene expression in the enteric nervous system. Dev. Dyn. 236, 93–105 (2007).
32. Lei, J. & Howard, M. J. Targeted deletion of Hand2 in enteric neural precursor cells affects its functions in neurogenesis, neurotransmitter specification and gangliogenesis, causing functional aganglionosis. Development 138, 4789–4800 (2011).
33. Bates, M. D., Dunagan, D. T., Welch, L. C., Kaul, A. & Harvey, R. P. The Hlx homeobox transcription factor is required early in enteric nervous system development. BMC Dev. Biol. 6, 33 (2006).
34. Carter, T. C. et al. Hirschsprung’s disease and variants in genes that regulate enteric neural crest cell proliferation, migration and differentiation. J. Hum. Genet. 57, 485–93 (2012).
35. Lui, V. C. H. et al. Perturbation of hoxb5 signaling in vagal neural crests down-regulates ret leading to intestinal hypoganglionosis in mice. Gastroenterology 134, 1104–15 (2008).
36. Ramalho-Santos, M., Melton, D. A. & McMahon, A. P. Hedgehog signals regulate multiple aspects of gastrointestinal development. Development 127, 2763–2772 (2000).
37. Tang, C. S. et al. Fine mapping of the 9q31 Hirschsprung’s disease locus. Hum. Genet. 127, 675–683 (2010).
38. Cheng, W. W.-C. et al. Depletion of the IKBKAP ortholog in zebrafish leads to hirschsprung disease-like phenotype. World J. Gastroenterol. 21, 2040–6 (2015).
39. Breau, M. A. et al. Lack of beta1 integrins in enteric neural crest cells leads to a Hirschsprung-like phenotype. Development 133, 1725–1734 (2006).
40. Breau, M. A., Dahmani, A., Broders-Bondon, F., Thiery, J.-P. & Dufour, S. Beta1 integrins are required for the invasion of the caecum and proximal hindgut by enteric neural crest cells. Development 136, 2791–801 (2009).
41. Brooks, A. S. et al. Homozygous nonsense mutations in KIAA1279 are associated with malformations of the central and enteric nervous systems. Am. J. Hum. Genet. 77, 120–6 (2005).
42. Drévillon, L. et al. KBP-cytoskeleton interactions underlie developmental anomalies in Goldberg-Shprintzen syndrome. Hum. Mol. Genet. 22, 2387–99 (2013).
43. Dafsari, H. S. et al. Goldberg-Shprintzen megacolon syndrome with associated sensory motor axonal neuropathy. Am. J. Med. Genet. A 167, 1300–4 (2015).
44. Okamoto, N., Wada, Y. & Goto, M. Hydrocephalus and Hirschsprung’s disease in a patient with a mutation of L1CAM. J. Med. Genet. 34, 670–671 (1997).
45. Parisi, M. A. et al. Hydrocephalus and intestinal aganglionosis: is L1CAM a modifier gene in Hirschsprung disease? Am. J. Med. Genet. 108, 51–6 (2002).
46. Okamoto, N. et al. Hydrocephalus and Hirschsprung’s disease with a mutation of L1CAM. J. Hum. Genet. 49, 334–7 (2004).
47. Jackson, S.-R. et al. L1CAM mutation in association with X-linked hydrocephalus and Hirschsprung’s disease. Pediatr. Surg. Int. 25, 823–5 (2009).
48. Garcia-Barcelo, M. et al. TTF-1 and RET promoter SNPs: regulation of RET transcription in Hirschsprung’s disease. Hum. Mol. Genet. 14, 191–204 (2005).
49. Garcia-Barcelo, M.-M. et al. Genome-wide association study identifies NRG1 as a susceptibility locus for Hirschsprung’s disease. Proc. Natl. Acad. Sci. U. S. A. 106, 2694–9 (2009).
50. Luzón-Toro, B. et al. Comprehensive Analysis of NRG1 Common and Rare Variants in

COMBINED STRATEGIES TO IDENTIFY GENES FOR RARE COMPLEX DISEASES; HSCR AS A MODEL
155
5
Hirschsprung Patients. PLoS One 7, e36524 (2012). 51. Tang, C. S.-M. et al. Genome-wide copy number analysis uncovers a new HSCR gene: NRG3.
PLoS Genet. 8, e1002687 (2012). 52. Yang, J. et al. Exome sequencing identified NRG3 as a novel susceptible gene of Hirschsprung’s
disease in a Chinese population. Mol. Neurobiol. 47, 957–66 (2013). 53. Doray, B. et al. Mutation of the RET ligand, neurturin, supports multigenic inheritance in
Hirschsprung disease. Hum. Mol. Genet. 7, 1449–1452 (1998). 54. Ruiz-Ferrer, M. et al. Novel mutations at RET ligand genes preventing receptor activation are
associated to Hirschsprung’s disease. J. Mol. Med. (Berl). 89, 471–80 (2011). 55. Heuckeroth, R. O. et al. Gene targeting reveals a critical role for neurturin in the development
and maintenance of enteric, sensory, and parasympathetic neurons. Neuron 22, 253–63 (1999).
56. Chalazonitis, A. et al. Neurotrophin-3 is required for the survival-differentiation of subsets of developing enteric neurons. J. Neurosci. 21, 5620–5636 (2001).
57. Fernández, R. M. et al. A novel point variant in NTRK3, R645C, suggests a role of this gene in the pathogenesis of Hirschsprung disease. Ann. Hum. Genet. 73, 19–25 (2009).
58. Lang, D. et al. Pax3 is required for enteric ganglia formation and functions with Sox10 to modulate expression of c-ret. J. Clin. Invest. 106, 963–71 (2000).
59. Amiel, J. et al. Polyalanine expansion and frameshift mutations of the paired-like homeobox gene PHOX2B in congenital central hypoventilation syndrome. Nat. Genet. 33, 459–61 (2003).
60. Garcia-Barceló, M. et al. Association study of PHOX2B as a candidate gene for Hirschsprung’s disease. Gut 52, 563–7 (2003).
61. Pattyn, A., Morin, X., Cremer, H., Goridis, C. & Brunet, J. F. The homeobox gene Phox2b is essential for the development of autonomic neural crest derivatives. Nature 399, 366–70 (1999).
62. Ngan, E. S.-W. et al. Hedgehog/Notch-induced premature gliogenesis represents a new disease mechanism for Hirschsprung disease in mice and humans. J. Clin. Invest. 121, 3467–78 (2011).
63. Wang, Y. et al. Common Genetic Variations in Patched1 (PTCH1) Gene and Risk of Hirschsprung Disease in the Han Chinese Population. PLoS One 8, 1–8 (2013).
64. Edery, P. et al. Mutations of the RET proto-oncogene in Hirschsprung’s disease. Nature 367, 378–380 (1994).
65. Romeo, G. et al. Point mutations affecting the tyrosine kinase domain of the RET proto-oncogene in Hirschsprung’s disease. Nature 367, 377–378 (1994).
66. Schuchardt, A., D’Agati, V., Larsson-Blomberg, L., Costantini, F. & Pachnis, V. Defects in the kidney and enteric nervous system of mice lacking the tyrosine kinase receptor Ret. Nature 367, 380–383 (1994).
67. Warren, M. et al. A Sall4 mutant mouse model useful for studying the role of Sall4 in early embryonic development and organogenesis. Genesis 45, 51–58 (2007).
68. Jiang, Q. et al. Functional loss of semaphorin 3C and/or semaphorin 3D and their epistatic interaction with ret are critical to Hirschsprung disease liability. Am. J. Hum. Genet. 96, 581–96 (2015).
69. Luzón-Toro, B. et al. Mutational spectrum of semaphorin 3A and semaphorin 3D genes in Spanish Hirschsprung patients. PLoS One 8, e54800 (2013).
70. Fu, M. Sonic hedgehog regulates the proliferation, differentiation, and migration of enteric neural crest cells in gut. J. Cell Biol. 166, 673–684 (2004).
71. Pingault, V. et al. SOX10 mutations in patients with Waardenburg-Hirschsprung disease. Nat. Genet. 18, 171–173 (1998).
72. Touraine, R. L. et al. Neurological phenotype in Waardenburg syndrome type 4 correlates with novel SOX10 truncating mutations and expression in developing brain. Am. J. Hum. Genet. 66, 1496–503 (2000).
73. Sánchez-Mejías, A. et al. Involvement of SOX10 in the pathogenesis of Hirschsprung disease: report of a truncating mutation in an isolated patient. J. Mol. Med. (Berl). 88, 507–14 (2010).
74. Southard-Smith, E. M., Kos, L. & Pavan, W. J. Sox10 mutation disrupts neural crest development in Dom Hirschsprung mouse model. Nat. Genet. 18, 60–64 (1998).
75. Taketomi, T. et al. Loss of mammalian Sprouty2 leads to enteric neuronal hyperplasia and esophageal achalasia. Nat. Neurosci. 8, 855–7 (2005).
76. Amiel, J. et al. Mutations in TCF4, encoding a class I basic helix-loop-helix transcription factor, are responsible for Pitt-Hopkins syndrome, a severe epileptic encephalopathy associated with

CHAPTER 5
156
autonomic dysfunction. Am. J. Hum. Genet. 80, 988–993 (2007). 77. Zweier, C. et al. Haploinsufficiency of TCF4 causes syndromal mental retardation with
intermittent hyperventilation (Pitt-Hopkins syndrome). Am. J. Hum. Genet. 80, 994–1001 (2007).
78. Peippo, M. M. et al. Pitt-Hopkins syndrome in two patients and further definition of the phenotype. Clin. Dysmorphol. 15, 47–54 (2006).
79. Wakamatsu, N. et al. Mutations in SIP1, encoding Smad interacting protein-1, cause a form of Hirschsprung disease. Nat. Genet. 27, 369–70 (2001).
80. Van de Putte, T. et al. Mice lacking ZFHX1B, the gene that codes for Smad-interacting protein-1, reveal a role for multiple neural crest cell defects in the etiology of Hirschsprung disease-mental retardation syndrome. Am. J. Hum. Genet. 72, 465–70 (2003).
81. Zhang, Y. & Niswander, L. Zic2 is required for enteric nervous system development and neurite outgrowth: a mouse model of enteric hyperplasia and dysplasia. Neurogastroenterol. Motil. 25, 538–41 (2013).