unit 2 polynomial and rational functions. do now given the following function, find
TRANSCRIPT

Unit 2
Polynomial and Rational Functions

Do NowGiven the following function,
find
f (x) 2x 2 5x 2
f ( 2) f (0) f (2)
Unit 2 Lesson 1
2.1 Quadratic Functions2.2 Polynomial Functions

Lesson ObjectivesIn this lesson presentation, you will learn how to: define, sketch & analyze graphs of quadratic & polynomial functions.
define and identify the vertex, minimum and maximum values of a quadratic& polynomial functions.
use the LEADING COEFFICENT TEST to determine how a polynomial function rises or falls.
identify the zeros of both of quadratic & polynomial functions.
use the Intermediate Value Theorem to help identify the real zeros of a polynomial function.

2.1 Quadratic Functions
a, b, and c are real numbers where a0
f (x) ax 2 bx cWhen graphed called a Parabola

Axis of Symmetry – all parabolas are symmetric (line where it’s cut in half)
Vertex – axis intersects the parabola
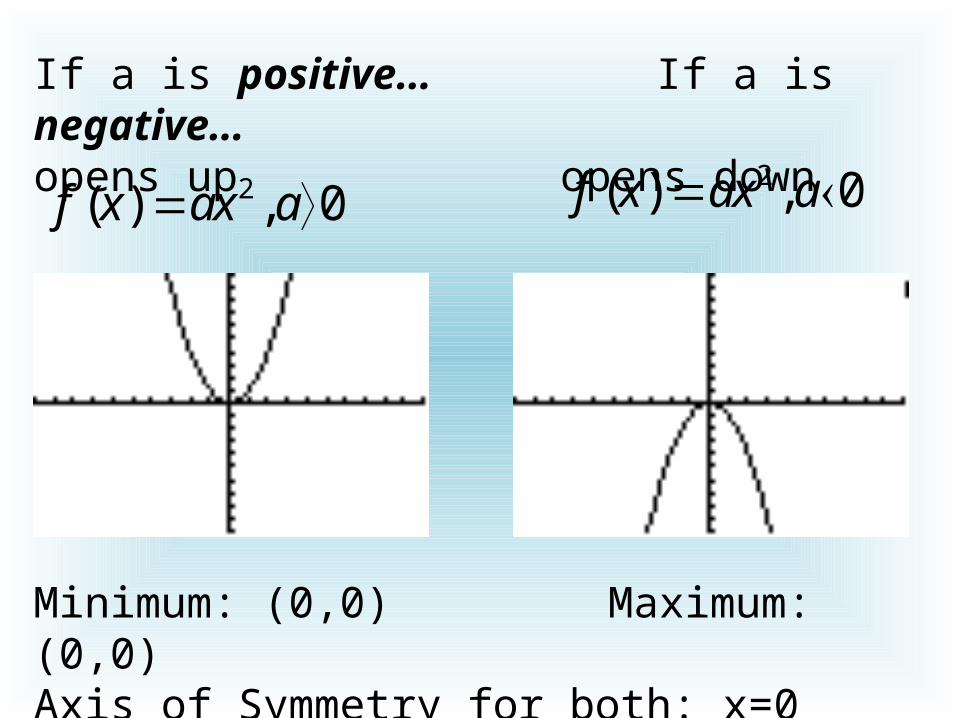
If a is positive… If a is negative…opens upopens down
2( ) , 0f x ax a 2( ) , 0f x ax a
Minimum: (0,0)Maximum: (0,0)Axis of Symmetry for both: x=0

f (x) ax 2 bx c
If a is positive…opens up If a is negative…opens down
Vertex is lowest point. Vertex is highest point.
Axis of symmetry
2( ) 2 2 1f x x x 2( )f x x
2( ) , 0f x ax bx c a 2( ) , 0f x ax bx c a
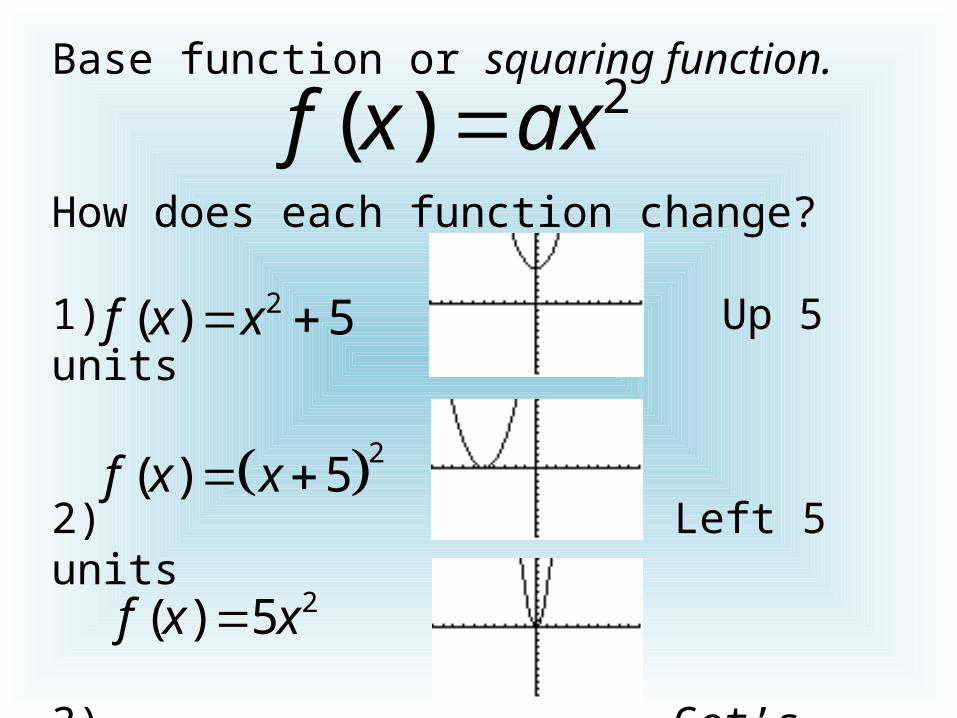
f (x) ax2Base function or squaring function.
How does each function change?
1)Up 5 units
2) Left 5 units
3) Get’s skinny
2( ) 5f x x
2( ) 5f x x
2( ) 5f x x

Summarize: How do they change?
If c>0, then move up. If c<0, then move down.
If (x+#), then move left. If (x-#), then move right.
If “a” is integer, then get skinny.
If “a” is fraction, then get wide.
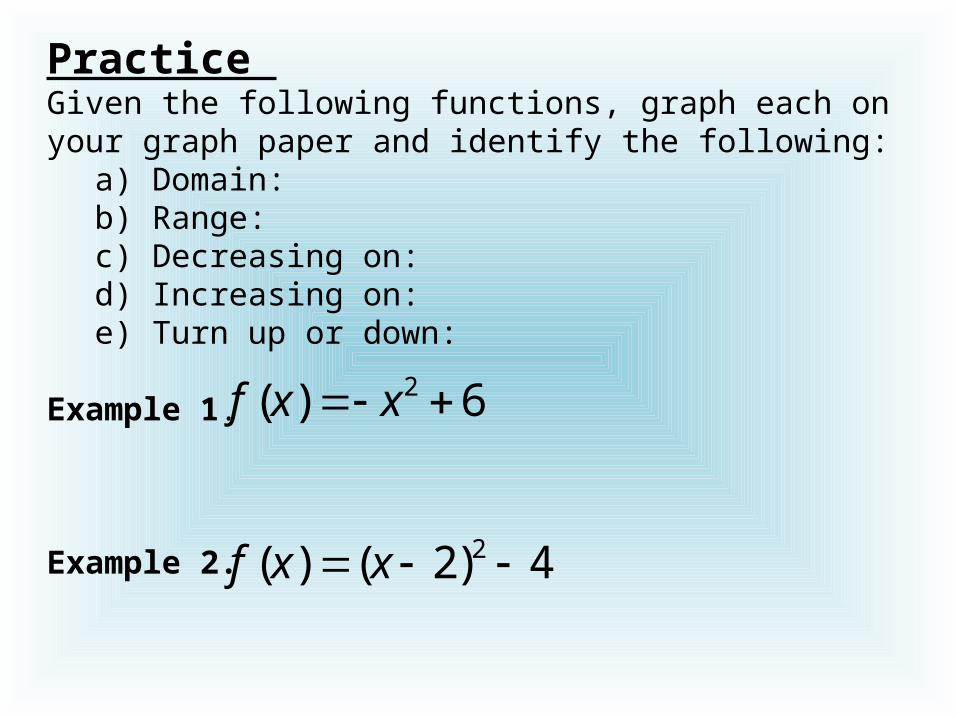
Practice Given the following functions, graph each on your graph paper and identify the following:
a) Domain:b) Range:c) Decreasing on:d) Increasing on:e) Turn up or down:
Example 1.
Example 2.
2( ) 6f x x
2( ) ( 2) 4f x x
Practice Given the following function, identify the following:
Domain:
Range:
Decreasing on:
Increasing on:
Turn up or down:

Standard Form of a Quadratic
Vertex is (h, k) and a0
2( ) ( )f x a x h k
Axis is the vertical line x = h
If a < 0, then the parabola opens down
If a > 0, then the parabola opens up

Identify the vertex of a Quadratic Given a function
Write the function in Standard Form by completing the square to find the vertex.
Example 1.*Factor out the 2
*b=4, add &
subtract (4/2)2 =4
*Regroup terms
*Write in
Standard Form.
2( ) 2 8 5f x x x
2( ) 2 8 5f x x x 22( 4 ) 5x x 22( 4 4 4) 5x x 22( 4 4) 2(4) 5x x
22( 2) 3x
The vertex is (-2,-3)
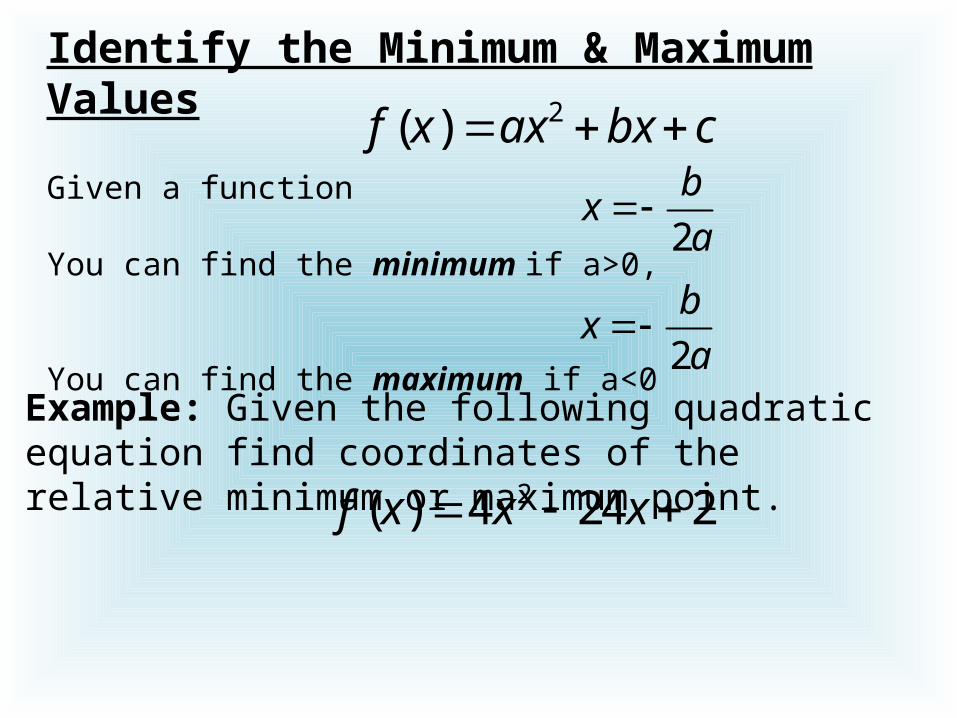
Identify the Minimum & Maximum Values Given a function
You can find the minimum if a>0,
You can find the maximum if a<0
f (x) ax 2 bx c
2
bx
a
2
bx
a
2( ) 4 24 2f x x x
Example: Given the following quadratic equation find coordinates of the relative minimum or maximum point.
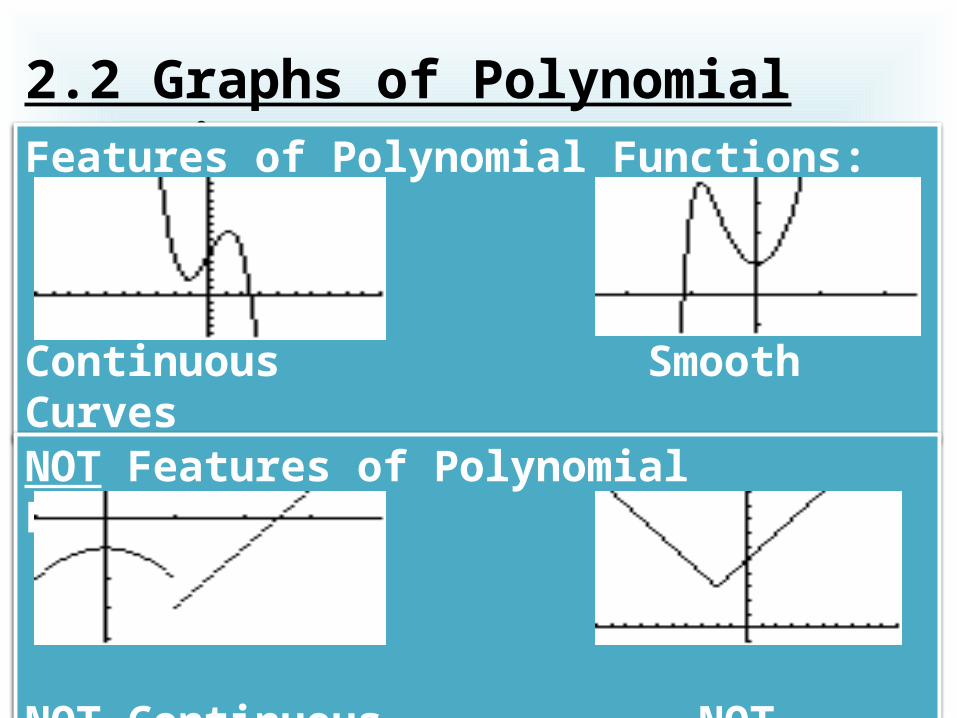
2.2 Graphs of Polynomial FunctionsFeatures of Polynomial Functions:
ContinuousSmooth Curves
NOT Features of Polynomial Functions:
NOT Continuous NOT Smooth

Functions with 1 degree are Linear.Functions with 2 degrees are Quadratic.Functions with 3rd or greater are Polynomial. 3( )f x x
Functions with an even degree will look like our quadratics. (e.g.)
Functions with an odd degree will look like our cubic. (e.g.)
2( )f x x
4( )f x x 8( )f x x
5( )f x x11( )f x x

A polynomial of the nth degree has the form:
n is a positive integer
The greater the value of n the flatter the graph near (0,0)
1 21 2 1 0( ) ...n n
n nf x a x a x a x a x a

The Leading Coefficient TestA functions ability to rise or fall can be determined by the functions degree (even or odd) and by it’s leading coefficient.
1 21 2 1 0( ) ...n n
n nf x a x a x a x a x a

When n is odd: When
When n is odd: When 0na
0na ( )f x
as
x
( )f x
as
x
( )f x
as
x
( )f x
as
x
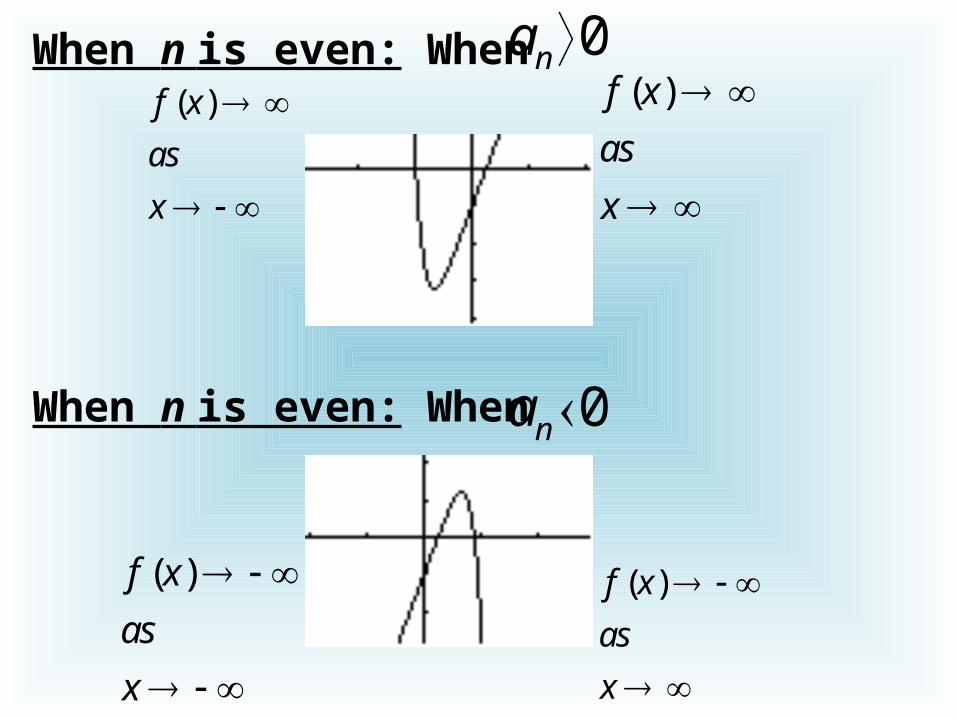
When n is even: When
When n is even: When 0na
0na ( )f x
as
x
( )f x
as
x
( )f x
as
x
( )f x
as
x
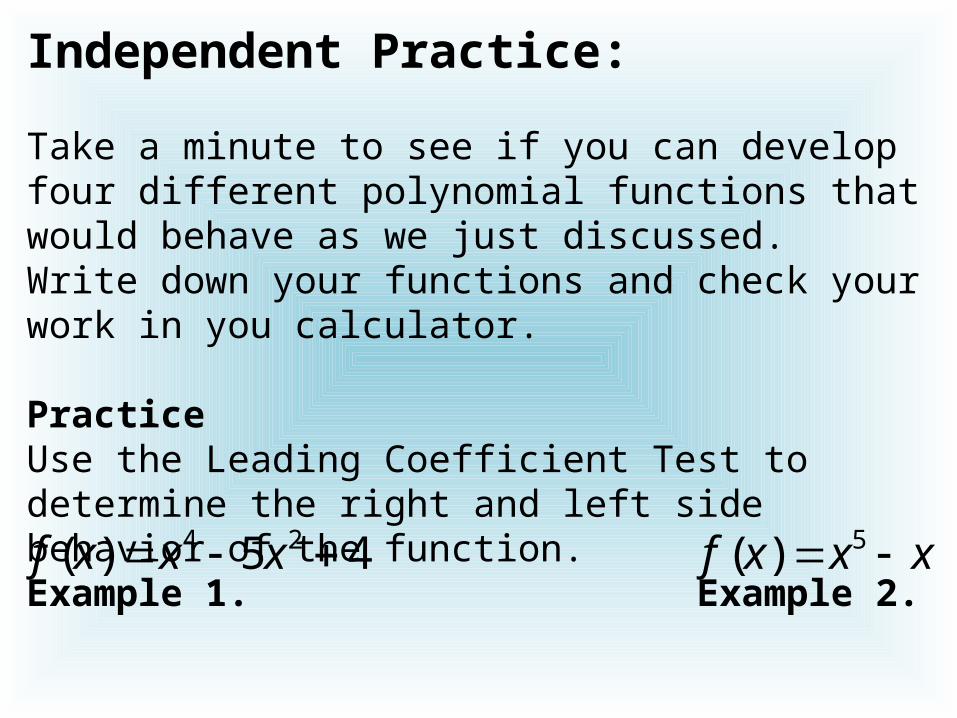
Independent Practice:
Take a minute to see if you can develop four different polynomial functions that would behave as we just discussed. Write down your functions and check your work in you calculator.
PracticeUse the Leading Coefficient Test to determine the right and left side behavior of the function.Example 1.
Example 2.
4 2( ) 5 4f x x x 5( )f x x x
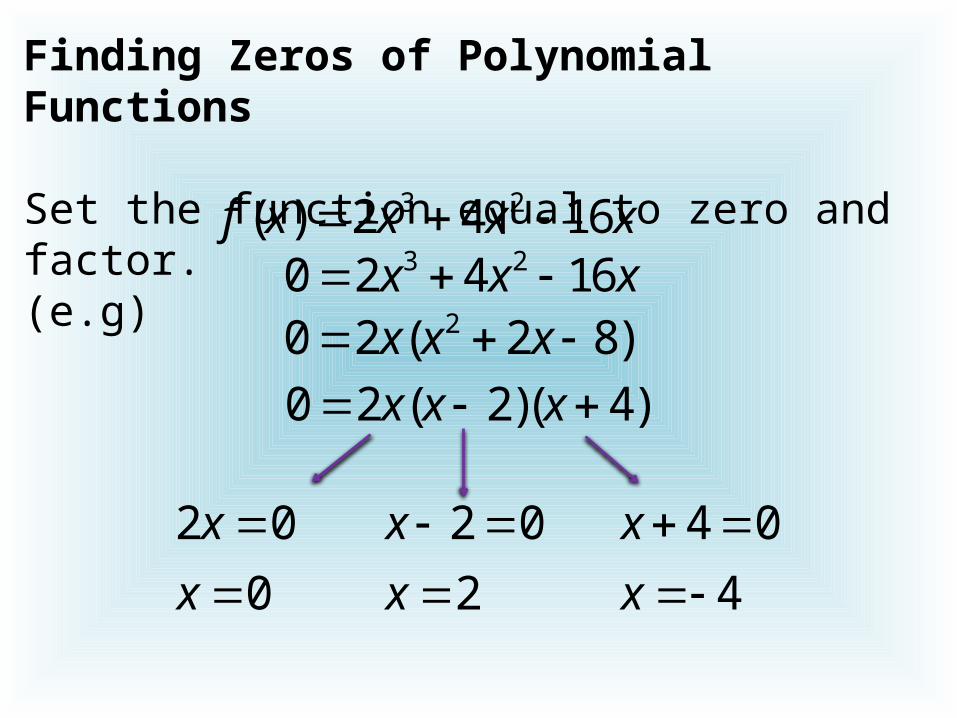
Finding Zeros of Polynomial Functions
Set the function equal to zero and factor.(e.g)
Check on the graphing calculator.
3 2( ) 2 4 16f x x x x
20 2 ( 2 8)x x x
3 20 2 4 16x x x
0 2 ( 2)( 4)x x x
2 0
0
x
x
2 0
2
x
x
4 0
4
x
x

2.3 Real Zeros of Polynomial Functions
Disclaimer:There are many ways for us to determine the zeros of a polynomial function. Please be patient and as the lesson progresses through the various topics the math should become easier for you!Topics will include:*Long Division of Polynomials*Synthetic Division*Remainder & Factor Theorems*Rational Zero Test*Descartes's Rule of Signs

Graph the function to identify a zero that is an integer.
Long Division of Polynomials3 2( ) 6 19 16 4f x x x x
You can see that x=2 is a zero, as a result (x-2) is a factor of the polynomial.
We will divide the entire function by (x-2).

3 22 (6 19 16 4)x x x x Divide!1) Multiply: 26 ( 2)x x
3 26 12x x
26x
27 16x x
2) Subtract.
3) Multiply:
4) Subtract.
5) Multiply:
6) Subtract.
7 ( 2)x x
7x
27 14x x
2 4x 2 4x
2( 2)x
2
0

3 2 26 19 16 4 ( 2)(6 7 2)x x x x x x Now we know that:
So we factor and solve for zero!20 ( 2)(6 7 2)
0 ( 2)(2 1)(3 2)
x x x
x x x
0 2
2
x
x
0 2 1
1
2
x
x
0 3 2
2
3
x
x
We have three x-intercepts at:
1 22, ,
2 3x x x
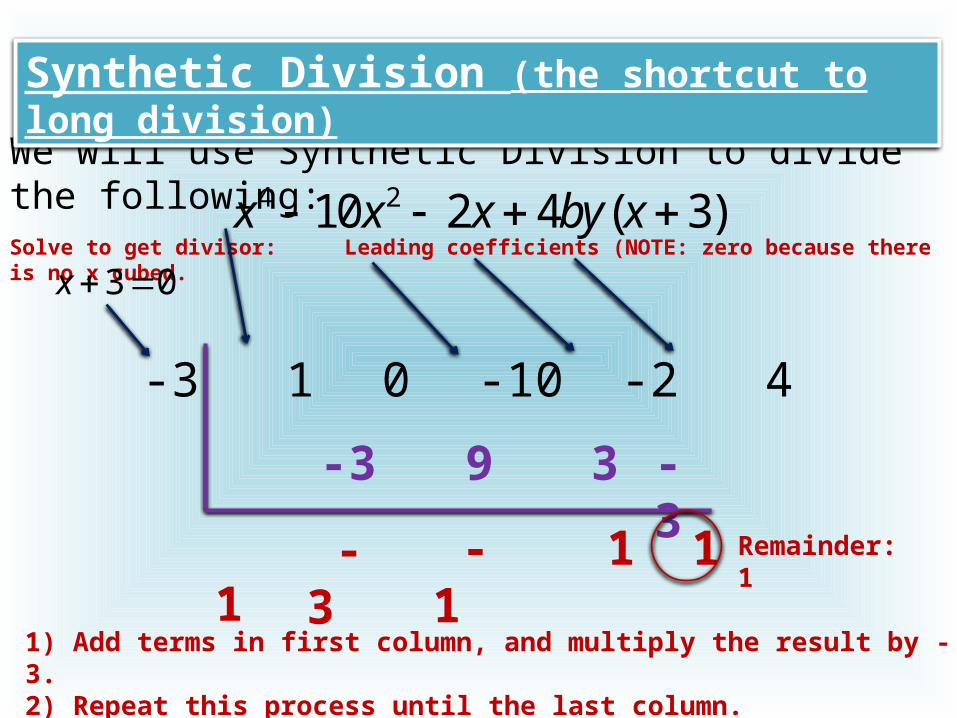
We will use Synthetic Division to divide the following:
Synthetic Division (the shortcut to long division)
4 210 2 4 ( 3)x x x by x
-3 1 0 -10-2 4
3 0x Solve to get divisor: Leading coefficients (NOTE: zero because there is no x cubed.
1) Add terms in first column, and multiply the result by -3.2) Repeat this process until the last column.
1 -3 -1 1 1
-3 9 3 -3
Remainder: 1
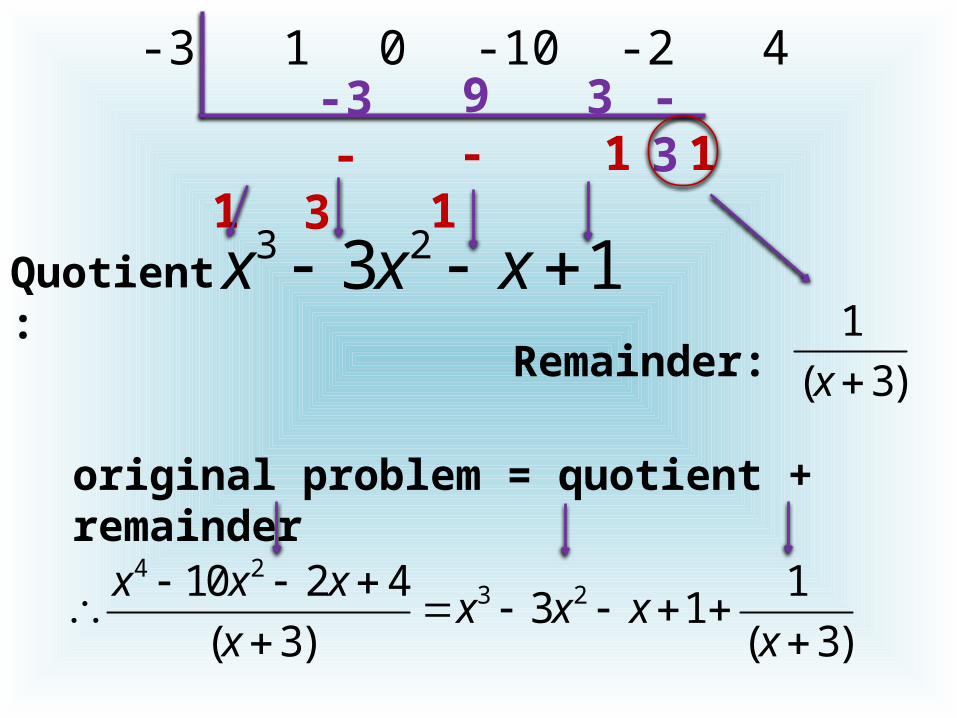
-3 1 0 -10-2 4
1 -3 -1 1 1-3 9 3 -
3
Quotient:3 23 1x x x
Remainder:
1
( 3)x
4 23 210 2 4 13 1
( 3) ( 3)
x x xx x x
x x
original problem = quotient + remainder

The Remainder Theorem (the remainder from synthetic
division):
If a polynomial is divided by x-k,
the remainder is .
Remainder & Factor Theorems
( )f x( )r f k
Practice 1. Use the Remainder Theorem to evaluate the given function at x = -2.
3 2( ) 3 8 5 7f x x x x
Start by doing synthetic division!

-2 3 8 5-7
3 2 1 -9-6 -
4-2
Remainder is -9, .( 2) 9f (-2,-9) is a point on the graph of our polynomial.
Check by substituting in -2 into our original function.

If the polynomial
has integer coefficients, every rational zero of f has the form:
Rational Zero
Rational Zero Test
1 21 2 1 0( ) ...n n
n nf x a x a x a x a x a
p
q
p: factor of constant term
q: factor of leading coefficient
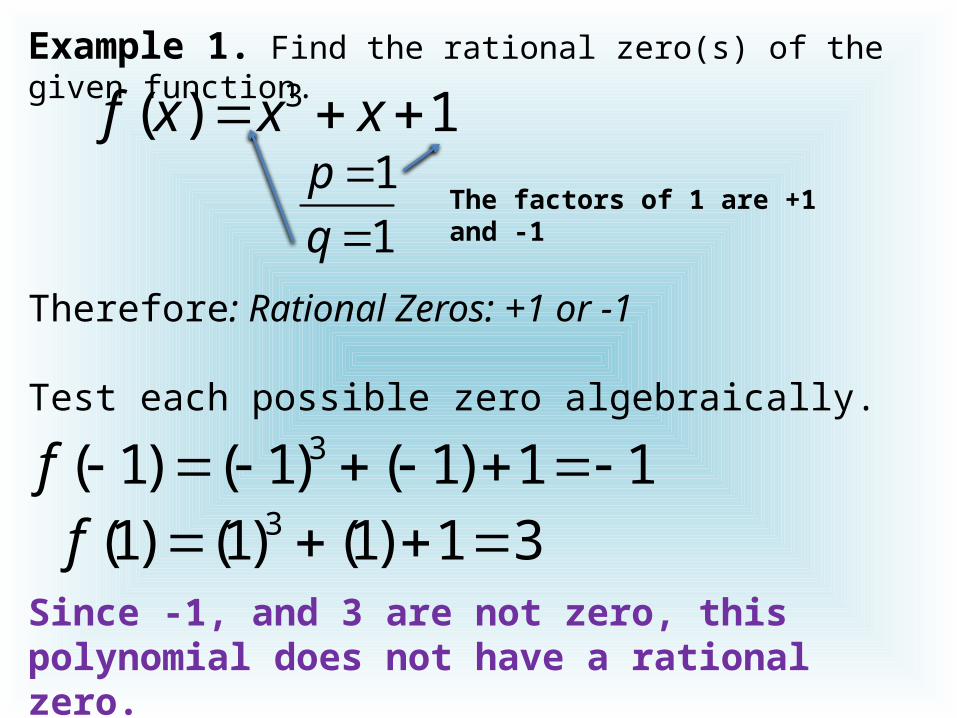
Example 1. Find the rational zero(s) of the given function. 3( ) 1f x x x
Therefore: Rational Zeros: +1 or -1
1
1
p
q
The factors of 1 are +1 and -1
Test each possible zero algebraically.3( 1) ( 1) ( 1) 1 1f
3(1) (1) (1) 1 3f Since -1, and 3 are not zero, this polynomial does not have a rational zero.
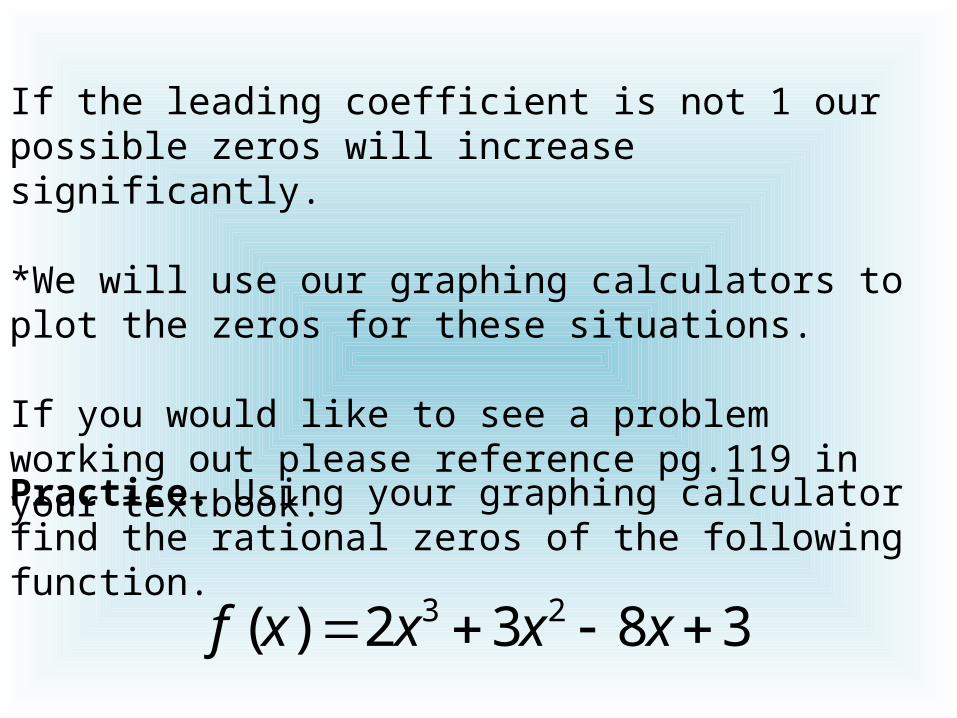
If the leading coefficient is not 1 our possible zeros will increase significantly.
*We will use our graphing calculators to plot the zeros for these situations.
If you would like to see a problem working out please reference pg.119 in your textbook.
Practice. Using your graphing calculator find the rational zeros of the following function.
3 2( ) 2 3 8 3f x x x x

Variation in sign: Two consecutive (nonzero) coefficients have opposite signs.
Example: Do the given functions have a difference of signs?
3 2( ) 3 2 6 9f x x x x + to +
+ to +
+ to +
NO!!!
3 2( ) 7 8 6 5f x x x x + to -
+ to -
- to +
YES!!!
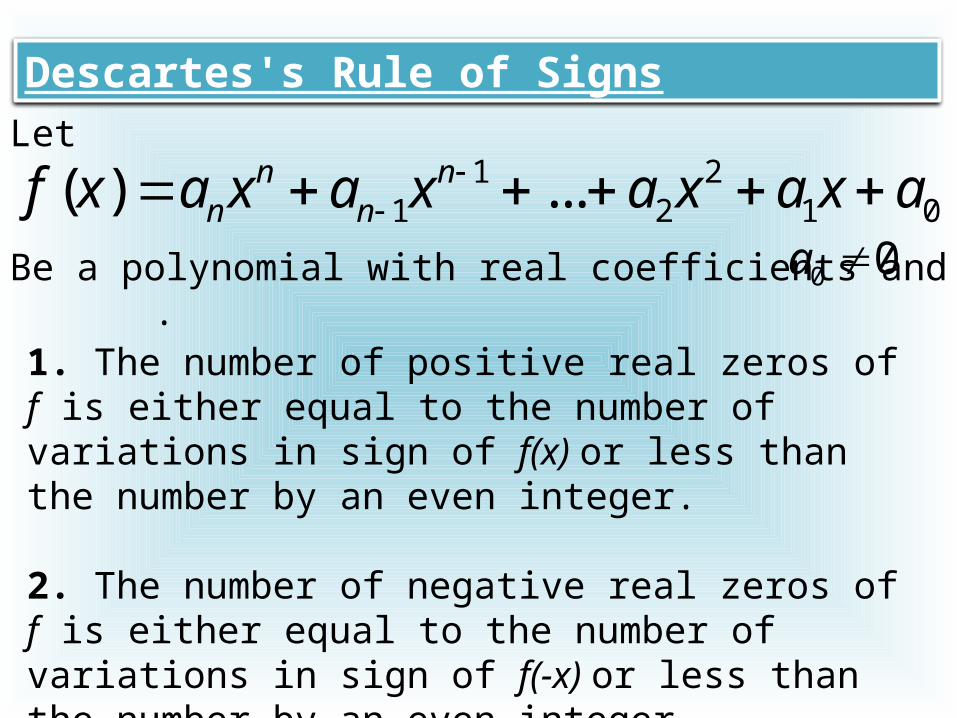
Let
Be a polynomial with real coefficients and .
Descartes's Rule of Signs
1 21 2 1 0( ) ...n n
n nf x a x a x a x a x a
0 0a
1. The number of positive real zeros of f is either equal to the number of variations in sign of f(x) or less than the number by an even integer.
2. The number of negative real zeros of f is either equal to the number of variations in sign of f(-x) or less than the number by an even integer.

Example. Describe the possible real zeros of the given function.
3 2( ) 7 8 6 5f x x x x + to -
+ to +
- to +
This polynomial has either two or no positive real zeros.
3 2( ) 7 8 6 5f x x x x - to - - to +
- to -
This one negative real zeros.

2.4 The Imaginary Unit i
If a and b are real numbers:
a + bi is a complex number in standard form
If b = 0, a +bi = a
If b ≠ 0, a +bi is an imaginary number
If b ≠ 0, bi is a pure imaginary number.
1i

Addition & Subtraction with Complex Numbers
Just like combining like terms in Algebra!
Example1: Solve / Simplify.
(5 - i) + (9 + 5i)
Example2: Solve / Simplify.
10 + (3 + 6i) - (-2 + 2i)
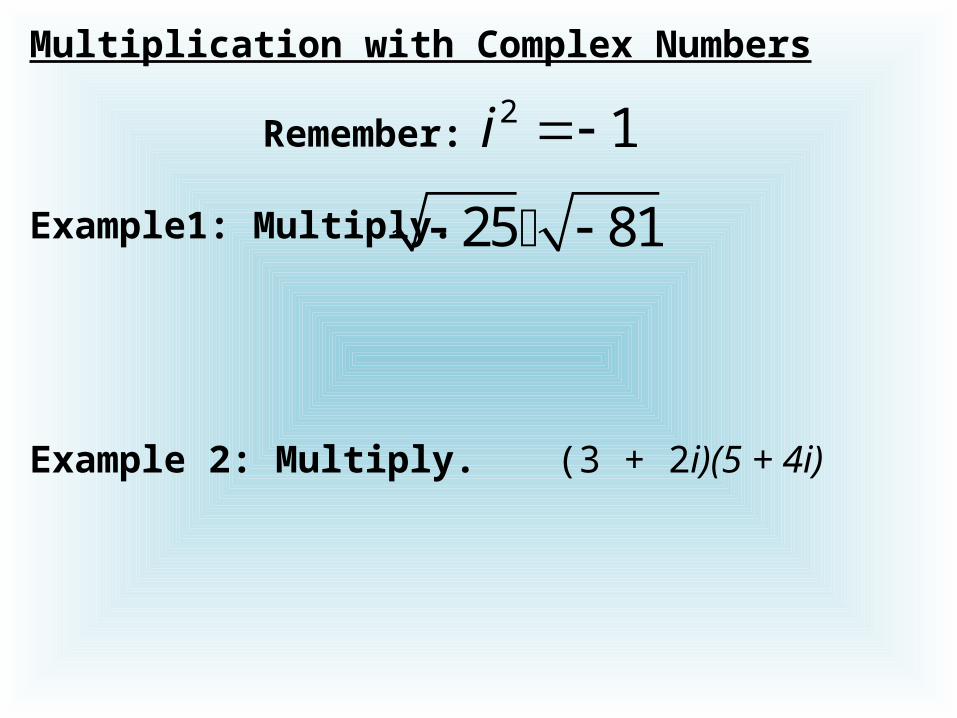
Multiplication with Complex Numbers
Remember: 2 1i
Example1: Multiply. 25 81
Example 2: Multiply. (3 + 2i)(5 + 4i)

Complex ConjugatesWhen two complex numbers are multiplied and their solution is a real number. (remember the difference of squares?)
Example of Complex Conjugates:
(5 + 2i)(5 – 2i)

Find the complex conjugate for the following complex number and multiply.
(7 - 4i)

Division with Complex Numbers
Example1: Write the following quotient in standard form.
(2 3 )
(4 2 )
i
i

2.5 The Fundamental Theorem of Algebra
The Fundamental Theorem of Algebra
If f(x) is a polynomial of degree n, where n > 0, the f has at least one zero in the complex number system.

Linear Factorization Theorem
If f(x) is a polynomial of degree n where n > 0, f has precisely n linear factors.
1 2( ) ( )( ) ( )n nf x a x c x c x c
Where are complex numbers.
1 2, , , nc c c
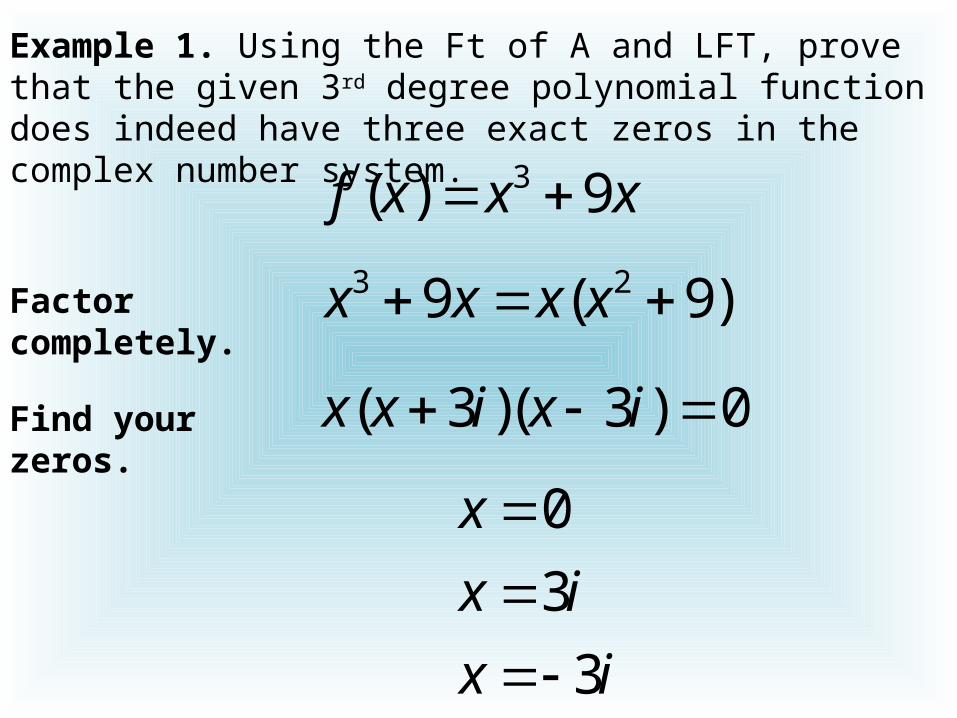
Example 1. Using the Ft of A and LFT, prove that the given 3rd degree polynomial function does indeed have three exact zeros in the complex number system. 3( ) 9f x x x
Factor completely.
3 29 ( 9)x x x x
( 3 )( 3 ) 0x x i x i Find your zeros.
0
3
3
x
x i
x i

Conjugate Pairs (think: difference of squares)
FACT:Complex zeros occur in conjugate pairs!(think about the last example!)
( ) ( )a bi and a bi
If is a zero of a function, then the conjugate is also a zero.a bi
a bi
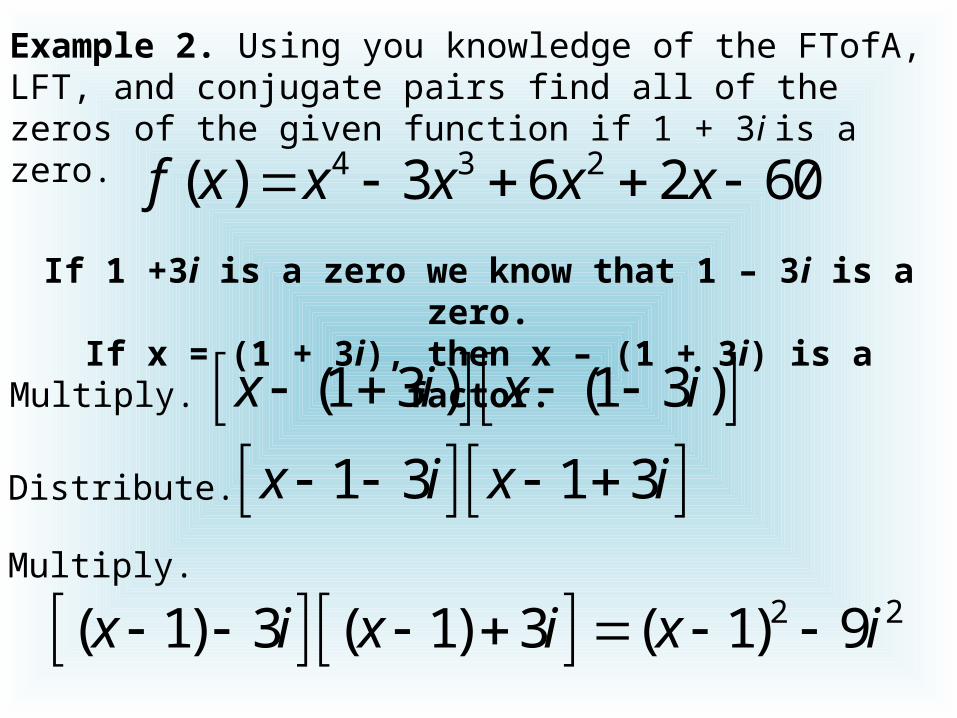
Example 2. Using you knowledge of the FTofA, LFT, and conjugate pairs find all of the zeros of the given function if 1 + 3i is a zero.
4 3 2( ) 3 6 2 60f x x x x x
(1 3 ) (1 3 )x i x i
If 1 +3i is a zero we know that 1 – 3i is a zero.If x = (1 + 3i), then x – (1 + 3i) is a factor.
Multiply.
1 3 1 3x i x i Distribute.
2 2( 1) 3 ( 1) 3 ( 1) 9x i x i x i Multiply.
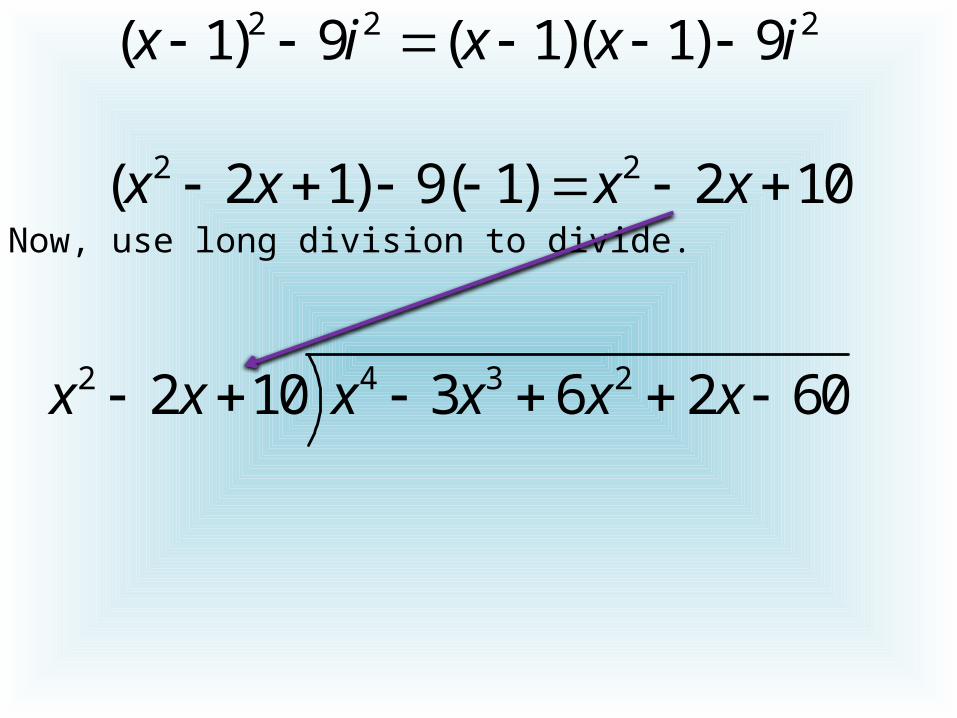
2 2 2( 1) 9 ( 1)( 1) 9x i x x i
Now, use long division to divide.
2 2( 2 1) 9( 1) 2 10x x x x
2 4 3 22 10 3 6 2 60x x x x x x
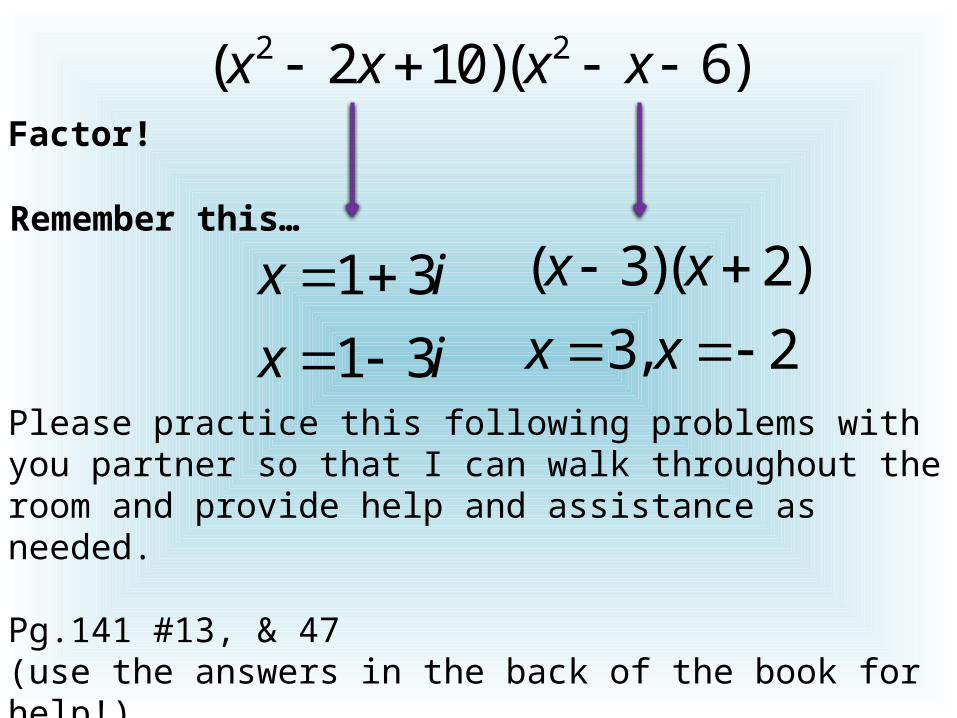
Factor!
2 2( 2 10)( 6)x x x x
( 3)( 2)
3, 2
x x
x x
1 3
1 3
x i
x i
Remember this…
Please practice this following problems with you partner so that I can walk throughout the room and provide help and assistance as needed.
Pg.141 #13, & 47 (use the answers in the back of the book for help!)

2.6 Rational Functions & AsymptotesRational Function
Remember: D(x) ≠ 0
( )( )
( )
N xf x
D x
As f(x) approaches D(x) = 0 the function will increase or decrease rapidly!

Reciprocal Function - most basic rational function.
1( )f x
x
We know that x ≠ 0, so…Use your calculator to complete the following chart as x gets closer to 0
x f(x)-1
-.5
-.1
-.01
-.001
→0
x f(x)1
.5
.1
.01
.001
→0
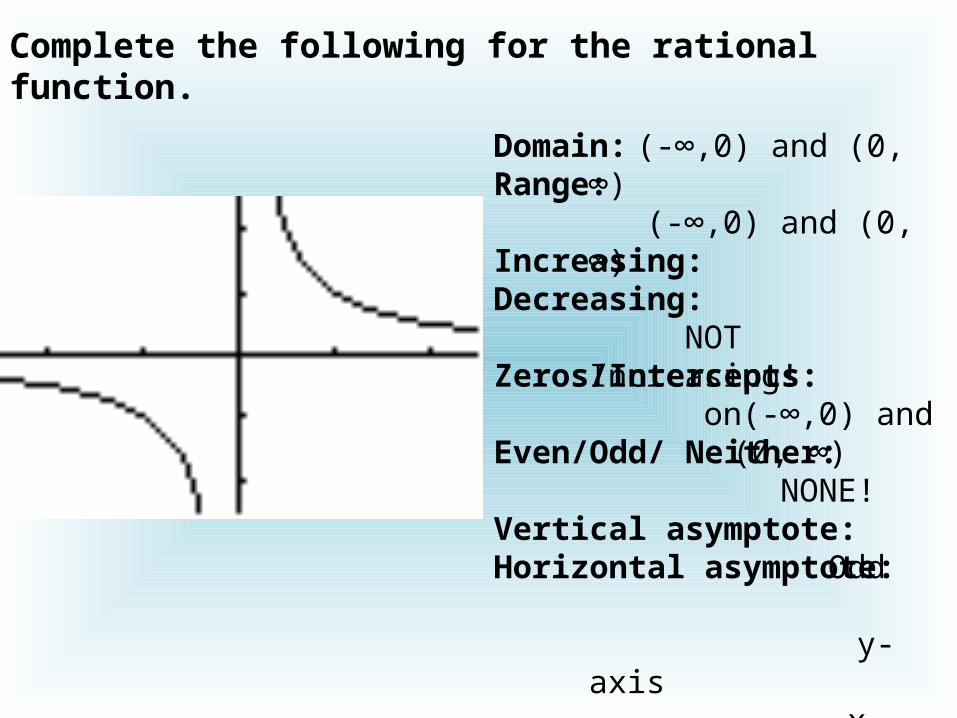
Complete the following for the rational function.
Domain:Range:
Increasing:Decreasing:
Zeros/Intercepts:
Even/Odd/ Neither:
Vertical asymptote:Horizontal asymptote:
(-∞,0) and (0, ∞) (-∞,0) and (0, ∞)
NOT Increasing!
on(-∞,0) and (0, ∞)
NONE!
Odd
y-axis
x-axis

Asymptotes
Vertical Asymptotes x = a (line)
If f(x) → a OR f(x) → -∞ as x → a (from the right or left)
Horizontal Asymptotes y = b (line)
If f(x) → b OR f(x) → -∞ as x → a

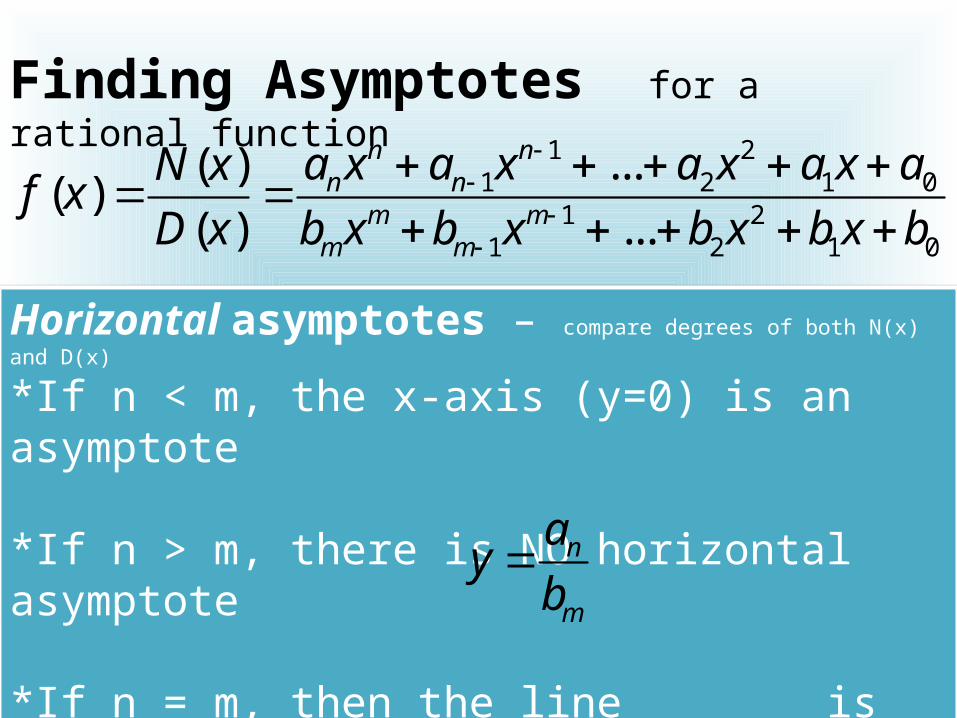
Finding Asymptotes for a rational function 1 2
1 2 1 01 2
1 2 1 0
...( )( )
( ) ...
n nn nm m
m m
a x a x a x a x aN xf x
D x b x b x b x b x b
Vertical asymptotes - at the zeros of D(x)
Finding Asymptotes for a rational function 1 2
1 2 1 01 2
1 2 1 0
...( )( )
( ) ...
n nn nm m
m m
a x a x a x a x aN xf x
D x b x b x b x b x b
Horizontal asymptotes – compare degrees of both N(x) and D(x)
*If n < m, the x-axis (y=0) is an asymptote
*If n > m, there is NO horizontal asymptote
*If n = m, then the line is an asymptote
(an and bm are leading coefficinets.)
n
m
ayb

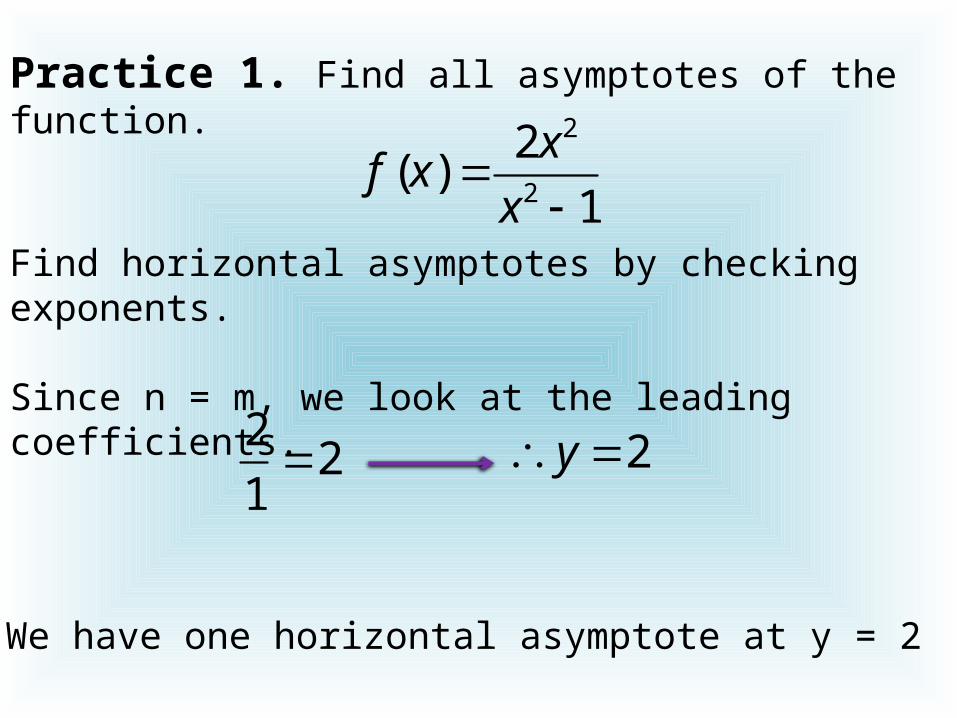
Practice 1. Find all asymptotes of the function.2
2
2( )
1
xf x
x
Find vertical asymptotes by setting denominator equal to zero. 2 1 0x
( 1)( 1) 0x x
We have two vertical asymptotes at x = -1 and x = 1
1x 1x
Practice 1. Find all asymptotes of the function.2
2
2( )
1
xf x
x
Find horizontal asymptotes by checking exponents.
Since n = m, we look at the leading coefficients.2
21
We have one horizontal asymptote at y = 2
2y

Practice 2. The following function will have two horizontal asymptotes.
10( ) , 0
2
xf x x
x
We have two horizontal asymptotes at
y = 1 for x values less than zero. y = -1 for x values greater than or equal to zero
10( )
2
xf x
x
11
1 1y
10( ) , 0
2
xf x x
x
1
11
1y
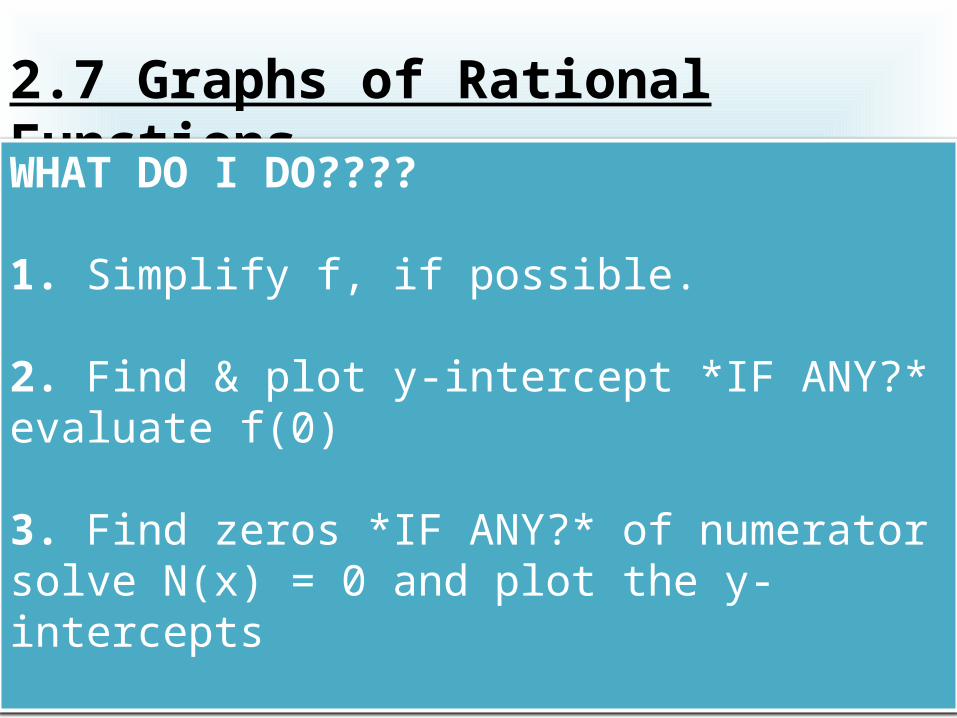
2.7 Graphs of Rational Functions WHAT DO I DO????
1. Simplify f, if possible.
2. Find & plot y-intercept *IF ANY?*evaluate f(0)
3. Find zeros *IF ANY?* of numerator solve N(x) = 0 and plot the y-intercepts

WHAT DO I DO? Continued…4. Find zeros *IF ANY?* of denominatorsolve D(x) = 0sketch the vertical asymptote(s)
5. Find & sketch the horizontal asymptote(s)*IF ANY?*
6. Plot at least one point between each x-intercept and vertical asymptote.
7. Draw smooth curves between the points and asymptotes.

Practice 1. Using your knowledge from Chapter 2, follow the previously mentioned steps to sketch a graph of the following rational function by hand. (NO CALCULATORS!) 2
( )2
xf x
x x
Simplify for later… ( )( 1)( 2)
xf x
x x
Find the y-intercept:
2
0(0) 0
0 0 2f

Find zeros for numerator N(x) = 0
0x
Find vertical asymptotes D(x) = 0
2( ) ( )
2
xf x N x x
x x
y-intercept: (0,0) x-intercept: (0,0)
( ) ( ) ( 1)( 2)( 1)( 2)
xf x D x x x
x x
0 ( 1)( 2)x x
1x 2x
Vertical asymptotes are at x = -1 and x = 2

Check the degree of the numerator and denominator to determine if there are horizontal asymptotes.
The degree the numerator is less than the degree of the denominator so we have a Horizontal asymptote at y = 0
2( )
2
xf x
x x
Complete the following to determine other points.
x f(x)-3
-1
-.5
1
2
3
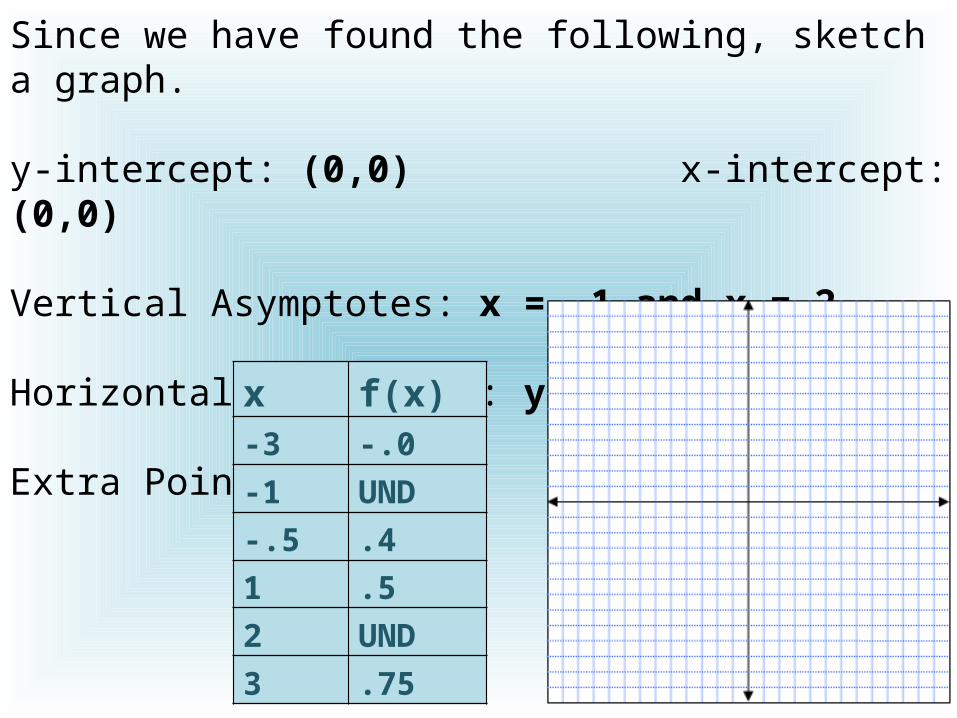
Since we have found the following, sketch a graph.
y-intercept: (0,0) x-intercept: (0,0)
Vertical Asymptotes: x = -1 and x = 2
Horizontal Asymptotes: y = 0
Extra Points:
x f(x)-3 -.0
-1 UND
-.5 .4
1 .5
2 UND
3 .75


Slant Asymptotes - if the degree of the numerator is one degree larger than the denominator then you have a slant asymptote.
2 2( )
1
x xf x
x
WE USE LONG DIVISON TO HELP US!
Example 1. Find the slant (oblique) asymptote.
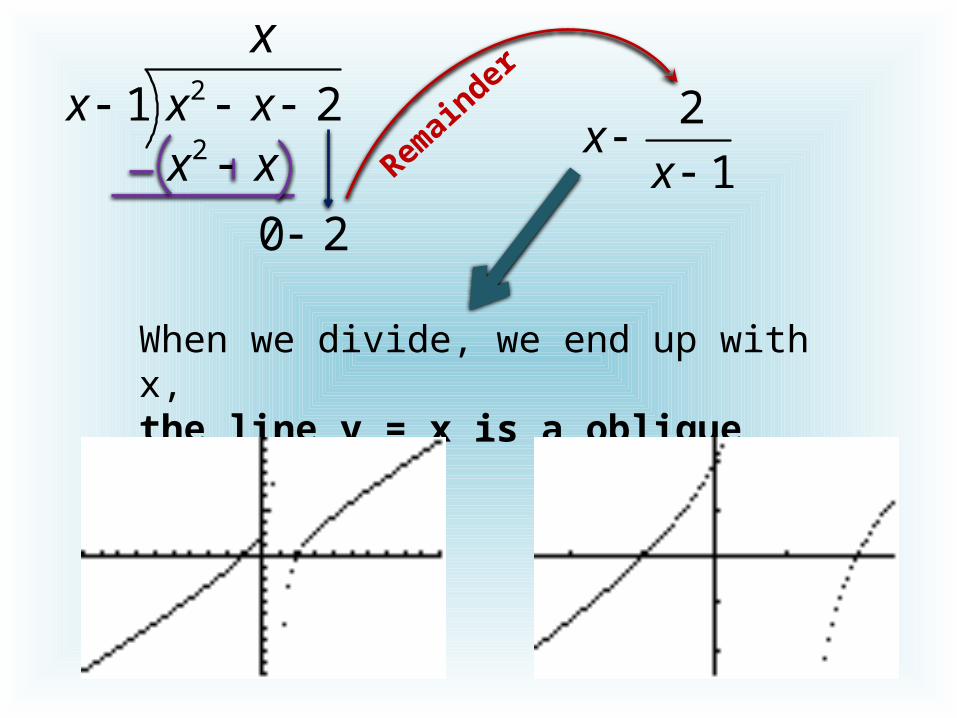
21 2x x x x
0 2
2x x
When we divide, we end up with x, the line y = x is a oblique asymptote.
2
1xx
Rem
ainde
r
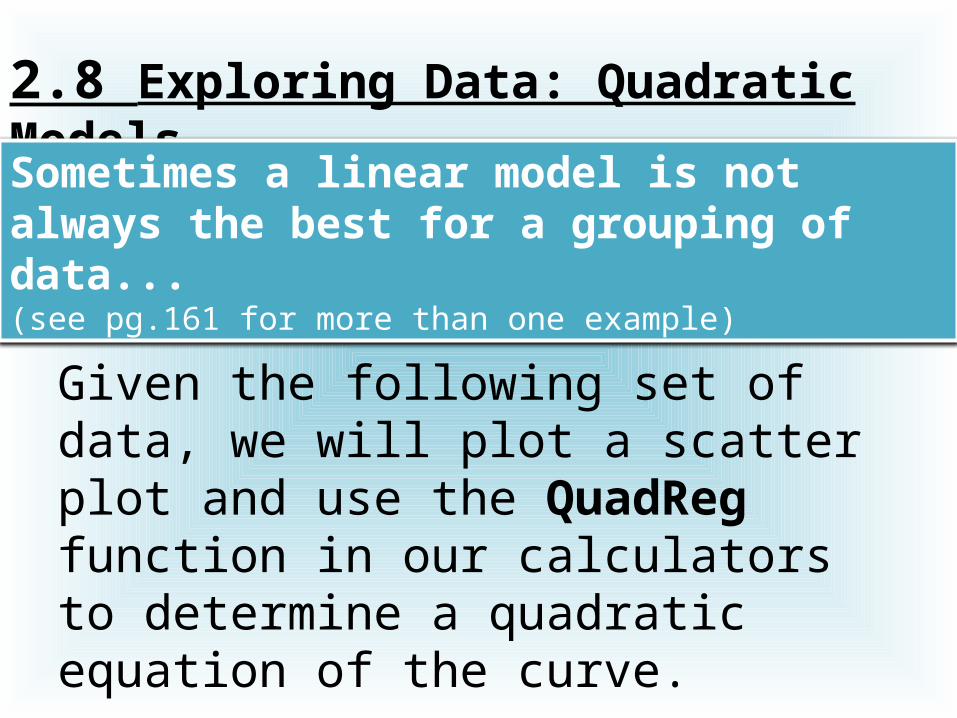
2.8 Exploring Data: Quadratic ModelsSometimes a linear model is not always the best for a grouping of data...(see pg.161 for more than one example)
Given the following set of data, we will plot a scatter plot and use the QuadReg function in our calculators to determine a quadratic equation of the curve.
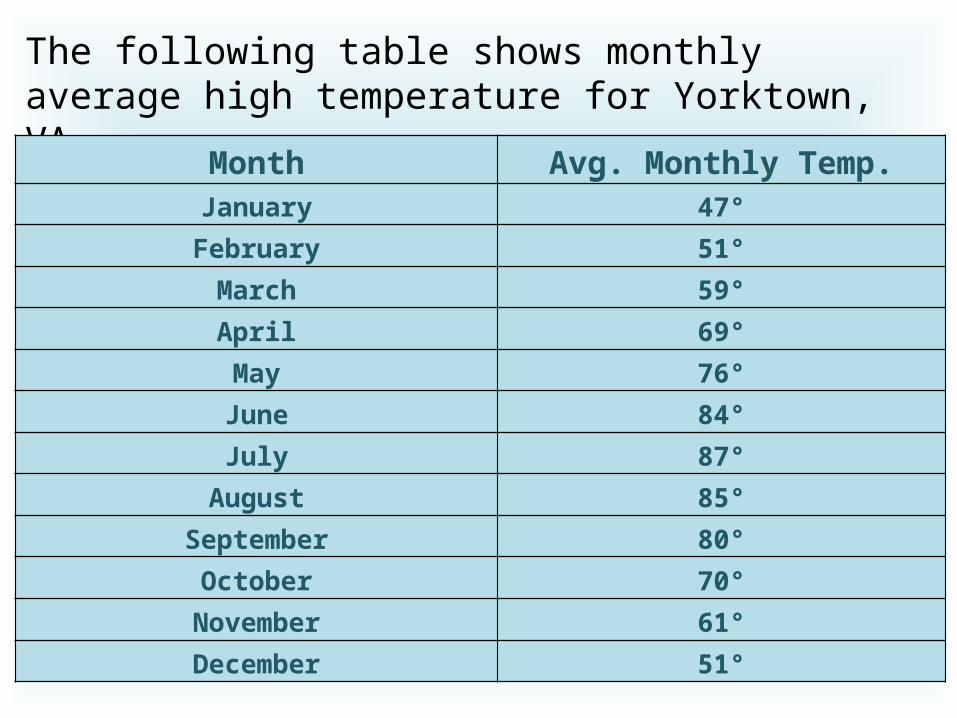
The following table shows monthly average high temperature for Yorktown, VA
Month Avg. Monthly Temp.January 47°
February 51°
March 59°
April 69°
May 76°
June 84°
July 87°
August 85°
September 80°
October 70°
November 61°
December 51°

Input the data into L1 & L2.
Use 1,2,3,4… to represent the months of the year.
Buttons:*Stat*Select EDIT*L1 = Months*L2 = Temperatures
Month Avg. Monthly Temp.
January 47°
February 51°
March 59°
April 69°
May 76°
June 84°
July 87°
August 85°
September 80°
October 70°
November 61°
December 51°

Buttons:*2nd Function “y=” (Stat Plot)
Buttons:*Enter, turn ON, & select mark
Buttons:*Window change your widow so that it will fit our data

Buttons:*Graph
Buttons:*Stat, right one to Calc
Buttons:*#5 QuadReg