chapter 3 • polynomial and rational functions 3...304 chapter 3 • polynomial and rational...
TRANSCRIPT

304 Chapter 3 • Polynomial and Rational Functions
3.5
RationalFunctions
For a rational function, find the domain and graph the function,identifying all of the asymptotes.Solve applied problems involving rational functions.
Now we turn our attention to functions that represent the quotient oftwo polynomials. Whereas the sum, difference, or product of two poly-nomials is a polynomial, in general the quotient of two polynomials is not itself a polynomial.
A rational number can be expressed as the quotient of two integers, ,where . A rational function is formed by the quotient of two polyno-mials, , where . Here are some examples of rational func-tions and their graphs.
Rational FunctionA rational function is a function f that is a quotient of twopolynomials, that is,
,
where and are polynomials and where is not the zero polynomial. The domain of f consists of all inputs x for which .q�x� � 0
q�x�q�x�p�x�
f�x� �p�x�q�x�
f(x) �1x
x
y
x
y
x
y
x
y
x
y
x
y
f(x) � �f(x) � 1x2 f(x) � x � 3
x2 � x � 2
f(x) � x2 � 2x � 3x2 � x � 2
f(x) � �x2
x � 1f(x) � 2x � 5
2x � 6
�8 8 44
1 26
q�x� � 0p�x��q�x�q � 0
p�q
BBEPMC03_0312279093.QXP 12/2/04 1:17 PM Page 304

The Domain of a Rational FunctionEXAMPLE 1 Consider
.
Find the domain and graph f .
Solution When the denominator is 0, we have , so the onlyinput that results in a denominator of 0 is 3. Thus the domain is
, or .
The graph of this function is the graph of translated to the right3 units. Two versions of the graph on a graphing calculator are shown below.
Using CONNECTED mode can lead to an incorrect graph. In CON-NECTED mode, a graphing calculator connects plotted points with line seg-ments. In DOT mode, it simply plots unconnected points. In the first graph,the graphing calculator has connected the points plotted on either side of thex-value 3 with a line that appears to be the vertical line . (It is not ac-tually vertical since it connects the last point to the left of with the firstpoint to the right of .) Since 3 is not in the domain of the function, thevertical line cannot be part of the graph. We will see later in this sec-tion that vertical lines like , although not part of the graph, are impor-tant in the construction of graphs. If you have a choice when graphingrational functions, use DOT mode.
EXAMPLE 2 Determine the domain of each of the functions illustratedat the beginning of this section.
Solution The domain of each rational function will be the set of all realnumbers except those values that make the denominator 0. To determinethose exceptions, we set the denominator equal to 0 and solve for x.
x � 3x � 3
x � 3x � 3
x � 3
y �1
x � 3
DOT MODE
�2 5
�5
5
y �1
x � 3
CONNECTED MODE
�2 5
�5
5
y � 1�x
���, 3� � �3, ��x x � 3�
x � 3x � 3
f�x� �1
x � 3
Section 3.5 • Rational Functions 305
domains of functionsreview section 1.2.
GCM
BBEPMC03_0312279093.QXP 12/2/04 1:17 PM Page 305

As a partial check of the domains, we can observe the discontinuities(breaks) in the graphs of these functions. (See page 304.)
AsymptotesLook at the graph of , shown at left. (Also see Example 1.)Let’s explore what happens as x-values get closer and closer to 3 from theleft. We then explore what happens as x-values get closer and closer to 3from the right.
From left:
From right:
We see that as x-values get closer and closer to 3 from the left, the func-tion values (y-values) decrease without bound (that is, they approach nega-tive infinity, ). Similarly, as the x-values approach 3 from the right, thefunction values increase without bound (that is, they approach positive in-finity, ). We write this as
as and as .
We read “ as ” as “ decreases without bound as x ap-proaches 3 from the left.” We read “ as ” as “ increaseswithout bound as x approaches 3 from the right.” The notation meansthat x gets as close to 3 as possible without being equal to 3. The vertical line
is said to be a vertical asymptote for this curve.x � 3
x l 3f�x�x l 3�f�x� l �
f�x�x l 3�f�x� l ��
x l 3�f�x� l �x l 3�f�x� l ��
�
��
f�x� � 1��x � 3�
306 Chapter 3 • Polynomial and Rational Functions
x 2
�1 �2 �100 �10,000 �1,000,000f �x�
2 999,9991,000,0002 9999
10,0002 991002 1
2 3
��
x 4
1 2 100 10,000 1,000,000f �x�
3 11,000,0003 1
10,0003 11003 1
2 3
�
x � 3
x�2 21 4�3 �1 3 5 6 7
y
�4
�2
2
�5
1
4
�3
�1
3
5
From right:3 x
Fromleft:x 3
f(x) � ����1
x � 3
Vertical asymptote: x � 3
FUNCTION DOMAIN
, or
, or
, or
, or ���, �1� � ��1, ��x x � �1�f�x� ��x2
x � 1
f�x� �x2 � 2x � 3
x2 � x � 2�
x2 � 2x � 3
�x � 1� �x � 2�
���, 3� � �3, ��x x � 3�f�x� �2x � 5
2x � 6�
2x � 5
2�x � 3�
f�x� �x � 3
x2 � x � 2�
x � 3
�x � 2� �x � 1�
���, 0� � �0, ��x x � 0�f�x� �1
x2
���, 0� � �0, ��x x � 0�f�x� �1
x
, or���, �2� � ��2, 1� � �1, ��x x � �2 and x � 1�
, or���, �1� � ��1, 2� � �2, ��x x � �1 and x � 2�
BBEPMC03_0312279093.QXP 12/2/04 1:17 PM Page 306

Section 3.5 • Rational Functions 307
In general, the line is a vertical asymptote for the graph of f ifany of the following is true:
as or as , or
as or as .
The following figures show the four ways in which a vertical asymptotecan occur.
x l a�f�x� l ��x l a�f�x� l �x l a�f�x� l ��x l a�f�x� l �
x � a
�6�4�2 2 6 8 10
�5
�2
�1
�4
�3
1
2
3
4
x
y
5
x � 2x � �4
2x � 11
x2 � 2x � 8f(x) �
Figure 1
�1 1
1
x
y
1.5
0.5
�0.5
�2�3�4�5 3
x � 2
x3 � 5xg(x) �
x � ��5 x � 0 x � �5
�1
Figure 2
x
y
y � f(x)
f(x) → � as x → a�
x � a
x
y
f(x) → �� as x → a�
y � f(x)
x � a
x
y
f(x) → �� as x → a�
y � f(x)
x � a
x
y
f(x) → � as x → a�
y � f(x)
x � a
The vertical asymptotes of a rational function arefound by determining the zeros of that are not also zeros of . Ifand are polynomials with no common factors other than constants, weneed determine only the zeros of the denominator .
Determining Vertical AsymptotesFor a rational function , where and arepolynomials with no common factors other than constants, if a is azero of the denominator, then the line is a vertical asymptotefor the graph of the function.
EXAMPLE 3 Determine the vertical asymptotes for the graph of eachof the following functions.
a) b)
Solutiona) We factor to find the zeros of the denominator:
. The zeros of the denominator are �4 and 2.Thus the vertical asymptotes are the lines and .(See Fig. 1.)
b) We factor to find the zeros of the denominator:. Solving we get
.
The zeros of the denominator are 0, , and . Thus thevertical asymptotes are the lines , , and .(See Fig. 2.)
x � ��5x � �5x � 0��5�5
x � 0 or x � �5
x � 0 or x2 � 5
x � 0 or x2 � 5 � 0
x�x2 � 5� � 0x�x2 � 5�x3 � 5x �
x � 2x � �4�x � 4� �x � 2�
x2 � 2x � 8 �
g�x� �x � 2
x3 � 5xf�x� �
2x � 11
x2 � 2x � 8
x � a
q�x�p�x�f�x� � p�x��q�x�
q�x�q�x�
p�x�p�x�q�x�f�x� � p�x��q�x�
BBEPMC03_0312279093.QXP 12/2/04 1:17 PM Page 307

Looking again at the graph of , shown at left (also seeExample 1), let’s explore what happens to as x increaseswithout bound (approaches positive infinity, ) and as x decreases withoutbound (approaches negative infinity, ).
x increases without bound:
x decreases without bound:
We see that
as and as .
Since is the equation of the x-axis, we say that the curve approachesthe x-axis asymptotically and that the x-axis is a horizontal asymptote forthe curve.
In general, the line is a horizontal asymptote for the graph of fif either or both of the following are true:
as or as .
The following figures illustrate four ways in which horizontal asymptotescan occur. In each case, the curve gets close to the line either as or as . Keep in mind that the symbols and convey the ideaof increasing without bound and decreasing without bound, respectively.
���x l ��x l �y � b
x l ��f�x� l bx l �f�x� l b
y � b
y � 0
x l ��1
x � 3l 0x l �
1
x � 3l 0
���
f�x� � 1��x � 3�f�x� � 1��x � 3�
308 Chapter 3 • Polynomial and Rational Functions
f(x) � ����1
x � 3
y � 0
x�2 21 4�3 �1 3 5 6 7
y
�4
�2
2
�5
1
4
�3
�1
3
5
x ∞
Horizontal asymptote: y � 0
�∞ xx 100 5000 1,000,000
� 0.000001� 0.0002� 0.0103f �x� 0
�
x �300 �8000 �1,000,000
� �0.000001� �0.0001� �0.0033f �x� 0
��
y � f(x)
y � b
y
xy � f(x)
y � b
f(x) → b as x → ∞ f(x) → b as x → �∞ f(x) → b as x → ∞ f(x) → b as x → �∞
yy � f(x)
y � b y � f(x)y � b
y
x
y
x x
How can we determine a horizontal asymptote? As x gets very large or very small, the value of the polynomial function is dominated bythe function’s leading term. Because of this, if and have the samedegree, the value of as or as is dominated bythe ratio of the numerator’s leading coefficient to the denominator’s lead-ing coefficient.
x l ��x l �p�x��q�x�q�x�p�x�
p�x�
BBEPMC03_0312279093.QXP 12/2/04 1:17 PM Page 308

For , we see that the numerator,is dominated by and the denominator, is
dominated by so approaches or as x gets very large orvery small:
, or 1.5, as , and
, or 1.5, as .
We say that the curve approaches the horizontal line asymptoticallyand that is a horizontal asymptote for the curve.
It follows that when the numerator and the denominator of a rationalfunction have the same degree, the line is the horizontal asymptote,where a and b are the leading coefficients of the numerator and the denomi-nator, respectively.
EXAMPLE 4 Find the horizontal asymptote: .
Solution The numerator and the denominator have the same degree.The ratio of the leading coefficients is , so the line or is the horizontal asymptote.
To check Example 4, we could use a graphing calculator to evaluate thefunction for a very large and a very small value of x. (See the window at left.)Another check, one that is useful in calculus, is to multiply by 1, using
:
.
As becomes very large, each expression with a power of x in the denomi-nator tends toward 0. Specifically, as or as , we have
, or .
The horizontal asymptote is , or .We now investigate the occurrence of a horizontal asymptote when
the degree of the numerator is less than the degree of the denominator.
�0.63y � �7
11
f�x� l �7
11f�x� l
�7 � 0 � 0
11 � 0 � 0
x l ��x l � x
�
�7 �10
x2 �1
x4
11 �1
x3 �2
x4
f�x� ��7x4 � 10x2 � 1
11x4 � x � 2�
1
x4
1
x4
�
�7x4
x4 �10x2
x4 �1
x4
11x4
x4 �x
x4 �2
x4
�1�x4���1�x4�
�0.63,y � �7
11 ,�7
11
f�x� ��7x4 � 10x2 � 1
11x4 � x � 2
y � a�b
y � 32
y � 32
x l ��3x2 � 2x � 4
2x2 � x � 1l
3
2
x l �3x2 � 2x � 4
2x2 � x � 1l
3
2
3�23x2�2x2,f�x�2x2,2x2 � x � 1,3x23x2 � 2x � 4,
f�x� � �3x2 � 2x � 4���2x2 � x � 1�
Section 3.5 • Rational Functions 309
y �32
f(x) � 3x2 � 2x � 42x2 � x � 1
y
�2�4�6�8 8642 x
�4
�3
�2
�1
1
2
3
4
x � ��� � x
�.6364�.6364
X
X �
Y1
100000�80000
BBEPMC03_0312279093.QXP 12/2/04 1:17 PM Page 309
310 Chapter 3 • Polynomial and Rational Functions
EXAMPLE 5 Find the horizontal asymptote: .
Solution We let , , and . Note that as , the value of grows much faster than
the value of . Because of this, the ratio shrinks toward 0.As , the ratio behaves in a similar manner. The hori-zontal asymptote is , the x-axis. This is the case for all rational func-tions for which the degree of the numerator is less than the degree of thedenominator. Note in Example 1 that , the x-axis, is the horizontalasymptote of .
The following statements describe the two ways in which a horizontalasymptote occurs.
Determining a Horizontal Asymptote
When the numerator and the denominator of a rational functionhave the same degree, the line is the horizontalasymptote, where a and b are the leading coefficients of thenumerator and the denominator, respectively.
When the degree of the numerator of a rational function is lessthan the degree of the denominator, the x-axis, or , is thehorizontal asymptote.
When the degree of the numerator of a rational function isgreater than the degree of the denominator, there is nohorizontal asymptote.
The following statements are also true.
The graph of a rational function never crosses a vertical asymptote.
The graph of a rational function might cross a horizontal asymptotebut does not necessarily do so.
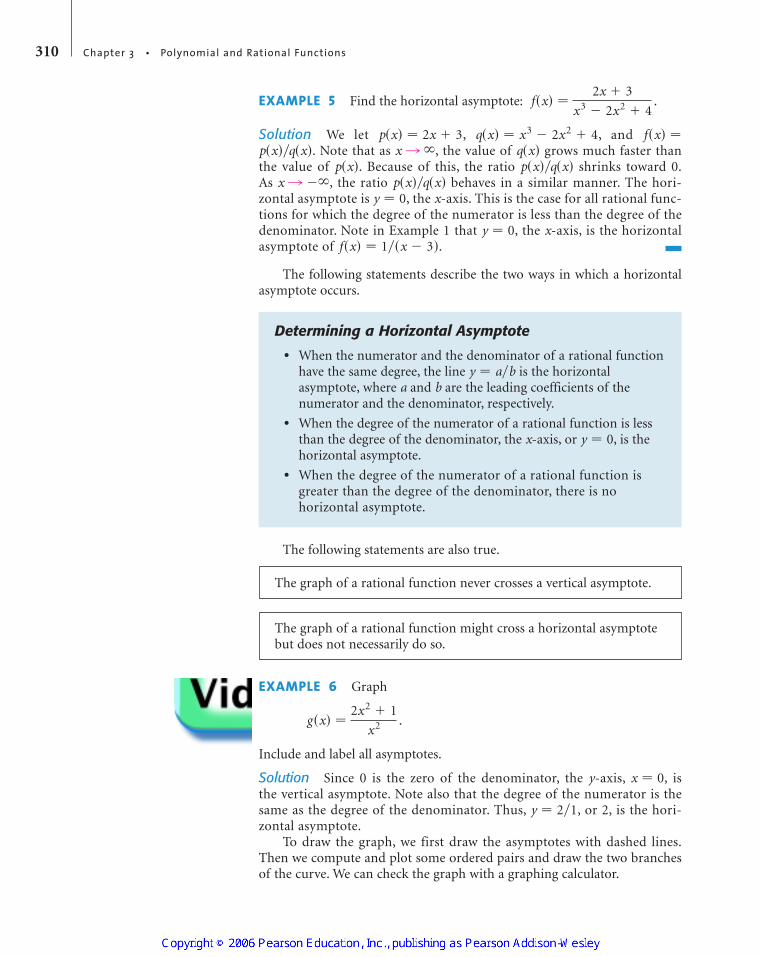
EXAMPLE 6 Graph
.
Include and label all asymptotes.
Solution Since 0 is the zero of the denominator, the y-axis, , is the vertical asymptote. Note also that the degree of the numerator is thesame as the degree of the denominator. Thus, , or 2, is the hori-zontal asymptote.
To draw the graph, we first draw the asymptotes with dashed lines.Then we compute and plot some ordered pairs and draw the two branchesof the curve. We can check the graph with a graphing calculator.
y � 2�1
x � 0
g�x� �2x2 � 1
x2
y � 0
y � a�b
f�x� � 1��x � 3�y � 0
y � 0p�x��q�x�x l ��
p�x��q�x�p�x�q�x�x l �p�x��q�x�
f�x� �q�x� � x3 � 2x2 � 4p�x� � 2x � 3
f�x� �2x � 3
x3 � 2x2 � 4
BBEPMC03_0312279093.QXP 12/2/04 1:17 PM Page 310

Sometimes a line that is neither horizontal nor vertical is an asymptote.Such a line is called an oblique asymptote, or a slant asymptote.
EXAMPLE 7 Find all the asymptotes of
.
Solution The line is the vertical asymptote because 2 is the zero ofthe denominator. There is no horizontal asymptote because the degree of thenumerator is greater than the degree of the denominator. When the degreeof the numerator is 1 greater than the degree of the denominator, we divideto find an equivalent expression:
.
Now we see that when or , and the value of. This means that as becomes very large, the graph of
gets very close to the graph of . Thus the line is theoblique asymptote.
x
y
�5�4�3�2�1 1 2 3 4 5
�5
�4
�3
�2
�1
1
2
3
4
5
6
7
8
9
10
11
12
y � 2x � 1
x � 2
2x2 � 3x � 1
x � 2f(x) �
y � 2x � 1y � 2x � 1f�x� x f�x� l 2x � 1
1��x � 2� l 0x l ��x l �
2x2 � 3x � 1
x � 2� �2x � 1� �
1
x � 2
x � 2
f�x� �2x2 � 3x � 1
x � 2
�5�4�3�2�1 1 3 4 5
�5
�4
�3
�1
1
2
3
4
x
y2x2 � 1
x2g(x) �
Horizontalasymptote
y � 2Vertical
asymptotex � 0
Section 3.5 • Rational Functions 311
x
�2
�1 36
61 3
2 2 14
2 491 1
2
12
�12
2 49�1 1
2
2 14
g �x�
1 x � 2 x � 1 2x2 � 4x
x � 2�2x 2 � 3x � 1 2x � 1
�10 10
�10
10
2x2 � 1
x2y �
BBEPMC03_0312279093.QXP 12/2/04 1:17 PM Page 311
Occurrence of Lines as Asymptotes of Rational FunctionsFor a rational function , where and haveno common factors other than constants:
Vertical asymptotes occur at any x-values that make thedenominator 0.
The x-axis is the horizontal asymptote when the degree of thenumerator is less than the degree of the denominator.
A horizontal asymptote other than the x-axis occurs when thenumerator and the denominator have the same degree.
An oblique asymptote occurs when the degree of the numeratoris 1 greater than the degree of the denominator.
There can be only one horizontal asymptote or one oblique asymptote and never both.
An asymptote is not part of the graph of the function.
The following is an outline of a procedure that we can follow to createaccurate graphs of rational functions.
To graph a rational function , where and have no common factor other than constants:
1. Find the real zeros of the denominator. Determine the domain ofthe function and sketch any vertical asymptotes.
2. Find the horizontal or the oblique asymptote, if there is one, andsketch it.
3. Find the zeros of the function. The zeros are found bydetermining the zeros of the numerator. These are the firstcoordinates of the x-intercepts of the graph.
4. Find . This gives the y-intercept , of the function.
5. Find other function values to determine the general shape. Thendraw the graph.
EXAMPLE 8 Graph: .
Solution1. We find the zeros of the denominator by solving .
Since
,
the zeros are and �3. Thus the domain excludes and �3 and is
.���, �3� � ��3, 23� � �2
3 , ��
23
23
3x2 � 7x � 6 � �3x � 2� �x � 3�
3x2 � 7x � 6 � 0
f�x� �2x � 3
3x2 � 7x � 6
�0, f�0��f�0�
q�x�p�x�f�x� � p�x��q�x�
q�x�p�x�f�x� � p�x��q�x�
312 Chapter 3 • Polynomial and Rational Functions
BBEPMC03_0312279093.QXP 12/2/04 1:17 PM Page 312

The graph has vertical asymptotes and . We sketch these asdashed lines.
2. Because the degree of the numerator is less than the degree of the denominator, the x-axis, , is the horizontal asymptote.
3. To find the zeros of the numerator, we solve and get. Thus, is the zero of the function, and the pair
is the x-intercept.
4. We find :
.
Thus, is the y-intercept.
5. We find other function values to determine the general shape and thendraw the graph. Note that the graph of this function crosses its horizon-tal asymptote at .
EXAMPLE 9 Graph: .
Solution1. We find the zeros of the denominator by solving . Since
,
the zeros are �3 and 2. Thus the domain excludes the x-values �3 and 2and is
.
The graph has vertical asymptotes and . We sketch these asdashed lines.
2. The numerator and the denominator have the same degree, so the hor-izontal asymptote is determined by the ratio of the leading coefficients:
, or 1. Thus is the horizontal asymptote. We sketch it with a dashed line.
y � 11�1
x � 2x � �3
���, �3� � ��3, 2� � �2, ��
x2 � x � 6 � �x � 3� �x � 2�
x2 � x � 6 � 0
g�x� �x2 � 1
x2 � x � 6
�3�2�1 1 2 3 4 5
�5
�4
�3
�2
�1
1
2
3
4
x
y
52x � 3
3x2 � 7x � 6f(x) �
(�w, 0)
(0, �q)
x � �3
y � 0
x � s
x � �32
�0, �12�
�3
�6� �
1
2
f�0� �2 � 0 � 3
3 � 02 � 7 � 0 � 6
f�0�
��32 , 0��
32x � �
32
2x � 3 � 0
y � 0
x � 23x � �3
Section 3.5 • Rational Functions 313
BBEPMC03_0312279093.QXP 12/2/04 1:17 PM Page 313

3. To find the zeros of the numerator, we solve . The solutionsare �1 and 1. Thus, �1 and 1 are the zeros of the function and the pairs
and are the x-intercepts.
4. We find :
.
Thus, is the y-intercept.
5. We find other function values to determine the general shape and thendraw the graph.
The magnified portion of the graph in Example 9 at left shows another situation in which a graph can cross its horizontal asymptote.The point where crosses can be found by setting andsolving for x :
Subtracting
. Adding 6
The point of intersection is . Let’s observe the behavior of the curveafter it crosses the horizontal asymptote at . (See the graph at left.) Itcontinues to decrease for a short interval and then begins to increase, gettingcloser and closer to as .
Graphs of rational functions can also cross an oblique asymptote. Thegraph of
f�x� �2x3
x2 � 1
x l �y � 1
x � 5�5, 1�
5 � x
x2 �1 � x � 6
x2 � 1 � x2 � x � 6
x2 � 1
x2 � x � 6� 1
g�x� � 1y � 1g�x�
�5�4�3 �1 1 2 3 4 5
�5
�4
�3
�2
�1
1
2
3
4
x
y
5
6
x � 2x � �3
y � 1
(�1, 0)(1, 0)
(5, 1)
(0, Z)
x2 � 1
x2 � x � 6g(x) � Curve crosses
the line y � 1 atx � 5
�0, 16�
g�0� �02 � 1
02 � 0 � 6�
�1
�6�
1
6
g�0��1, 0���1, 0�
x2 � 1 � 0
314 Chapter 3 • Polynomial and Rational Functions
0.5
1.5
0 40
y1 � (x2 � 1)/(x2 � x � 6), y2 � 1
y1
y2
Xscl � 5, Yscl � 0.1
BBEPMC03_0312279093.QXP 12/2/04 1:17 PM Page 314
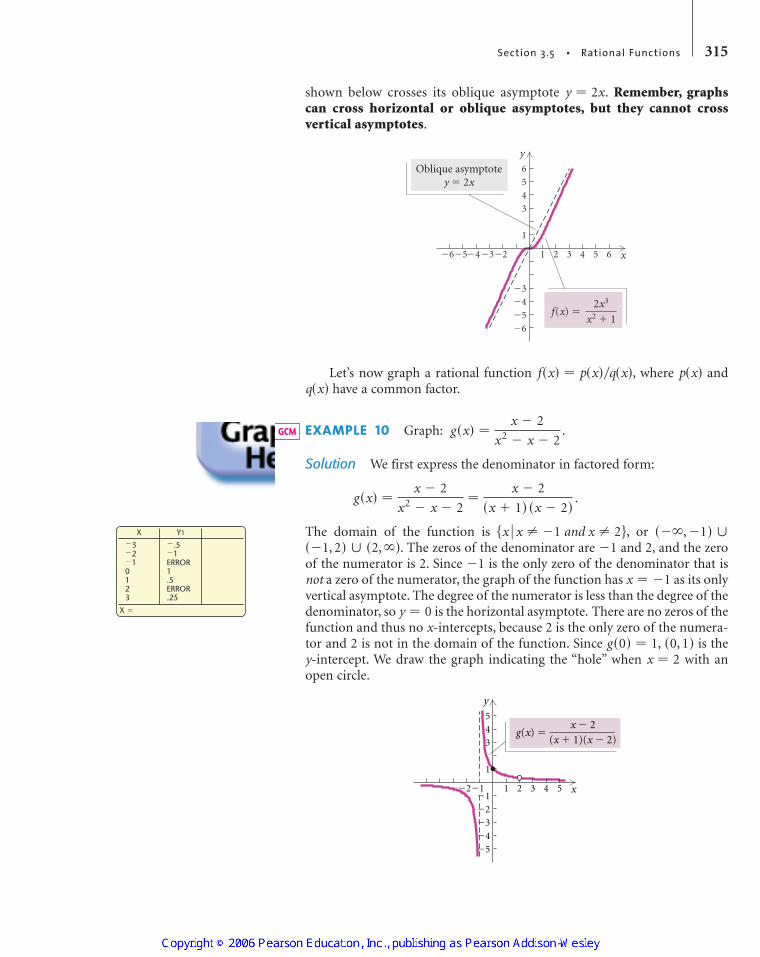
shown below crosses its oblique asymptote . Remember, graphscan cross horizontal or oblique asymptotes, but they cannot cross vertical asymptotes.
Let’s now graph a rational function , where andhave a common factor.
EXAMPLE 10 Graph: .
Solution We first express the denominator in factored form:
.
The domain of the function is , or . The zeros of the denominator are �1 and 2, and the zero
of the numerator is 2. Since �1 is the only zero of the denominator that isnot a zero of the numerator, the graph of the function has as its onlyvertical asymptote. The degree of the numerator is less than the degree of thedenominator, so is the horizontal asymptote. There are no zeros of thefunction and thus no x-intercepts, because 2 is the only zero of the numera-tor and 2 is not in the domain of the function. Since , is they-intercept. We draw the graph indicating the “hole” when with anopen circle.
�2�1 1 2 3 4 5
�5
�4
�3
�2
�1
1
3
4
x
y
5x � 2
(x � 1)(x � 2)g(x) �
x � 2�0, 1�g�0� � 1
y � 0
x � �1
��1, 2� � �2, �����, �1� �x x � �1 and x � 2�
g�x� �x � 2
x2 � x � 2�
x � 2
�x � 1� �x � 2�
g�x� �x � 2
x2 � x � 2
q�x�p�x�f�x� � p�x��q�x�
�5�4�3�2 1 2 3 4 5
�5
�6
�4
�3
1
3
4
x
y
5
6
�6 6
2x3
x2 � 1f(x) �
Oblique asymptotey � 2x
y � 2x
Section 3.5 • Rational Functions 315
�.5�1ERROR1.5ERROR.25
X
X �
Y1
�3�2�10123
GCM
BBEPMC03_0312279093.QXP 12/2/04 1:17 PM Page 315

The rational expression can be simplified.Thus,
, where and .
The graph of is the graph of with the point wheremissing. To determine the coordinates of the “hole,” we substitute 2
for x in
Thus the “hole” is located at . With certain window dimensions, the“hole” is visible on a graphing calculator.
ApplicationsEXAMPLE 11 Temperature During an Illness. The temperature T, indegrees Fahrenheit, of a person during an illness is given by the function
,
where time t is given in hours since the onset of the illness.
a) Graph the function on the interval
b) Find the temperature at , 1, 2, 5, 12, and 24.
c) Find the horizontal asymptote of the graph of . Complete:
as .
d) Give the meaning of the answer to part (b) in terms of the application.
e) Find the maximum temperature during the illness.
Solutiona) The graph is shown at left.
b) We have
, , ,
, , and .
c) Since
,
the horizontal asymptote is , or 98.6. Then it follows thatas .
d) As time goes on, the temperature returns to “normal,” which is 98.6 .
e) Using the MAXIMUM feature on a graphing calculator, we find the maxi-mum temperature to be 100.6° at t � 1 hr.
t l �T�t� l 98.6y � 98.6�1
�98.6t 2 � 4t � 98.6
t 2 � 1
T�t� �4t
t 2 � 1� 98.6
T�24� � 98.766T�12� � 98.931T�5� � 99.369
T�2� � 100.2T�1� � 100.6T�0� � 98.6
t l �T�t� l
T�t�t � 0
�0, 48�.
T�t� �4t
t 2 � 1� 98.6
�2, 13�
g�2� �1
2 � 1�
1
3.
g�x� � 1��x � 1�:x � 2
y � 1��x � 1�g�x�
x � 2x � �1g�x� �x � 2
�x � 1� �x � 2��
1
x � 1
�x � 2����x � 1� �x � 2��
316 Chapter 3 • Polynomial and Rational Functions
x � 2
x2 � x � 2y �
�3.1
3.1
�4.7 4.7
Xscl � 12, Yscl � 1
4x
x2 � 1T(x) � � 98.6
98
102
0 48
MaximumX � 1 Y � 100.60 48
102
98Xscl � 12, Yscl � 1
BBEPMC03_0312279093.QXP 12/2/04 1:17 PM Page 316

A
�4 �2 2 4�5 �3 �1 1 3 5 x�1
�2
�3
�4
�5
1
2
3
4
5y
F
�4 �2 2 4�5 �3 �1 1 3 5 x�1
�2
�3
�4
�5
1
2
3
4
5y
B
�4 �2 2 4�5 �3 �1 1 3 5 x�1
�2
�3
�4
�5
1
2
3
4
5y
G
�4 �2 2 4�5 �3 �1 1 3 5 x�1
�2
�3
�4
�5
1
2
3
4
5y
C
�4 �2 3 5�3 �1 21 4 6 x�1
�2
�3
�4
2
1
3
4
5
6y
H
3�3 �1 5�4 �2 21 4 6 x�1
�2
�3
�4
�5
1
2
3
4
5y
D
�1
�2
�3
�4
�5
1
2
3
4
5y
�3 �1 5�4 �2 21 4 6 x3
I
�4 �2 2 4�5 �3 �1 1 3 5 x
�3
�4
�1
�2
�5
�6
�7
1
2
3y
E
�4 �2 2 4�5 �3 �1 1 3 5 x�1
�2
�3
�4
2
1
3
4
5
6y
J
�5 �3 1 3�6 �4 �1�2 �1 2 4 x�1
�2
�3
�4
2
1
3
4
5
6y
Visualizing the GraphMatch the function with its graph.
1. A
2. C
3. D
4. H
5. G
6. F
7. B
8. I
9. J
10. E
Answers on page A-22
f�x� � 2x2 � 4x � 1
f�x� �8x � 4
3x � 6
f�x� � x4 � 2x2 � 5
f�x� � x2 � 1
f�x� �3
4x � 2
f�x� �x � 3
x2 � x � 6
f�x� � �x2 � 4x � 1
f�x� �x2 � 4
x2 � x � 6
f�x� � x3 � 3x2 � 2x � 3
f�x� � �1
x2
Section 3.5 • Rational Functions 317
BBEPMC03_0312279093.QXP 12/2/04 1:18 PM Page 317
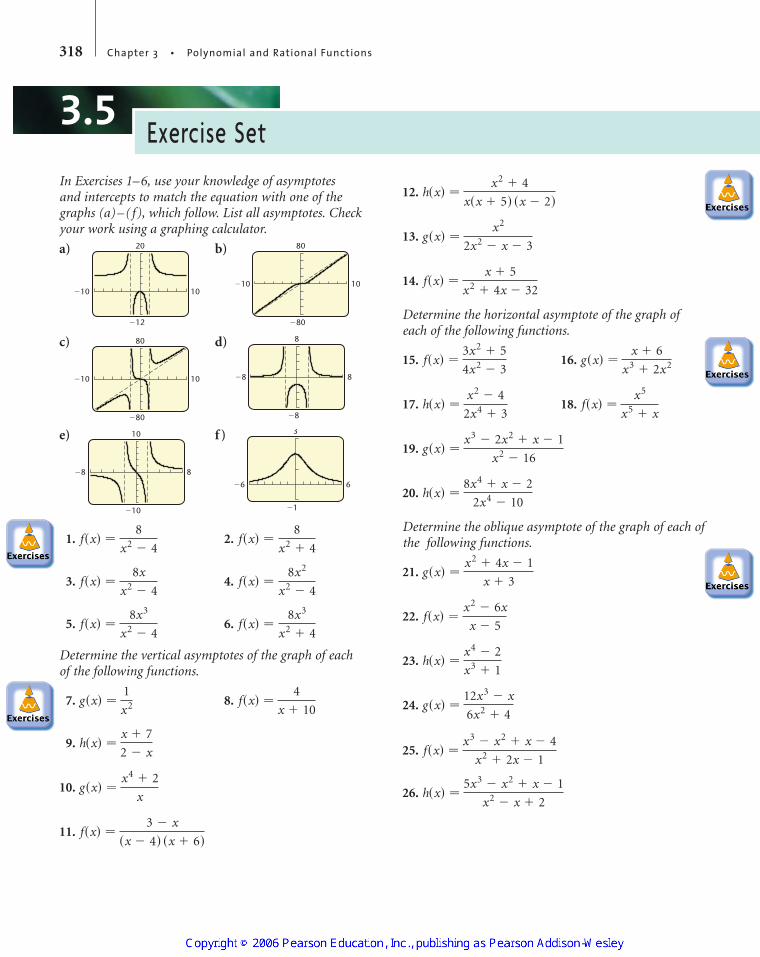
3.5 Exercise SetIn Exercises 1–6, use your knowledge of asymptotes and intercepts to match the equation with one of thegraphs (a)–(f), which follow. List all asymptotes. Checkyour work using a graphing calculator.
a) b)
c) d)
e) f )
1. � 2. (f);
3. � 4. �
5. � 6. (b);
Determine the vertical asymptotes of the graph of each of the following functions.
7. 8.
9.
10.
11. ,
12. , ,
13. ,
14. ,
Determine the horizontal asymptote of the graph ofeach of the following functions.
15. 16.
17. 18.
19. No horizontal asymptote
20.
Determine the oblique asymptote of the graph of each ofthe following functions.
21.
22.
23.
24.
25.
26. y � 5x � 4h�x� �5x3 � x2 � x � 1
x2 � x � 2
y � x � 3f�x� �x3 � x2 � x � 4
x2 � 2x � 1
y � 2xg�x� �12x3 � x
6x2 � 4
y � xh�x� �x4 � 2
x3 � 1
y � x � 1f�x� �x2 � 6x
x � 5
y � x � 1g�x� �x2 � 4x � 1
x � 3
y � 4h�x� �8x4 � x � 2
2x4 � 10
g�x� �x3 � 2x2 � x � 1
x2 � 16
y � 1f�x� �x5
x5 � xy � 0h�x� �
x2 � 4
2x4 � 3
y � 0g�x� �x � 6
x3 � 2x2y � 34f�x� �
3x2 � 5
4x2 � 3
x � �8x � 4f�x� �x � 5
x2 � 4x � 32
x � �1x � 32g�x� �
x2
2x2 � x � 3
x � 2x � �5x � 0h�x� �x2 � 4
x�x � 5� �x � 2�
x � �6x � 4f�x� �3 � x
�x � 4� �x � 6�
x � 0g�x� �x4 � 2
x
x � 2h�x� �x � 7
2 � x
x � �10f�x� �4
x � 10x � 0g�x� �
1
x2
y � 8xf�x� �
8x3
x2 � 4f�x� �
8x3
x2 � 4
f�x� �8x2
x2 � 4f�x� �
8x
x2 � 4
y � 0f�x� �
8
x2 � 4f�x� �
8
x2 � 4
�6 6
�1
3
�8 8
�10
10
�8 8
�8
8
�10
�80
10
80
�10
�80
10
80
�10
�12
10
20
318 Chapter 3 • Polynomial and Rational Functions
� Answers to Exercises 1 and 3–5 can be found on p. IA-17.
BBEPMC03_0312279093.QXP 12/2/04 1:18 PM Page 318
Make a hand-drawn graph for each of the following. Besure to label all the asymptotes. List the domain and thex- and y-intercepts. Check your work using a graphingcalculator.
27. �
28. �
29. �
30. �
31. �
32. �
33. �
34. �
35. �
36. �
37. �
38. �
39. �
40. �
41. �
42. �
43. �
44. �
45. �
46. �
47. �
48. �
49. �
50. �
51. �
52. �
53. �
54. �
55. �
56. �
57. �
58. �
59. �
60. �
61. �f�x� �x3 � 1
x
f�x� �x � 2
�x � 1�3
f�x� �x � 3
�x � 1�3
f�x� �x � 2
x2 � 2x � 15
f�x� �x � 1
x2 � 2x � 3
f�x� �2x � 1
2x2 � 5x � 3
g�x� �3x2 � x � 2
x � 1
f�x� �x2 � 2x � 3
3x2 � 2
f�x� �x2 � x � 2
2x2 � 1
f�x� �x2 � 4
x � 1
f�x� �x2 � 9
x � 1
f�x� �3x
x2 � 5x � 4
f�x� �x � 3
2x2 � 5x � 3
f�x� �x � 2
x � 1
f�x� �x � 1
x � 2
f�x� �x2 � 9
x � 3
f�x� �x2 � 4
x � 2
f�x� ��1
x2 � 2
f�x� �1
x2 � 3
f�x� �1
3x2
f�x� � �1
x2
f�x� ��2
�x � 3�2
f�x� �1
�x � 2�2
f�x� �3x � 1
x
f�x� �2x � 1
x
f�x� �3
3 � x
f�x� ��2
x � 5
f�x� �1
x � 5
f�x� �1
x � 3
h�x� �2x2 � x � 3
x � 1
g�x� �x2 � 4x � 3
x � 1
f�x� � �6
x
h�x� � �4
x2
g�x� �1
x2
f�x� �1
x
Section 3.5 • Rational Functions 319
� Answers to Exercises 27–61 can be found on pp. IA-18 through IA-20.
BBEPMC03_0312279093.QXP 12/2/04 1:18 PM Page 319
62. �
63. �
64. �
65. �
66. �
67. �
68. �
Find a rational function that satisfies the given conditions for each of the following. Answers may vary, but try to give the simplest answer possible.
69. Vertical asymptotes , �
70. Vertical asymptotes , ;x-intercept �
71. Vertical asymptotes , ; horizontalasymptote ; x-intercept �
72. Oblique asymptote �
73. Medical Dosage. The function
,
gives the body concentration , in parts permillion, of a certain dosage of medication after time t, in hours.
a) Graph the function on the interval andcomplete the following:
as . �
b) Explain the meaning of the answer to part (a) interms of the application. �
74. Average Cost. The average cost per DVD, in dollars,for a company to produce x DVDs on exercising isgiven by the function
, .
a) Graph the function on the interval andcomplete the following:
as . �
b) Explain the meaning of the answer to part (a) interms of the application. �
75. Population Growth. The population P, inthousands, of Lordsburg is given by
,
where t is the time, in months.
a) Graph the function on the interval �
b) Find the population at , 1, 3, and 8 months.c) Find the horizontal asymptote of the graph and
complete the following: as
as .
d) Explain the meaning of the answer to part (c) interms of the application. �
e) Find the maximum population and the value of tthat will yield it. 58,926 at
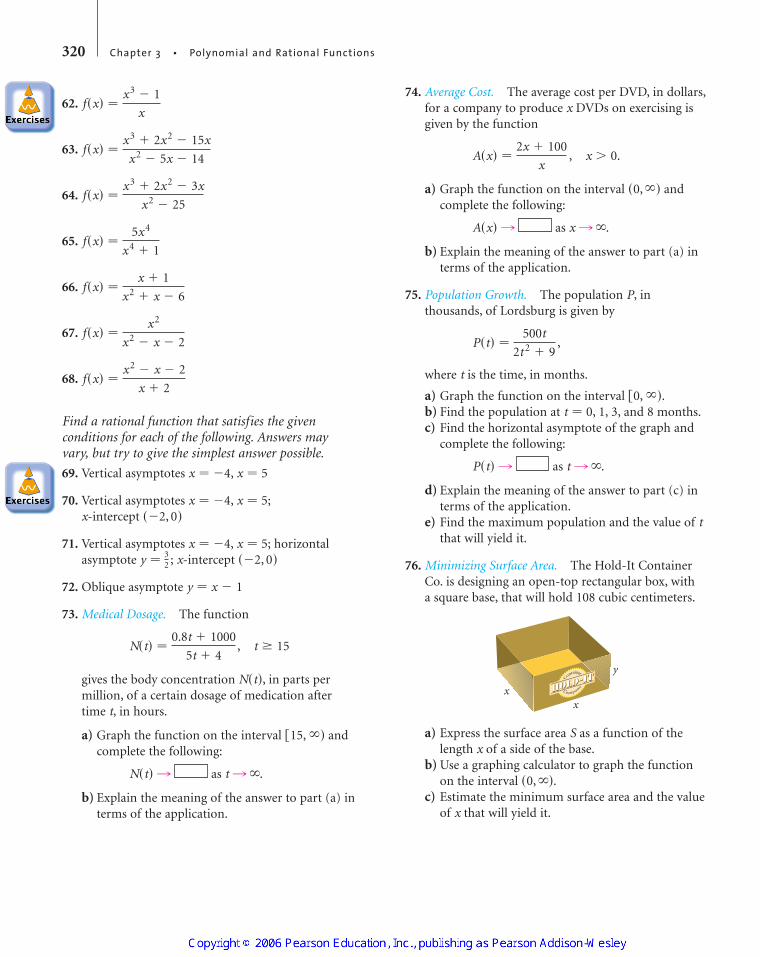
76. Minimizing Surface Area. The Hold-It ContainerCo. is designing an open-top rectangular box, with a square base, that will hold 108 cubic centimeters.
a) Express the surface area S as a function of thelength x of a side of the base. �
b) Use a graphing calculator to graph the functionon the interval . �
c) Estimate the minimum surface area and the valueof x that will yield it. �
�0, ��
xx
y
t � 2.12 months
t l �P�t� l
t l �P�t� l 0
t � 0�0, ��.
P�t� �500t
2t 2 � 9
x l �A�x� l
�0, ��
x � 0A�x� �2x � 100
x
t l �N�t� l
�15, ��
N�t�
t � 15N�t� �0.8t � 1000
5t � 4
y � x � 1
��2, 0�y � 32
x � 5x � �4
��2, 0�x � 5x � �4
x � 5x � �4
f�x� �x2 � x � 2
x � 2
f�x� �x2
x2 � x � 2
f�x� �x � 1
x2 � x � 6
f�x� �5x4
x4 � 1
f�x� �x3 � 2x2 � 3x
x2 � 25
f�x� �x3 � 2x2 � 15x
x2 � 5x � 14
f�x� �x3 � 1
x
320 Chapter 3 • Polynomial and Rational Functions
� Answers to Exercises 62–74, 75(a), 75(b), 75(d), and 76 can be found on pp. IA-20 and IA-21.
�
BBEPMC03_0312279093.QXP 12/2/04 1:18 PM Page 320
77. Graph
and
using the same viewing window. Explain how theparabola can be thought of as a nonlinearasymptote for . �
Collaborative Discussion and Writing78. Explain why the graph of a rational function cannot
have both a horizontal and an oblique asymptote.
79. Under what circumstances will a rational functionhave a domain consisting of all real numbers?
Skill MaintenanceIn each of Exercises 80–88, fill in the blank with thecorrect term. Some of the given choices will not be used.Others will be used more than once.
x-intercepty-interceptodd functioneven functiondomainrangeslopedistance formulamidpoint formulahorizontal linesvertical linespoint–slope equationslope–intercept equationdifference quotient
80. A function is a correspondence between a first set,called the , and a second set, calledthe , such that each member of the
corresponds to exactly one memberof the .
[1.2] domain, range, domain, range
81. The of a line containing and is given by .
[1.3] slope82. The of the line with slope m and
y-intercept is .[1.4] slope–intercept equation
83. The of the line with slope m passingthrough is .
[1.4] point–slope equation84. A(n) is a point .
[1.1] x-intercept85. For each x in the domain of an odd function f ,
. [1.7]
86. are given by equations of the type . [1.3] Vertical lines
87. The is .[1.1] midpoint formula
88. A(n) is a point [1.1] y-intercept
SynthesisFind the nonlinear asymptote of the function.
89.
90.
Graph the function.
91. �
92. �
Find the domain of the function.
93.
94. ���, �3� � �7, ��f�x� � �x2 � 4x � 21
���, �3� � �7, ��f�x� �� 72
x2 � 4x � 21
f�x� �x3 � 4x2 � x � 6
x2 � x � 2
f�x� �2x3 � x2 � 8x � 4
x3 � x2 � 9x � 9
y � x2 � 2f�x� �x4 � 3x2
x2 � 1
y � x3 � 4f�x� �x5 � 2x3 � 4x2
x2 � 2
�0, b�.
�x1 � x2
2,
y1 � y2
2 x � a
f ��x� � �f �x�
�a, 0�
y � y1 � m�x � x1��x1, y1�
y � mx � b�0, b�
� y2 � y1���x2 � x1��x2, y2��x1, y1�
f��x� � �f�x�f�x� � f��x�
y1
y2 � x2
y2 � x2y1 �x3 � 4
x
Section 3.5 • Rational Functions 321
� Answers to Exercises 77, 91, and 92 can be found on p. IA-21.
BBEPMC03_0312279093.QXP 12/2/04 1:18 PM Page 321