understanding mid year estimates in light of england
TRANSCRIPT
Understanding Mid Year Estimates in light of the England & Wales CensusSteve Smallwood and Neil ParkPopulation Quality UnitPresentation forSCOTLAND’S PEOPLE & PLACES – A JOURNEY FROM OUR PAST TO OUR FUTUREThursday 28th November 2013

Aims of presentation
• Outline what is meant by inter-censal drift.• Outline lessons learnt from the 2011 Census
about the England and Wales population.• Discuss why we know internal migration is a
major culprit.• Elaborate on the basic mechanisms that
cause internal migration related drift.• Briefly highlight some ways forward for
dealing with these issues.
Inter-censal drift
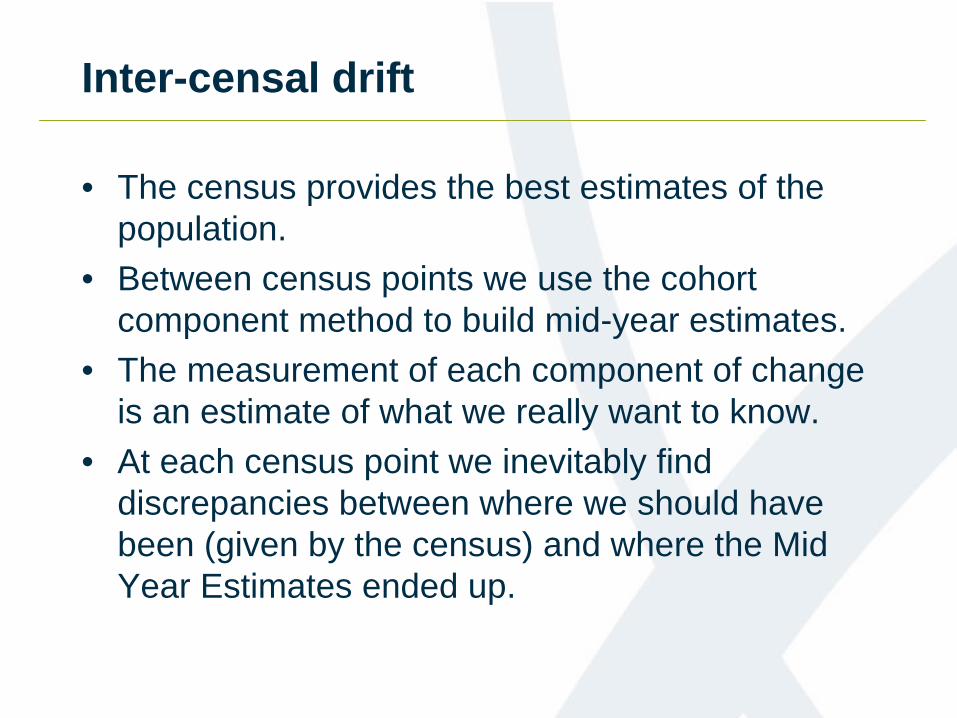
• The census provides the best estimates of the population.
• Between census points we use the cohort component method to build mid-year estimates.
• The measurement of each component of change is an estimate of what we really want to know.
• At each census point we inevitably find discrepancies between where we should have been (given by the census) and where the Mid Year Estimates ended up.
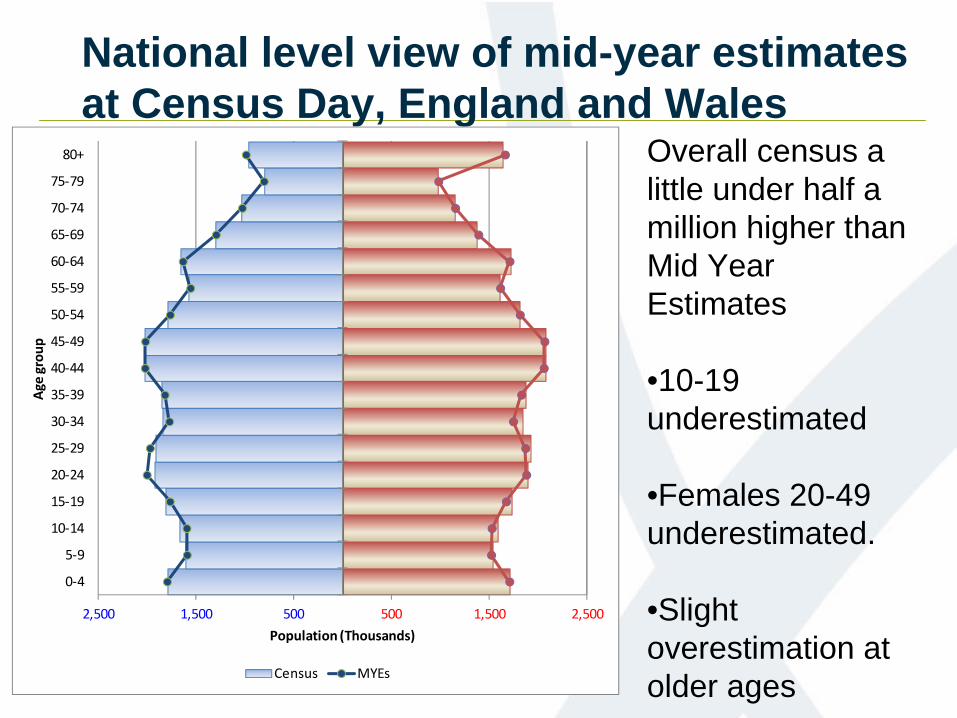
National level view of mid-year estimates at Census Day, England and Wales
2,500 1,500 500 500 1,500 2,500
0‐4
5‐9
10‐14
15‐19
20‐24
25‐29
30‐34
35‐39
40‐44
45‐49
50‐54
55‐59
60‐64
65‐69
70‐74
75‐79
80+
Population (Thousands)
Age
gro
up
Census MYEs
Overall census a little under half a million higher than Mid Year Estimates
•10-19 underestimated
•Females 20-49 underestimated.
•Slight overestimation at older ages
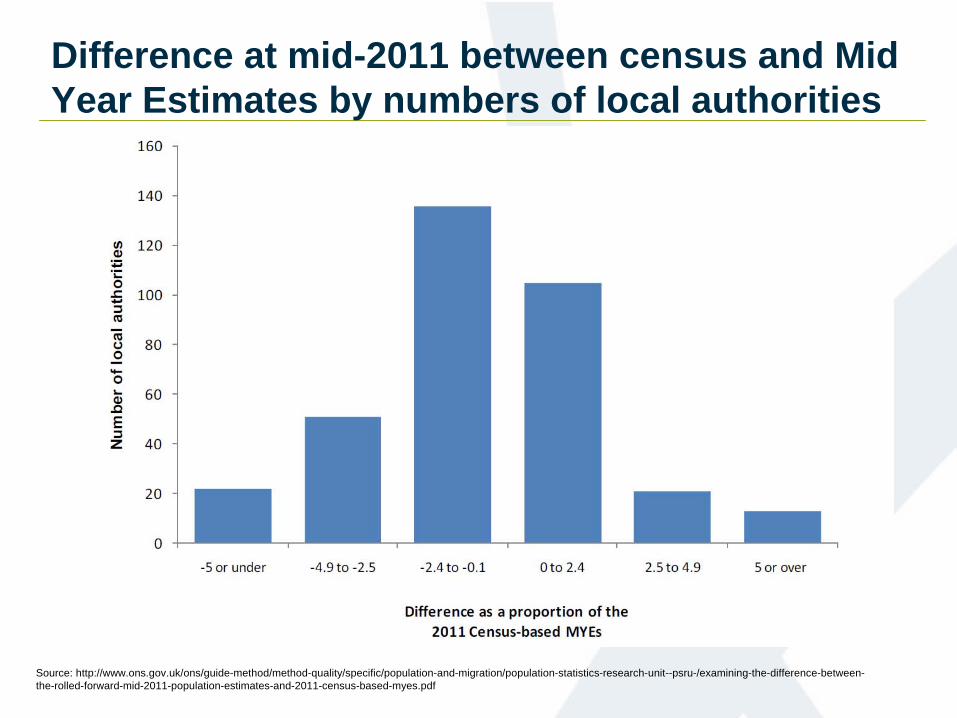
Difference at mid-2011 between census and Mid Year Estimates by numbers of local authorities
Source: http://www.ons.gov.uk/ons/guide-method/method-quality/specific/population-and-migration/population-statistics-research-unit--psru-/examining-the-difference-between- the-rolled-forward-mid-2011-population-estimates-and-2011-census-based-myes.pdf
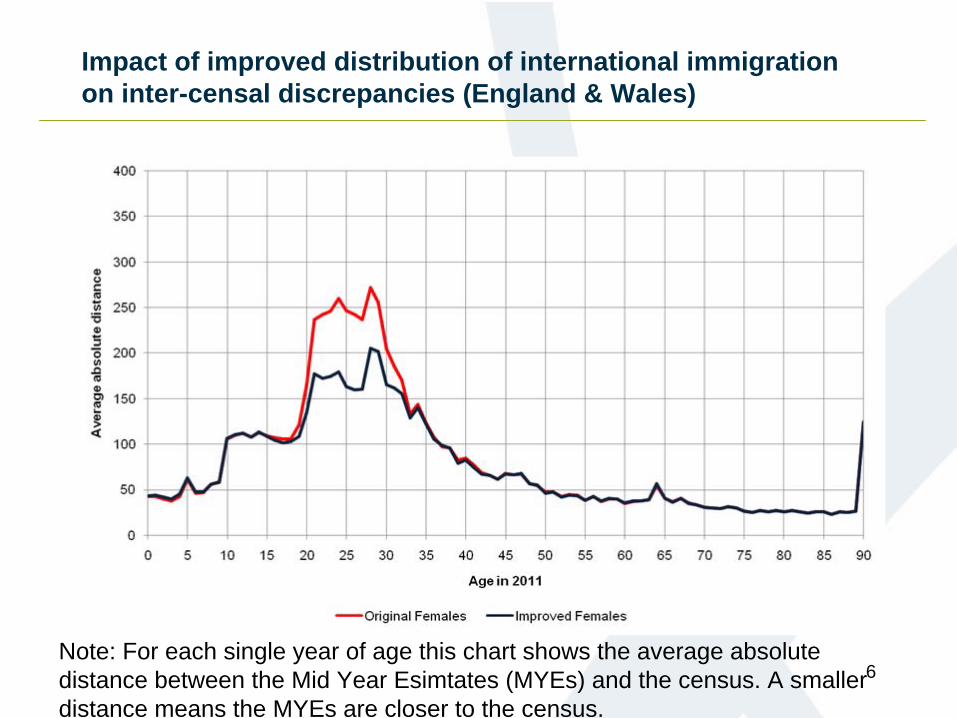
Impact of improved distribution of international immigration on inter-censal discrepancies (England & Wales)
6Note: For each single year of age this chart shows the average absolute distance between the Mid Year Esimtates (MYEs) and the census. A smaller distance means the MYEs are closer to the census.
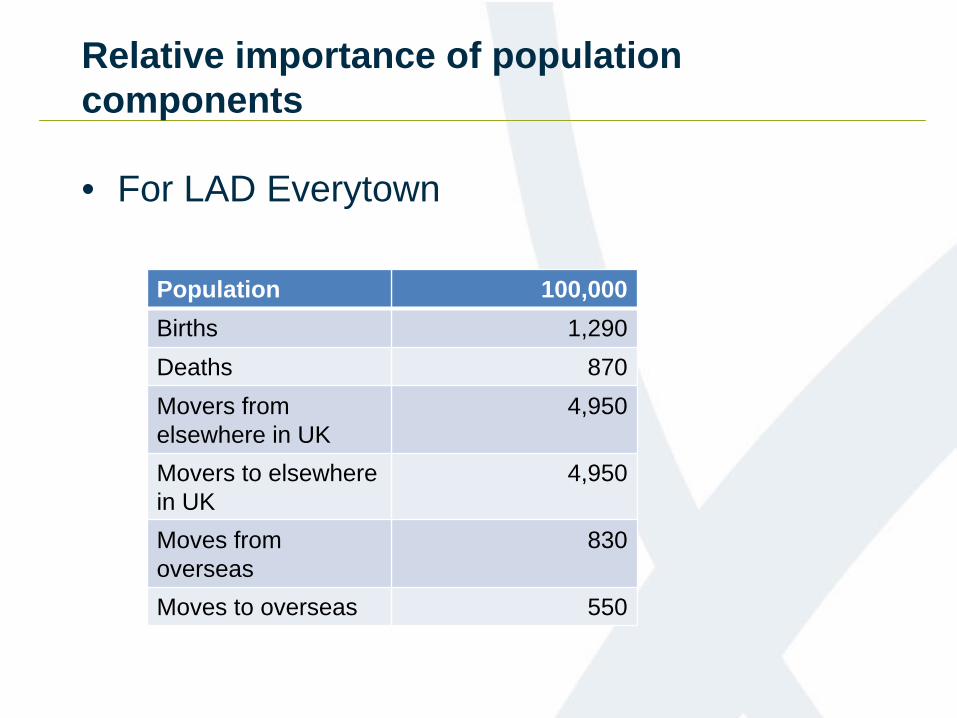
Relative importance of population components
• For LAD Everytown
Population 100,000Births 1,290Deaths 870Movers from elsewhere in UK
4,950
Movers to elsewhere in UK
4,950
Moves from overseas
830
Moves to overseas 550
Why do we think internal migration might explain some of this drift?
• Internal migration driven by changes in the patient register....we know that there are issues with patient register.
• Process of elimination, in some Local Authorities we know that other components of change have a minimal impact on the population – Internal migration is the only feasible culprit.
• Comparison of internal migration in Mid Year Estimate with census based internal migration

3 Issues with internal migration
• Missed movesA move by person A in time T that we never pick up
• Lagged movesA move by person A in time T that we pick up in T+1, T+2
etc.
• Interaction with the CensusA move by person A in time T that we pick up in T+1, T+2 etc
that has already been accounted for by the census

1. Missed moves
• Internal migration based around capturing address changes on patient registers, when people move they are not necessarily efficient at informing their doctor.
• Even where moves are missed consistently on both in and out flows there is a risk that net flows can be substantially distorted (consequently population estimates will also be distorted).
• The amount of distortion depends upon a number of factors including the proportion of missed moves and the overall flow size.
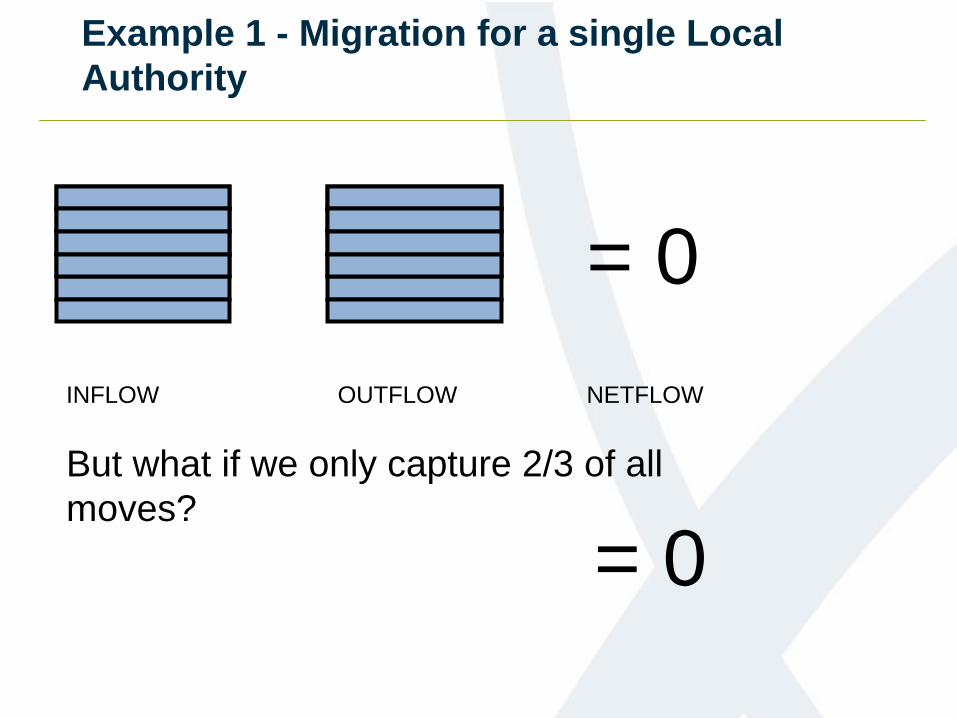
Example 1 - Migration for a single Local Authority
= 0INFLOW OUTFLOW NETFLOW
= 0But what if we only capture 2/3 of all moves?
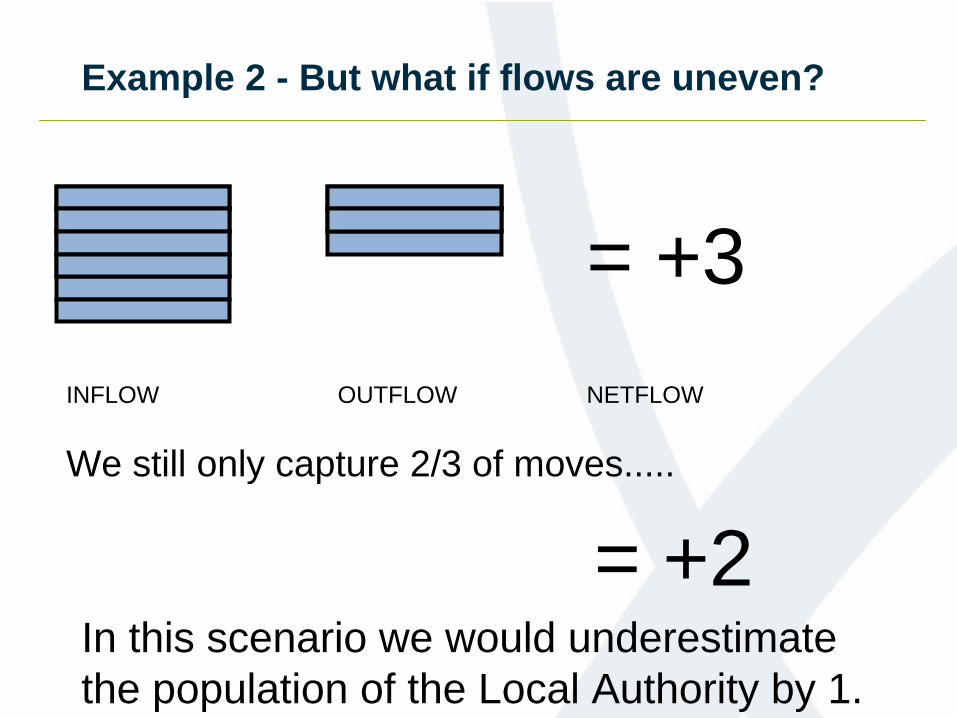
Example 2 - But what if flows are uneven?
= +3INFLOW OUTFLOW NETFLOW
= +2We still only capture 2/3 of moves.....
In this scenario we would underestimate the population of the Local Authority by 1.

What does this mean?
• Missing moves leads to dulled flows, what should go up doesn’t go up enough and what should go down doesn’t go down enough.
Underestimate MYE
Overestimate MYE

2. Lagged moves
• Few moves are completely missed, we just pick them up in the wrong time period, they are lagged.
• What does this mean in practice? It means that the flows we measure are a complex mix of:
Moves from Time TMoves from Time T-1Moves from Time T-2 etc.Measured moves for a given cohort can be overestimated
even though we miss a proportion of moves!
Beneficial in some ways
• Lags can mitigate against some of the bias of missed moves, by filling in gaps in the migration flows, for most age groups this is little more than noise as migration patterns for most age groups are relatively similar.
• But problematic when patterns of migration vary considerably by age.
• In these circumstances the lagged moves can be either too many or too few to fill the gap left by missed moves.
• For some age groups it’s feasible that we overestimate migration as a result.
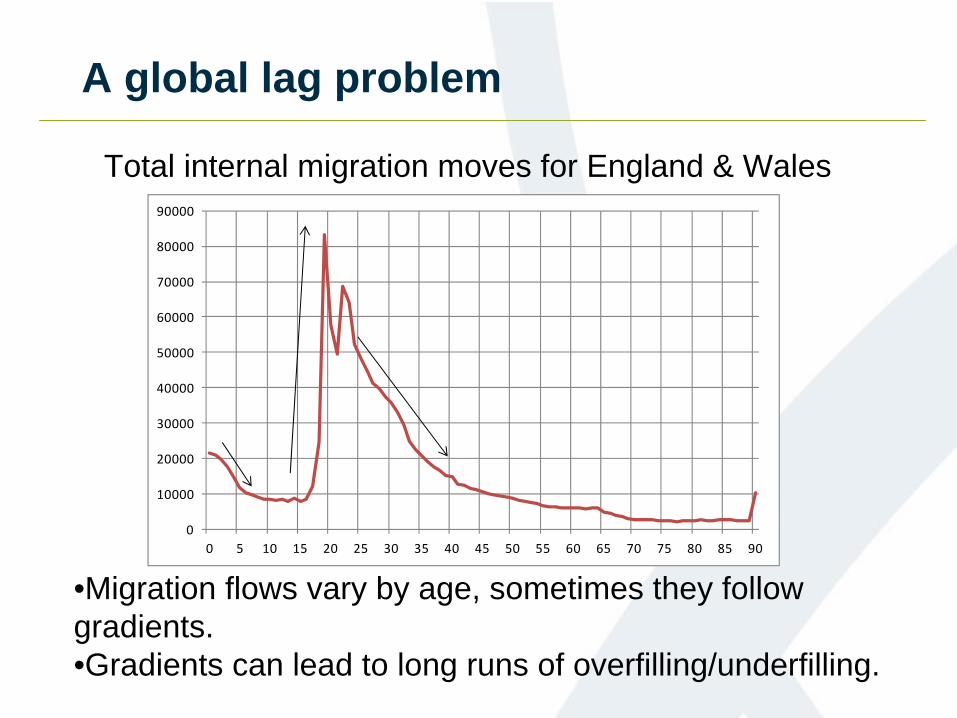
A global lag problem
•Migration flows vary by age, sometimes they follow gradients.•Gradients can lead to long runs of overfilling/underfilling.
0
10000
20000
30000
40000
50000
60000
70000
80000
90000
0 5 10 15 20 25 30 35 40 45 50 55 60 65 70 75 80 85 90
Total internal migration moves for England & Wales
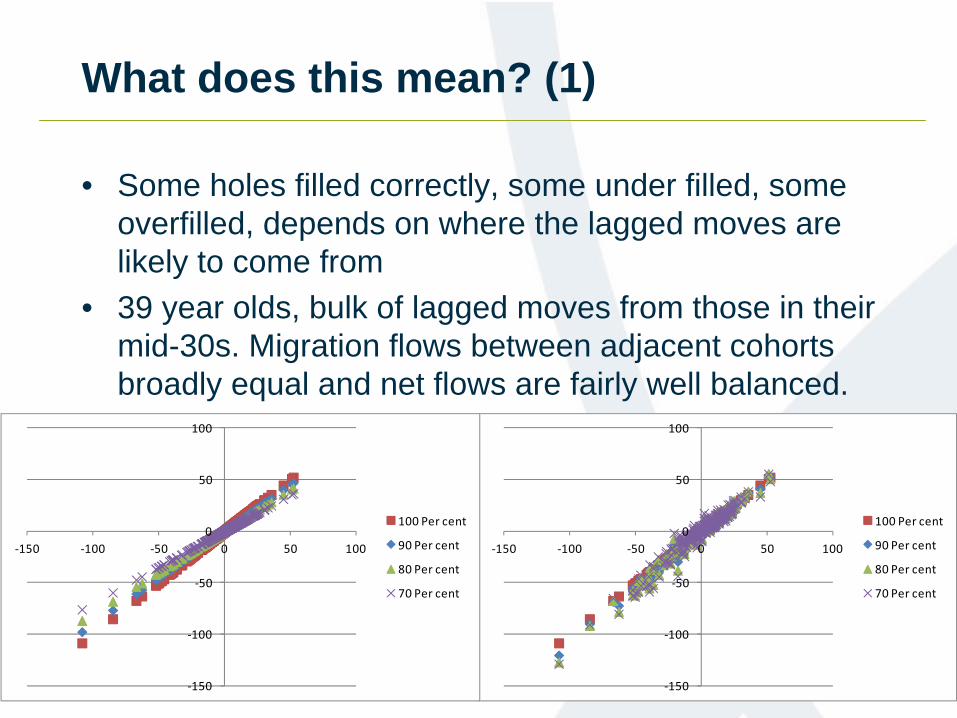
What does this mean? (1)
• Some holes filled correctly, some under filled, some overfilled, depends on where the lagged moves are likely to come from
• 39 year olds, bulk of lagged moves from those in their mid-30s. Migration flows between adjacent cohorts broadly equal and net flows are fairly well balanced.
‐150
‐100
‐50
0
50
100
‐150 ‐100 ‐50 0 50 100
100 Per cent
90 Per cent
80 Per cent
70 Per cent
‐150
‐100
‐50
0
50
100
‐150 ‐100 ‐50 0 50 100
100 Per cent
90 Per cent
80 Per cent
70 Per cent
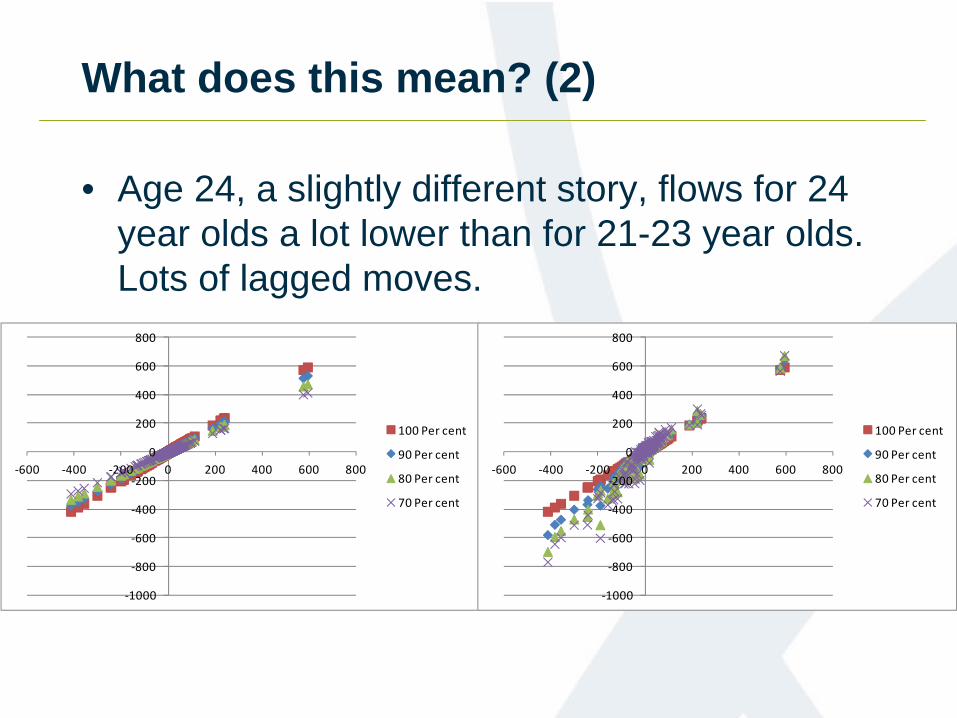
What does this mean? (2)
• Age 24, a slightly different story, flows for 24 year olds a lot lower than for 21-23 year olds. Lots of lagged moves.
‐1000
‐800
‐600
‐400
‐200
0
200
400
600
800
‐600 ‐400 ‐200 0 200 400 600 800
100 Per cent
90 Per cent
80 Per cent
70 Per cent
‐1000
‐800
‐600
‐400
‐200
0
200
400
600
800
‐600 ‐400 ‐200 0 200 400 600 800
100 Per cent
90 Per cent
80 Per cent
70 Per cent

3. The Census and internal migration distortions
• The census resets the mid-year estimates – at census point the estimates have no accumulation of drift errors (no lag issues).
• But, as we’ve already discussed measured internal migration is a composite of timely and lagged moves.
• Following census we apply our internal migration figures but some of the moves in our Mid Year Estimates have already been accounted for by the census.
• Duplication of internal migration moves.• An underestimate due to internal migration prior
to census becomes an overestimate after census.
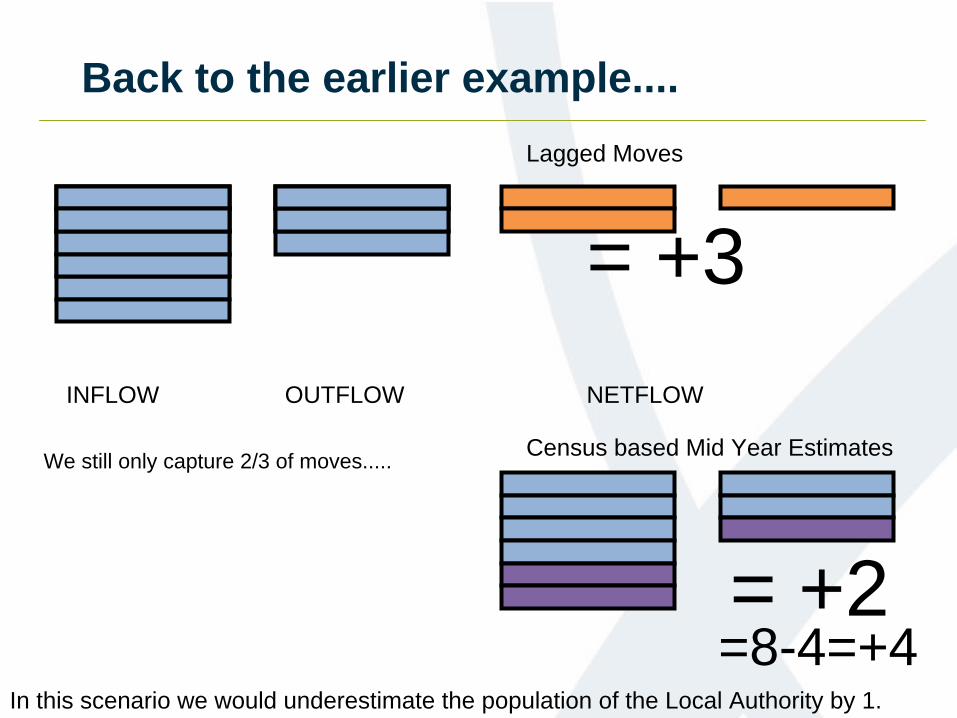
Back to the earlier example....
= +3INFLOW OUTFLOW NETFLOW
= +2
We still only capture 2/3 of moves.....
In this scenario we would underestimate the population of the Local Authority by 1.
Lagged Moves
Census based Mid Year Estimates
=8-4=+4

What does it look like?
• It generally affects cohorts aged 22-32 at the time of the census
• In student areas we end up underestimating these age groups over the course of the next decade.
• In non-student areas we end up overestimating these age groups over the course of the next decade.

But lots of mitigating factors
• If flows are absolutely low then the potential damage to the Mid Year Estimates is minimal.
Internal migration flows vary by age
• If flows net to (near) zero even if a large number of moves are missed the damage is likely to be small.
Where in/out flows are balanced the problem is minimalBecomes a visible problem when net movements are
directional
This was simple, real life is more complicated.
• There are some good reasons to suspect that the rate at which we miss moves varies by sex, age and geography.
Universities with their own health centres
• We don’t know how many moves we miss.• We don’t know the rate at which the which we
realise lagged moves.
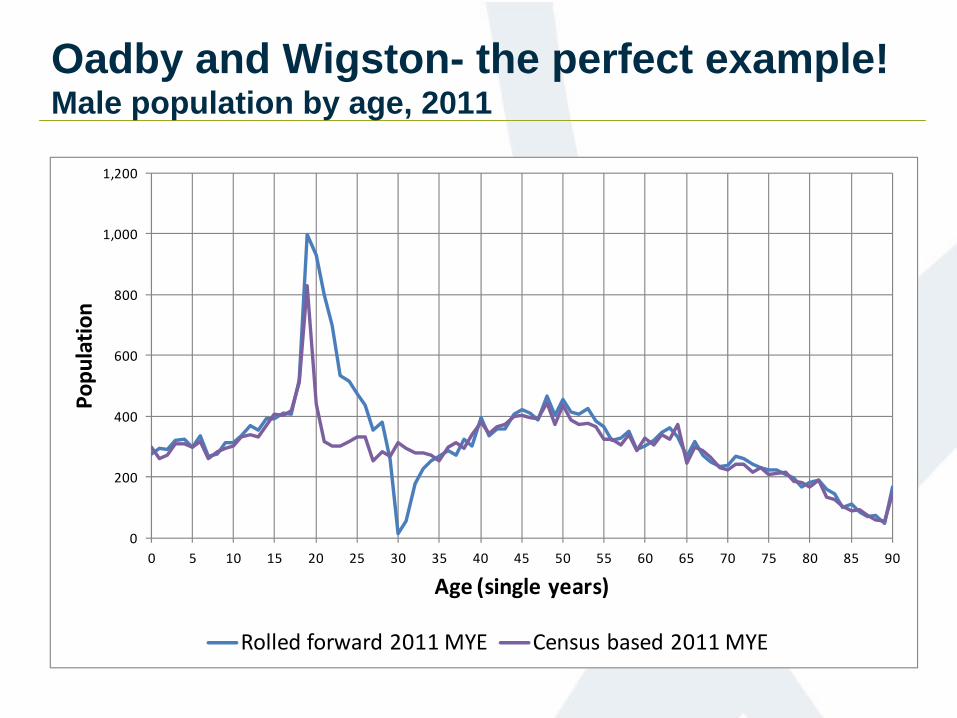
Oadby and Wigston- the perfect example! Male population by age, 2011
0
200
400
600
800
1,000
1,200
0 5 10 15 20 25 30 35 40 45 50 55 60 65 70 75 80 85 90
Popu
latio
n
Age (single years)
Rolled forward 2011 MYE Census based 2011 MYE
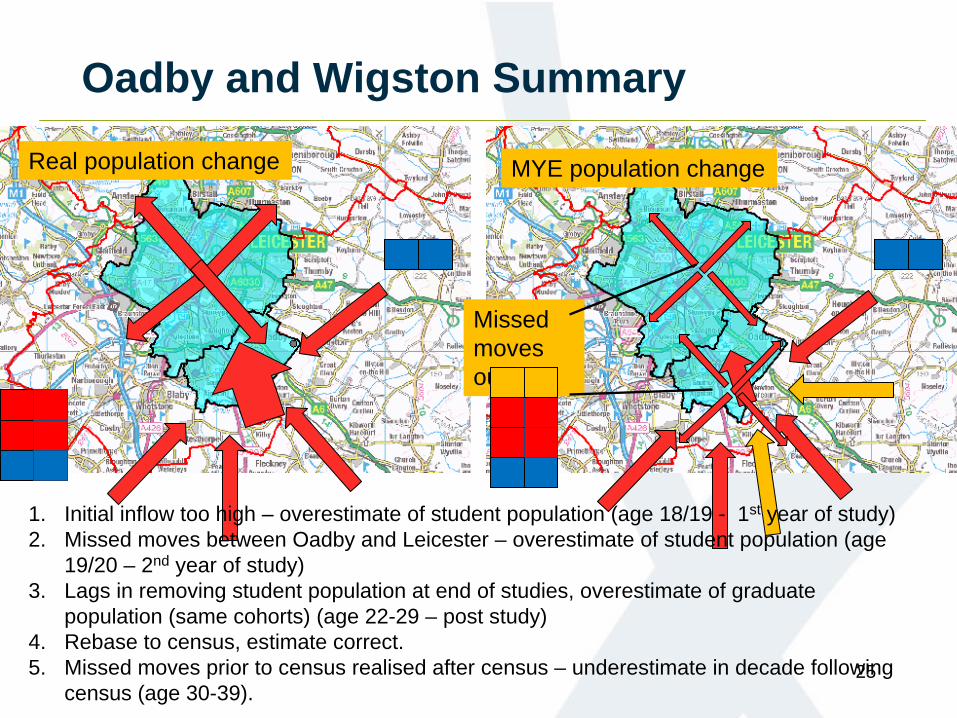
Oadby and Wigston Summary
25
1. Initial inflow too high – overestimate of student population (age 18/19 - 1st year of study)2. Missed moves between Oadby and Leicester – overestimate of student population (age
19/20 – 2nd year of study)3. Lags in removing student population at end of studies, overestimate of graduate
population (same cohorts) (age 22-29 – post study)4. Rebase to census, estimate correct.5. Missed moves prior to census realised after census – underestimate in decade following
census (age 30-39).
Real population change MYE population change
Missed moves out.

But it’s not just a problem for student areas
• We tended to have too many 20-29 year olds in student areas.
• Internal migration is zero-sum.• We can find symptoms of internal migration
issues in other places but these are more difficult to interpret.
• Over the course of a decade discrepancies from a number of sources can occur and obscure each other, detecting the signature of internal migration issues can be difficult.

In most circumstances Internal migration works well
• It works well for women• It works well for most age groups for men• It works well in most places• Student adjustment beneficial in many
circumstances
• Problems measuring moves by young men, long lags, wholly missed moves
• Student adjustments not always successful
27
What’s been/being done to solve this?
• 2001-2011 first decade in which all internal migration was PR based.
• Dealing with missing moves – constrain to NHS Central Register
• Student adjustments v1 (until Mid Year Estimate (MYE) 2011)
• Student adjustments v2 (from MYE 2012)
• Population Statistics Research Unit looking in detail at internal migration over the next year
• Longitundal Study (LS) Beta test.

Longitudinal Study (LS) Beta test 2013 updating Smallwood & Lynch, 2010
This will give us indications of:•How many patient register records are incorrectly addressed at the time of Census and might lead to duplicate moves.•How many moves are initially missed (those how moved in the last year according to Census)•The rate at which moves are realised (by analysing LS changes over time).

Some other things we have learnt
• People still think of census as a count• Don’t discount errors in 2001 when trying to
explain 2011 (including over count)• Importance of census household statistics• New releases of data raise new questions• For small area data in particular, comparison is
difficult now both 2001 and 2011 are estimates
Summary
• Internal migration is a key driver of inter-censal drift.
• All flows are at risk of some mis-measurement but the impacts of these are mitigated by:
• Balanced flows for most age groups in most places• Low numbers of movements for most age groups in most
places.
• One of the key reasons for discrepancies in estimates for 20-40 year olds.
• Non-random, bias increases over time.• Improving this is a priority for Office for National
Statistics.