dwelling stock estimates: 2017, england housing ... · figures are correct at the time of this...
TRANSCRIPT
Introduction 2 National estimates 2 Sub-national estimates 3 Tenure 3 Vacant dwellings 6 Methodology 7 Accompanying tables 11 Definitions 11 Technical notes 12 Enquiries 25
Housing Statistical Release 24 May 2018
Responsible Statistician: Neil Higgins Statistical enquiries: office hours: 0303 444 1864 [email protected]
Media Enquiries: 0303 444 1209 [email protected]
Date of next publication: May 2019
Dwelling Stock Estimates: 2017, England • There were 23.9 million dwellings in England at 31 March
2017, an increase of 217,000 dwellings (0.92%) on the same point the previous year.
• 15.1 million dwellings were owner occupied dwellings, 4.8 million private rented dwellings and 4.0 million social and affordable rented dwellings (Private Registered Providers plus Local Authority).
• Between March 2016 and March 2017, the owner occupied dwelling stock increased by 262,000 and the private rented stock decreased by 46,000. The social and affordable rented stock increased by 3,000 dwellings and the other public sector stock decreased by 1,000 dwellings.
• There were 605,891 vacant dwellings in England on 2 October 2017, an increase of 16,125 (2.7%) from 589,766 on 3 October 2016. Vacant dwellings are 2.5 per cent of the dwelling stock.
• Long-term vacant dwellings numbered 205,293 on 2 October 2017, an increase of 5,148 (2.6%) from 200,145 on 3 October 2016. Long-term vacant dwellings are 0.9 per cent of the dwelling stock.
(Vacancy figures as previously published in Council Taxbase statistics
and Live Table 615)
2 Housing Statistical Release
Introduction This Statistical Release presents estimates of the number of dwellings in England and in each local authority district. The estimates are at 31 March each year. The statistics use the Census 2011 as a baseline and apply annual net changes to stock as measured by the related housing supply; net additional dwellings statistics (see related statistics). Estimates for Scotland, Wales and Northern Ireland, Great Britain and the UK are also available in the live tables on the Ministry of Housing, Communities and Local Government website. These data are produced and published separately by the devolved administrations, and although the figures are correct at the time of this publication they may be superseded before the next England dwelling stock estimates release.
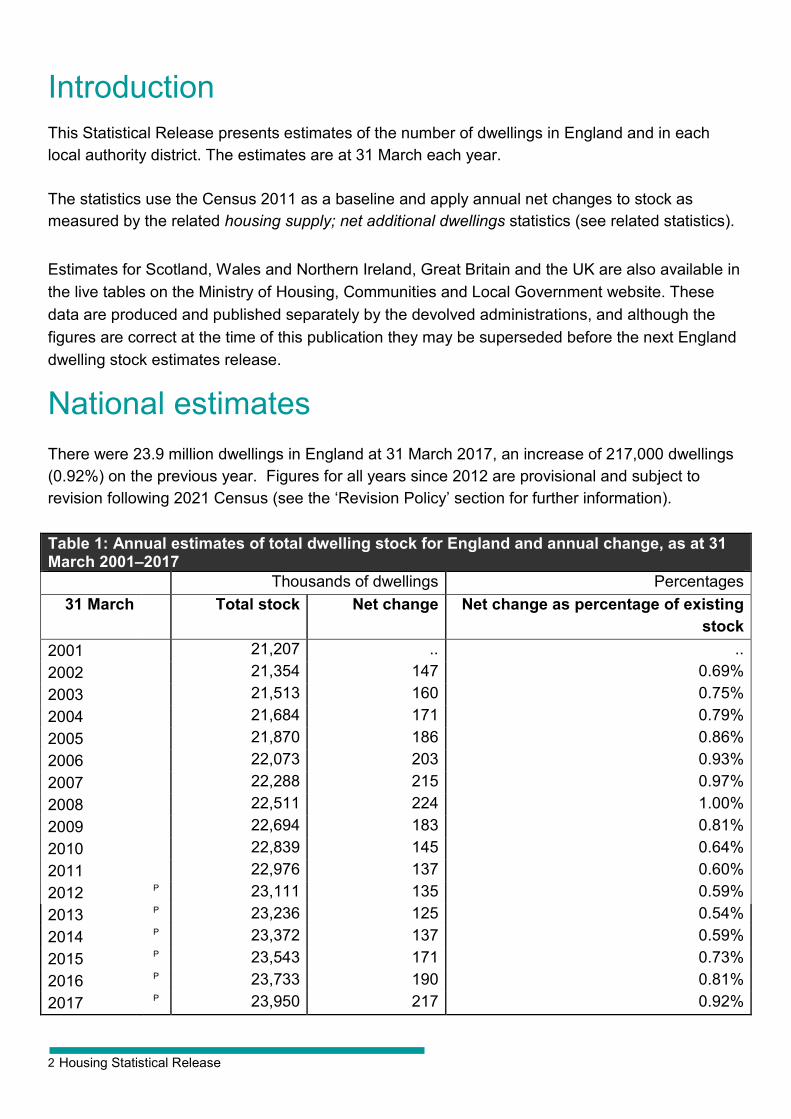
National estimates There were 23.9 million dwellings in England at 31 March 2017, an increase of 217,000 dwellings (0.92%) on the previous year. Figures for all years since 2012 are provisional and subject to revision following 2021 Census (see the ‘Revision Policy’ section for further information). Table 1: Annual estimates of total dwelling stock for England and annual change, as at 31 March 2001–2017
Thousands of dwellings Percentages 31 March
Total stock Net change Net change as percentage of existing
stock 2001 21,207 .. .. 2002 21,354 147 0.69% 2003 21,513 160 0.75% 2004 21,684 171 0.79% 2005 21,870 186 0.86% 2006 22,073 203 0.93% 2007 22,288 215 0.97% 2008 22,511 224 1.00% 2009 22,694 183 0.81% 2010 22,839 145 0.64% 2011 22,976 137 0.60% 2012 P 23,111 135 0.59% 2013 P 23,236 125 0.54% 2014 P 23,372 137 0.59% 2015 P 23,543 171 0.73% 2016 P 23,733 190 0.81% 2017 P 23,950 217 0.92%
3 Housing Statistical Release
Sub-national estimates
Local authority district estimates Local authority district estimates are available in the live tables 100 and 125. The same methodology (census + net additions) is used to produce estimates at this level of detail as at the national and regional levels, using a methodology endorsed by the Office for National Statistics. Live table 125 presents district level totals from 2001 to 2017. Live table 100 shows district level information with a tenure breakdown between local authority, Private Registered Providers (PRPs), other public sector and private sector. Live table 100 covers the years from 2009 to 2017.
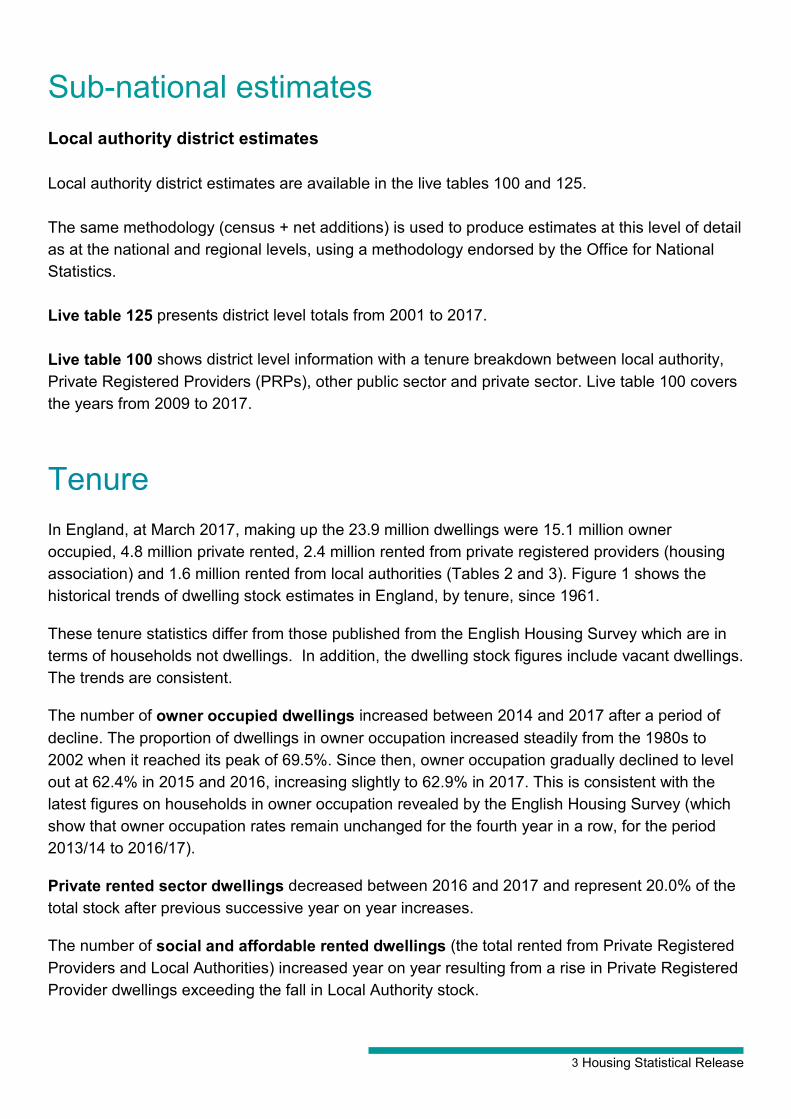
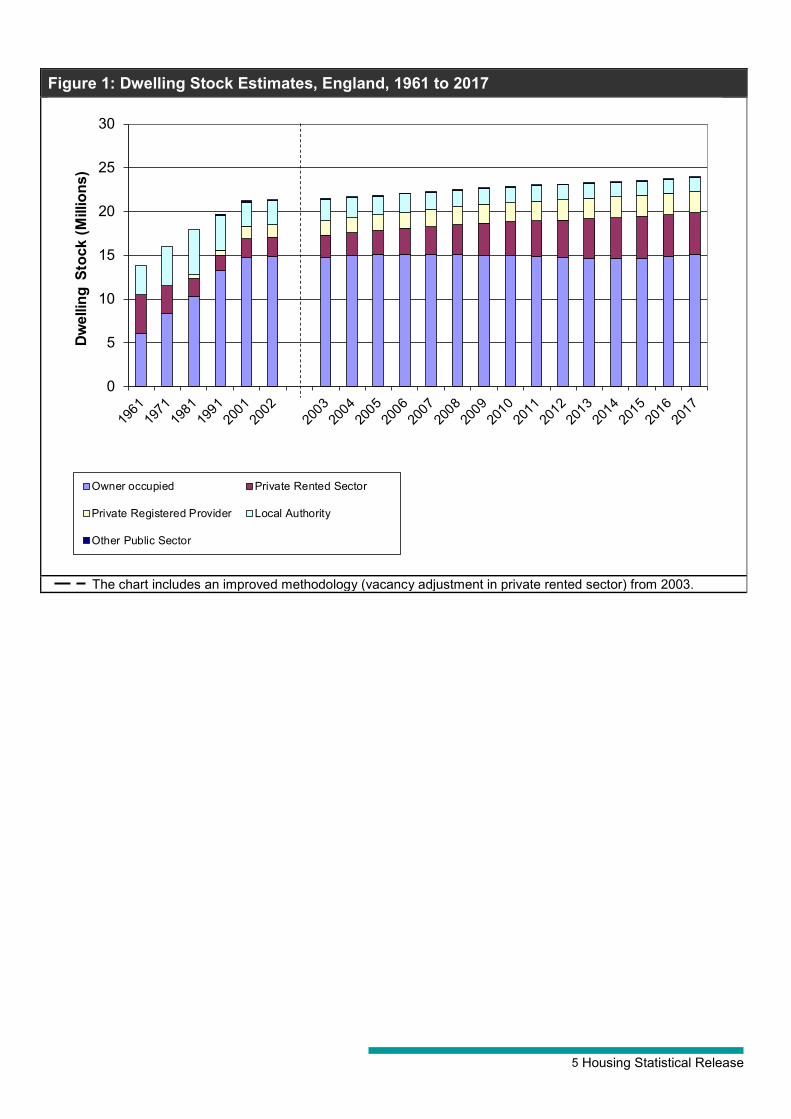
Tenure In England, at March 2017, making up the 23.9 million dwellings were 15.1 million owner occupied, 4.8 million private rented, 2.4 million rented from private registered providers (housing association) and 1.6 million rented from local authorities (Tables 2 and 3). Figure 1 shows the historical trends of dwelling stock estimates in England, by tenure, since 1961.
These tenure statistics differ from those published from the English Housing Survey which are in terms of households not dwellings. In addition, the dwelling stock figures include vacant dwellings. The trends are consistent.
The number of owner occupied dwellings increased between 2014 and 2017 after a period of decline. The proportion of dwellings in owner occupation increased steadily from the 1980s to 2002 when it reached its peak of 69.5%. Since then, owner occupation gradually declined to level out at 62.4% in 2015 and 2016, increasing slightly to 62.9% in 2017. This is consistent with the latest figures on households in owner occupation revealed by the English Housing Survey (which show that owner occupation rates remain unchanged for the fourth year in a row, for the period 2013/14 to 2016/17).
Private rented sector dwellings decreased between 2016 and 2017 and represent 20.0% of the total stock after previous successive year on year increases.
The number of social and affordable rented dwellings (the total rented from Private Registered Providers and Local Authorities) increased year on year resulting from a rise in Private Registered Provider dwellings exceeding the fall in Local Authority stock.
4 Housing Statistical Release
Table 2: Dwelling stock in England by tenure, as at 31 March 2001–2017
Thousands of dwellings 31 March
Owner occupied
Rented privately
or with a job or
business
Rented from Private
Registered Providers and Local
Authorities
Of which Rented
from Private
Registered Providers
Of which Rented
from Local
Authorities
Other public sector
dwellings
All dwellings
2001 14,735 2,133 4,236 1,424 2,812 103 21,207 2002 14,846 2,197 4,198 1,492 2,706 112 21,354 2003 14,752 2,549 4,108 1,651 2,457 104 21,513 2004 14,986 2,578 4,037 1,702 2,335 83 21,684 2005 15,100 2,720 3,968 1,802 2,166 82 21,870 2006 15,052 2,987 3,952 1,865 2,087 82 22,073 2007 15,093 3,182 3,938 1,951 1,987 75 22,288 2008 15,067 3,443 3,927 2,056 1,870 74 22,511 2009 14,968 3,705 3,947 2,128 1,820 74 22,694 2010 14,895 3,912 3,966 2,180 1,786 66 22,839 2011 14,827 4,105 3,981 2,255 1,726 63 22,976 2012 P 14,754 4,286 3,996 2,304 1,693 75 23,111 2013 P 14,685 4,465 4,013 2,331 1,682 73 23,236 2014 P 14,674 4,623 4,012 2,343 1,669 64 23,372 2015 P 14,684 4,773 4,030 2,387 1,643 55 23,543 2016 P R 14,801 4,832 4,042 2,430 1,612 57 23,733 20171 P 15,062 4,786 4,045 2,444 1,602 56 23,950 1 EHS 2017 vacancy data are not yet available to adjust the LFS 2017 privately rented tenure estimates. Therefore, EHS 2016 vacancy data has been used for the LFS 2017 adjustment This will be updated once the required survey information becomes available.
5 Housing Statistical Release
Figure 1: Dwelling Stock Estimates, England, 1961 to 2017
The chart includes an improved methodology (vacancy adjustment in private rented sector) from 2003.
0
5
10
15
20
25
30
Dw
ellin
g St
ock
(Mill
ions
)
Owner occupied Private Rented Sector
Private Registered Provider Local Authority
Other Public Sector
6 Housing Statistical Release
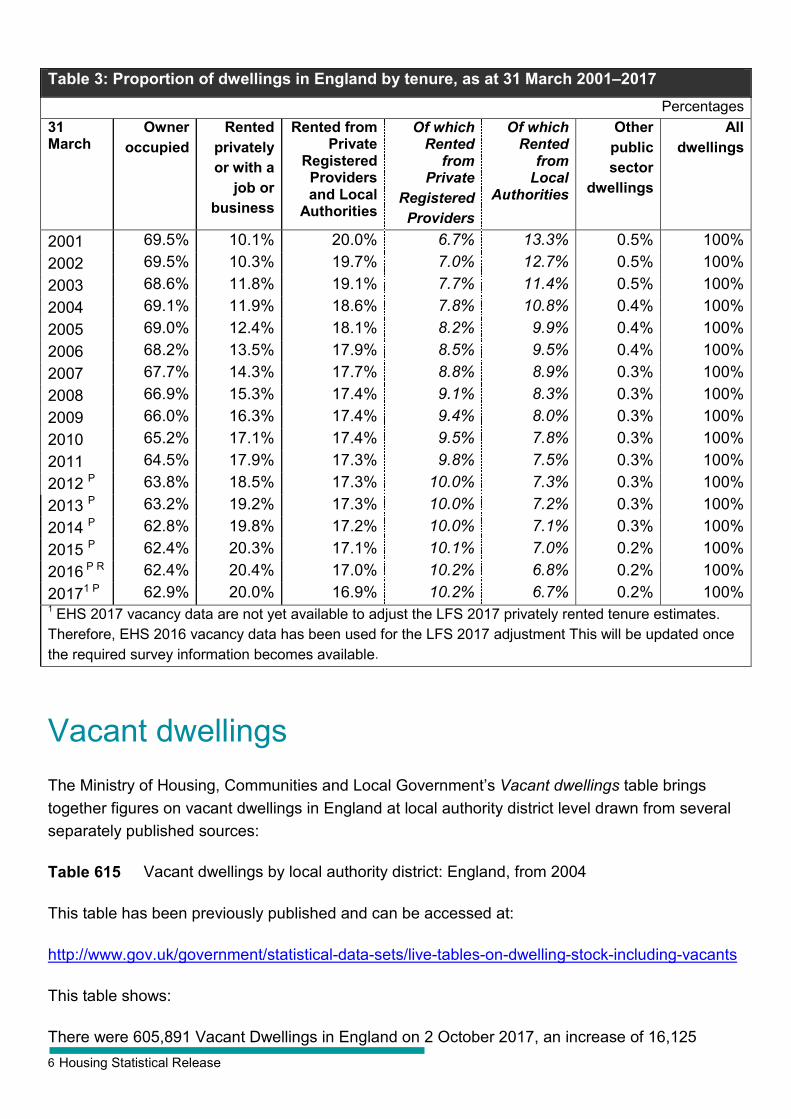
Table 3: Proportion of dwellings in England by tenure, as at 31 March 2001–2017
Percentages 31 March
Owner occupied
Rented privately
or with a job or
business
Rented from Private
Registered Providers and Local
Authorities
Of which Rented
from Private
Registered Providers
Of which Rented
from Local
Authorities
Other public sector
dwellings
All dwellings
2001 69.5% 10.1% 20.0% 6.7% 13.3% 0.5% 100% 2002 69.5% 10.3% 19.7% 7.0% 12.7% 0.5% 100% 2003 68.6% 11.8% 19.1% 7.7% 11.4% 0.5% 100% 2004 69.1% 11.9% 18.6% 7.8% 10.8% 0.4% 100% 2005 69.0% 12.4% 18.1% 8.2% 9.9% 0.4% 100% 2006 68.2% 13.5% 17.9% 8.5% 9.5% 0.4% 100% 2007 67.7% 14.3% 17.7% 8.8% 8.9% 0.3% 100% 2008 66.9% 15.3% 17.4% 9.1% 8.3% 0.3% 100% 2009 66.0% 16.3% 17.4% 9.4% 8.0% 0.3% 100% 2010 65.2% 17.1% 17.4% 9.5% 7.8% 0.3% 100% 2011 64.5% 17.9% 17.3% 9.8% 7.5% 0.3% 100% 2012 P 63.8% 18.5% 17.3% 10.0% 7.3% 0.3% 100% 2013 P 63.2% 19.2% 17.3% 10.0% 7.2% 0.3% 100% 2014 P 62.8% 19.8% 17.2% 10.0% 7.1% 0.3% 100% 2015 P 62.4% 20.3% 17.1% 10.1% 7.0% 0.2% 100% 2016 P R 62.4% 20.4% 17.0% 10.2% 6.8% 0.2% 100% 20171 P 62.9% 20.0% 16.9% 10.2% 6.7% 0.2% 100% 1 EHS 2017 vacancy data are not yet available to adjust the LFS 2017 privately rented tenure estimates. Therefore, EHS 2016 vacancy data has been used for the LFS 2017 adjustment This will be updated once the required survey information becomes available.
Vacant dwellings The Ministry of Housing, Communities and Local Government’s Vacant dwellings table brings together figures on vacant dwellings in England at local authority district level drawn from several separately published sources:
Table 615 Vacant dwellings by local authority district: England, from 2004
This table has been previously published and can be accessed at:
http://www.gov.uk/government/statistical-data-sets/live-tables-on-dwelling-stock-including-vacants
This table shows:
There were 605,891 Vacant Dwellings in England on 2 October 2017, an increase of 16,125
7 Housing Statistical Release
(2.7%) from 589,766 on 3 October 2016. Vacant dwellings are 2.5 per cent of the dwelling stock in England on 2 October 2017.
There were 205,293 Long-Term Vacant Dwellings1 in England on 2 October 2017, an increase of 5,148 (2.6%) from 200,145 on 3 October 2016. Long-term vacant dwellings are 0.9 per cent of the dwelling stock in England on 2 October 2017.
The England figures above have been previously published within the Council Taxbase statistics and in Live Table 615.
Methodology
Local authority stock
Since 2012, the data on local authority and other public sector housing stock are taken from the Ministry of Housing, Communities and Local Government’s Local Authority Housing Statistics (LAHS) return, which is completed and returned every year by local authorities. Prior to 2012, the data were taken from the Ministry of Housing, Communities and Local Government’s Housing Strategy Statistical Appendix (HSSA). These data are used directly in the dwelling stock tenure split. A web link to this data source where you can find further information is given in the ‘Data collection’ section of this publication.
Private Registered Provider stock Information on PRP stock prior to 2012 comes from the Tenant Services Authority (TSA) Regulatory and Statistical Return (RSR). From April 2012, the TSA had become part of the Homes and Communities Agency (HCA), now Homes England and information on PRP stock is now published in their annual Statistical Data Return (SDR). The SDR (and the RSR in the past) is completed by all PRPs every year in one of two variants; with larger PRPs completing a longer, more detailed form (the ‘long form’) than smaller ones (who complete the ‘short form’). Up to 2006, the threshold for completing the long form was that the PRP owned or managed at least 250 units or bed spaces of social housing. From 2007 this increased to 1,000 units or bed spaces of social housing. For 2012, the threshold for completing the long form was that the PRP owned at least 1000 units or bed spaces of social housing or was the parent of a group, while, for 2013, the threshold was simply owning at least 1000 units or bed spaces of social housing. A web link to this data source where you can find further information is given in the ‘Data collection’ section of this publication. The RSR and SDR data include information on bed spaces as well as self-contained dwellings. In
1 From 2004 to 2012, Long-term empty homes are those dwellings which have been unoccupied and substantially unfurnished for over six months. Up until April 2013 local authorities could use their discretion to award these dwellings a discount of between 0% and 50%. Since April 2013 Local authorities can now set that level of discount anywhere between 0% and 100% and can also charge a premium of up to 50% on those properties which have been empty for more than 2 years. Source: Council Tax Base Statistics.
8 Housing Statistical Release
calculating dwelling stock numbers, bed spaces are not included as they do not represent a separate, self-contained dwelling. Dwellings are also reported on the RSR and SDR separately as general needs and supported dwellings (where the occupant requires some form of special facilities or care). Supported dwellings include both Supported Housing and Housing for Older People. Due to the format of the data collection and the need to minimise the burden on data providers of completing the form, it is not possible to separate out bed spaces from self-contained dwellings in all categories. The treatment of the different categories is detailed below. General needs, long form In both the RSR and the SDR, data on general needs dwellings provided on the long form are split between bed spaces and self-contained dwellings. Only the self-contained dwellings are included in the numbers published here. General needs, short form In the RSR (prior to 2012), data on general needs dwellings collected on the short form only give a total including bed spaces and self-contained dwellings combined. The short form data represent a small (around 3 per cent) proportion of the general needs stock and from the long form data bed spaces make up less than 1 per cent of the total general needs stock. Due to the small size of the adjustment which would have to be made and having no directly comparable data from which to adjust, short form general needs totals are left unadjusted for bed spaces. In the SDR (from 2012), data on general needs dwellings collected on the short form are split between bed spaces and self-contained dwellings in the same way as for the long form. Again, only the self-contained dwellings are included here. Supported, long and short form In both the RSR and the SDR, for supported dwellings, only a combined bed space and dwellings figure is reported at sub-national level and comprises the short and long form data combined. At a national level the long form data provide a split between supported bed spaces and self-contained dwellings. This is used to calculate the percentage of long form supported dwellings which are self-contained. The percentage is then used to adjust the sub-national supported dwellings totals to give an estimate of the number of self-contained supported dwellings. For the RSR data (collected prior to 2012) this adjustment was made for all supported dwellings collectively but for the SDR data (from 2012), it is made separately for the Supported Housing and Housing for Older People sub-categories. Total Prior to 2012, the PRP stock figure from the RSR was then calculated as the total:
9 Housing Statistical Release
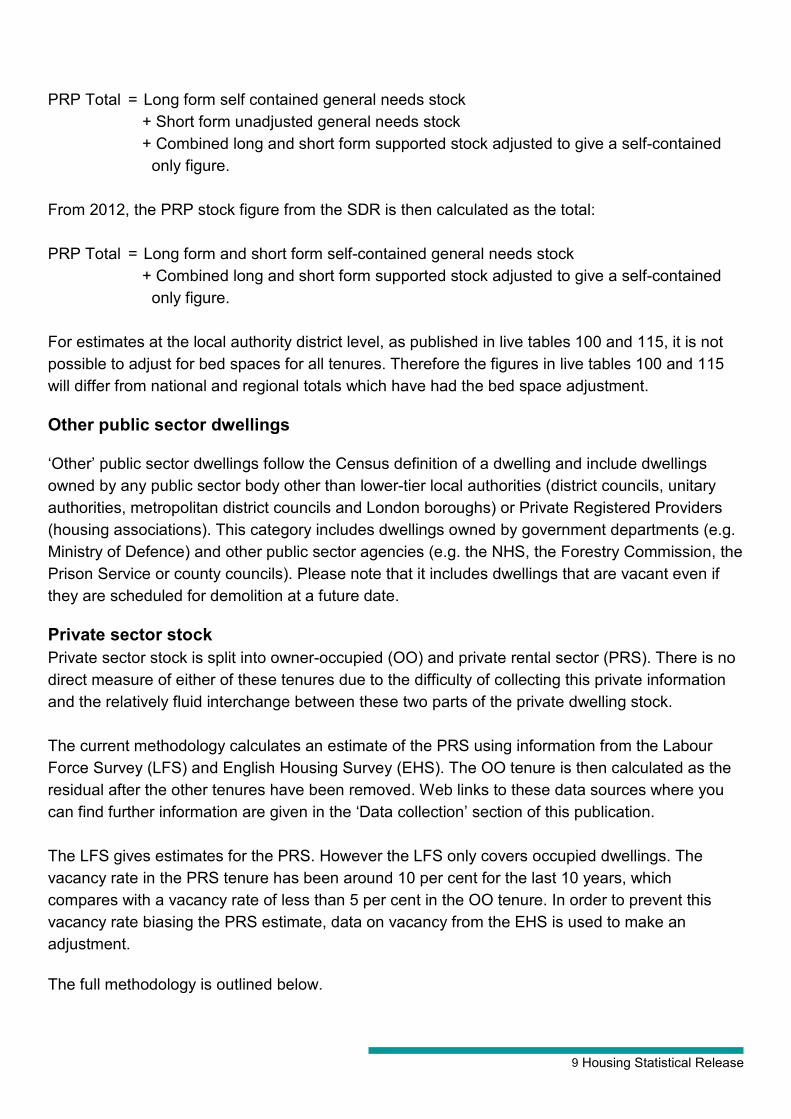
PRP Total = Long form self contained general needs stock
+ Short form unadjusted general needs stock + Combined long and short form supported stock adjusted to give a self-contained
only figure. From 2012, the PRP stock figure from the SDR is then calculated as the total: PRP Total = Long form and short form self-contained general needs stock
+ Combined long and short form supported stock adjusted to give a self-contained only figure.
For estimates at the local authority district level, as published in live tables 100 and 115, it is not possible to adjust for bed spaces for all tenures. Therefore the figures in live tables 100 and 115 will differ from national and regional totals which have had the bed space adjustment.
Other public sector dwellings
‘Other’ public sector dwellings follow the Census definition of a dwelling and include dwellings owned by any public sector body other than lower-tier local authorities (district councils, unitary authorities, metropolitan district councils and London boroughs) or Private Registered Providers (housing associations). This category includes dwellings owned by government departments (e.g. Ministry of Defence) and other public sector agencies (e.g. the NHS, the Forestry Commission, the Prison Service or county councils). Please note that it includes dwellings that are vacant even if they are scheduled for demolition at a future date.
Private sector stock Private sector stock is split into owner-occupied (OO) and private rental sector (PRS). There is no direct measure of either of these tenures due to the difficulty of collecting this private information and the relatively fluid interchange between these two parts of the private dwelling stock. The current methodology calculates an estimate of the PRS using information from the Labour Force Survey (LFS) and English Housing Survey (EHS). The OO tenure is then calculated as the residual after the other tenures have been removed. Web links to these data sources where you can find further information are given in the ‘Data collection’ section of this publication. The LFS gives estimates for the PRS. However the LFS only covers occupied dwellings. The vacancy rate in the PRS tenure has been around 10 per cent for the last 10 years, which compares with a vacancy rate of less than 5 per cent in the OO tenure. In order to prevent this vacancy rate biasing the PRS estimate, data on vacancy from the EHS is used to make an adjustment. The full methodology is outlined below.
10 Housing Statistical Release
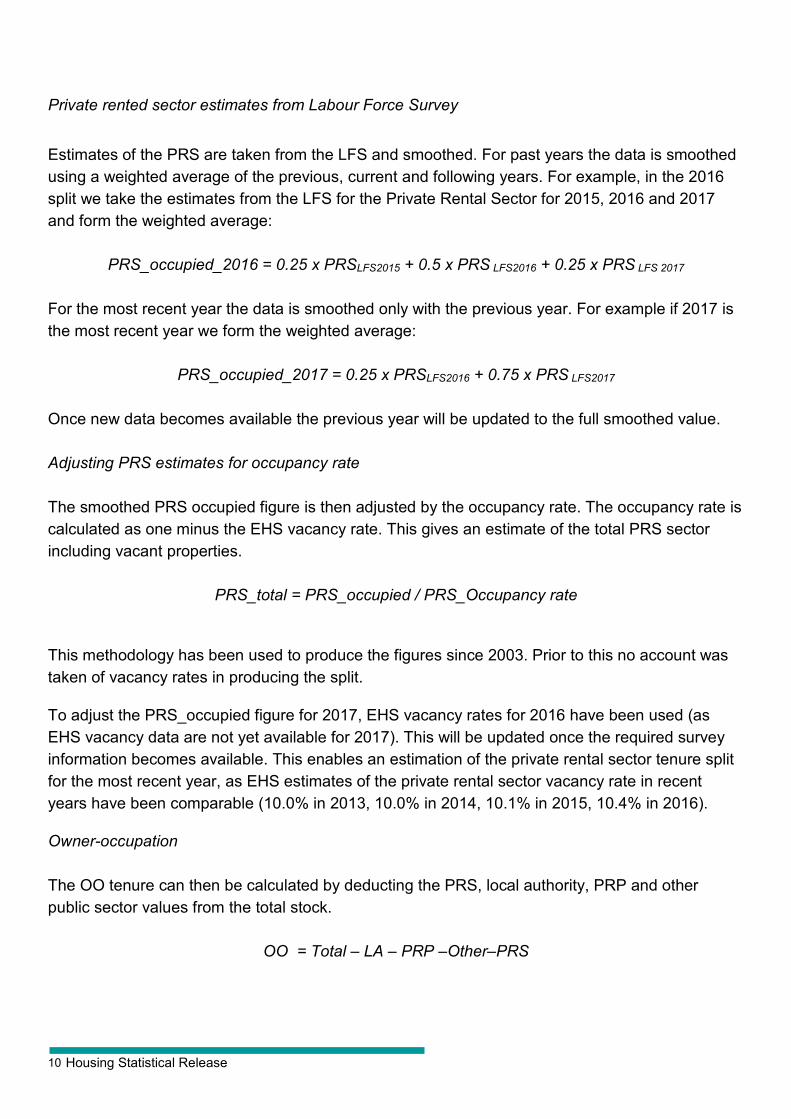
Private rented sector estimates from Labour Force Survey
Estimates of the PRS are taken from the LFS and smoothed. For past years the data is smoothed using a weighted average of the previous, current and following years. For example, in the 2016 split we take the estimates from the LFS for the Private Rental Sector for 2015, 2016 and 2017 and form the weighted average:
PRS_occupied_2016 = 0.25 x PRSLFS2015 + 0.5 x PRS LFS2016 + 0.25 x PRS LFS 2017 For the most recent year the data is smoothed only with the previous year. For example if 2017 is the most recent year we form the weighted average:
PRS_occupied_2017 = 0.25 x PRSLFS2016 + 0.75 x PRS LFS2017 Once new data becomes available the previous year will be updated to the full smoothed value. Adjusting PRS estimates for occupancy rate The smoothed PRS occupied figure is then adjusted by the occupancy rate. The occupancy rate is calculated as one minus the EHS vacancy rate. This gives an estimate of the total PRS sector including vacant properties.
PRS_total = PRS_occupied / PRS_Occupancy rate
This methodology has been used to produce the figures since 2003. Prior to this no account was taken of vacancy rates in producing the split.
To adjust the PRS_occupied figure for 2017, EHS vacancy rates for 2016 have been used (as EHS vacancy data are not yet available for 2017). This will be updated once the required survey information becomes available. This enables an estimation of the private rental sector tenure split for the most recent year, as EHS estimates of the private rental sector vacancy rate in recent years have been comparable (10.0% in 2013, 10.0% in 2014, 10.1% in 2015, 10.4% in 2016).
Owner-occupation The OO tenure can then be calculated by deducting the PRS, local authority, PRP and other public sector values from the total stock.
OO = Total – LA – PRP –Other–PRS
11 Housing Statistical Release
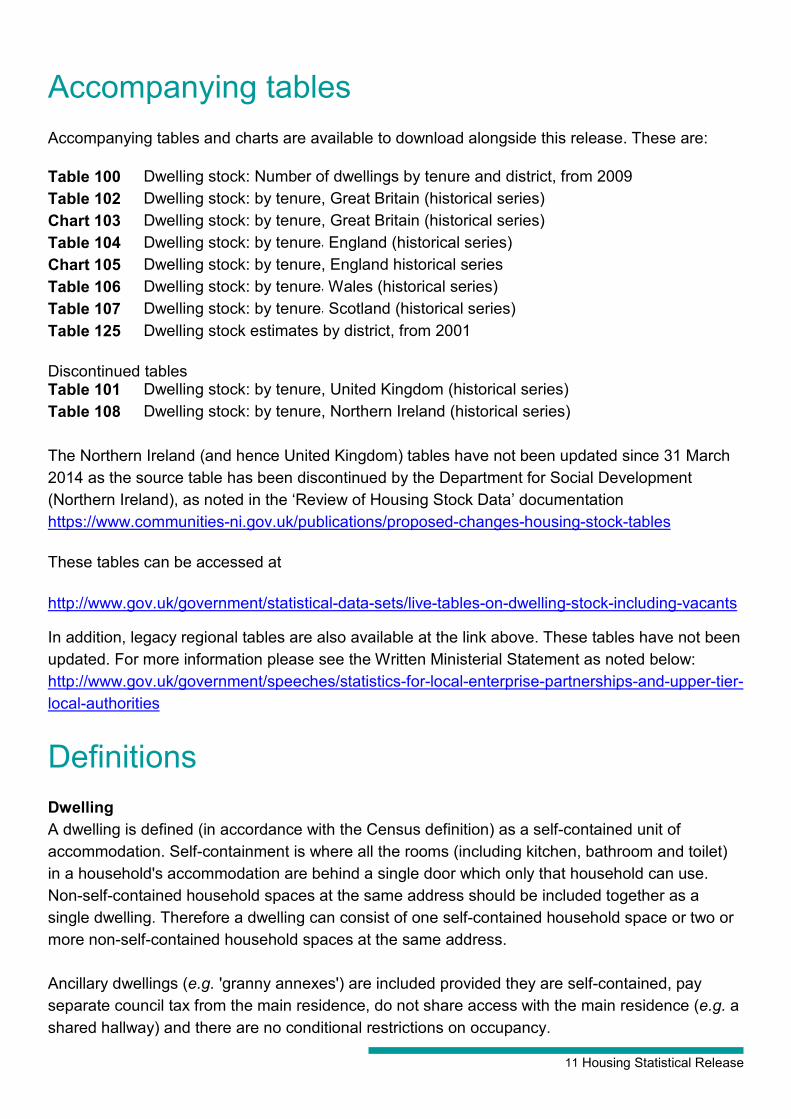
Accompanying tables
Accompanying tables and charts are available to download alongside this release. These are:
Table 100 Dwelling stock: Number of dwellings by tenure and district, from 2009 Table 102 Dwelling stock: by tenure, Great Britain (historical series) Chart 103 Dwelling stock: by tenure, Great Britain (historical series) Table 104 Dwelling stock: by tenure, England (historical series) Chart 105 Dwelling stock: by tenure, England historical series Table 106 Dwelling stock: by tenure, Wales (historical series) Table 107 Dwelling stock: by tenure, Scotland (historical series) Table 125 Dwelling stock estimates by district, from 2001 Discontinued tables Table 101 Dwelling stock: by tenure, United Kingdom (historical series) Table 108 Dwelling stock: by tenure, Northern Ireland (historical series) The Northern Ireland (and hence United Kingdom) tables have not been updated since 31 March 2014 as the source table has been discontinued by the Department for Social Development (Northern Ireland), as noted in the ‘Review of Housing Stock Data’ documentation https://www.communities-ni.gov.uk/publications/proposed-changes-housing-stock-tables These tables can be accessed at http://www.gov.uk/government/statistical-data-sets/live-tables-on-dwelling-stock-including-vacants
In addition, legacy regional tables are also available at the link above. These tables have not been updated. For more information please see the Written Ministerial Statement as noted below: http://www.gov.uk/government/speeches/statistics-for-local-enterprise-partnerships-and-upper-tier-local-authorities
Definitions Dwelling A dwelling is defined (in accordance with the Census definition) as a self-contained unit of accommodation. Self-containment is where all the rooms (including kitchen, bathroom and toilet) in a household's accommodation are behind a single door which only that household can use. Non-self-contained household spaces at the same address should be included together as a single dwelling. Therefore a dwelling can consist of one self-contained household space or two or more non-self-contained household spaces at the same address. Ancillary dwellings (e.g. 'granny annexes') are included provided they are self-contained, pay separate council tax from the main residence, do not share access with the main residence (e.g. a shared hallway) and there are no conditional restrictions on occupancy.
12 Housing Statistical Release
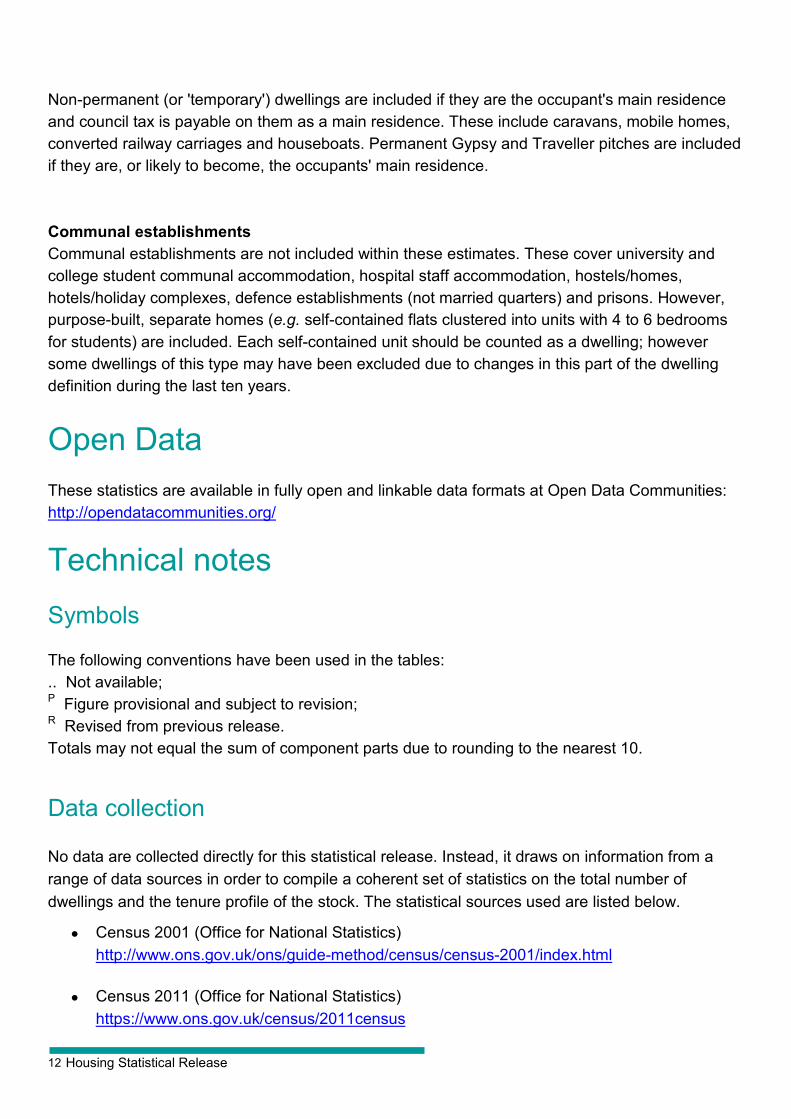
Non-permanent (or 'temporary') dwellings are included if they are the occupant's main residence and council tax is payable on them as a main residence. These include caravans, mobile homes, converted railway carriages and houseboats. Permanent Gypsy and Traveller pitches are included if they are, or likely to become, the occupants' main residence. Communal establishments Communal establishments are not included within these estimates. These cover university and college student communal accommodation, hospital staff accommodation, hostels/homes, hotels/holiday complexes, defence establishments (not married quarters) and prisons. However, purpose-built, separate homes (e.g. self-contained flats clustered into units with 4 to 6 bedrooms for students) are included. Each self-contained unit should be counted as a dwelling; however some dwellings of this type may have been excluded due to changes in this part of the dwelling definition during the last ten years.
Open Data
These statistics are available in fully open and linkable data formats at Open Data Communities: http://opendatacommunities.org/
Technical notes Symbols The following conventions have been used in the tables: .. Not available; P Figure provisional and subject to revision; R Revised from previous release. Totals may not equal the sum of component parts due to rounding to the nearest 10.
Data collection
No data are collected directly for this statistical release. Instead, it draws on information from a range of data sources in order to compile a coherent set of statistics on the total number of dwellings and the tenure profile of the stock. The statistical sources used are listed below.
• Census 2001 (Office for National Statistics) http://www.ons.gov.uk/ons/guide-method/census/census-2001/index.html
• Census 2011 (Office for National Statistics) https://www.ons.gov.uk/census/2011census
13 Housing Statistical Release
• Housing Supply: Net Additional Dwellings (Ministry of Housing, Communities and Local Government) https://www.gov.uk/government/collections/net-supply-of-housing
• Local Authority Housing Statistics (Ministry of Housing, Communities and Local Government) https://www.gov.uk/government/collections/local-authority-housing-data
• Statistical Data Return (Homes England, formerly Homes and Community Agency) https://www.gov.uk/government/collections/statistical-data-return-statistical-releases
• Labour Force Survey (Office for National Statistics) https://www.ons.gov.uk/surveys/informationforhouseholdsandindividuals/householdandindividualsurveys/labourforcesurveylfs
• English Housing Survey (Ministry of Housing, Communities and Local Government) https://www.gov.uk/government/collections/english-housing-survey
Data quality
There are several alternative sources of data on total dwelling stock in England, including the census and the council tax system. Each has its own advantages and disadvantages. The methodology has been reviewed by Office for National Statistics in 2009, July 2017 and December 2017.
In 2009 the Ministry of Housing, Communities and Local Government asked the Office for National Statistics to conduct a review of the method and data sources used for producing estimates of the dwelling stock. One of the key findings of the review was that the existing method for producing estimates at the England and Government Office regions remains the most suitable method. The review also stated that it would be desirable to extend the same methodology to produce estimates at the local authority district level.
Since then, the Ministry of Housing, Communities and Local Government have been working with the Office for National Statistics to explore whether this is possible using alternative data sources. We met with the Land Registry to evaluate the potential for using their database. However, this is a record of land and ownership, and therefore not all dwellings will be identifiable. In particular, in the affordable and social rented sector, the database will record the land ownership (eg Local Authority) and development of a building but not necessarily the number of dwellings within (until these are transacted as a private sale, such as through Right to Buy, upon which a database entry with ownership for that dwelling is created).
In July 2017, the Office for National Statistics published a quality assurance of administrative data used in consumer price inflation statistics. This is relevant as ONS use the dwelling stock
14 Housing Statistical Release
estimates in the production of the Consumer Price Index include Owner Occupiers’ Housing costs (CPI-H). As part of this work, the Department had provided a summary assessment of the methodology and data sources used for ‘Dwelling Stock Estimates’ and this is published in Annex A at the following link. ONS reviewed this and key finding was that they “have assessed the checks and processes as being fit for the purpose for which they are used in the production of CPIH”.
https://www.ons.gov.uk/economy/inflationandpriceindices/methodologies/qualityassuranceofadministrativedatausedincpih
In December 2017, the Office for National Statistics, after completing a new review of the method and data sources used for producing estimates of the dwelling stock published a research output on subnational dwelling stock by tenure estimates, available at the following link.
https://www.ons.gov.uk/peoplepopulationandcommunity/housing/articles/researchoutputssubnationaldwellingstockbytenureestimatesengland2012to2015/2017-12-04
One of the key findings of the 2017 Office for National Statistics review was that the existing methods for producing ‘total stock’, ‘private sector stock’, ‘local authority’ stock, ‘other public sector stock’ and ‘housing association stock’ for the published England tables remain the most suitable method, as these are calculated from data provided by local authority and housing associations. Therefore, the Office for National Statistics explored whether it is possible to use data on tenure for subnational areas from the Annual Population Survey (APS) and regional vacancy data from the English Housing Survey (EHS) to split the private sector stock into owner-occupied and privately-rented dwellings. The Office for National Statistics noted that at the local authority level, the APS sample sizes ranged from an average of 4 households in the City Of London to 1,034 households in each year in the Isle of Wight, hence estimates were not reported for all areas (those with a private sector sample size smaller than 50 for any given year were not reported). Therefore, the Office for National Statistics provided estimates and confidence intervals to indicate the degree of uncertainty around the estimates. The results showed local authority estimates of privately rented dwellings tended to be have wider confidence intervals and a wider distribution than estimates of owner occupied dwellings.
The source of the baseline dwelling counts for these estimates, the 2001 census and the 2011 census, are some of the most reliable National Statistics produced in the UK. The dwelling stock estimates are scheduled to be recalibrated following the 2021 Census and the dwelling stock estimates methodology will be reviewed again alongside rebasing to Census.
The Census results are subject to intensive validation processes. It cannot be perfect however, and it is estimated that the dwelling count from the 2001 census contains an undercount for England of approximately 60,000 dwellings.
There is a wide margin of error around this estimate of the undercount, and the ONS does not recommend that it should be used as a basis on which to revise the census count. For this reason, and to maintain consistency with published census figures, the dwelling stock estimates in
15 Housing Statistical Release
this series will continue to use the existing 2001 census and 2011 census count as a baseline.
Information on the strengths and weaknesses of the Housing supply; net additional dwellings data used in the production of these dwelling stock estimates can be found in the most recent release of those statistics at the following link.
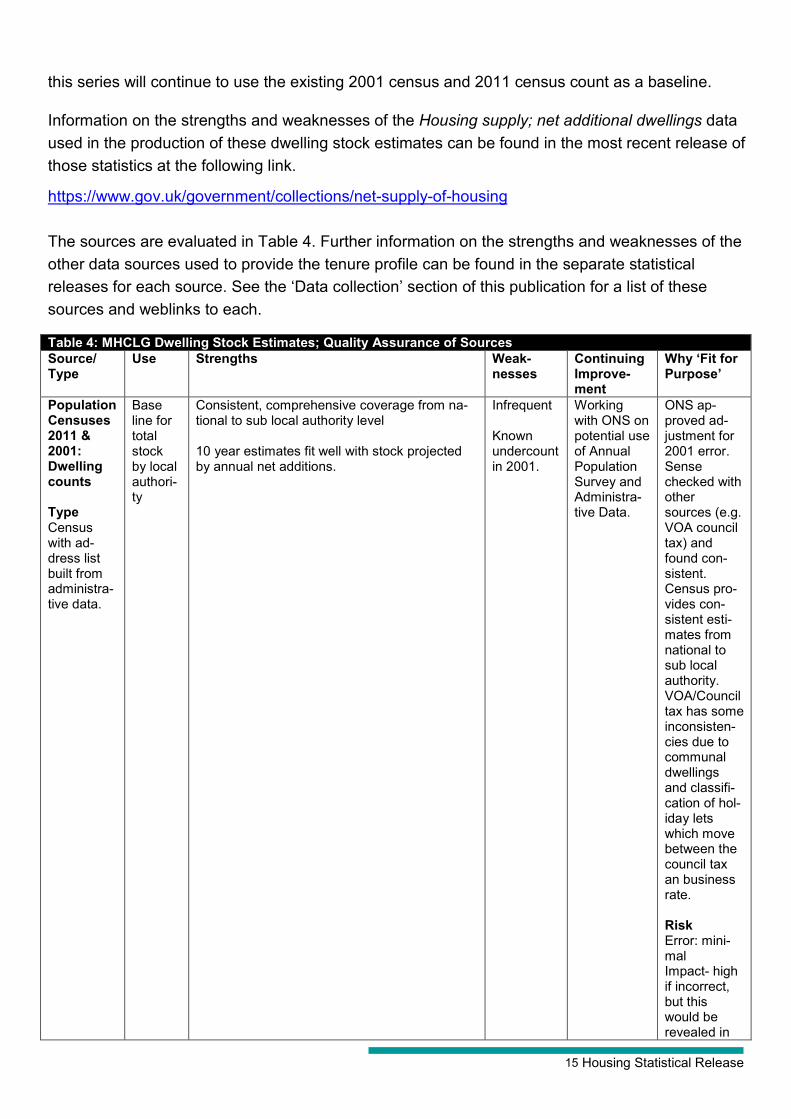
https://www.gov.uk/government/collections/net-supply-of-housing The sources are evaluated in Table 4. Further information on the strengths and weaknesses of the other data sources used to provide the tenure profile can be found in the separate statistical releases for each source. See the ‘Data collection’ section of this publication for a list of these sources and weblinks to each.
Table 4: MHCLG Dwelling Stock Estimates; Quality Assurance of Sources Source/ Type
Use Strengths Weak-nesses
Continuing Improve-ment
Why ‘Fit for Purpose’
Population Censuses 2011 & 2001: Dwelling counts Type Census with ad-dress list built from administra-tive data.
Base line for total stock by local authori-ty
Consistent, comprehensive coverage from na-tional to sub local authority level 10 year estimates fit well with stock projected by annual net additions.
Infrequent Known undercount in 2001.
Working with ONS on potential use of Annual Population Survey and Administra-tive Data.
ONS ap-proved ad-justment for 2001 error. Sense checked with other sources (e.g. VOA council tax) and found con-sistent. Census pro-vides con-sistent esti-mates from national to sub local authority. VOA/Council tax has some inconsisten-cies due to communal dwellings and classifi-cation of hol-iday lets which move between the council tax an business rate. Risk Error: mini-mal Impact- high if incorrect, but this would be revealed in
16 Housing Statistical Release
comparisons with other sources.
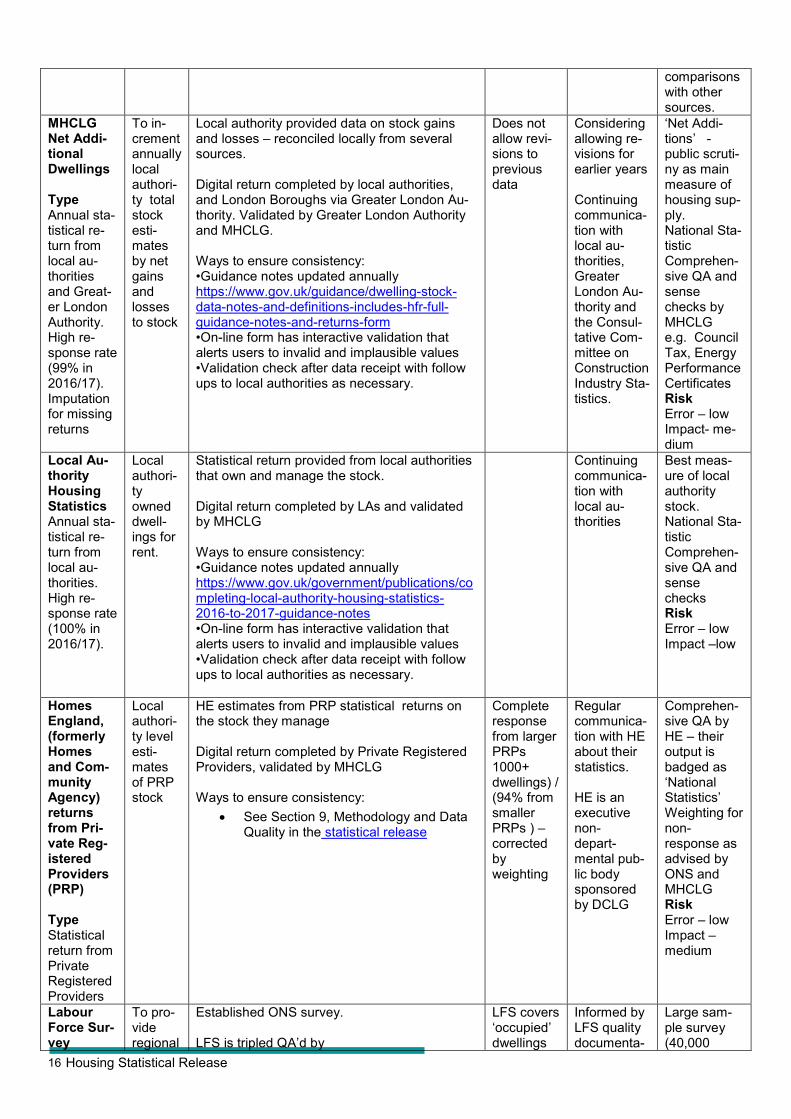
MHCLG Net Addi-tional Dwellings Type Annual sta-tistical re-turn from local au-thorities and Great-er London Authority. High re-sponse rate (99% in 2016/17). Imputation for missing returns
To in-crement annually local authori-ty total stock esti-mates by net gains and losses to stock
Local authority provided data on stock gains and losses – reconciled locally from several sources. Digital return completed by local authorities, and London Boroughs via Greater London Au-thority. Validated by Greater London Authority and MHCLG. Ways to ensure consistency: •Guidance notes updated annually https://www.gov.uk/guidance/dwelling-stock-data-notes-and-definitions-includes-hfr-full-guidance-notes-and-returns-form •On-line form has interactive validation that alerts users to invalid and implausible values •Validation check after data receipt with follow ups to local authorities as necessary.
Does not allow revi-sions to previous data
Considering allowing re-visions for earlier years Continuing communica-tion with local au-thorities, Greater London Au-thority and the Consul-tative Com-mittee on Construction Industry Sta-tistics.
‘Net Addi-tions’ -public scruti-ny as main measure of housing sup-ply. National Sta-tistic Comprehen-sive QA and sense checks by MHCLG e.g. Council Tax, Energy Performance Certificates Risk Error – low Impact- me-dium
Local Au-thority Housing Statistics Annual sta-tistical re-turn from local au-thorities. High re-sponse rate (100% in 2016/17).
Local authori-ty owned dwell-ings for rent.
Statistical return provided from local authorities that own and manage the stock. Digital return completed by LAs and validated by MHCLG Ways to ensure consistency: •Guidance notes updated annually https://www.gov.uk/government/publications/completing-local-authority-housing-statistics-2016-to-2017-guidance-notes •On-line form has interactive validation that alerts users to invalid and implausible values •Validation check after data receipt with follow ups to local authorities as necessary.
Continuing communica-tion with local au-thorities
Best meas-ure of local authority stock. National Sta-tistic Comprehen-sive QA and sense checks Risk Error – low Impact –low
Homes England, (formerly Homes and Com-munity Agency) returns from Pri-vate Reg-istered Providers (PRP) Type Statistical return from Private Registered Providers
Local authori-ty level esti-mates of PRP stock
HE estimates from PRP statistical returns on the stock they manage Digital return completed by Private Registered Providers, validated by MHCLG Ways to ensure consistency:
• See Section 9, Methodology and Data Quality in the statistical release
Complete response from larger PRPs 1000+ dwellings) / (94% from smaller PRPs ) – corrected by weighting
Regular communica-tion with HE about their statistics. HE is an executive non-depart-mental pub-lic body sponsored by DCLG
Comprehen-sive QA by HE – their output is badged as ‘National Statistics’ Weighting for non-response as advised by ONS and MHCLG Risk Error – low Impact –medium
Labour Force Sur-vey
To pro-vide regional
Established ONS survey. LFS is tripled QA’d by
LFS covers ‘occupied’ dwellings
Informed by LFS quality documenta-
Large sam-ple survey (40,000
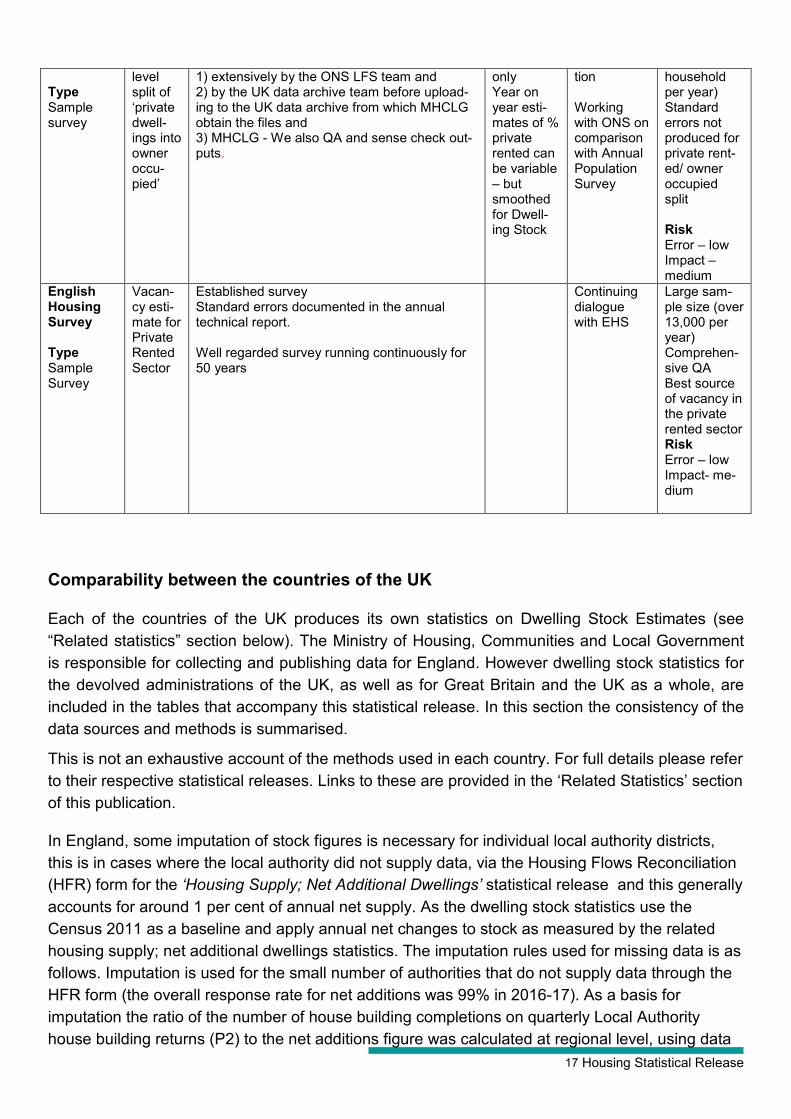
17 Housing Statistical Release
Type Sample survey
level split of ‘private dwell-ings into owner occu-pied’
1) extensively by the ONS LFS team and 2) by the UK data archive team before upload-ing to the UK data archive from which MHCLG obtain the files and 3) MHCLG - We also QA and sense check out-puts.
only Year on year esti-mates of % private rented can be variable – but smoothed for Dwell-ing Stock
tion Working with ONS on comparison with Annual Population Survey
household per year) Standard errors not produced for private rent-ed/ owner occupied split Risk Error – low Impact – medium
English Housing Survey Type Sample Survey
Vacan-cy esti-mate for Private Rented Sector
Established survey Standard errors documented in the annual technical report. Well regarded survey running continuously for 50 years
Continuing dialogue with EHS
Large sam-ple size (over 13,000 per year) Comprehen-sive QA Best source of vacancy in the private rented sector Risk Error – low Impact- me-dium
Comparability between the countries of the UK
Each of the countries of the UK produces its own statistics on Dwelling Stock Estimates (see “Related statistics” section below). The Ministry of Housing, Communities and Local Government is responsible for collecting and publishing data for England. However dwelling stock statistics for the devolved administrations of the UK, as well as for Great Britain and the UK as a whole, are included in the tables that accompany this statistical release. In this section the consistency of the data sources and methods is summarised.
This is not an exhaustive account of the methods used in each country. For full details please refer to their respective statistical releases. Links to these are provided in the ‘Related Statistics’ section of this publication.
In England, some imputation of stock figures is necessary for individual local authority districts, this is in cases where the local authority did not supply data, via the Housing Flows Reconciliation (HFR) form for the ‘Housing Supply; Net Additional Dwellings’ statistical release and this generally accounts for around 1 per cent of annual net supply. As the dwelling stock statistics use the Census 2011 as a baseline and apply annual net changes to stock as measured by the related housing supply; net additional dwellings statistics. The imputation rules used for missing data is as follows. Imputation is used for the small number of authorities that do not supply data through the HFR form (the overall response rate for net additions was 99% in 2016-17). As a basis for imputation the ratio of the number of house building completions on quarterly Local Authority house building returns (P2) to the net additions figure was calculated at regional level, using data
18 Housing Statistical Release
from all local authorities that finalised their 2016-17 HFR return. For local authorities which failed to submit a HFR return this ratio was applied to the number of house building completions reported on their P2 quarterly house building returns for 2016-17. Due to the differing way that data is collected in London, no imputation was performed as the Greater London Authority informed the department that all London Boroughs had supplied data. This should not lead to any positive of negative bias in the final figures.
In Scotland, council tax data are used and this leads to a slight definitional mismatch with the rest of the UK as council tax data includes certain extra dwelling types. Evidence from comparisons in England suggests that the inclusion of such extra dwelling types probably increases estimates of the Scottish dwelling stock by less than one per cent, although this proportion may differ between Scotland and England.
The approach in Wales is very similar to that in England, using the Census and adding a measure of net supply for each intervening year. However, there may be a small negative bias in the net supply estimate for Wales compared to the rest of the UK due to the fact that they do not include new builds certified by Approved Inspectors and they have no way of incorporating gains or losses due to Change of Use.
Northern Ireland, like Scotland, previously used administrative data from a tax system for total stock, but the data relate to March 31st and no substantial definitional differences or biases have been detected. The Northern Ireland (and hence United Kingdom) tables have not been updated since 31 March 2014 as the source table has been discontinued by the Department for Social Development (Northern Ireland), as noted in the ‘Review of Housing Stock Data’ documentation https://www.communities-ni.gov.uk/publications/proposed-changes-housing-stock-tables
The methodology used for the tenure breakdown of stock is similar for all devolved administrations. Due to the nature of the social housing sector, data can be collected directly from the local authorities and PRPs who own and manage the stock. Total private sector is then derived by deducting full counts for the social tenures from the total estimate: Private = Total – Social (PRP + LA) The private stock is then split into owner-occupied and private rental using proportions estimated from a large government survey. This is done slightly differently in England from the other countries of the UK, with extra account taken of the much higher vacancy rate in the private rental sector. For further details see the ‘Tenure’ section of this publication.
Revisions policy
This policy has been developed in accordance with the UK Statistics Authority Code of Practice for Official statistics and the Ministry of Housing, Communities and Local Government Revisions Policy (found at https://www.gov.uk/government/publications/statistical-notice-dclg-revisions-policy). There are two types of revisions that the policy covers:
19 Housing Statistical Release
Non-Scheduled Revisions
Where a substantial error has occurred as a result of the compilation, imputation or dissemination process, the statistical release, live tables and other accompanying releases will be updated with a correction notice as soon as is practical.
Scheduled Revisions
Scheduled revisions for the dwelling stock estimates are dependent on revisions to the Housing Supply: Net Additional Dwelling statistics. Information on the revisions policy of those statistics can be found in the most recent release of those statistics at the following link. https://www.gov.uk/government/collections/net-supply-of-housing
Scheduled revisions for the dwelling stock estimates are also dependent on revisions to the English Housing Survey statistics. Information on the revisions policy of those statistics can be found in the most recent release of those statistics at the following link.
https://www.gov.uk/government/collections/english-housing-survey
In addition, the dwelling stock estimates are calibrated against the census dwelling count on its release every ten years.
Following the 2001 census, the annual figures (1992 to 2001) were adjusted, with any difference spread evenly across the ten years since the previous census. It amounted to around 8,000 extra dwellings per year at the England level.
Following the 2011 census, the annual figures (2002 to 2011) were adjusted, with any difference spread evenly across the ten years since the previous census. It amounted to around 16,000 extra dwellings per year at the England level.
The differences are not evenly spread across districts.
For information, the dwelling stock estimates are not the source for the local authority council taxbase in England, which is sourced from the number of dwellings liable for council tax on the Valuation Office Agency valuation list, which can be found at the link below.
https://www.gov.uk/government/collections/council-taxbase-statistics
Uses of the data The dwelling stock estimates are used as evidence in policy making by both central and local government. These estimates are important because they show how the housing stock is used and how this changes year on year. The data is also used in the development and production of other government statistics such as the English Housing Survey and by the Office for National
20 Housing Statistical Release
Statistics for the Consumer Price Index including Owner Occupier’s Housing costs (CPIH). Outside of government the dwelling stock estimates are used by the finance and investment industries, for example to help develop a picture of demographic trends. External users include the Charter Institute of Housing’s UK Housing Review which compiles figures for England with comparable numbers from the other UK countries. Other users include local authorities, the Bank of England, Eurostat and the European Central Bank.
Related statistical releases are available:
Housing supply; net additional dwellings
The Ministry of Housing, Communities and Local Government publishes annual National Statistics on net additional dwellings based on local authority estimates of gains and losses of dwellings during each year. These Housing supply: net additional dwellings (formerly known as Net supply of housing) statistics show the absolute change in dwelling stock between 1 April and 31 March the following year. They comprise the number of new build permanent dwellings; plus the net gain from dwelling conversions; plus the net gain of non-dwellings brought into residential use; plus net additions from other gains and losses to the dwelling stock (such as mobile and temporary dwellings); less any demolitions. These annual statistics provide a more comprehensive but less timely measure of total housing supply in England than the new build dwelling statistics. The quarterly new build dwelling statistics can be considered an important leading indicator of the annual net additional dwellings statistics.
Each year the annual net additional dwellings is added to the previous year’s dwelling stock estimates to produce the latest year’s dwelling stock estimates. The Housing supply: net additional dwellings statistics can be found at the link below.
https://www.gov.uk/government/collections/net-supply-of-housing
House building (new build dwellings) starts and completions New house building completions are the largest component of housing supply. The Ministry of Housing, Communities and Local Government also publish a quarterly National Statistics series on new build starts and completions based on quarterly data returns by local authorities, the National House-Building Council (NHBC) and other independent approved building control inspectors. This quarterly House building (new build dwellings) completions statistic is a key leading indicator for the annual net supply of housing figures in this release.
The quarterly House building (new build dwellings) statistical series is separate from and complementary to the annual Housing Supply (net additional dwellings) series. The quarterly House building (new build dwellings) series provides a more frequent and timely but less comprehensive measure of total housing supply in England. Completions figures from the quarterly House building (new build dwellings) series are not used in the Housing Supply (net additional dwellings) statistics. Instead a separate set of data on the new build completions component of housing supply is collected as part of the overall annual Housing Supply (net additional dwellings) data collection. This eliminates timing differences from the net supply series
21 Housing Statistical Release
and provides a picture of the components of net change which can be reconciled between years.
The House building (new build dwellings) statistical series takes its data from the same source throughout England, combining data from building control officers at local authorities, the National House-Building Council (NHBC) and other independent approved building control inspectors. This collection provides a consistent source for the series which is published within eight weeks of the end of each quarter. For net supply all the data comes from local authorities, who in turn use whichever local data source they believe is most appropriate. The data collection period for net supply is relatively long, closing some five months after the end of the financial year. The longer collection period makes it possible to compile a more complete picture of housing supply over the period; including conversions, change of use and demolitions.
The new build component of the Housing Supply (net additional dwellings) statistics is generally larger than the corresponding annual total from the House building (new build dwellings) series, despite the fact that they are measuring the same thing. The longer collecting period and range of sources used in compiling the Housing Supply (net additional dwellings) statistics means that the new build component of net supply captures some elements of new build which are missed in the building control based data. It is also possible that Housing Supply (net additional dwellings) will pick up the small minority of dwellings in which people are living but for which no completion certificate has been issued. In such cases a completion may be missed in the building control data even if the dwelling meets the ‘completion’ definition.
Users are advised to regard Housing Supply (net additional dwellings) as the fullest and most accurate estimate of the total (net) increase in new housing units over the course of the year, and that the House Building (new build dwellings) release is a leading indicator of this as well as providing a good indication of the trend.
The House building (new build dwellings) statistics can be found at the link below.
https://www.gov.uk/government/collections/house-building-statistics
Affordable housing supply
The Ministry of Housing, Communities and Local Government’s annual Affordable housing supply statistics can be found at the following link. The affordable housing supply statistics include both new build supply and acquisitions for social and affordable rent and low cost home ownership. These figures are ‘gross’ in that they do not take account of any losses from the affordable housing sectors for example through demolitions, sales or transfers to the private sector.
https://www.gov.uk/government/collections/affordable-housing-supply
Council tax valuation lists
The Valuation Office Agency compiles and maintains lists of all domestic properties in England and Wales to support the collection of council tax, and these lists are constantly updated to reflect the creation of new dwellings and losses of dwellings. The Valuation Office Agency also compiles and maintains lists of non-domestic rating properties in England and Wales to support the collection of business rates, and these lists are constantly updated to reflect the creation and loss
22 Housing Statistical Release
of non-domestic rating stock. To note, there is a flow of existing stock between both lists (for example, a non-domestic rated self-catering property may change to a Council Tax valuation list dwelling, and vice versa).
The Valuation Office Agency’s definition of a dwelling differs somewhat from that used by the census. The Ministry of Housing, Communities and Local Government’s Housing supply: net additional dwellings and dwelling stock estimates statistics use the census definition (see ‘Definitions’ section below). The census definition used by the Housing Supply; net additional dwellings statistics does not include communal dwellings although these would be found on the council tax list.
If the communal dwelling data (4,620) collected as part of the Housing Supply statistics in 2016-17 is combined with the headline figure (217,350) from Housing Supply statistics the combined total is within 1 per cent of the change in the Council Tax valuation list (220,420) over the same period. The 1 per cent difference is likely to relate partly to changes between the Council Tax valuation list and the Non-Domestic Rating lists, timing differences and imputation for non-response. Dwellings are likely only to be registered on the Council Tax valuation list when they become occupied whilst they should feature in the net supply statistics as soon as they are ready for occupation. It is also possible that the Council Tax valuation list will count differently houses in multiple occupation and include dwellings which have been build or converted outside the planning regime.
The Valuations Office Agency now publishes statistics on these lists which can be found at the following link.
http://www.voa.gov.uk/corporate/Publications/statistics.html
New Homes Bonus
The New Homes Bonus allocates grants to local authorities according to the number of new homes delivered and empty homes brought back into use in their area. The growth in their council taxbase is used as a proxy measure for the number of new homes delivered because this provides information about council tax bands which are required as part of the calculation of New Homes Bonus allocations. The number of long-term empty homes in each area is also collected as part of the council tax system.
As the New Homes Bonus is based on council tax data, which is itself derived from the Valuation Office Agency’s valuation list, it is collected using the same, broader definition of a dwelling as used by the Valuation Office Agency (see ‘Council tax valuation lists’ above).
The council taxbase data return is made by local authorities to the Ministry of Housing, Communities and Local Government in November giving details of their council tax base at September. Therefore the period over which the change in taxbase is measured for the New Homes Bonus (the year to September) is different from the period over which the housing supply is measured (the year to April).
The combination of timing and definitional differences means that it is not possible to reconcile the
23 Housing Statistical Release
New Homes Bonus numbers fully to the National Statistics on House Building and Housing Supply. The different sources will inevitably give different figures, though trends over time are likely to be similar. In addition, the New Homes Bonus headline allocations figures also include a component for empty homes brought back in to use.
Users of housing supply statistics should note that the New Homes Bonus figures are a by-product of the data used to administer the council tax system and are not primarily designed as a measure of housing supply. The National Statistics on House Building and on Housing Supply are designed to give a comprehensive measure of housing supply which can be used to make consistent comparisons over time. They have been assessed and endorsed by the UK Statistics Authority (see ‘National Statistics’ section below).
Energy Performance Certificates
A related source of information on new supply is the data collected by the Ministry on Energy Performance Certificates.
https://www.gov.uk/government/collections/energy-performance-of-buildings-certificates
These relate to new build and transactions of existing dwellings. New build can be identified separately but “conversions’ count as new domestic properties for EPC purposes (e.g. office conversions”). Therefore the EPC definition of new domestic properties is broader than ‘House Building (new build dwellings)’ and is closer to ‘Housing Supply (net additional dwellings)’.
User engagement
Users are encouraged to provide feedback on how these statistics are used and how well they meet user needs. Comments on any issues relating to this statistical release are welcomed and encouraged. Responses should be addressed to the "Public enquiries" contact given in the "Enquiries" section below. The Ministry’s engagement strategy to meet the needs of statistics users is published here: https://www.gov.uk/government/publications/engagement-strategy-to-meet-the-needs-of-statistics-users A short questionnaire on how the Housing Statistics and data are used and the decisions they inform is currently open at: https://www.surveymonkey.co.uk/r/housinguser
Notes 1. These dwelling stock statistics are estimates and are all provisional and subject to revision.
Figures at the national levels in the accompanying tables are shown rounded to the nearest 1000 dwellings. Figures at the local authority district level are expressed to the nearest ten dwellings but should not be regarded as accurate to the nearest ten (an unrounded version is
24 Housing Statistical Release
also available in Live Table 125). Further work is scheduled to investigate differences in estimates of net additional dwellings.
2. Sources are shown at the foot of individual accompanying tables and live tables.
3. National Statistics are produced to professional standards set out in the Code of Practice for Statistics.
4. Details of ministers and officials who receive pre-release access to the Ministry of Housing, Communities and Local Government annual dwelling stock release up to 24 hours before release can be found at: https://www.gov.uk/government/organisations/ministry-of-housing-communities-and-local-government/about/statistics
5. The next annual release will be published in May 2019, and will provide estimates of the dwelling stock as at 31 March 2018.
Devolved administration statistics Dwelling stock estimates for the devolved administrations of the UK are included alongside the England statistics in the tables that accompany this statistical release. These data are published separately by the devolved administrations, and although figures are correct at the time of this publication they may be superseded before the next England dwelling stock release. Latest data and details on data sources and methods can be found at the following links.
Scotland http://www.scotland.gov.uk/Topics/Statistics/Browse/Housing-Regeneration/HSfS Wales https://gov.wales/statistics-and-research/?lang=en Northern Ireland https://www.communities-ni.gov.uk/topics/housing-statistics
25 Housing Statistical Release
Enquiries Media enquiries: 0303 444 1209 Email: [email protected] Public enquiries and Responsible Statistician: Neil Higgins
Email: [email protected] Information on Official Statistics is available via the UK Statistics Authority website: https://www.gov.uk/government/statistics/announcements Information about statistics at MHCLG is available via the Ministry’s website: https://www.gov.uk/government/organisations/ministry-of-housing-communities-and-local-government/about/statistics
26 Housing Statistical Release
© Crown copyright, 2018 Copyright in the typographical arrangement rests with the Crown. You may re-use this information (not including logos) free of charge in any format or medium, under the terms of the Open Government Licence. To view this licence, http://www.nationalarchives.gov.uk/doc/open-government-licence/version/3/ or write to the Information Policy Team, The National Archives, Kew, London TW9 4DU, or email: [email protected]. This document/publication is also available on our website at http://www.gov.uk/mhclg If you have any enquiries regarding this document/publication, email [email protected] or write to us at: Ministry of Housing, Communities and Local Government Fry Building 2 Marsham Street London SW1P 4DF Telephone: 030 3444 0000
May 2018
For all our latest news and updates follow us on Twitter: https://twitter.com/mhclg ISBN: 978-1-4098-5240-7