mid-year population estimates - statssa.gov.za · statistics south africa p0302 mid-year population...
TRANSCRIPT
www.statssa.gov.za
T +27 12 310 8911
F +27 12 310 8500
Private Bag X44, Pretoria, 0001, South Africa
ISIbalo House, Koch Street, Salvokop, Pretoria, 0002
STATISTICAL RELEASE P0302
Mid-year population estimates
2018
Embargoed until: 23 July 2018
11:00
ENQUIRIES: FORTHCOMING ISSUE: EXPECTED RELEASE DATE: User Information Services 2019 31 July 2019
Tel: (012) 310 8600 / 4892 / 8390
STATISTICS SOUTH AFRICA P0302
Mid-year population estimates, 2018
ii
Contents
Summary ......................................................................................................................................... 1
1. Introduction .......................................................................................................................... 3
2. Demographic and other assumptions ................................................................................... 3
3. Demographic and other indicators ....................................................................................... 5
4. National population estimates .............................................................................................. 8
5. Provincial population estimates .......................................................................................... 11
5.1 Demographic assumptions ................................................................................................. 11
5.2 Migration patterns .............................................................................................................. 14
5.3 Provincial distributions ....................................................................................................... 16
References .................................................................................................................................... 19
Appendices ................................................................................................................................... 21
List of tables
Table 1: Mid-year population estimates for South Africa by population group and sex, 2018 ................ 2
Table 2: Assumptions of expectation of life at birth without HIV/AIDS and total fertility rate, 2002–2018
............................................................................................................................................................. 4
Table 3: International net-migration assumptions for the period 1985–2021 ......................................... 4
Table 4: Births and deaths for the period 2002–2018 ........................................................................... 7
HIV prevalence ..................................................................................................................................... 7
Table 5: Mid-year population estimates by population group and sex, 2018 ......................................... 9
Table 6: Mid-year population estimates by population group, age and sex, 2018 ............................... 10
Table 7: Estimated provincial migration streams 2006–2011 .............................................................. 14
Table 8: Estimated provincial migration streams 2011–2016 .............................................................. 15
Table 9: Estimated provincial migration streams 2016–2021 .............................................................. 15
Table 10: Percentage distribution of the projected provincial share of the total population, 2002–2018
........................................................................................................................................................... 16
Table 11 (a): Provincial mid-year population estimates by age and sex, 2018 .................................... 17
Table 11 (b): Provincial mid-year population estimates by age and sex, 2018 (concluded) ................. 18
List of figures
Figure 1: Mid-year population estimates for South Africa by province, 2018 ...................................... 2
Figure 2: Crude birth rate, crude death rate, and rate of natural increase over time, 2002–2018 ....... 5
Figure 3: Life expectancy by sex over time, 2002–2018 .................................................................... 6
Figure 4: IMR, U5MR and CDR over time, 2002–2018 ...................................................................... 6
Figure 5: HIV prevalence by selected age groups, 2002–2018 .......................................................... 8
Figure 6: HIV Population over time, 2002–2018 ................................................................................ 8
Figure 7: Population growth rates by selected age groups over time, 2002–2018 ............................. 9

STATISTICS SOUTH AFRICA P0302
Mid-year population estimates, 2018
iii
Figure 8: Provincial average total fertility rate over time, 2001–2021 ............................................... 11
Figure 9: Provincial average total fertility rate, 2016–2021 .............................................................. 12
Figure 10: Provincial average life expectancy at birth (males) ......................................................... 12
Figure 11: Provincial average life expectancy at birth (females) ...................................................... 13
Figure 12: Population under 15 years of age ................................................................................... 19
Figure 13: Proportion of elderly aged 60+ ........................................................................................ 19

STATISTICS SOUTH AFRICA P0302
Mid-year population estimates, 2018
1
Summary
This release uses the cohort-component methodology to estimate the 2018 mid-year population of South Africa.
The estimates cover all the residents of South Africa at the 2018 mid-year, and are based on the latest available
information. Estimates may change as new data become available. With the new estimate comes an entire series
of revised estimates for the period 2002–2018.
For 2018, Statistics South Africa (Stats SA) estimates the mid-year population at 57,73 million.
Approximately 51% (approximately 29,5 million) of the population is female.
Gauteng comprises the largest share of the South African population, with approximately 14,7 million people
(25,4%) living in this province. KwaZulu-Natal is the province with the second largest population, with 11,4 million
people (19,7%) living in this province. With a population of approximately 1,23 million people (2,1%), Northern
Cape remains the province with the smallest share of the South African population.
About 29,5% of the population is aged younger than 15 years and approximately 8,5% (4,89 million) is 60 years
or older. Similar proportions of those younger than 15 years live in Gauteng (21,1%) and KwaZulu-Natal (21,0%).
Of the elderly aged 60 years and older, the highest percentage 24,0% (1,18 million) reside in Gauteng. The
proportion of elderly persons aged 60 and older is increasing over time.
Migration is an important demographic process in as it shapes the age structure and distribution of the provincial
population. For the period 2016–2021, Gauteng and Western Cape are estimated to experience the largest inflow
of migrants of approximately, 1 048 440 and 311 004 respectively (see migration stream Tables 7, 8 and 9 for net
migration).
Life expectancy at birth for 2018 is estimated at 61,1 years for males and 67,3 years for females.
The infant mortality rate for 2018 is estimated at 36,4 per 1 000 live births.
The estimated overall HIV prevalence rate is approximately 13,1% among the South African population. The total
number of people living with HIV is estimated at approximately 7,52 million in 2018. For adults aged 15–49 years,
an estimated 19,0% of the population is HIV positive.

STATISTICS SOUTH AFRICA P0302
Mid-year population estimates, 2018
2
Table 1: Mid-year population estimates for South Africa by population group and sex, 2018
Population group Male Female Total
Number
% distribution
of males Number % distribution
of females Number
% distribution
of total
Black African 22 786 200 80,9 23 896 700 80,9 46 682 900 80,9
Coloured 2 459 500 8,7 2 614 800 8,9 5 074 300 8,8
Indian/Asian 740 200 2,6 708 100 2,4 1 448 300 2,5
White 2 194 200 7,8 2 325 900 7,9 4 520 100 7,8
Total 28 180 100 100,0 29 545 500 100,0 57 725 600 100,0
Figure 1: Mid-year population estimates for South Africa by province, 2018
Risenga Maluleke Statistician-General
14 717 000
11 384 700
6 621 100
6 522 700
5 797 300
4 523 900
3 979 000
2 954 300
1 225 600
0 2 000 000 4 000 000 6 000 000 8 000 000 10 000 000 12 000 000 14 000 000
Gauteng
KwaZulu-Natal
Western Cape
Eastern Cape
Limpopo
Mpumalanga
North West
Free State
Northern Cape

STATISTICS SOUTH AFRICA P0302
Mid-year population estimates, 2018
3
1. Introduction
In a projection, the size and composition of the future population of an entity such as South Africa is estimated. The
mid-year population estimates produced by Statistics South Africa (Stats SA) uses the cohort-component method for
population estimation. In the cohort-component method, a base population is estimated that is consistent with known
demographic characteristics of the country. The cohort base population is projected into the future according to the
projected components of change. Selected levels of fertility, mortality and migration are used as input to the cohort-
component method. For the 2018 mid-year estimates, the cohort-component method is utilised within the Spectrum
Policy Modelling system. Spectrum is a Windows-based system of integrated policy models (version 5.63). The
DemProj module within Spectrum is used to develop the demographic projection, whilst the AIDS Impact Model (AIM)
is used to incorporate the impacts of HIV and AIDS on fertility and mortality, and ultimately the population estimates.
Stats SA subscribes to the specifications of the Special Data Dissemination Standards (SDDS) of the International
Monetary Fund (IMF). The mid-year estimates are an estimate of the population as at 01 July in a given year. The
estimates of stock such as population size, number infected with HIV etc. pertain to the middle of the year i.e. 01
July, whilst the estimates of flow e.g. births, deaths, Total Fertility Rates (TFRs), Infant Mortality Rates (IMRs) etc.
are for a 12-month period e.g. 01 July 2018 to 30th June 2019. A stock variable is measured at one specific time, and
represents a quantity at each moment in time – e.g. the number of population at a certain moment whilst an estimate
of flow is typically measured over a certain interval of time. The mid-year population estimates are published
annually.
2. Demographic and other assumptions
A cohort-component projection requires a base population distributed by age and sex. Levels of mortality, fertility and
migration are estimated for the base year and projected for future years. The cohort base population is projected into
the future according to the projected components of population change. The DemProj module of Spectrum is used
to produce a single-year projection, thus the TFR and the life expectancy at birth must be provided in the same format
i.e. single years. The time series of TFR estimates for all population groups in South Africa are derived following a
detailed review of TFR estimates (1985–2018), published and unpublished, from various authors, methods and data
sources. The finalised TFR assumptions can be found in Table 2 (page 4). The estimates of fertility show a fluctuation
over the period 2002–2018, giving rise to a population structure indicative of that of Census 2011 population structure.
Between the period 2009 and 2018, fertility has declined from an average of 2,66 children per woman to 2,4 children
in 2018. Other inputs required in DemProj include the age-specific fertility rate (ASFR) trend, sex ratios at birth and
net international migration.
In estimating South Africa’s population, international migration is provided as an input into the model (see Table 3,
page 4). Net international migration estimates are derived using not only Census 2011 migration data, but also
migration numbers and proportions from various other authors, methods and data sources such as the International
Organisation for Migration (IOM), Organisation for Economic Co-operation and Development (OECD) which form
part of the UN network as well as census data from National statistics offices (NSO) of various countries. Assumptions
regarding future migration patterns are based on past and current trends.

STATISTICS SOUTH AFRICA P0302
Mid-year population estimates, 2018
4
The life expectancy assumption entered into DemProj by sex is the life expectancy in the absence of AIDS (see Table
2). Each population group is also subjected to non-AIDS mortality according to the input non-AIDS life expectancy
and the selected model life table. AIM will calculate the number of AIDS deaths and determine a new set of life
expectancies that incorporates the impact of AIDS, (see Figure 3, page 6). Stats SA applies the country-specific UN
Model Life table for South Africa in Spectrum. The age pattern of mortality is based on various sources, data and
methods, these include death date from the RAPID surveillance, Mortality and causes of death report, Demographic
and Health Survey among others. Survival rates from the selected life tables were then used to project the population
forward.
Table 2: Assumptions of expectation of life at birth without HIV/AIDS and total fertility rate, 2002–2018
Year TFR Life expectancy at birth without
HIV/AIDS
Male Female
2002 2,51 61,4 68,3
2003 2,50 61,4 68,4
2004 2,53 61,5 68,5
2005 2,57 61,5 68,6
2006 2,62 61,7 68,7
2007 2,66 62,1 68,7
2008 2,68 62,1 68,8
2009 2,66 62,2 68,9
2010 2,62 62,3 69,0
2011 2,60 62,4 69,1
2012 2,57 63,0 69,8
2013 2,53 63,4 70,1
2014 2,50 63,5 70,2
2015 2,47 63,6 70,2
2016 2,45 64,0 70,6
2017 2,42 64,5 71,3
2018 2,40 64,5 71,5
Table 3: International net-migration assumptions for the period 1985–2021
Black African Indian/Asian White
Net international Migration
1985–2000 516 886 33 166 -184 430 365 622
2001–2006 481 842 22 719 -97 113 407 448
2006–2011 773 946 39 406 -105 964 707 388
2011–2016 940 352 53 444 -110 434 883 362
2016–2021 1 072 557 59 432 -114 995 1 016 994
The Spectrum Policy Modelling System (Futures Group) consists of 7 components, but Stats SA used only two of
them in this projection, namely (a) Demproj for population projections and (b) AIM in which the consequences of the
AIDS epidemic were projected. In the AIM projection, several programmatic and epidemiological data inputs are
required. These are related to programme coverage of adults and children on antiretroviral treatment (ART) and

STATISTICS SOUTH AFRICA P0302
Mid-year population estimates, 2018
5
Prevention of mother-to-child-transmission (PMTCT) treatment (NDoH, 2017). In addition to eligibility for treatment
as per national guidelines, the epidemiological inputs include antenatal clinic data (NDoH, 2018). The assumptions
regarding the HIV epidemic in South Africa are based primarily on the prevalence data collected annually from
pregnant women attending public antenatal clinics (ANC) since 1990 to the most recent estimates of 2015. However,
antenatal surveillance data produce biased prevalence estimates for the general population because only a select
group of people (i.e. pregnant women attending public health services) are included in the sample. The HSRC survey
prevalence data that produces national estimates for the country is used in the model to correct for this bias (Shisana
et al, 2014). Other inputs in the AIM model include the following: Median time from HIV infection to death, and Ratio
of new infections. Indicators of HIV prevalence, incidence and HIV population numbers over time show the impact of
HIV on the population. HIV indicators shown in Figures 5 and 6 are based on the aforementioned assumptions.
3. Demographic and other indicators
Figure 2 indicates that the crude birth rate (CBR) has increased between 2002 and 2008, thereafter it declines in the
period 2009 to 2018. The CBR is directly related to the fluctuating TFR assumptions (Table 2, page 4). Figure 2 and
Table 4 offer a glimpse into the mortality experience of South Africa, which incorporates the impact of HIV and AIDS
(using the AIM model). The crude death rate (CDR) has declined from 12,6 deaths per 1 000 people in 2002 to 9,1
deaths per 1 000 people in 2018. The rate of natural increase (RNI) is the rate of population growth in South Africa
over time, without including the impact of migration i.e. deaths subtracted from births. The RNI fluctuates over time,
mirroring the CBR, indicating the great influence of births in South Africa.
Figure 2: Crude birth rate, crude death rate, and rate of natural increase over time, 2002–2018
Life expectancy at birth declined between 2002 and 2006, in largely due to the impact of the HIV and AIDS epidemic
experienced, but expansion of health programmes to prevent mother to child transmission as well as access to
antiretroviral treatment has partly led to the increase in life expectancy since 2007. By 2018 life expectancy at birth
is estimated at 61,1 years for males and 67,3 years for females. Figure 3 indicates that life expectancy is increasing,
and this may be related to marginal gains in survival rates among infants and children under-5 post HIV interventions
in 2005. Infant mortality rate (IMR) has declined from an estimated 53,2 infant deaths per 1 000 live births in 2002 to
0,00
0,20
0,40
0,60
0,80
1,00
1,20
1,40
1,60
1,80
2,00
0,0
5,0
10,0
15,0
20,0
25,0
30,0
2002 2003 2004 2005 2006 2007 2008 2009 2010 2011 2012 2013 2014 2015 2016 2017 2018
%
Rat
e
Crude Birth Rate Crude Death Rate Rate of Natural Increase (%)

STATISTICS SOUTH AFRICA P0302
Mid-year population estimates, 2018
6
36,4 infant deaths per 1 000 live births in 2018. Similarly the under-five mortality rate (U5MR) declined from 80,1
child deaths per 1 000 live births to 45,0 child deaths per 1 000 live births between 2002 and 2018. IMR and U5MR
shown in Figure 4 (page 8) are based on the selected model life table and may differ to similar indices published
elsewhere.
Figure 3: Life expectancy by sex over time, 2002–2018
Figure 4: IMR, U5MR and CDR over time, 2002–2018
Table 4 below shows estimates for selected indicators. The highest number of deaths were estimated in 2006. The
decline in the percentage of AIDS-related deaths since 2007 can be attributed to the increase in the roll-out of ART
over time. National roll-out of ART began in 2005 with a target of one (1) service point in each of the 53 districts of
53,8 53,3 52,8 52,4 52,253,1
53,855,1
56,557,4
58,1 58,759,4 59,7 60,1 60,7 61,157,6
56,655,9 55,5 55,8
56,658,1
59,661,2
62,3
64,164,8
65,5 65,9 66,267,1 67,3
40,0
45,0
50,0
55,0
60,0
65,0
70,0
2002 2003 2004 2005 2006 2007 2008 2009 2010 2011 2012 2013 2014 2015 2016 2017 2018
Male female
0,0
10,0
20,0
30,0
40,0
50,0
60,0
70,0
80,0
2002 2003 2004 2005 2006 2007 2008 2009 2010 2011 2012 2013 2014 2015 2016 2017 2018
Rat
e
IMR U5MR CDR
STATISTICS SOUTH AFRICA P0302
Mid-year population estimates, 2018
7
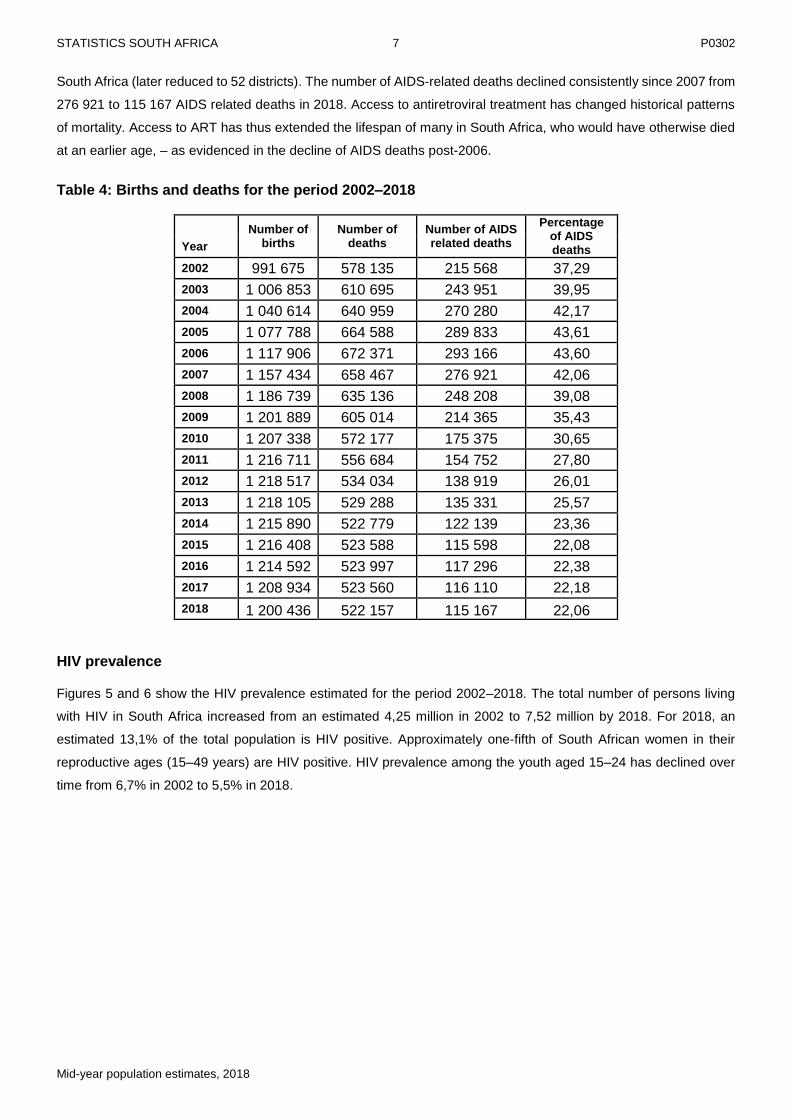
South Africa (later reduced to 52 districts). The number of AIDS-related deaths declined consistently since 2007 from
276 921 to 115 167 AIDS related deaths in 2018. Access to antiretroviral treatment has changed historical patterns
of mortality. Access to ART has thus extended the lifespan of many in South Africa, who would have otherwise died
at an earlier age, – as evidenced in the decline of AIDS deaths post-2006.
Table 4: Births and deaths for the period 2002–2018
Number of births
Number of deaths
Number of AIDS related deaths
Percentage of AIDS deaths Year
2002 991 675 578 135 215 568 37,29
2003 1 006 853 610 695 243 951 39,95
2004 1 040 614 640 959 270 280 42,17
2005 1 077 788 664 588 289 833 43,61
2006 1 117 906 672 371 293 166 43,60
2007 1 157 434 658 467 276 921 42,06
2008 1 186 739 635 136 248 208 39,08
2009 1 201 889 605 014 214 365 35,43
2010 1 207 338 572 177 175 375 30,65
2011 1 216 711 556 684 154 752 27,80
2012 1 218 517 534 034 138 919 26,01
2013 1 218 105 529 288 135 331 25,57
2014 1 215 890 522 779 122 139 23,36
2015 1 216 408 523 588 115 598 22,08
2016 1 214 592 523 997 117 296 22,38
2017 1 208 934 523 560 116 110 22,18
2018 1 200 436 522 157 115 167 22,06
HIV prevalence
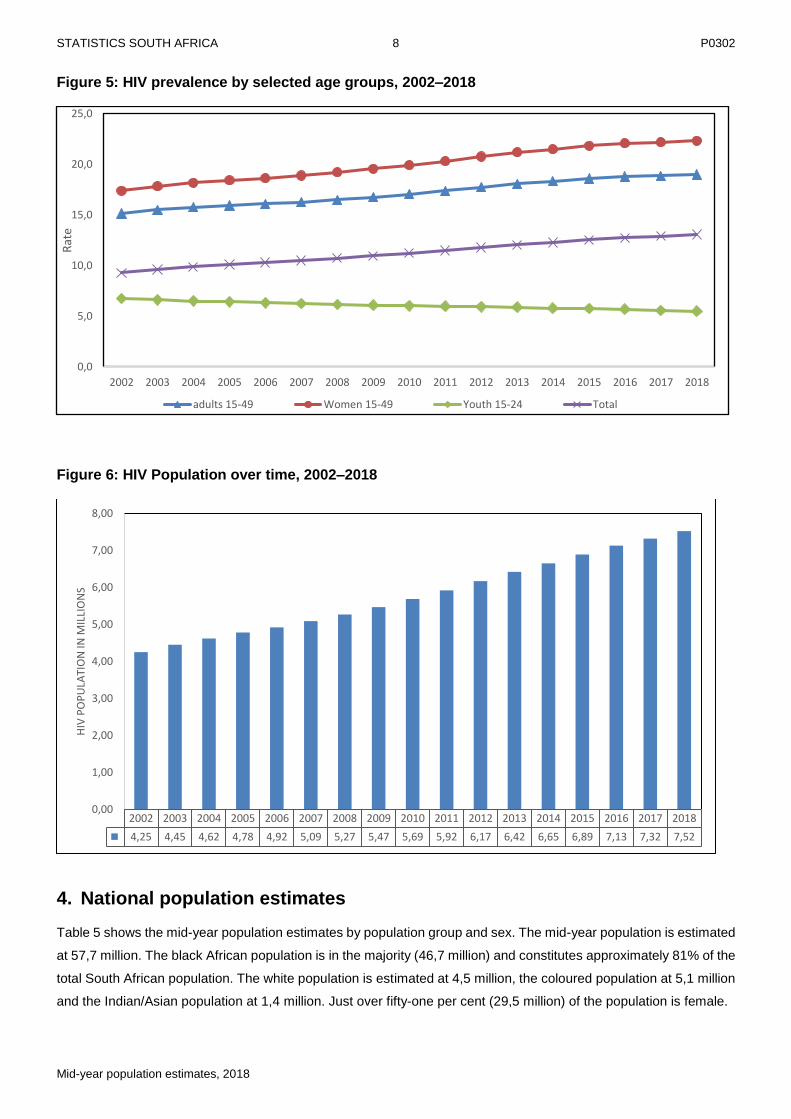
Figures 5 and 6 show the HIV prevalence estimated for the period 2002–2018. The total number of persons living
with HIV in South Africa increased from an estimated 4,25 million in 2002 to 7,52 million by 2018. For 2018, an
estimated 13,1% of the total population is HIV positive. Approximately one-fifth of South African women in their
reproductive ages (15–49 years) are HIV positive. HIV prevalence among the youth aged 15–24 has declined over
time from 6,7% in 2002 to 5,5% in 2018.
STATISTICS SOUTH AFRICA P0302
Mid-year population estimates, 2018
8
Figure 5: HIV prevalence by selected age groups, 2002–2018
Figure 6: HIV Population over time, 2002–2018
4. National population estimates
Table 5 shows the mid-year population estimates by population group and sex. The mid-year population is estimated
at 57,7 million. The black African population is in the majority (46,7 million) and constitutes approximately 81% of the
total South African population. The white population is estimated at 4,5 million, the coloured population at 5,1 million
and the Indian/Asian population at 1,4 million. Just over fifty-one per cent (29,5 million) of the population is female.
0,0
5,0
10,0
15,0
20,0
25,0
2002 2003 2004 2005 2006 2007 2008 2009 2010 2011 2012 2013 2014 2015 2016 2017 2018
Rat
e
adults 15-49 Women 15-49 Youth 15-24 Total
2002 2003 2004 2005 2006 2007 2008 2009 2010 2011 2012 2013 2014 2015 2016 2017 2018
4,25 4,45 4,62 4,78 4,92 5,09 5,27 5,47 5,69 5,92 6,17 6,42 6,65 6,89 7,13 7,32 7,52
0,00
1,00
2,00
3,00
4,00
5,00
6,00
7,00
8,00
HIV
PO
PU
LATI
ON
IN M
ILLI
ON
S

STATISTICS SOUTH AFRICA P0302
Mid-year population estimates, 2018
9
Table 5: Mid-year population estimates by population group and sex, 2018
Population group
Male Female Total
Number
% of total male
population Number
% of total female
population Number % of total
population
Black African 22 786 200 80,9 23 896 700 80,9 46 682 900 80,9
Coloured 2 459 500 8,7 2 614 800 8,9 5 074 300 8,8
Indian/Asian 740 200 2,6 708 100 2,4 1 448 300 2,5
White 2 194 200 7,8 2 325 900 7,9 4 520 100 7,8
Total 28 180 100 100,0 29 545 500 100,0 57 725 600 100,0
Figure 7 below shows that the rate of growth for the South African population has increased between 2002 and 2018.
The estimated overall growth rate increased from approximately 1,04% for the period 2002–2003 to 1,55% for the
period 2017–2018. The proportion of the elderly in South Africa is on the increase and this is indicative in the
estimated growth rate over time rising from 1,21% for the period 2002–2003 to 3,21% for the period 2017–2018.
Given the fluctuation in fertility over time, the growth rate among children aged 0–14 increased between 2002 and
2012, with a stall in the period 2013–2018.
Figure 7: Population growth rates by selected age groups over time, 2002–2018
Table 6 (page 10) shows the 2018 mid-year population estimates by age, sex and population group. About 29,5% of
the population is aged 0–14 years and approximately 8,5% is 60 years and older.
-1,5
-1
-0,5
0
0,5
1
1,5
2
2,5
3
3,5
4
Rat
e
Elderly 60+ Youth 15-24 Children 0-14 Total Pop adults 25-59

STATISTICS SOUTH AFRICA P0302
Mid-year population estimates, 2018
10
Table 6: Mid-year population estimates by population group, age and sex, 2018
Age
Black African Coloured Indian/Asian White RSA
Male Female Total Male Female Total Male Female Total Male Female Total Male Female Total
0-4 2 563 829 2 565 832 5 129 661 241 769 233 941 475 710 49 001 47 120 96 120 115 704 111 757 227 461 2 970 302 2 958 649 5 928 951
5-9 2 524 670 2 518 447 5 043 117 240 351 232 952 473 303 48 518 46 351 94 869 127 490 123 302 250 792 2 941 029 2 921 052 5 862 081
10-14 2 229 354 2 247 086 4 476 440 221 550 215 429 436 979 45 396 43 020 88 416 127 310 123 340 250 650 2 623 611 2 628 874 5 252 485
15-19 1 987 756 2 009 256 3 997 012 206 457 202 313 408 770 44 494 42 033 86 527 122 241 119 241 241 482 2 360 947 2 372 843 4 733 790
20-24 2 093 724 2 140 452 4 234 176 214 450 211 450 425 900 54 296 49 366 103 662 128 124 127 299 255 423 2 490 594 2 528 566 5 019 161
25-29 2 336 908 2 323 406 4 660 314 217 409 215 406 432 815 67 101 57 621 124 722 135 226 133 874 269 100 2 756 645 2 730 307 5 486 952
30-34 2 281 671 2 221 521 4 503 192 203 275 203 568 406 842 74 569 61 954 136 523 149 594 149 091 298 685 2 709 109 2 636 133 5 345 242
35-39 1 836 672 1 770 140 3 606 812 171 585 177 693 349 277 71 738 58 462 130 200 146 634 148 212 294 846 2 226 629 2 154 507 4 381 136
40-44 1 372 353 1 340 514 2 712 867 152 677 156 540 309 217 62 150 52 044 114 193 152 664 160 245 312 909 1 739 843 1 709 343 3 449 186
45-49 1 032 933 1 106 085 2 139 018 146 367 162 443 308 809 54 474 48 316 102 790 168 392 173 360 341 753 1 402 166 1 490 204 2 892 370
50-54 753 749 972 012 1 725 761 131 972 157 947 289 919 45 736 45 284 91 020 153 242 162 639 315 881 1 084 700 1 337 881 2 422 581
55-59 621 476 807 003 1 428 479 112 864 134 642 247 506 38 289 40 731 79 020 147 081 160 280 307 361 919 710 1 142 656 2 062 367
60-64 473 809 647 435 1 121 244 81 300 107 443 188 743 30 967 35 143 66 110 138 340 150 653 288 993 724 416 940 674 1 665 090
65-69 322 088 473 362 795 450 55 781 81 433 137 214 23 517 29 522 53 039 125 225 142 698 267 923 526 610 727 015 1 253 626
70-74 184 722 318 378 503 100 33 186 53 443 86 629 15 389 22 105 37 494 105 238 121 502 226 740 338 535 515 429 853 963
70-79 100 835 206 357 307 192 17 159 35 182 52 341 8 743 14 882 23 625 75 210 94 655 169 865 201 946 351 076 553 023
80+ 69 691 229 370 299 061 11 324 33 016 44 340 5 842 14 151 19 993 76 452 123 757 200 209 163 309 400 295 563 604
Total 22 786 240 23 896 656 46 682 896 2 459 473 2 614 840 5 074 313 740 222 708 103 1 448 324 2 194 167 2 325 906 4 520 072 28 180 101 29 545 505 57 725 606

STATISTICS SOUTH AFRICA P0302
Mid-year population estimates, 2018
11
5. Provincial population estimates
Provincial estimates are derived using a cohort-component method as suggested by the United Nations (United
Nations, 1992), incorporating changes in births, deaths as well as migration over time. When provincial population
estimates are desired and the appropriate data are available, a multi-regional approach should be considered as this
is the only way to guarantee that the total migration flows between regions will sum to zero (United Nations, 1992).
Multi-regional methods require the estimation of separate age-specific migration rates between every region of the
country and every other region and such detailed data are rarely available. Although it is possible to estimate some
of the missing data (see Willekens et al., 1978) the task of preparing data can become overwhelming if there are
many regions. If there are only a few streams however the multi-regional method is the best method to use. In South
Africa 2 448 (9x8x17x2) migration streams are derived if the multi-regional model is applied in calculating migration
streams by age group (17 in total) and sex for each of the nine provinces.
5.1 Demographic assumptions
The demographic data from the 2011 Census i.e. fertility, mortality and migration rates are incorporated in the
assumptions. The population structure as per Census 2011 as well as the distribution of births and deaths from vital
registrations (adjusted for late registration and completeness) are used to determine provincial estimates (Stats SA,
2017). Figure 8 shows the provincial fertility estimates for the periods 2001–2006; 2006–2011; 2011–2016 and 2016-
2021. In the period 2006–2011, there is a general rise in TFR, giving shape to the Census 2011 provincial population
structure. However for the period 2011–2021 there is an overall decline in TFR over time. Fertility varies from province
to province as is depicted in Figure 8. The more rural provinces of the Eastern Cape and Limpopo indicate higher
fertility rates whilst more urbanised provinces such as Gauteng and the Western Cape indicate lower levels of fertility.
Figure 8: Provincial average total fertility rate over time, 2001–2021
EC FS GP KZN LIM MP NC NW WC
2001-2006 3,35 2,65 2,19 2,86 3,20 2,91 3,09 3,10 2,32
2006-2011 3,33 2,81 2,38 2,97 3,32 3,01 3,12 3,20 2,49
2011-2016 3,15 2,65 2,14 2,74 3,14 2,89 2,93 3,05 2,38
2016-2021 2,89 2,41 2,04 2,51 2,86 2,60 2,71 2,77 2,21
0,00
0,50
1,00
1,50
2,00
2,50
3,00
3,50
4,00
TFR

STATISTICS SOUTH AFRICA P0302
Mid-year population estimates, 2018
12
Figure 9: Provincial average total fertility rate, 2016–2021
Figures 10 and 11 (page 13) show the average provincial life expectancies at birth for males and females for the
periods 2001–2006; 2006–2011; 2011–2016 and 2016–2021. Life expectancy at birth reflects the overall mortality
level of a population. The life expectancy increased incrementally for each period across all provinces but more
significantly in the period 2011–2016 due to the uptake of antiretroviral therapy over time in South Africa. Though the
life expectancy in the periods 2001–2006 and 2006–2011, depicts marginal improvement, this masks the interaction
between the highest number of deaths in 2006 in combination with declining numbers of deaths between 2007 and
2010. Western Cape consistently has the highest life expectancy at birth for both males and females over time whilst
the Free State has the lowest life expectancy at birth.

STATISTICS SOUTH AFRICA P0302
Mid-year population estimates, 2018
13
Figure 10: Provincial average life expectancy at birth (males)
Figure 11: Provincial average life expectancy at birth (females)
EC FS GP KZN LIM MP NC NW WC
2001-2006 51,7 46,5 55,8 48,8 52,0 52,0 52,2 49,9 59,2
2006-2011 52,3 46,9 56,2 48,9 52,6 52,8 52,8 50,7 60,5
2011-2016 56,1 53,1 62,0 55,3 56,4 57,6 57,2 55,3 63,9
2016-2021 58,5 55,0 64,0 57,7 58,6 60,6 60,0 58,4 66,2
0,0
10,0
20,0
30,0
40,0
50,0
60,0
70,0
Life
exp
ecta
ncy
EC FS GP KZN LIM MP NC NW WC
2001-2006 54,8 49,2 58,6 54,0 55,4 55,6 57,4 54,0 64,1
2006-2011 56,1 51,0 59,7 54,4 55,8 57,1 58,1 55,7 66,2
2011-2016 62,9 58,8 67,2 61,4 62,8 63,2 63,5 62,8 70,3
2016-2021 65,9 61,5 69,8 64,1 65,4 66,1 66,3 64,6 72,1
0,0
10,0
20,0
30,0
40,0
50,0
60,0
70,0
80,0
Life
exp
ecta
ncy
STATISTICS SOUTH AFRICA P0302
Mid-year population estimates, 2018
14
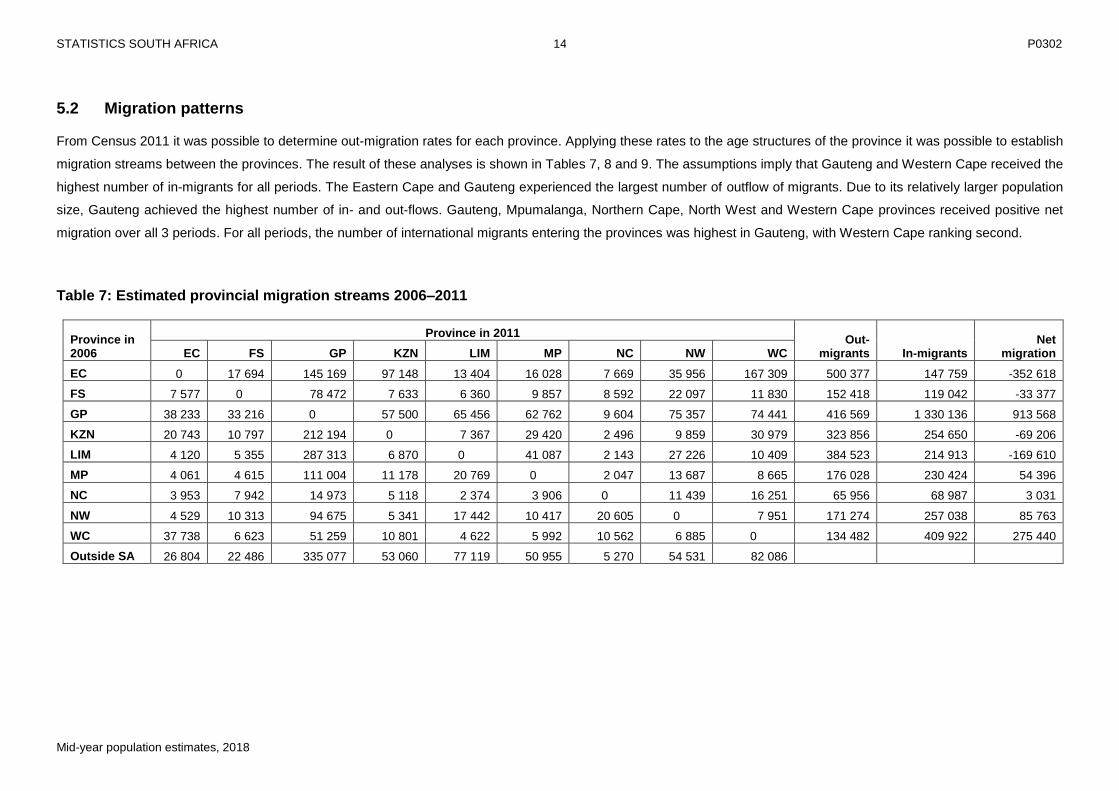
5.2 Migration patterns
From Census 2011 it was possible to determine out-migration rates for each province. Applying these rates to the age structures of the province it was possible to establish
migration streams between the provinces. The result of these analyses is shown in Tables 7, 8 and 9. The assumptions imply that Gauteng and Western Cape received the
highest number of in-migrants for all periods. The Eastern Cape and Gauteng experienced the largest number of outflow of migrants. Due to its relatively larger population
size, Gauteng achieved the highest number of in- and out-flows. Gauteng, Mpumalanga, Northern Cape, North West and Western Cape provinces received positive net
migration over all 3 periods. For all periods, the number of international migrants entering the provinces was highest in Gauteng, with Western Cape ranking second.
Table 7: Estimated provincial migration streams 2006–2011
Province in 2006
Province in 2011 Out-
migrants In-migrants Net
migration EC FS GP KZN LIM MP NC NW WC
EC 0 17 694 145 169 97 148 13 404 16 028 7 669 35 956 167 309 500 377 147 759 -352 618
FS 7 577 0 78 472 7 633 6 360 9 857 8 592 22 097 11 830 152 418 119 042 -33 377
GP 38 233 33 216 0 57 500 65 456 62 762 9 604 75 357 74 441 416 569 1 330 136 913 568
KZN 20 743 10 797 212 194 0 7 367 29 420 2 496 9 859 30 979 323 856 254 650 -69 206
LIM 4 120 5 355 287 313 6 870 0 41 087 2 143 27 226 10 409 384 523 214 913 -169 610
MP 4 061 4 615 111 004 11 178 20 769 0 2 047 13 687 8 665 176 028 230 424 54 396
NC 3 953 7 942 14 973 5 118 2 374 3 906 0 11 439 16 251 65 956 68 987 3 031
NW 4 529 10 313 94 675 5 341 17 442 10 417 20 605 0 7 951 171 274 257 038 85 763
WC 37 738 6 623 51 259 10 801 4 622 5 992 10 562 6 885 0 134 482 409 922 275 440
Outside SA 26 804 22 486 335 077 53 060 77 119 50 955 5 270 54 531 82 086

STATISTICS SOUTH AFRICA P0302
Mid-year population estimates, 2018
15
Table 8: Estimated provincial migration streams 2011–2016
Province in 2011
Province in 2016 Out-
migrants In-
migrants Net
migration EC FS GP KZN LIM MP NC NW WC
EC 0 17 239 142 037 92 194 12 981 15 531 7 457 36 373 169 171 492 983 172 917 -320 066
FS 7 844 0 81 138 7 905 6 591 10 208 8 895 22 878 12 255 157 714 132 917 -24 797
GP 43 894 38 197 0 66 237 75 134 72 265 11 049 86 779 85 905 479 461 1 459 549 980 088
KZN 22 055 11 473 225 488 0 7 855 31 299 2 659 10 497 32 977 344 302 275 920 -68 382
LIM 4 336 5 628 287 096 7 229 0 43 192 2 258 28 605 10 947 389 290 248 413 -140 878
MP 4 468 5 073 121 999 12 281 22 829 0 2 253 15 050 9 526 193 479 258 374 64 895
NC 4 217 8 480 17 232 5 459 2 537 4 169 0 12 215 17 368 71 678 75 606 3 929
NW 4 977 11 314 107 643 5 867 19 149 11 433 22 610 0 8 737 191 729 288 204 96 475
WC 47 741 7 459 57 748 12 648 5 207 6 755 11 890 7 762 0 157 210 449 308 292 099
Outside SA 33 386 28 054 419 169 66 100 96 130 63 523 6 535 68 044 102 423
Table 9: Estimated provincial migration streams 2016–2021
Province in 2016
Province in 2021 Out-
migrants In-
migrants Net
migration EC FS GP KZN LIM MP NC NW WC
EC 0 18 261 149 867 100 226 13 840 16 522 7 930 37 014 172 603 516 264 192 412 -323 851
FS 8 108 0 84 158 8 177 6 817 10 565 9 217 23 676 12 690 163 408 147 666 -15 742
GP 50 121 43 685 0 75 771 85 884 82 704 12 638 99 311 98 341 548 456 1 596 896 1 048 440
KZN 23 396 12 185 239 905 0 8 346 33 228 2 825 11 159 35 105 366 150 307 547 -58 602
LIM 4 589 5 950 304 317 7 650 0 45 628 2 387 30 197 11 550 412 269 279 755 -132 513
MP 4 889 5 549 133 937 13 434 24 949 0 2 469 16 472 10 417 212 116 286 154 74 038
NC 4 487 9 061 18 432 5 814 2 709 4 444 0 13 031 18 533 76 512 83 000 6 489
NW 5 448 12 373 118 045 6 421 20 945 12 507 24 786 0 9 572 210 096 317 830 107 733
WC 53 052 8 338 64 675 14 168 5 826 7 566 13 286 8 703 0 175 613 486 617 311 004
Outside SA 38 322 32 263 483 561 75 886 110 440 72 988 7 461 78 267 117 805

STATISTICS SOUTH AFRICA P0302
Mid-year population estimates, 2018
16
5.3 Provincial distributions
Table 10 below shows the estimated percentage of the total population residing in each of the provinces from 2002 to 2018. The provincial estimates show that Gauteng has
the largest share of the population followed by KwaZulu-Natal, Western Cape and Eastern Cape. Inter-provincial as well as international migration patterns significantly
influence the provincial population numbers and structures in South Africa. By 2018 approximately 11,5% of South Africa’s population live in Western Cape and Northern
Cape has the smallest share of the population (2,1%). Free State has the second smallest share of the South African population constituting 5,1% of the population. Figures
12 and 13 indicate that Limpopo (34,3%) and Eastern Cape (34,4%) have the highest proportions of persons younger than 15 years while a greater proportion of persons
aged 60 years and above are found in Eastern Cape and Northern Cape.
Table 10: Percentage distribution of the projected provincial share of the total population, 2002–2018
2002 2003 2004 2005 2006 2007 2008 2009 2010 2011 2012 2013 2014 2015 2016 2017 2018
EC 13,8 13,7 13,5 13,4 13,3 13,1 12,9 12,8 12,6 12,4 12,2 12,0 11,9 11,7 11,6 11,5 11,3
FS 6,0 5,9 5,9 5,8 5,7 5,7 5,6 5,6 5,5 5,5 5,4 5,4 5,3 5,3 5,2 5,2 5,1
GP 21,2 21,5 21,7 22,0 22,3 22,5 22,8 23,1 23,4 23,7 24,0 24,2 24,5 24,7 25,0 25,2 25,5
KZN 21,3 21,2 21,1 21,0 20,9 20,8 20,7 20,6 20,5 20,4 20,3 20,2 20,1 20,0 19,9 19,8 19,7
LP 11,1 11,0 10,9 10,8 10,8 10,7 10,6 10,6 10,5 10,4 10,4 10,3 10,2 10,2 10,2 10,1 10,0
MP 7,5 7,6 7,6 7,6 7,6 7,6 7,7 7,7 7,7 7,7 7,7 7,8 7,8 7,8 7,8 7,8 7,8
NC 2,2 2,2 2,2 2,2 2,2 2,2 2,2 2,2 2,2 2,2 2,2 2,2 2,1 2,1 2,1 2,1 2,1
NW 6,7 6,7 6,7 6,7 6,7 6,7 6,8 6,8 6,8 6,8 6,8 6,8 6,8 6,8 6,9 6,9 6,9
WC 10,2 10,3 10,4 10,4 10,5 10,6 10,7 10,8 10,9 11,0 11,1 11,1 11,2 11,3 11,3 11,4 11,5
Total 100,0 100,0 100,0 100,0 100,0 100,0 100,0 100,0 100,0 100,0 100,0 100,0 100,0 100,0 100,0 100,0 100,0
STATISTICS SOUTH AFRICA P0302
Mid-year population estimates, 2018
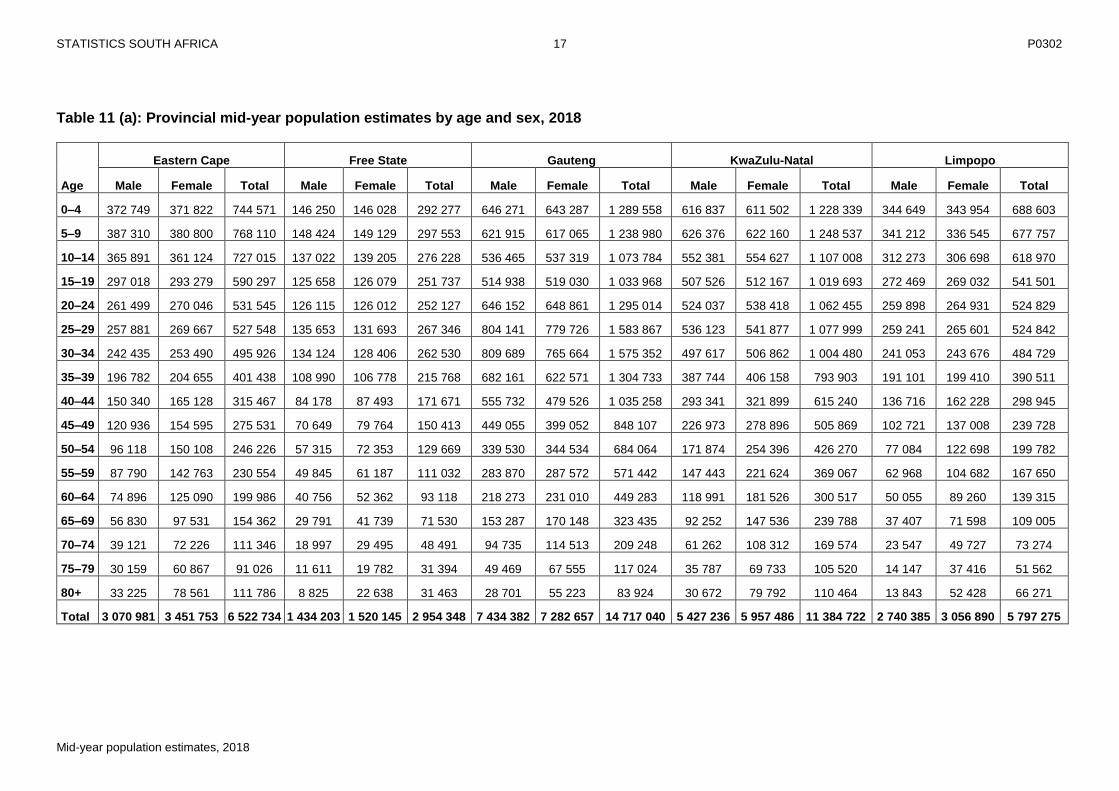
17
Table 11 (a): Provincial mid-year population estimates by age and sex, 2018
Age
Eastern Cape Free State Gauteng KwaZulu-Natal Limpopo
Male Female Total Male Female Total Male Female Total Male Female Total Male Female Total
0–4 372 749 371 822 744 571 146 250 146 028 292 277 646 271 643 287 1 289 558 616 837 611 502 1 228 339 344 649 343 954 688 603
5–9 387 310 380 800 768 110 148 424 149 129 297 553 621 915 617 065 1 238 980 626 376 622 160 1 248 537 341 212 336 545 677 757
10–14 365 891 361 124 727 015 137 022 139 205 276 228 536 465 537 319 1 073 784 552 381 554 627 1 107 008 312 273 306 698 618 970
15–19 297 018 293 279 590 297 125 658 126 079 251 737 514 938 519 030 1 033 968 507 526 512 167 1 019 693 272 469 269 032 541 501
20–24 261 499 270 046 531 545 126 115 126 012 252 127 646 152 648 861 1 295 014 524 037 538 418 1 062 455 259 898 264 931 524 829
25–29 257 881 269 667 527 548 135 653 131 693 267 346 804 141 779 726 1 583 867 536 123 541 877 1 077 999 259 241 265 601 524 842
30–34 242 435 253 490 495 926 134 124 128 406 262 530 809 689 765 664 1 575 352 497 617 506 862 1 004 480 241 053 243 676 484 729
35–39 196 782 204 655 401 438 108 990 106 778 215 768 682 161 622 571 1 304 733 387 744 406 158 793 903 191 101 199 410 390 511
40–44 150 340 165 128 315 467 84 178 87 493 171 671 555 732 479 526 1 035 258 293 341 321 899 615 240 136 716 162 228 298 945
45–49 120 936 154 595 275 531 70 649 79 764 150 413 449 055 399 052 848 107 226 973 278 896 505 869 102 721 137 008 239 728
50–54 96 118 150 108 246 226 57 315 72 353 129 669 339 530 344 534 684 064 171 874 254 396 426 270 77 084 122 698 199 782
55–59 87 790 142 763 230 554 49 845 61 187 111 032 283 870 287 572 571 442 147 443 221 624 369 067 62 968 104 682 167 650
60–64 74 896 125 090 199 986 40 756 52 362 93 118 218 273 231 010 449 283 118 991 181 526 300 517 50 055 89 260 139 315
65–69 56 830 97 531 154 362 29 791 41 739 71 530 153 287 170 148 323 435 92 252 147 536 239 788 37 407 71 598 109 005
70–74 39 121 72 226 111 346 18 997 29 495 48 491 94 735 114 513 209 248 61 262 108 312 169 574 23 547 49 727 73 274
75–79 30 159 60 867 91 026 11 611 19 782 31 394 49 469 67 555 117 024 35 787 69 733 105 520 14 147 37 416 51 562
80+ 33 225 78 561 111 786 8 825 22 638 31 463 28 701 55 223 83 924 30 672 79 792 110 464 13 843 52 428 66 271
Total 3 070 981 3 451 753 6 522 734 1 434 203 1 520 145 2 954 348 7 434 382 7 282 657 14 717 040 5 427 236 5 957 486 11 384 722 2 740 385 3 056 890 5 797 275

STATISTICS SOUTH AFRICA P0302
Mid-year population estimates, 2018
18
Table 11 (b): Provincial mid-year population estimates by age and sex, 2018 (concluded)
Age
Mpumalanga Northern Cape North West Western Cape All provinces
Male Female Total Male Female Total Male Female Total Male Female Total Male Female Total
0–4 253 987 254 231 508 218 63 447 63 664 127 111 219 152 221 040 440 192 306 960 303 122 610 082 2 970 302 2 958 649 5 928 951
5–9 245 047 245 739 490 786 62 739 62 719 125 458 208 561 210 895 419 456 299 444 296 000 595 444 2 941 029 2 921 052 5 862 081
10–14 214 500 217 228 431 728 57 565 59 146 116 711 186 448 190 789 377 237 261 066 262 738 523 803 2 623 611 2 628 874 5 252 485
15–19 193 714 198 222 391 936 50 733 51 740 102 473 158 816 160 895 319 710 240 075 242 399 482 475 2 360 947 2 372 843 4 733 790
20–24 197 598 202 329 399 926 49 747 49 093 98 840 157 605 158 010 315 616 267 944 270 865 538 809 2 490 594 2 528 566 5 019 161
25–29 217 058 211 210 428 268 55 328 51 048 106 376 178 774 172 329 351 103 312 446 307 156 619 602 2 756 645 2 730 307 5 486 952
30–34 218 292 203 853 422 145 57 327 50 199 107 526 183 672 169 795 353 467 324 900 314 188 639 088 2 709 109 2 636 133 5 345 242
35–39 176 448 164 909 341 357 47 784 41 528 89 312 158 696 141 281 299 977 276 923 267 216 544 139 2 226 629 2 154 507 4 381 136
40–44 129 407 129 892 259 300 36 730 33 872 70 601 126 795 114 610 241 405 226 605 214 695 441 300 1 739 843 1 709 343 3 449 186
45–49 99 316 111 607 210 924 30 739 31 399 62 138 104 718 99 943 204 661 197 058 197 941 394 999 1 402 166 1 490 204 2 892 370
50–54 76 181 97 369 173 550 24 224 28 571 52 795 85 365 87 146 172 511 157 008 180 706 337 714 1 084 700 1 337 881 2 422 581
55–59 62 890 76 798 139 688 20 883 24 493 45 376 75 339 72 526 147 865 128 682 151 010 279 693 919 710 1 142 656 2 062 367
60–64 49 238 61 460 110 697 17 463 21 317 38 780 56 872 59 679 116 551 97 872 118 970 216 842 724 416 940 674 1 665 090
65–69 35 317 46 776 82 093 12 963 17 042 30 006 37 605 45 032 82 637 71 159 89 612 160 771 526 610 727 015 1 253 626
70–74 21 547 31 223 52 770 8 564 12 668 21 232 23 733 33 157 56 890 47 029 64 108 111 137 338 535 515 429 853 963
75–79 13 027 22 613 35 640 5 490 8 968 14 457 14 190 24 597 38 787 28 067 39 545 67 612 201 946 351 076 553 023
80+ 13 038 31 809 44 847 4 778 11 586 16 364 9 856 31 035 40 891 20 370 37 223 57 594 163 309 400 295 563 604
Total 2 216 604 2 307 270 4 523 874 606 504 619 052 1 225 555 1 986 197 1 992 758 3 978 955 3 263 609 3 357 494 6 621 103 28 180 101 29 545 505 57 725 606

STATISTICS SOUTH AFRICA P0302
Mid-year population estimates, 2018
19
Figure 12: Population under 15 years of age
Figure 13: Proportion of elderly aged 60+

STATISTICS SOUTH AFRICA P0302
Mid-year population estimates, 2018
20
References Avenir Health (2016) Spectrum Version 5.47., www.avenirhealth.org.
Dorrington R.E., Bradshaw D., Laubscher R., & Nannan, N, (2018) Rapid mortality surveillance report 2016, Cape
Town: South African Medical Research Council. ISBN: 978-1-928340-30-0.
National Department of Health, (2018). The 2015 National Antenatal Sentinel HIV and Herpes Simplex Type-2
Prevalence Survey, South Africa, National Department of Health.
National Department of Health, (2017). National Department of Health 2016/2017 Annual report, South Africa, ISBN:
978-0-621-45639-4.
Shisana O. Rehle T., Simbayi I., C, Zuma K., Jooste S., Jungi N., Labadarios D., Onoya D., et al (2014). South
African National HIV Prevalence Incidence and Behaviour Survey 2012, Cape Town, HSRC Press,
Simelela N. P., & Venter, W.D. F. (2014). A brief history of South Africa’s response to AIDS. South African Medical
Journal, March 2014, Vol 104, No. 3, Supplement 1, 249-251.
Stats SA (2017). Mortality and causes of death in South Africa, 2016: Findings from death notification. PO309. 3,
Pretoria.
United Nations (1992). Preparing Migration Data for Sub-national Population Projections. Department of International
and Economic and Social Affairs, United Nations, New York.
USAID Health Policy Initiative (2009) AIM: A Computer Program for Making HIV/AIDS Projections and Examining
the Demographic and Social Impacts of AIDS, New York.
USAID (2009) DemProj Version 4. A computer program for making population projections (The Spectrum system of
policy models). New York.
Willekens F., & Rogers A., (1978) Spatial Population Analysis: Methods and Computer Programs. International
Institute for Applied System Analysis, Research Report, RR 78-18. Luxenberg, Austria.
Willekens F., Por A., & Raquillet, R. (1978) Entropy multi-proportional and quadratic techniques for inferring detailed
migration patterns from aggregate data. International Institute for Applied System Analysis, Working Paper WP-79-
88. Luxenberg, Austria.

STATISTICS SOUTH AFRICA P0302
Mid-year population estimates, 2018
21
Appendices Appendix 1: Mid-year population estimates by province, 2018
Population estimate % of total population
Eastern Cape 6 522 700 11,3
Free State 2 954 300 5,1
Gauteng 14 717 000 25,5
KwaZulu-Natal 11 384 700 19,7
Limpopo 5 797 300 10,0
Mpumalanga 4 523 900 7,8
Northern Cape 1 225 600 2,1
North West 3 979 000 6,9
Western Cape 6 621 100 11,5
Total 57 725 600 100,0
Appendix 2: Demographic indicators, 2002–2018
Year
Crude
birth rate
Life expectancy
Infant mortality
rate
Under 5 mortality
rate
Crude death rate
Rate of natural
increase (%) Male Female Total
2002 21,7 53,8 57,6 55,8 53,2 80,1 12,6 0,90
2003 21,8 53,3 56,6 55,0 52,8 79,5 13,2 0,86
2004 22,3 52,8 55,9 54,4 52,3 78,6 13,7 0,86
2005 22,8 52,4 55,5 54,0 51,8 78,0 14,1 0,88
2006 23,4 52,2 55,8 54,1 51,2 76,9 14,1 0,93
2007 23,9 53,1 56,6 54,9 50,4 75,5 13,6 1,03
2008 24,2 53,8 58,1 56,0 49,5 73,6 12,9 1,12
2009 24,1 55,1 59,6 57,4 45,8 68,9 12,1 1,20
2010 23,8 56,5 61,2 58,9 45,4 66,9 11,3 1,25
2011 23,6 57,4 62,3 59,9 44,8 60,8 10,8 1,28
2012 23,3 58,1 64,1 61,2 42,4 54,7 10,2 1,31
2013 22,9 58,7 64,8 61,8 39,8 50,2 10,0 1,29
2014 22,5 59,4 65,5 62,5 38,3 48,1 9,7 1,28
2015 22,1 59,7 65,9 62,8 38,4 48,0 9,5 1,26
2016 21,8 60,1 66,2 63,2 37,9 47,4 9,4 1,24
2017 21,3 60,7 67,1 63,9 37,0 46,1 9,2 1,21
2018 20,8 61,1 67,3 64,2 36,4 45 9,1 1,18

STATISTICS SOUTH AFRICA P0302
Mid-year population estimates, 2018
22
Appendix 3: HIV prevalence estimates and number of people living with HIV, 2002–2018
Year
Prevalence (%) Incidence
(%) HIV
population
Women 15–49
Adults 15–49
Youth 15–24
Total population 15–49 (in millions)
2002 17,40 15,16 6,74 9,29 1,88 4,25
2003 17,84 15,51 6,61 9,62 1,84 4,45
2004 18,17 15,76 6,50 9,90 1,80 4,62
2005 18,42 15,94 6,43 10,11 1,76 4,78
2006 18,64 16,10 6,33 10,31 1,72 4,92
2007 18,90 16,27 6,24 10,51 1,67 5,09
2008 19,21 16,50 6,16 10,74 1,63 5,27
2009 19,56 16,77 6,10 10,97 1,58 5,47
2010 19,93 17,07 6,03 11,23 1,52 5,69
2011 20,33 17,40 5,98 11,51 1,50 5,92
2012 20,77 17,76 5,94 11,79 1,48 6,17
2013 21,19 18,08 5,91 12,07 1,46 6,42
2014 21,50 18,32 5,80 12,29 1,34 6,65
2015 21,82 18,59 5,76 12,54 1,37 6,89
2016 22,09 18,80 5,71 12,77 1,33 7,13
2017 22,19 18,88 5,57 12,90 1,18 7,32
2018 22,32 18,99 5,49 13,06 1,21 7,52
Appendix 4: Estimates of annual growth rates, 2002–2018
Period Children 0–14 Youth 15–24 Elderly 60+ adults 25–59 Total
2002–2003 -0,86 3,02 1,21 1,54 1,04
2003–2004 -0,63 2,77 1,33 1,49 1,07
2004–2005 -0,32 2,27 1,48 1,58 1,12
2005–2006 0,01 1,44 1,70 1,90 1,20
2006–2007 0,36 1,02 1,93 2,09 1,32
2007–2008 0,64 0,70 2,22 2,26 1,43
2008–2009 0,84 0,42 2,33 2,42 1,52
2009–2010 0,96 0,21 2,75 2,50 1,58
2010–2011 1,15 -0,35 2,83 2,68 1,62
2011–2012 1,48 -0,88 3,04 2,71 1,65
2012–2013 1,58 -1,17 3,13 2,71 1,65
2013–2014 1,52 -1,08 3,22 2,63 1,65
2014–2015 1,47 -0,96 3,18 2,54 1,63
2015–2016 1,42 -0,82 3,14 2,43 1,61
2016–2017 1,65 -0,99 3,32 2,22 1,58
2017–2018 1,41 -0,74 3,21 2,20 1,55

STATISTICS SOUTH AFRICA P0302
Mid-year population estimates, 2018
23
General information Stats SA publishes approximately 300 different statistical releases each year. It is not economically viable to produce them in more than one of South Africa's 11 official languages; since the releases are used extensively not only locally but also by international economic and social-scientific communities. Stats SA releases are therefore published in English only. Stats SA has copyright on this publication. Users may apply the information as they wish provided that they acknowledge Stats SA as the source of the basic data wherever they process apply utilise publish or distribute the data; and also that they specify that the relevant application and analyses (where applicable) result from their own processing of the data. Advance release calendar An advance release calendar is disseminated on www.statssa.gov.za Stats SA products A complete set of Stats SA publications is available at the Stats SA Library and the following libraries: National Library of South Africa Pretoria Division National Library of South Africa Cape Town Division Natal Society Library Pietermaritzburg Library of Parliament Cape Town Bloemfontein Public Library Bloemfontein Johannesburg Public Library Johannesburg Eastern Cape Library Services King William’s Town Central Regional Library Polokwane Central Reference Library Nelspruit Central Reference Collection Kimberley Central Reference Library Mmabatho Stats SA also provides a subscription service. Electronic services A large range of data is available via online services and CD. For more details about our electronic data services contact 012 310 8600/8390/8351/4892/8496/8095. Forthcoming issue Issue Expected release date Mid-year population estimates
N/A
July 2019
You can visit us on the internet at: www.statssa.gov.za Enquiries Telephone number: 012 310 8600/8390/8351/4892/8496/8095 (User Information Services) 012 310 8922/2152 (technical enquiries) 012 310 8161 (orders) 012 310 8490 (library) Fax number: 086 670 9723 (technical enquiries) Email address: [email protected] (technical) [email protected] (technical) [email protected] (technical) [email protected] (User Information Services) distribution@statssa gov za (orders) Postal address: Private Bag X44, Pretoria, 0001
Produced by Stats SA