understanding glass through differential scanning...
TRANSCRIPT

Understanding Glass through Differential Scanning CalorimetryQiuju Zheng,†,○ Yanfei Zhang,†,○ Maziar Montazerian,‡,○ Ozgur Gulbiten,§ John C. Mauro,†,∥
Edgar D. Zanotto,‡ and Yuanzheng Yue*,†,⊥,∇
†School of Materials Science and Engineering, Qilu University of Technology (Shandong Academy of Sciences), Jinan 250353,China‡Vitreous Materials Laboratory (LaMaV), Department of Materials Engineering (DEMa), Federal University of Sao Carlos(UFSCar), 13.565-905 Sao Carlos, SP, Brazil§Science and Technology Division, Corning Incorporated, Corning, New York 14831, United States∥Department of Materials Science and Engineering, The Pennsylvania State University, University Park, Pennsylvania 16802, UnitedStates⊥State Key Laboratory of Silicate Materials for Architectures, Wuhan University of Technology, Wuhan 430070, China∇Department of Chemistry and Bioscience, Aalborg University, DK-9220 Aalborg, Denmark
ABSTRACT: Differential scanning calorimetry (DSC) is a powerful tool to addresssome of the most challenging issues in glass science and technology, such as thenonequilibrium nature of the glassy state and the detailed thermodynamics and kineticsof glass-forming systems during glass transition, relaxation, rejuvenation, polyamorphictransition, and crystallization. The utility of the DSC technique spans across all glass-forming chemistries, including oxide, chalcogenide, metallic, and organic systems, aswell as recently discovered metal−organic framework glass-forming systems. Here wepresent a comprehensive review of the many applications of DSC in glass science withfocus on glass transition, relaxation, polyamorphism, and crystallization phenomena.We also emphasize recent advances in DSC characterization technology, including flashDSC and temperature-modulated DSC. This review demonstrates how DSC studies have led to a multitude of relevantadvances in the understanding of glass physics, chemistry, and even technology.
CONTENTS
1. Introduction B2. Principles of DSC D
2.1. Heat Flux DSC D2.2. Power Compensation DSC E2.3. Flash DSC E2.4. Temperature-Modulated DSC G
3. Clarifying Glass Transition via DSC H3.1. General Aspects of Glass Transition H3.2. Calorimetric Glass Transition J
3.2.1. Key Features and Parameters J3.2.2. Structure−Thermodynamics Relation K3.2.3. Topological Effect L
3.3. Mechanical and Thermal Effects N3.3.1. Pressure N3.3.2. Non-Affine Strain O3.3.3. Liquid−Liquid Phase Separation O
3.4. Determination of Fictive Temperature O3.4.1. Slowly Cooled and Aged Glasses P3.4.2. Fast-Quenched and Hyperquenched
Glasses P3.4.3. Unified Approach Q
3.5. Determination of Cooling Rate R3.6. Liquid Fragility Determined by Calorimetry
and Viscometry R
3.7. Determination of Viscosity by DSC T3.8. Polyamorphic Transitions T
3.8.1. Definition and General Aspects T3.8.2. Zeolites U3.8.3. ZIF-4 V
4. Exploring Enthalpy Relaxation via DSC W4.1. Sub- and Sup-Tg Relaxation X
4.1.1. Potential Energy Landscape X4.1.2. Hyperquenched Glasses Y4.1.3. Ultrastable Glasses AB4.1.4. Milling Amorphized Materials AD4.1.5. Stretched Glasses AE
4.2. Primary and Secondary Relaxations AF4.2.1. Identifying Relaxation Modes AF4.2.2. Oxide Glasses AG4.2.3. Metallic Glasses AH4.2.4. Molecular Glasses AI4.2.5. Chalcogenide Glasses AJ4.2.6. Metal−Organic Framework (MOF)
Glasses AK4.3. Structural Heterogeneity AK
4.3.1. Good Glass Formers AL4.3.2. Poor Glass Formers AL
Received: August 12, 2018
Review
pubs.acs.org/CRCite This: Chem. Rev. XXXX, XXX, XXX−XXX
© XXXX American Chemical Society A DOI: 10.1021/acs.chemrev.8b00510Chem. Rev. XXXX, XXX, XXX−XXX
Dow
nloa
ded
by U
NIV
FE
D D
E S
AO
CA
RL
OS
at 1
2:52
:51:
751
on M
ay 2
3, 2
019
from
http
s://p
ubs.
acs.
org/
doi/1
0.10
21/a
cs.c
hem
rev.
8b00
510.

4.4. Anomalous Relaxation versus Fragile-to-Strong Transition AM
5. Investigating Glass Transition and Relaxation byFlash DSC AN5.1. Background AN5.2. Glass Transition and Fragility AO5.3. Enthalpy Relaxation AP
6. Probing Glass Transition and Relaxation byTMDSC AQ6.1. Interpretation of TMDSC Signals AQ
6.1.1. Complex Heat Capacity AQ6.1.2. Nonequilibrium Thermodynamics and
Linear Response AR6.1.3. Reversing and Nonreversing Heat Flow AT6.1.4. Comparison of the Data Analysis
Methods AT6.2. Cp″ in the Frequency Spectrum AT6.3. Cp″ in the Temperature Spectrum AU6.4. Probing Glass Relaxation via Nonreversing
Heat Flow AW7. Understanding Crystallization in Glasses AX
7.1. Crystal Nucleation Kinetics AY7.1.1. Estimation of the Temperature of
Maximum Nucleation AY7.1.2. Estimation of Nucleation Kinetics AZ7.1.3. Heterogeneous Nucleation BC
7.2. Crystal Growth Kinetics BC7.3. Overall Crystallization Kinetics BE
7.3.1. Isothermal Method BE7.3.2. Nonisothermal Methods BF
7.4. Modeling of DSC Signals BI7.5. Glass-Forming Ability BJ7.6. Glass Stability BN7.7. Liquidus Temperature BP7.8. Applications in Developing Glass-Ceramics BR
8. Concluding Remarks and Perspectives BS8.1. Calorimetric Glass Transition BS8.2. Sub- and Sup-Tg Enthalpy Relaxation BS8.3. Crystallization BT8.4. Perspectives BU
Author Information BUCorresponding Author BUORCID BUAuthor Contributions BUNotes BUBiographies BU
Acknowledgments BVSymbols and Abbreviations BVReferences BX
1. INTRODUCTION
Glass is everywhere; it is one of the most critical materials forthe development of modern human civilization and isubiquitous in our everyday lives. The oldest glasses arenaturally occurring, many of which are nearly as old as theuniverse. Glass itself is a fascinating phase of matter, combiningaspects of the liquid and solid states.1−3 The key structuralfeature of any glass is its lack of the atomic long-range order(LRO) (e.g., periodic lattice arrangement over a length scaleabove 2 nm), in contrast to crystals, while the essentialdynamic feature is the glass-to-liquid transition upon heating,during which a jump in configurational entropy occurs.
Moreover, it is important to note that glass exhibits short-range order (SRO), e.g., identical interatomic arrangementwithin a polyhedral unit, and intermedium range order (IRO),e.g., identical interpolyhedral arrangement.A diverse variety of glass-forming chemistries exist, having a
wide range of structural building blocks from which adisordered glass network can be constructed. The detailednature of these chemical building blocks and the manner inwhich they are connected depend on the particular nature ofthe chemical bonding in these systems. For example,traditional oxide glasses have network structures composedof tetrahedral and/or trigonal building blocks involving mixedcovalent-ionic bonding. Chalcogenide glasses are built upontwo-, three-, and four-coordinated building blocks, which arecovalently bonded. Metallic glasses, including bulk metallicglasses (BMGs), consist mainly of icosahedral units withmetallic bonding. Organic polymeric glasses are made from thecross-linked molecular chains involving covalent intramolecularbonding and van der Waals bonding between chains. Therecently discovered metal−organic framework (MOF) glassesare composed of tetrahedral units with coordination bonds.4
Water can also be quenched into a glassy state and iscomprised of tetrahedral units connected via hydrogen bonds.It is these different types of bonds, resulting from the variouselectronic structures of the constituent atoms, that lead todifferent structures (short- and medium-range order) andproperties in the glassy state.Within the same family of glasses, the structure, topology,
and properties also differ from one member to another,determined by the chemical composition. Some glass-formingsystems, such as many silicates and polymers, are easily vitrifiedupon cooling, whereas others are more difficult to form glasses;for example, most metallic liquids can only be vitrified if theyundergo extremely rapid quenching. This gives rise to a firstimportant question: how can we quantify the “ease” ofvitrification, i.e., the glass-forming ability (GFA), of a givensystem? A second equally important question is how a glassrelaxes toward the supercooled liquid state and ultimatelycrystallizes to its thermodynamic equilibrium state. Differentialscanning calorimetry (DSC) is perhaps the most useful andwidely applicable of all characterization techniques forproviding answers to these questions, which are of criticalimportance for both fundamental glass science and appliedglass technology and engineering.DSC equipment can be found in most chemical and
materials science laboratories. DSC has become a universalstandard tool for characterizing thermodynamic and kineticproperties, phase transitions, and property evolution in glasses.DSC is more than just a simple characterization tool: over thepast two decades, it has been developed into an advanced andversatile set of techniques for many aspects of glass research.The widespread use of DSC is driven by its ultrahigh sensitivityto both small and large energy fluctuations caused by phasetransitions and structural changes in glass during heating,cooling, annealing, and pressurization. With the emergence ofFlash DSC (Section 2.3), the range of heating and coolingrates has been enormously broadened (up to a million degreesper second), allowing for measurements at ultrashort timescales. With the development of temperature-modulated DSC(TMDSC) (Section 2.4), scientists have been able todistinguish overlapping transitions and to detect weak andsecondary transitions, due to the ability to separate the heatcapacity and kinetic components of the DSC signal.
Chemical Reviews Review
DOI: 10.1021/acs.chemrev.8b00510Chem. Rev. XXXX, XXX, XXX−XXX
B
Several excellent review articles5−7 and books8,9 are availableconcerning the application of DSC in glass research. However,a comprehensive review is still lacking concerning the recentadvances achieved through DSC and supplementary techni-ques in the study of both universal and unique thermodynamicand kinetic features of various glass families. Our motivation inthe present review is, thus, to provide emphasis on glasstransition, relaxation, and crystallization in different families ofsupercooled liquids and their corresponding glasses. In doingso, we give a comprehensive overview of the many roles ofDSC in understanding the fundamental nature of glass. Whilemany types of glasses exist, the majority of examples given inthis review paper refer to oxide systems, which are by far themost important family of commercial glasses. Also, we describethe new DSC approaches that have been established over thepast two decades.Our review is structured as follows. We first briefly introduce
the principles of DSC, Flash DSC, and TMDSC (Section 2)and then present a recent understanding of the calorimetricglass transition (Section 3). This new understanding originatesfrom various studies of the effect of structure, pressure, andphase separation on the glass transition temperature (Tg) andconfigurational heat capacity (Cp,conf). We discuss thetopological origin of the compositional trends of both Tg andliquid fragility (m), regarding the Gupta−Mauro temperature-dependent constraint model.10 Another longstanding puzzle ishow the heat capacity jump during the glass-liquid transition islinked to the IRO structure in glass. Part of the answer to thisquestion is acquired by performing DSC and Ramanspectroscopy measurements on a series of borosilicateglasses.11 We also discuss the enhancement of the glasstransition overshoot through increased pressure and include arecent finding on the rejuvenation of a metallic glass caused bynonaffine strain well below Tg. In the past two decades, someof the present authors have established new calorimetricapproaches determining the fictive temperature (Tf), thecooling rate of hyperquenched or slowly quenched glasses,liquid viscosity, and liquid fragility. These approaches arereviewed in Sections 3.4 through 3.7 At the end of Section 3,we illustrate the recent understanding of polyamorphism,which is achieved by performing DSC and structural analyseson zeolites and MOFs and interpreting these results regardingthe underlying potential energy landscape (PEL) of thesystem.12
In Section 4, we review recent major findings regarding thesub-Tg (below Tg) and sup-Tg (above Tg) enthalpy relaxationin glass. A variety of glasses have been used as the subjects ofthe present article, viz., from organic to inorganic, metallic tononmetallic, and chalcogenide to MOF systems, includingboth strong and fragile glass-formers, and systems from boththe bottom of the PEL (ultrastable molecular glasses) andthose trapped in the upper part of PEL (e.g., hyperquenched ormechanically excited glass). Much space (Section 4.1) isallocated for describing the glass transition and the sup-Tgrelaxation in thermodynamically ultrastable glasses, which areproduced by molecular deposition since these glasses are oneof the most significant discoveries in glass science over the lasttwo decades.13 In the opposite limit, the hyperquenching-annealing-DSC (HAD) approach is described to characterizethe thermodynamic and structural features of glasses,14
including highly out-of-equilibrium systems. Also, the atomicvibrational dynamics (e.g., the Boson peak) in HQ glassesduring annealing can be traced using neutron scattering15,16 or
nuclear inelastic scattering17 techniques in combination withthe HAD approach. Using the HAD approach, scientists canadequately explore the primary and secondary relaxations invarious families of MQ glasses or mechanically milled glasses interms of PEL. We also discuss a calorimetric approach toidentify the slow secondary relaxation, i.e., the Johari−Goldstein (JG) relaxation,18,19 in metallic and oxide glasses.The striking differences in relaxation modes between strongand fragile systems are discussed in Section 4.2. Furthermore,the HAD approach enables monitoring of the energeticevolution of a HQ glass or a ball-milled or stretched glasswell below Tg, by which the structural heterogeneity of theseglasses can be reflected (Section 4.3). From there, one mayalso infer how the potential energy and structure of glass varyupon annealing or dynamic heating. In Section 4.4 we alsodescribe the relationship between the anomalous relaxationbehavior and the fragile-to-strong transition for some metallicglass systems.20 Several Flash DSC studies of the glasstransition and glass relaxation in ultrathin organic glassy filmsare reviewed in Section 5.The recently developed TMDSC technique is reviewed in
Section 6. This technique is based on the superposition of asinusoidally varying signal on top of the usual linear heatingpath used in standard DSC. With TMDSC, the thermody-namic and kinetic effects can be separated through complexsignal analysis. The TMDSC technique has led to the discoveryof glass compositions where relaxation effects can beminimized. These so-called “intermediate phase” glasses havestirred significant controversy in the glass community.Evidence both for and against the existence of thisintermediate phase will be reviewed in Section 6. The signalanalysis techniques for TMDSC will also be discussed.Nucleation, crystal growth, and overall crystallization in
glass-forming supercooled (inorganic, organic, and metallic)liquids have been the subject of many studies. “Crystallization”is one of the most frequently used keywords in 200 years ofglass history.21 DSC has been extensively used as a fast, usefulmethod to preanalyze crystallization processes, for instance, todetect good and poor glass-formers and to detect/controlcrystallization behavior. Furthermore, the results of DSC havebeen used to develop an important group of materials (glass-ceramics) via controlled crystallization of glasses. Numerousnovel glass-ceramics have been commercialized for a variety ofdomestic, electronic, optical, dental, and biomedical applica-tions.22 As discussed by Davis and Zanotto, no other class ofmaterials possesses such a valuable and unusual combination ofproperties advantageously and feasibly.23 However, we foundonly a limited number of studies, reported in Section 7, dealingwith the application of DSC to investigate and quantify thecrystallization kinetics (e.g., nucleation and growth rates),glass-forming ability (GFA), glass stability (GS), and liquidustemperature (TL) in inorganic MQ glasses. Therefore, weelaborate on the versatility and usefulness of several DSCtechniques for examining this specific variety of dynamicprocesses spanning from nucleation to GS and GFA. We alsointend to call attention to the advantages and problems relatedto the use of DSC and caution the reader against its“automatic” application. For example, while most DSCmethods do not allow us to predict the crystallization kineticsquantitatively, some methods are beneficial for providingestimates of the temperature range where, for example,significant crystal nucleation and growth occur.
Chemical Reviews Review
DOI: 10.1021/acs.chemrev.8b00510Chem. Rev. XXXX, XXX, XXX−XXX
C
At the end of this review (Section 8), we give concludingremarks and perspectives regarding the application of DSC forglass research. As a powerful, sensitive thermochemical tool,DSC can provide profound insights into the thermodynamicand dynamic behavior of both supercooled liquids and theglassy state. Furthermore, new DSC methodology andinstrumentation are being rapidly developed, particularly foruse under extreme conditions. Emerging DSC approaches offerenormous potential to solve challenging problems in glassscience and to contribute to understanding the intricate natureof glass. We believe that this review article will be highlybeneficial for research activities and educational programs inthe multidisciplinary fields of chemistry, physics, and materialssciences, particularly in glass chemistry and physics, and also tothe glass and glass-ceramics industry.
2. PRINCIPLES OF DSC
DSC is the most common thermal analysis technique used fora wide range of applications, including fundamental research,development of new materials, and quality inspection inindustrial production. It is an especially important character-ization technique in the field of glass science and technology.24
With DSC, a sample is scanned dynamically or heldisothermally in the instrument, and the heat flow of both thesample and reference are monitored as a function of time andtemperature.25 Essentially, the calorimeter measures the heat/energy absorbed or released by the sample when it is subjectedto the specific temperature path. As chemical reactions andphysical transitions take place, there is an associated generation(exothermic reaction) or consumption (endothermic reaction)of heat. This process creates a heat flow that serves as thesignal measured by the DSC instrument.26
There are two basic types of DSCs: the heat flux DSC andthe power compensation DSC.27−29 The design and measure-ment principles differ between these two kinds of DSCinstruments. The characteristic common to both types of DSCis that the measured signal is proportional to a heat flow rate (Jg−1 s−1), Φ, which allows the time dependence of a transitionto be analyzed based on the Φ(t) curve. In addition to thesetwo standard types of DSC, we will describe the Flash DSCmethod, which can be operated at ultrafast scan rates. Finally,we will introduce the basic principles of TMDSC.
2.1. Heat Flux DSC
The heat flux DSC is a type of heat-exchanging calorimeter.30
Through a well-defined heat conduction path with giventhermal resistance, a defined exchange of the heat between asample and its surroundings can be measured. The heatexchange path can be implemented in various ways, includingthe disk-type, the turret-type, and the cylinder-type measure-ment systems. Among them, the most frequently used type isthe disk-type measurement system, where the heat exchangetakes place via a disk that serves as a solid sample support.With this system, the DSC measurement can be conductedquickly and accurately over a wide temperature range. The heatflux DSC can generally be applied in the temperature rangefrom −190 to 1600 °C depending on the instrument. TheDSC measurements can be conducted in a certain atmosphere,e.g., in nitrogen or argon to avoid oxidation of the sample, inair or oxygen to oxidize the sample.In the heat flux DSC with a disk-type measurement
system,31 the primary heat flows from the furnace to thesample crucible and reference crucible after passing symmetri-
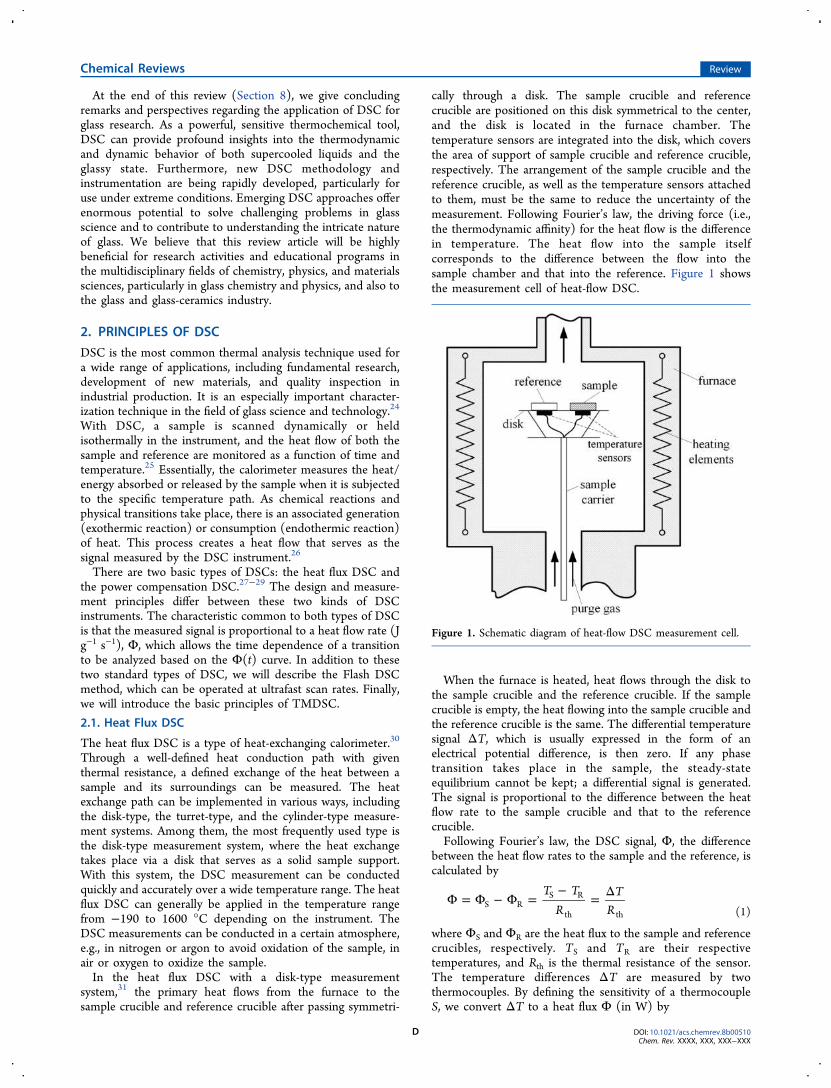
cally through a disk. The sample crucible and referencecrucible are positioned on this disk symmetrical to the center,and the disk is located in the furnace chamber. Thetemperature sensors are integrated into the disk, which coversthe area of support of sample crucible and reference crucible,respectively. The arrangement of the sample crucible and thereference crucible, as well as the temperature sensors attachedto them, must be the same to reduce the uncertainty of themeasurement. Following Fourier’s law, the driving force (i.e.,the thermodynamic affinity) for the heat flow is the differencein temperature. The heat flow into the sample itselfcorresponds to the difference between the flow into thesample chamber and that into the reference. Figure 1 showsthe measurement cell of heat-flow DSC.
When the furnace is heated, heat flows through the disk tothe sample crucible and the reference crucible. If the samplecrucible is empty, the heat flowing into the sample crucible andthe reference crucible is the same. The differential temperaturesignal ΔT, which is usually expressed in the form of anelectrical potential difference, is then zero. If any phasetransition takes place in the sample, the steady-stateequilibrium cannot be kept; a differential signal is generated.The signal is proportional to the difference between the heatflow rate to the sample crucible and that to the referencecrucible.Following Fourier’s law, the DSC signal, Φ, the difference
between the heat flow rates to the sample and the reference, iscalculated by
T TR
TRS R
S R
th thΦ = Φ − Φ =
−= Δ
(1)
where ΦS and ΦR are the heat flux to the sample and referencecrucibles, respectively. TS and TR are their respectivetemperatures, and Rth is the thermal resistance of the sensor.The temperature differences ΔT are measured by twothermocouples. By defining the sensitivity of a thermocoupleS, we convert ΔT to a heat flux Φ (in W) by
Figure 1. Schematic diagram of heat-flow DSC measurement cell.
Chemical Reviews Review
DOI: 10.1021/acs.chemrev.8b00510Chem. Rev. XXXX, XXX, XXX−XXX
D

SVT
VR S
,th
=Δ
Φ =(2)
where V is the sensor signal in the thermoelectric voltage.The caloric calibration must be done to ensure the accuracy
of the DSC measurements. The heat flow rate Φ in eq 2 is themeasured signal output by the DSC, and its relation with thetrue heat flow Φtrue consumed or produced by the sample mustbe calibrated. Caloric calibration involves the determination ofthe proportionality factor (KΦ) between the measured heatflow rate Φ and the true heat flow rate Φtrue, as well as theproportionality factor (KQ) between the measured exchangedheat, Qexch, and the true exchanged heat, Qtrue:
26
KtrueΦ = ΦΦ (3)
Q K Qtrue Q exch= (4)
The calibration of KΦ can be carried out by measuring theheat flow rate into a sample of known heat capacity Cp at aconstant scan rate q = dT/dt.32 The following relation is validfor the heat flow rate absorbed by the sample:
C qtrue pΦ = · (5)
K TC T q
T T( )
( )
( ) ( )p
S R=
Φ − ΦΦ(6)
KQ can be obtained by comparing the integral over atransition peak with the known heat of transition Qtrue:
33
Q K T t T t t( ) ( ) dtrue Q bl∫= {Φ[ ] − Φ [ ]}(7)
where Φbl is the baseline signal, i.e., the heat flow rate curvemeasured with two empty crucibles, where no physical orchemical reaction occurs. Thus, both the heat flow rate and thetransition heat can be calibrated separately.2.2. Power Compensation DSC
The power compensated DSC is a type of heat-compensatingcalorimeter.34−36 As shown in Figure 2, there are two identical
microfurnaces, which are positioned inside a thermostaticchamber. The sample crucible is placed in one microfurnace,and the reference sample is in the other microfurnace. Each ofthe furnaces contains a temperature sensor and a heatingresistor. With this setup, the sample and reference are entirelyisolated from each other, and both the sample and reference
crucibles have their heating element and temperature sensingelement.During heat-up, the same electrical power is supplied to both
microfurnaces. With the aid of separate temperaturecontrollers, the sample and reference are heated and arealways set at the same temperature. If any thermal reactiontakes place on the sample, a temperature difference betweenthe sample and reference occurs. The temperature difference isboth the measured signal and the input signal of a secondcontrol circuit. The second circuit is used to compensate forthe reaction heat flow rate of the sample, which is achieved byincreasing or decreasing an additional heating power of thesample furnace. The compensating heating power ΔP isproportional to the remaining temperature difference ΔT. Theintegral of the compensating heating power corresponds to theconsumed or released heat of the sample. The heating powercompensation enables the microfurnace containing the sampleto maintain the set temperature program and a zero-temperature difference between the sample and reference.Again, we need to convert the temperature difference ΔTmeasured by the thermocouple to the heat flow rate Φ. Theoutput signal of power compensation DSC is also given as Φ.Following the relation Φtrue = KΦ·Φ, KΦ must also bedetermined by calibration.Another type of DSC includes a combined heat flux and
power compensation measuring system. This “hybrid system”has a pair of sensor−heater combinations on a disk. Thetemperature difference between the sample and reference ismeasured by temperature sensors and compensated bycontrolling the integrated heating elements. The prerequisitefor short time constants and a negligible cross heat flowbetween the two sensor−heater elements is a good thermalcoupling between the temperature sensor and its correspond-ing heater. This type of design combines the advantages ofboth the heat flux and the pure power compensationmeasuring system. For example, it has a stable baseline, shorttime constants, high resolution, low noise, and smalltemperature differences between the environment (furnace)and measuring system.The operating modes of a DSC are normally divided into
two types, viz., constant heating rate and varying heating rate.For the former type the temperature changes linearly with timefollowing:
T t T qt( ) 0= + (8)
where T0 is the starting temperature and t is the time. Thenormal range of heating rates for a heat flux DSC could be 1 to50 K/min (in some special case, up to 150 K/min).26 In theisothermal mode, T0 is constant, and q is zero.
2.3. Flash DSC
The scanning rate of a standard DSC is not sufficiently high forsome studies, where physical and chemical processes occurmuch faster than the standard scan rate of 10 K/min. Manyphenomena such as metastability, molecular reorganization,and various kinetic phenomena are difficult to probe using astandard DSC since they are easily hindered or suppressed as aresult of the low scan rate. To solve these problems, ultrafastDSC instruments were invented by several researchgroups.37−42 Such an instrument was often called nano-calorimetry39 or Flash DSC.43 The first high-speed calorimetrywas developed by Pijpers et al.37 The HyperDSC has beencommercialized by PerkinElmer, which offers scan rates up to
Figure 2. Schematic diagram of a power compensated DSCmeasurement cell.
Chemical Reviews Review
DOI: 10.1021/acs.chemrev.8b00510Chem. Rev. XXXX, XXX, XXX−XXX
E
750 K/min.37 The advantage of the HyperDSC is that it canmimic temperature−time ramps that occur for the coolingrates used in realistic processing. Moreover, the increasedsensitivity enables measurement of the signals with low heatflow rates for subtle transitions and small material mass. Afurther advance is the development of extremely fast-operatingchip-based calorimeters, as described in refs 38 and 39. Somepolymer liquids can be already vitrified by using Standard DSCand HyperDSC at a specific cooling rate.40,41 However, otherpolymer liquids can be vitrified only by a chip-based fastscanning calorimeter, since it can provide much higher scanrates. In special cases, a chip-based ultrafast scanningcalorimeter42 is required to vitrify the extremely fastcrystallizing glass-forming liquids.To meet the need for fundamental research and industrial
applications, the Mettler-Toledo Flash DSC 1 has beencommercially developed.43 The power compensation twin-type, chip-based fast scanning calorimeter (FSC) can beoperated in a substantially broadened scan range, i.e., from verylow scan rates to ultrahigh cooling and heating rates. The scanrates can reach 50,000 K/s in heating and 40,000 K/s incooling. Thus, Flash DSC combined with the conventionalDSC can cover more than 7 orders of magnitude of scan rates.The accuracy and reliability of the Flash DSC 1, e.g.,concerning calibration, symmetry, repeatability, and scan ratecontrol windows of operation, have been proven by variousstudies.44,45 It should be mentioned that the temperaturewindow for the Mettler-Toledo Flash DSC 1 is from −95 to420 °C, suitable for research on most organic glasses and somemetallic glasses. With the newly developed Mettler-ToledoFlash DSC 2+, the temperature window has been extended to arange from −95 to 1000 °C, which significantly widens thesystems that can be studied concerning crystallization andmelting. It is not currently possible to make an oxide glasssample ultrathin and tightly adhered to the chip of Flash DSCto get the correct signals of the enthalpy response to theultrafast scans. However, it has been possible to achieve asubmicron thick sample by blowing glass bubbles for softextended X-ray absorption fine structure (EXAFS experi-ments).46 This thin glass sample could be placed onto thesurface of the sensor (i.e., sample holder) and then slightlymelted to get a good contact to the sensor, so that accuratesignals of the sample could be captured by the Flash DSC.Flash DSC 1 applies a calorimeter chip with a twin sensor
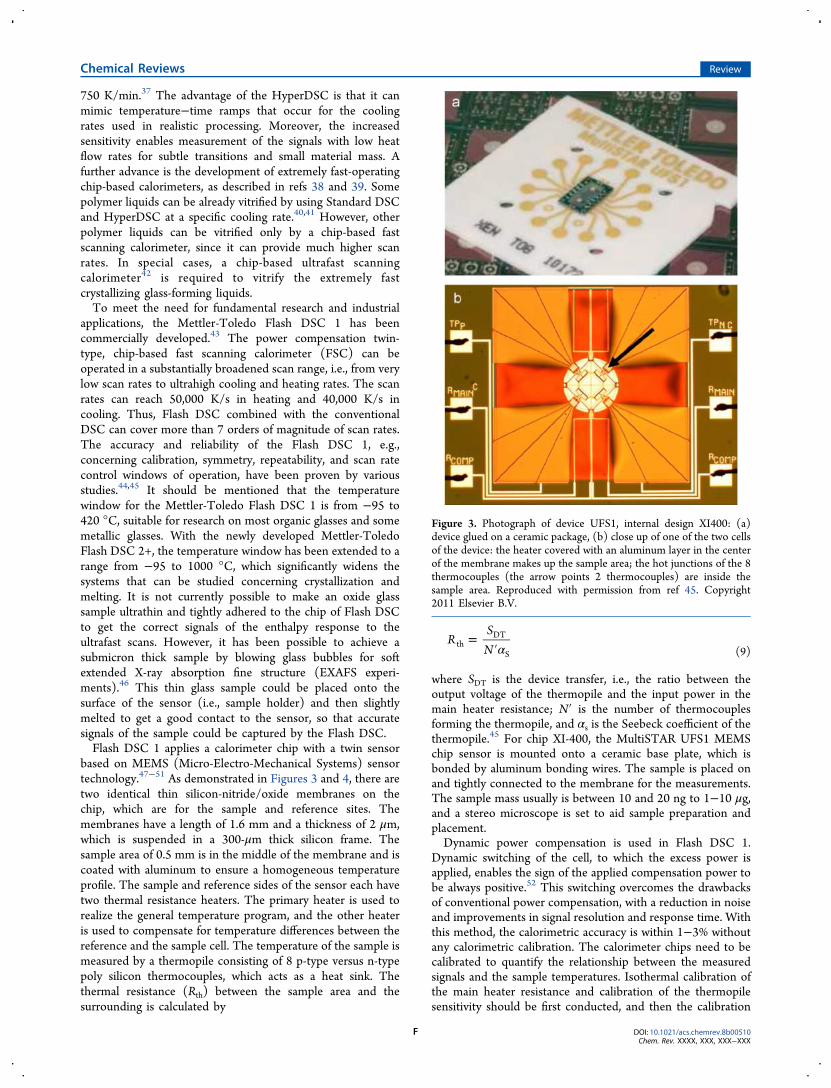
based on MEMS (Micro-Electro-Mechanical Systems) sensortechnology.47−51 As demonstrated in Figures 3 and 4, there aretwo identical thin silicon-nitride/oxide membranes on thechip, which are for the sample and reference sites. Themembranes have a length of 1.6 mm and a thickness of 2 μm,which is suspended in a 300-μm thick silicon frame. Thesample area of 0.5 mm is in the middle of the membrane and iscoated with aluminum to ensure a homogeneous temperatureprofile. The sample and reference sides of the sensor each havetwo thermal resistance heaters. The primary heater is used torealize the general temperature program, and the other heateris used to compensate for temperature differences between thereference and the sample cell. The temperature of the sample ismeasured by a thermopile consisting of 8 p-type versus n-typepoly silicon thermocouples, which acts as a heat sink. Thethermal resistance (Rth) between the sample area and thesurrounding is calculated by
RSNth
DT
Sα=
′ (9)
where SDT is the device transfer, i.e., the ratio between theoutput voltage of the thermopile and the input power in themain heater resistance; N′ is the number of thermocouplesforming the thermopile, and αs is the Seebeck coefficient of thethermopile.45 For chip XI-400, the MultiSTAR UFS1 MEMSchip sensor is mounted onto a ceramic base plate, which isbonded by aluminum bonding wires. The sample is placed onand tightly connected to the membrane for the measurements.The sample mass usually is between 10 and 20 ng to 1−10 μg,and a stereo microscope is set to aid sample preparation andplacement.Dynamic power compensation is used in Flash DSC 1.
Dynamic switching of the cell, to which the excess power isapplied, enables the sign of the applied compensation power tobe always positive.52 This switching overcomes the drawbacksof conventional power compensation, with a reduction in noiseand improvements in signal resolution and response time. Withthis method, the calorimetric accuracy is within 1−3% withoutany calorimetric calibration. The calorimeter chips need to becalibrated to quantify the relationship between the measuredsignals and the sample temperatures. Isothermal calibration ofthe main heater resistance and calibration of the thermopilesensitivity should be first conducted, and then the calibration
Figure 3. Photograph of device UFS1, internal design XI400: (a)device glued on a ceramic package, (b) close up of one of the two cellsof the device: the heater covered with an aluminum layer in the centerof the membrane makes up the sample area; the hot junctions of the 8thermocouples (the arrow points 2 thermocouples) are inside thesample area. Reproduced with permission from ref 45. Copyright2011 Elsevier B.V.
Chemical Reviews Review
DOI: 10.1021/acs.chemrev.8b00510Chem. Rev. XXXX, XXX, XXX−XXX
F

accuracy is determined. A maximum temperature error of ±5 Kis typically found for Flash DSC 1. In a first orderapproximation, the sample mass (mS) is inversely proportionalto scan rate (q) as described below:53
mC CF
q( )
s = | || | (10)
where C(|CF|) is the proportionality as a function CF, thecorrection factor. |CF| should not be too high, to avoid high-temperature corrections, large thermal lags, and poorresolutions. Furthermore, sample masses and scan rates cannotbe too low, to ensure detectable heat flow rate signals.2.4. Temperature-Modulated DSC
DSC signals include a convolution of overlapping dynamicprocesses over the glass transition range. Peculiar features ofsupercooled glass-forming liquids such as dynamic hetero-geneities lead to the complex nature of the temperaturedependence of the heat capacity as a function of thermalhistory. However, the kinetic and thermodynamic contribu-tions to the heat capacity cannot be deconvoluted using aconventional DSC with the standard linear heating rate.TMDSC was developed to overcome the limitations ofstandard DSC techniques.54,55 In 1971, i.e., two decadesbefore the commercialization of TMDSC, Gobrecht et al.introduced the principles of frequency dependent calorimetricmeasurements.56 Birge and Nagel57 subsequently demonstra-ted heat capacity spectroscopy, where the heat capacity ismeasured as a function of modulation frequency andtemperature. Heat capacity is measured by applying a smallsinusoidal temperature oscillation while the sample is heldisothermally. The main idea is to use small perturbations awayfrom equilibrium while linearity is preserved. This methodprovided further evidence for the definition of the glasstransition as a breaking of the ergodicity58,59 in a continuousfashion. Even though the mean temperature is constant withtime, a glass transition occurs since the observation timechanges inversely with the oscillation frequency. Therefore, theglass transition can be observed in any condition when theDeborah number60 reaches unity. Following the developmentof frequency dependent measurements, Reading et al.introduced the first commercially available TMDSC, which
involves a single frequency oscillation superimposed on astandard linear DSC heating rate.54,61 The temperature profileof TMDSC can be shown as
T t T qt A t( ) sin( )0 t ω= + + (11)
where At and ω are the amplitude and the angular frequency ofthe sinusoidal oscillation, respectively. Differentiating eq 11leads to the modulated heating rate
Tt
q A tcos( )tω ω∂∂
= +(12)
The system response can be defined in terms of a sinusoidalheat flow, as depicted in Figure 5. In a linearly respondingmaterial, the kinetic response is fast compared to themodulation period; that is, the two modulated functions are
Figure 4. Schematic cross section (not to scale) of the UFS1 ceramic on the chip. Reproduced with permission from ref 44. Copyright 2011Elsevier B.V.
Figure 5. Modulated heating rate, Tt−1 (the top black curve), and theresponse function as modulated heat flow, Qa (the bottom blackcurve), are superimposed on the temporal averages of the linear DSCheating rate (the top red curve) and linear DSC heat flow (thebottom red curve). Reproduced with permission from ref 62.Copyright 2013 AIP Publishing LLC.
Chemical Reviews Review
DOI: 10.1021/acs.chemrev.8b00510Chem. Rev. XXXX, XXX, XXX−XXX
G

in phase. In other words, they are two points moving in thecomplex plane with a constant angle. When a kinetic eventoccurs, which is on a time scale comparable to or slower thanthe modulation period, the phase angle between the twofunctions varies with the rate of the dynamic process. Forinstance, heat is transferred by atomic vibrations in the glass.The typical time scales of those vibrations are much shorterthan the standard TMDSC oscillation periods. Therefore, theinput (modulated heating rate) and output (modulated heatflow) functions are still in phase, and the phase angle isconstant. In the supercooled liquid region, the heat capacityinvolves both vibrational and configurational contributions,and molecular motions dominate the heat flow process. Theaverage molecular rearrangement time scale is again muchshorter than the modulation period, and therefore the inputand output functions are in phase. However, when thesupercooled liquid approaches the glass transition regionupon quenching, the structural relaxation times will drasticallyincrease to a time scale similar to the modulation period ofoscillation in the glass transition range. Hence, the phase anglebetween the two functions continuously changes in the vicinityof the glass transition.62
The phase angle can be linearly scaled with the distributionof relaxation times to investigate the dynamic processes andrelaxation kinetics in glasses. The temperature sweep over theglass transition range represents the response of dynamicdomains for a given observation time (or frequency) since theTMDSC technique relies on a single constant frequency.However, the same modulation can be repeated over a range offrequencies63 to probe the frequency dependence of the heatflow (or enthalpy response) of the entire system or localdomains. Stochastic methods have also been proposed64 toinvestigate the frequency dependence of the enthalpy responseby utilizing pulses controlled by a random number generator. Amore detailed review of the interpretation of the TMDSCsignals and their applications is provided in Section 6.
3. CLARIFYING GLASS TRANSITION VIA DSC
3.1. General Aspects of Glass Transition
Is glass a solid or liquid? This deceptively “simple” question isone of the longstanding mysteries of glass science and involvescomplex scientific consideration. Glasses appear solid on atypical human time scale, e.g., exhibiting elasticity andfracturing. This type of solid lacks LRO, in contrast to theircrystalline counterparts. Also, they spontaneously relax andflow toward the supercooled liquid (SCL) state, even at lowtemperatures over a long time scale; such viscous flow is aliquid-state property. Also, the atomic structure of glass isnoncrystalline and continuously connected to that of its parentSCL. In the limit of infinitely long time or given sufficientlylong thermal treatments, glass will ultimately crystallize (i.e.,become a thermodynamically stable solid). Given thiscombination of solid-like and liquid-like properties, glass canbe considered as a special hybrid state of matter, where thesolid-like properties are evident when probing its mechanicalresponse on short time scale, but its noncrystalline structure,spontaneous relaxation, flow, and crystallization behavior makeit more akin to a nonequilibrium “frozen” liquid.65 Despitethese similarities to the liquid and solid states, glasses also haveunique properties that are determined by their nonequilibriumand nonergodic (frozen) nature. Based on these consider-ations, a new definition of glass has recently been proposed by
Zanotto and Mauro: “Glass is a nonequilibrium, non-crystalline state of matter that appears solid on a short timescale but continuously relaxes towards the liquid state.”65
According to this definition, glass is a unique state of matterthat combines features of both liquids and solids and alsoexhibits its unique characteristics. In addition to this shortdefinition for a general audience, a more detailed scientificdefinition was proposed: “Glass is a nonequilibrium, non-crystalline condensed state of matter that exhibits a glasstransition. The structure of glasses is similar to that of theirparent SCL, and they spontaneously relax toward the SCLstate. Their ultimate fate, in the limit of infinite time, is tocrystallize”.65
Glass has also been defined in other ways, e.g., “Any materialthat exhibits glass transition behaviour is a glass”;66 “Glass is asolid having a non-crystalline structure, which continuouslyconverts to a liquid upon heating”;67,68 and “Glasses aredisordered materials that lack the periodicity of crystals butbehave mechanically like solids.”3 Regardless of the definition,all glasses share two common characteristics. First is thatglasses lack long range, periodic atomic ordering; second is thatglasses exhibit time-dependent glass transformation behavior ina certain temperature range, which is termed the glasstransition range. The latter is the most important characteristicfeature of glass. Any non-crystalline, nonequilibrium materialthat exhibits glass transition behavior is defined as a glass.66
“The deepest and most interesting unsolved problem in solidstate theory is probably the theory of the nature of glass andthe glass transition,” as stated by Nobel Prize winner P. W.Anderson in 1995.69 Despite substantial progress in under-standing the glass transition, it remains one of the mostchallenging problems in condensed matter physics. The glasstransition itself is the single key physical phenomenon definingthe glassy state, which is of great scientific and technologicalimportance.Glass transition behavior is commonly described regarding
enthalpy (or volume) versus temperature diagrams, as shownin Figure 6. When the temperature is above the melting point(Tm) for a pure system or liquidus temperature (TL) for amulticomponent system, the liquid is in thermodynamicequilibrium. For any given composition, the liquidus temper-ature is the highest temperature of thermodynamic equilibriumbetween the solid and liquid phases, above which the crystalsare unstable and dissolve in the liquid phase. TL equals Tm forcongruently melting compounds. The determination of TL isdescribed in Section 7.7. If the liquid is cooled down to Tm at acritical cooling rate (Section 7.5), it will start to undergo a first-order thermodynamic phase transition, namely, crystallization,leading to a discontinuous loss of enthalpy. However, for mostglass-forming liquids, the crystallization is not the first-orderthermodynamic phase transition under normal conditions(e.g., at a cooling rate above the critical rate) since it occurs inthe supercooled region below Tm. Subsequent to crystalliza-tion, cooling will then follow the equilibrium path of thecrystal. However, if the liquid is cooled quickly enough toavoid crystallization, a SCL is obtained. The structure of theliquid rearranges quickly to attain this metastable equilibriumstate as the temperature decreases. Upon continued cooling,the relaxation time of the SCL increases at least exponentially,and the system eventually becomes frozen as the relaxationtime exceeds the laboratory (observation) time. When thishappens, the atoms have insufficient time to rearrangethemselves to the metastable equilibrium state; that is, the
Chemical Reviews Review
DOI: 10.1021/acs.chemrev.8b00510Chem. Rev. XXXX, XXX, XXX−XXX
H

structural rearrangement is kinetically arrested. As a result, theenthalpy deviates from the SCL line and follows that of theconfigurationally frozen system. This freezing of the systemoccurs continuously and results in a nonequilibrium materialknown as a “glass”. Since the glass transition is a kineticfreezing process, the final enthalpy of glass depends on thecooling rate. When the cooling rate is high, the system has lesstime to relax into a lower energy structure, which leads togreater enthalpy in the final glass. This phenomenon isexpressed in Figure 6, where it is seen that Glass 2 (e.g.,fiberglass) has higher enthalpy or volume than Glass 1 (e.g.,bulk glass), since the former is cooled more quickly than thelatter. The temperature range between the equilibrium liquidand the frozen solid is defined as the “glass transition” range.67
The temperature at the intercept between the two linesextrapolated from glassy and liquid enthalpies is the character-istic value of the glass transition, which is termed the glasstransition temperature or fictive temperature (Tf). Due to itshigher cooling rate, Glass 2 has a higher Tf value (Tf2), whereasGlass 1 has a lower value (Tf1). The Tf can be determined by aDSC as described in Section 3.4. Among the Tf values, there isa standard value called the standard calorimetric glasstransition temperature (Tg), which is measured using a DSCat the heating rate of 10 K/min equal to the prior cooling rate(Section 3.4). Tg depends on composition, thermal history,and mechanical history. Whereas the crystallization of a liquidresults in a discontinuity in extensive thermodynamic variables(e.g., volume and enthalpy), the glass transition is not athermodynamic phase transition. A thermodynamic conse-quence of this kinetic transition is that configurational degreesof freedom in the glass are frozen, leading to a sharp loss insecond-order thermodynamic properties such as heat capacityand thermal expansion coefficient.70
The glass transition is intimately connected to the notion ofergodicity. Ergodicity denotes a system where the time andensemble averages of properties are equivalent and implies thatthe system explores a sufficient fraction of its configurational
phase space to reach this equivalence.59,71,72 However, asystem that is initially ergodic can become nonergodic, i.e., ifsufficient configurational degrees of freedom are lost.73,74 Thisbreakdown of ergodicity can occur either discontinuously orcontinuously, depending upon the details of the system.Whether or not a system is ergodic is a question of time scale.There are two relevant time scales involved when anexperiment is taking place. One is the internal time scale(τint) on which the dynamics of the system occur, which isessentially a relaxation time over which a system loses“memory” of its preceding states. The other is the externaltime scale (τext) on which properties are measured, whichdefines a measurement window over which the system isobserved. The Deborah number60 of an experiment is definedas the ratio of internal to external time scales,
D int
ext
ττ
=(13)
A large Deborah number (D ≫ 1, τint ≫ τext) indicates thatthe system visits only a small subset of the available points inphase space during the external (i.e., observation) time scale.Hence, a system with a large Deborah number is nonergodic.On the contrary, a very small Deborah number (D ≫ 1, τint ≫τext) means that the system can explore a greater portion ofphase space during the observation time, which leads to anergodic system. Therefore, both the internal relaxation time ofa system and the external observation time determine theergodicity of the system.Palmer58 introduced the notion of “broken ergodicity,” in
which glass can be described as an ensemble of components ofthe phase space, where each component exhibits internalergodicity, but transitions between components are notallowed. This breakdown of ergodicity occurs where theDeborah number of the system is near unity, i.e., D ≈ 1. Thisbreakdown is the most fundamental definition of the glasstransition, i.e., where the internal relaxation time of a glass-forming system is equal to an external observation time scale(tobs = τsystem).
67 The transition between ergodic andnonergodic states, where D ≈ 1 corresponds directly to theglass transition. For any realistic system, the loss of ergodicityis a gradual process; that is, the glass transition involves acontinuous breakdown of ergodicity. Thus, the glass transitionis fundamentally a process in which an equilibrium, ergodicliquid is gradually frozen into a nonequilibrium, nonergodicglassy state.75 The glassy state can be observed only when therelaxation time scale of the system becomes much longer thanthe observation time scale; that is, the glass transition onlytakes place when a finite observation time is defined.Given the above definition, what is a typical experimental
observation time scale? The glass transition is defined asoccurring at the temperature at which the relaxation time forthe structural relaxation process reaches some criticalvalue,67,76−80 often taken as 100 s. The glass transition occursover a range of temperatures, but it is convenient to define asingle temperature as an indication of the onset of the glasstransition range for a glass. This temperature is termed theglass transition temperature (Tg).
66,67 In most cases, Tg isdetermined from DSC measurements.70,81,82 The calorimetricglass transition is characterized by “the change in heat capacitywhich occurs as the state of equilibrium is reestablished duringwarming after an initial cooling into the glassy state at a ratesufficiently high that no crystals have formed”.83 During theDSC upscan, the heat capacity of a glass increases rather
Figure 6. Schematic representation of the decrease in enthalpy/volume of an ideal one-component glass-forming liquid upon cooling.SCL: Supercooled liquid; Glass 1: transformed from SCL at a lowercooling rate, and hence, at a lower fictive temperature (Tf1); Glass 2:transformed at a higher fictive temperature (Tf2). Crystal: transformedfrom the liquid at the melting point (Tm) at a sufficiently low coolingrate (i.e., a critical cooling rate). The SCL−glass transition is a kineticprocess, whereas the liquid-crystal transition is a thermodynamic one,i.e., a first-order transition.
Chemical Reviews Review
DOI: 10.1021/acs.chemrev.8b00510Chem. Rev. XXXX, XXX, XXX−XXX
I

abruptly as the solid converts to the liquid, which is theenthalpy signal of the glass transition. The Tg of different glasssystems can vary from below 50 K to above 1500 K.83−89
Another important concept is the Maxwell relation thatconnects the relaxation time with the shear viscosity;90 thestress relaxation time τ is expressed in terms of viscosity andG∞,
TT
G T( )
( )( )
τ η=∞ (14)
G∞ is the shear modulus measured at high frequency, whichchanges little with temperature, while both τ and η varydramatically with temperature. The viscosity and stressrelaxation time are roughly proportional since the temperaturedependence of G∞ is small. Building on the above definitionand considering a typical shear modulus (in Maxwell’sequation), Angell proposed an alternative definition of Tg asthe temperature at which the viscosity of the supercooledliquid is equal to 1012 Pa s.77 This definition was confirmed formany glass-forming systems.81,91 At first sight, the definition isespecially intriguing because it is defined for equilibrium; thatis, it is a property of the supercooled liquid and does notdepend on the cooling rate of the system. This is in contrast tothe preceding definitions above, in which in the Tg is defined asa property of the nonequilibrium glassy state. However, thisdefinition only holds for Tg measured at the normal heatingrates of 5−20 K/min. If, instead, much lower or higher heatingrates are used, the viscosity at Tg is not 1012 Pa s. UsingAngell’s definition, there is a single Tg value defined for eachcomposition, which is not cooling rate dependent as it assumesa typical experimental relaxation time scale of 100 s.To understand the nature of the glass transition, various
theoretical models have been proposed, e.g., configurationalentropy model,92 free volume theory,93 potential energylandscape,94 mode-coupling theory,95 frustration-based mod-els,96 the shoving model,97 elastic model,98 liquid fragilitytheory,1 and temperature-dependent constraint theory.99 Onthe one hand, these models have been applied in describingsome aspects of the glass transition in different glass-formingsystems from different perspectives. On the other hand, weshould admit that a unified theory of glass transition has notbeen established.Beyond these theoretical approaches, various experimental
approaches have been developed to characterize and explainthe glass transition. One of the most effective approaches isDSC, which is probably the most sensitive to the energyfluctuation during glass transition and relaxation among all thecharacterization approaches. The glass transition traced byDSC is termed the calorimetric glass transition, which is thefocus of this section. It should be noted that to obtain acomprehensive understanding of the glass transition, DSCmust be used in combination with other characterizationtechniques, such as dielectric spectroscopy, microscopicimaging, vibrational dynamics, and structural analysis. One ofthe main challenges in clarifying the origin of the calorimetricglass transition is the measurement of structural evolutionduring the glass transition and relaxation processes. Never-theless, we recognize that important advances have, in recentyears, been made in understanding the calorimetric glasstransition. In the following section, we review these recentadvances.
3.2. Calorimetric Glass Transition
3.2.1. Key Features and Parameters. The features andkey parameters of the calorimetric glass transition areillustrated in Figure 7, where the changes of the isobaric heat
capacity (Cp) with temperature are recorded for both thecalcium metaphosphate glass during the DSC upscan (heating)and its corresponding liquid during the subsequent downscan(cooling) at the standard rate of 10 K/min.81 Prior to this cycleof the DSC up and downscanning, the as-produced sample hasundergone the first cycle of the DSC up and downscanning at10 K/min. The onset of the glass transition during heating isdefined as the standard glass transition temperature (Tg). Thestandard Tg value is determined as the crossing pointtemperature of the extrapolated Cpg line and the extrapolatedline of the rapidly rising Cp line. This Tg value is equal to thetemperature (Tg,infl) corresponding to the inflection point ofthe Cp drop line during cooling (see the blue filled circle inFigure 7). This standard Tg value is in coincidence with thatdetermined by the enthalpy-matching method.81,82,100 Theglass-to-liquid transition during heating is manifested byΔCp(Tg), i.e., the Cp jump from glass Cp at Tg (denoted Cpg)to liquid Cp at the ending temperature of glass-to-liquidtransition (Tg,end) (denoted Cpl).The width of the glass transition, ΔTg, is the difference
between Tg,end and Tg, where Tg,end is the offset of the glasstransition, which is determined as the temperature of theintercept between the rapidly dropping line and the Cpl line(Figure 7). ΔTg is inversely proportional to the liquid fragilityquantified by the index m = d log10 η/d(Tg/T)T = Tg (Section3.6).101 Figure 7 also shows that a Cp overshoot also occurs inthe glass transition region during heating. The overshootreflects the recovery of the enthalpy lost during annealing orcooling to that corresponding to the standard heating rate of10 K/min.100,102 The origin of this difference is that on the firstupscan the glass starts in a much deeper minimum of thepotential enthalpy surface75 due to its higher degree of
Figure 7. Temperature (T) dependences of the isobaric heat capacity(Cp) for calcium metaphosphate glass (CaP2O6), which weredetermined using DSC during the second heating−cooling cycle(rate: 10 K/min). The first scanning circle is not shown and its up anddownscan rates were 10 K/min. The cooling rate of the as-producedglass sample was unknown. The glass−liquid transition during upscanis featured by the Cp jump, ΔCp(Tg), whereas the liquid−glasstransition is reflected by the Cp drop. The onset temperature of theglass−liquid transition, i.e., the intercept between the extrapolatedglass Cp line and the line with the maximum tangent of the Cp risingcurve, is defined as the standard glass transition temperature Tg.Reproduced with permission from ref 81. Copyright 2007 ElsevierB.V.
Chemical Reviews Review
DOI: 10.1021/acs.chemrev.8b00510Chem. Rev. XXXX, XXX, XXX−XXX
J

annealing compared to the glass that is subjected to the secondupscan. Theoretically, the enhancement of this overshoot is thedirect consequence of the nonexponentiality and nonlinearityof the glass relaxation process.103 The extent of the overshootincreases with a decrease of the prior cooling rate and withextending the prior annealing time around Tg.
104
According to Angell,77 for a typical heating rate of 5−20 K/min, Tg can be linked to the liquid viscosity of 1012 Pa s. Thislink was confirmed for oxide systems by Yue,81,105 where theTg was measured at the DSC upscan rate of 10 K/min, equal tothe prior downscan rate. This Tg is defined as the standardcalorimetric Tg as introduced in the next paragraph. Tg can alsobe measured by thermal expansion or relaxation timemeasurements.66,67 The value of Tg for the same glasscomposition could be slightly different using various measure-ment methods, even at the same heating rate. It is known thatTg and Tf are dynamic characteristic values since each shifts tohigher temperature with increasing heating rate or coolingrate.100 In order to compare the dynamics and physicalproperties of different glass systems, a standard, unifiedapproach for measuring Tg needs to be defined.Yue compared the calorimetric glass transition temperature
(Tg,DSC) directly measured by DSC at 10 K/min with the Tg,visindirectly determined at the viscosity of η = 1012 Pa s (Figure8).81,105 Tg,DSC is defined as the onset temperature of thecalorimetric glass transition peak (Figure 7). As mentionedabove, the Cp curve is measured at the standard upscan rate of10 K/min (equal to the first downscan rate) during the secondupscan. As shown in the inset of Figure 8, the two Tg valuesremarkably coincide for oxide glasses.81,105 The agreementbetween Tg,vis and Tg,DSC measured can be used for assigningthe standard Tg. This allows a direct comparison of the glasstransition temperatures among different glass systems. In thisarticle, Tg refers to the standard value unless otherwisespecified.3.2.2. Structure−Thermodynamics Relation. The con-
nection between thermodynamic change and microstructuralevolution during the glass−liquid transition is a longstandingproblem. Much progress has already been made in under-standing this problem.106,107 In this section, we review somerecent findings concerning the link between the configurationalheat capacity at Tg (Cp,conf(Tg)) and the structure of glasses,which has been found by combining the DSC technique withRaman spectroscopy. Before doing so, we first explain thephysical meaning of Cp,conf.As is known, Cp is the sum of vibrational and configurational
contributions arising from intrabasin and interbasin transitions,respectively; that is, Cp = Cp,vib + Cp,conf.
59,108 In the glassy state,the configuration space is partitioned into a set of metabasinswith slow transitions between these metabasins due to the highactivation barriers. The glassy state thus primarily containsvibrational degrees of freedom.109 As it is heated through theglass transition region, the interbasin transitions begin to occurmore frequently, and the supercooled liquid state thus containsboth vibrational and configurational degrees of freedom inliquid state; that is, Cpl = Cp,vib + Cp,conf.
110−113 The vibrationalcomponent of Cp would change to a much lower extentthrough glass−liquid transition region compared to theconfigurational component, and hence, Cpg can be approx-imately regarded as the Cp,vib component of Cpl, leading to therelation Cp,conf ≈ Cpl − Cpg = ΔCp. This suggests that Cp,confmay be indirectly obtained by measuring ΔCp as a function oftemperature through DSC. Thus, Cp,conf is determined through
the relation ΔCp = Cpl − Cpg, where Cpl is accessible throughDSC, and Cpg is obtained by extrapolating the Cpg curve to anyT above Tg through a power law or a linear function (Section3.4.1).5,92,105 However, it should be stressed that ΔCp deviatesfrom Cp,conf.
112,113 In the present article, ΔCp(Tg) andCp,conf(Tg) refer to the Cp jump through the glass transitionregion from Tg to Tg,end (Figure 7), whereas ΔCp and Cp,confrepresent the difference between Cpl and Cpg as a function oftemperature in the entire liquid region that a DSC can access(Section 3.4.1).As a supercooled liquid is quenched through the glass
transition region, the structural degrees of freedom decrease,leading to a loss of the configurational entropy, i.e., to a drasticdecrease of Cp,conf(Tg). In a series of glasses, Cp,conf(Tg) varieswith the composition.114 However, the structure of a glass isnot sensitive enough to the dynamic slowing-down during theglass transition, so it is difficult to reveal the structural origin ofthe temperature dependence of Cp,conf(Tg) during the glasstransition. However, it is possible to detect the structuredependence of Cp,conf(Tg) for a glass series with distinctstructural difference and thereby to find the structural sourceof the change of Cp,conf(Tg) with composition. An example fordoing this is given in Figure 9, where we can see thecomposition dependences of both Cp,conf(Tg) and Tg, and the
Figure 8. Correspondence between the temperature of the character-istic viscosity of 1012 Pa s and the calorimetric glass transitiontemperature (Tg) for calcium metaphosphate Ca(PO3)2. (a) Thelogarithm of the viscosity (log η) as a function of temperature. Thesolid curve was obtained by fitting the experimental data to theMauro-Yue-Ellison-Gupta-Allan (MYEGA) equation (eq 32 inSection 3.7).99 (b) The heat capacity (Cp) as a function oftemperature. The solid red curve is the Cp curve recorded duringthe second upscan, whereas the dashed blue curve represents thesecond downscan Cp curve. Inset: Comparison between the glasstransition temperatures measured by DSC at 10 K/min, Tg,DSC, andthose obtained from the fit of viscosity data to the MYEGAequation99 (Tg,vis) for oxide glasses. Reproduced with permission fromrefs 81, 91, and 105. Copyrights 2007, 2009, 2016 Elsevier B.V.
Chemical Reviews Review
DOI: 10.1021/acs.chemrev.8b00510Chem. Rev. XXXX, XXX, XXX−XXX
K

connection between the Cp,conf(Tg) and IRO structure for theborosilicate glass series 15Na2O-10CaO-75qrB2O3-(75(1-qr))-SiO2 (mol%), where qr = B2O3/(B2O3 + SiO2). This glassseries was chosen because it displays abundant structuralfeatures on both short and intermediate-range scales.Figure 9a illustrates the evolution of Tg and Cp,conf(Tg) with
the substitution of B2O3 for SiO2. Tg exhibits a nonmonotonicvariation with composition. Specifically, initial addition ofB2O3 leads to an increase of Tg from 830 to 855 K, whilefurther increase in B2O3 results in a monotonic decrease of Tgto 777 K. It was reported that this nonmonotonic variation ofTg is mainly caused by the change of temperature dependentconstraints and the short-range order structural evolution ofboron.108
For Cp,conf(Tg), in borate glasses, many researchers foundthat the boron speciation (i.e., 3- and 4-fold coordinated boronspecies) makes a significant contribution to the compositiondependence of Cp,conf(Tg) by using the Van’t Hoffequation.115−117 However, the boron speciation can accountfor only a minor change of Cp,conf(Tg) in borate-silicate mixedglasses.118,119 As shown in Figure 9a, Cp,conf(Tg) exhibits apronounced nonlinear increase with the substitution of B2O3for SiO2. Recently, it has been found that the intermediaterange order (IRO) superstructures govern the major change ofCp,conf(Tg) with the composition in the abovementionedsystem.11
The inset of Figure 9b shows Raman spectra of 15Na2O-10CaO-75qrB2O3-(75(1 − qr))SiO2 (mol%) glasses. Bydeconvoluting Raman spectra, various vibration modes ofIRO superstructures are identified. As qr initially increases, theB-O-Si network forms instead of boroxol rings, due to a lack ofredundant B3. Upon a further increase in the B2O3 content inthe composition range of 0.32 < qr < 0.84, various IROsuperstructures occur, i.e., ring- and chain-type metaborate, six-membered borate rings with 1 and 2 B4, and boroxol rings. Thetwo latter IRO superstructures become dominant with thefurther addition of B2O3.
11
Based on the composition dependence of Cp,conf(Tg) andthat of IRO, the relation between IRO superstructures andCp,conf has been established (Figure 9b). Specifically, in the low-B2O3 glasses, the formation of B-O-Si network units and six-membered borate rings with B4 (4-fold coordinated boronspecies) has a major contribution to the increase of Cp,conf(Tg).As B2O3/SiO2 ratio increases, the competition amongdisruption of metaborate groups and formation of otherborate superstructures causes Cp,conf(Tg) to be approximatelyunchanged. In the high-B2O3 glasses, the six-membered boraterings with B4 and boroxol rings become dominant, leading to afurther increase of Cp,conf(Tg). The relation between IRO andCp,conf(Tg) reflects a close connection between the glassstructure and the thermodynamic properties through theglass transition region, which is critical for understanding thenature of the glass transition.11
3.2.3. Topological Effect. Tg is mostly governed by thenetwork connectivity and average bond strength for networkglasses, and different glass systems possess different Tgvalues.10,120−125 Within the same compositional family, thevariation of Tg can be quantitatively determined by thevariation in glass structure, which is a function of composition.Due to the nonequilibrium, noncrystalline nature of glass, ithas been difficult to predict the composition dependence of Tg.While conventional atomistic modeling techniques, such asmolecular dynamics, are limited by short time steps,126,127
meta dynamic techniques have been developed to accesslonger time scales. Topological constraint theory has beenproven to be an especially useful tool to predict thecomposition dependence of glass properties, as well as toprovide insight into its structural and topological ori-gins.128−131 To reveal the nature of the calorimetric glasstransition, temperature-dependent constraint theory has beensuccessfully applied to predict the Tg values of numerous oxideglass formers. Here we briefly introduce this theory andcompare the theory-predicted Tg values with those measuredby DSC and thereby provide insights into the calorimetric glasstransition.Phillips and Thorpe132,133 originally proposed treating glass
as a network of bond constraints. Each atom in the glassnetwork has three translational degrees of freedom, which canbe removed by the presence of rigid bond constraints.According to their theory, the glass-forming ability isdetermined by comparing the number of atomic degrees offreedom with the number of constraints. While the originaltheory is formulated for zero temperature, Mauro and Guptahave incorporated the effect of temperature into the theory likethe so-called “temperature-dependent constraint” theory. Theglass properties are then quantitatively related to the numberof constraints, and this enables calculation of the compositiondependent on glass properties.
Figure 9. (a) Compositional dependence of both the configurationalheat capacity Cp,conf(Tg) and Tg for the borosilicate glass series withthe composition (mol %) (75qr)B2O3−(75(1 − qr))SiO2-15Na2O-10CaO, where qr = B2O3/(B2O3 + SiO2). b) Intermediate-range order(IRO) structure dependence of Cp,conf(Tg). The increase of the IROstructural units is indirectly expressed as that of the total area of IRObands. Inset: Raman spectra, where the curves are shifted vertically forcomparison. The colored stripes show the main bands originatingfrom the vibration modes of different structural units. The total areaof the IRO bands (see green stripe) is the algebraic sum of the area ofeach deconvoluted IRO band. Reproduced with permission from ref11. Copyright 2016 the PCCP Owner Societies.
Chemical Reviews Review
DOI: 10.1021/acs.chemrev.8b00510Chem. Rev. XXXX, XXX, XXX−XXX
L

Based on the Adam−Gibbs theory,92 the compositiondependence of Tg is related to variations in the configurationalentropy of a system. The Adam−Gibbs model considers thatviscous flow is governed by cooperatively rearranging regions,and the size of these regions dictates the configurationalentropy of the system. The size of the cooperativelyrearranging regions is proposed to increase as the temperatureof the system is lowered, requiring a greater number of atomsto flow together as thermal energy is removed from the system.According to the Adam−Gibbs model, a larger size of thecooperatively rearranging regions corresponds to a lowerconfigurational entropy, since the total number of possibleconfigurations decreases with decreasing temperature. Morerecent work by Naumis134 linking energy landscapes withtopological constraint theory has shown that the configura-tional entropy of a system is, in fact, largely proportional to theatomic degrees of freedom, f(x), where x is the compositionvariable. Gupta and Mauro have combined the Adam−Gibbsmodel with Naumis’s analysis to propose that Tg can becalculated via the following equation:128−130
T x
T x
f T x x
f T x x
d n T x x
d n T x x
( )
( )
( ), ( )
( ),
( ), ( )
( ),g
g R
g R R
g
g R R
g=
[ ][ ]
=− [ ]
− [ ] (15)
where d = 3 is the dimensionality of the network and xR is thereference composition. n(T, x) is the average number ofconstraints per atom, which may include two-body linear,three-body angular, or higher-order constraints.128−130 n(T, x)can be calculated by averaging over all network-forming speciesi and each type of constraint α:
n T x N x w q T( , ) ( ) ( )i
i i ,∑ ∑=α
α α(16)
Ni(x) is the mole fraction of network-forming species i, wi,α isthe number of α-type constraints associated with species i.qα(T) is the temperature dependence of the constraints, whichis a measure of rigidity for constraint α. In the limit of zerotemperature, all constraints are fully rigid (qα = 1) since thereis no thermal energy available to break a constraint. In contrast,constraints are easily broken in the limit of infinite temperature(qα = 0), i.e.
q T q Tlim ( ) 1 and lim ( ) 0T T0
= =α α→ →∞ (17)
At a finite temperature, some fraction of the constraints arebroken while others are rigid. The temperature dependence ofrigidity, qα(T), can be expressed as either a continuous ordiscrete function. The discrete form of qα is particularly usefulfor calculating the composition dependent on Tg since ananalytical form for Tg(x) can often be obtained.128−130
Temperature-dependent constraint theory has been appliedto predict the Tg of various series of glass sys-tems.108,120,128,129,135,136 Here we consider a series of sodalime borate glasses as an example.120 The borate glasses havebeen a particularly challenging system to predict properties dueto the “boron anomaly”. Four network-forming species (B4, B3,O, MNB) and the associated constraints as a function of thecomposition are calculated based on Gupta’s random pairmodel.120 Then, the constraint onset temperature of eachconstraint is determined, and different constraints are rankedaccording to their relative bond strengths. The correspondingnumber of atomic degrees of freedom is determined accordingto the constraint counting. Finally, the analytical formulas are
applied to calculate the composition dependence of Tg. Asshown in Figure 10, the Tg calculated using the constraintmodel agrees with the experimental Tg values determined byDSC.120,121
In addition to quantitative predictions of glass properties,topological constraint theory can also be used to explain thestructural and topological origins of the property variations.For example, boroaluminosilicate glasses form the basis ofmany commercial glasses and have a wide variety ofapplications.137,138 However, the structure and properties ofsuch mixed network glasses are complicated due to the mixednetwork former effect, which yields nonlinear variation inseveral macroscopic properties.139−142 Zheng et al. havestudied the glass transition behavior of a series of sodiumboroaluminosilicate glasses from peralkaline to peraluminouscompositions by substituting Al2O3 for SiO2.
10,143 The Tgvalues of the glasses determined by DSC and the compositiondependence of Tg are displayed in Figure 11. A clear trend isseen in the inset: Tg increases with increasing the differencevalue of [Al2O3]−[Na2O], but it increases faster in theperaluminous regime compared to the peralkaline regime.Through multinuclear magnetic resonance spectroscopy, it
was found that there were three structural roles of sodium,including charging compensation for AlIV, converting boronfrom trigonal to tetrahedral coordination, and formingnonbridging oxygens, with competition among these threeroles.10 In the peralkaline regime, with the increase of [Al2O3],the concentration of AlIV increases while the concentrations ofNBOs and BIV decrease. In the peraluminous regime, theconcentration of AlV increases with increasing [Al2O3], andthere are essentially no BIV or NBOs on silicon or boron.143
The structural dependence of Tg can be explained based on theconcept of topological constraints. In terms of constrainttheory, Tg increases with the average number of networkconstraints per atom.129,130 In the peralkaline regime, thedecreased number of NBOs enhances the network con-nectivity, and the increased number of constraints with
Figure 10. Comparison between the Tg values predicted by thetopological constraint theory (red solid line) and those measured byDSC (blue filled spheres) for the glass composition (mol%): xNa2O−10CaO−(89−x)B2O3−1Fe2O3). The changing trend of Tg with theNa2O content (x), is indicated by the red solid line: both theconstraints per network forming ions and the two rigid μ constraintsper NBO-forming Na were considered during the topologicalprediction. Dashed line: the modifier constraints were not considered.Reproduced with permission from ref 120. Copyright 2010 AmericanChemical Society.
Chemical Reviews Review
DOI: 10.1021/acs.chemrev.8b00510Chem. Rev. XXXX, XXX, XXX−XXX
M

increasing [Al2O3] leads to the increase of Tg. In theperaluminous regime, the five-coordinated aluminum contrib-utes more constraints than four-coordinated silicon, whichresults in a higher value of Tg.
10,143
Furthermore, to more accurately predict the dynamicproperties of multicomponent glasses using temperature-dependent constraint models, additional topological factorsmust be taken into account. Here we mention some recentstudies for improving the predictive ability of the topologicalconstraint approach. First, Hermansen et al. proposed atemperature-dependent constraint model of alkali phosphateglasses considering the structural and topological role of themodifying ion subnetwork constituted by alkali ions and theirnonbonding oxygen coordination spheres.144 Second, theydeveloped a topological model for binary phosphate glassesthat builds on the previously introduced concepts of themodifying ion subnetwork and the strength of modifierconstraints.135 Third, Rodrigues and Wondraczek introducedcationic constraint effects into the theory.145 In addition, itshould be mentioned that other glassy dynamic properties(e.g., liquid fragility) can also be predicted by the topologicaltemperature-dependent constraint theory. Interested readersare referred to several recent original papers146,147 and reviewarticles.148,149
In summary, the topological constraint approach is not yetfully developed, but it is capable of achieving the same resultsas can be obtained through DSC, e.g., determining dynamicproperties (e.g., Tg and m) for several families of networkglasses.3.3. Mechanical and Thermal Effects
3.3.1. Pressure. Pressure and pressure history have aprofound impact on the characteristics of the glass transition(including the Cp overshoot, and the Tf). Hence, the control ofpressure history provides another avenue for understanding thenature of glass transition and designing novel materials with
unique properties. The application of pressure can inducesubstantial structural changes in glass-forming systems, leadingto changes in its vibrational density of states and macroscopicproperties.150−154 These effects can be illustrated with thesimple 25Na2O-10CaO-65 B2O3 (mol%) system, wherepressure has a profound impact on both structure and physicalproperties.155 Nuclear magnetic resonance (NMR) spectros-copy and DSC were two of the primary characterization toolsfor such study.Figure 12a shows an enhancement of the Cp overshoot at
temperatures above Tg as the isostatic pressure (p) increases.This overshoot is indicative of the nonexponentiality of therelaxation process,102 i.e., a broadening of the relaxation timedistribution. Hence, subjecting the glass to high hydrostaticpressure forces the glass into a deeper part of the enthalpy
Figure 11. Impact of the substituted amount of Al2O3 for SiO2 on theglass transition in the glasses with designed compositions (mol%) of15Na2O·5B2O3·xAl2O3·(80−x)SiO2, where x = 0 to 20, as determinedby DSC at the upscan rate of 10 K/min subsequent to a cooling rateof 10 K/min. The plot is shown as the isobaric heat capacity (Cp)against temperature (T). The measured compositions are given in ref10. Inset: Composition dependence of Tg. The dashed lines are linearfits to the data in the [Al2O3]−[Na2O] < 0 and [Al2O3]−[Na2O] > 0regimes. Reproduced with permission from ref 10. Copyright 2012Elsevier B.V.
Figure 12. Isostatic pressure (p) effect on the glass transition for a25Na2O−10CaO−65 B2O3(mol%) glass. (a) Enhancement of the Cpovershoot of the glass transition with an increased p, which wasapplied to the samples during annealing at 0.9Tg and cooling prior tothe first DSC upscans. The first and second DSC up and downscanswere performed at 10 K/min at ambient pressure. Inset: Cp curves forthe second DSC upscans at 10 K/min. (b) Fictive temperatures (Tf)as a function of p, which are determined from both the first andsecond DSC upscan, respectively. (c) Evolution of fraction oftetrahedral to total boron (N4) with annealing duration. Inset: impactof isostatic pressure on N4 in the absence of annealing. Reproducedwith permission from ref 155. Copyright 2014 Macmillan PublishersLimited.
Chemical Reviews Review
DOI: 10.1021/acs.chemrev.8b00510Chem. Rev. XXXX, XXX, XXX−XXX
N

landscape compared to the system at ambient pressure. Note,however, that the enthalpy landscape itself is changing as afunction of pressure. Consistent with prior work,151,156 anincrease in pressure enhances the nonexponentiality of theenthalpy relaxation process. Increasing pressure densifies thesystem, increasing the connectivity of the glass network due toBO3−BO4 conversion. As the glass is subsequently heatedthrough the transition region, the systems compressed athigher pressure exhibit a greater jump in configurationalentropy during the approach to equilibrium. This effect isshown in Figure 12b, where the pressure dependence of Tf isplotted. Changes in the IRO structure may also be playing animportant role during the pressurization process.157
3.3.2. Non-Affine Strain. Recently, it was demonstratedthat melt-quenched metallic glasses could be energeticallyexcited, i.e., rejuvenated by thermal cycling in the temperaturerange well below room temperature (RT).158,159 Thisrejuvenation is opposite to structural relaxation, and the latteroccurs toward states of higher density and lower enthalpy(Section 3.4.3). In this case, the thermal cycling leads to non-affine strains (homogeneous stains) in metallic glasses, whichenhance the structural heterogeneity and hence cause theexcitation of potential energy in glasses. This is the so-called“non-affine strain effect,” which can be quantified by DSC asshown in Figure 13. The effect is found to greatly increase theplasticity of melt-quenched metallic glasses, which is a crucialmechanical property for their engineering applications.
Figure 13a shows a typical DSC upscan of the melt-spunribbon glass of La55Ni20Al25, where a broad sub-Tg relaxationpeak is seen prior to the glass transition and the subsequentcrystallization. The enthalpies of relaxation (ΔHrel) in both rodand ribbon samples were calculated from the correspondingheat capacity curves, as illustrated by the shaded areas inFigure 13b. Interestingly, a considerable increase in ΔHrel, i.e.,rejuvenation, was observed for both the rod and the ribbonsamples after they underwent 15 and 10 cycles of thermalcycling, respectively, between RT (293K) and liquid-nitrogen
temperature (77 K). For melt-spun ribbons, ΔHrel reaches amaximum at ∼10 cycles, whereas, for bulk glass, ΔHrel issmaller and approaches the maximum after ∼15 cycles. In eachcase, the maximum increase of ΔHrel is ∼50% relative to the as-cast sample.
3.3.3. Liquid−Liquid Phase Separation. Some glass-forming systems contain multiple glassy phases that exhibitdifferent glass transition responses. To identify these multipleglass transitions, DSC may be used as a sensitive method, whileother advanced characterization techniques such as trans-mission electron microscopy (TEM), electron diffraction, andX-ray diffraction (XRD) can be used to detect the chemicalidentity of those phases. To demonstrate the effect of phaseseparation on the glass transition, here we take thefluoroaluminosilicate Fuji G338 ionomer glass system used asan example. The G338 glass is used as the glassy powdercomponent of glass ionomer cement (GIC) in dentalapplications. In two recent studies,160,161 both the as-receivedG338 glass and the heat-treated G338 glass were characterizedusing DSC and XRD. As shown in Figure 14, three glass
transitions were identified in the as-received G338 glass fromDSC upscan curve 2, implying the coexistence of threenoncrystalline phases. To determine the chemical identity ofthe three phases, XRD analyses were conducted on samplessubjected to dynamic heating, while further DSC and XRDanalyses were performed on samples subjected to isothermaltreatment. The results suggest that the three noncrystallinephases in G388 are Ca/Na-Al-Si-O, Ca-Al-F, and Ca-P-O-Fphases, respectively. However, the exact chemical compositionsof the three phases are hard to be acquired. The results shownin Figure 14 are important for understanding the impact ofphase separation within ionomer glasses on the glass transitionand on setting behavior of GIC by optimizing the glassproduction conditions.3.4. Determination of Fictive Temperature
The fictive temperature (Tf) of a glass is a crucial parameter todescribe its thermal history and a measure of the estimatedaverage level of its corresponding liquid on the potentialenergy landscape. The accurate determination of Tf is criticalto study the glass transition and glass relaxation and to controlglass production processes. Here we review the enthalpic
Figure 13. DSC traces of melt-spun ribbons of La55Ni20Al25 and bulkrods of La55Ni10Al35 metallic glasses. (a) Heat flow (in arbitrary unit)for the ribbon during heating, where a broad exothermic enthalpyrelaxation is seen before Tg. (b) Cp curves showing the excitation ofpotential energy induced by room temperature to 77 K thermalcycling, i.e., rejuvenation. Shaded area: the released enthalpy (ΔHrel)of as-produced glasses, which is obtained by integrating the differenceof successive traces of Cp over the temperature range of theexotherms. The ΔHrel areas of the rejuvenated glasses are shown,which are larger than those of the as-produced glasses. In both a andb, vertical bars give units and scales for the y axis. Reproduced withpermission from ref 158. Copyright 2015 Macmillan PublishersLimited.
Figure 14. DSC upscan curves for both fresh G338 glass (red) andthe glass subjected to upscan 1 (blue). Red curve: water-lossendothermic response followed by an exothermic enthalpy-releaseresponse, and then by triple glass transition responses. Blue curve:revealing three glass transitions represented by Tg1, Tg2, and Tg3,which are associated with three glass phases GP1, GP2, and GP3,respectively. Reproduced with permission from ref 160. Copyright2015 Macmillan Publishers Limited.
Chemical Reviews Review
DOI: 10.1021/acs.chemrev.8b00510Chem. Rev. XXXX, XXX, XXX−XXX
O

approaches based on DSC measurements to determine Tf forslowly cooled glasses82 and hyperquenched glasses,162 and weintroduce a combined approach to determine Tf of a glass witharbitrary thermal history.100
The properties of glass-forming systems depend not only ontemperature and composition but also on thermal history. Attemperatures above the glass transition range, the system is in astable or metastable equilibrium state. As the system is cooledthrough the glass transition regime, the liquid is graduallyfrozen into a nonequilibrium glassy state. The nonequilibriumproperties of the glass are of great importance and are generallyconsidered to be a function of both the physical temperature Tand the fictive temperature Tf.
163 The description of thenonequilibrium glassy state by means of Tf has drawnsignificant attention for several decades. There are variousdefinitions of Tf used in the literature. The concept of fictivetemperature was originally conceived by Tool and Eichlin,164
who proposed a description of glass in terms of an equivalentequilibrium liquid state at a fictive temperature. This makes itpossible to investigate complex glassy problems in terms oftheir corresponding equilibrium state. Nevertheless, based onhis pioneering crossover experiments, Ritland165 found that theglassy state cannot be described using just a single fictivetemperature. To overcome this problem, Narayanaswamy166
has introduced multiple fictive temperatures in his phenom-enological model of glass relaxation, and his approach“indicates that any nonequilibrium state is actually a mixtureof several equilibrium states.” However, Mauro et al.,167 basedon the enthalpy landscape approach and nonequilibriumstatistical mechanics, have proved that the configurationalspace distribution of the nonequilibrium glassy state cannot bedescribed in terms of a mixture of equilibrium liquid states.Moynihan et al.168 stated that the values of fictive
temperature calculated from different properties are notnecessarily identical. Against the structural interpretation offictive temperature using a macroscopic, property-basedinterpretation, he defined Tf as “simply the structuralcontribution to the value of the macroscopic property ofinterest expressed in temperature units.”.6 Instead ofconsidering fictive temperature in terms of a mapping of theglass structure to an equivalent equilibrium structure, thisdefinition bypasses the microscopic physics of the glass and isthe definition that will be now be adopted, with Tf beingdetermined by enthalpy. In other words, the fictive temper-ature is defined as the temperature at which the configurationalenthalpy of the glass equals that of the corresponding liquidstate.167 Tf is a parameter to account for the thermal historydependence of glass structure and properties. The cooling rateand pressure are major factors in determining Tf of a glass-forming liquid. The DSC approach is usually used todetermine Tf. In the following sections, we review the well-established methods for determining Tf for slowly cooledglasses82 and hyperquenched glasses.162 Moreover, a unifiedapproach to determine Tf of a glass with arbitrary thermalhistory has been introduced.100
3.4.1. Slowly Cooled and Aged Glasses. Moynihan etal.82 proposed an area-matching (i.e., enthalpy-matching)method for determining the fictive temperature (Tf) of slowlycooled glasses using DSC. This approach is based on Cpmeasurement of the glass as illustrated in Figure 15.Figure 15 shows that after cooling at the standard rate of 10
K/min, the basaltic glass is reheated at 10 K/min to atemperature above the glass transition region to get the Cp
upscan curve. The Tf value of the 10 K/min cooled glass canbe calculated based on this Cp curve using the followingequation:
C C T C C T( ) d ( ) dT
T
T
T
pl pg p pgf d
∫ ∫− = −* *
(18)
where Cpg is the glass heat capacity obtained by extrapolatingthe heat capacity below the glass transition, Cpl is theequilibrium liquid heat capacity, T′ is the temperature atwhich Cp begins to deviate from Cpg and enters the glasstransition region, and T* is any temperature above the glasstransition region. The Tf value derived in Figure 15 coincideswith the standard onset glass transition temperature Tg(corresponding to the viscosity of 1012 Pa s shown in Figure8). Furthermore, the area-matching method can be applied todetermine the Tf values of any glasses that are cooled at a rateof ≤10 K/min.Moynihan6,169 found that when the prior cooling (qc) and
reheating rates (qh) are the same, the Tf obtained using thearea-matching method from the Cp reheating curve is veryclose to the onset glass transition temperature, Tg,onset. Tg,onset isdefined as the temperature at the intersection point betweenthe extrapolated straight line of the glass Cp curve and thetangent line at the inflection point of the sharp rising Cp curve.Thus, Tg,onset can be regarded as the Tf value calculated by thearea-matching method, when the reheating rates are equal tothe preceding cooling rates.
3.4.2. Fast-Quenched and Hyperquenched Glasses.However, when the prior cooling rate of a glass is higher thanthe subsequent reheating rate (typically 10 or 20 K/min), its Tfshould be determined using another approach described in ref162 (Figure 16). In other words, the approach illustrated inFigure 15 is not applicable to the Tf determination of fast-quenched and hyperquenched (HQ) glasses by a conventionalDSC. Hyperquenched glasses here refer to the glasses that arecooled at an ultrafast rate, e.g., >105 K/s.14,162,170−176
Moynihan’s approach cannot be used to determine Tf ofhyperquenched glasses.82 His method requires that the DSCreheating rate should be the same as or higher than the coolingrate of the originally formed glass. In particular, it is notpossible for a conventional DSC to reach a high scan ratecomparable to hyperquenching rates (Section 3.4.2). In thiscircumstance, Yue et al.162 and Velikov et al.176 proposed asimple energy-matching method to determine the Tf value of ahyperquenched glass. According to Yue et al.,162 hyper-
Figure 15. Heat capacity as a function of temperature for a basalticglass determined at a heating rate of 10 K/min following a coolingrate of 10 K/min through the transition region. Replotted withpermission from ref 162. Copyright 2002 Elsevier B.V.
Chemical Reviews Review
DOI: 10.1021/acs.chemrev.8b00510Chem. Rev. XXXX, XXX, XXX−XXX
P
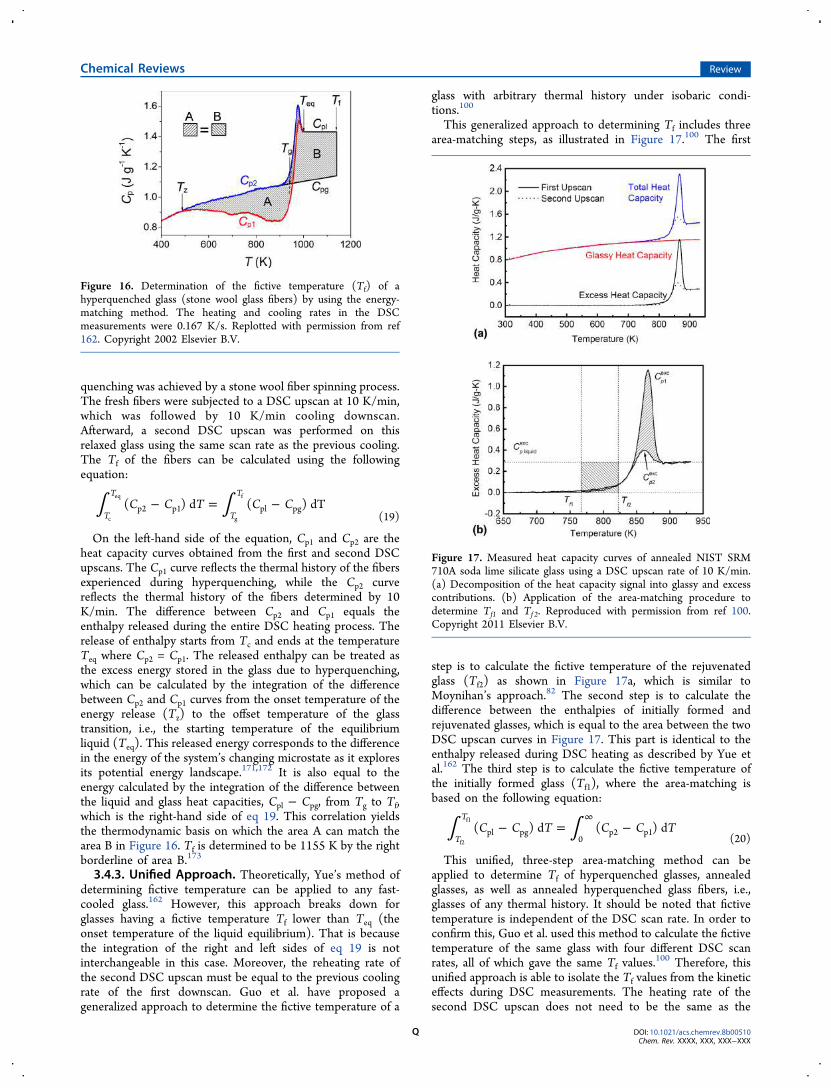
quenching was achieved by a stone wool fiber spinning process.The fresh fibers were subjected to a DSC upscan at 10 K/min,which was followed by 10 K/min cooling downscan.Afterward, a second DSC upscan was performed on thisrelaxed glass using the same scan rate as the previous cooling.The Tf of the fibers can be calculated using the followingequation:
C C T C C( ) d ( ) dTT
T
T
T
p2 p1 pl pgc
eq
g
f∫ ∫− = −(19)
On the left-hand side of the equation, Cp1 and Cp2 are theheat capacity curves obtained from the first and second DSCupscans. The Cp1 curve reflects the thermal history of the fibersexperienced during hyperquenching, while the Cp2 curvereflects the thermal history of the fibers determined by 10K/min. The difference between Cp2 and Cp1 equals theenthalpy released during the entire DSC heating process. Therelease of enthalpy starts from Tc and ends at the temperatureTeq where Cp2 = Cp1. The released enthalpy can be treated asthe excess energy stored in the glass due to hyperquenching,which can be calculated by the integration of the differencebetween Cp2 and Cp1 curves from the onset temperature of theenergy release (Tz) to the offset temperature of the glasstransition, i.e., the starting temperature of the equilibriumliquid (Teq). This released energy corresponds to the differencein the energy of the system’s changing microstate as it exploresits potential energy landscape.171,172 It is also equal to theenergy calculated by the integration of the difference betweenthe liquid and glass heat capacities, Cpl − Cpg, from Tg to Tf,which is the right-hand side of eq 19. This correlation yieldsthe thermodynamic basis on which the area A can match thearea B in Figure 16. Tf is determined to be 1155 K by the rightborderline of area B.173
3.4.3. Unified Approach. Theoretically, Yue’s method ofdetermining fictive temperature can be applied to any fast-cooled glass.162 However, this approach breaks down forglasses having a fictive temperature Tf lower than Teq (theonset temperature of the liquid equilibrium). That is becausethe integration of the right and left sides of eq 19 is notinterchangeable in this case. Moreover, the reheating rate ofthe second DSC upscan must be equal to the previous coolingrate of the first downscan. Guo et al. have proposed ageneralized approach to determine the fictive temperature of a
glass with arbitrary thermal history under isobaric condi-tions.100
This generalized approach to determining Tf includes threearea-matching steps, as illustrated in Figure 17.100 The first
step is to calculate the fictive temperature of the rejuvenatedglass (Tf2) as shown in Figure 17a, which is similar toMoynihan’s approach.82 The second step is to calculate thedifference between the enthalpies of initially formed andrejuvenated glasses, which is equal to the area between the twoDSC upscan curves in Figure 17. This part is identical to theenthalpy released during DSC heating as described by Yue etal.162 The third step is to calculate the fictive temperature ofthe initially formed glass (Tf1), where the area-matching isbased on the following equation:
C C T C C T( ) d ( ) dT
T
pl pg0
p2 p1f2
f1∫ ∫− = −∞
(20)
This unified, three-step area-matching method can beapplied to determine Tf of hyperquenched glasses, annealedglasses, as well as annealed hyperquenched glass fibers, i.e.,glasses of any thermal history. It should be noted that fictivetemperature is independent of the DSC scan rate. In order toconfirm this, Guo et al. used this method to calculate the fictivetemperature of the same glass with four different DSC scanrates, all of which gave the same Tf values.
100 Therefore, thisunified approach is able to isolate the Tf values from the kineticeffects during DSC measurements. The heating rate of thesecond DSC upscan does not need to be the same as the
Figure 16. Determination of the fictive temperature (Tf) of ahyperquenched glass (stone wool glass fibers) by using the energy-matching method. The heating and cooling rates in the DSCmeasurements were 0.167 K/s. Replotted with permission from ref162. Copyright 2002 Elsevier B.V.
Figure 17. Measured heat capacity curves of annealed NIST SRM710A soda lime silicate glass using a DSC upscan rate of 10 K/min.(a) Decomposition of the heat capacity signal into glassy and excesscontributions. (b) Application of the area-matching procedure todetermine Tf1 and Tf2. Reproduced with permission from ref 100.Copyright 2011 Elsevier B.V.
Chemical Reviews Review
DOI: 10.1021/acs.chemrev.8b00510Chem. Rev. XXXX, XXX, XXX−XXX
Q

previous cooling rate. The new approach is validated usingnumerical simulations, which are performed based on theMazurin−Startsev algorithm.174 It is found the fictive temper-ature determined by the calorimetric area-matching techniqueagrees very well with the modeled data, which is independentof the upscan rate used in the DSC measurement. Thisgeneralized approach for determining fictive temperatureunifies both Moynihan’s and Yue’s methods. Yue’s method isactually a special case of this approach when Tf > Teq.
100
3.5. Determination of Cooling Rate
The dependence of the fictive temperature (Tf) on the coolingrate qc is of great importance for both the glass-formingprocesses and fundamental research.175−177 For example, thefiber properties strongly depend on the cooling rate during thefiber forming process.178 Knowing the cooling rate of a glass iscrucial for any glass relaxation study. To determine the coolingrate of a glass, Yue et al. established the correlation betweenthe fictive temperature dependence of the cooling rate and thetemperature dependence of the equilibrium viscosity byperforming DSC and viscometry measurements.173 TheMYEGA equation (eq 32) can be used to describe thetemperature dependence of the equilibrium viscosity of glass.99
The Tf ∼ qc relation in the low cooling rate range can bedetermined by DSC since low cooling rates are controllable inDSC. However, it is not easy to determine the Tf − qc relationin the high cooling rate range (>102 K/s) of a quenchingprocess. Thus, finite element simulations were used todetermine the cooling rate of a glass fiber during drawingand quenching.179 The fictive temperature (Tf) of a hyper-quenched glass can be determined using the methodintroduced in refs 162,173 By introducing the parallel shiftfactor of log Kc = 11.35, the log η ∼ Tg/T curve can besuperimposed on the log(1/qc) ∼ Tg/Tf curve (Figure 18).
173
This parallel shift is reasonable since the activation energy forstructural relaxation determined by DSC is the same as that for
viscous flow.82,180 The resulting dependence of Tf on qc agreeswith that found in a previous study.177
Thus, the cooling rates of the fiber drawing process or otherhyperquenching processes of different glass systems can beestimated from the viscosity−temperature relation through theshift factor log Kc.
173 In Section 3.4, we have demonstratedhow to determine the Tf of both slowly cooled82,180 and fast-quenched and hyperquenched173 glasses by DSC. Therefore,the approach introduced here is a simple, effective one fordetermining the cooling rate of glasses, since it requires only aconventional viscometer and a DSC.173
3.6. Liquid Fragility Determined by Calorimetry andViscometry
The liquid fragility index (m) describes the rate of viscositychange of a glass-forming liquid with temperature at Tg. In theso-called Angell plot, the logarithm of viscosity, log10 η, isplotted against the Tg-scaled inverse temperature, Tg/T.
182−189
As shown in Figure 8, Tg corresponds to the viscosity of 1012
Pa·s. Liquid fragility itself is defined as the slope of the log10 ηversus Tg/T curve at Tg:
mT T
log
( / )T T
10
gg
η≡
∂∂
= (21)
Angell classified supercooled liquids as either “strong” or“fragile,” depending on whether they exhibit an Arrhenius orsuper-Arrhenius scaling of viscosity with temperature,respectively.182−189 Strong liquids exhibit a near-Arrheniusdependence of viscosity on temperature, which normallyexhibits small property changes during the glass transition.On the contrary, fragile liquids show a significant departurefrom Arrhenius behavior, which displays dramatic changes inproperties in the glass transition. The fragility index of aperfectly strong liquid equals 14.97 according to the MYEGAequation,99 with the log10 η∞ (Pa s) average value of −2.93determined in ref 190. The liquid fragility index is a usefulscaling parameter for comparing the viscous flow behavior ofall glass-forming liquids.Given that it is such an important parameter, a method is
needed for accurate determination of fragility.191,192 Liquidfragility can be determined directly using viscosity measure-ments and eq 21. However, crystallization and volatilization ofsome glass-forming liquids make high-temperature viscositymeasurements difficult, and the low-temperature viscosityexperiments are time-consuming.193,194 Therefore, alternativeapproaches are needed to quantify fragility indirectly. DSC hasproven to be a useful tool for determining liquid fragility. Herethe liquid fragility determined by DSC is denoted as thecalorimetric fragility index (mDSC), while that determined byviscosity measurements is defined as the kinetic fragility index(mvis).
91 Moynihan et al. found that the activation energy forstructural relaxation determined by DSC is in good agreementwith the shear viscosity activation energy.82,180 The activationenergy for structural relaxation in the glass transition regioncan be calculated from the cooling rate (qc) dependence of Tfmeasured using DSC.195
d q
d T
E
R
ln
(1/ )c
f
g= −(22)
where Eg is the activation energy for equilibrium viscous flowin the glass transition region and R is the gas constant.
Figure 18. Overlapping correlation between the reciprocal coolingrate (1/qc) and the viscosity (log10 η) for a basalt glass in the case of T= Tf. Red solid curve: the Tg/T dependence of the log10η, which wasdetermined by fitting the viscosity data to the MYEGA equation (eq32). The filled triangles and spheres represent the log10(1/qc) versusTg/Tf data, which were obtained by DSC and by finite elementsimulation (FEM), respectively. Inset: the linear relation betweenlog10 η and log10 qc. Note that the viscosity curve in ref 173 wasacquired by fitting the measured data to the Avramov equation.181
Reproduced with permission from ref 173. Copyright 2004 AmericanInstitute of Physics.
Chemical Reviews Review
DOI: 10.1021/acs.chemrev.8b00510Chem. Rev. XXXX, XXX, XXX−XXX
R

Kissinger proposed another equation to calculate the activationenergy for the glass transition using DSC analysis at differentscan rates:196
qT
E
RTln constant
f2
g
f
ikjjjjj
y{zzzzz = − +
(23)
The calorimetric liquid fragility can then be determinedfrom Eg and Tg through the following relation:
mE
RT2.303g
g= −
(24)
Wang et al.197 have introduced another equation to calculatecalorimetric fragility:
q
qm m
T
Tlog
,
c
c s
g
f
i
k
jjjjjjjy
{
zzzzzzz = −(25)
where qc is the DSC downscan rate and qc,s is the standarddownscan rate, typically 10 K/min. According to Yue et al., thedependence of the fictive temperature on the cooling rate canbe well described using a viscosity model.162,173 The slope oflog(1/qc) ∼ Tg/Tf near Tg can be approximated as thecalorimetric liquid fragility (mDSC) over a rather small range ofthe cooling rates. All of the abovementioned methods assumethe correlation of log(1/qc) ∼ 1/Tf to be Arrhenian near Tg.However, the actual scaling is non-Arrhenius across the wholetemperature range, which may lead to a deviation of mDSC frommvis.
91
The connection between the kinetic and calorimetric liquidfragility values for several series of glass-forming systems hasbeen investigated over a wide range of m from 26 to 108.91
The mDSC was determined as the slope of the log(1/qh) ∼ Tg/Tf curve around Tg,
162,173 i.e., the changing rate of fictivetemperature (Tf) with heating rate (qh) in a small Tf rangearound Tg. The kinetic fragility (mvis) is obtained by fitting themeasured viscosity data to the MYEGA equation.99 As shownin Figure 19, the calorimetric fragility (mDSC) deviatessystematically from the kinetic fragility (mvis) for all thestudied glasses, and the offset between the two kinds of fragility
indices becomes larger with an increase of the fragility value.The deviation of mDSC from mvis is due to the Arrhenianapproximation of the log(1/qc) ∼ Tg/Tf relation in the glasstransition range. Zheng et al. developed an empirical model toquantify the deviation and accurately calculate liquid fragilityfrom DSC measurements. Based on a correction factor toaccount for the non-Arrhenius scaling of the relaxation time,the empirical model is developed as follows:
m m m m1.289( )vis DSC 0 0= − + (26)
where m0 is 14.97. With this model, mvis can be well predictedfrom mDSC across a large range of fragilities, as demonstratedby the dashed line in Figure 19. Thus, a quantitative linkbetween kinetic and calorimetric fragilities is reestablished.91
As discussed in Sections 3.2.1 and 3.2.2, several thermody-namic properties, e.g., ΔCp(Tg) and ΔTg, which reflect theliquid fragility, can be determined by DSC. Also, (dCp/dT)inflectis another measure of liquid fragility, which is the slope of therising Cp curve at the inflection point during the glasstransition.10 There have been many studies attempting toconnect the kinetic fragility (m) determined by viscosity withthermodynamic quantities at the glass transition determinedusing DSC.101,106,195,197−199 Zheng et al. investigated the glasstransition behavior of two series of boroaluminosilicate glasses.They found that ΔCp(Tg) increases with the increase of kineticfragility (m). Furthermore, they have also studied thecorrelation between kinetic fragility and ΔTg, (dCp/dT)inflect.A higher fragility value means a sharper breakdown ofergodicity and a more well-defined glass transition.167 Thus,it is expected that ΔTg
101,106 is inversely correlated with m,whereas (dCp/dT)inflect is positively correlated with m. Theexperimental findings confirm those statements.10 It should beclarified that not all glass-forming liquids follow the qualitativecorrelations discussed above, which are just commonlyobserved trends.1,124
Huang and McKenna have compared the kinetic fragility(m) with the ratio of the liquid to glassy heat capacities at Tg,Cpl/Cpg, for several glass families covering small moleculeorganic, polymeric, and inorganic glass-forming liquids.198 Theimpact of fragility within each glass family is somewhatdifferent and may be classified into three groups. Thoseauthors found a negative correlation between kinetic fragilityand Cpl/Cpg; that is, m decreases as Cpl/Cpg increases for thepolymeric glass formers. No large dependence of m on Cpl/Cpghas been observed for small molecule organics and hydrogenbonding small molecules. Only inorganic glass formers exhibita clear positive correlation between m and Cpl/Cpg, whichagrees with the original statement of Angell that m increaseswith increasing Cpl/Cpg.
200 Angell has suggested that theanomalous fragility behavior of polymers is related to chainlength or entanglements. The glass transition is possiblypostponed, which could result in the decreasing change in heatcapacity.201−204 The correlation of m and Cpl/Cpg as a functionof the molecular structure should be further investigated togain a broader picture.While the discussion of kinetic fragility and thermodynamic
quantities starts with a simple, direct correlation, there havebeen several models proposed to quantify the correlation in amore comprehensive manner.205−211 Recently, a model used topredict Cp,conf(Tg), i.e., ΔCp(Tg), based on m and Tg has beenderived using a combined topological and thermodynamicapproach.108 In the derivation of the model, Cp,conf(Tg) isdefined in terms of configurational enthalpy and entropy, and
Figure 19. Correlation between the calorimetric and kinetic liquidfragility indices (mDSC vs mvis) for 20 boroaluminosilicate glasses, 6soda-lime borate glasses, two fiber glass compositions, and 6vanadium tellurite glasses. Blue Spheres: experimental mvis data;Red solid line: modeled mvis data; Dashed black line: mvis = mDSC.Reproduced with permission from ref 91. Copyright 2016 ElsevierB.V.
Chemical Reviews Review
DOI: 10.1021/acs.chemrev.8b00510Chem. Rev. XXXX, XXX, XXX−XXX
S

the Adam−Gibbs (AG) model for equilibrium viscosity iscombined with the definition of fragility. Based on the enthalpylandscape approach and temperature-dependent constrainttheory, the model is derived as follows:108
C x T xA xT x
m xm
, ( )( )( )
( )1p g
R
g 0
ikjjjjj
y{zzzzzΔ [ ] = −
(27)
where A(xR) is a proportionality constant for the referencecomposition xR, m0 is the fragility of an ideal strong liquid, andx is a composition variable.The advantage of the Adam−Gibbs model lies in connecting
kinetics (via the viscosity, η) with a thermodynamic variableSconf as a function of temperature, which leads to the successfulconnection of Cp,conf(Tg) with m. ΔCp(Tg) can be predictedusing the measured values of Tg and m.
108 Good agreement hasbeen found between measured and predicted values ofΔCp(Tg) for several inorganic glass systems, includingborosilicate108 and calcium aluminosilicate glasses.125 Thepredictive ability of the model indicates that thermodynamicchanges during the glass transition are indeed connected to thekinetic fragility index.As discussed above, the simple linear relation between the
kinetic fragility and Cp,conf(Tg) is not always valid for polymericglass formers. However, Martinez and Angell,106 andCangialosi et al.212 connected the kinetic fragility to the excessentropy and heat capacity of a large number of glass-formingpolymers. The liquid entropy in excess to the correspondingcrystal is termed excess entropy, which is found to beproportional to Sconf.
186,213 The Sconf term in the AG model canbe replaced by excess entropy Sex. By introducing the Adam−Gibbs equation into eq 27, the following relation isobtained.213
mC T
S T1
( )
( )p g
ex g= +
Δ
(28)
Wang et al. have developed an empirical correlation thatconnects kinetic fragility to thermodynamic variables for morethan 50 nonpolymeric supercooled liquids, mainly includingorganic small molecules and hydrogen bonded liquids:214
mT C T
H56
( )g p g
m=
ΔΔ (29)
where ΔHm is the melting enthalpy, and all the thermodynamicvariables can be determined calorimetrically. The correlationhas also been derived from the random first-order transitiontheory.215,216 The kinetic fragility has been well correlated tothe thermodynamic properties for the studied compositions.By combining the empirical “2/3 rule” between the meltingpoint and average glass transition temperature (Tg/Tm = 2/3)with eq 29, it yields the following form:
mC T
S40
( )p g
m=
ΔΔ (30)
The plot of scaled excess entropies of glasses and liquids as afunction of the reduced temperatures, i.e., ΔS(T)/ΔSm vs T/Tm is often viewed as the thermodynamic equivalent of thekinetic fragility plot.101 The slope in the ΔS(T)/ΔSm vs T/Tmplot can be derived as
S T ST T
C T
STT
d( ( )/ )d( / )
( )
T T
m
m
pex
g
m
m
gg
Δ Δ=
ΔΔ
= (31)
The above equation means that the slope in thethermodynamic plot of ΔS(T)/ΔSm vs T/Tm can bedetermined by ΔCp(Tg)/ΔSm. Based on this correlation,ΔCp(Tg)/ΔSm can be defined as a thermodynamic gauge forfragility. The measured kinetic fragility agrees well with thecalculated values using eq 31,214 which validates thequantitative correlation of thermodynamic and kineticfragilities.3.7. Determination of Viscosity by DSC
Viscosity is a key factor in all stages of glass industryproduction. It is also critical for understanding thecrystallization kinetics and glass formation, the glass transition,and the nonexponential relaxation of liquids and theircorresponding glasses.163,217 Due to the technical complica-tions of determining viscosity in many cases,193,194 it is usefulto find an alternative way of determining the viscosity−temperature curve. In this context, an approach combiningDSC and a viscosity model has recently been proposed toderive the viscosity−temperature relation in the entire liquidand supercooled liquid range of temperature. The question iswhich model best suits this approach. As is known, numerousviscosity models exist to describe the temperature dependenceof shear viscosity.92,99,181,218 Three-parameter viscosity modelscan be expressed in terms of three common parameters: Tg, m,and the extrapolated high temperature limit of viscosity η∞.One of these models is the MYEGA model, which is based onthe temperature dependence of configurational entropy andgives a better fit to the experimental data compared to other 3-parameter models.99 The model can be written as
TT
T
m T
T
log ( ) log (12 log )
exp12 log
1 1
10 10 10g
10
g
Ä
Ç
ÅÅÅÅÅÅÅÅÅÅÅÅ
i
kjjjjjj
y
{zzzzzzikjjjj
y{zzzzÉ
Ö
ÑÑÑÑÑÑÑÑÑÑÑÑ
η η η
η
= + −
×−
− −
∞ ∞
∞
(32)
As reported in ref 190, the analysis of the viscosity data of946 silicate liquids and another 31 nonsilicate liquids by theMEYGA model yields a universal high-temperature viscositylimit of 10−2.93 Pa·s. Thus, there are only two parameters left inthe MYEGA model, namely, Tg and m. As mentioned inSection 3.6, mvis can be calculated through mDSC across the fullrange of fragilities.91 Moreover, as shown in Figure 8, thecalorimetric Tg can be used as the kinetic Tg. Thus, both Tgand m can be determined solely by performing DSCmeasurements. By combining the high-T viscosity limit(10−2.93 Pa·s), we are able to obtain the entire viscositycurve of a glass-forming liquid only by DSC.91 An example isshown in Figure 20, where the viscosity−temperature relationof a borate melt is obtained by introducing the calorimetric Tg,mDSC, and log10 η∞ = −2.93 Pa·s into the MYEGA model,which excellently agrees with that measured directly by aviscometer across the full temperature range. But the DSCmethod is simpler and more effective compared to directviscosity measurements.91
3.8. Polyamorphic Transitions
3.8.1. Definition and General Aspects. Polyamorphismrefers to the existence or transformation of two noncrystalline
Chemical Reviews Review
DOI: 10.1021/acs.chemrev.8b00510Chem. Rev. XXXX, XXX, XXX−XXX
T

phases of a given material system under certain temperatureand pressure conditions. The two phases have the samechemical composition, but with different density, enthalpy, andentropy.219 The phase boundary dT/dP = dV/dS typically hasa negative slope. Polyamorphism is different from phaseseparation, which refers to the coexistence of two phases withdifferent chemical compositions (Section 3.3.3). Polyamor-phism is a physical phenomenon applying to noncrystallinestates such as glasses, amorphous solids, supercooled liquids,and equilibrium liquids. However, a liquid−liquid transitionmust occur only in a thermodynamically stable equilibriumstate, whereas the polyamorphic transition can also take placein a nonequilibrium, nonergodic state. Amorphous ice is atypical example of a polyamorphic transition.220,221 Some ofthese transitions (including that in water) are expected to endin a second critical point. Understanding of polyamorphism isimportant for obtaining a comprehensive picture of the glasstransition.Experimental detection of a possible phase transition
between two supercooled liquid states in water has been alongstanding challenging problem due to the difficulty inavoiding crystallization of water. However, a major break-through in addressing this problem was achieved in 2018 byWoutersen et al.222 They applied DSC, infrared spectroscopy,and molecular dynamics simulations to investigate a water-richhydrazinium trifluoroacetate solution in which the localhydrogen bond structure surrounding a water moleculeresembles that in neat water at elevated pressure, but whichdoes not crystallize upon cooling. For the first time, theyobserved in this solution a sharp, reversible phase transitionbetween two homogeneous liquid states. The hydrogen-bonded structures of these two states are similar to those ofhigh density liquid (HDL) and low density liquid (LDL)water. Such structural similarity supports theories223−225 thatpredict a sharp transition in pure water under pressure if icecrystallization could be suppressed. It should be noted that theterms of high density amorphous (HDA) and low densityamorphous (LDA) solid phases are encountered in some glassforming systems.226−229 These two solid phases can betransformed into each other, depending on temperature andpressure.227−229 It is worth mentioning that liquid−liquid
transitions in yttria-alumina liquids were first discovered byAasland and McMillan230 and Greaves et al.231 They observedthe coexistence of the HDA and LDA phases in the yttria−alumina system.However, whether or not transformations between poly-
amorphic phases are of the first order is controver-sial.226−229,232,233 In addition to LDA and HDA ice,227,228
polyamorphism has been reported in many tetrahedral liquidsor glasses.219 For silica under pressure, Si−O polyhedra cantransform from tetrahedral coordination eventually to octahe-dral coordination.234 New densified HDA phases can beobtained from crystalline precursors.2,235 Creating LDA phasesby this route is challenging since it is hard to achievedecompression without cavitation. An alternative approachinvolves the amorphization of microporous crystallinematerials, such as zeolites,226,236 and metal−organic frame-works.4,237 These two types of microporous materials areselected as the objects of this article to describe the currentunderstanding of polyamorphism. To identify and follow thepolyamorphic transition, DSC is utilized as a powerful andsensitive technique. However, DSC alone cannot tell thestructural evolution during polyamorphic transition, and itmust be used in combination with structural characterizationtechniques.
3.8.2. Zeolites. Pressure- and temperature-inducedamorphization of crystals well below melting points is anexciting subject of glass science.235,238 Here we take zeolite asan example to show the pressure-induced amorphization andpolyamorphic transitions. The speed and extent of amorphiza-tion can be followed by DSC. Zeolite amorphization isaccompanied by a sharp asymmetric exotherm followed by asmaller endothermic step.239,240 Around 6 kJ per NaAlSiO4mole is released, and comparable to very-low-energy acousticmodes or floppy modes.241 It has been argued that the floppymodes in zeolites create the extra-framework sites for charge-compensating cations.242 Soft phonon modes might also beinvolved in the destabilization of the low-density anhydrouscrystalline structure.Figure 21 shows the direct comparison between DSC and X-
ray diffraction (XRD) results. It is seen that the initial rise ofthe DSC exothermic curve with temperature coincides with theinitial fall in the volume fraction of zeolite (xzeo). The DSCexothermic peak appears at the temperature of the fastestcrystal collapse (TA) corresponding to xzeo = 0.5, whereas thehigh-temperature endothermic drop follows the high temper-ature section of the xzeo curve. This suggests that additionalfloppy modes may be created as constraints are lost during thecollapse, and they disappear when the rigid amorphized phaserecovers.Figure 21 also shows the small-angle X-ray scattering
invariant, QSAXS, which measures differences in local density.QSAXS increases as the XRD peaks become lower and the DSCoutput becomes exothermic, indicating that amorphizationbegins. However, the maximum in QSAXS occurs at a lowertemperature than the DSC peak. X-ray scattering continues fora further 500 s and until 100 °C above the disappearancetemperature of the crystalline phase, providing evidence fordensity variations in the amorphized material before the finalhomogeneous phase is obtained. Evidence for heterogeneity isalso found in the later stages of zeolite amorphization byexamining the linear thermal expansion coefficient, αExpan, ofthe residual zeolite (Figure 21). αExpan has a sharp maximumwhen most zeolite has amorphized. Many zeolites, however,
Figure 20. Logarithmic viscosity (log10 η) as a function of the Tgscaled inverse temperature, (Tg/T), for a borate glass composition.Red filled circles: measured viscosity data; Red solid line: MYEGA fitto the measured viscosity data. Blue dashed line: viscosity datadetermined by introducing mDSC, Tg, and log10 η∞ = −3 into theMYEGA equation. Reproduced with permission from ref 91.Copyright 2016 by Elsevier B.V.
Chemical Reviews Review
DOI: 10.1021/acs.chemrev.8b00510Chem. Rev. XXXX, XXX, XXX−XXX
U

exhibit negative thermal expansion; for example, anhydrouscrystals shrink considerably at lower temperatures.243 Thisbehavior has been found for zeolite A and zeolite Y beforecollapsing. However, from the rapid rise in αExpan when T > TA(Figure 21), it is inferred that the crystalline fraction istemporarily in tension. Negative pressure is expected ifamorphization occurs randomly and spontaneously withinindividual crystals. As an HDA phase forms, internal tensionwill be created and disappears when the collapse iscomplete.244 In the framework of liquid fragility, the LDAphase is even stronger than SiO2, whereas the HDA phase isrelatively fragile.4,245
3.8.3. ZIF-4. Recently, a completely new family of melt-quenched glasses has emerged, chemically different fromexisting (i) organic, (ii) inorganic, and (iii) metallic glasses,which involve covalent bonds, ionic/covalent mixed bonds,and metallic bonds, respectively. This new family of glasses isobtained by melting and vitrifying zeolitic imidazolateframeworks (ZIFs), a subset of metal−organic frameworks(MOFs), upon quenching.4,246−255 The ZIF glasses involvecoordination bonds, which connect each metal node to fourorganic ligands, constituting the disordered tetrahedral net-work, in contrast to the long-range ordered network of theircorresponding crystals. The ordered cagelike structure of ZIFcrystals is lost in their glassy state. It should be noted that onlysome MOFs can be vitrified into a glassy state due to chemicaldecomposition that can occur during heating; that is, onlythose which fulfill certain structural conditions can be meltedand quenched. The same applies to the lower melting pointcoordination polymers and hybrid perovskites.257 The primarybuilding unit in ZIF glasses is analogous to that in the SiO2glass, viz., the [SiO4] tetrahedron. According to the radialdistribution function data, the short-range order in ZIFs is fargreater than that in silica glass, since imidazolate linkers aremuch larger than the bridging oxygen results.256 These melt-
quenched ZIF glasses present a new opportunity to exploreone of the most challenging problems in condensed matterscience, i.e., glass transition and glass formation.221,256,258−261
In addition to melting and glass formation, one particular ZIF,ZIF-4 [Zn(Im)2] (Im = imidazolate, C3H3N2
−), exhibits aremarkable feature, namely, polyamorphic transitions, when itundergoes a DSC upscan. In the following, we review thefindings about the polyamorphic transitions in ZIF-4, whichwere achieved by using DSC.The DSC upscan curves of ZIF-4 are shown in Figure 22a,
where it is seen that the endotherm at point A occurs due to
the release of the framework template (N,N-dimethylforma-mide). Subsequently, an exothermic feature is observed (D−F), which is attributed to the collapse of ZIF-4 into the lowdensity amorphous phase (LDA) (confirmed by SAXSexperiments262). Above this temperature, LDA converts to ahigh-density amorphous phase (HDA) (Figure 22a F−H), andthe glassy nature of HDA after cooling is confirmed by theglass transition peak at Tg = 565 K during DSC upscans 2 and3) (Figure 22a). The LDA−HDA transition is similar topolyamorphic transitions in inorganic zeolites226,240,245 andglass-forming liquids.2 HDA is a highly viscous liquid phaseabove its Tg, which crystallizes to ZIF-zni upon further heating,and ZIF-zni has different topology compared to the as-synthesized ZIF-4.4 The Tg of HDA (Figure 22a) is
Figure 21. Direct comparisons between DSC output (heat flow),small-angle X-ray scattering (SAXS), and XRD during the collapse ofzeolite Y. The peak and the half-width of the DSC exotherm coincidewith the collapsing temperature (TA) and the collapsing time (τA).The SAXS invariant, QSAXS, increases at a similar rate to the DSCexotherm but reaches a maximum at a higher temperature or a longtime, and persists long after xzeo = 0. In the final stages of collapse,residual zeolite crystals exhibit a peak in the thermal expansioncoefficient, αExpan, indicating the development of negative pressurewithin the amorphizing material before a homogeneous phase isobtained. Reproduced with permission from ref 245. Copyright 2003Nature Publishing Group.
Figure 22. (a) DSC upscans on ZIF-4 at 10 K/min. Upscan 1: thesuccessive eventssolvent release, crystal collapse to low-densityamorphous (LDA) phase, and LDA to HDA transition. Upscans 2and 3: glass transition peaks. (b) DSC upscans to 673 at 10 K/min onZIF-4 samples preheated to temperatures A (529 K), B (563 K), C(578 K), D (588 K), E (601 K), F (608 K), G (613 K), and H (673K) and cooled back. Red arrow: increase in the Tg of HDA phase withthe preheating temperature (D to H in Figure 22a); Blue arrow:increase in the temperature of ZIF-4 collapse into LDA with thepreheating temperature (A to D in Figure 22a). Sample D (588 K):coexistence of LDA and HDA captured by the DSC upscan curve(Figure 22b). Reproduced with permission from ref 4. Copyright2015 Macmillan Publishers Limited.
Chemical Reviews Review
DOI: 10.1021/acs.chemrev.8b00510Chem. Rev. XXXX, XXX, XXX−XXX
V

significantly lower than the LDA onset temperature (589 K)(Figure 22b). It should be mentioned that the HDA−LDAreversible transition (H−C in Figure 22a) during the DSCdownscan was not observed even at the lowest cooling rates (1K/min) that DSC can reach.Remarkably, LDA and HDA can coexist in the ZIF-4 sample
heated to temperature D (Figure 22a), which is captured byDSC curve D (Figure 22b), where the endothermic response isfollowed by an exothermic one. It is also seen that the glasstransition peak of HDA shifts to higher temperature withincreasing the preheating temperature from D to H (red arrowin Figure 22b), whereas the exothermic peak for ZIF-4collapsing into LDA shifts to lower temperature (blue arrow).The former shift is expected since the HDA structure isdensifying with increasing the preheating temperature, whilethe latter opposite shift suggests some increase in atomicdegrees of freedom as collapse advances. For the sampleshowing the HAD−LDA coexistence (Curve D in Figure 22b),there is a 24 K difference between the HDA and LDA glasstransitions.As mentioned above, the polyamorphic transition in ZIF-4
(Figure 22a) is not reversible under the laboratory conditions.This is similar to the case of the ultrastable glass13 obtained bymolecular deposition, which also has a higher Tg than that ofits “normal” glass counterpart.263 Upon reheating, theultrastable glass is transformed into a standard glass state,i.e., not into an ultrastable state at laboratory cooling rates,even though it would be thermodynamically favorable. This isalso the same scenario observed in long-time aged amber.264 Incontrast, LDA coexists with the HDA phase in ZIF-4 (Figure22b). When ZIF-4 has fully released its solvent, its structuralskeleton becomes looser but remains ordered with unchangedpotential energy.4 Upon further heating, the structure ofsolvent-free ZIF-4 relaxes toward a lower enthalpy state,
leading to LDA (Figure 22a). This behavior is also common toanhydrous zeolites,226,240,245 the enthalpies of which all exceedthose of conventional oxide glasses with the same composi-tion,265 reflecting the metastable nature of zeolitic crystals.When the temperature rises above its Tg, LDA spontaneouslytransforms into the highly viscous liquid HDA. With furtherheating, this liquid phase is turned to a more stable ZIF-znicrystal phase, and subsequently to a melt before decom-position. When this melt is quenched, the ZIF-4 glass isobtained.The apparent irreversibility for the phase transition in ZIF-4
is in contrast to the reversibility reported in ab initio moleculardynamics simulations of volume vs pressure in zeolitesystems.266 With increasing pressure, zeolite−LDA followedby LDA−HDA first order transitions could also be reversed byreducing pressure. Some evidence for phase transitionreversibility was found experimentally during the initial zeolitecollapsing process226 and over protracted periods at roomtemperature.240 The irreversibility of the transition in ZIF-4 ona laboratory time scale might be due to the inherent structuraldifferences between ZIF-4 and inorganic systems, in particular,the difference in rigidity of the intertetrahedral bridgingunit.267 Compared to oxide melts and zeolites, for example, thefloppy bridging oxygen is replaced by the rigid bridgingimidazolate in ZIF-4. This could influence differences inconformational changes involved in the LDA−HDA transitionthat determine the HDA topology and may not be kineticallysymmetric.4 The coexistence of HDA and LDA in the ZIF-4subjected to heating to D (588 K) (Figure 22b) implies thatthe entropy of the HDA phase is close to that of LDA.
4. EXPLORING ENTHALPY RELAXATION VIA DSC
The most common method for glass formation is by cooling aliquid from high temperature at a rate fast enough to avoid
Figure 23. Schematic representation of the enthalpy relaxation from a hyperquenched glass (HQG) toward a standard glass (STG) (i.e., a glasscooled at the standard rate of 10 K/min) (left panel) and the reflection of such relaxation on the potential energy landscape (PEL) (right panel).(a) Enthalpy decrease upon cooling a supercooled liquid to the HQG with higher fictive temperature (Tf2) and to the STG with lower fictivetemperature (Tf1 = Tg), and also enthalpy drop during crystal formation at the liquidus temperature (TL). Inset: A typical isobaric heat capacity (Cp)diagram for sub-Tg relaxation in a HQG, e.g., stone wool fibers.14,15 The hatched area is the enthalpy released during the DSC first upscan, which isequal to the enthalpy drop of the glass from Tf to Tg. (b) Different relaxation modes depending on the level of the glass on the PEL. Primary (α)and secondary (β) relaxations occur around Tg and Tf, respectively.
274 Different states (liquid, supercooled liquid, ideal glass, and crystal) of a glass-forming system are indicated on the PEL. TK is the Kauzmann temperature corresponding to a hypothetical ideal glass state.
Chemical Reviews Review
DOI: 10.1021/acs.chemrev.8b00510Chem. Rev. XXXX, XXX, XXX−XXX
W

crystallization. During cooling, the supercooled liquid graduallyfalls out of thermodynamic equilibrium and enters into theglassy state, passing through the glass transition region.1,2 Dueto the nonequilibrium nature of glass, one of its most intriguingphenomena is the spontaneous structural relaxation that occurswhen approaching the metastable supercooled liquid state.Specifically, when the glass is subjected to a sub-Tg annealingprocess (i.e., annealing below Tg), almost all of the importantrelaxation mechanisms occur from atomic vibrations, the fast βrelaxation process, the secondary slow β relaxation process(Johari−Goldstein relaxation), and finally the cooperative α(primary) relaxation process, evolving with time within thenonequilibrium region.2 DSC has proven to be a powerfultechnique for studying the enthalpy relaxation behavior ofdifferent glass systems because of its high sensitivity, highaccuracy, practicality, and direct access to thermodynamics.This section reviews recent advances in investigating enthalpyrelaxation in glass by using DSC in combination with structuralcharacterization techniques such as NMR, neutron scattering,total X-ray diffraction, and nuclear inelastic scattering. Wedescribe both the α and β relaxation features in melt-quenchedglasses such as oxide, metallic, organic, chalcogenide, andmetal−organic framework glasses. Furthermore, we discusshow to detect the structural heterogeneity in both normal andpoor glass formers by studying sub-Tg enthalpy relaxation. Tounderstand the structural origin of the enthalpy relaxationeffects, it is necessary to combine the hyperquenching-annealing-DSC (HAD) approach with structural character-ization techniques. Sub-Tg relaxation behavior is also discussedin terms of a potential energy landscape description. Finally,we introduce a recent understanding of the origin of thefragile-to-strong transition with the help of the DSC approach.
4.1. Sub- and Sup-Tg Relaxation
4.1.1. Potential Energy Landscape. The potentialenergy landscape (PEL) description of liquids andglasses3,94,171,176,209,268,269 is a useful approach for relatingthe complex sub-Tg relaxation processes, in particular, the αand β relaxations, to molecular-scale events of the glasses.Simply speaking, the PEL refers to a multidimensional surfacegenerated by a system’s potential energy as a function ofmolecular coordinates. In this regard, Goldstein suggested thatthere should be a temperature below which the molecularmotions can be detected by transitions over certain potentialbarriers in the energy landscape.270 This temperature is similarto the fictive temperature Tf in some sense. Figure 23 illustratesa schematic connection between the enthalpy drop (Figure23a) of a glass-forming liquid during cooling and annealing andthe PEL of this liquid (Figure 23b). Note that in Figure 23bthe PEL with multidimensional nature is schematicallyconstructed by plotting the potential energy against the one-dimensional configurational coordinate (Z*) for simplicity. In1995, Stillinger proposed that the relaxation of glass in itsconfiguration space of the PEL conceptually corresponds to acombination of fast motion between inherent structures withina metabasin (β relaxation) and a slower diffusive motionamong metabasins (α relaxation).271 In other words, duringrelaxation, the configuration of the glass system graduallysamples the rugged topography of the landscape in order toreach the deeper basin by crossing the saddle points betweenthe basins272 (Figure 23b).The depth of the basins sampled by the system in the energy
landscape varies as a result of sub-Tg annealing.273 The DSC is
a rather sensitive tool to detect the changes of the potentialenergy in liquid, supercooled liquid, and glass states, and toprobe the changes in their degrees of atomic freedom, i.e., frommigration to vibration, upon cooling of a liquid or vice-versaon reheating a glass.273 Relaxation is a process of approachingequilibrium by traversing the PEL. Figure 23 schematicallydepicts the energy level of the trapped state obtained atdifferent cooling rates.273 It is obvious that a higher coolingrate corresponds to a higher energy level of the basin, wherethe liquid is located and trapped at a higher Tf (HQG). Withsub-Tg annealing, the depth of the basins occupied by the glassgradually decreases, and the system recovers to the standardglass state. The enthalpy loss (ΔH) of HQG during dynamicheating from room temperature to the onset temperature ofthe supercooled liquid or isothermal annealing can be preciselydetermined by two runs of Cp measurements as shown in theinset of Figure 23a.The higher potential energy configurations trapped by
hyperquenching relax more rapidly than those trapped by slowquenching, and hence, the former one is involved in the βrelaxation as shown in Figure 23b. All the potential energystates over the temperature range from Tf of the HQG to thatof the STG could be observed in a real-time window duringthe subsequent enthalpy recovery procedure. Thus, we mayfind the characteristics of β relaxation in glasses. The HADapproach makes the β relaxation more visible and moreseparable from the α relaxation. The potential energy of a glasscan be excited or rejuvenated via different ways such ashyperquenching, ball-milling, and mechanical stretching, andthe excited glass can relax again upon sub-Tg annealing. Thepath of the enthalpy relaxation is different from one system toanother, thus providing thermodynamic, dynamic, andstructural information on a glass system. The bottom part ofthe PEL can be accessed by extremely slow cooling or bymolecule-by-molecule deposition. Fabrication of ultrastableglasses by molecular deposition can suppress the potentialenergy of a glass to a level corresponding to thousands of yearsof annealing or cooling. In addition, the question aboutwhether an ideal glass state (Figure 23b) exists at finitetemperature is still under debate.2−4,94,239,240,245,271,275 Accord-ing to the MYEGA model, the configurational entropy vanishesonly when the temperature approaches zero. The crystal stateis seen at the lowest level of the PEL (Figure 23b).A systematic study of the heterogeneous relaxation dynamics
of a glass system was carried out by Diezemann et al. based onthe PEL picture.276−279 Their investigations concentrated onlinking the molecular reorientation by means of transitionsamong an extensive number of free energy minima in PEL toboth α and β relaxations. First, by studying the heterogeneityof α relaxation in glass-forming liquids, a free energy landscapemodel was proposed in which the molecular reorientation rates(rotational relaxation) were intrinsically linked to the timescale of the α relaxation (structural relaxation).276 The modelwas further improved by including the translational dynamicsof the supercooled liquids.277 The simulated aging of anonequilibrium state by quenching from infinitely hightemperature to low temperature was investigated based on aqualitative description of the physics inherent in the free-energy model.278 They found that the time scale for re-equilibration is solely determined by that of the α relaxation.Although the proposition of the free energy landscape modelhas brought our understanding of the heterogeneous dynamicsof the α relaxation significantly forward, the β relaxation
Chemical Reviews Review
DOI: 10.1021/acs.chemrev.8b00510Chem. Rev. XXXX, XXX, XXX−XXX
X

process has been largely ignored.280−282 Diezemann et al.279
improved the abovementioned free energy landscape model byincluding β relaxation. Their modeling results agreed well withthe experimental results of dielectric relaxation and spin−lattice relaxation. An analytically solvable PEL model of α andβ relaxation was reported by Mauro and Smedskjaer,283
showing a natural decoupling of the dynamics into intra-metabasin (β) and intermetabasin (α) relaxation processes.The quantitative energy landscape model for a glass-forming
system with a realistic chemistry was established by Mauro andLoucks284 using ab initio-derived interatomic potentials forselenium.285 Their approach enabled calculation of glasstransition and relaxation behavior on laboratory time scales,taking advantage of the broken ergodic nature of the glassystate.109 Since the landscape was calculated under isobaricrather than isochoric conditions, it is actually an enthalpylandscape286 rather than a PEL. A detailed review of theenthalpy landscape description of the glass transition is givenelsewhere.75 The enthalpy landscape or PEL in a real liquidsystem may be partially mapped by HAD measurements asdisplayed in Figure 23 and described in a recent paper.4
In the following section, we review some studies of the sub-Tg enthalpy relaxation behavior of several glass systems byHAD and describe the relaxation dynamics of the glasseswithin the PEL framework.4.1.2. Hyperquenched Glasses. 4.1.2.1. Sub-Tg Anneal-
ing. Hyperquenched (HQ) glasses are those that form using anextremely high cooling rate (>105 K/s) via different routessuch as the melt spinning process15,162,287 and electrosprayquenching process.288 Such a high cooling rate causes theliquid structure to be frozen at a high Tf in a high potentialenergy region of the PEL and, hence, create a glassy state farfrom equilibrium.273 During sub-Tg annealing, the trappedenergy will be gradually released, resulting in a decrease in theTf.
289 Structural and energetic heterogeneities can also bedetected during this relaxation process.Enthalpy relaxation in HQ glasses has received much
attention.175,288,290 Over the past two decades, Yue et al.have conducted systematic and detailed calorimetric studies onthe sub-Tg enthalpy relaxation in different kinds of HQ glassesincluding oxide glass fibers, metallic glasses, organic glasses,and water by using the hyperquenching-annealing-DSC(HAD) strategy.14,15,162,287,291,292 The HAD method exploresthe thermodynamics, kinetics, and structural evolution ofglasses and supercooled liquids in the temperature regionbetween Tg and Tf. Here we demonstrate several intriguingfeatures regarding the enthalpy relaxation of the HQ glassesrelative to that of the standard glass (i.e., a glass cooled at thestandard rate of 10 K/min to 20 K/min),162,175 which providesinsight into the evolution process of a HQ glass relaxing from ahigh to low energy state in the PEL.Figure 24 shows a typical sub-Tg enthalpy relaxation pattern
of a HQ glass system (namely, stone wool fibers withaluminosilicate composition) cooled at a rate of about 106
K/s; the pattern was obtained during the first and second DSCupscans (Cp1 and Cp2), respectively.
162 The exothermic peakon the Cp1 curve indicates the release of the excess enthalpy ofthe HQ glass relative to the standard glass upon dynamicheating.14,15,162,287,288,291,292 The enthalpy release is alsoconsidered to be an enthalpy recovery process, i.e., a recoveryfrom the enthalpy of HQ glass to that of the standard glass.The inset of Figure 24 displays the rate of the excess energyrelease of the HQ glasses, dΔE/dT,291 which is equal to the
difference Cp1 − Cp2 between the HQ and the standard glasses,Cp,exc, as a function of temperature T. Tre is the onsettemperature of the energy release, while Teq is the offsettemperature of the glass transition, at which Cp1 = Cp2. Theasymmetric Cp,exc curve with a shoulder at Ts implicitly suggeststhat the α relaxation (represented by the main peak rightbelow Tg) and the β relaxation (reflected by the Cp,exc partbelow Ts) overlap with each other.291,292 The direct link of thesub-Tg enthalpy relaxation to α and β relaxations was examinedby studying the DSC relaxation patterns of glass fibers withdifferent chemical compositions and thereby differentfragilities.293
The sub-Tg relaxation is explicitly expressed by the variationof the Cp curves of the HQ glasses subjected to differentannealing degrees, i.e., different temperatures (Ta) below Tg fordifferent annealing times (ta).
14,291−294 The effect of Ta onenthalpy relaxation is similar to that of ta. Figure 25 shows theeffect of Ta on the Cp curves of the basaltic HQ glasses for ta =8 days.294 The methodology for determining the magnitude of
Figure 24. Isobaric heat capacity of HQ stone wool fibers againsttemperature (T), measured at 20 K/min during the first (Cp1) and thesecond DSC upscan (Cp2), respectively. Inset: the excess of the heatcapacity (Cp,exc = Cp2 − Cp1) versus T. Tre stands for the onsettemperature for the release of enthalpy, and Teq is the equilibriumtemperature, at which the glass is fully converted to the supercooledliquid, and Cp2 = Cp1. Ts refers to the temperature at which anenthalpy release shoulder appears, indicating that there is a partialoverlap of two enthalpy release peaks. Replotted with permission fromref 162. Copyright 2002 Elsevier B.V.
Figure 25. Cp curves of a HQ glass (stone wool fibers quenched at 106
K/s) annealed at different temperatures (Ta) for ta = 8 days obtainedfrom the first DSC upscan at a heating rate of 20 K/min. Adaptedfrom ref 294 with permission. Copyright 2009 Shandong UniversityPublisher.
Chemical Reviews Review
DOI: 10.1021/acs.chemrev.8b00510Chem. Rev. XXXX, XXX, XXX−XXX
Y

the excess enthalpy trapped in hyperquenched glasses is tocalculate the area enclosed by Cp2 and Cp1 curves. The excessenthalpy (ΔH) decreases with increasing Ta in the manner thatits onset temperature (Tre) shifts from a lower to a highertemperature. In other words, the structural configuration of theglass system approaches a lower energy level in order to attainthe energy level corresponding to Ta with annealing, but thistakes a long time, even beyond the experimental time windowif Ta is well below Tg. Similar findings regarding sub-Tgenthalpy relaxation were also reported in other HQ glasses,e.g., inorganic glass fibers15,81,162,291−293,295,296 and metallicglasses.297−299 Tre depends on the hyperquenching rate (qc)and thus on the Tf of the HQ glass.81
In addition, another important feature of the relaxationpattern of the annealed HQ glass is the occurrence of theendothermic prepeak followed by an exotherm (curves C−I inFigure 26a), indicating a high degree of structural hetero-geneity of the HQ glass;14,81,293,294,296,300 that is, duringannealing, the system accesses a deeper basin in the PEL.
Owing to fluctuations in the glass system, some local domainsmay reside in energy states lower than that of the standardglass. Thus, in the subsequent DSC upscan, additional energyis needed for these local domains to rejuvenate to the standardstate, resulting in the prepeak. The prepeak can be greatlyenhanced and shifts to a higher temperature, merging with theglass transition overshoot by further increasing Ta or extendingta.
81,292,293,296 Remarkably, the prepeak appears even when theHQ glass undergoes a very short ta, e.g., 8 min annealing at Tabelow Tg as shown in Figure 26b. The ta dependence of theprepeak area of Cp,endo is plotted, and the inset demonstrateshow Cp,endo is obtained.Yue and Angell studied the glass transition behavior of water
by comparison with the sub-Tg relaxation behavior of two HQoxide glasses.14,301 They argued that the glass transition around136 K was likely attributed to the annealing-induced prepeak,which is also termed a “shadow” glass transition in terms ofboth the jump in Cp at Tg and the activation energy of theapparent glass transition endotherm.14 However, it should benoted that the assignment Tg of water is still underdebate259,261 since the glass transition of water could not bedirectly probed due to the intervention of strong crystallizationin the temperature region often referred to as “No-Man’sLand”. Moreover, the correlation between the endothermicprepeak and the structural heterogeneity is reviewed in Section4.3.1.The nonexponential decay of the enthalpy relaxation can be
described by fitting the enthalpy data (i.e., the remainingenthalpy in the HQ glasses after annealing, normalized by thetotal released enthalpy) to the stretched exponential function,also known as the Kohlrausch−Williams−Watts (KWW)function,302−304 from which both the Ta-dependent relaxationtime τ and the stretching exponent β can be obtained.162,295,296
The β value describes the breadth of the relaxation timedistribution, reflecting the heterogeneous dynamics of thesystem. By determining the activation energy for the sub-Tgenthalpy relaxation in the HQ glasses through the relationshipbetween the τ and Ta, Guo et al.296 inferred that the enthalpyrecovery during annealing is mainly due to secondaryrelaxation.The abovementioned sub-Tg enthalpy relaxation concerns
relatively fragile glass systems. It has been found that the liquidfragility has a profound impact on the enthalpy relaxationbehavior in the HQ glasses.274,305,306 Here we take the HQGeO2 glass as an example of a glass derived from a strongliquid, as shown in Figure 27.274 First, in contrast to theannealed HQ fragile system, the annealed HQ GeO2 glassexhibits no distinct sub-Tg prepeak in the Cp curve,
274 implyingthat the strong glass systems involve lower nonexponentialityand less structural heterogeneity.78 Second, the HQ GeO2 glassshows a decrease in the sub-Tg exothermic peak area (i.e., theexcess enthalpy ΔH) along the y-axis with increasing theannealing degree, i.e., increasing either Ta or ta (Figure 27),whereas a fragile system displays a decrease of the exothermicpeak area along the x-axis (Figures 25 and 26). This indicatesthe different coupling modes of α and β relaxations uponannealing. Driven by the thermal kinetic energy, GeO4tetrahedra collaboratively adjust themselves from their HQ-excited higher energy positions to lower energy and morestable positions. During this process, these structural units arestill connected with each other and therefore are influenced byeach other, indicating that the cooperative relaxation is auniversal feature of strong glass formers.
Figure 26. Impact of sub-Tg annealing time (ta) on the sub-Tgenthalpy relaxation in the stone wool fibers (Tg = 944 K) quenched at106 K/s. (a) Cp curves (obtained from the first DSC upscans at 20 K/min) of the samples annealed at 723 K for various ta. Black thickcurve: the second upscan Cp curve obtained at 20 K/min. The broadCp peaks above the black curve are termed the prepeak. Inset: The tadependence of the remaining excess enthalpy (ΔHrem) after annealing,normalized by the total released enthalpy (ΔHtot), ΔHrem/ΔHtot. (b)The excess of the heat capacity (Cp,endo) of the HQ glass annealed atTa = 823 K for various ta over that of the “standard glass” within theprepeak region against the upscanning temperature (T). Note: theprepeak (Cp,endo) is contrary to the exothermic peak (Cp,exc). All theup and downscans were conducted at 20 K/min. Inset: the Cp curvesfor both the standard glass (the second upscan curve) and the 58 min-annealed HQ glass (the first upscan curve). The prepeak is indicatedby the dashed box, and the sub-Tg exotherm and the glass transitionendotherm are illustrated. Reproduced with permission from refs 14and 301. Copyright 2004, 2005 Nature Publishing Group.
Chemical Reviews Review
DOI: 10.1021/acs.chemrev.8b00510Chem. Rev. XXXX, XXX, XXX−XXX
Z

4.1.2.2. Modeling. As reviewed above, DSC is a sensitivemethod to capture the features of sub-Tg enthalpy relaxation inHQ glasses. However, to gain insights into these effects, it iscrucial to establish and apply physical models to simulate orpredict the DSC patterns of both HQ glasses and annealed HQglasses. So far, development of such models has beenchallenging because of the complexity of the enthalpyrelaxation in HQ glasses compared to slowly cooled glasses.As is known, numerous researchers have been making efforts todevelop phenomenological or physical models for predictingthe Cp curves of the glasses. These efforts have led toremarkable success. For instance, the Tool−Narayanaswamy−Moynihan (TNM) model70,166,289 and the Adam−Gibbs−Scherer (AGS)92,177 model have been applied to predict the Cpcurves of slowly cooled glasses, which are in good agreementwith those determined by DSC. On the one hand, the twomodels have different expressions for the nonlinear relaxationfunction; that is, the TNM model adopts Narayanaswamy’snonlinear function,166 whereas the AGS model includes theAdam−Gibbs function.92 On the other hand, both modelshave similarities in two aspects: (1) the response function ofthe system can be represented by a stretched exponentialfunction; (2) the relaxation time depends not only on realtemperature T but also on Tf. However, both models failed topredict or reproduce the Cp curves for both HQ glasses andpartially annealed HQ glasses. This was confirmed by themodeling work of Huang and Gupta in 1992 on the sub-Tgenthalpy relaxation in thin glass fibers.175,307,308 Later on,several research groups attempted to develop phenomeno-logical or physical models for describing the sub-Tg enthalpyrelaxation in HQ glasses. In this regard, two modeling studiesshould be mentioned, which enhanced the understanding ofthe sub-Tg enthalpy relaxation in HQ glasses, as describedbelow.The first modeling study of the sub-Tg relaxation in HQ
glasses was reported by Giovambattista et al.309,310 Theysucceeded in mimicking the difference in enthalpy relaxationbetween standard and HQ glasses by performing the moleculardynamics (MD) simulations using the extended simple pointcharge potential. They also obtained the isochoric heatcapacity (Cv) curves for the HQ glassy water and the annealedHQ glassy water, which are quite similar to the Cp curvesdetermined by DSC. Even the endothermic prepeak (Section4.1.2) can be reproduced by the MD simulation for the sub-Tg
annealed HQ glasses. The second modeling study wasconducted by Hornboell et al. on the HQ glass fibers.311 Tocreate the DSC Cp curves, they made the following two majormodifications to the TNM model.311
First, they proposed a composite relaxation function (CRF)to replace the Kohlrausch function. The CRF is written asM(ξ) = exp(−ξβc − ξ), where ξ is the reduced time, i.e., theannealing time normalized by the characteristic relaxation time,and βc is a fitting parameter. This function describes two well-separated distributions of relaxation time. It should be notedthat the Kohlrausch parameter β and the CRF βc parameterhave different meanings. β defines the stretching extent of therelaxation time distribution, whereas the CRF βc does notalone determine the relaxation time distribution, and instead,the sum of ξβc and ξ determines it. Moreover, βc decreases withincreasing Tf.Second, the difference in Cp between glass and liquid was
considered to be a temperature dependent variable (ΔCp) inconstructing the relaxation function, and this is in contrast tothe Adam−Gibbs’ treatment, where ΔCp is treated as atemperature independent constant. Based on these modifica-tions, Hornboell et al. obtained the Cp curves for both freshHQ glasses (Figure 28a) and the sub-Tg annealed HQ glasses
(Figure 28b), which are in good agreement with thosedetermined by DSC. As shown in Figure 28b, the newapproach can also predict the occurrence of the endothermicprepeak. To further increase the modeling accuracy, Zhang etal.312 considered the difference between the initial annealingand the entire annealing process of HQ glasses. It was shownthat the multiexponential relaxation mechanisms for the initialannealing process are crucial for capturing more subtlerelaxation processes.As discussed in detail by Mauro et al.,200 the TNM model is
unable to capture the relaxation kinetics of glasses over a widerange of fictive temperatures using a common set ofparameters. The limitation is because of the phenomenologicalfunctional form assumed by the TNM for the Tf dependence ofthe relaxation time. This issue was addressed by the newMauro−Allan−Potuzak (MAP) model for the nonequilibriumdynamics of glasses.163,200 The MAP model was proposed
Figure 27. Isobaric heat capacity curves of HQ GeO2 glasses (fibers)annealed at 565 K (well below Tg = 792 K) for different durations(ta). Reproduced with permission from ref 274. Copyright 2008American Chemical Society.
Figure 28. Modeled Cp curves for the HQ E-glass (a) and the HQglass annealed at 800 K for various durations (b). The DSC upscanrate is 20 K/min. Reproduced with permission from ref 311.Copyright 2010 Elsevier B.V.
Chemical Reviews Review
DOI: 10.1021/acs.chemrev.8b00510Chem. Rev. XXXX, XXX, XXX−XXX
AA
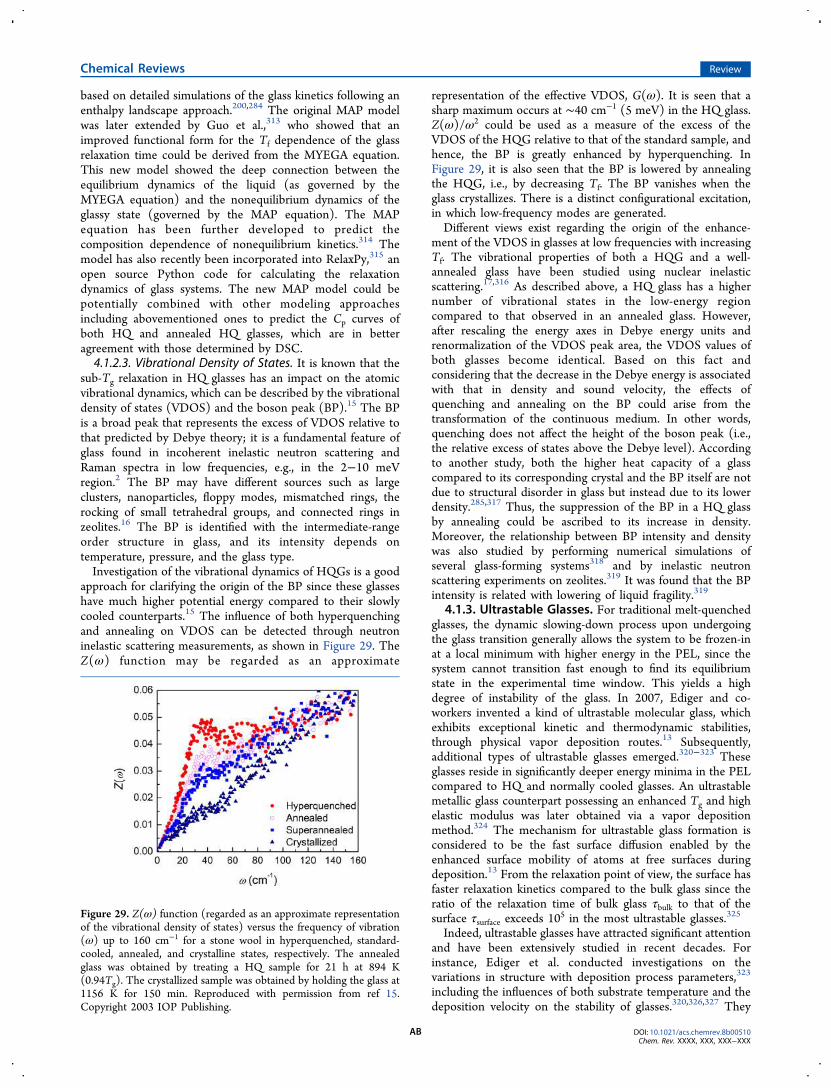
based on detailed simulations of the glass kinetics following anenthalpy landscape approach.200,284 The original MAP modelwas later extended by Guo et al.,313 who showed that animproved functional form for the Tf dependence of the glassrelaxation time could be derived from the MYEGA equation.This new model showed the deep connection between theequilibrium dynamics of the liquid (as governed by theMYEGA equation) and the nonequilibrium dynamics of theglassy state (governed by the MAP equation). The MAPequation has been further developed to predict thecomposition dependence of nonequilibrium kinetics.314 Themodel has also recently been incorporated into RelaxPy,315 anopen source Python code for calculating the relaxationdynamics of glass systems. The new MAP model could bepotentially combined with other modeling approachesincluding abovementioned ones to predict the Cp curves ofboth HQ and annealed HQ glasses, which are in betteragreement with those determined by DSC.4.1.2.3. Vibrational Density of States. It is known that the
sub-Tg relaxation in HQ glasses has an impact on the atomicvibrational dynamics, which can be described by the vibrationaldensity of states (VDOS) and the boson peak (BP).15 The BPis a broad peak that represents the excess of VDOS relative tothat predicted by Debye theory; it is a fundamental feature ofglass found in incoherent inelastic neutron scattering andRaman spectra in low frequencies, e.g., in the 2−10 meVregion.2 The BP may have different sources such as largeclusters, nanoparticles, floppy modes, mismatched rings, therocking of small tetrahedral groups, and connected rings inzeolites.16 The BP is identified with the intermediate-rangeorder structure in glass, and its intensity depends ontemperature, pressure, and the glass type.Investigation of the vibrational dynamics of HQGs is a good
approach for clarifying the origin of the BP since these glasseshave much higher potential energy compared to their slowlycooled counterparts.15 The influence of both hyperquenchingand annealing on VDOS can be detected through neutroninelastic scattering measurements, as shown in Figure 29. TheZ(ω) function may be regarded as an approximate
representation of the effective VDOS, G(ω). It is seen that asharp maximum occurs at ∼40 cm−1 (5 meV) in the HQ glass.Z(ω)/ω2 could be used as a measure of the excess of theVDOS of the HQG relative to that of the standard sample, andhence, the BP is greatly enhanced by hyperquenching. InFigure 29, it is also seen that the BP is lowered by annealingthe HQG, i.e., by decreasing Tf. The BP vanishes when theglass crystallizes. There is a distinct configurational excitation,in which low-frequency modes are generated.Different views exist regarding the origin of the enhance-
ment of the VDOS in glasses at low frequencies with increasingTf. The vibrational properties of both a HQG and a well-annealed glass have been studied using nuclear inelasticscattering.17,316 As described above, a HQ glass has a highernumber of vibrational states in the low-energy regioncompared to that observed in an annealed glass. However,after rescaling the energy axes in Debye energy units andrenormalization of the VDOS peak area, the VDOS values ofboth glasses become identical. Based on this fact andconsidering that the decrease in the Debye energy is associatedwith that in density and sound velocity, the effects ofquenching and annealing on the BP could arise from thetransformation of the continuous medium. In other words,quenching does not affect the height of the boson peak (i.e.,the relative excess of states above the Debye level). Accordingto another study, both the higher heat capacity of a glasscompared to its corresponding crystal and the BP itself are notdue to structural disorder in glass but instead due to its lowerdensity.285,317 Thus, the suppression of the BP in a HQ glassby annealing could be ascribed to its increase in density.Moreover, the relationship between BP intensity and densitywas also studied by performing numerical simulations ofseveral glass-forming systems318 and by inelastic neutronscattering experiments on zeolites.319 It was found that the BPintensity is related with lowering of liquid fragility.319
4.1.3. Ultrastable Glasses. For traditional melt-quenchedglasses, the dynamic slowing-down process upon undergoingthe glass transition generally allows the system to be frozen-inat a local minimum with higher energy in the PEL, since thesystem cannot transition fast enough to find its equilibriumstate in the experimental time window. This yields a highdegree of instability of the glass. In 2007, Ediger and co-workers invented a kind of ultrastable molecular glass, whichexhibits exceptional kinetic and thermodynamic stabilities,through physical vapor deposition routes.13 Subsequently,additional types of ultrastable glasses emerged.320−323 Theseglasses reside in significantly deeper energy minima in the PELcompared to HQ and normally cooled glasses. An ultrastablemetallic glass counterpart possessing an enhanced Tg and highelastic modulus was later obtained via a vapor depositionmethod.324 The mechanism for ultrastable glass formation isconsidered to be the fast surface diffusion enabled by theenhanced surface mobility of atoms at free surfaces duringdeposition.13 From the relaxation point of view, the surface hasfaster relaxation kinetics compared to the bulk glass since theratio of the relaxation time of bulk glass τbulk to that of thesurface τsurface exceeds 10
5 in the most ultrastable glasses.325
Indeed, ultrastable glasses have attracted significant attentionand have been extensively studied in recent decades. Forinstance, Ediger et al. conducted investigations on thevariations in structure with deposition process parameters,323
including the influences of both substrate temperature and thedeposition velocity on the stability of glasses.320,326,327 They
Figure 29. Z(ω) function (regarded as an approximate representationof the vibrational density of states) versus the frequency of vibration(ω) up to 160 cm−1 for a stone wool in hyperquenched, standard-cooled, annealed, and crystalline states, respectively. The annealedglass was obtained by treating a HQ sample for 21 h at 894 K(0.94Tg). The crystallized sample was obtained by holding the glass at1156 K for 150 min. Reproduced with permission from ref 15.Copyright 2003 IOP Publishing.
Chemical Reviews Review
DOI: 10.1021/acs.chemrev.8b00510Chem. Rev. XXXX, XXX, XXX−XXX
AB

found that the most stable glass can be formed by vapordepositing onto a substrate of about 0.85Tg, and lowerdeposition rates enhance the kinetic stability and lower theenthalpy of the glass.13,326,328
Using DSC, both the kinetic and thermodynamic stabilitiesof ultrastable glasses can be evaluated from the onsettemperature for molecular mobility and the fictive temperatureTf, respectively. The Tf is determined from the enthalpy of theultrastable glass, which can indirectly reflect the location depthof the system in the PEL. Figure 30 shows the DSC data for
the TNB glass vapor-deposited onto a substrate at 296 K.Clearly, TNB glass has a substantially higher onset glasstransition temperature Tg (363 K), much higher than that ofthe ordinary melt-quenched glass and even higher than that ofthe ordinary glass annealed at 328 K for 15 days. The higher Tgof the deposited glass implies its extremely high kineticstability13,320,326,327 since more thermal energy is required toovercome the energy barriers to dislodge molecules from theiroriginal configurations, i.e., lower minima, in PEL. Further-more, the deposition process also improves the thermody-namic stability of TNB glass, as confirmed by the enhancedendotherm in the Cp curve compared to those of the ordinaryaged samples.13,320,326,327 This is because the deposited glassresides in the lowest minima in the PEL; as the sample isheated during DSC upscan, more energy is required toovercome different saddle points to transform the glass intosupercooled liquids. The energy needed to transform the glassinto the supercooled liquid quantifies the thermodynamicstability of the glasses.As described above, the ultrastable glasses have highly
efficient noncrystalline packing and reside in a much lowerregion of the PEL. It has been estimated that a glass preparedby melt-quenching would require thousands of years of agingto achieve the properties of a glass vapor-deposited onto asubstrate at 0.85Tg.
320 An interesting question arises: if thedeposited glass is already ultrastable, does it relax further? Yuet al. performed in situ dielectric measurements to compare therelaxation dynamics between the ordinary glass and the as-deposited stable toluene glass.329 As expected, the β relaxationof the deposited glass is highly suppressed due to the fact that
the ultrastable glass with highest kinetic stability is already veryclose to the long-sought “ideal glass” in terms of potentialenergy.329
In this case, can annealing at a temperature above Tg inducerelaxation of the ultrastable glass? If so, in what manner does itrelax? Before answering these questions, we first consider oneof the intriguing features in the Cp curve of the ultrastable glass,viz., the occurrence of the double-peaked pattern for thetransformation from the low-enthalpy glass to higher enthalpysupercooled liquid.320 This double-peaked pattern suggests theexistence of two different noncrystalline packings with differentstabilities in this system. That is, during the DSC upscan, thetransformation of the glass to liquid results from two differenttypes of molecular packing.Therefore, studying the relaxation of the ultrastable glasses is
an effective route to understand the polyamorphism in a glass-forming system. A typical example of the heat capacities Cp forvapor-deposited indomethacin glasses is shown in Figure 31,330
which illustrates that the double-peaked pattern (enthalpyovershoots in Cp curve) strongly depends on the depositionrate. The area ratio of the lower temperature peak to the highertemperature peak decreases with decreasing deposition rate,implying an increase in the degree of high-stability packing. Fora specific glass system, the critical deposition rates forobtaining glasses with higher or lower stability packing canbe determined from the double-peaked structure.331
Sepulveda et al. conducted a systematic study on the sup-Tgrelaxation (i.e., relaxation above Tg) of vapor-depositedultrastable glassy films of toluene.331 Figure 32 shows the Cpcurves of the stable vapor-deposited toluene films annealed atdifferent temperatures above Tg for different times ta.
331 Itshould be noted that the original vapor-deposited toluene films
Figure 30. Isobaric heat capacity (Cp) versus temperature for the 1,3-bis-(1-naphthyl)-5-(2-naphthyl)benzene (TNB) glass produced bydifferent methods: vapor deposited at a rate of ∼5 nm/s directly intoa DSC pan at 296 K (curve 1); the as-produced ordinary glass viacooling the liquid at 40 K/min (curve 2); ordinary glass annealed at296 K for 174 days (curve 3), 328 K for 9 days (curve 4), and 328 Kfor 15 days (curve 5), respectively. Inset: structure of TNB.Reproduced with permission from ref 13. Copyright 2008 theAmerican Association for the Advancement of Science.
Figure 31. Isobaric heat capacities (Cp) for vapor-depositedindomethacin glasses, which were produced by different depositionrates: 70 Å/s (dotted, red), 8 Å/s (dash-dot, green), and 2 Å/s (dash-dot-dot, blue), measured by conventional DSC. The substratetemperature was 265 K for each deposition. Solid black line:Ordinary indomethacin glass, produced by cooling the liquid at ∼40K/min. The determination of the onset temperature of the glasstransition, Tonset, is illustrated for the 2 Å/s deposited glass (as anexample), and Tonset is the temperature of the intercept between theextrapolated glass Cp curve and the tangent line of the rapidly risingCp (dashed black lines). Reproduced with permission from ref 330.Copyright 2008 American Chemical Society.
Chemical Reviews Review
DOI: 10.1021/acs.chemrev.8b00510Chem. Rev. XXXX, XXX, XXX−XXX
AC
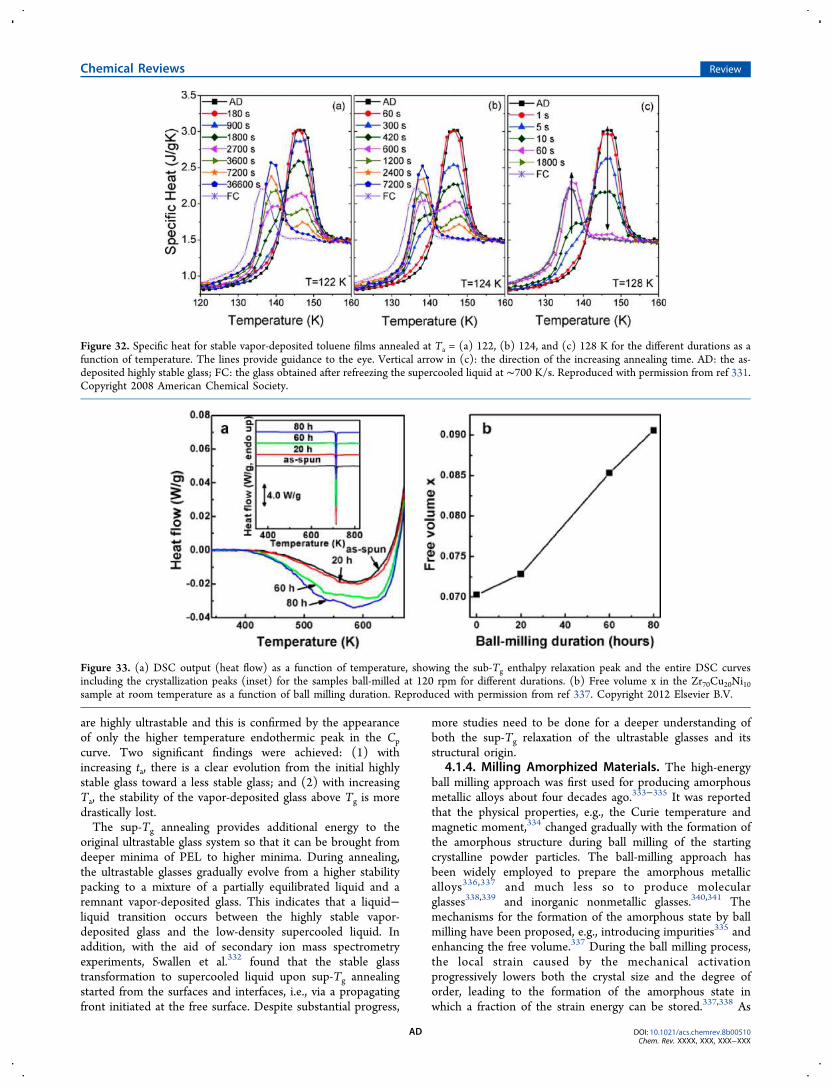
are highly ultrastable and this is confirmed by the appearanceof only the higher temperature endothermic peak in the Cpcurve. Two significant findings were achieved: (1) withincreasing ta, there is a clear evolution from the initial highlystable glass toward a less stable glass; and (2) with increasingTa, the stability of the vapor-deposited glass above Tg is moredrastically lost.The sup-Tg annealing provides additional energy to the
original ultrastable glass system so that it can be brought fromdeeper minima of PEL to higher minima. During annealing,the ultrastable glasses gradually evolve from a higher stabilitypacking to a mixture of a partially equilibrated liquid and aremnant vapor-deposited glass. This indicates that a liquid−liquid transition occurs between the highly stable vapor-deposited glass and the low-density supercooled liquid. Inaddition, with the aid of secondary ion mass spectrometryexperiments, Swallen et al.332 found that the stable glasstransformation to supercooled liquid upon sup-Tg annealingstarted from the surfaces and interfaces, i.e., via a propagatingfront initiated at the free surface. Despite substantial progress,
more studies need to be done for a deeper understanding ofboth the sup-Tg relaxation of the ultrastable glasses and itsstructural origin.
4.1.4. Milling Amorphized Materials. The high-energyball milling approach was first used for producing amorphousmetallic alloys about four decades ago.333−335 It was reportedthat the physical properties, e.g., the Curie temperature andmagnetic moment,334 changed gradually with the formation ofthe amorphous structure during ball milling of the startingcrystalline powder particles. The ball-milling approach hasbeen widely employed to prepare the amorphous metallicalloys336,337 and much less so to produce molecularglasses338,339 and inorganic nonmetallic glasses.340,341 Themechanisms for the formation of the amorphous state by ballmilling have been proposed, e.g., introducing impurities335 andenhancing the free volume.337 During the ball milling process,the local strain caused by the mechanical activationprogressively lowers both the crystal size and the degree oforder, leading to the formation of the amorphous state inwhich a fraction of the strain energy can be stored.337,338 As
Figure 32. Specific heat for stable vapor-deposited toluene films annealed at Ta = (a) 122, (b) 124, and (c) 128 K for the different durations as afunction of temperature. The lines provide guidance to the eye. Vertical arrow in (c): the direction of the increasing annealing time. AD: the as-deposited highly stable glass; FC: the glass obtained after refreezing the supercooled liquid at ∼700 K/s. Reproduced with permission from ref 331.Copyright 2008 American Chemical Society.
Figure 33. (a) DSC output (heat flow) as a function of temperature, showing the sub-Tg enthalpy relaxation peak and the entire DSC curvesincluding the crystallization peaks (inset) for the samples ball-milled at 120 rpm for different durations. (b) Free volume x in the Zr70Cu20Ni10sample at room temperature as a function of ball milling duration. Reproduced with permission from ref 337. Copyright 2012 Elsevier B.V.
Chemical Reviews Review
DOI: 10.1021/acs.chemrev.8b00510Chem. Rev. XXXX, XXX, XXX−XXX
AD

shown in Figure 33, a pronounced sub-Tg relaxation peakappears during a DSC upscan of the ball-milling derivedmetallic glass (Zr70Cu20Ni10).
337 The exothermic peakbecomes larger with the increasing milling time, implyingthat more and more energy was introduced into the metallicglass by the ball milling process. That is, the ball-millingprocess brought the metallic glass to a higher energy state inthe PEL with a higher Tf.
3,94 The ball milling technique canboth induce amorphization of crystals and convert a standardglass state to an excited state with the relaxation features of aHQ glass, i.e., having a higher Tf. A typical example is theindomethacin glass; after 6-day annealing at 25 °C, theenthalpy released during annealing can be rejuvenated by thehigh energy cryomilling.339
As reviewed in Section 4.1.2, the sub-Tg endothermicprepeak in the Cp curve prior to the exothermic peak is one ofthe typical features of the annealed fragile HQglasses.14,81,293,294,296,300 Likewise, the sub-Tg endothermicprepeaks were also observed in the Cp curves of the ballmilling amorphized solids after annealing, e.g., the amorphoustrehalose339 and the amorphous Ag3PS4.
341 Moreover, theendothermic prepeak gradually shifts to a higher temperatureuntil it merges with the glass transition overshoot, resulting in asignificant increase of the glass transition peak, with increasingthe degree of annealing.339 Note that for the molecular glasses,the higher energy amorphous state can be achieved by ballmilling either from a crystalline or an amorphous state withlower energy state.339
A striking relaxation phenomenon was found by Kim etal.;338 that is, the sub-Tg endothermic prepeak appeared in theCp curve of the as-milled glassy starch without any annealing,but it increased with the increasing milling time. This is quitedifferent from the enthalpy relaxation in the HQ glass. Thedifference is attributed to the fact that the structure of theglassy starch formed by milling is much more heterogeneousthan the HQ glass. The real dynamics behind the appearanceof the endothermic prepeak during ball milling needs furtherexperimental verification.Ang et al. reported the sub-Tg enthalpy relaxation in a
milling amorphized chalcogenide.341 The enthalpy relaxationin the milling amorphized Ag3PS4 (Figure 34) was found tosignificantly differ from that of the HQ oxide glasses (Figure35) in three aspects. First, two decoupled peaks were observed(rather than one) due to the energy released in the Cp curve ofthe amorphous Ag3PS4. The two peaks were linked to the βand α relaxations, respectively, corresponding to differentmicrostructures. Second, the occurrence of the endothermicprepeaks with a high degree of annealing indicates the highnonexponentiality of the sub-Tg enthalpy relaxation and, thus,the high structural heterogeneity of the milling amorphizedAg3PS4. Third, the weaker bonds in the amorphouschalcogenides compared to oxide glasses (Figure 34) resultedin the release of its excess energy at a temperature even belowthe onset temperature of the dynamic heating induced energyrelease peak.Despite some progress in understanding the ball-milling
induced amorphization, several key questions remain. Forinstance, how does the ordered structure evolve into thedisordered structure during high-energy ball milling? What isthe glass formation mechanism when cryomilling an annealedsample? How will the cryomilled sample, i.e., the rejuvenatedsample from the annealed one, relax below Tg? Answeringthese questions will serve as interesting topics for future
research. In fact, it is still an open issue whether these millingderived materials are glassy, or purely amorphous, since theydo not show α-relaxation, a glass transition event, and viscousflow. To the best of our knowledge, there is no report showinga clear glass transition peak in a DSC curve of milling-amorphized chalcogenides. It is still a challenge to directlyaccess the viscosities of these materials above the onsettemperature of recrystallization.
4.1.5. Stretched Glasses. Anisotropy in glass can beinduced by application of external stresses or compression inglass melts that may be frozen-in by cooling under load.342−345
For instance, a certain degree of preferred structuralorientation along the direction of the glass fibers can begenerated by the axial stresses during the hyperquenchingprocess.342 Mechanical quenching (i.e., slowly cooling underuniaxial compression) from a temperature above Tg can lead toa frozen-in anisotropic structure in a glass cylinder.343 If thepressure is sufficiently high, non-Newtonian flow, i.e., shearthinning, can occur.345 The anisotropy in the metallic glass isusually caused by the residual stresses developed during a rapidquenching process.346 The laser light can also give rise tooptical anisotropy in glass.347
Glass fibers undergo both thermal quenching and mechan-ical stretching during the fiber draw process. The enthalpyrelaxation of glass fibers has been extensively studied by means
Figure 34. Annealing time (ta) dependences of the excess heatcapacity ΔCp,exc, which is the difference in Cp between the second andthe first DSC upscans, for the amorphous Ag3PS4 samples annealed atthe temperatures (Ta) of 400 K (part a) and 440 K (part b). Insets:The ta dependence of the remaining excess enthalpy (ΔHrem) afterannealing, normalized by the total released enthalpy (ΔHtot), ΔHrem/ΔHtot, of the samples heated to 400 K (part a) and 440 K (part b),respectively.341 Red solid curves: fits of the ΔHrem/ΔHtot data to theKWW function. Reproduced with permission from ref 341. Copyright2016 the American Ceramic Society.
Chemical Reviews Review
DOI: 10.1021/acs.chemrev.8b00510Chem. Rev. XXXX, XXX, XXX−XXX
AE

of the HAD method (Section 4.1.1). However, only a fewstudies have been performed with regard to anisotropyrelaxation in glass fibers and its impact on enthalpyrelaxation.342,348−350
Anisotropy in glass is mainly characterized by opticalbirefringence. The sub-Tg anisotropic relaxation, also calledbirefringence relaxation, in oxide glass fibers, was studied by Luet al.348 They proposed a phenomenological-modifiedstretched exponential to describe the time-dependentbirefringence relaxation. To quantitatively evaluate thecontribution of relaxation in stretching-induced anisotropy tothe total enthalpy relaxation of the glass fibers, Martin et al.349
conducted a DSC study on the enthalpy relaxation in amechanically stretched calcium metaphosphate glass rod withone-dimensional (chain-like) network structure, i.e., in a glassrod that was stretched using a given stress at a temperatureslightly above Tg and then cooled slowly. They found that themechanically induced excess enthalpy increases with increasingtensile stress.349 The energy release caused by the anisotropyrelaxation of the isothermally stretched silicate glass fibers witha three-dimensional network structure was detected usingDSC.350 This implies that the mechanical strain can excite thesystem to a higher energy state in the PEL. However, themechanical stretching-induced energy was much lower thanthat induced by thermal hyperquenching.350 Moreover, theincrease of the optical birefringence with increasing tensilestress displays a similar trend to that of the excess enthalpywith increasing quenching rate.
Ya et al.342 investigated the structural origins andmechanisms for both enthalpy and anisotropy relaxations ofthe glass fibers. For the E-glass fibers, the birefringencerelaxation is much faster than the enthalpy relaxation for thesame extent of annealing, i.e., for comparable Ta and ta (Figures35a and b). This pronounced difference indicates that thestructural origins of the anisotropy and enthalpy relaxation aredifferent. The birefringence relaxation was attributed to therelaxation of local anisotropic structure units, whereas theexcess enthalpy relaxation was associated with the cooperativerearrangement of the frozen-in isotropic network. Deubener etal.351 further addressed this issue by studying the opticalbirefringence and the enthalpy relaxation in E-glass. Theyobserved a sharp decoupling of birefringence relaxation andviscous relaxation, i.e., a large discrepancy between theactivation energies for optical recovery and viscous flow atthe glass transition by conducting both annealing andviscometric experiments on both fibers and bulk E-glasses,respectively. According to their results, the sub-Tg enthalpyrelaxation arose from contributions of α and β relaxations,while the birefringence relaxation had an intimate connectionto the γ-relaxation, which is significantly faster than βrelaxation. Investigating the anisotropic relaxation in glass isa crucial way to understand the fast relaxation process, i.e., γ-relaxation, and to clarify the significantly higher tensile strengthof thin glass fibers compared to bulk glass with the samecomposition.178
4.2. Primary and Secondary Relaxations
4.2.1. Identifying Relaxation Modes. The glass tran-sition results from the ratio of the primary (α) relaxation insupercooled liquids to that of an external observation timescale (i.e., the Deborah number). Significant attention has beenfocused on the α relaxation process in order to understand theglass transition phenomenon.271 However, in recent years thesearch for the secondary (β) relaxation has been a topic ofmuch interest274,287,293,296,352−356 since it was believed to havean intrinsic correlation with the glass transition and wasconsidered as the basic mechanism for α relaxation.18,19,357 It isgenerally considered that the primary (α) and secondary (β)relaxations are the two main relaxation processes in glasses andsupercooled liquids.2,183 Specifically, the α relaxation involves along or medium range cooperative motion of atoms, which isdirectly related to viscous flow and, therefore, to the glasstransition itself.358 However, as the α relaxation is frozen wellbelow Tg, the β relaxation process, which initiates at hightemperature, still continues. β relaxation corresponds tolocalized and fast molecular motions in the glassy state,occurring on a shorter time scale compared to the primary (α)relaxation modes. β relaxation is a universal phenomenon ofglassy dynamics.19 However, as mentioned in Section 4.1.5, βrelaxation is much slower than γ relaxation and the latter isassociated with the even more localized structural relaxation.Here, it should be mentioned that the secondary relaxation
usually includes contributions from both fast and slow βrelaxation modes. The fast β relaxation was reported to evolvewith only intramolecular motion and plays no important role inaffecting the glass transition.358 Here, we focus on the slow βrelaxation, i.e., the Johari−Goldstein (JG) relaxation in glass,which was discovered by Johari and Goldstein in 1970 byperforming dielectric measurement on glasses made from rigidmolecules.18 The JG relaxation is believed to be a precursor toα relaxation and, hence, is related to the glass transition. The
Figure 35. Comparison between the anisotropy relaxation index (Δn/Δnmax) and the enthalpy relaxation index (ΔHrem/ΔHtot) for E-glassfibers with a diameter of 9.3 mm. Δn and Δnmax are the opticalbirefringences of both the annealed fibers and the unannealed fibers,respectively, which are a measure of the glass structural anisotropy.ΔHrem and ΔHtot have the same meaning as that described in thecaption of Figure 34. (a) The annealing temperature (Ta) dependencefor the duration of ta = 180 min. (b) The ta dependence at Ta = 400°C. Dashed lines: best fits of cumulative distribution functionsthrough the Δn/Δnmax and ΔHrem/ΔHtot data. Reproduced withpermission from ref 342. Copyright 2007 the American CeramicSociety.
Chemical Reviews Review
DOI: 10.1021/acs.chemrev.8b00510Chem. Rev. XXXX, XXX, XXX−XXX
AF
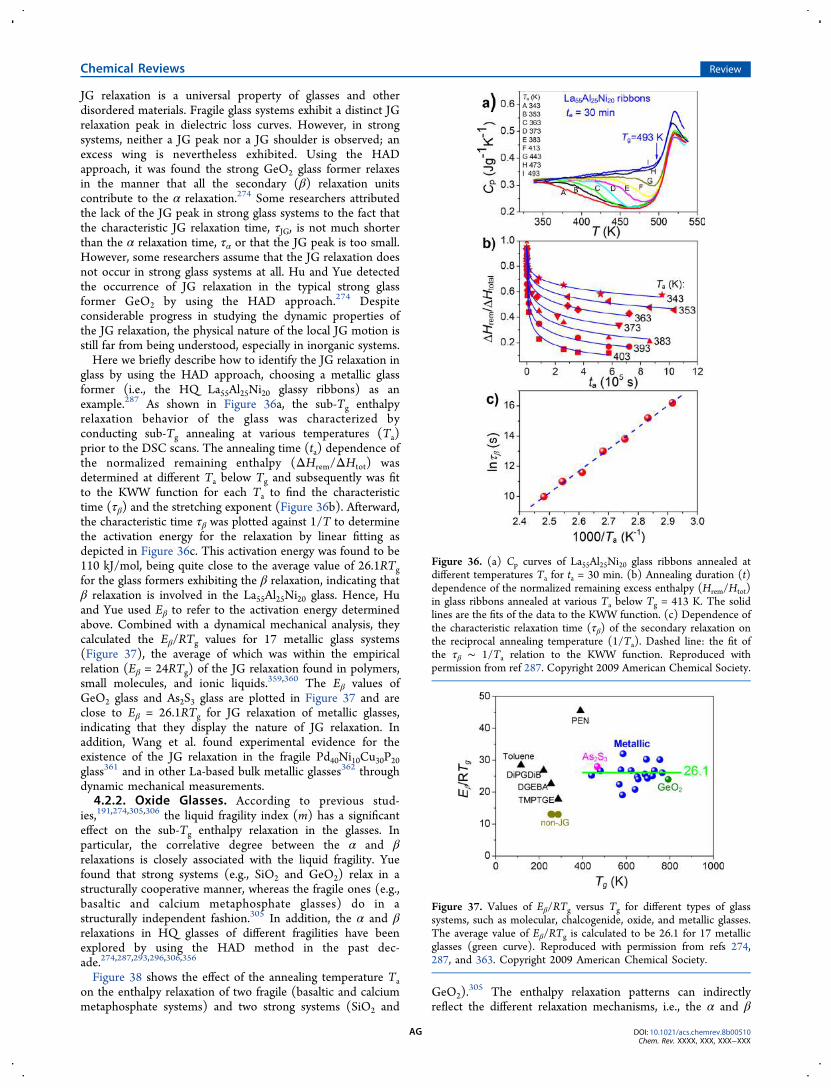
JG relaxation is a universal property of glasses and otherdisordered materials. Fragile glass systems exhibit a distinct JGrelaxation peak in dielectric loss curves. However, in strongsystems, neither a JG peak nor a JG shoulder is observed; anexcess wing is nevertheless exhibited. Using the HADapproach, it was found the strong GeO2 glass former relaxesin the manner that all the secondary (β) relaxation unitscontribute to the α relaxation.274 Some researchers attributedthe lack of the JG peak in strong glass systems to the fact thatthe characteristic JG relaxation time, τJG, is not much shorterthan the α relaxation time, τα or that the JG peak is too small.However, some researchers assume that the JG relaxation doesnot occur in strong glass systems at all. Hu and Yue detectedthe occurrence of JG relaxation in the typical strong glassformer GeO2 by using the HAD approach.274 Despiteconsiderable progress in studying the dynamic properties ofthe JG relaxation, the physical nature of the local JG motion isstill far from being understood, especially in inorganic systems.Here we briefly describe how to identify the JG relaxation in
glass by using the HAD approach, choosing a metallic glassformer (i.e., the HQ La55Al25Ni20 glassy ribbons) as anexample.287 As shown in Figure 36a, the sub-Tg enthalpyrelaxation behavior of the glass was characterized byconducting sub-Tg annealing at various temperatures (Ta)prior to the DSC scans. The annealing time (ta) dependence ofthe normalized remaining enthalpy (ΔHrem/ΔHtot) wasdetermined at different Ta below Tg and subsequently was fitto the KWW function for each Ta to find the characteristictime (τβ) and the stretching exponent (Figure 36b). Afterward,the characteristic time τβ was plotted against 1/T to determinethe activation energy for the relaxation by linear fitting asdepicted in Figure 36c. This activation energy was found to be110 kJ/mol, being quite close to the average value of 26.1RTgfor the glass formers exhibiting the β relaxation, indicating thatβ relaxation is involved in the La55Al25Ni20 glass. Hence, Huand Yue used Eβ to refer to the activation energy determinedabove. Combined with a dynamical mechanical analysis, theycalculated the Eβ/RTg values for 17 metallic glass systems(Figure 37), the average of which was within the empiricalrelation (Eβ = 24RTg) of the JG relaxation found in polymers,small molecules, and ionic liquids.359,360 The Eβ values ofGeO2 glass and As2S3 glass are plotted in Figure 37 and areclose to Eβ = 26.1RTg for JG relaxation of metallic glasses,indicating that they display the nature of JG relaxation. Inaddition, Wang et al. found experimental evidence for theexistence of the JG relaxation in the fragile Pd40Ni10Cu30P20glass361 and in other La-based bulk metallic glasses362 throughdynamic mechanical measurements.4.2.2. Oxide Glasses. According to previous stud-
ies,191,274,305,306 the liquid fragility index (m) has a significanteffect on the sub-Tg enthalpy relaxation in the glasses. Inparticular, the correlative degree between the α and βrelaxations is closely associated with the liquid fragility. Yuefound that strong systems (e.g., SiO2 and GeO2) relax in astructurally cooperative manner, whereas the fragile ones (e.g.,basaltic and calcium metaphosphate glasses) do in astructurally independent fashion.305 In addition, the α and βrelaxations in HQ glasses of different fragilities have beenexplored by using the HAD method in the past dec-ade.274,287,293,296,306,356
Figure 38 shows the effect of the annealing temperature Taon the enthalpy relaxation of two fragile (basaltic and calciummetaphosphate systems) and two strong systems (SiO2 and
GeO2).305 The enthalpy relaxation patterns can indirectly
reflect the different relaxation mechanisms, i.e., the α and β
Figure 36. (a) Cp curves of La55Al25Ni20 glass ribbons annealed atdifferent temperatures Ta for ta = 30 min. (b) Annealing duration (t)dependence of the normalized remaining excess enthalpy (Hrem/Htot)in glass ribbons annealed at various Ta below Tg = 413 K. The solidlines are the fits of the data to the KWW function. (c) Dependence ofthe characteristic relaxation time (τβ) of the secondary relaxation onthe reciprocal annealing temperature (1/Ta). Dashed line: the fit ofthe τβ ∼ 1/Ta relation to the KWW function. Reproduced withpermission from ref 287. Copyright 2009 American Chemical Society.
Figure 37. Values of Eβ/RTg versus Tg for different types of glasssystems, such as molecular, chalcogenide, oxide, and metallic glasses.The average value of Eβ/RTg is calculated to be 26.1 for 17 metallicglasses (green curve). Reproduced with permission from refs 274,287, and 363. Copyright 2009 American Chemical Society.
Chemical Reviews Review
DOI: 10.1021/acs.chemrev.8b00510Chem. Rev. XXXX, XXX, XXX−XXX
AG
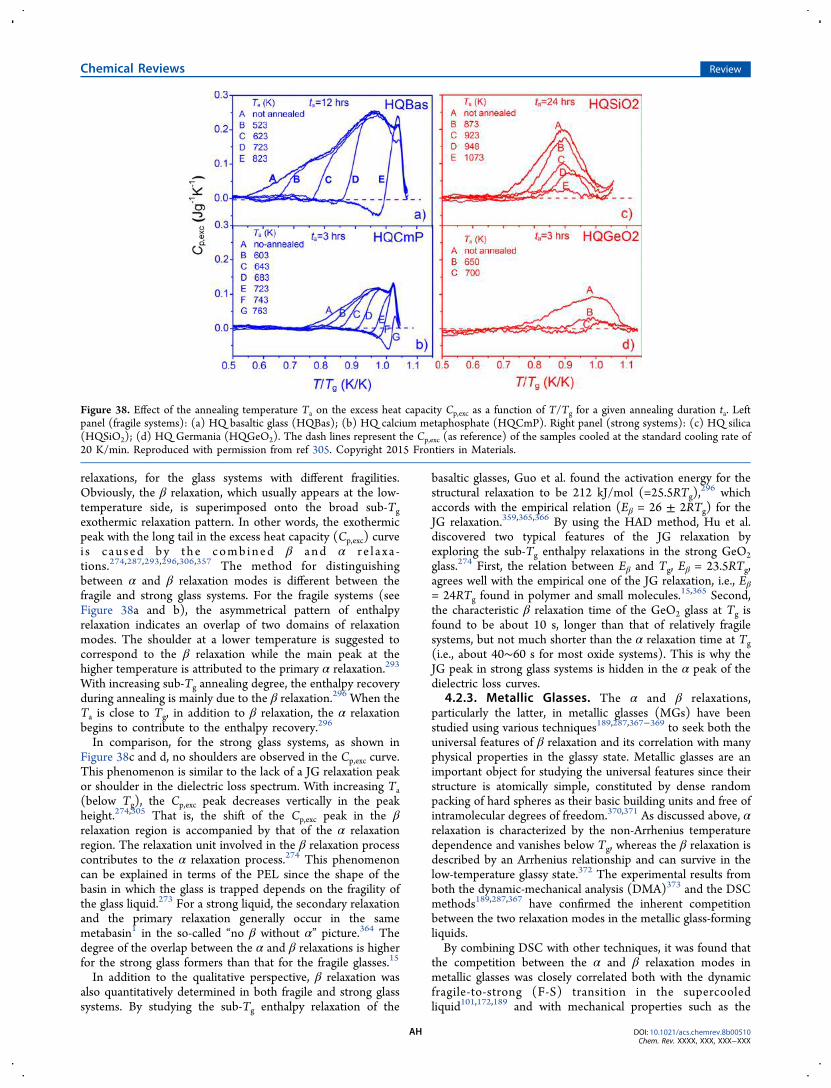
relaxations, for the glass systems with different fragilities.Obviously, the β relaxation, which usually appears at the low-temperature side, is superimposed onto the broad sub-Tgexothermic relaxation pattern. In other words, the exothermicpeak with the long tail in the excess heat capacity (Cp,exc) curvei s cau sed by the combined β and α r e l a x a -tions.274,287,293,296,306,357 The method for distinguishingbetween α and β relaxation modes is different between thefragile and strong glass systems. For the fragile systems (seeFigure 38a and b), the asymmetrical pattern of enthalpyrelaxation indicates an overlap of two domains of relaxationmodes. The shoulder at a lower temperature is suggested tocorrespond to the β relaxation while the main peak at thehigher temperature is attributed to the primary α relaxation.293
With increasing sub-Tg annealing degree, the enthalpy recoveryduring annealing is mainly due to the β relaxation.296 When theTa is close to Tg, in addition to β relaxation, the α relaxationbegins to contribute to the enthalpy recovery.296
In comparison, for the strong glass systems, as shown inFigure 38c and d, no shoulders are observed in the Cp,exc curve.This phenomenon is similar to the lack of a JG relaxation peakor shoulder in the dielectric loss spectrum. With increasing Ta(below Tg), the Cp,exc peak decreases vertically in the peakheight.274,305 That is, the shift of the Cp,exc peak in the βrelaxation region is accompanied by that of the α relaxationregion. The relaxation unit involved in the β relaxation processcontributes to the α relaxation process.274 This phenomenoncan be explained in terms of the PEL since the shape of thebasin in which the glass is trapped depends on the fragility ofthe glass liquid.273 For a strong liquid, the secondary relaxationand the primary relaxation generally occur in the samemetabasin1 in the so-called “no β without α” picture.364 Thedegree of the overlap between the α and β relaxations is higherfor the strong glass formers than that for the fragile glasses.15
In addition to the qualitative perspective, β relaxation wasalso quantitatively determined in both fragile and strong glasssystems. By studying the sub-Tg enthalpy relaxation of the
basaltic glasses, Guo et al. found the activation energy for thestructural relaxation to be 212 kJ/mol (=25.5RTg),
296 whichaccords with the empirical relation (Eβ = 26 ± 2RTg) for theJG relaxation.359,365,366 By using the HAD method, Hu et al.discovered two typical features of the JG relaxation byexploring the sub-Tg enthalpy relaxations in the strong GeO2glass.274 First, the relation between Eβ and Tg, Eβ = 23.5RTg,agrees well with the empirical one of the JG relaxation, i.e., Eβ
= 24RTg found in polymer and small molecules.15,365 Second,the characteristic β relaxation time of the GeO2 glass at Tg isfound to be about 10 s, longer than that of relatively fragilesystems, but not much shorter than the α relaxation time at Tg(i.e., about 40∼60 s for most oxide systems). This is why theJG peak in strong glass systems is hidden in the α peak of thedielectric loss curves.
4.2.3. Metallic Glasses. The α and β relaxations,particularly the latter, in metallic glasses (MGs) have beenstudied using various techniques189,287,367−369 to seek both theuniversal features of β relaxation and its correlation with manyphysical properties in the glassy state. Metallic glasses are animportant object for studying the universal features since theirstructure is atomically simple, constituted by dense randompacking of hard spheres as their basic building units and free ofintramolecular degrees of freedom.370,371 As discussed above, αrelaxation is characterized by the non-Arrhenius temperaturedependence and vanishes below Tg, whereas the β relaxation isdescribed by an Arrhenius relationship and can survive in thelow-temperature glassy state.372 The experimental results fromboth the dynamic-mechanical analysis (DMA)373 and the DSCmethods189,287,367 have confirmed the inherent competitionbetween the two relaxation modes in the metallic glass-formingliquids.By combining DSC with other techniques, it was found that
the competition between the α and β relaxation modes inmetallic glasses was closely correlated both with the dynamicfragile-to-strong (F-S) transition in the supercooledliquid101,172,189 and with mechanical properties such as the
Figure 38. Effect of the annealing temperature Ta on the excess heat capacity Cp,exc as a function of T/Tg for a given annealing duration ta. Leftpanel (fragile systems): (a) HQ basaltic glass (HQBas); (b) HQ calcium metaphosphate (HQCmP). Right panel (strong systems): (c) HQ silica(HQSiO2); (d) HQ Germania (HQGeO2). The dash lines represent the Cp,exc (as reference) of the samples cooled at the standard cooling rate of20 K/min. Reproduced with permission from ref 305. Copyright 2015 Frontiers in Materials.
Chemical Reviews Review
DOI: 10.1021/acs.chemrev.8b00510Chem. Rev. XXXX, XXX, XXX−XXX
AH

Poisson’s ratio.319,367 Such competition is generally charac-terized by a parameter r, i.e., the ratio between the activationenergies for the α and the β relaxations (Eα/Eβ).
367 The Eα andEβ values for the MGs can be determined by DSC,189,367
DMA,373 and dielectric spectra.359 Sun et al.189 found aninverse exponential relationship between the extent of the F−Stransition extent and the relaxation competition parameter r.This implies that the F−S transition is closely associated withthe decoupling of the slow β relaxation from the α relaxationwhen dropping to a critical temperature. Combining the DSCwith the acoustic measurement, it was found that Eα/Eβ ofmetallic glasses was intimately related to the glass ductilityreflected by the Poisson’s ratio.367 These findings189,367
suggested that r could be used as an indicator of glass ductilityand a measure of the structural heterogeneity in supercooledliquids.β relaxation is the most important relaxation process in the
metallic glassy state and has aroused much scientific attentionsince it can assist the self-diffusion of the smallest constitutingatoms,374 trigger the activation of the shear-transformation-zones366 and spatial heterogeneity,299 as well as aid inunderstanding the mechanisms of plastic deformation ofMGs.375 It has recently been shown that a better under-standing of the β-relaxation is helpful for explaining numerousunresolved issues in glass science.357,358,373,376
The β relaxation in the metallic glasses can be affected bymany factors, e.g., physical aging,377 composition,378 and hencethe liquid fragility,353,379 as well as Tf.
353 By using mechanicalspectroscopy, Qiao et al. investigated the influence of physicalaging on the β relaxation in La60Ni15Al25 bulk metallic glass.377
Yu et al.378 systematically studied the effect of chemicalcomposition on β relaxations in several MG systems andformulated a general rule that the pronounced β relaxations areassociated with systems where all the atomic pairs have largesimilar negative values of enthalpy of mixing while the positivevalues of enthalpy of mixing suppress β relaxations. Moreover,Yu et al.379 also found a correlation between fragility m and thedegree of separation between α relaxation time τα and βrelaxation time τβ in the metallic glass-formers by usingdynamical mechanical spectroscopy (DMS). As described inSection 4.2.1, the activation energy of β relaxation (Eβ) can bedetermined by the HAD approach.274,287 Recently, Hu et al.353
developed a new hyperquenching-calorimetry (HC) approachto determine the activation energy of β relaxation (Eβ) basedon the inherent connection between the slow β relaxation andsub-Tg enthalpy relaxation in several metallic glasses. The newHC approach is efficient since it avoids the series of long-timeannealing processes required in the HAD method. The core ofthe new HC method is to determine the critical fictivetemperature (Tf,c), at which Eβ is equal to the activation energyof the onset of the sub-Tg enthalpy relaxation of metallicglasses, that is, to find the critical cooling rate for formation ofa metallic glass with Tf,c, at which the structural units hopcooperatively across the subset of basins involved in the JGrelaxation. A linear relationship between Tf,c/Tg and mmanifests the connection between the contribution of the JGrelaxation to the entire relaxation process and the liquidfragility of supercooled liquids. The β relaxation was identifiedto have a connection to the evolution of both the sheartransformation zones and the localized flow units,366,367,380
which is a critical factor influencing the plastic deformation ofMGs. Moreover, the β relaxation was also found to have similaractivation energy as the self-diffusion of the smallest
constituting atoms,374 the spatial heterogeneity,299 as well asthe irreversible sub-Tg endotherm from TMDSC results.381
The β relaxations (measured by DMS) and the hoppingmotions of P atoms (probed by NMR) in the Pd40Ni10Cu30P20glass occur in the same temperature and frequency ranges withthe same activation energy, suggesting that the β relaxationrelates with the diffusive motions of the smallest constitutingatoms in MG.374 This correlation provided new insights intothe structural origin of β relaxation and the mechanism ofdiffusions in MGs. By combining the DSC measurements withamplitude-modulated AFM measurements, both the character-istic relaxation times and the activation energy of the spatialheterogeneity dynamics were found to be in good accordancewith those of the β relaxation, verifying the intrinsic correlationbetween local structural evolution and the β relaxation.299
The microscopic connection between structure anddynamics of MGs provides compelling evidence of thestructural origin of β relaxation and has important implicationsfor what governs the mechanical properties and dynamics ofMGs. These studies of MGs provide a promising route tounderstand fundamental issues in glassy physics and materialsscience.
4.2.4. Molecular Glasses. During the formation ofmolecular glass systems, the supercooled liquid state involvesa high degree of molecular complexity. Moreover, molecularglasses possess a readily controllable structure with a broaderrange of building blocks compared to strong systems. In theglassy state, the molecular systems relax toward thermody-namic equilibrium during the structural relaxation process,during which two kinds of motions are always detectable: acooperative motion associated with the α relaxation183 and asubsegmental relaxation associated with the β relaxation, suchas the reorientation of an ester side group.382 Theinvestigations of the enthalpy relaxation in molecular glasseshave led to considerable success because of their structuralpeculiarities compared to metallic glasses and network glasses.For instance, the existence of the JG process was firstconfirmed in rigid molecular glasses without the relevantinternal molecular (intramolecular) degrees of freedom.18
Subsequently, it was demonstrated by its ubiquitous presencein different glass formers, such as simple organic molecularliquids,383 polymers,384,385 inorganic oxide glasses,274,296 andmetallic glasses.287
The relaxation dynamics (in particular, the α and βrelaxations) of molecular systems have been widely studiedby many techniques including dielectric spectroscopy,386,387
NMR,387,388 thermally stimulated depolarization current (adielectric-related technique),389 light-scattering spectrosco-py,390 as well as DSC.354,355 Among these techniques,dielectric spectroscopy and DSC are the most commonlyused. For instance, the studies of many different kinds ofmolecular systems by dielectric spectroscopy focus ondetecting the α relaxation, identifying the existence of the βrelaxation, and describing features specific to the β relaxationfor understanding of the molecular mechanism of the JGprocess386,387,391,392 as well as for exploring the origin of thepotential connection between the α and the β relaxations inthe conceptual basis of the mode-coupling theory.385 The glasstransition and structural relaxations in molecular glasses havebeen extensively investigated by employing DSC measure-ments. These investigations have been linked to topographicfeatures of the energy landscape of glass-forming liquids and toliquid fragility.393−396 Important progress has been made in
Chemical Reviews Review
DOI: 10.1021/acs.chemrev.8b00510Chem. Rev. XXXX, XXX, XXX−XXX
AI

determination of the activation energies of both the α and βrelaxations, in evaluation of the sizes of cooperativelyrearranging regions (CRRs) at the glass transition,92 and inevaluation of the critical sub-Tg temperature to invoke the βrelaxation in molecular systems.355,356,397
Upon sub-Tg annealing, the endothermic sub-Tg peak priorto the glass transition peak, i.e., the endothermic prepeak, wasalso observed in the DSC curves of the annealed molecularglasses,354,398,399 which are similar to those in the annealed HQfragile oxide glasses. Vyazovkin et al. conducted a series ofDSC studies to evaluate the effective activation energies of theβ relaxations (Eβ) from the sub-Tg peaks and to determine thesizes of cooperatively rearranging regions at the glass transitionin both PS-Clay and some amorphous pharmaceuticalsystems.354,356,397 Based on the empirical correlation, Eβ =(24 ± 3)RTg,
400 Vyazovkin et al.397 found the lowest accessibletemperature at which the β relaxation can be induced. Thislow-temperature limit of β relaxation is very important for theapplication of the amorphous drugs. As Ta rises, theendothermic prepeak shifts toward the glass transition,implying that the longer time relaxation modes associatedwith α relaxation occur, which correspondingly result in anincrease in the effective activation energy.354,356,397 Theincrease in activation energy with Ta reflects the coupling ofthe β- and α-processes, i.e., an increasing contribution of thecooperative α motion to the annealing process.In addition to the occurrence of the endothermic sub-Tg
peak, one of the most striking features of this peak wasdemonstrated in a biodegradable polymer.401 When thepoly(L-lactide) (PLLA) samples were annealed at a temper-ature just below Tg, i.e., 0.95Tg, the endothermic peak not onlyoverlapped with the glass transition peak but shifted to highertemperature with the increase of aging time (ta), as shown inFigure 39. This implies that the sub-Tg annealing can give rise
to α relaxation in this polymer system due to the more easilysegmental rearrangement compared to the inorganic oxideglasses.274,296 In addition, the cooling rates experienced byboth the PLLA and the PDLLA during formation can alsoaffect the α relaxation in the system; that is, with decreasingcooling rate, the glass transition peak shifted to a highertemperature, and the peak intensity increases.401 Similar
enthalpy relaxation behavior was also found in a lactoseglass402 and in sucrose.403 It was found that only when Ta ishigher than a certain temperature, e.g., 0.92 Tg, can the αrelaxation be initiated.402
The nonexponentiality of the structural relaxation of fourpharmaceuticals was used to detect their stability againstcrystallization, i.e., the deleterious tendency for nucleation andcrystal growth, in amorphous pharmaceuticals.355 A highervalue of β corresponds to a narrower distribution of dynamics,less susceptible to nucleation. In Figure 39a, it is noticed that ashoulder is present at the high-temperature side of the mainendothermic peak when ta is between 3 and 24 h. It wassuggested that the shoulders caused by the existence of smallamounts of crystalline phases in the polymer formed during thequenching process. From another perspective, the existence ofthe shoulder indicates the instability of the PLLA againstcrystallization during quenching. In addition, the effects ofboth the temperature and humidity on the annealing process ofspray-dried maltodextrin were investigated by DSC.399 Thehumidity was found to reduce the Tg values of both themaltodextrin404 and the SiO2 glass.305 Compared to thethermal effect, the humidity plays a less efficient role inaffecting the enthalpy relaxation of the maltodextrin.404
4.2.5. Chalcogenide Glasses. Chalcogenide glasses aregenerally composed of covalently bonded rings, chains, layers,and three-dimensional structures, with van der Waals forcesacting between structural units. The glass transition temper-ature Tg of chalcogenide glasses is generally lower compared tothat of oxide glasses.405,406 This means that the enthalpyrelaxations in these glasses can occur more easily compared tooxide glasses, particularly at low temperatures. By conductingTMDSC experiments, Lucas et al.407,408 have studied thephotoinduced structural relaxations in both the Ge-Se and As-S-Se glass systems during sub-bandgap irradiation. It wasrevealed that the mechanisms for the thermal and photo-induced relaxations were quite different. With respect to therelaxation mechanism, Lucas et al.406 also pointed out thedifferences in mechanisms between the stress relaxation andthe enthalpy relaxation in chalcogenide fibers at roomtemperature through DSC measurements.The average coordination number ⟨r⟩409 is a useful quantity
for investigating the composition dependence of the structuralrelaxation behavior.406−408 The strongest liquid was consideredto correspond to a value of 2.4 since the structure reaches therigidity percolation threshold.410,411 The ⟨r⟩ of chalcogenideglasses tends to decrease with increasing liquid fragility. Interms of the energy landscape formalism, the fragile systemsundergo larger structural relaxation because of the availabilityof a greater number of different structural configura-tions.406−408 Moreover, the composition of chalcogenideglasses can also influence their very long-term physicalaging.412,413 A series of binary AsxSe1‑x chalcogenide glasseswere annealed under the normal ambient conditions for nearly20 years, and this induced huge increases both in the area ofthe endothermic peak near the glass transition region and in Tgfor the samples with x < 40 (i.e., for Se-enriched glasses).412
This also implies that the α relaxation was invoked during thislong-term aging process. In addition, Saiter et al.413 studied theeffects of very long physical aging up to 13 years at lowtemperature on the enthalpy relaxations of another binarychalcogenide glasses, i.e., the GexSe1−x glasses (x = 4, 8, and 12at%), by means of DSC. Interestingly, a reversible phase-likeseparation in the endothermic peak near the glass transition
Figure 39. DSC upscan curves in the glass transition region at 10 K/min for molecular glasses: (a) poly(L-lactide) (PLLA) and (b)poly(DL-lactide) (PDLLA) samples annealed at 40 °C for differenttimes (in hours). Adapted with permission from ref 401. Copyright2007 American Chemical Society.
Chemical Reviews Review
DOI: 10.1021/acs.chemrev.8b00510Chem. Rev. XXXX, XXX, XXX−XXX
AJ

region was observed in the DSC curves of the glasses with x =4 and 8 at%, implying that the initial glassy structure graduallyevolves into a heterogeneous one during the long-timerelaxation process. Moreover, this evolution strongly dependson the composition, since no such phase-like separation in theendothermic peak appears in the glass with x = 12 at%.A systematic study on the enthalpy relaxation in the Gex·
Se1−x glasses was carried out by Saiter’s group regarding theeffect of the degree of annealing and the composition on theenthalpy relaxation.413−416 Similar to the AsxSe1−x glasses, theGexSe1‑x glasses414 and the Se98In1.5Sn0.5 glass405 exhibit anincrease of Tg with increasing Ta and/or ta. This furtherconfirms that the sub-Tg annealing induced the α relaxation inthe Se-based chalcogenide glasses. Since it is known that Seatoms are 2-fold coordinated (forming chains) and Ge atomsare tetrahedrally coordinated, the topological model ofPhillips132 was used to clarify the structural origin of theenthalpy relaxation in the GexSe1−x glasses with differentcompositions.414,415
A study on the volume and enthalpy relaxations of Se glasswas conducted by Malek et al.417 According to their results, therelaxation processes were attributed to the α relaxation sincethe activation energy of viscous flow in the glass transitionregion was identical to the activation energy for relaxation.Svoboda et al.418 also studied the enthalpy relaxation inGe2Se98 and As2Se98 glasses based on the Tool−Narayanasw-amy−Moynihan (TNM) model.82,166 By studying the enthalpyrelaxation in Ge2Sb2Se5,
419 Ge-Se glass420 and GeTe4glasses421 by DSC and the TNM and the Adam−Gibbs−Scherer (AGS) models, they found the most convenient andaccurate way for determining the parameters of the TNM/AGS models. Structural relaxation of both the isothermally andthe isochronally heat treated Se96In4 glasses, respectively, in theglass transition region, has been studied using DSC by Imranand co-workers, from which the activation energy spectra ofthe enthalpy relaxation were obtained and discussed.422
Very recently, Qiao et al. have investigated the sub-Tgrelaxation in both the mechanically milled and the quenchedAs2S3 glasses by using DSC and Raman and X-ray photo-electron spectroscopies (XPS).363 By comparing the activationenergy for sub-Tg enthalpy relaxation (Eβ) with that for the JGrelaxation, they found that the relaxation in the quenched glassexhibits the JG relaxation feature, whereas the relaxation inmilled glass has an activation energy of 33RTg, which isconsiderably higher than the average value of 24RTg for the JGrelaxation.274 Upon sufficient sub-Tg annealing, the endother-mic prepeak appears in the milled As2S3 glass, implying itshigher nonexponentiality of the sub-Tg relaxation compared tothe quenched glass. The Raman and XPS analyses indicate thatboth milling and melt-quenching can increase the structuralheterogeneity of glass due to the occurrence of the As4S4clusters and -S-S- chains.4.2.6. Metal−Organic Framework (MOF) Glasses.
Zeolitic imidazole frameworks (ZIFs) are a subset of metal−organic frameworks (MOF). The recent discovery of the melt-quenched (MQ) ZIF glasses has captured considerablescientific interest due to their unique structures, dynamics,performances, and potential technical applications.237,247,248,257
The structure of the ZIF glasses lacks any long-range periodicorder but retains the basic building blocks and connectivity oftheir crystalline counterparts. ZIF consists of metal ions asnodes and their tetrahedrally coordinated organic ligands, andthe interconnected tetrahedra constitute an extended three-
dimensional (3D) porous framework. As described in Section3.8.3, upon a DSC upscan the ZIF-4 crystal (Zn(Im)2)experiences a series of thermal responses, owing to thetransformation of crystal to low-density amorphous (LDA)phase, high-density amorphous (HDA) phase, and ZIF-znicrystal and owing to melting and finally decomposi-tion.4,254,255,423
Using DSC, the coexistence of HDA and LDA in ZIF-4 wasdemonstrated and explained in terms of the underlying PEL.4
Study of the enthalpy relaxation in this new family of glassesgives a new perspective for understanding the fundamentalglass problems. Recently, Wang and co-workers haveconducted a detailed study on the glass relaxation thermody-namics and kinetics in the HDA phase of ZIF-4.423 It wasfound that the glass transition and relaxation parameters ofHDA ZIF-4 follow all the correlations established for theconventional melt-quenched glasses. Yue and co-workers havestudied the enthalpy relaxation in the MQ ZIF-62 (Zn-(Im)1.75(bIm)0.25) glass by performing sub-Tg annealing andDSC and XRD measurements.424 From the annealing and thesubsequent DSC upscanning experiments, the KWW stretch-ing exponent β is found to be in the wide range of 0.44−0.76,which increases with the annealing temperature. This indicatesa substantial degree of structural heterogeneity at medium-range scale in the ZIF-62 glass. The pair distribution functionof the annealed glasses demonstrates structural densificationduring sub-Tg relaxation.
4.3. Structural Heterogeneity
The information about structural heterogeneity is importantfor understanding structural relaxation and the nature of glass,in particular, for clarifying the structural origin of the dynamicheterogeneity as the temperature approaches Tg in glass-forming liquids.425−427 From the PEL view, the structuralheterogeneity can be simply considered as the spatialcorrelations of molecular potential energies,428 and con-sequently, it has a strong impact on the glass properties, e.g.,shear modulus429 and ductility367,430 in metallic glasses. Hu etal.367 found a correlation between the SCL relaxation and thePoisson’s ratio (ν) of the glass by comparing the activationenergy ratio of the α and the slow β relaxations (r = Eα/Eβ) forthe metallic and the nonmetallic glasses. The underlyingphysics of this correlation lies in the heredity of the structuralheterogeneity from liquid to glass. Although the chemical bondtypes are fundamentally different between the metallic glassesand other glass systems, the heterogeneous structure should benevertheless their common feature.In addition, the existence of the structural heterogeneity in
the molten state makes it difficult to determine the liquidustemperature (TL)
431,432 above which the structure should bemore uniform and homogeneous at medium-range order scale.Over the past decades, much effort has been devoted toclarifying the structural heterogeneity in glasses by means ofdifferent experimental techniques, e.g., nanomechanical test-ing,430 dynamic force microscopy,433 solid-state NMR,434,435
DSC,431,432 and atomistic modeling,428 as well as acombination of experiment and modeling.415 Nonexponentialrelaxation processes connect the variations in local density ormolecular packing with annealing to a distribution of relaxationtimes,426 usually quantified by the KWW stretching exponent,β.296 Assuming that particular regions of the structurecorrespond to certain relaxation modes, the width of the
Chemical Reviews Review
DOI: 10.1021/acs.chemrev.8b00510Chem. Rev. XXXX, XXX, XXX−XXX
AK

structural relaxation time distribution can be used as a measureof the extent of the structural heterogeneity.295
The DSC technique has been demonstrated to be veryefficient and convenient for detecting structural heterogeneityin both the glassy and supercooled liquid states via thecontrolled enthalpy relaxation process in different glassysystems, including oxides,295,296,431,432 metals,436,437 poly-mers,398 and chalcogenides.413 In the following, we reviewsome recent work about the detection of the structuralheterogeneity through the enthalpy relaxation in both thenormal and extremely poor glass formers. The extremely poorglass formers here refer to glasses that are highly unstable withrespect to crystallization.295
4.3.1. Good Glass Formers. The study of enthalpyrelaxation in HQGs is a key approach for understanding thestructural heterogeneity in glasses.291,293,296,431,432,437 Asdescribed in Section 4.1.2, the HQ and annealed HQ glassesshow different and complex features of the enthalpy relaxationcompared to slowly cooled glass reflected by a broadtemperature range of sub-Tg exothermic response in their Cpcurves.291,293,296,431,432,437 The asymmetrical pattern of theenthalpy relaxation peak in the Cp curve, which manifests itselfas an overlap of at least two-domains of relaxation modesduring the DSC upscan, is considered as evidence for structuralheterogeneity.291,293 Such a relaxation pattern can be regardedas the first evidence of the structural heterogeneity in thenormal glass formers.The HAD approach is an indirect method to access the
structural heterogeneity291,293,381,431,432,437 in the supercooledliquid state. The HQ strategy is often used to arrest thestructure of the supercooled liquid at a temperature Tf wellabove Tg, and the subsequent annealing lets the arrestedstructure relax in a controlled manner, and finally, the releasedenthalpy can be quantified by performing two cycles of DSCup and downscans. The heat capacity Cp of the annealed HQglasses provides access to the different microstructural regionsassociated with different relaxation time scales. If the annealingtemperature is sufficiently high (but below Tg) or the annealingtime is sufficiently long, the occurrence of the endothermicprepeak prior to the sub-Tg energy release peak, which can beeliminated by a second upscaning, is a common phenomenonof the fragile oxide glasses,291,293,431,432,438 metallicglasses,381,437 polymer glasses,398 and chalcogenideglasses.405,412−414 The endothermic prepeak is attributed tothe fast-relaxing regions with high potential energy, implyingthe existence of the structural heterogeneity of the glass or thesupercooled liquid at Tf. In particular, the endothermicprepeak is a reflection of the nonexponential nature of therelaxation in systems far from equilibrium.431 The structuralheterogeneity is described by a series of independentmicrodomains with different size (≤medium-range orderscale), local density, and stability. The diversity of thesedomains is reflected by the stretching exponent β.296 Theendothermic prepeak is the consequence of the short-timerelaxing domains of a broad relaxation time spectrum in thetemperature range far below Tg. Moreover, the endothermicprepeak becomes more pronounced with increasing theannealing degree, indicating that more subregions werea c t i v a t e d d u r i n g t h e a n n e a l i n g p r o c -ess.291,293,381,413,431,432,437,438
However, the endothermic prepeak strongly depends on thechemical composition and hence the fragility of glass systems.For example, no distinct endothermic prepeak can be observed
in the Cp curves of the annealed strong GeO2 glass274 andstrong metallic glasses subjected to same annealing degree asthat of the fragile glass systems.287 This indicates a higherdegree of structural heterogeneity in fragile glass formerscompared to strong glasses.28 On the other hand, as reviewedin Section 4.2.4, Saiter et al.413 conducted a very long time ofannealing, i.e., 13 years, on chalcogenide GexSe1−x glasses.Such long-time annealing led to two endothermic peaks nearTg in the DSC curves for the glasses with x = 4 and 8 at%. Inaddition, the two peaks corresponded to two differentdomains; that is, one is rich in Se-polymeric chains, and theother is rich in Ge, forming a three-dimensional network,indicating a heterogeneous structure of the studied glass. Thus,the endothermic prepeak in the Cp curve of the annealed glasscan be considered as the second evidence for the structuralheterogeneity.By studying the enthalpy relaxation behaviors of the HQ Cu-
Zr-Al metallic glasses, Hu et al.436,437 observed an abnormalthree-steplike relaxation pattern, i.e., both the onset temper-ature of the enthalpy recovery during DSC upscan and thereleased enthalpy of the HQ glasses during annealing variednonmonotonically with Ta (increase−decrease−increase) incontrast to oxide systems. The origin of this abnormal behaviorwas revealed by studying the cooling rate dependence, i.e., theTf dependence, of the remaining enthalpy after annealing andthe activation energy for the onset of the energy release in twometallic glasses.437 These abnormal relaxation phenomenawere explained in terms of the competition between the lowand the high-temperature clusters during the fragile-to-strongtransition,436,437 indicating the structural heterogeneity insupercooled liquids. The abnormal three-step relaxationpattern could be considered as the third evidence for thestructural heterogeneity in supercooled liquids.The HAD strategy can also be used to detect the structural
heterogeneity in liquids. Yue applied the repeated DSC up-and down-scanning approach to detect the structuralheterogeneity of a basaltic liquid above TL.
431,432 Hediscovered the crystal-memory effect in this liquid over awide temperature range above TL and inferred that thestructural heterogeneity is also present in the equilibriumliquids. Furthermore, as described in Section 4.1.3, the sup-Tgenthalpy relaxation of the ultrastable glasses is accompanied bythe evolution from high energy to the lower energy packing,suggesting the existence of the structural heterogeneity in thesupercooled liquid.331,332 This structural evolution can beconsidered to be the fourth evidence for the structuralheterogeneity in supercooled liquids.
4.3.2. Poor Glass Formers. The binary Al2O3−SiO2system is a highly unstable system against crystallization, i.e.,an extremely poor glass former, since its crystallization peakpartially overlaps with the glass transition peak.14,295,439,440
This glass system is often used for making high-temperatureinsulation wool fibers. Zhang et al. explored the correlationsamong the sub-Tg enthalpy relaxation, crystallization, and thestructural heterogeneity in the extremely unstable 65SiO2-35Al2O3 glass using the HAD approach.295 A high degree ofstructural heterogeneity in the HQ glass, which is inheritedfrom the medium-range ordered domains in the supercooledliquid, can greatly suppress the occurrence of the endothermicprepeak in the Cp curve of the annealed samples. Combinedwith the sub-Tg annealing effect on the crystallization behavior,the structural heterogeneity in the 65SiO2-35Al2O3 glass wasrevealed to be closely correlated with two types of structural
Chemical Reviews Review
DOI: 10.1021/acs.chemrev.8b00510Chem. Rev. XXXX, XXX, XXX−XXX
AL

domains (silica-rich and alumina-rich domains). By using DSC,NMR spectroscopy, and high-resolution transmission electronmicroscopy, it was found that structural heterogeneity is themain factor that lowered the glass stability of the alumina−silica glass.440 It was proposed that the tricoordinated-oxygenclusters in the alumina−silica glass during annealing could actas the nucleation sites for mullite formation.440
The hyperquenched ternary 20.8CaO−15.6MgO−62.2SiO2glass is also an extremely poor glass former.352 There is a tinyexothermic peak right above the glass transition overshoot inthe Cp curves of this glass,352 which was attributed toprecipitation of nanocrystals, i.e., diopside crystals. Figure 40
shows the plot of the excess heat capacity (Cp,exc) againsttemperature, where the enthalpy evolution with ta can beobserved for the HQ 20.8CaO−15.6MgO−62.2SiO2 glass atTa = 823 K. It is seen that two well-separated sub-Tg relaxationpeaks appear in the Cp curve, implying that two differentstructural domains coexist in the supercooled liquid at T = Tf.The two peaks behave differently with increasing ta. In detail,the low-temperature peak vertically diminishes with increasingta, similar to the relaxation behavior in strong glass formers,whereas the high-temperature peak horizontally decreases andan endothermic prepeak gradually emerges as a HQ fragileglass former behaves with the proceeding of annealing.274 Thisclearly indicates the structural heterogeneity in the glass.It is known that a glass with higher degree of structural
heterogeneity has higher probability for nucleation to occurcompared to that with lower degree of structural heterogeneityunder the same thermal treatment condition,295,352,441 and thiscorrelation appears particularly strong for poor glass formers.For instance, the vanadium tellurite glass system is a ratherpoor glass former with high fragility (m ≈ 80−100), in whichcrystallization can easily occur during a DSC upscan.123,442
Recently, the 60V2O5−40TeO2 glass was found to be anexcellent anode material for lithium-ion batteries owing to itshigh discharging/charging cycling stability and ionic con-ductivity.443,444 The superior performances were attributed tothe occurrence of the γ-Li3VO4 nanocrystals in the glass, whichwas induced by Li-ion insertion during the discharging/charging cycles. This kind of nanocrystal formation is in strongcontrast to crystallization caused by heat-treatment above Tg.Through detailed DSC characterizations, it was found that
60V2O5−40TeO2 glass had a high degree of structuralheterogeneity.443 Upon Li insertion, the structural domainswith higher potential energy are easy to be transformed intonanocrystals, and simultaneously Li ions join the latticestructure. This suggests that structural heterogeneity plays acritical role in nanocrystal formation in poor glass formers.In summary, the DSC results of the enthalpy relaxation
provide evidence for the existence of structural heterogeneityin both the normal and poor glass formers. With furtherunderstanding of the structural heterogeneity in glass,numerous longstanding issues related to dynamic hetero-geneities can be clarified.
4.4. Anomalous Relaxation versus Fragile-to-StrongTransition
As mentioned in Section 3.5, glass-forming liquids can beclassified as either fragile or strong. However, it has also beenfound that some glass-forming liquids do not conform to theconventional “strong/fragile” scheme but exhibit a fragile-to-strong (F−S) transition during cooling. As shown in Figure41a, the temperature dependence of viscosity of these liquidsstrongly deviates from the Arrhenius relation in the high-temperature region above TL but is close to the Arrheniusrelation in the low-temperature region around Tg.
445 Figure41a shows a fit of the viscosity versus Tg/T relation to theextended MYEGA equation20 for the Cu46Zr46Al8 liquid (redsolid curve). The blue dashed curve refers to the strong term,whereas the pink dashed curve represents the fragile one. TheF−S transition was confirmed to be a general feature of manymetallic glass-forming liquids (MGFLs).20 A question thenarises: what is the structural source of the F−S transition inMGFLs and other types of glass-forming liquids? It has been achallenge to answer this question since intense crystallizationin the F−S transition region hinders a direct probe of thestructural evolution of most of poor glass formers such as waterand melt-spun metallic glass systems. For most good glassformers such as some nonmetallic inorganic systems and bulkmetallic glass systems, the F−S transition usually lies in aregion that viscosity-measuring methods cannot reach. Despitethis challenge, some indirect studies have given interestingimplications for the structural origin of the F−S transition inMGFLs. Based on HAD experiments, Zhou et al. observed astriking anomalous relaxation phenomenon in the HQ CuZrAlglass ribbons, i.e., the three-stage sub-Tg relaxation with respectto Ta.
445 This behavior corresponds to the dynamic F−Stransition, during which a structural evolution occurs asobserved by Zhou et al. (Figures 40b and c).445
Figure 41b shows the three-stage anomalous relaxationbehavior (see curve E and point E in inset) in the HQCu46Zr46Al8 glass when Ta increases from 583 to 623 K. Figure41c demonstrates the changes of the structure factor S(Q)peaks with increasing Ta for the Cu46Zr46Al8 glass ribbons,determined using X-ray scattering. It is clearly seen that thereare two low Q minor peaks (P1 and P2) and one main peak(Pm) on each curve. The Pm position remains unchanged withTa, suggesting that the SRO structural units are stable.However, the positions of P1 and P2 vary with the annealingdegree, particularly evident for P1. The P2 position shiftsslightly toward a higher Q value with increasing Ta, and thiscould be associated with the monotonic decrease ofintermediate-range ordering units. Below 583 K, P1 shifts toa lower Q value with increasing Ta. When Ta increases from593 to 613 K, P1 shifts to a larger Q value. Above 623 K, P1
Figure 40. Annealing time (ta) dependence of the excess heat capacityCp,exc (Cp difference between the standard and the first DSC upscans)for the 20.8CaO−15.6MgO−62.2SiO2 (in wt%) fibers annealed at823 K. Reproduced with permission from ref 352. Copyright 2013 theAmerican Ceramic Society.
Chemical Reviews Review
DOI: 10.1021/acs.chemrev.8b00510Chem. Rev. XXXX, XXX, XXX−XXX
AM

shifts to a lower Q with increasing Ta again. The intensity of P1decreases when increasing Ta above 583 K. The nonmonotonicevolution of the P1 position occurs in the same Ta region(Figure 41c) as that of the three-stage enthalpy relaxation(inset of Figure 41b). This implies that a drastic transition ofthe IRO structure should be responsible for the F−S transitionin the CuZrAl liquid. The structural unit size corresponding tothe P1 is calculated using the Ehrenfest’s formula runit = 1.23 ×2π/Qpp, where Qpp is the position of P1. The Ta dependence ofrunit is illustrated in the inset of Figure 41c. An anomalousdecrease of runit is observed when Ta increases from 593 to 613K. Since the increase in Ta generally causes a decrease in Tf,
this nonmonotonic change of runit implies a discontinuity in theMRO structural evolution during the F−S transition of GFLs.The size of the MRO structural units in the supercooledCuZr(Al) GFLs does not increase monotonically uponcooling, and this is in contrast to the trend predicted byAdam−Gibbs theory. Instead, they are dissociated into smallerclusters during the F−S transition. The dramatic decrease inthe structural unit size runit coincides with the anomalousincrease in enthalpy of the supercooled CuZr(Al) liquid duringcooling around 1.3∼1.4Tg. The F−S transition in CuZr(Al)liquid has been attributed to the competition among the MROclusters composed of different locally ordering configurations.Zhou et al. proposed a phenomenological scenario to explainthe structural evolution from the fragile to the strong phase inthe CuZr(Al) liquids.445
5. INVESTIGATING GLASS TRANSITION ANDRELAXATION BY FLASH DSC
5.1. Background
As described above, conventional DSC is a very effective toolfor exploring glass transition, enthalpy relaxation, liquid−liquidtransition, polyamorphic transition, and phase separation inglasses. A recently developed nanocalorimeter, i.e., Flash DSC1, has greatly extended the heating and cooling rates in therange of about 6 orders of magnitude, respectively,complementary to the conventional DSC. A brief introductionto Flash DSC is given in Section 2.3. Since Flash DSC wasinvented,446,447 its application has already led to much progressin understanding the nature of glass. For instance, somethermodynamic and dynamic properties of some organic glassformers such as the polystyrene (PS) and poly(ethyleneterephthalate)-glycol (PETg) were determined by Flash DSC,although they could not be probed by conventional DSC.448
Flash DSC was also applied to study enthalpy relaxation insome inorganic glasses, e.g., selenium glass, at heating/coolingrates of up to 104 K/s.449 Its rapid response time and ultrahighheating and cooling rates provide opportunities for researchersto detect those thermal processes that are inaccessible byconventional DSC. The critical cooling and heating ratesrequired to avoid crystallization in Au-based bulk metallicglasses (BMG) were found by Flash DSC to be dependent onsample mass, implying the so-called size-dependent nuclea-tion.450 This indicates that Flash DSC is advantageous fordeveloping and studying new types of glasses with low glass-forming ability. Although the Flash DSC technology hasreceived increasing attention, only a few studies have beenconducted on purely glassy systems. Many studies have beendevoted to understanding phase transitions, e.g., crystallization,and the thermal stability, e.g., decomposition of polymers. It isanticipated that Flash DSC will become an important tool forglass science and materials science in general. In this section,we review the Flash DSC studies mainly on both glasstransition451−457 and enthalpy relaxation in glass.449,457−460 Itshould be noted that, owing to the relatively low upscanningtemperature of Flash DSC 1 (773 K), its application is limitedto organic glasses,448,451−458,461 chalcogenide glasses,449 andmetallic glasses.459,460 With the arrival of the new generation ofFlash DSC 2, whose maximum upscan temperature can reach1273 K, applying the Flash DSC to oxide glasses becomespossible.
Figure 41. (a) The Tg-scaled temperature dependence of the viscosityof the Cu46Zr46Al8 liquid in both the equilibrium region and thesupercooled region (open circles). Solid curve: the fit of the viscositydata to the extended MYEGA equation (eq 7 in ref 20). Dashed pinkcurve: fragile term. Blue curves: strong term. The intersection point ofboth dashed lines is the characteristic temperature Tf‑s of the fragile-to-strong transition. (b) Isobaric heat capacity (Cp) versus temper-ature for the Cu46Zr46Al8 glass ribbons cooled at 106 K/s andannealed at Ta below Tg for 1 h, exhibiting the Ta effect on theenthalpy relaxation. Inset: the onset temperature of the exothermicpeak (Tonset) as a function of Ta. (c) Nonmonotonic structuralevolution (described by the structure factor S(Q), where Q is thescattering vector) with increasing Ta for 1 h. The bottom curve wasextracted from extended X-ray absorption fine structure (EXAFS)analysis. The dashed line and the dot−dashed line illustrate the shiftof the first (P1) and the second prepeak (P2) with increasing Ta,respectively. Inset: The structural unit size (runit) was calculated fromP1 with Ta. Reproduced with permission from ref 445. Copyright 2015AIP Publishing LLC.
Chemical Reviews Review
DOI: 10.1021/acs.chemrev.8b00510Chem. Rev. XXXX, XXX, XXX−XXX
AN

5.2. Glass Transition and Fragility
The effects of thermal history and measurement conditions onthe Tf and the nonstandard Tg values can be directlydetermined by the Flash DSC over a larger range of coolingrates compared to a conventional DSC. The latter can be usedto determine the Tf of a hyperquenched glass (Section 4.1.2).The range of cooling rates available in conventional DSCcovers only about 2 orders of magnitude, and hence, thedependence of Tf on the cooling rate is usually approximatedas an Arrhenius relation, from which the activation energy forstructural relaxation in the glass transition region, and thus theliquid fragility index m, can be calculated. However, such aderived fragility is systematically higher than that obtained byfitting the viscosity data to the MYEGA equation because ofthe abovementioned approximation.91 Therefore, the DSC-derived m values must be corrected by using an empiricalmodel proposed in ref 91 to obtain the relatively accurate mvalues. In contrast to the conventionally obtained m, the FlashDSC can be used to directly determine m by taking advantageof a large range of cooling/heating rates covering about 6orders of magnitude.448
A wide range of Tf can be directly accessed using Flash DSCfor glassy ultrathin films with different thicknesses since thecooling rates can be varied to a significantly larger extentcompared to a conventional DSC.448,451−454 In these studies,Tf is determined during cooling (downscan) in DSC, duringwhich the supercooled liquid state is vitrified. The Tf can alsobe determined during heating (DSC upscan) after cooling at agiven rate (Section 3.4.3). In some cases, this Tf has also beentermed the limiting fictive temperature (Tf′),462 while it is alsoreferred to as Tg in other cases.451,452,462 However, forsimplicity and convenience, in this article, we use Tf torepresent the fictive temperature determined during eithercooling or heating and use Tg to express the standard glasstransition temperature, i.e., the Tg value measured during aDSC upscan at 10 K/min after a downscan at 10 K/min. TheTg corresponds to the viscosity of 1012 Pa s (Figure 8). Theexact definitions of Tf and Tg are described in Sections 3.4.1−3. As a typical example, Tf of the polystyrene ultrathin films hasbeen studied as functions of the cooling rate and film thicknessby using Flash DSC.448,451,452,454−456 Tf was found to decreasewith the decreasing cooling rate (qc) independent of heatingrate (qh), along with the increase and shift of the enthalpyovershoot to higher temperatures as shown in Figure 42.451,452
The dependence of the Tf on qc can be described by theWilliams−Landel−Ferry (WLF) relationship.452,455 In addi-tion, combining conventional DSC with Flash DSC, the qcdependence of the Tg of polystyrene was also studied over arange of scan rates covering more than 6 orders of magnitude(3 × 10⁻³∼4 × 10³ K/s).454 The influence of the thermal lagduring measurement arising from the formation of a temper-ature gradient in the sample during scanning was taken intoaccount when evaluating Tg, and the corresponding correctionmethods were established.It was found by Gao et al. that the nanoconfined polymer
films have a substantially lower Tf than the bulk sample.451,452
As shown in Figure 42, a glass transition depression (i.e., aglass transition overshoot as shown in Section 3.2.1) wasdetected in the thin film samples that underwent differentcooling rates and subsequently the heating rate of 600 K/s.This overshoot decreases with increasing qc. Only a smallerovershoot occurs at the highest qc (within the experimentalerror) while it becomes more intense as qc decreases. These
findings are in line with those reported for polystyrene films456
and also for the thin polycarbonate films.453 Moreover, the Tgis dependent on film thickness, leading to a reduction of theliquid fragility m with decreasing film thickness451,453 since thedetermination of the fragility is intimately correlated to thevalue of Tg and thus to the Tg decrease in polymer films. Inother words, the liquid fragility, which reflects the structuralpacking efficiency of the films, is an important factor ingoverning the Tg-confinement effect.463
The effect of the film thickness (less than a critical value,e.g., the film thickness of 160 nm for polystyrene) on the glasstransition can be compromised by annealing the film at a giventemperature (e.g., 160 °C for the polystyrene film) for a periodof time.451 The mechanism of the recovery of the film Tg valueto the bulk value, i.e., from confined to bulk behavior, duringannealing was elucidated by considering the effects of themorphological change and thickening of the films, and theseeffects are correlated with the dewetting and microcavitygrowth of the films.451
As described in Section 3.6, the liquid fragility m isassociated with the structure and dynamics of glass-formingliquids and can be determined from the dependence of thefictive temperature on the cooling rate qc in conventional DSC.Due to the rather small range of cooling rates that conventionalDSC can reach, the log(1/qc) ∼ 1/Tf relation follows a nearArrhenius scaling around Tg. However, this relation of theconfined films, such as polycarbonate ultrathin films453 andselenium449 should be described by a non-Arrhenian model,e.g., by the MYEGA equation163,218,464 in the extended coolingrate range of Flash DSC. By using a reference temperatureTg,ref, which is obtained at the reference cooling rate qref of 0.1K/s, the Tf dependence of the cooling rate qc for the ultrathinfilms can be fitted by the Williams−Landell−Ferry (WLF)equation:455
q
q
C T T
C T Tlog
( )
( ),
,
c
ref
1 g g ref
2 g g ref
i
kjjjjjj
y
{zzzzzz =
−+ − (33)
where C1 and C2 are constants. Thus, the dynamic fragility mcan be determined by the following equation:77
Figure 42. Flash DSC upscans performed at a heating rate (qh) of 600K/s for a 160 nm thick polystyrene film on Krytox oil. Theendothermic peaks represent the glass transition of the samplesubjected to various cooling rates (qc) from 0.1 to 1000 K/s. The flowrate curves were rotated to be horizontal in the liquid state.Reproduced with permission from ref 451. Copyright 2013 AmericanChemical Society.
Chemical Reviews Review
DOI: 10.1021/acs.chemrev.8b00510Chem. Rev. XXXX, XXX, XXX−XXX
AO
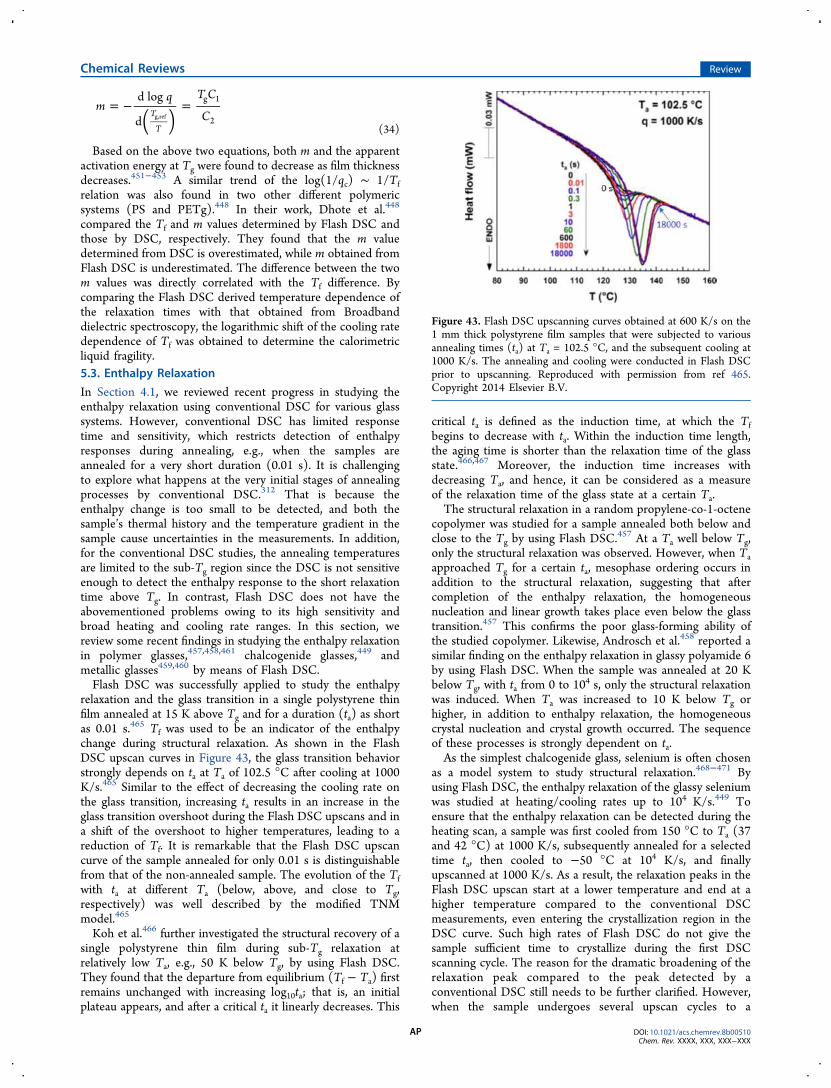
( )m
q TC
Cd log
dT
T
g 1
2g,ref= − =
(34)
Based on the above two equations, both m and the apparentactivation energy at Tg were found to decrease as film thicknessdecreases.451−453 A similar trend of the log(1/qc) ∼ 1/Tfrelation was also found in two other different polymericsystems (PS and PETg).448 In their work, Dhote et al.448
compared the Tf and m values determined by Flash DSC andthose by DSC, respectively. They found that the m valuedetermined from DSC is overestimated, while m obtained fromFlash DSC is underestimated. The difference between the twom values was directly correlated with the Tf difference. Bycomparing the Flash DSC derived temperature dependence ofthe relaxation times with that obtained from Broadbanddielectric spectroscopy, the logarithmic shift of the cooling ratedependence of Tf was obtained to determine the calorimetricliquid fragility.5.3. Enthalpy Relaxation
In Section 4.1, we reviewed recent progress in studying theenthalpy relaxation using conventional DSC for various glasssystems. However, conventional DSC has limited responsetime and sensitivity, which restricts detection of enthalpyresponses during annealing, e.g., when the samples areannealed for a very short duration (0.01 s). It is challengingto explore what happens at the very initial stages of annealingprocesses by conventional DSC.312 That is because theenthalpy change is too small to be detected, and both thesample’s thermal history and the temperature gradient in thesample cause uncertainties in the measurements. In addition,for the conventional DSC studies, the annealing temperaturesare limited to the sub-Tg region since the DSC is not sensitiveenough to detect the enthalpy response to the short relaxationtime above Tg. In contrast, Flash DSC does not have theabovementioned problems owing to its high sensitivity andbroad heating and cooling rate ranges. In this section, wereview some recent findings in studying the enthalpy relaxationin polymer glasses,457,458,461 chalcogenide glasses,449 andmetallic glasses459,460 by means of Flash DSC.Flash DSC was successfully applied to study the enthalpy
relaxation and the glass transition in a single polystyrene thinfilm annealed at 15 K above Tg and for a duration (ta) as shortas 0.01 s.465 Tf was used to be an indicator of the enthalpychange during structural relaxation. As shown in the FlashDSC upscan curves in Figure 43, the glass transition behaviorstrongly depends on ta at Ta of 102.5 °C after cooling at 1000K/s.465 Similar to the effect of decreasing the cooling rate onthe glass transition, increasing ta results in an increase in theglass transition overshoot during the Flash DSC upscans and ina shift of the overshoot to higher temperatures, leading to areduction of Tf. It is remarkable that the Flash DSC upscancurve of the sample annealed for only 0.01 s is distinguishablefrom that of the non-annealed sample. The evolution of the Tfwith ta at different Ta (below, above, and close to Tg,respectively) was well described by the modified TNMmodel.465
Koh et al.466 further investigated the structural recovery of asingle polystyrene thin film during sub-Tg relaxation atrelatively low Ta, e.g., 50 K below Tg, by using Flash DSC.They found that the departure from equilibrium (Tf − Ta) firstremains unchanged with increasing log10ta; that is, an initialplateau appears, and after a critical ta it linearly decreases. This
critical ta is defined as the induction time, at which the Tfbegins to decrease with ta. Within the induction time length,the aging time is shorter than the relaxation time of the glassstate.466,467 Moreover, the induction time increases withdecreasing Ta, and hence, it can be considered as a measureof the relaxation time of the glass state at a certain Ta.The structural relaxation in a random propylene-co-1-octene
copolymer was studied for a sample annealed both below andclose to the Tg by using Flash DSC.457 At a Ta well below Tg,only the structural relaxation was observed. However, when Taapproached Tg for a certain ta, mesophase ordering occurs inaddition to the structural relaxation, suggesting that aftercompletion of the enthalpy relaxation, the homogeneousnucleation and linear growth takes place even below the glasstransition.457 This confirms the poor glass-forming ability ofthe studied copolymer. Likewise, Androsch et al.458 reported asimilar finding on the enthalpy relaxation in glassy polyamide 6by using Flash DSC. When the sample was annealed at 20 Kbelow Tg, with ta from 0 to 104 s, only the structural relaxationwas induced. When Ta was increased to 10 K below Tg orhigher, in addition to enthalpy relaxation, the homogeneouscrystal nucleation and crystal growth occurred. The sequenceof these processes is strongly dependent on ta.As the simplest chalcogenide glass, selenium is often chosen
as a model system to study structural relaxation.468−471 Byusing Flash DSC, the enthalpy relaxation of the glassy seleniumwas studied at heating/cooling rates up to 104 K/s.449 Toensure that the enthalpy relaxation can be detected during theheating scan, a sample was first cooled from 150 °C to Ta (37and 42 °C) at 1000 K/s, subsequently annealed for a selectedtime ta, then cooled to −50 °C at 104 K/s, and finallyupscanned at 1000 K/s. As a result, the relaxation peaks in theFlash DSC upscan start at a lower temperature and end at ahigher temperature compared to the conventional DSCmeasurements, even entering the crystallization region in theDSC curve. Such high rates of Flash DSC do not give thesample sufficient time to crystallize during the first DSCscanning cycle. The reason for the dramatic broadening of therelaxation peak compared to the peak detected by aconventional DSC still needs to be further clarified. However,when the sample undergoes several upscan cycles to a
Figure 43. Flash DSC upscanning curves obtained at 600 K/s on the1 mm thick polystyrene film samples that were subjected to variousannealing times (ta) at Ta = 102.5 °C, and the subsequent cooling at1000 K/s. The annealing and cooling were conducted in Flash DSCprior to upscanning. Reproduced with permission from ref 465.Copyright 2014 Elsevier B.V.
Chemical Reviews Review
DOI: 10.1021/acs.chemrev.8b00510Chem. Rev. XXXX, XXX, XXX−XXX
AP

temperature well above Tg, some crystal growth occurs, leadingto a smaller relaxation peak.449 In summary, both the structuralrelaxation and nucleation processes induced by sub-Tg or near-Tg annealing can be detected by using Flash DSC.As described above, the common feature of enthalpy
relaxation in glassy polymers is that the glass transitionovershoot shifts to higher temperatures with increasing ta at acertain Ta. This means that Tg increases, and thus the kineticstability of the glass is enhanced, which is signified by theincrease of the temperature range of the glass state. As isknown, increasing the kinetic stability of metallic glasses wouldextend their utility to higher temperatures. By using FlashDSC, Wang et al.459 succeeded in increasing the kineticstability, i.e., increasing the temperature range of the glass stateby raising the Tg of Au49Cu26.9Ag5.5Pd2.3Si16.3 glasses byoptimizing the annealing protocol. The optimum annealingprotocol was determined by considering both the α and βrelaxation processes since the α relaxation is related to thekinetic stability while the thermodynamic stability is linked toboth α and β relaxation. The maximum Tg increase of 28 K ofthe sample annealed at 0.85Tg for 10
5 s is illustrated in Figure44. The enhanced kinetic stability is analogous to that of a
vapor-deposited glass. Another striking feature shown in Figure44 is that the crystallization peak and the onset temperature ofcrystallization (Tx) remain unchanged with extending ta, whilethe glass transition peak shifts to a higher temperature, i.e., Tgincreases. This phenomenon implies that the annealing historyof all the samples annealed for various ta has been completelyerased upon a Flash DSC upscan, and consequently thesupercooled liquids above Tg have the same structure and samelevel on PEL, and hence, the crystallization behavior (e.g., peakshape, size, and Tx) is the same for all the samples.In regard to a vapor-deposited ultrathin Au-based metallic
glass film (i.e., so-called nanoglass), Wang et al.460 haveexplored the combined effect of ultrastable character andnanoglobular microstructure on the kinetic behavior by usingFlash DSC. The ultrastable nanoglass has much higher Tg andTc than a normal ribbon sample at low upscan rates, e.g., 300K/s. The higher kinetic stability of the vapor-deposited glass(e.g., compared to melt-quenched glass) is attributed to boththe relaxation during deposition and the nanoglobularmicrostructure. It was also found that the kinetic stabilitywas reduced, i.e., Tg was lowered, by preheating up to thesupercooled liquid region at a certain heating rate.
Recently, Cubeta demonstrated that Flash DSC couldprovide insights into the slow molecular kinetics of amorphousmaterials at temperatures far below Tg.
472 Cubeta discoveredthat the complex devitrification kinetics of glasses reduced to azero-order, Arrhenius-like rate law in the high limit of heatingrates. Both the melt-quenched glasses and the vapor-depositedamorphous phases of methylbenzene underwent heteroge-neous, surface-facilitated relaxation when they were heated at asufficiently high rate. The simplified kinetics is definedprimarily by the initial structural state of the sample at lowtemperatures, which is evidenced by the high activationenergies for these relaxation processes. Cubeta proposed amodified Wilson−Frenkel model of front-propagated structuralrelaxation, which was validated by Flash DSC data. Thesefindings have improved the theoretical understanding of theformation and devitrification of glasses.
6. PROBING GLASS TRANSITION AND RELAXATIONBY TMDSC
The microscopic origins of glass formation are more complexthan the macroscopic properties measured by DSC. Thespatially heterogeneous nature of supercooled liquid dynam-ics425 leads to the continuous breaking of the ergodicity71 inthe liquid-to-glass transition. The length scale of the dynamicheterogeneities changes with temperature in liquid,425 and theheterogeneous liquid structure continuously freezes-in in theglass state.65,71,110,425 Structural relaxation can be considered asthe inverse of the liquid-to-glass transition when the timeconstraint is removed.110 Since the distribution of thedynamics of spatial heterogeneities is proportional to therelaxation time distributions, a nonexponential relaxationbehavior is observed during the isothermal relaxation.473
DSC can be used to investigate the nonexponential relaxationprocesses. However, the heat flow signal obtained from DSCmeasurements is the convolution of various glass transitionrange responses.54,61,474,475 Development of the TMDSCmethod54,61 (Section 2.4) opened up a new venue for thedetailed calorimetric analysis of dynamic processes in thevicinity of the glass transition. In this section, we describedifferent approaches for interpreting the TMDSC signals andreview recent progress in understanding glass transition andglass relaxation, made by TMDSC.
6.1. Interpretation of TMDSC Signals
6.1.1. Complex Heat Capacity. Birge and Nagel initiallyintroduced the idea of the complex heat capacity in theirisothermal specific heat spectroscopy studies.476,477 Thetemperature dependence of the resistance of a thin metalheater is used to measure the drop of the product of the heatcapacity (Cp) and thermal conductivity in a glass-formingsupercooled liquid when a sinusoidal current is passed. Thechange in the thermal conductivity is negligible in comparisonto the rapid drop of Cp. Thus, the total measured product is afunction of the heat capacity while the thermal conductivitycan be considered as a constant. Then, the same measurementsare repeated in a very wide range of frequencies (0.2 Hz−6kHz) and at various temperatures. A systematic shift in thetemperature onset of the Cp drop is observed in the frequencyspectrum. The onset temperature of the Cp drop increases withincreasing frequency, and the onset of the frequency of the Cpdrop increases with increasing temperature.476 Specific heatspectroscopy experiments proved (i) the frequency depend-ence of Cp
59,476,478 and (ii) isothermal glass transition when
Figure 44. Cp curves for Au49Cu26.9Ag5.5Pd2.3Si16.3 glass samplesannealed at 373 K (=0.85Tg) for various times (0 ∼ 105 s). Verticalblack arrows: Tg and the onset temperature of crystallization (Tx).Horizontal red arrow: an increase of Tg of ΔTg = 28 K from 424 to452 K by extending ta from 0 to 105 s. Reproduced with permissionfrom ref 459. Copyright 2016 Acta Materialia Inc. Published byElsevier Ltd.
Chemical Reviews Review
DOI: 10.1021/acs.chemrev.8b00510Chem. Rev. XXXX, XXX, XXX−XXX
AQ

the external time (text) is changed while the internal time (tint)is constant.65,110,478 The Cp is generally not considered to be adynamic property,477 but frequency-dependent heat capacityexperiments demonstrated that the heat capacity could bemeasured as a dynamic susceptibility when a smallperturbation is applied to the equilibrium liquid.476,477 Thisbrilliant experiment helps clarify the distinction between theequilibrium and ergodic systems.478 Even though the liquid iswell above the Tg defined by Angell,1 which is independent ofthe thermal history,313,479 a rapid change in the heat capacity isobserved as a function of the frequency.476 The liquid is inthermodynamic equilibrium, but the breaking of the ergodicityis observed when text varied from text ≫ tint to text ≪ tint, whichcorresponds to limit ω→0 and limit ω→∞, respectively.110,478
Although there is no net change in energy between the liquidand the surrounding environment,476,477,480 the entropychanges.477 This can be attributed to the lag between theheat flow and temperature oscillations. The phase lag betweenthe input and output functions is proportional to the imaginarypart of the complex heat capacity (Cp″). Considering theKramers−Kronig481 relations frequency dependent complexheat capacity is shown as
C C iC( )p p pω* = ′ − ′′(35)
where Cp* is the frequency dependent complex heat capacityand Cp′ and Cp′′ are the real and the imaginary parts of thecomplex heat capacity, respectively.The complex heat capacity concept provides a basis for
Schawe’s analysis.475,482 In TMDSC, a sinusoidal heat ramp isused,483 unlike the classical specific heat spectroscopymeasurements where the glass or liquid is held isother-mally.476,477 Each period of oscillation is considered a steadystate, and the amplitude of the temperature is the appliedperturbation.480 In a standard TMDSC measurement inheating mode when heating from a temperature well belowthe Tg to a temperature well above the Tg in the liquid, thefollowing events are observed:
1. T ≪ Tg: Cp involves only vibrational contribution, andaverage relaxation times are much slower than the timescales of each period of oscillation. Hence, the sinusoidalheat flow response is in phase with the sinusoidal heatingrate input. The amplitude of the modulated heat flowchanges as a function of the change in Cp; however, it isvery minimal due to the weak temperature dependenceof the heat capacity below the transition.62
2. T ∼ Tg: Near the glass transition, heat capacitycontinuously increases while it involves both vibrationaland configurational contributions. The heat transfer isswitching from atomic vibrations to molecular motionsas the average relaxation times are in the same range ofthe external time scale (period of oscillations). Spatiallyheterogeneous dynamics is the main source for thedistribution of relaxation times that could be consideredas a system where each dynamic domain has its internalrelaxation times and fictive temperatures. Therefore,each dynamic domain’s heat flow response starts to lagbehind the external time scale at a different temperature.Because of the continuously changing lag between theinput and out functions, TMDSC signals yield a phaseangle peak.62
3. T ≫ Tg: Relaxation times of all dynamic domains areshorter than the external time scale so that no phase lag
is observed. The output signals are very similar to thosein the glass, and the phase angle reaches to a zerovalue.62
The phase angle (ϕ) obtained from TMDSC measurements,as introduced in Section 2.4, shows similar characteristics toother dynamic susceptibilities such as those in the dielectricspectroscopy.474,475,482 In a monolithic and compositionallyhomogeneous glass, a normal distribution of the phase anglepeak can be fitted with a Gaussian function.484 Accordingly, acomplex heat capacity approach requires analysis of the phaseangle and input and output functions. The output function, themodulated heat flow rate (Φm), can be written as
A C t( ) cos( )m pω ω ω ϕΦ = ′| | − (36)
where A′ is the amplitude of the modulated heating rate,|Cp(ω)| is the modulus of the complex heat capacity, and ϕ isthe phase angle between the input and output functions.|Cp(ω)| is shown as
C C C( )p p2
p2ω| | = ′ + ′′ (37)
where Cp′ is the real and Cp″ is the imaginary part of thecomplex heat capacity. The modulus of the complex heatcapacity can be estimated by calculating the amplitude of themodulated heat flow (Φa) and the A’ using
CA
( )paωω
| | =Φ′ (38)
and real and imaginary parts can be calculated from themodulus of complex heat capacity and the phase angle:
C C( ) ( ) cosp pω ω ϕ′ = | | (39)
and
C C( ) ( ) sinp pω ω ϕ″ = | | (40)
6.1.2. Nonequilibrium Thermodynamics and LinearResponse. The linear dynamic susceptibility approachrequires the linear response of a system when it is perturbed.482
In theory, the input function (modulated heating rate) and theoutput function (modulated heat flow) must be linearlyscaled.485 However, the ideal linear response could occur onlyif the sample thickness was infinitely small.62,485,486 To test thelinearity of the TMDSC experiments, Lissajous curves are usedto examine the relationship between two parametricequations.62,485 In TMDSC experiments, the linear responsecan be shown in an elliptical Lissajous curve when themodulated heat flow is plotted against the modulated heatingrate. The shape and size of the ellipsoids depend on thethermal conductivity of the material and thickness of thesample. In linearly responding modulation conditions, eachperiod of oscillation is displayed as an ellipse, the slope ofwhich changes with temperature throughout the glasstransition. When modulation conditions do not satisfy thelinear response, the ellipsoid shape gets distorted or non-geometric and irregular shapes are observed.485 The change inenthalpy in each period of oscillation must be as small aspossible to preserve the linear response of the glass. SinceTMDSC is not based on isothermal conditions, rapid changesin Cp might cause a significant heat flow effect in addition tothe small sinusoidal heat flow responses. If the underlyingheating rate exceeds a maximum limit, Cp changes catastroph-ically during a period of oscillation. Therefore, the output
Chemical Reviews Review
DOI: 10.1021/acs.chemrev.8b00510Chem. Rev. XXXX, XXX, XXX−XXX
AR

function becomes distorted, and the system’s response isnonlinear at high heating rates.485 The amplitude of theoscillations also affects linearity. Perturbations are supposed tobe small enough to ensure that the glass is close to its steadystate over the period of oscillation.487
The nonlinear behavior becomes crucially more problematicin the thermally activated processes where the enthalpy changeis relatively significant. Hence, TMDSC is predominantly usedin the glass transition range since the enthalpy change in themelting or crystallization is orders of magnitude higher thanthe enthalpy changes in the glass transition range. Preserving alinear response in the crystallization or melting process isnearly impossible with standard TMDSC conditions due to therapid change in the enthalpy as a function of time in quasi-isothermal conditions or as a function of temperature duringthe sinusoidal heating. It was previously reported that evenchanges in the thermal history (fictive temperature) might leadto a nonlinear behavior in the glass transition range.62 Sincethe magnitude of the crystallization peak is often much biggerthan the glass transition peak, it can be expected that sustainingthe linear response in the crystallization range is much morechallenging than in the glass transition range, and in somecases impossible to achieve throughout the crystallizationprocess. One might argue that the use of a very smallamplitude of oscillation might help achieve linear behavior; itcomes with its own disadvantages, particularly in the signal-to-noise ratio. Concerns about linearity were acknowledged inprevious investigations;62,474,475,482 however, there is nosystematic study in the crystallization or melting to prove thepossibility of achieving linear behavior neither by providing theLissajous curves nor by showing the independence of thereversing heat flow from the amplitude of the oscillation. Thefeasibility of the utilization of TMDSC in glass crystallizationstudies needs further investigation.Modulation conditions depend strongly on the physical
properties of glasses. The thermal history62 and fragility487 ofglass-forming systems are the two main parameters that governthe limitations of the linear response. Thermal history mightlimit the modulation conditions if there were a significantdeviation between Tf and Tg. When Tf ≫ Tg, a strongexothermic peak is observed; and when Tf ≪ Tg, a largeendothermic peak is measured. In both cases, modulationconditions are more limited, and the heating rate must belower than TMDSC conditions used in glasses when Tf is equalor close to Tg.
62
Figure 45 displays the Lissajous curves for selenium afterlong isothermal annealing for over a week at a sub-Tgtemperature.62 When the heating rate (qh) is slow enough(e.g., 1 °C/min), and the amplitude (A) is relatively small (0.8°C), linearity could be satisfied even after 249 h of annealing.Figure 45a shows the linear, elliptical Lissajous curves in theglass and liquid regions where it is easier to preserve the linearresponse. Figure 45b shows the linear response in the glasstransition region where strong endothermic contributionscould cause nonlinear behavior if proper modulationconditions were not chosen. Figure 45c displays an exampleof the nonlinear behavior of the selenium sample after 192 h ofisothermal annealing at the same sub-Tg temperature when theheating rate is faster (2 °C/min) and the amplitude is slightlylarger (1 °C).62 Even though the annealing time is shorter,making thermal history-related enthalpic contributions smaller,a nonlinear behavior is observed in the glass transition range asthe ellipse is distorted. It should also be noted that the liquid
and glass regions preserve their linearity since the heat flowdoes not show a rapid change as a function of the underlyingmean temperature.62 This example clearly shows thesignificance of the thermal history and how small changes inthe measurement conditions change the applicability of thedynamic susceptibility approach to TMDSC.The fragility of glass affects the linearity of the TMDSC
conditions, independent of the thermal history.487 Thethermodynamic signature at the glass transition, such as ΔCpor ΔTg is directly correlated to the kinetic fragility (m). ΔCp isproportional to m/Tg (eq 27),108,214 whereas ΔTg is inverselycorrelated with m.101 Therefore, a more careful selection ofTMDSC conditions is needed for fragile glass formers. Arsenicselenides can be used to make a comparison with the previousexample of glassy selenium. When selenium is mixed witharsenic, stronger As−Se glass compositions can be obtained.484
For instance, linearity can be easily satisfied in As30Se70 glasscomposition when modulation conditions of A = 3 °C, q = 3°C/min, and ω = 0.005 Hz are used.55 Compared to selenium,As30Se70 is a much stronger glass, and the Cp jump is muchsmaller.484 Besides, the Tf of As30Se70 is very close to Tg as itsquenching rate is very close to the underlying meantemperature55 of the modulation, while the Tf of theisothermally annealed selenium glass is well below the Tg.
62
The significance of the linearity is not limited to chalcogenidesor low Tg glasses. In a recent study, the importance of the
Figure 45. Lissajous curves for glassy selenium after isothermalannealing at 25 °C for 249 h when A = 0.8 °C, qh = 1 °C/min, and ω= 0.0083 Hz: (a) in the glass and liquid range; (b) in the glasstransition range. (c) Nonlinear response in the glass transition region.Reproduced with permission from ref 62. Copyright 2013 theAmerican Institute of Physics.
Chemical Reviews Review
DOI: 10.1021/acs.chemrev.8b00510Chem. Rev. XXXX, XXX, XXX−XXX
AS

fragility under TMDSC conditions was demonstrated incalcium alumina silicate glasses.487
6.1.3. Reversing and Nonreversing Heat Flow.Derivation of the nonreversing and reversing heat flow involvesmuch less complicated mathematics since the phase angle ϕ isnot included in the data analysis. The reversing heat flow Hrevcorresponds to the amplitude of the modulated heat flow termas in eq 36.474 It can also be converted to reversing heatcapacity by normalizing the amplitude of the modulatedheating rate (A’), and it would then be equivalent to themodulus of the complex heat capacity. In this analysis, themethod output function is considered to consist of two parts:the thermodynamic reversing part (eq 12 in Section 2.4) andthe kinetic part f(t,T) associated with time-dependentevents54,61,474,483 shown as
C q T t f t Tcos( ) ( , )u p ω ωΦ = [ + ] + (41)
where Φu is the total underlying heat flow and f(t,T) isassociated with the nonreversing part of the heat flow. Thenonreversing heat flow ΔHnr is obtained by subtraction of thereversing heat flow Hrev from the total underlying heat flowthat is equivalent to the heat flow in the conventional DSCmeasurements:55,474,483
H Hnr u revΔ = Φ − (42)
In this analysis, the phase angle is not included, and theassumption is that the kinetic component corresponds to thesubtraction of the amplitude of the modulated heat flow fromthe total heat flow, which should yield the nonreversing heatflow.55 The comparison of these two methods is presented inthe following section.6.1.4. Comparison of the Data Analysis Methods.
There has been an ongoing debate480 on the methods used forthe analysis of TMDSC signals and the meaning of analyzeddata since the introduction of TMDSC. The disagreement isnot limited to thermophysics scientists and thermal analysisinstrument developers but is also debated by glassscientists488−491 who have been utilizing TMDSC to elucidatefundamental physics questions about glass relaxation,62,484
glass formability, and topological constraints.489,492−497 Thecomplex heat capacity approach relies on the linear responsetheory and is analogous to the methods used in other dynamicsusceptibilities.498,499 The thermodynamic meaning of theimaginary part of the complex heat capacity is debated sincethere is no heat dissipation.477,480,500 However, there is aconsensus that the complex notation in the glass transitionrange can be explained by the Cp drop when the period ofoscillation is close to the average relaxation times.480 However,the nonreversing heat flow concept is still being debated due tothe empirical nature of the analysis.62,474 Reversing heat flow isthe modulus of a complex quantity, and it is subtracted fromthe underlying heat flow that is a real quantity. Schawe claimsthat the two signals are not comparable474 while Readingclaims that it is the difference between these two propertiesthat represents the kinetic component of the heat flowfunction.501 Schawe also points out that the nonzero,nonreversing heat flow signals while cooling from thesupercooled liquid to the glass do not agree with theinterpretation of such peaks as enthalpy relaxation.474
Frequency correction502 can be considered as a solution tothe confusing peaks observed when the sample is cooled fromliquid instead of heating. The ongoing debate among theexperimentalists is presented in Section 6.4.
6.2. Cp″ in the Frequency Spectrum
In standard TMDSC measurements, a constant frequency isapplied to an average heating ramp cycle. Therefore, Cp″ peaksobtained from TMDSC signals correspond to the response ofthe glass for a constant frequency. However, consecutivemeasurement can be conducted by changing the frequency,while all other measurement conditions remain the same.Conventionally available DSC works in limited modulatedconditions to provide a period of oscillations in the range of40−200 s. The observation time range covered by TMDSC iscomparable to the relaxation times around Tg. Each dynamicdomain has its internal relaxation times for a correspondingtemperature. The Cp″ peak is the sum of those correspondingtemperatures when the observation time is equal to the internalrelaxation time.62 Therefore, a Cp″ vs temperature plot can beconsidered as the temperature probability distribution. The tipof the peak is correlated with the mean relaxation time of theglass when the distribution is Gaussian.62,484 When thefrequency is changed, the peak position shifts while thenormalized distribution functions remain the same. Theexternal observation time is proportional to the period ofoscillation (Po) and denoted as Po/2π. When the frequency isincreased, the internal relaxation time deviates from theobservation time at higher temperatures. Therefore, the Cp″peak shifts to higher temperatures at higher frequen-cies.484,503,504 The relationship between frequency and peaktip could be expected to be non-Arrhenius in fragile glasses.1
However, the frequency range of the TMDSC measurements isrelatively short. Thus, a short-range Arrhenius relationshipbetween the frequency and the tip of the Cp″ peak position canbe used to determine the activation energy for structuralrelaxation as known from thermally activated processes.Various studies show the correlation between frequency andthe peak position in an Arrhenius fashion for a limitedfrequency range, and a systematic compositional change inactivation energy was calculated for those systems.484,503,504
Figure 46 shows the frequency dependence of the Cp″ peakand the method used to estimate the activation energies fromTMDSC signals.504
Even though TMDSC does not cover a wide range offrequencies compared to most other dynamic measurements, itstill covers a sufficiently wide range to probe the dynamicprocesses at around Tg. Non-Gaussian Cp″ peaks might beassigned to the phase separation in the glass.484 Macroscopicand microscopic inhomogeneities can be investigated byexamining the frequency dependence of the Cp″ peak. Aphase separated arsenic-rich As-Se glass has been investigatedby frequency dependent TMDSC measurements.484 It is amacroscopically phase-separated glass, and the signature of thephase separation could be observed in other macroscopicmeasurements such as the standard DSC measurements.484
However, DSC cannot distinguish the dynamics of glassyregions. The As-Se glass structure consists of AsSe3 pyramidsand selenium chains depending on the arsenic content.505
Although the dimensionality of the network changes as afunction of composition, the backbone of the structure remainsas AsSe3 pyramids.484,505 When the arsenic content over-exceeds the stoichiometric composition, molecular cagelikestructural units start to appear.505 The dimensionality of theseunits is very small or zero since they are weakly connected tothe backbone of the structure by van der Waals interactions.484
Therefore, the dynamic response of the pyramidal units, as afunction of frequency, is expected to be much slower than that
Chemical Reviews Review
DOI: 10.1021/acs.chemrev.8b00510Chem. Rev. XXXX, XXX, XXX−XXX
AT

of the molecular units. TMDSC measurements are conductedin a period of oscillation range of 100 to 200 s. In eachTMDSC scan, two distinct Cp″ peaks are obtained frommeasurement signals, and the low-temperature peak isobserved to be Gaussian, while the high-temperature peakcannot be fitted to a Gaussian function.484 The high-temperature peak is clearly a convolution of different dynamicresponses. The results show more interesting features when thefrequency dependence is investigated. As previously explained,the activation energy for structural relaxation can be estimatedfrom the frequency dependence of the tip of the peakpositions. The activation energy of the low-temperatureGaussian peak is calculated to be comparable to that of thecompositions where there is no significant presence of excessselenium chains or molecular As-Se cage like units.55,484 Inaddition to the activation energy, the full width at half-maximum (fwhm) of the low-temperature peak is found to beclose to the fwhm value of the As40Se60 composition. Thus thelow-temperature peak can be assigned to the dynamic responseof the backbone of the structure.55,484 However, there is nosignificant shift in the high-temperature Cp″, as would beexpected from fragile glasses.55,484 The convoluted non-Gaussian peak shape can be explained by the diversity of themolecular units in the arsenic-rich As-Se compositions.505 It isknown from NMR and Raman studies that various cage-likestructures such as As4Se4, As4Se3, and As4 form in arsenic-richglasses.505 Each of these cage structures has its ownindependent dynamic response and distribution of structuralrelaxation.484 As a result, the backbone of the structure remainsin the phase separated glass while the molecular motifs areweakly connected to the glass, and their dynamic responses aresignificantly different and convoluted in a separate Cp″
peak.55,505 This study is an excellent example of probing thedynamics and liquid properties of different phases inheterogeneous glasses.
6.3. Cp″ in the Temperature Spectrum
Since the Cp″ peak is correlated to the relaxation timedistribution, it can be used to understand the thermal historyeffects and the liquid dynamic properties of differentcompositions. To elucidate the dynamical origins of non-exponential relaxation, the thermal history dependent Cp″ peakis analyzed. In a systematic sub-Tg annealing study thenonmonotonic evolution of fwhm is observed while thestandard DSC measurements show monotonic evolutions ofreleased enthalpy or Tf. The fwhm scales linearly with thewidth of the distribution of the relaxation structural times.62
Cp″ narrows down as a function of annealing time asdemonstrated in previous studies in aging polycarbonates.506
However, the fwhm does not follow the same trend withannealing time due to the nonmonotonic evolution of enthalpyfluctuations.62 This can be better understood by analyzing theCp″ peak for each annealing time. Initially, the high-temperature tail of the Cp″ peak shifts with annealing time.The high-temperature tail corresponds to fast relaxing low-density regions. These regions rearrange much quicker thanhigh-density slow regions. Therefore, an asymmetric peak isobserved in the initial parts of relaxation.62 The asymmetricCp″ peak shape is also reproduced in an aging study in adifferent glass system,507 and it can be expected to be auniversal feature of the relaxation processes in glasses. Afterlong annealing times, the low-temperature tail of the Cp″ peak,which corresponds to high density and low-mobility regions,starts to move slowly while the high-temperature tail reaches aplateau of shifting rate. Because of this nonmonotonic shiftingrate, the Cp″ peak becomes less asymmetric for very longannealing times, and the fwhm broadens again.62 In standardDSC measurements, these events are represented as a sum ofall contributions from all regions. Thus a monotonic stretchedexponential behavior is observed. TMDSC allows us toinvestigate the mechanisms that govern the stretchedexponential relaxation. The first-ever experimental demon-stration of the nonmonotonic evolution of enthalpy fluctua-tions is demonstrated by the complex heat capacityapproach.62 The same trend of enthalpy fluctuations is alsoshown with enthalpy landscape model simulations. Theseresults are also in good agreement with a similar study thatshows the nonmonotonic evolution of density fluctuations inboth glassy selenium and an oxide glass.508
The fwhm of the Cp″ peak can also be correlated with thefragility of different glass compositions.484 Since the Cp″ peakis correlated to the distribution of relaxation times, it can beused to evaluate the relationship between the fragility andrelaxation variation in different compositions. As-Se is a goodchoice of glass family since arsenic and selenium atoms arevery similar in size, it has a broad compositions range for glassformation, and a wide range of fragilities can be studied bysimply changing the selenium content.505 The fwhm of the Cp″is compared with the m values, which were obtained byequilibrium viscosity measurements near the glass transitionrange. The results are intriguing because the fwhm of the Cp″peak is inversely proportional to m up to high arsenic contentswhere the glass compositions tend to be phase separated.Figure 47 shows the Gaussian fit and fwhm on a Cp″ peak,fwhm as a function of arsenic content, and fragility index values
Figure 46. (a) Temperature dependence of Cp″ for various oscillationperiods for a side-chain liquid crystalline polymer, i.e., polyM[3-(4@-cyano-4-biphenyloxy)propoxycarbonyl]ethylene. (b) Temperaturedependence of the frequency at the Cp″ peak (log10 ω) used toestimate the activation energy. Reproduced with permission from ref504. Copyright 2000 Royal Society of Chemistry.
Chemical Reviews Review
DOI: 10.1021/acs.chemrev.8b00510Chem. Rev. XXXX, XXX, XXX−XXX
AU

as a function of mean coordination number ⟨r⟩.484 It shouldalso be noted that ⟨r⟩ has a simple linear correlation witharsenic content in As-Se glasses and it can be shown as ⟨r⟩ = 2+ x where x is the arsenic molar fraction content in AsxSe1−xcompositions.505 Another aspect of these results is that higherarsenic content glasses do not follow this trend since the fwhmis artificially broadened due to the diverse dynamics of variousmacroscopically separated structural units.484
The tip point of the Cp″ peak is equal to the temperaturewhere the average relaxation time is 2πP. Since the standardperiods used in TMDSC measurements correspond to a rangeof 40 s < (P) < 200 s, Tg can be estimated by the extrapolationof the arhenius trend of tip points of Cp″ from higherfrequencies to lower frequencies in the vicinity of Tg. Thefrequency dependence of the Cp″ peak temperature can also beused to estimate the temperatures that correspond to theaverage relaxation time for each oscillation frequency. Then,the peak temperature (Tω) can be normalized by Tg as inAngell’s universal plot to scale viscosity slopes of glass-formingsupercooled liquids. The slope of the relaxation time curvewhen plotted vs Tg/Tω yielded the m value of the glass.509 Them values estimated from TMDSC agree well with thosereported in the literature, which are estimated using thestandard viscosity method.509 In a recent study, the m values ofcalcium−alumina−silicate glasses are determined by theTMDSC method,487 where a systematic offset is observed asa function of silica content.487,510 A similar systematicdeviation is observed in another study when the m values
determined by conventional DSC are compared to viscositydata.91 Empirical models can be used to correct the results ifthe goals are pragmatic and confined to a single family of glasscompositions. However, there is no unambiguous explanationpresented to clarify the systematic deviation. To find the originof such a deviation, it should be considered that both DSC andTMDSC methods for the m determination are based on thethermodynamic properties, e.g., heat flow, enthalpy, and heatcapacity, of glass-forming liquids, whereas standard mdetermination is based on dynamic properties, e.g., shearviscosity and relaxation time. The activation energy for viscousflow and activation energy for enthalpy relaxation are assumedto be equivalent. However, this assumption has not beenproven in a wide range of glass compositions. Intuitiveassumptions are preferred for preliminary experiments, butmore comprehensive studies are needed to judge if theassumption is reasonable. Also, equilibrium viscosity measure-ments used to estimate the fragility index are challenging andtime-consuming and very limited data can be found in theliterature based on those measurements.Another interesting application of TMDSC is the evaluation
of the stretched exponential structural relaxation function atTg, from which the nonexponentiality of the enthalpyrelaxation can be quantified. Matsuda et al.511 analyzed thereal and imaginary parts of the complex heat capacity for aseries of lithium borate glasses by using an analogy to thedielectric spectroscopy. The Havriliak−Negami (HN) equa-tion was used to fit the Cole−Cole plot,512 which is displayed
in Figure 48 as the imaginary part of the complex heat capacityvs the real part. The HN equation513 is shown as
C CC C
i( )
1 ( )p pp0
p
D Dω
ωτ* = +
−[ + ]α γ
∞∞
(43)
where Cp* is the complex isobaric heat capacity, γD and αD areDebye parameters, τ is the relaxation time, and Cp
0 and Cp∞
are the isobaric heat capacity in the zero and infinite frequencylimits. Based on the parameters obtained from the fit andconsidering their correlation to the KWW stretching exponentβ:514
D D1.23γ α β= (44)
Figure 47. (a) Gaussian fit on Cp″ peak for As30Se70; (b) Fragilityindex m and fwhm as functions of arsenic content (linearly correlatedto the average coordination ⟨r⟩). Reproduced with permission fromref 484. Copyright 2012 American Physical Society.
Figure 48. Measured data vs Havriliak−Negami fit used to estimatethe stretched exponent for 12Li2O.88B2O3 glass. Reproduced withpermission from ref 510. Copyright 2008 Physical Society of Japan.
Chemical Reviews Review
DOI: 10.1021/acs.chemrev.8b00510Chem. Rev. XXXX, XXX, XXX−XXX
AV

nonexponentiality of the relaxation function at Tg can beestimated.
6.4. Probing Glass Relaxation via Nonreversing Heat Flow
Nonreversing heat flow is thought to be correlated with theenthalpy relaxation of glasses.54,483 The ΔHnr approach ismostly used in relaxation studies and investigations oftopological constraints in various glass systems. The conceptof intermediate compositions was introduced by Boolchand asan extension to the original topological constraint theory.493 Intheir original work, Phillips133 and Thorpe409 classified glassesas a function of their mean coordination numbers. In a three-dimensional system such as network glasses, the universal valueof ⟨r⟩ = 2.4 corresponds to the transition from floppy andunderconstrained glasses to rigid and overconstrained glasses.⟨r⟩ = 2.4 is found to be an ideal composition for achieving theoptimum glass forming ability,133 and it is also found to be athreshold composition point for the trends of various physicalproperties.505 Through the intermediate phase the behavior at⟨r⟩ = 2.4 is extended to a range of compositions where theglass is believed to be isostatic, i.e., rigid but not stressed.TMDSC is essential to find those intermediate regions sinceΔHnr is expected to be zero or near zero for the intermediatephase compositions. The transition from the overconstrained/underconstrained compositions to the intermediate phase canbe amplified when the glasses are annealed below the initialfictive temperature for a long time since the intermediate phasecompositions are not expected to show significant enthalpyrelaxation. Therefore, the value of ΔHnr remains close to thezero, while the value of ΔHnr significantly increases withannealing for compositions outside the intermediate region.515
Boolchand and co-workers studied intermediate phases formore than two decades in many glass systems includingchalcogenides and oxides.493−496,516 However, there is stilldebate on the existence of intermediate phases determined bynonreversing heat flow measurements. The following sectionsummarizes some examples of the ongoing debate about thetopic.It is claimed that the ΔHnr is measured for only one
frequency and it cannot represent the glass transitionbehavior.488 The activation energy for enthalpy relaxationestimated by Moynihan’s method shows a different trend thanthe ΔHnr trend in Ge-Se glass compositions.488 Figure 49shows the activation energy vs ΔHnr as a function of averagecoordination.488,517
However, frequency correction simulations proved thefrequency dependence of ΔHnr could be overcome by thefrequency correction502 and proper frequency selection. Thefrequency correction procedure is basically subtraction of theΔHnr measured during the cooling curve from the ΔHnrmeasured during the heating scans.502 Simulations of suchcorrections in a wide range of frequencies yield a master ΔHnrcurve. This study also shows that ΔHnr curves collapse into amaster curve both in quenched and in annealed glasses. Basedon the results of this study, the frequency correction can bemade without interference from the thermal history.502 Thisstudy can be considered as a solution to the problem raised bySchawe, who claims that the ΔHnr should be nonzero in thecooling experiment.474 However, there is still no clearexplanation regarding the difference between the trends ofthe activation energy for enthalpy relaxation and ΔHnr. Thedisagreement between the two data sets raises anotherquestion about the position of the intermediate phase. As
can be seen from Figure 49, the activation energy trend iscentered at ⟨r⟩ = 2.4 as proposed in the original theory andinvolves a sharp transition from the floppy to the rigid regions.On the other hand, the intermediate region is centered arounda higher average coordination number. The structural originsof the existence of the intermediate phase are still beingdebated and out of the scope of this review.Reproducibility of the ΔHnr measurements was investigated
by Golovchak et al.489 and by Zeidler et al.,518 who studied thesystems Boolchand and co-workers had studied using TMDSC.Figure 50a shows the comparison of those authors’ ΔHnrmeasurements in the Ge-Se glass system. In the Ge-Se systemthere is a significant offset between the trends of those twodata sets, and Zeidler’s data show a narrow range ofcompositions showing zero ΔHnr values centered around ⟨r⟩
Figure 49. Activation energy for enthalpy relaxation (Erelax) and thenonreversing heat flow (ΔHnr) as functions of the mean coordinationnumber ⟨r⟩ for Ge-Se glasses. Reproduced with permission from ref488. Copyright 2009 American Physical Society.
Figure 50. (a) Comparison of ΔHnr measurements in the Ge-Se glasssystem.495,518 Reproduced with permission from ref 495 and ref 518.Copyright 2012 John Wiley and Sons. (b) ΔHnr measurements forboth aged and rejuvenated conditions in the As-Se system.489 Theinlet shows the rejuvenated trend in a magnified scale. Reproducedwith permission from ref 489. Copyright 2008 American PhysicalSociety.
Chemical Reviews Review
DOI: 10.1021/acs.chemrev.8b00510Chem. Rev. XXXX, XXX, XXX−XXX
AW
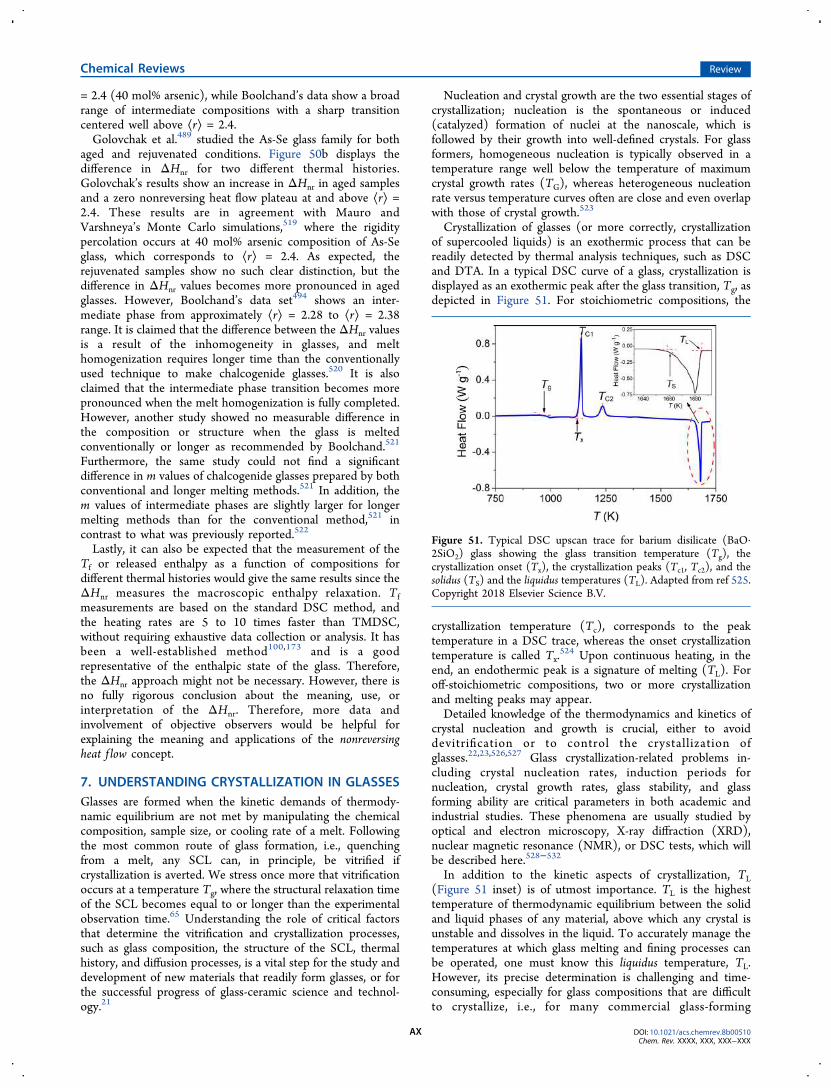
= 2.4 (40 mol% arsenic), while Boolchand’s data show a broadrange of intermediate compositions with a sharp transitioncentered well above ⟨r⟩ = 2.4.Golovchak et al.489 studied the As-Se glass family for both
aged and rejuvenated conditions. Figure 50b displays thedifference in ΔHnr for two different thermal histories.Golovchak’s results show an increase in ΔHnr in aged samplesand a zero nonreversing heat flow plateau at and above ⟨r⟩ =2.4. These results are in agreement with Mauro andVarshneya’s Monte Carlo simulations,519 where the rigiditypercolation occurs at 40 mol% arsenic composition of As-Seglass, which corresponds to ⟨r⟩ = 2.4. As expected, therejuvenated samples show no such clear distinction, but thedifference in ΔHnr values becomes more pronounced in agedglasses. However, Boolchand’s data set494 shows an inter-mediate phase from approximately ⟨r⟩ = 2.28 to ⟨r⟩ = 2.38range. It is claimed that the difference between the ΔHnr valuesis a result of the inhomogeneity in glasses, and melthomogenization requires longer time than the conventionallyused technique to make chalcogenide glasses.520 It is alsoclaimed that the intermediate phase transition becomes morepronounced when the melt homogenization is fully completed.However, another study showed no measurable difference inthe composition or structure when the glass is meltedconventionally or longer as recommended by Boolchand.521
Furthermore, the same study could not find a significantdifference in m values of chalcogenide glasses prepared by bothconventional and longer melting methods.521 In addition, them values of intermediate phases are slightly larger for longermelting methods than for the conventional method,521 incontrast to what was previously reported.522
Lastly, it can also be expected that the measurement of theTf or released enthalpy as a function of compositions fordifferent thermal histories would give the same results since theΔHnr measures the macroscopic enthalpy relaxation. Tfmeasurements are based on the standard DSC method, andthe heating rates are 5 to 10 times faster than TMDSC,without requiring exhaustive data collection or analysis. It hasbeen a well-established method100,173 and is a goodrepresentative of the enthalpic state of the glass. Therefore,the ΔHnr approach might not be necessary. However, there isno fully rigorous conclusion about the meaning, use, orinterpretation of the ΔHnr. Therefore, more data andinvolvement of objective observers would be helpful forexplaining the meaning and applications of the nonreversingheat f low concept.
7. UNDERSTANDING CRYSTALLIZATION IN GLASSESGlasses are formed when the kinetic demands of thermody-namic equilibrium are not met by manipulating the chemicalcomposition, sample size, or cooling rate of a melt. Followingthe most common route of glass formation, i.e., quenchingfrom a melt, any SCL can, in principle, be vitrified ifcrystallization is averted. We stress once more that vitrificationoccurs at a temperature Tg, where the structural relaxation timeof the SCL becomes equal to or longer than the experimentalobservation time.65 Understanding the role of critical factorsthat determine the vitrification and crystallization processes,such as glass composition, the structure of the SCL, thermalhistory, and diffusion processes, is a vital step for the study anddevelopment of new materials that readily form glasses, or forthe successful progress of glass-ceramic science and technol-ogy.21
Nucleation and crystal growth are the two essential stages ofcrystallization; nucleation is the spontaneous or induced(catalyzed) formation of nuclei at the nanoscale, which isfollowed by their growth into well-defined crystals. For glassformers, homogeneous nucleation is typically observed in atemperature range well below the temperature of maximumcrystal growth rates (TG), whereas heterogeneous nucleationrate versus temperature curves often are close and even overlapwith those of crystal growth.523
Crystallization of glasses (or more correctly, crystallizationof supercooled liquids) is an exothermic process that can bereadily detected by thermal analysis techniques, such as DSCand DTA. In a typical DSC curve of a glass, crystallization isdisplayed as an exothermic peak after the glass transition, Tg, asdepicted in Figure 51. For stoichiometric compositions, the
crystallization temperature (Tc), corresponds to the peaktemperature in a DSC trace, whereas the onset crystallizationtemperature is called Tx.
524 Upon continuous heating, in theend, an endothermic peak is a signature of melting (TL). Foroff-stoichiometric compositions, two or more crystallizationand melting peaks may appear.Detailed knowledge of the thermodynamics and kinetics of
crystal nucleation and growth is crucial, either to avoiddevitrification or to control the crystallization ofglasses.22,23,526,527 Glass crystallization-related problems in-cluding crystal nucleation rates, induction periods fornucleation, crystal growth rates, glass stability, and glassforming ability are critical parameters in both academic andindustrial studies. These phenomena are usually studied byoptical and electron microscopy, X-ray diffraction (XRD),nuclear magnetic resonance (NMR), or DSC tests, which willbe described here.528−532
In addition to the kinetic aspects of crystallization, TL(Figure 51 inset) is of utmost importance. TL is the highesttemperature of thermodynamic equilibrium between the solidand liquid phases of any material, above which any crystal isunstable and dissolves in the liquid. To accurately manage thetemperatures at which glass melting and fining processes canbe operated, one must know this liquidus temperature, TL.However, its precise determination is challenging and time-consuming, especially for glass compositions that are difficultto crystallize, i.e., for many commercial glass-forming
Figure 51. Typical DSC upscan trace for barium disilicate (BaO·2SiO2) glass showing the glass transition temperature (Tg), thecrystallization onset (Tx), the crystallization peaks (Tc1, Tc2), and thesolidus (TS) and the liquidus temperatures (TL). Adapted from ref 525.Copyright 2018 Elsevier Science B.V.
Chemical Reviews Review
DOI: 10.1021/acs.chemrev.8b00510Chem. Rev. XXXX, XXX, XXX−XXX
AX

compositions, which are designed to resist crystallization. Thisdifficult task is typically conducted by way of a traditionalmicroscopic investigation after treating rod samples in agradient furnace for a long time and then examining them bymicroscopy. In this section, we will explain a much faster DSCmethod that has been successfully tested for determination ofTL.Here we elaborate on the application of different DSC
techniques for the determination of phase transformations ininorganic oxide glasses, including crystal nucleation, crystalgrowth, overall crystallization kinetics, and the liquidustemperature.
7.1. Crystal Nucleation Kinetics
Nucleation is the earliest stage of crystallization and can becategorized into homogeneous and heterogeneous processes.Homogeneous nucleation is stochastic and happens with thesame probability in any given volume of a glass sample. On theother hand, nucleation occurring on preferred nucleation sites,such as solid impurities, pre-existing interfaces, previouslycrystallized phases, and surface defects, is called heterogeneousnucleation. Many inorganic glasses and their correspondingSCLs are fascinating materials for studies of nucleation andcrystal growth due to their high viscosities below the liquidustemperature, leading to relatively low (measurable) rates ofcrystallization. These materials then serve as models fordetailed studies of nucleation and growth kinetics.9
Homogeneous nucleation can indeed be observed in theinterior of specific glasses at deep undercoolings (T/TL < 0.6),because inorganic glass-forming melts can readily dissolve mostsolid impurities (which could act as catalyzes) that exist only asionic species when the liquid is vitrified. Some of these ionicimpurities accelerate or impair nucleation and growth rates bymodifying the crystal/liquid surface energy or viscosity, butthey do not induce heterogeneous nucleation. Furthermore,the rapid increase in viscosity with decreasing temperatureallows for the “freezing” of different states on the crystallizationpathway by quenching previously heat-treated specimens toroom temperature.533,534 It was once figuratively mentionedthat “glasses did and may serve as the Drosophila of nucleationtheory to test different approaches.”535
Tammann’s method536 is commonly used to determine thenumber density of supercritical nuclei. This method consists ina double-stage treatment, i.e., the “development” of crystalnuclei at temperatures higher than the typical nucleationtemperatures to a size sufficiently large to be visible under anoptical or electron microscope. Nucleation rates covering abroad range of values can be determined by this method. Forexample, measured crystal nucleation rates for various oxideglasses cover a wide range between 101 m−3·s−1 and 1017 m−3·s−1.512 While Tammann’s method can yield correct values ofnucleation rates, it is quite laborious and does havelimitations.537
7.1.1. Estimation of the Temperature of MaximumNucleation. In the early 1980s, Marotta et al.538−540 proposeddifferent techniques based on DTA/DSC experiments to studythe crystallization kinetics of glass-forming systems. In contrastwith Tammann’s method, their nonisothermal methodstypically consider combined nucleation and growth kinetics.In this method, only the temperature of maximum nucleationcan be estimated (not the nucleation rates themselves) usingthe fact that a higher number of nuclei leads to faster overallcrystallization kinetics, and hence the DSC crystallization peak
moves to lower temperatures. The DSC/DTA crystallizationpeak temperature, Tc, is proportional to the number density ofnuclei.538 This behavior is illustrated by plotting Tc or 1/Tcversus TN (the temperature of nucleation treatment for a giventime), which indicates the temperature dependence of thenucleation rate, or more exactly, the crystal number density(N) nucleated in a definite treatment time. The minimum inthe Tc vs TN curves or maximum in 1/Tc vs TN corresponds tothe most efficient nucleation temperature (Figure 52a).
Furthermore, to a first-order approximation, the DSCcrystallization peak area is proportional to the remainingamount of residual glass, whereas its width is determined bythe time needed for complete crystallization, which depends onboth the number of nuclei and the crystal growth rate. For aconstant crystal growth rate, the peak width decreases and itsheight increases with increasing number of nuclei. Therefore,the height or half-width at half-maximum of the crystallizationpeak can also be used (Figure 52a) to deduce the temperaturedependence of the number of nuclei.541−549
Weinberg544 and Kelton545 independently showed that thepeak height method works for lithium disilicate glass (LS2)and is applied by a combination of isothermal preannealingtreatments followed by devitrification measurements innonisothermal DTA experiments. These authors also demon-strated that the use of 1/Tc is more accurate than the peakheight for predicting the temperature dependence of the
Figure 52. (a) Temperatures of the DTA crystallization peak, Tc, andthe half-width at half-maximum, ΔT, as a function of nucleationtemperature, TN (for 3 h) for a Li2O·2SiO2 glass. TN = 453 °C, fromRay et al. Reproduced with permission from ref 541. Copyright 1990John Wiley and Sons. (b) 1/Tc versus the number of lithium disilicatecrystals, N. N increases with the time of nucleation at TN = 473 °C.Reproduced with permission from ref 546. Copyright 2010 ElsevierScience B.V.
Chemical Reviews Review
DOI: 10.1021/acs.chemrev.8b00510Chem. Rev. XXXX, XXX, XXX−XXX
AY

nucleation rates. Specifically, Fokin et al.546 used a lithiumdisilicate glass to show both experimentally (Figure 52b) andtheoretically that the relationship of 1/Tc with N is logarithmic.Furthermore, Xia et al.547 recently used this method toestimate the crystal nucleation temperature for BaO·2SiO2 and5BaO·8SiO2 glasses (for the latter, nucleation data were notavailable). For the BaO·2SiO2 glass, the temperature rangewhere considerable nucleation occurs is 660−770 °C, with amaximum rate near 710 °C. Their results were in goodagreement with those determined by the traditional two-stepannealing, microscopy-based studies (Tammann’s method).They found that the temperature range of significantnucleation for the 5BaO·8SiO2 glass is about 675−790 °C,with a maximum rate near 725 °C, which is slightly higher thanfor the BaO·2SiO2 composition. Xia et al.547 compared thepeak height, peak temperature, and peak area to estimate thetemperature where growth starts to overlap considerably withnucleation. The peak height appeared to be a more sensitiveindicator for determining this effect. Finally, they concludedthat while DTA/DSC methods are not quantitativelypredictive, they are useful for providing estimates of thetemperature range where significant nucleation occurs.7.1.2. Estimation of Nucleation Kinetics. 7.1.2.1. Meth-
od of Ray et al. Another type of nonisothermal approach wasproposed by Ray et al.548 and Ranasinghe et al.549 forquantitative determination of steady-state nucleation rates as afunction of temperature. They suggested that the area, A,under the crystallization peak of a DTA/DSC scan of a givenstoichiometric glass is proportional to the volume of residualglass, Vg, remaining in a sample that has been previously treatedto induce partial crystallization. Therefore:
A t kV t k V V t kVVV
kV t
( ) ( ) ( ( )) 1
(1 ( ))
g 0 c 0c
0
0
ikjjjjj
y{zzzzz
α
= = − = −
= − (45)
where V0 is the volume of the sample before transformation,Vc(t) is the crystallized volume, and α(t) is the fraction ofcrystallization.In this method, precrystallized glasses are subjected to a
DTA/DSC test according to the schematic illustration inFigure 53, and the crystallized volume fraction is estimated bythe decrease of the crystallization peak area, A(t), on a DTA/DSC curve due to the transformation of the residual glass. Thefraction of residual glass decreases due to the previousnucleation at TN for time tN plus growth at TG > TN fortime tG. The crystallized volume fraction, α(t), is then
calculated by the Johnson−Mehl−Avrami−Yerofeeyev−Kol-mogorov (JMAYK) equation:550−553
tV tV
t( )( )
1 exp ( )c
0α α= = − [− ′ ]
(46)
where α′(t) is the transformed volume of residual glass withouttaking into consideration the overlap of the growing particles,frequently denoted the “extended volume.”For the particular case of three-dimensional crystals
simultaneously nucleating and growing in the interior of aglass sample that is isothermally treated at T, the I(T) andU(T) curves overlap to some extent, and α′(t) is given by
t g I T U T t t( ) ( ) ( ) d dt
t
t
0
3Ä
ÇÅÅÅÅÅÅÅÅ
É
ÖÑÑÑÑÑÑÑÑ∫ ∫α′ = ′
′ (47)
where g is a shape factor, which is equal to 4π/3 for sphericalcrystals, and t is the time. Assuming that the nucleation andgrowth rates are time-independent at a given temperature(steady-state homogeneous nucleation and growth), eq 47becomes
t I t U t( )3( )( )3α π′ = · ·
(48)
For double-stage heat treatments, i.e., a treatment fornucleation at a temperature TN followed by another treatmentfor growth at a higher temperature, TG, such that no significantnucleation and no significant dissolution of critical nucleihappens during the growth step, one can write eq 47 asfollows:
t I T t U T t( )43
( ) d ( ) dt t
0 0
3N G
Ä
ÇÅÅÅÅÅÅÅÅ
É
ÖÑÑÑÑÑÑÑÑ∫ ∫α π′ = ′
(49)
Assuming time-independent rates, after integration, eq 49becomes
t I t U t( )43( )( )N G
3α π′ = · ·(50)
Ray et al. combined eqs 46 and 48 to obtain
t I T t N U T t( ) 1 exp3( ( ) ) ( )G N N at G
3G3i
kjjj
y{zzzα π= − − +
(51)
where (I(TN)tN + Nat) is the total number of nuclei formed bynucleation at TN with the rate I plus athermic nuclei (Nat),which are the nuclei formed during cooling the melt to formthe glass (quenched-in or athermic nuclei, Nat), and during theheating up of the glass sample to the temperature TG. Theprior crystallization reduces the DSC crystallization peak area,A. By varying the growth time, tG, at fixed nucleationconditions (TN and tN), the value of α, and therefore A, willchange. Ray et al.548 considered α(t) = α′(t) (anapproximation of eq 46 that is valid for small volume fractioncrystallized) and combined eq 45 with eq 51. Theysubsequently proposed the following equation for the ratioof peak areas corresponding to two different values of tG:
AA
V It N Ut
V It N Ut
1 ( )( )
1 ( )( )1
2
1 3 N at G13
2 3 N at G23
ÄÇÅÅÅÅÅÅ
ÉÖÑÑÑÑÑÑÄ
ÇÅÅÅÅÅÅ
ÉÖÑÑÑÑÑÑ
=− +
− +
π
π(52)
where V1 and V2 are the volume of the residual glasses aftertwo cycles of heat treatment. When the density of the residualglass does not vary appreciably, eq 52 reduces to
Figure 53. Schematic diagram of the thermal treatment used by Rayet al.548 to study nucleation kinetics via DSC experiments.
Chemical Reviews Review
DOI: 10.1021/acs.chemrev.8b00510Chem. Rev. XXXX, XXX, XXX−XXX
AZ

AA
M It N Ut
M It N Ut
1 ( )( )
1 ( )( )1
2
1 3 N at G13
2 3 N at G23
ÄÇÅÅÅÅÅÅ
ÉÖÑÑÑÑÑÑÄ
ÇÅÅÅÅÅÅ
ÉÖÑÑÑÑÑÑ
=− +
− +
π
π(53)
where M1 and M2 are the sample masses for two DSC runscorresponding to times of growth tG1 and tG2, respectively.Therefore, the total number (Ntotal) of nuclei (ItN + Nat) andthe number of athermic crystals can be estimated separately byeq 53, which is simplified as follows:
N It NA M A M
U A M t A M t3( )( )total N at
1 2 2 23
1 2 G23
2 1 G13π
= + =−
− (54)
The analysis of Ray et al.548 is based on three assumptions,which can lead to significant errors in some cases: (1) The firstassumption is a linear proportionality of A and α(t) in eq 45.(2) The second supposition, i.e., that α(t) = α′(t), is only validfor small crystallized volume fractions. Hence, eq 54 is limitedto approximately α(t) < 0.1, i.e., before the crystals impinge.(3) Finally, the use of eq 48 instead of eq 50 should not beapplied to this type of DSC test because significant nucleationdoes not normally happen during the growth step. Therefore,eq 50, which assumes a constant number of nuclei in that step,is more appropriate. In other words, if the heating rate in aDSC test is fast enough and crystallization occurs via crystalgrowth from a fixed number of nuclei, the values calculatedfrom eq 54 must be divided by four, as expressed by eq 50.By knowing tGi, Ai, Mi (i = 1 and 2), and U, (ItN + Nat) can
be calculated by eq 54. If the value of U(TG) is known (e.g., asmeasured by optical microscopy), the total number of nuclei(ItN + Nat) per unit volume of the glass and, hence, the steady-state nucleation rate, I, at any temperature can be determinedusing eq 54. For a comparable sample mass, the area of thesecond DTA peak (A2) is smaller than that of the first (A1) iftG2 > tG1. For a reasonably high U, A2 may be too small tomeasure. In that case, M2 should be made sufficiently largerthan M1 such that a measurable peak can be obtained for thesecond DTA run.In this method, the value of U(T) at any suitable
temperature should be known, which, therefore, must bemeasured first by microscopy (See Section 7.2). Then, the
temperature at which U is measured by the conventionalmethod (e.g., TG) can be used as the crystal-growthtemperature in the DTA experiments for all other measure-ments to determine the quantity (ItN + Nat), as a function ofnucleation time (tN) at the fixed nucleation temperature (TN).After the induction time (tind) for nucleation at thetemperature TN, a plot of (ItN + Nat) is expected to be alinearly increasing function of tN. Therefore, the slope of the(ItN + Nat) vs tN line is the steady-state nucleation rate, I, at TN.The value of (ItN + Nat) for tN ≪ tind is the number ofquenched-in nuclei (Nat) in the glass. However, the value ofNat also can be determined separately from a pair of DTA runsfor glass samples that have not been subjected to anynucleation heat treatment (i.e., ItN = 0 in eq 54) but havebeen subjected to crystal-growth heat treatments at TG for twodifferent times (tG1 and tG2) before the DTA measurements.The methods of Ray et al. have been successfully
tested541,548 using literature data for the nucleation and growthrates of stoichiometric lithium disilicate, Li2O·2SiO2 (LS2) andsodium calcium silicate, Na2O·2CaO·3SiO2 (N1C2S3) glasses,which show internal homogeneous nucleation.541,548 Thatmethod was also justified theoretically by comparing thenucleation rates from model calculations and computer-generated DTA data.554
7.1.2.2. Improved Method of Fokin et al. In a detailedstudy about the changes in the DTA crystallization peakposition as a function of pre-DTA heat-treatment times andtemperatures, proposed by Marotta, Buri, and Branda,538−540
Fokin et al.546 argued that the DSC/DTA crystallization peakposition does not show a linear dependence with the numberof pre-existing nuclei. This fact together with non-steady-statenucleation effects (which is always significant in a temperaturerange near the glass transition temperature) distorts the realtemperature dependence of the nucleation rate when oneemploys this DSC peak shift method. Fokin et al. made it clearthat some other key factors, such as surface crystallization, havealso been neglected in previous studies. Surface crystallizationhas a significant role when the relative volume crystallized issmall, e.g., in the case of athermic crystals. Also, the crystalgrowth rate, U(T), is not constant in nonisothermal heattreatments between the nucleation and growth temperatures.
Figure 54. (a) Transmitted light micrograph of a LS2 glass sample after a DSC run (nucleation at 480 °C for 10 min, growth at 620 °C for 10 min,with heating/cooling rates of 20 °C/min). (b) Lithium disilicate crystals in a LS2 glass. Ellipsoids can be observed in the plan (1) and front (2)views. Reproduced with permission from ref 546. Copyright 2010 Elsevier Science B.V.
Chemical Reviews Review
DOI: 10.1021/acs.chemrev.8b00510Chem. Rev. XXXX, XXX, XXX−XXX
BA

The formation of nonequilibrium phases can also have aconsiderable effect on the DTA/DSC crystallization peak.Finally, the calculations in the method of Ray et al.548 are verysensitive to the crystal growth rate, which appears in cubicform (U3) and strongly depends on viscosity, which, in turn, issensitive to the deviation from nominal stoichiometry and alsouncontrollable impurities, such as water. Ray et al. tested541,548
their method using literature data for growth rates ofstoichiometric lithium disilicate and Na2O·2CaO·3SiO2glasses, which imposed further errors because the growthrates of glasses prepared in different conditions usually deviatefrom each other. Additionally, to estimate the value of growthrates correctly, one must know the morphology of the crystals,since, in the case of asymmetric forms, crystal growth cannotbe characterized by a single value.546 All of these factorsprevent an accurate analysis of nucleation kinetics by DSC/DTA methods. Additionally, one needs some preliminary dataon the nucleation and growth rates of the parent glass toconsider all the above effects when employing DTA/DSCmethods to determine nucleation kinetics.Therefore, Fokin et al.546 have modified Ray’s method541,548
to address all these issues. They measured the growth rate oftheir glass, considered an average crystal growth rate indifferent dimensions, and derived the following equation as asubstitution for Ray’s eq 54:
N It NU t t
A MA M
34
1( )
lntotal N at 3G23
G13
1 2
2 1
ikjjjjj
y{zzzzz
ikjjjjj
y{zzzzzπ
= + =− (55)
As described earlier, Fokin et al. already knew that the abovecalculation is very sensitive to the crystal growth rate (U3),surface crystallization, crystal shape, etc. Therefore, theymodified eq 55 in the case of crystallization in lithiumdisilicate (LS2) glass (Figure 54). Since at TG the shape of thelithium disilicate crystals is close to an ellipsoid of revolution,with the minimum growth rate Umin and the maximum growthrate Umax = kUmin, where k is the proportionality constant, eq55 should be replaced by eq 56.
N It NkU t t
A MA M
34
1lntotal N at
2
max3
G23
G13
1 2
2 1
ikjjjjj
y{zzzzz
ikjjjjj
y{zzzzzπ
= + =− (56)
To estimate the role of surface crystallization, a coefficient βwas introduced as the ratio between the sample volumereduced by surface crystallization and the initial samplevolume. In the case of M1 = M2, eq 56 was written as
N It NkU t t
AA
34
1lntotal N at
2
max3
G23
G13
1 2
2 1
ikjjjjj
y{zzzzz
i
kjjjjj
y
{zzzzzπ
ββ
= + =− (57)
where β1 and β2 are the ratios between the sample volumereduced by surface crystallization for two different growthtimes.It is usually assumed that using relatively high heating and
cooling rates (e.g., 20 °C/min or higher) one can neglectcrystal growth during the nonisothermal regime beforereaching TG. Hence, growth predominantly happens at TG.However, this assumption may not always be valid. Also, someoverheating may take place during the growth stage. Botheffects lead to an underestimate of the growth rate and to anincrease in the values of N. Fokin et al. tested this hypothesisby using eq 58, a slightly altered version of eq 57.
N It N Kr r
AA
34
1lntotal N at
2
23
13
1 2
2 1
ikjjjjj
y{zzzzz
i
kjjjjj
y
{zzzzzπ
ββ
= + =− (58)
This equation considers the actual crystal sizes r1 and r2 afterthe nucleation and growth steps taking into account non-isothermal growth. The conditions and results of a DSCanalysis together with data from optical measurements ofsamples subjected to DSC runs are shown in Figure 55. In the
case of optical microscopy, the last stage of crystallization(Figure 53) was not performed, and the nuclei were developedat a temperature higher than the previous nucleationtemperature up to a size large enough to be visible underoptical microscopy.Nat can be calculated from eqs 54 and 56. Cabral et al.555
compared the results of values measured by Tammann’smethod in Fokin’s study546 and the values measured andcalculated by eqs 54 and 56. They demonstrated that somenuclei might reach the critical size at the temperatures used forcrystal growth during the DSC heating runs carried out at 15−20 °C/min. Therefore, the N values provided by both DSCexpressions were much higher than the experimental valuesdirectly obtained by Tammann’s method. It should be notedthat, in conventional laboratory experiments (Tammann’smethod), heating/cooling ramps are usually very short becausethe samples are pushed quickly into and out of the furnacebetween the nucleation and growth treatments. In contrast toCabral et al.,555 we believe that this difference could also bedue to other effects. Recently, experiments by Deubener etal.556 demonstrated, for the first time, that the heating rateused in typical double-stage heat treatments considerablyaffects the values of the experimental tind and N. An increase oftind and decrease of N with increasing heating rate wereobserved. These experimental trends were in agreement withearlier results of numerical simulations, which predicted anincrease in the size of the surviving critical nuclei withincreasing heating rate. When the heating rate is increased,redissolution of clusters smaller than the survival size triggers a“flushing effect” and leads to a longer induction period.556
More recently, Ranasinghe et al.557 used eq 55 to estimate Nand heterogeneous nucleation rates (I) for lithium disilicateglass doped with different concentrations of platinum particles.However, they did not consider all of the necessary corrections
Figure 55. Number of crystals versus time of nucleation at TN = 480°C measured by Tammann’s method and estimated by the DSCmethod of Fokin et al. Reproduced with permission from ref 546.Copyright 2010 Elsevier Science B.V.
Chemical Reviews Review
DOI: 10.1021/acs.chemrev.8b00510Chem. Rev. XXXX, XXX, XXX−XXX
BB

suggested by Fokin et al. and the effect of heating ratediscussed by Deubener et al.556 Therefore, they attributed thevery large measured number of nuclei merely to the effect ofheterogeneous nucleation. In the end, it seems that, whenproperly used, such nonisothermal methods can yield usefulkinetic information, which includes the crystal number densityand nucleation rate, but they are as arduous as the traditionalmicroscopy methods.Finally, Gupta et al.558 argued that most studies of this kind
have focused on the kinetics of isochemical crystallization(where the compositions of the crystal and the parent glass arethe same). Therefore, they reported on an evaluation of theDTA peak shift in systems where, after a preliminarycrystallization treatment, the compositions of the crystal andglass are different. Their results revealed that the exothermicpeak temperature decreases in the beginning but increases lateron, with an increase in the pre-DTA heat-treatment time at afixed temperature, finally becoming significantly larger than theinitial value. To analyze these results, a model of primarycrystallization was developed by Gupta et al.,558 whichincluded diffusion-controlled growth, the Gibbs−Thomsoneffect, homogeneous nucleation, and a mean field soft-impingement correction during growth. Based on this modeland experimental results, they concluded that an increase inthe number of crystal nuclei shifts the crystallization peak tolower temperatures (as found previously by other researchersfor the case of polymorphic crystallization) and that diffusion-controlled growth during the pre-DTA heat treatment isresponsible for the later shift toward higher temperatures.7.1.3. Heterogeneous Nucleation. Homogeneous nucle-
ation is a stochastic process in which crystal nuclei randomlyand spontaneously appear within any given volume element ofa supercooled liquid at different temperatures or times,whereas heterogeneous nucleation takes place at somepreferred sites or interfaces. Regarding DSC experiments,Repetitive Scanning Calorimetry (RS-DSC), either with acertain cooling rate or by quenching a SCL to an isothermalhold, has been performed in different materials, such as metals,e.g., aluminum,559 gold,560 and tin,561 water,562 hydrates563 andoxides.564,565 In these experiments, onset temperatures (inisochronal transformations) and onset times (in isothermaltransformations) can sometimes be detected, and theirprobability distributions are combined with the classicalnucleation theory to determine delay times and rates ofnucleation.In general, the theory of nucleation is most often verified
based on the average behavior of a number of independentnucleation events. The direct observation of these eventshappening at the nanoscale poses a challenge. Uttormark etal.559 utilized the RS-DSC technique to show the repeatednucleation of the solid aluminum from the liquid in the same80 μm droplet. A total of 845 repeats were recorded undernearly identical conditions, and a statistical analysis wasperformed. Multiple nucleation mechanismshomogeneousand heterogeneouswere active. Studies of this kind onmetallic glass alloys help to understand glass formation and thecrystallization reaction that yields a high density (1021−1023m−3) of nanocrystals (7−20 nm). This type of microstructurecan also be synthesized by the repeated cold rolling or meltspinning of ribbons.566,567
Therefore, nucleation can be homogeneous (intrinsic, in thesample interior) or heterogeneous, e.g., triggered by surfacedefects, solid impurities, or crucible walls. DSC experiments,
especially on cooling melts, usually involve heterogeneousnucleation because the liquid wets the walls of the DSC pan.The major problem with such experiments of heterogeneousnucleation is that the resulting crystallization statistics do notdepend solely on the stochasticity of the process; they alsodepend on the availability of surface nucleation sites, which canvary substantially from one experiment (one DSC run) toanother. All in all, it is not trivial to decouple both effects(stochastic from spurious nucleation).In any case, we describe below an extensive RS-DSC work
reported in five consecutive articles on heterogeneousnucleation of LS2 initiated on the Pt pans of a DSCequipment. For supercooled lithium disilicate liquid, themean undercooling (ΔT) to trigger heterogeneous nucleationwas 147 K for cooling at 5 K/min, and the mean delay (half-time = ln 2/I0) was 753 s for isothermal dwelling at TL − 133K.564,565,570 In those works,564,565,568−570 Kruger and Deubenercarried out DSC analyses of several hundred repetitivecrystallization events. For instance, in ref 570 the isothermalliquid-to-crystal transformation kinetics of (non-Gaussian)Poisson-distributed exothermic DSC signals were calculatedindividually. They found that random and regular dispersionsof crystals fail to accurately predict the growth exponent(Avrami exponent) if only a small number of crystals weregrowing. Nonstationary effects were evident at low and largecrystallized fractions.570 The overall conclusion of thecombined articles is that RS-DSC can be a useful techniqueto probe heterogeneous nucleation kinetics. It could be veryinteresting to repeat this same type of experiment with vitreouscarbon pans, which do not trigger heterogeneous nucleation inLS2 glass, to check whether it could be used to probehomogeneous nucleation.
7.2. Crystal Growth Kinetics
Microscopy techniques are commonly used to determinecrystal growth rates in supercooled liquids, U(T). The simplestand most used method is to perform heat treatments fordifferent periods at a given temperature. Samples are thenpolished for microscopic analysis, where the sizes of thecrystals on the sample surface or in their volume are measured,along with the thickness of the crystallized surface layer. Then,the growth rates are calculated from the slopes of the crystalsize versus time curves at different temperatures. Hot stagemicroscopes can also be employed, in which case the growingcrystals on the sample surface are directly observed in situ.Ray et al.548,549 proposed methods to estimate the crystal
growth by DTA/DSC. Later, Fokin et al.546 modified Ray’sprocedure and introduced eq 55, which can be used toestimate the growth rate at any temperature using eq 59:
U TN t t
A MA M
( )3
41
( )ln
at G23
G13
1 2
2 1
1/3Ä
Ç
ÅÅÅÅÅÅÅÅÅÅÅ
ikjjjjj
y{zzzzz
ikjjjjj
y{zzzzz
É
Ö
ÑÑÑÑÑÑÑÑÑÑÑπ=
− (59)
where, tG1 and tG2 are the heat-treatment times at atemperature T for samples of mass M1 and M2, respectively.A1 and A2 are the respective areas of the resulting DTA peaks.Nat is the number of athermal or quenched-in nuclei.In Fokin’s method, two DSC runs are performed to
determine the number of athermal crystals (Nat) within thevolume of a glass sample. These runs include an isothermalstep for crystal growth at a temperature at which the growthrate is already known. After obtaining the number of crystals(Nat) for a given glass sample, the growth rate can be
Chemical Reviews Review
DOI: 10.1021/acs.chemrev.8b00510Chem. Rev. XXXX, XXX, XXX−XXX
BC

determined with two extra DSC runs using eq 59.549
Therefore, for each temperature where U is desired, twoDSC runs are needed, plus two additional DSC runs fordetermination of the number of crystals (Nat), and then furtherexperiments for the initial evaluation of U at an appropriatetemperature using conventional optical microscopy. However,Fokin et al.546 demonstrated that this approach (toapproximate Nat) is sensitive to the crystal growth takingplace during the heating and cooling steps, surfacecrystallization, and the shape of the crystal, which are difficultto be taken into account. The same caution should apply to thedetermination of the growth rate.Recently, Reis et al.571 proposed and successfully tested an
innovative new method for the calculation of crystal growthrates using a single DSC run over a given temperature range.Their method is based on determining crystal growth ratesfrom the DSC crystallization peak of a thin glass sheet. TheU(T) curve in the temperature range where the crystallizationpeak is detected results from this method. They assumed thefollowing criteria to derive an expression for the growth rate:(i) The sample is a thin glass sheet; (ii) Only surfacenucleation from a very large number of sites takes place; (iii)The crystallization rate is interface controlled and does notdepend on long-range diffusion.The crystallization of such a sample is represented
schematically in Figure 56. The crystals grow in one directionfrom the sample surface toward the interior, with twocrystallization fronts. Because the area of the crystallizationfront is constant, the liberated heat of crystallization at anygiven time is proportional to the rate of interfacial advance,that is, the crystal growth rate. At any time, the crystallizedfraction can be estimated by the ratio of the crystallized layerthickness and half the sample thickness. In the case ofnonisothermal heat treatment with a constant heating rate(qh), the dependence of crystallized volume fraction to thetemperature, α(T), is given by eq 60:
TL
U Tq
T( )1 ( )
dT
T
h0
∫α =(60)
where T0 is a temperature where the growth rate, U, isnegligible. The following equation shows that the rate of theenthalpy release of a gram of glass due to crystallization,dHc(T)/dt (J g−1 s−1), is proportional to the rate ofcrystallization, dα(T)/dT (vol% K−1), when the temperaturerises from the onset to the offset of the crystallization peak:
H Tt
TT
q Hd ( )
dd ( )d
ch c
α= · ·(61)
where qh and Hc are the heating rate (K/s) and the totalcrystallization enthalpy (J g−1) (i.e., the enthalpy releasedduring the entire crystallization process), respectively. Asshown in Figure 57, dHc(T)/dt is actually the differencebetween the as-measured DSC output Φ(T) (J g−1 s−1) and
the background signal Φ0(T) in the temperature range of thecrystallization peak, which is expressed as
H T t T T Td ( )/d ( ) ( ) ( )c 0=Φ − Φ = ΔΦ (62)
The area of the exothermal peak (Apeak) is obtained byintegrating dHc/dt over T, yielding qh·Hc. Substituting eq 62into eq 61 leads to the equation
TT
TA
d ( )d
( )
peak
α = ΔΦ
(63)
From eqs 60 and 63, the growth rate, U(T), can then becalculated from the DSC crystallization peak area using eq 64:
U TT
AL q( )
( )
peakh= ΔΦ · ·
(64)
Equation 64 predicts that the crystallization enthalpyreleasing rate, ΔΦ, has the same temperature dependence asU(T). Hence, when the two crystalline layers collide in thecenter of the sample, a sharp drop is expected in the DSCcurve. This method allows for the determination of U(T),which depends on the values of q and L, over the temperaturerange of the crystallization peak. An increase in L increases thecrystallization peak width because of an increase in the timeneeded for full crystallization and, therefore, the offset of thecrystallization process. An increase in the heating rate shifts thecrystallization peak to higher temperatures. Both effects can beused to broaden the temperature range of crystal growthdetermination by changing sample thickness and heating rates.It is worth mentioning that using units of μV/mg for the DSCsignal does not modify the form of eq 64 since any conversionfactor is canceled out in the ΔΦ/A0 fraction.The linear relation between the crystal volume fraction and
the released crystallization enthalpy for glass wool fibers with a
Figure 56. (a) Initial glass pieces used to measure growth rates via DSC. (b) Scheme for the surface nucleated crystallization of a glass sheet ofthickness 2L. Reproduced with permission from ref 571. Copyright 2016 John Wiley and Sons.
Figure 57. Typical DSC downscan signal showing the differencebetween the as-measured DSC output Φ(T) (J g−1 s−1) and thebackground signal Φ0(T) in the temperature range of thecrystallization peak. This difference is equal to the rate of theenthalpy released during upscanning (dHc(T)/dt). Reproduced withpermission from ref 572. Copyright 2007 Elsevier Science B.V.
Chemical Reviews Review
DOI: 10.1021/acs.chemrev.8b00510Chem. Rev. XXXX, XXX, XXX−XXX
BD

diameter of 5∼15 μm was also reported by Moesgaard et al.572
They derived an equation to calculate the crystallinity in glassdirectly from the heat treatment temperature and time.In the study of Reis et al.,571 the crystal growth rate, U vs T
curves (in the temperature range of the DSC crystallizationpeak) for lithium disilicate, diopside, and lithium calciummetasilicate glasses were determined. The experimental growthrates obtained from their DSC method agreed very well withliterature data obtained by the microscopy method. Figure 58summarizes the results obtained for lithium disilicate glass.
For nonstoichiometric crystallization of lithium metasilicatefrom a lithium calcium metasilicate glass, the DSC resultsunderestimated the actual crystal growth rate. However, theuse of the peak area up to the temperature of the maximum ofthe crystallization peak (Tc) improved the results because inDSC runs the signal (energy release) reaches the maximumwhen crystallization is completed, and then it drops, bringingthe signal back to the background. This method is indeed quite
useful to estimate the growth rates of any glass that undergoespredominantly surface nucleation (as most glasses do).7.3. Overall Crystallization Kinetics
Crystal nucleation occurring simultaneously with or followedby subsequent growth results in overall crystallization. Thisprocess can be described by determining the evolution of thevolume fraction crystallized, α(t), as a function of time andtemperature. The theory of crystallization kinetics underisothermal conditions was developed in the late 1930sindependently by Johnson, Mehl, Avrami, Yerofeeyev, andKolmogorov and is known as JMAYK theory. According totheir model, the volume fraction of the new phase (in this casea crystal) is given by eq 65, which is the combination of eqs 46and 47.8,66,573
t g I T U T t t( ) 1 exp ( ) ( ) d dt
t
t
0
3lmoonoo
Ä
ÇÅÅÅÅÅÅÅÅ
É
ÖÑÑÑÑÑÑÑÑ
|}oo~oo
∫ ∫α = − − ′′ (65)
where g is a shape factor that depends on the shape of crystals.If the nucleation (I) and growth (U) rates are constantthroughout the transformation, eq 65 can be rewritten as
tgIU t
( ) 1 exp4
3 4Ä
Ç
ÅÅÅÅÅÅÅÅÅÅ
É
Ö
ÑÑÑÑÑÑÑÑÑÑα = − −
(66)
when the number of growing crystals, N0, does not change withtime (as it is typical for fast heterogeneous nucleation on afinite number of active sites or from quenched-in, athermalnuclei), eq 65 transforms to
t gN U t( ) 1 exp 03 3α = − [− ] (67)
Avrami proposed that, in the general case, the followingrelation should be used:
t Kt( ) 1 exp nα = − [− ] (68)
where K represents the overall rate constant, and n is theAvrami coefficient. In typical applications, eq 68 is used in theform
K n tln( ln(1 )) ln lnα− − = + (69)
The values of K and n can be estimated by fitting theexperimental data of a(t) to eq 69. Thus the coefficient Kincludes I and U, or N0 and U.For nucleation starting from a fixed number of nuclei at
temperatures below the so-called “decoupling temperature”,the growth rates become approximately Arrhenian. Below thisdecoupling temperature, the temperature dependence of K canbe described by
K vERT
exp c0
ikjjj
y{zzz= −
(70)
where both the pre-exponential term, ν0, and the activationenergy for crystal growth, EC, are temperature independent,and R is the gas constant.8,66,573
In eq 69, n is called the Avrami coefficient and depends onboth nucleation and growth mechanisms, as shown in Table 1.The knowledge of that coefficient is very helpful to understandthe mechanism of phase transformation at any giventemperature.574
7.3.1. Isothermal Method. If the phase transformationmechanism is unchanged during the experiment, a plot ofln(−ln(1 − α)) versus ln(t) at a number of temperatures
Figure 58. (a) Normalized DSC crystallization peaks for lithiumdisilicate glass. The numbers in parentheses are the sample thickness(2L) and heating rate (qh), respectively. (b) Growth rates calculatedfrom the DSC peaks using eq 64. (c) Results of Reis et al., otherexperimental data, and a fitted dashed line. Reproduced withpermission from ref 571. Copyright 2016 John Wiley and Sons.
Chemical Reviews Review
DOI: 10.1021/acs.chemrev.8b00510Chem. Rev. XXXX, XXX, XXX−XXX
BE

should yield a series of parallel lines with slope n and interceptln(K) at each temperature. The value of α is approximatelyequal to the fractional area under the isothermal crystallizationpeak as a function of time at that temperature, which is usuallydetermined using the software from commercial DSCequipment (Figure 59). For example, if A is the DTA peak
area per unit volume of a glass that has already been given anisothermal heat treatment at a temperature T for a time t, andα is the volume fraction crystallized during the DSC run, then
A A (1 )0 α= − (71)
where A0 is the area of the exothermic peak for an as-quenched(uncrystallized) glass sample. For a partially crystallizedspecimen, the crystallinity, α, in the glass is given by
1 AA0
ÄÇÅÅÅÅÅÅÅ
ÉÖÑÑÑÑÑÑÑ− . Combining eq 71 with eq 69, we obtain
AA
K n tln ln ln0ikjjj
y{zzz = +
(72)
thus, plots of ( )ln AA0 vs ln t can be used to determine n and K,
the kinetic parameters for crystallization.8,66,573
In their study in 1991, Ray et al.575 investigated thecrystallization kinetics of a nonstoichiometric 40Li2O·60SiO2(mol%) glass via DSC to reveal the effects of (1) particle size
of the glass powder, (2) crucible, e.g., alumina or platinum, (3)DSC atmosphere, e.g., nitrogen, oxygen, or argon, and (4)surface treatment of the glass powder with deionized water,HCI, or HF. According to eq 70, both the pre-exponentialfactor and the activation energy for crystal growth varied, asthe particle size of the glass powder changed, but neither theatmosphere nor the crucible had a significant effect on thecrystallization kinetics. Washing the glass with deionized water,HCl, or HF before the measurements decreased thecrystallization temperature by 25 to 30 °C. EC and ν0 remainedunchanged by this treatment. This particular glass crystallizespredominantly in the interior; that is why the surface conditiondid not affect the results.In 2007, Ray et al.576 subsequently simplified their
isothermal DSC method originally published in 1991. Theyargued that the determination of crystallization parameters bythe conventional isothermal heating techniques is a tediousand time-consuming operation because it is often difficult toobtain an idealized crystallization exotherm experimentally, asshown in Figure 59. Obtaining such an exotherm dependsupon two factors: (1) the choice of a suitable isothermal holdtemperature, which is generally unknown for an unknownsystem, and that depends upon the characteristic temperature-time-transformation (TTT) diagram of the supercooled liquid,and (2) the efficiency and capability to attain a proper holdtemperature quickly and precisely that, in most cases, lieswithin a very narrow range. As a result, often one cannot find aproper treatment temperature that falls within the temperaturerange for observable crystallization, or the temperature showsoscillations before stabilizing at the desired treatment temper-ature, making it difficult to identify the crystallization eventand, hence, to accurately determine the time taken for aparticular volume fraction to crystallize. Therefore, theyproposed a simplified method. Their new experimentalprotocol includes first an isothermal heat treatment of glassas a function of time in a separate furnace to achieve a time-dependent partial crystallization at a particular temperature.The isothermal heat treatment is then followed by a DSC scanof the partially crystallized glass sample at a fixed heating rate,which generates a crystallization peak for a fraction of glass thatdid not crystallize during the previous isothermal heat-treatment step. From the area of this DSC peak, the portionof the sample that crystallized during the isothermal heattreatment can be readily determined and analyzed using eqs 70and 72 to calculate the crystallization parameters. This methodwas tested by Ray et al.576 using a lithium disilicate glass, whichis frequently taken as a model glass for studies of nucleationand crystallization, and hence numerous experimental data areavailable for comparison. The results are illustrated in Figure60.
7.3.2. Nonisothermal Methods. The isothermal methoddescribed above is time-consuming and difficult to carry outover a wide temperature range. A much easier method, basedon determining the temperature of the crystallization peakmaximum, Tc, for samples heated at different rates wasdeveloped by Kissinger in the mid-1950s.196,577 The derivationof the Kissinger method will be described later when wecritically analyze this approach.577 His final expression relatesthe heating rate and the temperature of the exothermic peakmaximum by
Table 1. Values of the Avrami Exponent (n) for SeveralMechanisms of Crystallization574
Polymorphic change, interface-controlled growtha n
Diffusion-controlledgrowtha n
Increasing nucleation rate, 3D >4 Increasing nucleationrate, 3D
>2.5
Constant nucleation rate, 3D 4 Constant nucleationrate, 3D
2.5
Decreasing nucleation rate, 3D 3−4 Decreasingnucleation rate, 3D
1.5−2.5
Zero nucleation rate (nucleation sitesaturation) 3D
3 Constant nucleationrate, 2D
2
Constant nucleation rate, 2-D (plate) 3 Zero nucleation rate,3D
1.5
Zero nucleation rate, 2-D (plate) 2 Constant nucleationrate, 1D
1.5
Constant nucleation rate (nucleationsite saturation), 1D
2 Zero nucleation rate,2D
1
Zero nucleation rate, 1D (needle) 1 Zero nucleation rate,1D
0.5
aD: Dimensional growth
Figure 59. Typical crystallization exotherm. A method for calculatingthe volume fraction crystallized, α, for any time, t, is illustrated.
Chemical Reviews Review
DOI: 10.1021/acs.chemrev.8b00510Chem. Rev. XXXX, XXX, XXX−XXX
BF

q
TZRE
ERT
ln lnh
c2
c
ikjjjjj
y{zzzzz
ikjjj
y{zzz= −
(73)
where qh is the heating rate, E is the activation energy for theoverall crystallization, Z is a constant, and Tc is the temperatureat the peak maximum. If this equation is valid for the system
under study, a plot of ( )lnq
Th
c2 versus
T1
cshould yield a straight
line with a slope of ERand an intercept ( )ln ZR
E.
Due to its simplicity, this method has been widely used todetermine the activation energy for the overall crystallizationprocess of many glasses. An example is shown in Figure 61 forLS2.We emphasize here that, in principle, this method can only
be applied to the case of crystal growth from a f ixed number ofnucleation sites in a temperature range where the U(T) isArrhenian, i.e., below the temperature of breakdown of theStokes−Einstein equation (SEE).Another widely used nonisothermal method for calculation
of E and n was proposed by Ozawa in 1971.579 For a constant
heating rate (qh), given by ( )q T Tth
0= −, eq 68 can be
rewritten as
t KT Tq
( ) 1 expn
0
h
Ä
Ç
ÅÅÅÅÅÅÅÅÅÅÅÅ
i
kjjjjjj
y
{zzzzzz
É
Ö
ÑÑÑÑÑÑÑÑÑÑÑÑα = − −
−
(74)
Figure 60. (a) DTA curves at 10 °C/min for an as-quenched LS2 glass with particle sizes between 425 and 500 μm, and after an isothermal holdingat 575 °C for 0.5, 1, 2 and 3 h. The peak area decreases with increasing heat treatment time, but the peak temperature (Tc) remains virtuallyunchanged at 645 °C. (b) Crystallized volume fraction, α, as a function of time for an LS2 glass heated at the indicated temperatures. Lines arepolynomial fits through the data points. (c) Avrami plots (Eq. 72) for the same glass using crystallized volume fraction data obtained at theindicated temperatures. (d) Arrhenius plot (eq 70) using lnK-values obtained from the Avrami analysis of the data in (b). Reproduced withpermission from ref 576. Copyright 2007 John Wiley and Sons.
Figure 61. Kissinger plot ( )lnq
Th
c2 vs
T1
c(eq 73)of the DTA
experiments for a lithium disilicate glass with a particle size of 425−600 μm. Reproduced with permission from ref 578. Copyright 2015John Wiley and Sons.
Chemical Reviews Review
DOI: 10.1021/acs.chemrev.8b00510Chem. Rev. XXXX, XXX, XXX−XXX
BG

By applying logarithms to both sides in eq 74, the followingequation is obtained:
K T T n qln( ln(1 )) ln ( ) ln0 hα− − = [ − ] − (75)
Therefore, n can be estimated from the slope of the straightline of a plot of ln(−ln(1 − α)) versus ln qh. The crystallizedvolume fraction, α, at any time, t, is estimated according to themethod explained in Figure 59. We should keep in mind thatthe heat liberation during crystallization in a DSC run isproportional to the mass of the glass. Therefore, if the densityof the residual glass does not significantly change duringcrystallization, we can consider that the crystallized massfraction is proportional to the volume fraction.The parameter n can also be evaluated using the Augis−
Bennett method, derived in 1978:580
nRTE
2.5fwhm
c2
=(76)
where E is the activation energy for overall crystallization,which includes crystal nucleation and growth, R is the gasconstant, and fwhm and Tc are the “full width at halfmaximum” and the temperature of the DTA crystallizationpeak, respectively. This model can only be used if theactivation energy is known.The three methods mentioned above are frequently used by
the glass research community to estimate the Avrami constantand the activation energy for crystallization. Several others,which are different variations of the Avrami, Ozawa, andKissinger models, have been proposed by Piloyan-Borch-ardt581,582 and Coats-Redfern.583 Approaches by Sestak584,585
and Ligero et al.586 are sometimes used in the community.While most of the DSC/DTA treatments are based on the
formal theory of transformation kinetics, they differ signifi-cantly in their assumptions and in many cases lead tocontradictory results. Therefore, controversy exists withrespect to each of these models, and great care should betaken when using them. In many cases, they extend the Avramiequation to transformation cases under linearly increasing(nonisothermal) treatments, which imposes further complica-tions on the theoretical interpretation of the kinetic results.Therefore, we highly encourage researchers to refer to reviewpapers written by members of the Committee of theInternational Confederation for Thermal Analysis andCalorimetry (ICTAC) before starting kinetic studies byDSC/DTA.587,588 Their recommendations offer useful guid-ance for preparing proper samples, collecting data, and reliablyevaluating the kinetic parameters (the activation energy, thepre-exponential factor, and the reaction model) in the thermalanalysis using thermogravimetry (TG), DSC, and DTA. Therecommendations cover the most common kinetic methods,including model-free (iso-conversional) as well as model-fitting. Their focus is on the problems faced by various kineticmethods and on the ways how these problems can be resolved.Recommendations for making reliable kinetic predictions arealso provided. The objective of those recommendations is tohelp researchers with efficient (rather complicated, butindispensable) analysis.587 Additionally, Henderson,589,590
Matusita and Sakka,591 Yinnon and Ulhmann,592 Malek,7,593
and Sestak594 have published critical analyses of the non-isothermal methods and show under which conditions thesemethods are justified as we shortly discuss below.
Aside from surface crystallization, which still has severalissues before full understanding,7,590−597 the practical applic-ability of the JMAYK transformation kinetics for the bulkcrystallization process under nonisothermal conditions de-pends on the knowledge of the nucleation and growth kinetics.It is well accepted that the JMAYK model successfullydescribes the case of crystal growth from pre-existing nucleieven under nonisothermal conditions. However, in some cases,the application of the JMAYK kinetics under nonisothermalconditions leads to incorrect results when the number of pre-existing nuclei changes, depending on the sample thermalhistory, within the temperature range of nucleation. Forexample, Everton and Cabral598 determined the crystallizedfraction, α(t) directly by optical microscopy (OM) andindirectly by DSC under isothermal conditions. In theirwork, the kinetic crystallization parameters E (activationenergy) and n (Avrami index) of a lithium disilicate glass(Li2O·2SiO2) were studied. First, bulk samples were fastheated in a vertical tube furnace to temperatures between 500and 530 °C for different periods. The same samples wereheated in a calorimeter from room temperature to 850 °C at10 °C/min. The following E and n values were obtained: (i)OM: 462 ± 1 kJ/mol and 4, respectively; and (ii) DSC: 188 ±1 kJ/mol and 2.4, respectively. The results indicated that in thenonisothermal (DSC) case, the activation energy for crystalgrowth was reduced due to the formation of new crystals andgrowing of “pre-existing” crystals during the nonisothermalDSC experiments and that the predominant crystallizationmechanism in the samples changed according to the thermalhistory.598
There are several limitations regarding the application of theKissinger method. The first important concern refers to themathematical derivation of his equation; the reaction (e.g.,glass → crystal) is assumed to be a first-order function defining
the reaction rate as k T( )(1 )t
dd
α= −α , where α is the fraction
of reactant remaining after a time t and k(T) is the rateconstant at a temperature T. The particular form of f(α) usedis called the “kinetic model function”.577 In the aboveexpression used by Kissinger f(α) = (1−α). The assumptionof a first-order reaction is not valid for many cases ofcrystallization in glasses.Therefore, some authors have extended the Kissinger
method to other kinetic models. For example, Elder599
extended the Kissinger equation to nth order reactions. Anotherextension is that of Augis and Bennett580 and the follow-uparticle by Boswell,600 which modified the original Kissingermethod for the Avrami model to be applicable to autocatalyticreactions, such as thermoset cure. This problem has also beenstudied by Matsushita and Sakka,601 who introduced twoparameters on the nucleation behavior and growth dimensionfor modifying the conventional Kissinger method to evaluatethe activation energy for glass crystallization, E. The form ofthe reaction rate has been discussed further by Matsushita etal.,602 Ozawa,603 and Kemeny and Sestak,604 who modified theconventional iso-conversional methods in integral and differ-ential forms. The iso-conversional methods yield values of theactivation energy as a function of the degree of conversion(crystallization). Koga and Sestak generalized the reaction rateas a modification of the generalized kinetic equation with anaccommodation function605,606 by studying the whole courseof the kinetic analysis for the crystallization of a Li2O·2B2O3glass.607 Koga and Sestak596 have explained a generalized
Chemical Reviews Review
DOI: 10.1021/acs.chemrev.8b00510Chem. Rev. XXXX, XXX, XXX−XXX
BH

approach for the case of crystal growth from pre-existingnuclei, exemplified by the crystallization kinetics of a Na2O·CaO·2SiO2 glass.596 Another concern is that the Kissingermethod is associated with the fact that the determination of anaccurate E value requires the degree of crystallization at thepeak maximum to be independent of the heating rate.Otherwise, the dependence given by eq 73 deviates from astraight line, producing a systematic error in E.608 Anotherlimitation is that the Kissinger method is applicable only tolinear heating conditions. Another commonly encounteredincorrect application of the Kissinger method is regarding thekinetic analysis of data obtained under linear coolingconditions, such as in the case of the melt crystallization. Inthe Kissinger method, qh cannot be replaced with a positivevalue for the cooling rate, because such a practice results inincorrect values of the kinetic parameters.609 In this case,dropping the negative sign for qh in order to make theKissinger equation applicable to cooling processes is an invalidprocedure, because the derivative of the rate equation, which isused to obtain Kissinger’s equation, would require the processrate to pass through a minimum to yield a downward rate peak.This requirement contradicts experimental observations forcrystallization, where the rate passes through a maximum andgives rise to an upward peak. Vyazovkin609 has identified thisconclusion and reported on the correct calculation of theactivation energy of crystallization of polymer melts byapplying the differential iso-conversional method and/or bythe integral iso-conversional method.609 All of thesemodifications to the original approach are time-consumingbut indispensable, and they should be tested for each glass.However, most researchers avoid considering these complexissues and simply employ the original equations of Kissinger orOzawa, which yield meaningless values of the activationenergy. Interested readers can refer to review papers dedicatedto Kissinger,577 Ozawa,610 and recommendations of theICTAC Kinetics Committee587,588 to find (rather complex)modifications that should be applied to these original methods.
7.4. Modeling of DSC Signals
In his pioneering work in 1989, Muller611 proposed a kineticmodel to reproduce the exothermic DSC or DTA signal forsurface-induced crystallization and tested it with a cordieriteglass. Uniform glass particle size, a constant density ofheterogeneous surface sites, and a steadily increasing temper-ature throughout the reaction were assumed. Using the(previously known) crystal growth rates, the density of surfacesites for powders of widely different size was estimated fromthe DTA peaks.611 In a following publication, Sandu and Singhprovided mathematical solutions for the heat of transformationin both single and multiple physical chemical transforma-tions.612
Recently, Reis and Zanotto613 proposed a new model for thekinetics of phase transformation of glass particles of well-defined geometries starting from the surface and/or internalnucleation sites. Their analytical equation is simple butaccurate, allowing for easy usage and interpretation. Themodel’s ability to describe the overall crystallization kinetics ofglass particles was tested by DSC experiments using sphericaldiopside (CaO·MgO·2SiO2) glass particles having differentnumber densities of surface nucleation sites. This glass onlyundergoes surface crystallization. Experiments were alsoperformed with cubic particles of lithium disilicate (Li2O·2SiO2) glass, which shows simultaneous surface and internal
crystallizations, having different number densities of internalnuclei. The model simulations of the DSC crystallization peaksagreed very well with the experiments and provided accuratepredictions of the particle transformation kinetics for bothmaterials.613
Additionally, Fernandes and Ferreira calculated DSC-likecrystallization peaks for glass particles having regular-geometry.614 The results of their calculations were in closeagreement with the experimental DSC peaks of a diopsideglass. This study provides an approximate method to calculatethe crystallization kinetics of glass particles of regulargeometries and constant size, considering heterogeneoussurface nucleation starting from a high number of nucleationsites. Based on a geometric-contraction transformation model,they derived equations for cubic, spherical, parallelepipedal andellipsoidal particles enabling the calculation of the trans-formation rate due to the evolution of a crystalline layergrowing into the particle under nonisothermal conditions.614
Figure 62 shows the calculated crystallization curves fordifferent particle morphologies of a diopside glass powder.This figure summarizes the calculated crystallization curves forcubic, spherical, prismatic, and ellipsoidal particles, comparingthem with the experimental DSC crystallization peak of ajagged diopside glass powder with 30 μm average particle size(22−38 μm sieve meshes). The experimental DSC crystal-lization peak was normalized by dividing the correspondingDSC experimental data points, whose unit is (μV mg−1), bythe total area under the peak, whose unit results from theproduct of heat flow sign and temperature (μV K mg−1), tomake possible the comparison with the calculated peaks. Thus,the unit of the normalized heat flow is the ratio between thefirst and second mentioned units, i.e., K−1. The values of Ω andγ expressed in the figure caption were chosen to establish theeffect of different shapes. At the considered levels of Ω and γ inFigure 62a, the onset of the crystallization peaks occursapproximately at the same temperature, 1140 K. However, thepeak shapes change from low-intensity and broad to moreintense and sharp, whereas their end point shifts to lowertemperatures as Ω and γ deviate from 1. Such behavior is dueto the increase of the surface-to-volume ratio for geometriesdeviating from cube and sphere; hence, the overall trans-formation rate is faster in plates or prolate ellipsoids than inneedle-shaped particles, which in turn is faster than in cubicand spherical particles. This is best observed by comparing thefull width at half-maximum (fwhm) of the calculatedcrystallization peaks for the different shapes (Figure 62b).614
Additionally, the shape, intensity, and end point of thecrystallization peaks are affected by the direction of the crystalgrowth fronts. For example, the crystallization peak of aplatelike particle is more intense, due to an initially largercrystalizing surface, and drops more abruptly, when the crystalgrowth fronts perpendicular to its larger faces meet in theparticle center than spherical and cubic particles. In summary,the Fernandes−Ferreira research shows an agreement, yet notperfect, between the calculated curves and the experimentalDSC peaks. Most importantly, the glass particle shapesignificantly influences the crystallization kinetics and thusmust be taken into account in the analysis of glasscrystallization kinetics by DSC. To the best of our knowledge,this is one scarce example of studies that estimated the effect ofglass particle shape on the DSC crystallization peaks,particularly for the case of heterogeneous surface crystal-lization.614 Several other more complicated variables, such as
Chemical Reviews Review
DOI: 10.1021/acs.chemrev.8b00510Chem. Rev. XXXX, XXX, XXX−XXX
BI
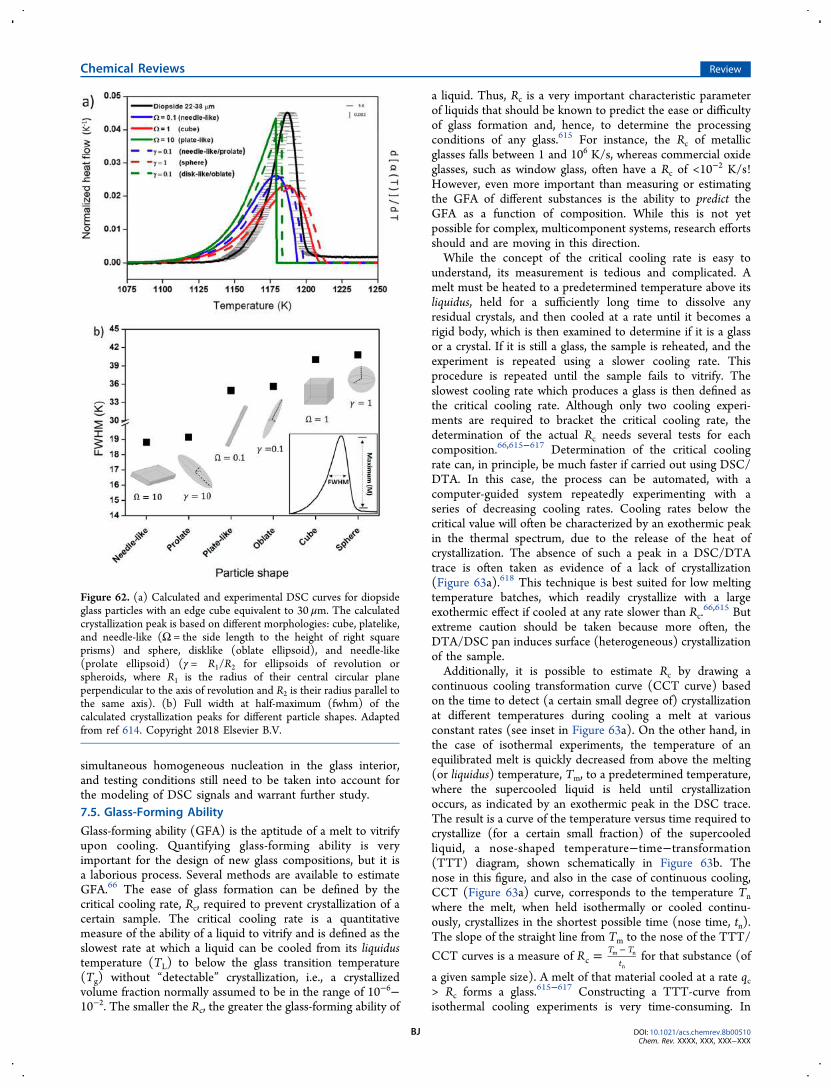
simultaneous homogeneous nucleation in the glass interior,and testing conditions still need to be taken into account forthe modeling of DSC signals and warrant further study.7.5. Glass-Forming Ability
Glass-forming ability (GFA) is the aptitude of a melt to vitrifyupon cooling. Quantifying glass-forming ability is veryimportant for the design of new glass compositions, but it isa laborious process. Several methods are available to estimateGFA.66 The ease of glass formation can be defined by thecritical cooling rate, Rc, required to prevent crystallization of acertain sample. The critical cooling rate is a quantitativemeasure of the ability of a liquid to vitrify and is defined as theslowest rate at which a liquid can be cooled from its liquidustemperature (TL) to below the glass transition temperature(Tg) without “detectable” crystallization, i.e., a crystallizedvolume fraction normally assumed to be in the range of 10−6−10−2. The smaller the Rc, the greater the glass-forming ability of
a liquid. Thus, Rc is a very important characteristic parameterof liquids that should be known to predict the ease or difficultyof glass formation and, hence, to determine the processingconditions of any glass.615 For instance, the Rc of metallicglasses falls between 1 and 106 K/s, whereas commercial oxideglasses, such as window glass, often have a Rc of <10
−2 K/s!However, even more important than measuring or estimatingthe GFA of different substances is the ability to predict theGFA as a function of composition. While this is not yetpossible for complex, multicomponent systems, research effortsshould and are moving in this direction.While the concept of the critical cooling rate is easy to
understand, its measurement is tedious and complicated. Amelt must be heated to a predetermined temperature above itsliquidus, held for a sufficiently long time to dissolve anyresidual crystals, and then cooled at a rate until it becomes arigid body, which is then examined to determine if it is a glassor a crystal. If it is still a glass, the sample is reheated, and theexperiment is repeated using a slower cooling rate. Thisprocedure is repeated until the sample fails to vitrify. Theslowest cooling rate which produces a glass is then defined asthe critical cooling rate. Although only two cooling experi-ments are required to bracket the critical cooling rate, thedetermination of the actual Rc needs several tests for eachcomposition.66,615−617 Determination of the critical coolingrate can, in principle, be much faster if carried out using DSC/DTA. In this case, the process can be automated, with acomputer-guided system repeatedly experimenting with aseries of decreasing cooling rates. Cooling rates below thecritical value will often be characterized by an exothermic peakin the thermal spectrum, due to the release of the heat ofcrystallization. The absence of such a peak in a DSC/DTAtrace is often taken as evidence of a lack of crystallization(Figure 63a).618 This technique is best suited for low meltingtemperature batches, which readily crystallize with a largeexothermic effect if cooled at any rate slower than Rc.
66,615 Butextreme caution should be taken because more often, theDTA/DSC pan induces surface (heterogeneous) crystallizationof the sample.Additionally, it is possible to estimate Rc by drawing a
continuous cooling transformation curve (CCT curve) basedon the time to detect (a certain small degree of) crystallizationat different temperatures during cooling a melt at variousconstant rates (see inset in Figure 63a). On the other hand, inthe case of isothermal experiments, the temperature of anequilibrated melt is quickly decreased from above the melting(or liquidus) temperature, Tm, to a predetermined temperature,where the supercooled liquid is held until crystallizationoccurs, as indicated by an exothermic peak in the DSC trace.The result is a curve of the temperature versus time required tocrystallize (for a certain small fraction) of the supercooledliquid, a nose-shaped temperature−time−transformation(TTT) diagram, shown schematically in Figure 63b. Thenose in this figure, and also in the case of continuous cooling,CCT (Figure 63a) curve, corresponds to the temperature Tnwhere the melt, when held isothermally or cooled continu-ously, crystallizes in the shortest possible time (nose time, tn).The slope of the straight line from Tm to the nose of the TTT/
CCT curves is a measure of R T Ttc
m n
n= −
for that substance (of
a given sample size). A melt of that material cooled at a rate qc> Rc forms a glass.615−617 Constructing a TTT-curve fromisothermal cooling experiments is very time-consuming. In
Figure 62. (a) Calculated and experimental DSC curves for diopsideglass particles with an edge cube equivalent to 30 μm. The calculatedcrystallization peak is based on different morphologies: cube, platelike,and needle-like (Ω = the side length to the height of right squareprisms) and sphere, disklike (oblate ellipsoid), and needle-like(prolate ellipsoid) (γ = R1/R2 for ellipsoids of revolution orspheroids, where R1 is the radius of their central circular planeperpendicular to the axis of revolution and R2 is their radius parallel tothe same axis). (b) Full width at half-maximum (fwhm) of thecalculated crystallization peaks for different particle shapes. Adaptedfrom ref 614. Copyright 2018 Elsevier B.V.
Chemical Reviews Review
DOI: 10.1021/acs.chemrev.8b00510Chem. Rev. XXXX, XXX, XXX−XXX
BJ

addition, the isothermal cooling approach does not replicatecommon glass manufacturing processes and overestimates thereal Rc by about 5−10 times.618,619 A more realistic approach,and which is less time-consuming, is to analyze thenonisothermal crystallization event for a melt cooled fromabove Tm at different rates.Another method to estimate Rc by DTA/DSC was proposed
by Barandiaran and Colmenero in 1981620 based on anempirical equation for evaluation of cooling curves. Thismethod has been utilized by several authors, e.g., Whichard etal.621 and Huang et al.622 The crystallization temperature, Tc,of a given supercooled liquid (Figure 63a) is related to thecorresponding cooling rate, qc, as
575,620,621
q RT T
ln ln( )c c
c
m c2
ω= −
− (77)
where ωc is a constant. A plot of ln qc versus T T1
( )m c2−yields a
straight line, and the critical cooling rate, Rc, for that liquid isdetermined from the intercept of the straight line with the ln qcaxis.
Each of the methods discussed above requires a detectablecrystallization DSC/DTA peak during a cooling experiment todetermine Rc. However, certain melts, particularly silica-richmelts, exhibit very broad crystallization peaks during coolingthat are unclear, either due to slow crystallization kinetics orbecause of small heats of crystallization.623 Therefore, thedetermination of Rc for such melts using the methodsdescribed above poses an additional experimental challenge.Beyond DSC, several key experimental tools are available,
such as optical microscopy, scanning/transmission electronmicroscopy (SEM/TEM), small angle X-ray scattering(SAXS), extended X-ray absorption fine structure (EXAFS),small-angle neutron scattering (SANS), X-ray absorptionspectroscopy (XAS), Raman spectroscopy (RS), nuclearmagnetic resonance (NMR), X-ray diffraction (XRD), andatomic force microscopy (AFM), which, together withmolecular dynamics (MD) simulations, can reveal specifichidden details of glass formation, nucleation, and crystallizationin glasses. The combined use of these techniques has providedvaluable insights into the complicated and rapidly changingstructural environments in which crystallization happens,challenging several hypotheses and assumptions, which leadto the development of more rigorous approaches. Several goodreviews and papers dealing with these techniques have beenpubl i shed . A few examples are prov ided e l se -where.239,534,573,624−630
Another issue is that, in general, for any glass-forming liquidthe thermodynamic barrier is larger for homogeneousnucleation than for heterogeneous nucleation. As a result,the homogeneous nucleation, I(T) curve, is always located at alower temperature range than that of heterogeneousnucleation, and this last mechanism predominates on cooling,which leads to complications in the determination of Rc.Another DTA method has been proposed by Ray et al.617 in2005 for determining Rc for glass-forming melts, which is basedon analyzing the relatively larger exothermic crystallizationpeaks that result when glasses with a known precrystallizationdegree after slow cooling are reheated at a constant rate in aDSC or DTA as described below.The area of a DTA/DSC peak on reheating is directly
proportional to the amount of heat evolved duringcrystallization, and, hence, to the amount of residual glasspresent after cooling an equilibrated melt, which, in turn,depends upon the initial cooling rate of the melt. If a glass ispartially crystallized (for a sufficiently slow qc, for example), thesubsequent DTA peak area on reheating will be smaller thanthose for a crystal-free glass cooled at a faster rate, since thepartially crystallized sample will contain less residual glass. Asolid sample produced at qc ≥ Rc should be crystal-free, andthe area of the subsequent reheated DTA peak should be amaximum. This means that no further increase in the area ofthe DTA peak would be observed for samples prepared bycooling the melt at rates higher than Rc. The primary task ofdetermining Rc by this method, therefore, is to identify acooling rate which produces a sample whose subsequent rate-heated DTA yields a crystallization peak with maximum area.Ray et al.617 tested three different glasses: a 38Na2O·62SiO2
(mol%) glass with a previously known Rc (∼20 K/min) andtwo complex, multicomponent Li2O·2SiO2 based dental glass-ceramics. Three DTA heating curves, collected at 15 °C/min,for the 38Na2O·62SiO2 (mol%) melts are shown in Figure 64.These curves were obtained after cooling each melt at differentrates (qc) indicated in the figures. Similar DTA results were
Figure 63. (a) Schematic diagrams of temperature−time coolingcurves for a hypothetical melt cooled at different speeds, qc. The meltcrystallizes, as exhibited by exothermic peaks, when cooled at ratesless than the Rc. The onset temperature of crystallization, Tc, and thepeak height, h, decrease with increasing qc, and the cooling rate forwhich the crystallization peak disappears is the Rc. The inset shows acontinuous-cooling-transformation diagram based on the temper-ature−time cooling curves. (b) Schematics of a typical nose-shapedisothermal temperature−time−transformation (TTT) diagram. Tm:melting point, Tn: nose temperature where the supercooled liquidcrystallizes in the shortest possible time, tn (nose time), R: coolingrate, Rc: critical cooling rate for glass formation. Reproduced withpermission from ref 617. Copyright 2005 Elsevier Science B.V.
Chemical Reviews Review
DOI: 10.1021/acs.chemrev.8b00510Chem. Rev. XXXX, XXX, XXX−XXX
BK

obtained for all three melts cooled at different rates, and theDTA peak areas are drawn as a function of qc in Figure 65 forglass 38Na2O·62SiO2 (mol%). Figure 65 shows that the DTApeak areas for all the samples initially increased with increasingR, indicating the existence of a higher fraction of residual glassin the cooled samples. The DTA peak area was maximum at aparticular qc and remained constant with further increase of qc.The critical cooling rate for glass formation, Rc, was taken asthe value of qc where the crystallization peak area on thesubsequent reheating cycle is maximized, i.e., when the meltcompletely vitrifies. As shown in Figure 65, the value of Rc wasdetermined from the intersection of the tangent drawn at theinflection point of the ascending curve, and the straight lineproduced by backward extrapolation of the plateau region. Forthe 38Na2O·62SiO2 (mol%) melt, this method predicted Rc of19 ± 1 °C/min, which was close to the value of ∼ 20 °C/mindetermined for this composition by standard techniques. Forthe two multicomponent Li2O-SiO2 based glasses, the Rc wasalso determined by the conventional methods described aboveand compared with the new method. The results showed that
the values of Rc determined by the different methods were inexcellent agreement, except using eq 77. The value of Rcdetermined by this equation (41 ± 3 and 53 ± 3 °C/min forthe two different multicomponent lithium silicate glasses) was10 °C/min higher than those determined by CCT curvetechnique. However, the values of Rc (33 ± 1 and 41 ± 2 °C/min) obtained by the method of Ray et al.617 agreed very wellwith those obtained by the more conventional cooling rateanalyses (32 ± 2 and 43 ± 2 °C/min, respectively).However, traditional DSC methods have some limitations in
determining Rc of either extremely poor glass formers (e.g.,metals) or exceptionally good glass formers (e.g., some certainsoda lime silicates and some atactic polymers). Normal DSCequipment cannot provide a sufficiently high cooling rate forvitrifying metallic liquids or a sufficiently low cooling rate todevitrify some polymers. On the other hand, new DSCtechniques are being rapidly developed such as Flash DSC (seeSection 5), which are able to heat a sample at heating andcooling rates of about 0.1−40,000 K/s enabling investigationof various properties of polymers, such as the determination ofthe Rc of very poor glass formers. Some older and updatedreviews42,631,632 have focused on the application of conven-tional and Flash DSC in studying polymers. For instance, theheat capacity can be studied under two extreme limits, that is,under quasi-isothermal conditions (limit of zero heating rate)and under fast heating/cooling rates. Flash DSC studies ofsemicrystalline polymers, which are far from equilibrium, alsoreveal recrystallization and reorganization during rapid heating.For example, the last endotherm detected under standard DSCscanning of some polymers, e.g., poly(ethylene terephthalate),is caused by molecular reorganization and vanishes under rapidheating conditions.631
In Flash DSC, the choice of scan rate depends on thepolymer being tested. The scan rates for semicrystallinepolymers are a particular case because the phase transitions aretime-dependent.632 Another interesting advantage of the FlashDSC method is the fact that it allows not only for the analysisof crystallization but also for reorganization processes thatcould not be measured previously. With currently availableequipment, such tests can be carried out in the temperature
Figure 64. DTA heating curves (15 °C/min) for the solidified meltsof a 38Na2O·62SiO2 (mol%) composition after cooling the melts at(a) 5 °C/min, (b) 20 °C/min, and (c) 25 °C/min. The area andheight of the crystallization peak increased as the prior cooling rateincreased from (a) 5 °C/min to (b) 20 °C/min, but no such increasein their values is observed when the prior cooling rate exceeded thecritical cooling rate, Rc, for this melt; compare (b) and (c).Reproduced with permission from ref 617. Copyright 2005 ElsevierScience B.V.
Figure 65. Calculation of Rc by Ray’s method using a tangentintersection procedure. Results for a 38Na2O−62SiO2 (mol%) glassfrom Figure 64 were used to calculate peak area for each cooling rate(qc). With permission from ref 617. Copyright 2005 Elsevier ScienceB.V.
Chemical Reviews Review
DOI: 10.1021/acs.chemrev.8b00510Chem. Rev. XXXX, XXX, XXX−XXX
BL

range −95 to 1000 °C. Some representative examples areprovided here.42
Trevino-Quintanilla and co-workers reported results regard-ing the nonisothermal crystallization of high-density poly-ethylene (HDPE) resins.633 The melting enthalpy wasdetermined by Flash DSC. Different cooling rates in a widerange, 50 to 4000 K/s, were used for studying the thermalactivity of HDPE. The crystallization temperature decreaseswith higher cooling rate,633 as expected. In isothermal studies,in which the sample is fast cooled from the melt to thecrystallization temperature, and the isothermal heat flow ismeasured, the same dependence between the crystallizationtemperature and the cooling rate of HDPE was alsoobserved.633
In a recent work, Li and co-workers used Flash DSC to studythe nucleation kinetics of poly(L-lactic acid)/poly(D-lacticacid) blends. The proposed method is useful in analyzing thenucleation kinetics, irrespective of the crystallization rates.634
In this study, which was complementary to the nucleationkinetics determination by Tammann’s method536 reported bySchick’s group,635 nucleated samples were heated at a relativelyslow rate (0.5 K/s) to the growth temperature (TG) range,instead of fast heating the nucleated samples (Tammann’smethod), or by isothermally crystallizing a nucleated sample athigher temperature. Also, Flash DSC was instrumental to makethe glass, quench the nucleated sample, and reheat it to Tm at asufficiently fast rate (2000−3000 K/s) (Figure 66).634
After heating a nucleated sample of 20 kg/mol PLLA/PDLAblends from 413 K (TN) to 463 K (TG) at 0.5 K/s, the sampleis crystallized and then fast-quenched to room temperature.The melting enthalpy (ΔHm) of the crystallized sample wasmeasured by heating the sample at 2000 K/s to above themelting point in a Flash DSC. The ΔHm resulting from themelting of the crystals reflected the nucleation density in theprimary sample.Thermally induced crystallization of polymers can be carried
out by crystallizing them either from the molten state or fromthe glassy state. The former is called melt crystallization, andthe latter is called cold-crystallization.636 The nucleationkinetics of polymers can be measured by using optical
microscopy and evaluating the spherulite number densityand size increasing with time.637 Additionally, in calorimetry,nucleation of polymer crystals can also be determined bymonitoring the evolution of enthalpy of cold-crystallizationduring subsequent heating, since this property depends on thenumber of previously formed nuclei.638,639 Figure 67(a) showsthe final Flash DSC heating curves of the samplescorresponding to different nucleation times at 433 K. Themelting enthalpy on the final heating curves as a function ofnucleation time is plotted in Figure 67(b). Figure 67(a) showsthe final heating curves with significant changes depending onthe nucleation time. For nucleation times less than 50 s, thearea of the melting peaks is almost equal. Therefore,homogeneous nucleation has not happened yet; the meltingenthalpy on the final heating curves, namely the enthalpy ofcold-crystallization during slow heating from 413 to 463 K,must be initiated by heterogeneous nucleation in the sample,e.g., solid impurities or at the interfaces between the sampleand the chip sensor. Predictably, when the nucleation time islonger than 50 s, the area of the melting peaks continuouslyincreases with time, which means that homogeneousnucleation has taken place. Thus, it is worth emphasizingthat by using a commercially available fast-scan chip-calorimeter, slow heating of the PLLA/PDLA blends in anassigned temperature range makes it possible to initiate theircold-crystallization by different amounts of the nucleus, andthe protocol presented in Figure 66 is valid for the PLAnucleation kinetics determination. Subsequently, after nuclea-tion at different temperatures for different times and followingcold-crystallization during heating at 0.5 K/s from 413 K to463 K, the melting enthalpies of the PLLA/PDLA blendssample were recorded in Figure 67(c). Inspection of this figurereveals that the melting enthalpies corresponding to the earlynucleation period are still indistinguishable at differenttemperatures, although the induction time of the meltingdepends on the nucleation temperature. This result furtherconfirms the assumption that heterogeneous nuclei initiatedthe cold-crystallization process with shorter nucleation time.Following the approaches originally proposed by Schick’sgroup635 and by Wang et al.640 by drawing a horizontal line(dash line in Figure 67c) at a constant ΔHm, i.e., half of thesaturated crystallization enthalpy (1.0 μJ for this sample), onecan use the intersections, denoted as half-nucleation time, toextract the data points for nucleation time vs nucleationtemperatures. The resulting curve based on these data is shownin Figure 68, which shows the best nucleation temperaturereferring to the minimum required time for nucleation. Byusing this experimental protocol and commercially availableFlash DSC, for the 20 kg/mol PLLA/PDLA blends, the finaltemperature versus nucleation time curve was determined andshowed a minimum value around 493 K, which is 20 K higherthan the published results by using Tammann’s two-stagenuclei development method.634
By applying the classical nucleation theory, Liu et al.641
established a new approach for determining the Rc of glass-forming liquids based on DSC and viscosity data. Theirmethod involves either the Turnbull equation642 or theThompson−Spaepen equation643 for ΔG. For three differenttypes of glass-forming systems (oxide, metallic, and molecularsystems), they found that the Rc values obtained through theThompson−Spaepen equation are more reliable than thosefrom the Turnbull equation. To further verify the applicabilityof the new approach in quantifying GFA, a broad range of
Figure 66. Temperature−time profile of the experimental protocoldesigned by Li et al. for determination of nucleation kinetics forPLLA/PDLA blends, where PDLA refers to poly(D-lactic acid).Reproduced from ref 634. Copyright 2018 Elsevier B.V.
Chemical Reviews Review
DOI: 10.1021/acs.chemrev.8b00510Chem. Rev. XXXX, XXX, XXX−XXX
BM

cooling rates (5 to 12,455 K/s), which was realized by threequenching methodscasting, pressing, and water-quench-ingwas used to determine the Rc of a phosphosilicate melt.This Rc value was estimated to be 3,700 K/s, which isconsistent with 4,000 K/s reported elsewhere.617
7.6. Glass Stability
While glass-forming ability (GFA) is defined as the resistanceto crystallization of a supercooled liquid during cooling, glassstability (GS) is defined as the resistance to devitrification ofglass or supercoooled liquid during heating. GFA is mostimportant during processes requiring vitrification, while GS isvery important during operations involving thermal treatmentof existing glass, such as annealing, tempering, or treatment forceramization. Although these two properties are not identical,they are frequently confused in the literature and technologicalpractice. It is often (reasonably) assumed that poor glass-forming ability automatically leads to poor glass stability, andvice versa.66
Glass stability is frequently characterized by the differencebetween the onset temperature of the glass transition (Tg) andthe DSC/DTA crystallization peak temperature (Tc) for asample heated at a given rate. The exact definitions of Tg andTc are subjected to the preference of the experimenter, asdiscussed in Figure 51. A drawback of this method is that thesetwo temperatures depend not only on the chemicalcomposition but also on glass particle size and heating rate;hence these two experimental parameters should be keptconstant for a proper evaluation of glass stability. Some authorsargued that the quantity (Tc − Tg), should be normalized byTg, Tc, or Tm of the crystalline phase, to compare the behaviorof glasses which crystallize in very different temperature ranges.As a result, there is no unanimously accepted criterion for glassstability. In general, however, as long as samples of different
Figure 67. Melting behaviors of PLLA/PDLA blends after being cold-crystallized over a temperature range between 413 and 463 K at 0.5 K/s,following a previous isothermal nucleation at 433 K for different times using the protocol of Figure 66. (a) Flash DSC curves. (b) Melting enthalpyas a function of the nucleation time at 433 K. (c) Melting enthalpy of samples nucleated at different temperatures for different times and followingcold-crystallization during heating at 0.5 K/s from 413 K to 463 K. Reproduced from ref 634. Copyright 2018 Elsevier B.V.
Figure 68. Half-nucleation time as a function of temperature,measured after applying the experimental protocol presented inFigures 66 and 67c. Adapted from ref 634. Copyright 2018 ElsevierB.V.
Chemical Reviews Review
DOI: 10.1021/acs.chemrev.8b00510Chem. Rev. XXXX, XXX, XXX−XXX
BN

compositions are compared using identical characteristics(particle size and heating rate), several of the proposedparameters, especially those containing all three characteristictemperatures, yield similar results.66
We first summarize the GS criteria following the study ofKozmidis-Petrovic and Sestak.644 They have compared thefamous Hruby parameter with other measures of the glassstability and vitrification ability. Some of these criteria arelisted in Table 2.
DSC traces (see Figure 51) may contain one or moreexothermic peaks due to the crystallization of different phases,but only the lowest crystallization peak is considered whencalculating glass stability because once significant crystalliza-tion occurred, subsequent events at higher temperatures nolonger affect the GS.There has been a long debate whether glass stability
parameters can infer glass-forming ability.655−661 For instance,Cabral et al.656 used experimental nucleation, I(T), and growthrates, U(T), for some glasses (Li2O·2SiO2, BaO-2SiO2, Na2O-2CaO-3SiO2, and 2Na2O-CaO-3SiO2 glasses) that nucleate(supposedly homogeneously) in the sample interior tocalculate critical cooling rates for glass formation (Rc) by theTTT method. The Rc for small 20 mg pieces of lithiumdisilicate glass (Rc ∼ 0.2−0.3 K/s, estimated from a TTT curvewhich was calculated from the JMAK model) agreed withquenching practice in laboratories and also with literaturedata.660 A strong correlation between the Hruby parameter ofglass stability and the glass-forming ability, evaluated by Rc, wasfound. Therefore, they suggested that the Hruby parameter canbe used to estimate the glass-forming ability at least for glassesthat exhibit volume nucleation.In a complementary study, Nascimento et al.659 assessed and
compared the GFA and several GS parameters for differentglasses. GFA and GS were estimated for six stoichiometricoxide glass-forming liquids that show predominant surface(heterogeneous) crystallization in laboratory time scales. Theseglasses were GeO2, Na2O·2SiO2, PbO·SiO2, CaO·Al2O3·2SiO2,CaO·MgO·2SiO2, and 2MgO·2Al2O3·5SiO2. They also inves-tigated Li2O·2SiO2 and Li2O·2B2O3 glasses that, besides
surface nucleation, also undergo homogeneous (internal)crystallization. They gauged GFA by the critical cooling rate,Rc, which was calculated from experimental crystal growthrates, U(T), and an estimated number of heterogeneousnucleation sites per unit surface, Ns, assuming a detectablesurface crystallized fraction Xc = 0.001. They calculated GSparameters using 14 different combinations of the character-istic DTA or DSC temperatures: the glass transition temper-ature (Tg), the onset crystallization temperature of heating(Tx), the peak crystallization temperature on heating (Tc), andthe melting point (Tm). To obtain the experimental GS criteriafor each glass, they ran DSC using coarse and fine glasspowders and completed the necessary calculations usingliterature values for Tm. Similar results were obtained for fineand coarse particles. Most of the GS parameters that involvethe three characteristic DSC temperatures showed an excellentcorrelation with GFA. On the other hand, rather poorcorrelations were revealed for criteria that use only twocharacteristic temperatures. This study thus showed thatcertain, but not all, GS parameters could be used to inferGFA659 of the tested glasses, for samples that showpredominantly heterogeneous crystallization.Then, Ferreira et al.661 re-evaluated nine parameters of glass
stability (GS) on heating using DSC experiments to predict theGFA of oxide liquids. Li2O·B2O3 glasses with 20.0−66.7 mol%Li2O were tested. The samples were prepared using bothcommercial chemicals and powders obtained via a solutionmethod. The GS parameters were calculated using thecharacteristic Tg, Tx, and Tm of DSC thermograms (Table2). They found that seven stability parameters give similartrends for compositions up to 33.3 mol% Li2O, and asexpected, the GS significantly decreased with lithia content.Beyond that, up to 66.7 mol% Li2O, GS showed a broad,shallow maximum but was approximately constant, indicatingthat, surprisingly, the composition did not significantly affectthe GFA in this compositional range. This result qualitativelyagreed with their successful experience of preparing glasseswith compositions up to 74 mol% Li2O and corroborated theadequacy of simple DSC tests to comparatively gauge the GSand GFA of glass-forming liquids.661
Furthermore, the review of Kozmidis-Petrovic and Sestak644
revealed that some generalized correlations between glass-forming ability and glass stability do exist. The relative changeof the Hruby parameter is the highest in almost all cases.Compared to other parameters (Table 2), this parameter ismore sensitive to the change of both the supercooled region(Tx − Tg) and the reduced glass-transition temperature (Trg).The relationship between the Hruby parameter and GFA issatisfying for oxide glasses and thus can be employed as areliable proxy for GFA. Associated problems are theexperimental determination of the proper temperatures.644
In another endeavor to test GS parameters for oxide glasses,Marques and Cabral662 determined the GS parametersproposed by Hruby (KH),
645 Weinberg (KW),647 Lu and Liu
(KLL),648 Long et al. (KLX),
653 and Zhang et al. (KZW)650
(Table 2) for Li2O·2SiO2, BaO·2SiO2, Na2O·2CaO·3SiO2, and2BaO·TiO2·2SiO2 glasses, which show predominant internalcrystallization. DSC experiments were performed in air, usingPt-Rh crucibles, at heating rates (qh) of 2, 5, 10, 15, 20, 25, and30 °C/min on monolithic specimens from room temperatureup to their melting temperatures. The results revealed that allthe criteria under investigation change significantly as afunction of the heating rate. The KH, KW, and KLL increased
Table 2. Examples of Glass Stability Parameters Based onthe Characteristic Temperatures (in Kelvin) Determined byDSC/DTAa
Glass stability parameters Proposed by
K T T T T( )/( )H x g m x= − − Hruby 645
KSP = (Tc − Tx)(Tx − Tg)/Tg Saad and Poulain646
K T T T( )/W c g m= − Weinberg647
KLL = Tc/(Tg + Tm) Lu and Liu648,649
K T T T T T/(2 ) /ZW g x g g m= − − Zhang et al.650
K T T T(2 )/DH x g m= − Du et al.651
K T T T( / )FC rg xg g= Δ Fan et al.652
K T T T T T/ 2 /( )LX g c g g m= − + Long et al.653
K T T T T/( )YB x g m x2= − Yuan et al.654
aTx: onset crystallization peak temperature, Tc: crystallization peaktemperature, Tg: glass transition temperature, Tm: melting temper-ature, Trg = Tg/Tm: reduced glass transition temperature, Tx-Tg:supercooled region (adapted from ref 644).
Chemical Reviews Review
DOI: 10.1021/acs.chemrev.8b00510Chem. Rev. XXXX, XXX, XXX−XXX
BO
with HR while KZW and KLX decreased. To evaluate theconsistency of these criteria in envisaging GFA, they werecorrelated to the critical cooling rates estimated by thecontinuous cooling (RCC) and “nose” (RCN) methods usingexperimental data of steady-state nucleation and crystal growthrates, the viscosity of each vitreous material, and free energyper unit of volume. They found that the correlation betweenthe GFA (RCC or RCN) and all the GS parameters investigatedpersists if changes of the GS parameters with heating rate areconsidered.662
However, some relatively stable glasses crystallize so slowlythat they do not exhibit a crystallization exotherm duringheating at 5∼20 K/min. When used in normal DSC/DTAstudies, they cannot be characterized by GS parameters. Inthese cases, it is usually necessary to carry out a series ofisothermal heat treatments, to determine the conditions underwhich such glasses crystallize to a detectable extent. Creationof a TTT diagram, as described in Section 7.5, often proves tobe a good method for defining their stability and GFA.Finally, the Tg/Tm ratio can be regarded as a (rough)
measure of GS. The larger this ratio, the higher the GS andinferentially the GFA. For most of the glass formers, this ratiois close to or below Tg/Tm = 2/3. Recently it has beendiscovered that the metal−organic framework, ZIF-62 (Zn-(Im2−xbImx)) exhibits ultrahigh GFA, and this is corroboratedby the fact that its Tg/Tm ratio is 0.84, higher than any otherknown glass former.663 For instance, B2O3 and Albite, the bestoxide glass formers, have Tg/Tm of approximately 0.76−0.78.664
7.7. Liquidus Temperature
It is critical in laboratory and industrial practice to define thetemperatures for the glass melting, homogenization, and finingprocesses, so that the manufacturing can be conducted withoutthe risk of incipient devitrification. However, the accuratedetermination of TL is not trivial and takes a long time forcompositions that are reluctant to crystallization, i.e., for mostcommercial products.66
The liquidus temperature of systems that crystallize readilycan be determined with DSC/DTA, a method which isremarkably simpler than the conventional “uniform temper-ature method”. The latter is performed according to theAmerican Society for Testing and Materials (ASTM)-C829and is accelerated using a gradient temperature furnace andsubsequent microscopic analysis for tracking of the liquid−crystal equilibrium.665 The reliability of the ASTM methoddepends heavily on the experience and eyes of the operatorand his/her interpretation. Another difficulty is the fact that, inmost cases, slowly crystallizing glasses are desired for mostcommercial products. Hence, the determination of the liquid−crystal equilibrium temperature can be effortful, inexact, andtime-consuming.The statistical error in the TL determination by the gradient
furnace method in 20 tests of the same glass in the samelaboratory was about ±7 K. Then, in a round-robin study,Beerkens and Conradt666 reported that investigation ofsamples from the same glass batch in 6 different laboratoriesyielded variations of 50−60 K. Although thermodynamicmodels, computer modeling, and empirical methods based onthe chemical composition are available to predict the liquidusof glass-forming systems,666−669 they have serious limitations;for example, thermodynamic data are often unavailable ordifficult to determine, and it is often not practical to
extrapolate to compositions out of the range of previousexperiments.666−669 In this regard, the use of deep learning orartificial intelligence (such as artificial neural networks)warrants more study and should be further developed for thereliable prediction of the liquidus temperatures (and otherproperties) of multicomponent glass-forming systems.147
As described in Section 7.1, any characteristic DSC trace fora stoichiometric, and easily crystallized glass shows at leastthree distinct signatures during heating: Tg, Tc, and TL (Figure51). However, DSC curves of complex multicomponent glassesthat resist crystallization (such as most commercial glasses)frequently show no crystallization and melting peaks, whereasothers show multiple Tg (phase separated systems) and Tc andmelting peaks. The correct interpretation of TL even forcompositions that show clear melting peaks also presents somedifficulties. Some of the problems discussed in the literatureregarding the use of DSC techniques for the determination ofthe liquidus temperature are reviewed henceforth.First, thermocouples are not always calibrated as they should
be. The geometry and thermal properties of the sample holdershould be introduced to the DSC/DTA software. However,when simultaneous melting processes occur,670 as in multi-component glasses, it is particularly difficult to interpret theresults. Any DSC peak can be identified by its onset,maximum, and offset temperatures (Figure 51). It is simpleto acquire the temperature of a DSC melting peak, although itsphysical meaning is not so clear. The determination of theother characteristic temperatures, such as the onset and offsettemperatures, is not so easy. Conventionally, these last twotemperatures are typically determined by the meeting point oftangents to the curve, traced on the baseline and the peak side,on the low- and high-temperature peak side, respectively.However, this so-called ‘‘tangent method’’ is not a standardpractice, and its uncertainty is difficult to estimate.Furthermore, it is also hard to draw tangents on a nonstraightDSC peak side, on broad, or low-intensity, or overlappedpeaks. All these parameters increase the uncertainty of thismethod. Garidel et al.671 compared the tangent method withanother method for marking the onset and offset temperaturesof the DSC melting peak. Their method simulates the variationof heat capacity as a function of temperature, assuming that theonset and offset points of the DSC melting peak are the solidusand the liquidus, respectively. They established binary-phasediagrams for organic compounds using the proposed techniqueand compared the results with those built by the tangentmethod. The resulting diagrams revealed that the liquidusvalues determined from both methods were in good agree-ment, while the solidus values deviated considerably.Pedersen et al.672 applied another DSC method to figure out
the solidus and liquidus of a Sn-Pb eutectic phase diagram.They used the tangent method to determine the onset andoffset of DSC melting peaks at various heating rates bychanging the heating rates from 0.1 to 30 °C/min. Theseauthors also supposed that a fit to the data points plotted as afunction of the heating rate and extrapolated to zero heatingrate represented the solidus for the onset and the liquidus forthe offset. They found, for their system, that the onset of themelting peak (the eutectic temperature in this case) wasindependent of composition and heating rate, whereas the endpoint temperature changed linearly with the heating rate, withapproximately the same slope for all compositions. The solidusand liquidus were in agreement with a published phase diagramwithin a few percent errors. Pedersen et al.672 used several
Chemical Reviews Review
DOI: 10.1021/acs.chemrev.8b00510Chem. Rev. XXXX, XXX, XXX−XXX
BP
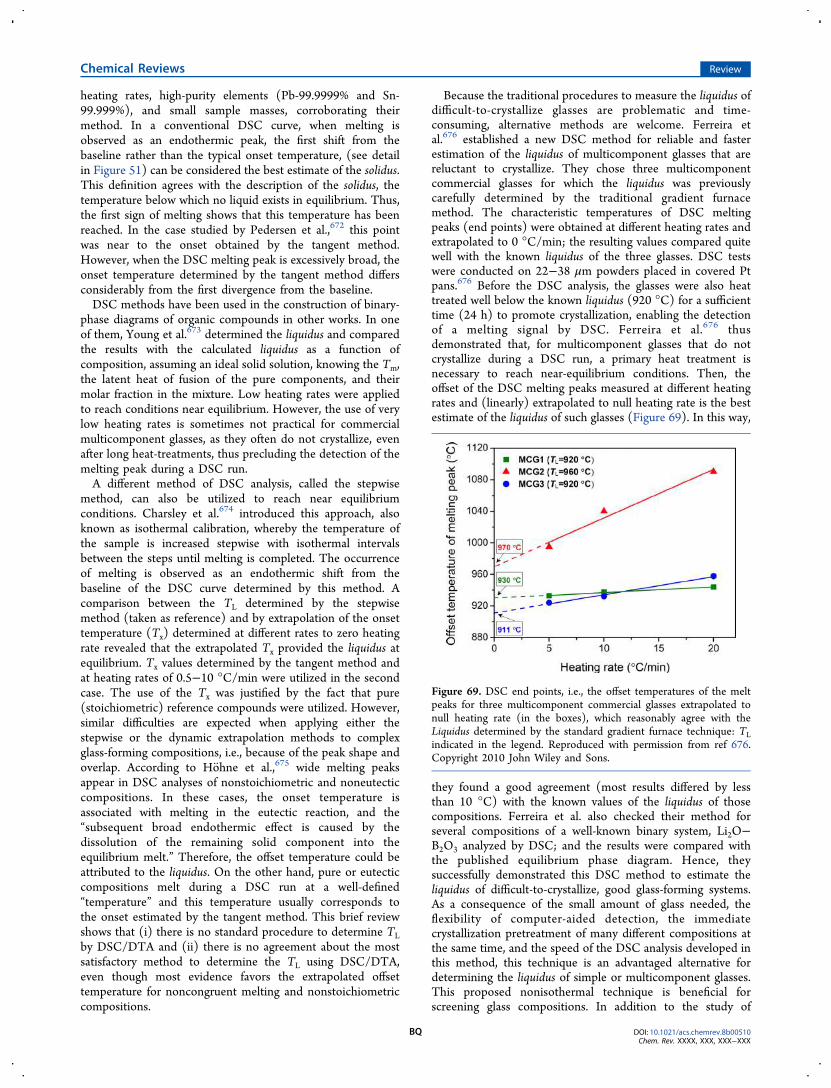
heating rates, high-purity elements (Pb-99.9999% and Sn-99.999%), and small sample masses, corroborating theirmethod. In a conventional DSC curve, when melting isobserved as an endothermic peak, the first shift from thebaseline rather than the typical onset temperature, (see detailin Figure 51) can be considered the best estimate of the solidus.This definition agrees with the description of the solidus, thetemperature below which no liquid exists in equilibrium. Thus,the first sign of melting shows that this temperature has beenreached. In the case studied by Pedersen et al.,672 this pointwas near to the onset obtained by the tangent method.However, when the DSC melting peak is excessively broad, theonset temperature determined by the tangent method differsconsiderably from the first divergence from the baseline.DSC methods have been used in the construction of binary-
phase diagrams of organic compounds in other works. In oneof them, Young et al.673 determined the liquidus and comparedthe results with the calculated liquidus as a function ofcomposition, assuming an ideal solid solution, knowing the Tm,the latent heat of fusion of the pure components, and theirmolar fraction in the mixture. Low heating rates were appliedto reach conditions near equilibrium. However, the use of verylow heating rates is sometimes not practical for commercialmulticomponent glasses, as they often do not crystallize, evenafter long heat-treatments, thus precluding the detection of themelting peak during a DSC run.A different method of DSC analysis, called the stepwise
method, can also be utilized to reach near equilibriumconditions. Charsley et al.674 introduced this approach, alsoknown as isothermal calibration, whereby the temperature ofthe sample is increased stepwise with isothermal intervalsbetween the steps until melting is completed. The occurrenceof melting is observed as an endothermic shift from thebaseline of the DSC curve determined by this method. Acomparison between the TL determined by the stepwisemethod (taken as reference) and by extrapolation of the onsettemperature (Tx) determined at different rates to zero heatingrate revealed that the extrapolated Tx provided the liquidus atequilibrium. Tx values determined by the tangent method andat heating rates of 0.5−10 °C/min were utilized in the secondcase. The use of the Tx was justified by the fact that pure(stoichiometric) reference compounds were utilized. However,similar difficulties are expected when applying either thestepwise or the dynamic extrapolation methods to complexglass-forming compositions, i.e., because of the peak shape andoverlap. According to Hohne et al.,675 wide melting peaksappear in DSC analyses of nonstoichiometric and noneutecticcompositions. In these cases, the onset temperature isassociated with melting in the eutectic reaction, and the“subsequent broad endothermic effect is caused by thedissolution of the remaining solid component into theequilibrium melt.” Therefore, the offset temperature could beattributed to the liquidus. On the other hand, pure or eutecticcompositions melt during a DSC run at a well-defined“temperature” and this temperature usually corresponds tothe onset estimated by the tangent method. This brief reviewshows that (i) there is no standard procedure to determine TLby DSC/DTA and (ii) there is no agreement about the mostsatisfactory method to determine the TL using DSC/DTA,even though most evidence favors the extrapolated offsettemperature for noncongruent melting and nonstoichiometriccompositions.
Because the traditional procedures to measure the liquidus ofdifficult-to-crystallize glasses are problematic and time-consuming, alternative methods are welcome. Ferreira etal.676 established a new DSC method for reliable and fasterestimation of the liquidus of multicomponent glasses that arereluctant to crystallize. They chose three multicomponentcommercial glasses for which the liquidus was previouslycarefully determined by the traditional gradient furnacemethod. The characteristic temperatures of DSC meltingpeaks (end points) were obtained at different heating rates andextrapolated to 0 °C/min; the resulting values compared quitewell with the known liquidus of the three glasses. DSC testswere conducted on 22−38 μm powders placed in covered Ptpans.676 Before the DSC analysis, the glasses were also heattreated well below the known liquidus (920 °C) for a sufficienttime (24 h) to promote crystallization, enabling the detectionof a melting signal by DSC. Ferreira et al.676 thusdemonstrated that, for multicomponent glasses that do notcrystallize during a DSC run, a primary heat treatment isnecessary to reach near-equilibrium conditions. Then, theoffset of the DSC melting peaks measured at different heatingrates and (linearly) extrapolated to null heating rate is the bestestimate of the liquidus of such glasses (Figure 69). In this way,
they found a good agreement (most results differed by lessthan 10 °C) with the known values of the liquidus of thosecompositions. Ferreira et al. also checked their method forseveral compositions of a well-known binary system, Li2O−B2O3 analyzed by DSC; and the results were compared withthe published equilibrium phase diagram. Hence, theysuccessfully demonstrated this DSC method to estimate theliquidus of difficult-to-crystallize, good glass-forming systems.As a consequence of the small amount of glass needed, theflexibility of computer-aided detection, the immediatecrystallization pretreatment of many different compositions atthe same time, and the speed of the DSC analysis developed inthis method, this technique is an advantaged alternative fordetermining the liquidus of simple or multicomponent glasses.This proposed nonisothermal technique is beneficial forscreening glass compositions. In addition to the study of
Figure 69. DSC end points, i.e., the offset temperatures of the meltpeaks for three multicomponent commercial glasses extrapolated tonull heating rate (in the boxes), which reasonably agree with theLiquidus determined by the standard gradient furnace technique: TLindicated in the legend. Reproduced with permission from ref 676.Copyright 2010 John Wiley and Sons.
Chemical Reviews Review
DOI: 10.1021/acs.chemrev.8b00510Chem. Rev. XXXX, XXX, XXX−XXX
BQ

Ferreira et al.,676 it has been reported in several papers that theof fset of the melting reaction for binary systems should be usedas a proxy for TL.
672,673,677 The linear extrapolation approachof determining TL was confirmed by a recent study of basalticglass compositions.217
More recently, the liquidus temperatures (TL) of good glass-forming systems within the CaO-SiO2-MgO-Al2O3 system(CMAS) were evaluated by Veit et al.678 The reproducibility ofTL via DTA was studied and compared with results from thegradient furnace method. Since these glasses were reluctant tocrystallize, a previous heat treatment was performed to inducecrystallization. The onset and the offset temperatures of themelting peaks of precrystallized glasses were determined at aheating rate of 2 K/min and compared with the liquidustemperatures obtained by the gradient furnace method.666 Theoffset temperatures of the melting peaks were closest to theresults determined using the ASTM procedure. The majorityof offset results via DTA differed by not more than 10 Kcompared to the isothermal (gradient) liquidus temperatures.This method is indeed a very helpful option to estimate theliquidus temperature of complex multicomponent glasses.678
7.8. Applications in Developing Glass-Ceramics
DTA/DSC are valuable tools for developing an importantgroup of materials, i.e., glass-ceramics (GCs). Numerous novelglass-ceramics have been developed so far for domestic,electronic, optical, dental, and biomedical applica-tions.22,530−532 As discussed by Davis and Zanotto,23 noother class of materials possesses such valuable and unusualcombination of properties in an advantageous and feasiblemanner.23 “Glass-ceramics are inorganic, non-metallic materialsprepared by controlled crystallization of glasses via dif ferentprocessing methods. They contain at least one type of functionalcrystalline phase and a residual glass. The volume fractioncrystallized may vary f rom ppm to almost 100%”.679 Heat
treatment is usually (but not always) performed in two stages:first, at relatively low temperatures, not far from the glasstransition, Tg, to induce internal nucleation, followed by asecond stage at a higher temperature to promote the growth ofdifferent phases. Therefore, accurate determinations ofnucleation and growth temperatures and their kinetics arecrucial for establishing precise heat treatments.528 In thiscontext, quick estimation of optimum nucleation/growthtemperature (e.g., by DSC), kinetic parameters such as crystalnucleation rate, nucleation time-lag (or induction period), andgrowth rate are of great importance, because they can be usedto define the crystal number density, N (nuclei/m3), which inturn limits the average size and the shape of the crystals in theresulting microstructure. These quantities determine, to a greatextent, the properties and applications of GCs. For example,new classes of advanced nanoglass-ceramics can be developedif the average size is kept at less than 200 nm.680,681 The samecomposition that is transparent with nanosized crystallites willbecome opaque with larger crystals. Crystallite morphologiesrange from blocky “coast and island” microstructures to longand narrow dendritic structures. A wide and most beautifulvariety of crystallite morphologies have been shown byZanotto in ref 682, including starlike NaF and spheruliticcristobalite crystals in the volume of PTR (photothermo-refractive) glass as in Figure 70. For a thorough insight into theapplication and prospects of glass-ceramics, we refer theinterested readers to some recent reviews.22,23,529−532,309
Finally, we can safely state that a DSC/DTA analysis is thefirst, and perhaps the most important, test in scrutinizingcandidate glass compositions for subsequent glass-ceramicdevelopment.More than 3,300 studies indexed in the Scopus database
report on the use of DSC/DTA analysis for investigations ofinorganic glasses, and many other studies deal with metallic
Figure 70. (a) NaF crystals in the interior of a PTR glass-ceramic. Treatment at a high temperature near the solubility limit. UV-unexposed, heat-treated at 700 °C for 30 min. (b) At more advanced stages, after precipitation of the desired NaF crystals, spherulitic cristobalite crystals appear inPTR glass. In this case, the glass was not exposed to UV and was hyperdeveloped by extensive thermal treatment. Optical microscopy, transmittedlight. Reproduced with permission from ref 682. Copyright by John Wiley and Sons, Inc. and the American Ceramic Society.
Chemical Reviews Review
DOI: 10.1021/acs.chemrev.8b00510Chem. Rev. XXXX, XXX, XXX−XXX
BR

and organic glasses. Most of them consider the laboratory useof DSC/DTA as a useful and fast method of analysis. However,in most cases, DTA/DSC is merely utilized to estimate themaximum nucleation temperature (Section 7.1.1), theactivation energy for overall crystallization (E), or the Avramiconstant (n) (Section 7.3.2). There are only a few studies,reported herein, that deal with the application of DTA/DSC toinvestigate nucleation or growth rates, GFA, GS, and TL.Therefore, in this section, we elaborated on the versatility andusefulness of DTA/DSC methods to examine a variety of glasscharacteristics. We also wanted to bring the reader’s attentionto some advantages and problems of DTA/DSC methods andto caution them against its “automatic” application. Forexample, in the case of calculating the activation energy forcrystallization or crystallization mechanism via the Kissinger/Ozawa-based equations, ultimate care should be devoted.DSC/DTA analysis well describes the nucleation/growthkinetics in a condition where it is isothermal, and the numberof nuclei (N) and growth rate (U) are constant. In othersituations, e.g., nonisothermal condition, unsteady nucleationbefore induction period, growing N, unsettled U, or multiplephase formations, this study may lead us to superficial resultswhich demand precise (usually complicated) explanations ormodifications. Therefore, it would be highly advisable toconsider numerous recommendations by the ICTAC KineticsCommittee587,588,594 and many other modifications/crite-ria7,589−593 to recalculate the values of E and n reported inmany papers that apply the Kissinger/Ozawa equation to theprocess of crystallization. Because of the uncertainty regardingthe reported values of E and n, we did not refer to many ofthese articles herein. However, there is still an exciting line ofresearch for expanding/simplifying the application of DSC/DTA for more complex conditions, because these techniquesare less tedious, require a smaller amount of sample, and arefaster than most conventional methods.
8. CONCLUDING REMARKS AND PERSPECTIVES
8.1. Calorimetric Glass Transition
Following this comprehensive review, we can indeed state thatDSC has played a critical role in clarifying fundamentalscientific questions related to the glass transition and the glassystate. The glass transition is still considered to be one of themost challenging and interesting problems in condensedmatter science. The abrupt jump of the configurational heatcapacity during the glass-to-liquid transition is a calorimetricsignature of the glass transition and one of its most strikingfeatures. The magnitude of this heat capacity jump stronglydepends on the composition, which is found to be intimatelyassociated with the change of the medium-range structure(Section 3.2.2.).The calorimetric glass transition characteristics of oxide
glasses are found to be connected to the topology of the glassnetwork since the compositional dependence of the Tg and mvalues can be predicted using temperature-dependent con-straint theory. However, for a multicomponent (>4 compo-nents) glass series, the prediction becomes more difficult toderive analytically.146 Topological models can be extended byconsidering the modifying ion subnetwork constraints and therelative strengths of the modifier constraints.144 As such, acomprehensive understanding of the calorimetric glasstransition must combine DSC measurements with knowledgeof the underlying glass structure and topology.
Another important feature of the calorimetric glass transitionis the significant impact of pressure, viz., the pressure-inducedenhancement of the endothermic overshoot. For a borosilicateglass series, it is evident that increasing pressure causes anincrease in the glass density and a commensurate drop in thetopological degrees of freedom due to the conversion of BO3to BO4 units, which entails an increase of network connectivityand rigidity. Interestingly, upon annealing near Tg, thepressure-induced boron speciation remains unchanged whilethe macroscopic properties (e.g., density, refractive index, andhardness) recover, implying that the change in macroscopicproperties is not a consequence of a change in short-rangeorder but rather of the increase in both medium- and long-range ordering.A recent discovery made by DSC is that melt-quenched
metallic glasses can be energetically excited, i.e., rejuvenated,by thermal cycling in the temperature range well below roomtemperature, in contrast to the typical structural relaxationtoward higher density and lower enthalpy states. Thermalcycling enhances the structural heterogeneity (i.e., nonaffinestrains) and hence causes the excitation of potential energy.This phenomenon is found to increase the plasticity of metallicglasses, which is a crucial property for engineering applications.This result also gives insight into energy fluctuations in glassymaterials.DSC is more than just a simple characterization instrument:
it is truly a tool to enable many aspects of advanced glassresearch. This article introduced some of the new DSCapproaches developed for glass research, e.g., the universalmethod for determination of the fictive temperature, coolingrate, liquid fragility, and viscosity of any MQ glass systems andthe HAD approach for probing the enthalpy relaxation and theenergetic and structural heterogeneity in glass.DSC is a sensitive technique for detecting polyamorphic
transitions, which occur in some materials. The pressure/temperature-induced polyamorphic transitions in zeolites canbe identified using DSC with the help of XRD, SAXS, andthermal expansion measurements. Zeolite amorphization istime-dependent, and the dynamics of order−disorder tran-sitions under temperature and pressure are equivalent. Zeolitesbehave as strong liquids during amorphization. In addition,DSC was used to detect the coexistence of both high-densityand low-density amorphous phases in ZIF-4, a metal−organicframework material (see Section 3.7). From the DSC data, asemiquantitative PEL was deduced.4
8.2. Sub- and Sup-Tg Enthalpy Relaxation
We documented several advances in DSC studies of enthalpyrelaxation for different glassy systems. DSC is a powerful toolfor exploring various thermodynamic relaxation events,including sub- and sup-Tg enthalpy relaxations, and forclarifying features of α and β relaxations, from which structuralheterogeneity and fragile-to-strong transition can be evaluated.Within the PEL framework, hyperquenching and physicalvapor deposition are two opposite synthesis routes, by whichthe formed glass systems were brought to comparatively higherand lower energy states, respectively. Ball milling andstretching are another two mechanical methods for formingglasses at different energy levels. The glasses formed viadifferent synthesis routes exhibit their own relaxationcharacteristics in terms of the evolution of Cp curves, providingdetailed information about the thermodynamic evolution, e.g.,during annealing. Exploring the microstructural changes at the
Chemical Reviews Review
DOI: 10.1021/acs.chemrev.8b00510Chem. Rev. XXXX, XXX, XXX−XXX
BS

medium range order level during the enthalpy relaxationprocess of the glass systems produced by different routes,particularly for ultrastable glasses, could be of great importancefor future research. In case of the ball-milling derivedamorphous materials, whose enthalpy relaxation has not yetbeen extensively studied, understanding their glass formationmechanism and relaxation behavior, along with those of thecryomilled glass (rejuvenated glass from annealing a ball-milledsample), is crucial for establishing a universal relaxation theoryfor describing the relaxation dynamics.In Section 4, we introduced the hyperquenching-annealing-
DSC (HAD) approach for glass relaxation studies. Using theHAD strategy, substantial progress has been made inunderstanding the two important dynamical relaxationprocesses, i.e., α and β relaxations. In particular, significantresearch work has been done on the slow β or JG relaxationand confirmed its universality in different glass formers and itsconnection to the glass transition. Despite extensive studies ofthis issue, there is lack of a definite correlation between therelaxation modes, atomic structures, and macroscopic proper-ties/behaviors of glassy systems. Combination of DSC withother techniques, e.g., dynamical mechanical spectrum (DMS)measurements,366,367,380 has demonstrated the relationshipbetween β relaxation and the plastic deformation of metallicglasses, which is of significant importance for the practicalapplication of BMGs. Hence, the effect of relaxation modes onthe functional properties of other glass systems should be givenspecial attention, especially for widely used oxide glasses. Ofcourse, it will be helpful to establish the relationship betweenrelaxation modes and the physical properties of the glasseswhen determining which local structures dominate the variousrelaxation processes.Analyzing Cp curve patterns for glasses subjected to different
degrees of annealing is a powerful way to elucidate thestructural heterogeneity in both normal and poor glass formers.An especially striking anomalous relaxation phenomenon, i.e.,the three-stage sub-Tg relaxation patterns in a typical metallicglass was revealed to correspond to the dynamic fragile-to-strong transition. The underlying physics of this phenomenonlies in the competition of low and the high-temperatureclusters, i.e., the structural heterogeneity of the glass-formingliquids. To understand structural heterogeneities more fully,further investigations regarding both the driving force for suchheterogeneity and the underlying atomic configurations aredesired.Flash DSC (Section 5) has also been employed to study
both the glass transition and the enthalpy relaxation in organic,chalcogenide, and metallic glasses. The extremely highheating/cooling rates of Flash DSC significantly open theinstrument parameter space compared to traditional DSC.Using the unique capabilities of Flash DSC, both the liquidfragility of several polymers and the apparent activationenergies of relaxation were found to vary with the film sizeand cooling rate. Both the underlying physics of m determinedby Flash DSC and the detection of different relaxation modesin various glasses by means of Flash DSC should be consideredas interesting issues for further investigation.In Section 6, we reviewed the TMDSC technique, in which a
modulated heat flow signal can be decomposed into boththermodynamic and kinetic components. Two methods existfor interpretation of the TMDSC signal, viz., complex signalanalysis and decomposition into reversing and nonreversingheat flows. The latter approach has been used to report the
discovery of intermediate phase glasses where the nonreversingheat flow is observed to be at a minimum over a range ofcompositions. This minimum is claimed to correspond to aminimum in aging; however, a rigorous analysis of the physicalmeaning of the nonreversing heat flow is still lacking. Furtherresearch is needed to reconcile these interpretations of theTMDSC signal and to understand the full meaning of thereported intermediate phases in various glass families.
8.3. Crystallization
The present article also elaborated on the versatility and utilityof several DSC techniques for examining the dynamics relatedto nucleation, growth, glass-forming ability (GFA) and stability(GS). We draw attention to the advantages and problemsrelated to the use of DSC and caution the reader against its“automatic” application. For example, DSC is very useful forproviding estimates of the temperature range where significantnucleation occurs (Section 7.1.1). When properly used,isothermal DSC runs yield useful information regardingcrystallization processes, including the crystal number density,the nucleation and growth kinetics, the activation energy foroverall crystallization (Ec), and the Avrami constant (n)(Sections 7.2 and 7.3). In the case of GFA (Section 7.5),traditional DSC methods have limitations in determining thecritical cooling rate (Rc) for vitrification of either extremelypoor glass formers (e.g., metallic alloys) or good glass formers(e.g., some soda lime silicates and some polymers). TraditionalDSC equipment cannot provide sufficiently high cooling ratesfor vitrifying metallic liquids and cannot provide a sufficientlylow cooling rate to devitrify some polymers. On the otherhand, new DSC techniques are being rapidly developed. Forinstance, Flash DSC can heat small samples at a rate up to 106
K/s (Section 4.1.2), enabling determination of the Rc of morereluctant glass formers. In Section 7.6, we summarized the GScriteria and compared them with the well-known Hruby parameter to measure the glass stability and glass-formingability. We also discussed how GS equations could beemployed as a reliable proxy for GFA. Additionally, weregarded the Tg/Tm ratio only as a (rough) measure of GS.The higher this ratio, the greater the GS and therefore theGFA. Our critical review also revealed that (i) there is nostandard procedure to determine the TL by DSC; and (ii) thereis no agreement regarding the most satisfactory method fordetermining the TL by DSC, even though most evidence favorsextrapolating the offset temperature of the endothermicmelting peak to zero heating rate for noncongruent meltingand nonstoichiometric compositions (Section 7.7). Formulticomponent glasses that do not crystallize during a typicalDSC run, a preliminary heat treatment is necessary tocrystallize the material to reach near-equilibrium conditions.Then, the offset of the DSC melting peaks measured atdifferent heating rates and (linearly) extrapolated to nullheating rate provides a good estimate of the liquidus (Section7.7). As a consequence of the small amount of glass needed,the flexibility, and the speed of DSC analysis, this method isrecommended for determining the liquidus of simple ormulticomponent glasses. Finally, in Section 7.8, we emphasizedthat DSC analyses have been used to develop an importantclass of materials, glass-ceramics. Numerous glass-ceramicshave already been commercialized for domestic, electronic,optical, dental, and biomedical applications. These materialsallow for an unusual and valuable combination of properties.They are usually developed (but not always) via two-stage heat
Chemical Reviews Review
DOI: 10.1021/acs.chemrev.8b00510Chem. Rev. XXXX, XXX, XXX−XXX
BT

treatments: first, at relatively low temperatures, to induceinternal nucleation, followed by a second stage at a highertemperature to promote the growth of different crystals.Therefore, accurate determinations of nucleation and growthtemperatures and their kinetics are crucial for establishingprecise heat treatments. In this context, quick estimation of theoptimum nucleation/growth temperature by DSC, kineticparameterssuch as crystal nucleation rate, nucleation time-lag (or induction period), and growth rateare of greatimportance, since they can be used to define the crystalnumber density, N (nuclei/m3), which in turn limits theaverage size of the crystals in the resulting microstructure.These quantities determine, to a great extent, their propertiesand applications and can boost the development of new typesof advanced glass-ceramics.
8.4. Perspectives
DSC is a highly sensitive and versatile technique for detectingthermodynamic changes in glass-forming systems upon heatingor cooling. To build a comprehensive understanding of theglass transition, DSC should be used in combination withother characterization techniques such as dielectric spectros-copy, microscopy, vibrational spectroscopy, and structuralanalysis. This experimental understanding should then beunderstood in terms of underlying physical theories such asenergy landscape and topological constraint theories. Deeperinsights into the sub-Tg enthalpy relaxation can still beobtained through computer simulation techniques, such asmolecular dynamics simulation and phenomenological model-ing, although some initial progress has been made in modelingthe enthalpy relaxation patterns of the annealed HQglasses.309,312 One of the main challenges regarding the originof the calorimetric glass transition is the detection of thestructural evolution during glass transition and relaxation. Toovercome this challenge, in situ NMR and Raman measure-ments during heating or cooling can be designed in such amanner that the enthalpy signal can be detected simulta-neously. To date, Flash DSC has only been used for studyingthe glass transition and relaxation in organic or metallic glasses.It is still challenging to apply this technique to oxide glassesdue to the difficulty of obtaining full contact between the oxidesample and the sensor of the Flash DSC. Significant progresscan be achieved in future studies of glass transition, relaxation,and crystallization phenomena in nonmetallic inorganic glasssystems.The quantitative estimation of crystallization kinetics using a
nonisothermal DSC run, which is much faster than isothermal,is still difficult and complex. For example, great care should betaken when calculating the activation energy for crystallizationor the crystallization mechanism via the popular Kissinger/Ozawa-based equations. DSC analysis can accurately describethe nucleation/growth mechanism under isothermal conditions.In other situations, such as nonisothermal conditions, non-steady-state nucleation, time-dependent growth rates, ormultiple phase formation, DSC experiments may lead tosuperficial results that demand especially complicated inter-pretation. Therefore, it is highly advisable to consider thenumerous recommendations of the ICTAC Kinetics Commit-tee and other modifications and criteria to recalculate thevalues of Ec and n reported in many papers that apply theKissinger/Ozawa equation to crystallization processes. There isstill scope for expanding/simplifying the application of DSCmethods for more complicated conditions, since the DSC
technique is less tedious, is faster, and requires smaller samplesizes, compared to most conventional methods.The inorganic, organic, and metallic glass communities have
been extensively utilizing DSC to explore the various aspects ofglass science reported herein. However, to date, there has oftenbeen a lack of interaction among these communities to definesome adequate DSC methods for all materials types. We hopethat this comprehensive review article can promote andadvance calorimetry-driven glass research across all of thesecommunities.
AUTHOR INFORMATIONCorresponding Author
*E-mail: [email protected]
Maziar Montazerian: 0000-0002-1409-9182Ozgur Gulbiten: 0000-0001-9156-7659John C. Mauro: 0000-0002-4319-3530Yuanzheng Yue: 0000-0002-6048-5236Author Contributions○Q.Z., Y.Z., and M.M. contributed equally to the paper.Notes
The authors declare no competing financial interest.
Biographies
Qiuju Zheng is Associate Professor at the Qilu University ofTechnology. In 2012, she received her Ph.D. in Materials Chemistryfrom Aalborg University in Denmark. During her Ph.D. study, she dida summer internship in Corning Incorporated, USA, in 2010. From2012 to 2015, she was a postdoctoral fellow at Aalborg University,sponsored by Rockwool International (Denmark). Her researchfocuses on structure, properties, relaxation, and crystallization of glassand glass fibers. She has published more than 20 peer-reviewed papersand has been granted two patents. She has given over 15 internationalconference presentations, including several invited talks.
Yanfei Zhang is Associate Professor at the Qilu University ofTechnology, Jinan, China. She received her Ph.D. degree in Physics atShandong University, China, in 2009. She was a postdoctoral fellow inthe Department of Chemistry and Bioscience, Aalborg University,Denmark (2011∼2012). She joined the School of Materials Scienceand Engineering at Qilu University of Technology in 2009. Herresearch interests are in glass relaxation, glass transition, structure andproperties of oxide glasses and glass fibers, and glassy electrodematerials for lithium/sodium-ion batteries. She has published morethan 20 peer-reviewed papers.
Maziar Montazerian received his Ph.D. degree in Materials Scienceand Engineering from the Iran University of Science and Technologyin 2015. He is currently a postdoctoral fellow at CeRTEV, UFSCar,Brazil. He intends to develop novel bioactive glasses/glass-ceramicsfor biomedical applications. His research interests also includenucleation and crystallization theories, dental materials, andmechanical properties. He has published 6 review papers, 14 scientificarticles, and 3 book chapters and gave over 10 internationalconference presentations. He was a recipient of a Ph.D. scholarshipfrom The World Academy of Science (TWAS) and Iran NationalScience Foundation (INFS) and a postdoctoral fellowship from SaoPaulo Research Foundation (FAPESP).
Ozgur Gulbiten is a senior research scientist at the science andtechnology division of Corning Incorporated in Corning, New York.Ozgur joined Corning in 2014 after completing his Ph.D. in materials
Chemical Reviews Review
DOI: 10.1021/acs.chemrev.8b00510Chem. Rev. XXXX, XXX, XXX−XXX
BU

science and engineering at the University of Arizona. He is currentlyfocused on solving product-related questions about the thermophys-ical properties of glass and glass-ceramic materials. His academicresearch interests include relaxation processes, the dynamics of theglass transition, and structure and physical property relationships insupercooled liquids. Ozgur is the author of 17 peer-reviewed scientificpapers.
John C. Mauro is Professor of Materials Science and Engineering atThe Pennsylvania State University. John earned a B.S. in GlassEngineering Science (2001), B.A. in Computer Science (2001), andPh.D. in Glass Science (2006), all from Alfred University. He joinedCorning Incorporated in 1999 and served in multiple roles there,including Senior Research Manager of the Glass Research department.John is the inventor or coinventor of several new glass compositionsfor Corning, including Corning Gorilla Glass products. John joinedthe faculty at Penn State in 2017 and is currently a world-recognizedexpert in fundamental and applied glass science, statistical mechanics,computational and condensed matter physics, thermodynamics, andthe topology of disordered networks. John is the author of over 220peer-reviewed publications and is Editor of the Journal of the AmericanCeramic Society.
Edgar Dutra Zanotto is a Professor of Materials Science andEngineering and Director of the Center for Research, Technologyand Education in Vitreous Materials, both at the Federal University ofSao Carlos (UFSCar), Brazil, and an editor of the Journal of Non-Crystalline Solids. His main research interests include dynamicprocesses in inorganic glass-forming liquids (diffusion, viscous flow,relaxation, crystal nucleation and growth, crystallization and glass-forming ability) and properties of glasses and glass-ceramics. He hasbeen working for forty-two years in this field and has published over260 scientific articles, 3 books, 27 patents, and 5 book prefaces, anddelivered approximately 150 invited and plenary conference talks. Hehas supervised approximately 80 research students and postdocs. Heis a member of both Brazilian and Sao Paulo State Academy ofSciences, National Academy of Engineering, The World Academy ofSciences, and World Academy of Ceramics, and Fellow of the Societyof Glass Technology, UK, the American Ceramic Society, and theBrazilian Ceramic Society.
Yuanzheng Yue is Professor of Chemistry at Aalborg University,Denmark. He is the founder of the inorganic glass research laboratoryin Denmark and the head of Center for Amorphous Materials. He is adistinguished visiting professor at Wuhan University of Technologyand Qilu University of Technology, China. He received his Ph.D.degree at Berlin University of Technology, Germany, in 1995. Hisresearch interests are in glass science, glass fiber technology,amorphous materials for thermal insulation, energy storage andmembrane, and metal−organic framework glasses. He is the author/coauthor of over 290 papers in peer-refereed journals and has givenmore than 100 invited and plenary talks at international conferences.He has supervised about 30 Ph.D. students and 16 postdocs. He is aneditor of European Journal of Glass Science and Technology. He is thefounding chair of the Technical Committee for Glass Fibers underICG. He is an honorary member of Glass Division of ChineseCeramic Society. He is a member of the EU Academy of Sciences.
ACKNOWLEDGMENTS
Q.J.Z. wishes to acknowledge support from National NaturalScience Foundation of China (51802165) and ShandongProvincial Natural Science Foundation (ZR2017LEM007).Y.F.Z. would like to acknowledge support by National NaturalScience Foundation of China (grant no. 51402156) and
Shandong Provincial Natural Science Foundation (grant no.ZR2014EMQ003). Q.J.Z and Y.F.Z. acknowledge ShandongProvincial Key Project Funding (2018YFJH0402). M.M. andE.D.Z. are grateful to the Sao Paulo Research Foundation(FAPESP, # 2013/07793-6) - CEPID/CeRTEV - for financialsupport of this work, and the postdoctoral fellowship grantedto Maziar Montazerian (# 2015/13314-9). J.C.M. acknowl-edges support from the National Science Foundation (CMMI1762275). Y.Z.Y. acknowledges support from the DanishResearch Council (grant no. 26-03-0096 and no. 09-064216)and the Shandong Taishan Scholar Program.
SYMBOLS AND ABBREVIATIONS
A’ Amplitude of the modulated heating rateA0 Total area of crystallization peakA Area of crystallization peakAt Amplitude of the sinusoidal oscillationA(xR) Proportionality constant for the reference compo-
sition xRCF Correction factorC(|CF|) Proportionality as a function of CFCv Isochoric heat capacityCp Isobaric heat capacityCp,vib Vibrational heat capacityCpg Glass CpCpl Liquid CpΔCp Cpl − Cpg as a function of TΔCp(Tg) Cpl − Cpg at TgCp,conf Configurational heat capacity as a function of TCp,conf(Tg) Cp,conf at TgCp,exc Excess of Cp of the standard glass over its HQ stateCp,endo Difference in Cp between the annealed HQ glass
and the standard glass within the endothermicprepeak below Tg
Cp0 Cp at zero frequency
Cp∞ Cp at the high frequency limit
Cp* Complex CpCp′ Real part of Cp*Cp″ Imaginary part of Cp*|Cp(ω)| Modulus of Cp*D The Deborah numberE Activation energy for overall crystallizationEg Activation energy for equilibrium viscous flowEα Activation energy for α relaxationEβ Activation energy for β relaxationErelax Activation energy for enthalpy relaxationEc Activation energy for crystal growthF Atomic degree of freedomG∞ Shear modulus at the high limit of frequencyG(ω) Effective vibrational density of statesHc Total crystallization enthalpyΔHm Melting enthalpyΔHnr Nonreversing heat flowΔHrel Enthalpy of relaxationΔHrem Remaining excess enthalpy in HQ or ball-milled
glasses after annealingHrev Reversing heat flowΔHtot Total excess enthalpy in as-prepared HQ or ball-
milled glassesI Nucleation rateKA Avrami fitting parameterKc Shift factor for determination of cooling rate
Chemical Reviews Review
DOI: 10.1021/acs.chemrev.8b00510Chem. Rev. XXXX, XXX, XXX−XXX
BV

KΦ Proportionality between the measured and the trueheat flow rate
KQ Proportionality between the measured and the trueexchanged heat
Kw Glass stability parameter proposed by WeinbergM(ξ) Relaxation function in terms of the reduced timeN Crystal number densityN0 Number of growing crystals,N’ Number of thermocouplesNat Number of quenched-in or athermic nucleiNi(x) Molar fraction of network-forming species i for
composition xNtotal Total number of nucleiP0 Period of oscillationΔP Compensating heating powerQ Scattering vectorQexch Exchanged heatQSAXS Small-angle X-ray scattering invariantQtrue True exchanged heatR Gas constantRc Critical cooling rateRCC Critical rate for continuous cooling methodRCN Critical rate for “nose” methodRth Thermal resistance of the sensorS Sensitivity of a thermocoupleSconf Configurational entropySex Excess entropySDT Device transferS(Q) Structural factor as a function of scattering vectorT TemperatureΔT Differential temperature signalT0 Starting temperatureTa Annealing temperatureTA Collapsing temperature of zeoliteTc Peak temperature of crystallizationTd Starting temperature of the departure of Cp curve
from Cpg curveTeq Starting temperature of equilibrium liquidTf Fictive temperatureTf,c Critical fictive temperatureTf,s Characteristic temperature of the fragile-to-strong
transitionTg Glass transition temperatureTg,DSC Glass transition temperature measured by DSCTg,infl Temperature at the inflection point of the Cp drop
curve during liquid−glass transitionTg,end Ending temperature of glass−liquid transitionTg,onset Onset temperature of the glass transitionTg,ref Glass transition temperature at reference cooling
rate (0.1 K/s)Tg,vis Tg determined by viscosityTK The Kauzmann temperatureTL Liquidus temperatureTm Melting pointTN Temperature for the first isothermal treatment
(Figure 53)Tn “Nose” temperatureTonset Onset temperature of glass transitionTG Temperature for the second stage isothermal
treatment (Figure 53)TR Temperature to the reference crucibleTrgTg/Tm Reduced glass transition temperature Tg/TmTS Temperature to the sample crucible
Tsh Temperature of sub-Tg relaxation peak shoulderTx Onset temperature of crystallization peakTz Onset temperature of the energy release of a HQ
glassTω Peak temperature at the average relaxation time of
2πPT* A temperature above the glass transition regionU Crystal growth rateUmin Minimum crystal growth rateUmax Maximum crystal growth rateV Sensor signal in voltageV0 Volume of the sample before transformationVc Volume of crystalVg Volume of residual glassZ Constant in eq 73Z(ω) Approximate representation of the vibrational
density of statesg Shape factork Proportionality constant in eq 56k(T) Rate constant at Tf(t,T) Kinetic part of the heat flow related to part of
nonreversingm Liquid fragility index of glass-forming liquidsm0 Liquid fragility index of a perfectly strong glass-
forming liquidmDSC Liquid fragility index determined by DSCmvis Liquid fragility index determined by viscositymS Sample massn(T, x) Average number of constraints per atom at T and xn Avrami coefficientΔn Optical birefringence of annealed fibersΔnmax Optical birefringence of not-annealed fibersp Isostatic pressureq DSC scan rateqc,s Standard downscan rate, typically 10 K/minqh Heating rate or DSC upscan rateqc Cooling rate or DSC downscan rateqα Rigidity of α-constraintqr Molar ratio: B2O3/(B2O3 + SiO2)qref Reference cooling rate (0.1 K/s)r Eα/Eβ
⟨r⟩ Mean coordination numberrunit Structural unit sizet Timeta Annealing timetext External timetG first stage isothermal treatment timetind Induction time for nucleationtint Internal timetN first stage isothermal treatment timetn Nose time on the TTT curvetobs External observation timeν Poisson’s ratioν0 Pre-exponential term in eq 70wi,α Number of α-type constraints associated with
species ix Composition variablexR Reference compositionxzeo Volume fraction of zeoliteα type Constraint typeα Volume fraction of crystalsα(t) Volume fraction of crystals as a function of t
Chemical Reviews Review
DOI: 10.1021/acs.chemrev.8b00510Chem. Rev. XXXX, XXX, XXX−XXX
BW

a′(t) Transformed volume of residual glass as a functionof t
αExpan Linear thermal expansion coefficientαD Debye parameter in eqs 43 and 44αs Seebeck coefficientβ Stretching exponentβc Fitting parameter of composite relaxation funac-
tion (CRF)γ R1/R2 for ellipsoids of revolution or spheroids,
where R1 is the radius of their central circular planeperpendicular to the axis of revolution and R2 istheir radius parallel to the same axis
γD Debye parameter in eqs 43 and 44τ Relaxation timeτα α relaxation timeτβ β relaxation timeτext External time scaleτint Internal time scaleτJG Characteristic JG relaxation timeτsystem Internal relaxation time of a glass-forming systemξ Reduced relaxation timeϕ The phase angle between the input and output
functionsω Angular frequency of the sinusoidal oscillationωc Fitting parameter in eq 77Φ DSC output, i.e., heat flowΦ0 Background line of DSC output curveΦa Amplitude of modulated heat flowΦu Total underlying heat flowΦbl Baseline heat flow signalΦm Modulated heat flow rateΦR Heat flow to the reference crucibleΦS Heat flow to the sample crucibleΦtrue True heat flow rateΔΦ Difference between Φ and Φ0η Viscosityη∞ Viscosity at high temperature limitΩ Side length to the height of right square prismsAFM Atomic Force MicroscopyAG Adam−GibbsAGS Adam−Gibbs−SchererASTM American Society for Testing and MaterialsBMGs Bulk metallic glassesBP Boson peakCCT Continuous cooling transformationCRF Composite relaxation functionCRRs Cooperatively rearranging regionsDMA Dynamic-mechanical analysisDMS Dynamical mechanical spectroscopyDSC Differential scanning calorimetryEXAFS X-ray absorption fine structureFEM Finite element simulationF-S Fragile-to-strongFSC Fast scanning calorimeterfwhm Full width at half-maximumGCs Glass-ceramicsGFA Glass-forming abilityGIC Glass ionomer cementGS Glass stabilityHAD Hyperquenching-annealing-DSCHC Hyperquenching-calorimetryHDA High-density amorphousHDL High-density liquid
HDPE High-density polyethyleneHN Havriliak−NegamiHQ HyperquenchedHQG Hyperquenched glassICTAC International Confederation for Thermal Analysis
and CalorimetryIRO Intermedium range orderJG Johari−GoldsteinJMAYK Johnson−Mehl−Avrami−Yerofeeyev−Kolmogor-
ovKWW Kohlrausch−Williams−WattsLDA Low-density amorphousLDL Low-density liquidHDPE High-density polyethyleneLRO Long-range orderLS2 Lithium disilicate glassMG Metallic glassMAP Mauro−Allan−PotuzakMD Molecular dynamicsMEMS Micro-Electro-Mechanical SystemsMGFLs Metallic glass-forming liquidsMGs Metallic glassesMOF Metal−organic FrameworksMQ Melt-quenchedMYEGA Mauro−Yue−Ellison−Gupta−AllanNMR Nuclear magnetic resonanceOM Optical microscopyPEL Potential energy landscapePETg Poly(ethylene terephthalate)-glycolPDLA Poly(D-lactic acid)PDLLA Poly(DL-lactide)PLLA Poly(L-lactide)PTR Photothermo-refractiveRS Raman spectroscopyRS-DSC Repetitive scanning DSCRT Room temperatureSANS Small-angle neutron scatteringSAXS Small angle X-ray scatteringSCL Supercooled liquidSEE Stokes−Einstein equationSEM Scanning electron microscopySRO Short-range orderSTG Standard glassTEM Transmission electron microscopyTMDSC Temperature-modulated DSCTNB 1,3-bis-(1-naphthyl)-5-(2-naphthyl)benzeneTNM Tool−Narayanaswamy−MoynihanTTT Temperature−time transformationVDOS Vibrational density of statesWLF Williams−Landel−FerryXAS X-ray absorption spectroscopyXPS X-ray photoelectron spectroscopiesXRD X-ray diffractionZIFs Zeolitic imidazolate frameworks
REFERENCES(1) Angell, C. A. Formation of Glasses from Liquids andBiopolymers. Science 1995, 267, 1924−1935.(2) Greaves, G. N.; Sen, S. Inorganic Glasses, Glass-forming Liquidsand Amorphizing Solids. Adv. Phys. 2007, 56, 1−166.(3) Debenedetti, P. G.; Stillinger, F. H. Supercooled Liquids and theGlass Transition. Nature 2001, 410, 259−267.
Chemical Reviews Review
DOI: 10.1021/acs.chemrev.8b00510Chem. Rev. XXXX, XXX, XXX−XXX
BX

(4) Bennett, T. D.; Tan, J. C.; Yue, Y. Z.; Baxter, E.; Ducati, C.;Terrill, N. J.; Yeung, H. H. M.; Zhou, Z.; Chen, W.; Henke, S.; et al.Hybrid Glasses from Strong and Fragile Metal-Organic FrameworkLiquids. Nat. Commun. 2015, 6, 8079.(5) Richet, P.; Bottinga, Y. Thermochemical Properties of SilicateGlasses and Liquids: A Review. Rev. Geophys. 1986, 24, 1−25.(6) Moynihan, C. T. Structural Relaxation and the Glass Transition.Rev. Mineral. 1995, 32, 1−19.(7) Malek, J. Kinetic Analysis of Crystallization Processes inAmorphous Materials. Thermochim. Acta 2000, 355, 239−253.(8) Sestak, J., Simon, P., Eds. Thermal Analysis of Micro, Nano- andNon-Crystalline Materials: Transformation, Crystallization, Kinetics andThermodynamics; Springer: Netherlands, 2013.(9) Orava, J.; Greer, A. L. Handbook of Thermal Analysis andCalorimetry; Elsevier: Netherlands, 2018.(10) Zheng, Q. J.; Potuzak, M.; Mauro, J. C.; Smedskjaer, M. M.;Youngman, R. E.; Yue, Y. Z. Composition-Structure-PropertyRelationships in Boroaluminosilicate Glasses. J. Non-Cryst. Solids2012, 358, 993−1002.(11) Liu, H.; Smedskjaer, M. M.; Tao, H. Z.; Jensen, L. R.; Zhao, X.J.; Yue, Y. Z. A Medium Range Order Structural Connection to theConfigurational Heat Capacity of Borate-silicate Mixed Glasses. Phys.Chem. Chem. Phys. 2016, 18, 10887−10895.(12) Wales, D. J. Energy Landscapes: With Applications to Clusters,Biomolecules and Glasses; Cambridge Molecular Science; CambridgeUniversity Press: Cambridge, U.K., 2002.(13) Swallen, S. F.; Kearns, K. L.; Mapes, M. K.; Kim, Y. S.;McMahon, R. J.; Ediger, M. D.; Wu, T.; Yu, L.; Satija, S. OrganicGlasses with Exceptional Thermodynamic and Kinetic Stability.Science 2007, 315, 353−356.(14) Yue, Y. Z.; Angell, C. A. Clarifying the Glass-transitionBehaviour of Water by Comparison with Hyperquenched InorganicGlasses. Nature 2004, 427, 717−720.(15) Angell, C. A.; Yue, Y. Z.; Wang, L. M.; Copley, J. R. D.; Borick,S.; Moss, S. Potential Energy, Relaxation, Vibrational Dynamics andthe Boson Peak of Hyperquenched Glasses. J. Phys.: Condens. Matter2003, 15, S1051−S1068.(16) Greaves, G. N.; Meneau, F.; Majerus, O.; Jones, D. G.; Taylor,J. Identifying Vibrations that Destabilize Crystals and Characterize theGlassy State. Science 2005, 308, 1299−1302.(17) Monaco, A.; Chumakov, A. I.; Yue, Y. Z.; Monaco, G.; Comez,L.; Fioretto, D.; Crichton, W. A.; Ruffer, R. Density of VibrationalStates of a Hyperquenched Glass. Phys. Rev. Lett. 2006, 96, 205502.(18) Johari, G. P.; Goldstein, M. Viscous Liquids and the GlassTransition II. Secondary Relaxations in Glasses of Rigid Molecules. J.Chem. Phys. 1970, 53, 2372−2388.(19) Johari, G. P.; Goldstein, M. Viscous Liquids and the GlassTransition III. Secondary Relaxations in Aliphatic Alcohols and OtherNonrigid Molecules. J. Chem. Phys. 1971, 55, 4245−4252.(20) Zhang, C. Z.; Hu, L. N.; Yue, Y. Z.; Mauro, J. C. Fragile-to-Strong Transition in Metallic Glass-Forming Liquids. J. Chem. Phys.2010, 133, 014508.(21) Mauro, J. C.; Zanotto, E. D. Two Centuries of Glass Research:Historical Trends, Current Status, and Grand Challenges for theFuture. Int. J. Appl. Glass Sci. 2014, 5, 313−327.(22) Montazerian, M.; Singh, S. P.; Zanotto, E. D. An Analysis ofGlass-Ceramic Research and Commercialization. Am. Ceram. Soc. Bull.2015, 94, 30−35.(23) Davis, M. J.; Zanotto, E. D. Glass-Ceramics and Realization ofthe Unobtainable: Property Combinations that Push the Envelope.MRS Bull. 2017, 42, 195−199.(24) Hill, J. O. For Better Thermal Analysis and Calorimetry, 3rd ed.;International Confederation for Thermal Analysis and Calorimetry,1991.(25) Pignatello, R. Drug-Biomembrane Interaction Studies; WoodheadPublishing Limited: Cambridge, 2013.(26) Hohne, G. W. H.; Hemminger, W. F.; Flammersheim, H. J.Differential Scanning Calorimetry, 2nd ed.; Springer: Berlin, 2003.
(27) Mackenzie, R. C. A. History of Thermal Analysis. Thermochim.Acta 1984, 73, 251−306.(28) Spink, C. H. Differential Scanning Calorimetry. Methods CellBiol. 2008, 84, 115−41.(29) Haines, P. J. Principles of Thermal Analysis and Calorimetry;Royal Society of Chemistry: Cambridge, 2002.(30) Boersma, S. L. Theory of DTA and New Methods ofMeasurement and Interpretation. J. Am. Ceram. Soc. 1955, 38, 281−284.(31) Mathot, V. B. F.; Benoist, L. Calorimetry and Thermal Analysisof Polymers; Hanser/Gardner Publications: Munich, 1994.(32) ASTM E 968-99: Standard Practice for Heat Flow Calibration ofDifferential Scanning Calorimeters, 1999.(33) ASTM E 793-01: Standard Test Method for Enthalpies of Fusionand Crystallization by Differential Scanning Calorimeters, 2001.(34) Tanaka, S. Theory of Power-compensated DSC. Thermochim.Acta 1992, 210, 67−76.(35) Watson, E. S.; O’Neill, M. J.; Justin, J.; Brenner, N. A DSC forQuantitative Differential Thermal Analysis. Anal. Chem. 1964, 36,1233−1238.(36) Hohne, G. W. H.; Gloggler, E. Some Peculiarities of the DSC-2/-7 (Perkin-Elmer) and Their Influence on Accuracy and Precisionof the Measurements. Thermochim. Acta 1989, 151, 295−304.(37) Pijpers, M. F. J.; Mathot, V. B. F.; Goderis, B.; Scherrenberg, R.L.; van der Vegte, E. W. High-Speed Calorimetry for the Study of theKinetics of (De)vitrification, Crystallization, and Melting of Macro-molecules. Macromolecules 2002, 35, 3601−3613.(38) Efremov, M. Y.; Warren, J. T.; Olson, E. A.; Zhang, M.; Kwan,A. T.; Allen, L. H. Thin-Film Differential Scanning Calorimetry: ANew Probe for Assignment of the Glass Transition of UltrathinPolymer Films. Macromolecules 2002, 35, 1481−1483.(39) Minakov, A. A.; Adamovsky, S. A.; Schick, C. Non-adiabaticThin-film (chip) Nanocalorimetry. Thermochim. Acta 2005, 432,177−185.(40) Mileva, D.; Androsch, R.; Zhuravlev, E.; Schick, C. Critical Rateof Cooling for Suppression of Crystallization in Random Copolymersof Propylene with Ethylene and 1-butene. Thermochim. Acta 2009,492, 67−72.(41) Tol, R. T.; Minakov, A. A.; Adamovsky, S. A.; Mathot, V. B. F.;Schick, C. Metastability of Polymer Crystallites Formed at LowTemperature Studied by Ultra Fast Calorimetry: Polyamide 6Confined in Sub-micrometer Droplets vs. Bulk PA6. Polymer 2006,47, 2172−2178.(42) Schick, C. Differential Scanning Calorimetry (DSC) ofSemicrystalline Polymers. Anal. Bioanal. Chem. 2009, 395, 1589−1611.(43) Mathot, V.; Pyda, M.; Pijpers, T.; Vanden Poel, G.; van deKerkhof, E.; van Herwaarden, S.; van Herwaarden, F.; Leenaers, A.The Flash DSC 1, A Power Compensation Twin-type, Chip-basedFast Scanning Calorimeter (FSC): First Findings on Polymers.Thermochim. Acta 2011, 522, 36−45.(44) van Herwaarden, S.; Iervolino, E.; van Herwaarden, F.; Wijffels,T.; Leenaers, A.; Mathot, V. Design, Performance and Analysis ofThermal Lag of the UFS1 Twin-calorimeter Chip for Fast ScanningCalorimetry Using the Mettler-Toledo Flash DSC 1. Thermochim.Acta 2011, 522, 46−52.(45) Iervolino, E.; van Herwaarden, A. W.; van Herwaarden, F. G.;van de Kerkhof, E.; van Grinsven, P. P. W.; Leenaers, A. C. H. I.;Mathot, V. B. F.; Sarro, P. M. Temperature Calibration and ElectricalCharacterization of the Differential Scanning Calorimeter Chip UFS1for the Mettler-Toledo Flash DSC 1. Thermochim. Acta 2011, 522,53−59.(46) Greaves, G. N.; Fontaine, A.; Lagarde, P.; Raoux, D.; Gurman,S. J. Local Structure of Silicate Glasses. Nature 1981, 293, 611−616.(47) Poel, G. V.; Mathot, V. B. F. High Performance DifferentialScanning Calorimetry (HPer DSC): A Powerful Analytical Tool forthe Study of the Metastability of Polymers. Thermochim. Acta 2007,461, 107−121.
Chemical Reviews Review
DOI: 10.1021/acs.chemrev.8b00510Chem. Rev. XXXX, XXX, XXX−XXX
BY

(48) van Herwaarden, A. W. Overview of Calorimeter Chips forVarious Applications. Thermochim. Acta 2005, 432, 192−201.(49) Vanden Poel, G.; Mathot, V. B. F. High-speed/highPerformance Differential Scanning Calorimetry (HPer DSC):Temperature Calibration in the Heating and Cooling Mode andMinimization of Thermal Lag. Thermochim. Acta 2006, 446, 41−54.(50) Neuenfeld, S.; Schick, C. Verifying the Symmetry of DifferentialScanning Calorimeters Concerning Heating and Cooling UsingLiquid Crystal Secondary Temperature Standard. Thermochim. Acta2006, 446, 55−65.(51) Zhuravlev, E.; Schick, C. Fast Scanning Power CompensatedDifferential Scanning Nano-calorimeter: 1. The Device. Thermochim.Acta 2010, 505, 1−13.(52) van de Kerkhof, E.; van Grinsven, P. P. W. U.S. Patent14,466,068, 2009.(53) DIN Specification 91127: Recommendation for TemperatureCalibration of Fast Scanning Calorimeters (FSCs) for Sample Mass andScan Rate, 2011.(54) Gill, P. S.; Sauerbrunn, S. R.; Reading, M. ModulatedDifferential Scanning Calorimetry. J. Therm. Anal. 1993, 40, 931−939.(55) Gulbiten, O. An Investigation of Dynamic Processes in SeleniumBased Chalcogenide Glasses. Ph.D. Thesis, University of Arizona:Tucson, 2014.(56) Gobrecht, H.; Hamann, K.; Willers, G. Complex Plane Analysisof Heat Capacity of Polymers in Glass Transition Region. J. Phys. E:Sci. Instrum. 1971, 4, 21−23.(57) Birge, N. O.; Nagel, S. R. Specific-Heat Spectroscopy of theGlass-Transition. Phys. Rev. Lett. 1985, 54, 2674−2677.(58) Palmer, R. G. Broken Ergodicity. Adv. Phys. 1982, 31, 669−735.(59) Mauro, J. C.; Loucks, R. J.; Sen, S. Heat Capacity, EnthalpyFluctuations, and Configurational Entropy in Broken ErgodicSystems. J. Chem. Phys. 2010, 133 (16), 164503.(60) Reiner, M. The Deborah Number. Phys. Today 1964, 17, 62−62.(61) Reading, M.; Luget, A.; Wilson, R. Modulated DifferentialScanning Calorimetry. Thermochim. Acta 1994, 238, 295−307.(62) Gulbiten, O.; Mauro, J. C.; Lucas, P. Relaxation of EnthalpyFluctuations during Sub-Tg Annealing of Glassy Selenium. J. Chem.Phys. 2013, 138, 244504.(63) Yang, G.; Gulbiten, O.; Gueguen, Y.; Bureau, B.; Sangleboeuf, J.C.; Roiland, C.; King, E. A.; Lucas, P. Fragile-strong Behavior in theAsxSe1‑x Glass Forming System in Relation to Structural Ddimension-ality. Phys. Rev. B: Condens. Matter Mater. Phys. 2012, 85, 144107.(64) Schawe, J. E. K.; Hutter, T.; Heitz, C.; Alig, I.; Lellinger, D.Stochastic Temperature Modulation: A New Technique in Temper-ature-modulated DSC. Thermochim. Acta 2006, 446, 147−155.(65) Zanotto, E. D.; Mauro, J. C. The Glassy State of Matter: ItsDefinition and Ultimate Fate. J. Non-Cryst. Solids 2017, 471, 490−495.(66) Shelby, J. E. Introduction to Glass Science and Technology; TheRoyal Society of Chemistry: Cambridge, 2005.(67) Varshneya, A. K.; Mauro, J. C. Fundamentals of InorganicGlasses, 3rd ed.; Elsevier: Amsterdam, Netherlands, 2019.(68) Varshneya, A. K.; Mauro, J. C. Comment on MisconceivedASTM Definition of “Glass” by A. C. Wright. Glass Technol.: Eur. J.Glass Sci. Technol. A 2010, 51, 28−30.(69) Anderson, P. W. Through the Glass Lightly. Science 1995, 267,1615−1616.(70) Moynihan, C. T.; Macedo, P. B.; Montrose, C. J.; Gupta, P. K.;DeBolt, M. A.; Dill, J. F.; Dom, B. E.; Drake, P. W.; Easteal, A. J.;Elterman, P. B.; et al. Stuctural Relaxation in Vitreous Materials. Ann.N. Y. Acad. Sci. 1976, 279, 15−35.(71) Mauro, J. C.; Gupta, P. K.; Loucks, R. J. Continuously BrokenErgodicity. J. Chem. Phys. 2007, 126, 184511.(72) Bantilan, F. T., Jr.; Palmer, R. G. Magnetic Properties of aModel Spin Glass and the Failure of Linear Response Theory. J. Phys.F: Met. Phys. 1981, 11, 261.(73) Monthus, C.; Bouchaud, J.-P. Models of Traps and GlassPhenomenology. J. Phys. A: Math. Gen. 1996, 29, 3847−3869.
(74) Bel, G.; Barkai, E. Weak Ergodicity Breaking in the Continuous-Time Random Walk. Phys. Rev. Lett. 2005, 94, 240602.(75) Mauro, J. C.; Loucks, R. J.; Varshneya, A. K.; Gupta, P. K.Enthalpy Landscapes and the Glass Transition. Sci. Model. Simul.2008, 15, 241−281.(76) Alba, C.; Busse, L. E.; Angell, C. A. Thermodynamic Aspects ofthe Vitrification of Toluene, and Xylene Isomers, and the Fragility ofLiquid Hydrocarbons. J. Chem. Phys. 1990, 92, 617−624.(77) Angell, C. A. Relaxation in Liquids, Polymers and PlasticCrystals - Strong/fragile Patterns and Problems. J. Non-Cryst. Solids1991, 131−133, 13−31.(78) Bohmer, R.; Ngai, K. L.; Angell, C. A.; Plazek, D. J.Nonexponential Relaxations in Strong and Fragile Glass Formers. J.Chem. Phys. 1993, 99, 4201−4209.(79) Stickel, F.; Fischer, E. W.; Richert, R. Dynamics of Glass-forming Liquids. I. Temperature-Derivative Analysis of DielectricRelaxation Data. J. Chem. Phys. 1995, 102, 6251−6257.(80) Stickel, F.; Fischer, E. W.; Richert, R. Dynamics of Glass-forming Liquids. II. Detailed Comparison of Dielectric Relaxation,Dc-conductivity, and Viscosity Data. J. Chem. Phys. 1996, 104, 2043−2055.(81) Yue, Y. Z. Characteristic Temperatures of Enthalpy Relaxationin Glass. J. Non-Cryst. Solids 2008, 354, 1112−1118.(82) Moynihan, C. T.; Easteal, A. J.; DeBolt, M. A.; Tucker, J.Dependence of the Fictive Temperature of Glass on Cooling Rate. J.Am. Ceram. Soc. 1976, 59, 12−16.(83) Angell, C. A. Liquid Fragility and the Glass Transition in Waterand Aqueous Solutions. Chem. Rev. 2002, 102, 2627−2650.(84) Hallbrucker, A.; Mayer, E.; Johari, G. P. Glass-liquid Transitionand the Enthalpy of Devitrification of Annealed Vapor-depositedAmorphous Solid Water. A Comparison with Hyperquenched GlassyWater. J. Phys. Chem. 1989, 93, 4986−4990.(85) Angell, C. A. Water II is A ″Strong″ Liquid. J. Phys. Chem.1993, 97, 6339−6341.(86) Chen, H. S.; Coleman, E. Structural Relaxation in MetallicGlasses. Appl. Phys. Lett. 1976, 28, 245−247.(87) Barrat, J. L.; Badro, J.; Gillet, P. A. Strong to Fragile Transitionin a Model of Liquid Silica. Mol. Simul. 1997, 20, 17−25.(88) Hemmati, M.; Moynihan, C. T.; Angell, C. A. Interpretation ofthe Molten BeF2 Viscosity Anomaly in terms of a High TemperatureDensity Maximum, and Other Waterlike Features. J. Chem. Phys.2001, 115, 6663−6671.(89) Way, C.; Wadhwa, P.; Busch, R. The Influence of Shear Rateand Temperature on the Viscosity and Fragility of theZr41.2Ti13.8Cu12.5Ni10.0Be22.5 Metallic-Glass-Forming Liquid. ActaMater. 2007, 55, 2977−2983.(90) Maxwell, J. C. On the Dynamical Theory of Gases. Phil. Trans.Roy. Soc. Lon. 1867, 157, 49−88.(91) Zheng, Q. J.; Mauro, J. C.; Yue, Y. Z. Reconciling Calorimetricand Kinetic Fragilities of Glass-forming Liquids. J. Non-Cryst. Solids2017, 456, 95−100.(92) Adam, G.; Gibbs, J. H. On the Temperature Dependence ofCooperative Relaxation Properties in Glass-forming Liquids. J. Chem.Phys. 1965, 43, 139−146.(93) Goldstein, M. Some Thermodynamic Aspects of the GlassTransition: Free Volume, Entropy, and Enthalpy Theories. J. Chem.Phys. 1963, 39, 3369−3374.(94) Stillinger, F. H.; Weber, T. A. Hidden Structure in Liquids.Phys. Rev. A: At., Mol., Opt. Phys. 1982, 25, 978−989.(95) Gotze, W. The Essentials of the Mode-coupling Theory forGlassy Dynamics. Condens. Matter Phys. 1998, 1, 873−904.(96) Tarjus, G.; Kivelson, S. A.; Nussinov, Z.; Viot, P. TheFrustration-based Approach of Supercooled Liquids and the GlassTransition: A Review and Critical Assessment. J. Phys.: Condens.Matter 2005, 17, R1143.(97) Dyre, J. C.; Olsen, N. B.; Christensen, T. Local ElasticExpansion Model for Viscous-flow Activation Energies of Glass-forming Molecular Liquids. Phys. Rev. B: Condens. Matter Mater. Phys.1996, 53, 2171−2174.
Chemical Reviews Review
DOI: 10.1021/acs.chemrev.8b00510Chem. Rev. XXXX, XXX, XXX−XXX
BZ

(98) Jaccani, S. P.; Gulbiten, O.; Allan, D. C.; Mauro, J. C.; Huang,L. P. Modified Elastic Model for Viscosity in Glass-forming Systems.Phys. Rev. B: Condens. Matter Mater. Phys. 2017, 96, 224201.(99) Mauro, J. C.; Yue, Y. Z.; Ellison, A. J.; Gupta, P. K.; Allan, D. C.Viscosity of Glass-forming Liquids. Proc. Natl. Acad. Sci. U. S. A. 2009,106, 19780−19784.(100) Guo, X. J.; Potuzak, M.; Mauro, J. C.; Allan, D. C.; Kiczenski,T. J.; Yue, Y. Z. Unified Approach for Determining the EnthalpicFictive Temperature of Glasses with Arbitrary Thermal History. J.Non-Cryst. Solids 2011, 357, 3230−3236.(101) Ito, K.; Moynihan, C. T.; Angell, C. A. ThermodynamicDetermination of Fragility in Liquids and a Fragile-to-strong LiquidTransition in Water. Nature 1999, 398, 492−295.(102) Hodge, I. M. Enthalpy Recovery in Amorphous Materials. J.Non-Cryst. Solids 1994, 169, 211−266.(103) Hodge, I. M.; Berens, A. R. Effects of Annealing and PriorHistory on Enthalpy Relaxation in Glassy Polymers. 2. MathematicalModelling. Macromolecules 1982, 15, 762−770.(104) Boehm, L.; Ingram, M. D.; Angell, C. A. Test of a Year-annealed Glass for the Cohen-grest Percolation Transition. J. Non-Cryst. Solids 1981, 44, 305−313.(105) Yue, Y. Z. The Iso-structural Viscosity, ConfigurationalEntropy and Fragility of Oxide Liquids. J. Non-Cryst. Solids 2009, 355,737−744.(106) Martinez, L. M.; Angell, C. A. A Thermodynamic Connectionto the Fragility of Glass-forming Liquids. Nature 2001, 410, 663−667.(107) Mauro, N. A.; Blodgett, M.; Johnson, M. L.; Vogt, A. J.;Kelton, K. F. A Structural Signature of Liquid Fragility. Nat. Commun.2014, 5, 4616.(108) Smedskjaer, M. M.; Mauro, J. C.; Youngman, R. E.; Hogue, C.L.; Potuzak, M.; Yue, Y. Z. Topological Principles of BorosilicateGlass Chemistry. J. Phys. Chem. B 2011, 115, 12930−12946.(109) Mauro, J. C.; Loucks, R. J.; Gupta, P. K. Metabasin Approachfor Computing the Master Equation Dynamics of Systems withBroken Ergodicity. J. Phys. Chem. A 2007, 111, 7957−7965.(110) Gupta, P. K.; Mauro, J. C. The Laboratory Glass Transition. J.Chem. Phys. 2007, 126, 224504.(111) Hubert, M.; Faber, A. J. On the Structural Role of Boron inBorosilicate Glasses. Phys. Chem. Glasses: Eur. J. Glass Sci. Technol.,Part B 2014, 55, 136−158.(112) Johari, G. P. Examining the Entropy Theory’s Application toViscosity Data and the Inference for a Thermodynamic Transition inan Equilibrium Liquid. J. Non-Cryst. Solids 2001, 288, 148−158.(113) Johari, G. P. Decrease in the Configurational and VibrationalEntropies on Supercooling a Liquid and Their Relations with theExcess Entropy. J. Non-Cryst. Solids 2002, 307−310, 387−392.(114) Bruning, R.; Levelut, C.; Faivre, A.; Leparc, R.; Simon, J.; Bley,F.; Hazemann, J. Characterization of the Glass Transition in VitreousSilica by Temperature Scanning Small-angle X-ray Scattering.Europhys. Lett. 2005, 70, 211−217.(115) Sen, S. Temperature Induced Structural Changes andTransport Mechanisms in Borate, Borosilicate and BoroaluminateLiquids: High-resolution and High-temperature NMR Results. J. Non-Cryst. Solids 1999, 253, 84−94.(116) Majerus, O.; Cormier, L.; Calas, G.; Beuneu, B. Temperature-induced Boron Coordination Change in Alkali Borate Glasses andMelts. Phys. Rev. B: Condens. Matter Mater. Phys. 2003, 67, 024210.(117) Stebbins, J. F.; Ellsworth, S. E. Temperature Effects onStructure and Dynamics in Borate and Borosilicate Liquids: High-resolution and High-temperature NMR Results. J. Am. Ceram. Soc.1996, 79, 2247−2256.(118) Angeli, F.; Villain, O.; Schuller, S.; Charpentier, T.; De Ligny,D.; Bressel, L.; Wondraczek, L. Effect of Temperature and ThermalHistory on Borosilicate Glass Structure. Phys. Rev. B: Condens. MatterMater. Phys. 2012, 85, 054110.(119) Wu, J.; Stebbins, J. F. Quench Rate and Temperature Effectson Boron Coordination in Aluminoborosilicate Melts. J. Non-Cryst.Solids 2010, 356, 2097−2108.
(120) Smedskjaer, M. M.; Mauro, J. C.; Sen, S.; Yue, Y. Z.Quantitative Design of Glassy Materials Using Temperature-depend-ent Constraint Theory. Chem. Mater. 2010, 22, 5358−5365.(121) Zheng, Q. J.; Mauro, J. C.; Smedskjaer, M. M.; Youngman, R.E.; Potuzak, M.; Yue, Y. Z. Glass-Forming Ability of Soda Lime BorateLiquids. J. Non-Cryst. Solids 2012, 358, 658−665.(122) Kjeldsen, J.; Smedskjaer, M. M.; Youngmann, R.; Mauro, J. C.;Yue, Y. Z. Mixed Alkaline Earth Effect in Sodium AluminosilicateGlasses. J. Non-Cryst. Solids 2013, 369C, 61−68.(123) Kjeldsen, J.; Rodrigues, A. C. M.; Mossin, S.; Yue, Y. Z.Critical V2O5/TeO2 Ratio Inducing Abrupt Property Changes inVanadium Tellurite Glasses. J. Phys. Chem. B 2014, 118, 14942−14948.(124) Paraschiv, G. L.; Munoz, F.; Jensen, L. R.; Yue, Y. Z.;Smedskjaer, M. M. Impact of Nitridation of Metaphosphate Glasseson Liquid Fragility. J. Non-Cryst. Solids 2016, 441, 22−28.(125) Bechgaard, T. K.; Mauro, J. C.; Bauchy, M.; Yue, Y. Z.;Lamberson, L. A.; Jensen, L. R.; Smedskjaer, M. M. Fragility andConfigurational Heat Capacity of Calcium Aluminosilicate Glass-forming Liquids. J. Non-Cryst. Solids 2017, 461, 24−34.(126) Kushima, A.; Lin, X.; Li, J.; Qian, X. F.; Eapen, J.; Mauro, J.C.; Diep, P.; Yip, S. Computing the Viscosity of Supercooled Liquids.II. Silica and Strong-fragile Crossover Behavior. J. Chem. Phys. 2009,131, 164505.(127) Li, J.; Kushima, A.; Eapen, J.; Lin, X.; Qian, X.; Mauro, J. C.;Diep, P.; Yip, S. Computing the Viscosity of Supercooled Liquids:Markov Network Model. PLoS One 2011, 6, 17909.(128) Gupta, P. K.; Mauro, J. C. Composition Dependence of GlassTransition Temperature and Fragility. I. A Topological ModelIncorporating Temperature-dependent Constraints. J. Chem. Phys.2009, 130, 094503.(129) Mauro, J. C.; Gupta, P. K.; Loucks, R. J. CompositionDependence of Glass Transition Temperature and Fragility. II. ATopological Model of Alkali Borate Liquids. J. Chem. Phys. 2009, 130,234503.(130) Mauro, J. C. Topological Constraint Theory of Glass. Am.Ceram. Soc. Bull. 2011, 90, 31−37.(131) Bauchy, M.; Micoulaut, M. Atomic Scale Foundation ofTemperature-dependent Bonding Constraints in Network Glasses andLiquids. J. Non-Cryst. Solids 2011, 357, 2530−2537.(132) Phillips, J. C. Topology of Covalent Non-Crystalline Solids I:Short-Range Order in Chalcogenide Alloys. J. Non-Cryst. Solids 1979,34, 153−181.(133) Phillips, J. C.; Thorpe, M. F. Constraint Theory, VectorPercolation and Glass Formation. Solid State Commun. 1985, 53,699−702.(134) Naumis, G. G. Glass Transition Phenomenology andFlexibility: An Approach using the Energy Landscape Formalism. J.Non-Cryst. Solids 2006, 352, 4865−4870.(135) Hermansen, C.; Rodrigues, B. P.; Wondraczek, L.; Yue, Y. Z.An Extended Topological Model for Binary Phosphate Glasses. J.Chem. Phys. 2014, 141, 244502.(136) Hermansen, C.; Youngman, R. E.; Wang, J.; Yue, Y. Z.Structural and Topological Aspects of Borophosphate Glasses andTheir Relation to Physical Properties. J. Chem. Phys. 2015, 142,184503.(137) Ellison, A.; Cornejo, I. A. Glass Substrates for Liquid CrystalDisplays. Int. J. Appl. Glass Sci. 2010, 1, 87−103.(138) Jantzen, C. M.; Brown, K. G.; Pickett, J. B. Durable Glass forThousands of Years. Int. J. Appl. Glass Sci. 2010, 1, 38−62.(139) Zielniok, D.; Cramer, C.; Eckert, H. Structure/PropertyCorrelations in Ion-Conducting Mixed-Network Former Glasses:Solid-State NMR Studies of the System Na2O−B2O3−P2O5. Chem.Mater. 2007, 19, 3162−3170.(140) Sen, S.; Youngman, R. E. High-Resolution Multinuclear NMRStructural Study of Binary Aluminosilicate and Other Related Glasses.J. Phys. Chem. B 2004, 108, 7557−7564.(141) Martin, S. W. Ionic Conduction in Phosphate Glasses. J. Am.Ceram. Soc. 1991, 74, 1767−1784.
Chemical Reviews Review
DOI: 10.1021/acs.chemrev.8b00510Chem. Rev. XXXX, XXX, XXX−XXX
CA

(142) Schuch, M.; Muller, C. R.; Maass, P.; Martin, S. W. MixedBarrier Model for the Mixed Glass Former Effect in Ion ConductingGlasses. Phys. Rev. Lett. 2009, 102, 145902.(143) Zheng, Q. J.; Youngman, R. E.; Hogue, C. L.; Mauro, J. C.;Potuzak, M.; Smedskjaer, M. M.; Yue, Y. Z. Structure ofBoroaluminosilicate Glasses: Impact of [Al2O3]/[SiO2] Ratio on theStructural Role of Sodium. Phys. Rev. B: Condens. Matter Mater. Phys.2012, 86, 054203.(144) Hermansen, C.; Mauro, J. C.; Yue, Y. Z. A Model forPhosphate Glass Topology Considering the Modifying Ion Sub-network. J. Chem. Phys. 2014, 140, 154501.(145) Rodrigues, B. P.; Wondraczek, L. Cationic Constraint Effectsin Metaphosphate Glasses. J. Chem. Phys. 2014, 140, 214501.(146) Mauro, J. C.; Ellison, A. J.; Allan, D. C.; Smedskjaer, M. M.Topological Model for the Viscosity of Multicomponent Glass-Forming Liquids. Int. J. Appl. Glass Sci. 2013, 4, 408−413.(147) Mauro, J. C.; Tandia, A.; Vargheese, K. D.; Mauro, Y.;Smedskjaer, M. M. Accelerating the Design of Functional Glassesthrough Modeling. Chem. Mater. 2016, 28, 4267−4277.(148) Micoulaut, M.; Yue, Y. Z. Material Functionalities fromMolecular Rigidity: Maxwell’s Modern Legacy. MRS Bull. 2017, 42,18−22.(149) Smedskjaer, M. M.; Hermansen, C.; Youngman, R. E.Topological Engineering of Glasses Using Temperature-dependentConstraints. MRS Bull. 2017, 42, 29−33.(150) Mishima, O.; Calvert, L. D.; Whalley, E. An Apparently First-order Transition between Two Amorphous Phases of Ice Induced byPressure. Nature 1985, 314, 76−78.(151) Yue, Y. Z.; Wondraczek, L.; Behrens, H.; Deubener, J. GlassTransition in an Iso-statically Compressed Calcium MetaphosphateGlass. J. Chem. Phys. 2007, 126, 144902.(152) Yarger, J. L.; Smith, K. H.; Nieman, R. A.; Diefenbacher, J.;Wolf, G.; Poe, B. T.; Mcmillan, P. F. Al Coordination Changes inHigh-pressure Aluminosilicate Liquids. Science 1995, 270, 1964−1967.(153) Guthrie, M.; Tulk, C. A.; Benmore, C. J.; Xu, J.; Yarger, J. L.;Klug, D. D.; Tse, J. S.; Mao, H. -K.; Hemley, R. J. The Formation andStructure of a Dense Octahedral Glass. Phys. Rev. Lett. 2004, 93,115502.(154) Monaco, A.; Chumakov, A. I.; Monaco, G.; Crichton, W. A.;Meyer, A.; Comez, L.; Fioretto, D.; Korecki, J.; Ruffer, R. Effect ofDensification on the Density of Vibrational States of Glasses. Phys.Rev. Lett. 2006, 97, 135501.(155) Smedskjaer, M. M.; Youngman, R. E.; Striepe, S.; Potuzak, M.;Bauer, U.; Deubener, J.; Behrens, H.; Mauro, J. C.; Yue, Y. Z.Irreversibility of Pressure Induced Boron Speciation Change in Glass.Sci. Rep. 2015, 4, 3770.(156) Wondraczek, L.; Behrens, H.; Yue, Y.; Deubener, J.; Scherer,G. W. Relaxation and Glass Transition in an Isostatically CompressedDiopside Glasses. J. Am. Ceram. Soc. 2007, 90, 1556−1561.(157) Wolf, G.; McMillan, P. F. Pressure Effects on Silicate Melt −Structure and Properties. Rev. Mineral. 1995, 32, 505−561.(158) Ketov, S. V.; Sun, Y. H.; Nachum, S.; Lu, Z.; Checchi, A.;Beraldin, A. R.; Bai, H. Y.; Wang, W. H.; Louzguineluzgin, D. V.;Carpenter, M. A.; Greer, A. L. Rejuvenation of Metallic Glasses byNon-affine Thermal Strain. Nature 2015, 524, 200−203.(159) Sun, Y.; Concustell, A.; Greer, A. L. ThermomechanicalProcessing of Metallic Glasses: Extending the Range of the GlassyState. Nat. Rev. Mater. 2016, 1, 16039.(160) Tian, K. V.; Yang, B.; Yue, Y.; Bowron, D. T.; Mayers, J.;Donnan, R. S.; Dobo-Nagy, C.; Nicholson, J. W.; Fang, D. C.; Greer,A. L.; et al. Atomic and Vibrational Origins of Mechanical Toughnessin Bioactive Cement during Setting. Nat. Commun. 2015, 6, 8631.(161) Pedersen, M. T.; Tian, K. V.; Dobo-Nagy, C.; Chass, G. A.;Greaves, G. N.; Yue, Y. Z. Phase Separation in an Ionomer Glass:Insight from Calorimetry and Phase Transitions. J. Non-Cryst. Solids2015, 415, 24−29.
(162) Yue, Y. Z.; Christiansen, J. D.; Jensen, S. L. Determination ofthe Fictive Temperature for a Hyperquenched Glass. Chem. Phys. Lett.2002, 357, 20−24.(163) Zheng, Q. J.; Mauro, J. C. Viscosity of Glass-Forming Systems.J. Am. Ceram. Soc. 2017, 100, 6−25.(164) Tool, A. Q.; Eichlin, C. G. Variations Caused in the HeatingCurves of Glass by Heat Treatment. J. Am. Ceram. Soc. 1931, 14,276−308.(165) Ritland, H. N. Limitations of the Fictive TemperatureConcept. J. Am. Ceram. Soc. 1956, 39, 403−406.(166) Narayanaswamy, O. S. A Model of Structural Relaxation inGlass. J. Am. Ceram. Soc. 1971, 54, 491−498.(167) Mauro, J. C.; Loucks, R. J.; Gupta, P. K. Fictive Temperatureand the Glassy State. J. Am. Ceram. Soc. 2009, 92, 75−86.(168) DeBolt, M. A.; Easteal, A. J.; Macedo, P. B.; Moynihan, C. T.Analysis of Structural Relaxation in Glass Using Rate Heating Data. J.Am. Ceram. Soc. 1976, 59, 16−21.(169) Moynihan, C. T. Correlation between the Width of the GlassTransition Region and the Temperature Dependence of the Viscosityof High-Tg Glasses. J. Am. Ceram. Soc. 1993, 76, 1081−1087.(170) Yue, Y. Z. Hyperquenched Glasses: Relaxation and Properties. AnEncyclopedia of Glass Science, Technology, History, Culture (in press).(171) Stillinger, F. H.; Weber, T. A. Packing Structures andTransitions in Liquids and Solids. Science 1984, 225, 983−989.(172) Saika-Voivod, I.; Poole, P. H.; Sciortino, F. Fragile-to-strongTransition and Polyamorphism in the Energy Landscape of LiquidSilica. Nature 2001, 412, 514−517.(173) Yue, Y. Z.; von der Ohe, R.; Jensen, S. L. Fictive Temperature,Cooling Rate, and Viscosity of Glasses. J. Chem. Phys. 2004, 120,8053. (a) Yue, Y. Z.; von der Ohe, R.; Jensen, S. L. Erratum: FictiveTemperature, Cooling Rate, and Viscosity of Glasses. J. Chem. Phys.2004, 121, 11508.(174) Priven, A. I. Calculation of Temperature Dependences of theViscosity and Volume Relaxation Time for Oxide Glass-FormingMelts from Chemical Composition and Dilatometric Glass TransitionTemperature. Glass Phys. Chem. 2001, 27, 527−542.(175) Huang, J.; Gupta, P. K. Enthalpy Relaxation in Thin GlassFibers. J. Non-Cryst. Solids 1992, 151, 175−181.(176) Velikov, V.; Borick, S.; Angell, C. A. The Glass Transition ofWater, Based on Hyperquenching Experiments. Science 2001, 294,2335−2338.(177) Scherer, G. W. Use of the Adam-Gibbs Equation in theAnalysis of Structural Relaxation. J. Am. Ceram. Soc. 1984, 67, 504−511.(178) Lund, M. D.; Yue, Y. Z. Impact of Drawing Stress on theTensile Strength of Oxide Glass Fibers. J. Am. Ceram. Soc. 2010, 93,3236−3243.(179) Von der Ohe, R. Simulation of Glass Fiber Forming Processes.Ph.D. thesis, Aalborg University, Aalborg, Denmark, 2003.(180) Moynihan, C. T.; Lee, S. K.; Tatsumisago, M.; Minami, T.Estimation of Activation Energies for Structural Relaxation andViscous Flow from DTA and DSC Experiments. Thermochim. Acta1996, 280, 153−162.(181) Avramov, I.; Milchev, A. Effect of Disorder on Diffusion andViscosity in Condensed Systems. J. Non-Cryst. Solids 1988, 104, 253−260.(182) Angell, C. A. Spectroscopy, Simulation, and the MediumRange Order Problem in Glass. J. Non-Cryst. Solids 1985, 73, 1−17.(183) Angell, C. A.; Ngai, K. L.; McKenna, G. B.; McMillan, P. F.;Martin, S. W. Relaxation in Glassforming Liquids and AmorphousSolids. J. Appl. Phys. 2000, 88, 3113−3157.(184) Angell, C. A. Glass Formation and Glass Transition inSupercooled Liquids, with Insights from Study of Related Phenomenain Crystals. J. Non-Cryst. Solids 2008, 354, 4703−4712.(185) McKenna, G. B. A Brief Discussion: Thermodynamic andDynamic Fragilities, Non-divergent Dynamics and the Prigogine−Defay Ratio. J. Non-Cryst. Solids 2009, 355, 663−671.
Chemical Reviews Review
DOI: 10.1021/acs.chemrev.8b00510Chem. Rev. XXXX, XXX, XXX−XXX
CB

(186) Ma, H.; Fecht, H. J. Thermodynamic and Kinetic Fragilities ofMg-based Bulk Metallic Glass-forming Liquids. J. Mater. Res. 2008,23, 2816−2820.(187) Yang, X. N.; Zhou, C.; Sun, Q. J.; Hu, L. N.; Mauro, J. C.;Wang, C. Z.; Yue, Y. Z. Anomalous Crystallization as a Signature ofthe Fragile-to-Strong Transition in Metallic Glass-Forming Liquids. J.Phys. Chem. B 2014, 118, 10258−10265.(188) Evenson, Z.; Schmitt, T.; Nicola, M.; Gallino, I.; Busch, R.High Temperature Melt Viscosity and Fragile to Strong Transition inZr−Cu−Ni−Al−Nb(Ti) and Cu47Ti34Zr11Ni8 Bulk Metallic Glasses.Acta Mater. 2012, 60, 4712−4719.(189) Sun, Q. J.; Zhou, C.; Yue, Y. Z.; Hu, L. N. A Direct Linkbetween the Fragile-to-Strong Transition and Relaxation in Super-cooled Liquids. J. Phys. Chem. Lett. 2014, 5, 1170−1174.(190) Zheng, Q. J.; Mauro, J. C.; Ellison, A. J.; Potuzak, M.; Yue, Y.Z. Universality of the High-temperature Viscosity Limit of SilicateLiquids. Phys. Rev. B: Condens. Matter Mater. Phys. 2011, 83, 212202.(191) Mauro, J. C.; Loucks, R. J. Impact of Fragility on EnthalpyRelaxation in Glass. Phys. Rev. E 2008, 78, 021502.(192) Zheng, Q. J.; Mauro, J. C. Variability in the RelaxationBehavior of Glass: Impact of Thermal History Fluctuations andFragility. J. Chem. Phys. 2017, 146, 074504.(193) Urbain, G.; Bottinga, Y.; Richet, P. Viscosity of Liquid Silica,Silicates and Alumino-silicates. Geochim. Cosmochim. Acta 1982, 46,1061−1072.(194) Langstaff, D.; Gunn, M.; Greaves, G. N.; Marsing, A.; Kargl, F.Aerodynamic Levitator Furnace for Measuring ThermophysicalProperties of Refractory Liquids. Rev. Sci. Instrum. 2013, 84, 124901.(195) Chen, Z. M.; Li, Z. J.; Zhang, Y. Q.; Liu, R. P.; Tian, Y. J.;Wang, L. M. Calorimetric Determination of Fragility in Glass FormingLiquids: Tf vs. Tg‑onset Methods. Eur. Phys. J. E 2014, 37, 1−7.(196) Kissinger, H. E. Reaction Kinetics in Differential ThermalAnalysis. Anal. Chem. 1957, 29, 1702−1706.(197) Wang, L. M.; Velikov, V.; Angell, C. A. Direct Determinationof Kinetic Fragility Indices of Glassforming Liquids by DifferentialScanning Calorimetry: Kinetic versus Thermodynamic Fragilities. J.Chem. Phys. 2002, 117, 10184.(198) Huang, D.; McKenna, G. B. New Insights into the FragilityDilemma in Liquids. J. Chem. Phys. 2001, 114, 5621−5630.(199) Potuzak, M.; Mauro, J. C.; Kiczenski, T. J.; Ellison, A. J.; Allan,D. C. Communication: Resolving the Vibrational and ConfigurationalContributions to Thermal Expansion in Isobaric Glass-formingSystems. J. Chem. Phys. 2010, 133, 091102.(200) Mauro, J. C.; Allan, D. C.; Potuzak, M. NonequilibriumViscosity of Glass. Phys. Rev. B: Condens. Matter Mater. Phys. 2009, 80,754−758.(201) Angell, C. A.; Richards, B. E.; Velikov, V. Simple Glass-forming Liquids: their Definition, Fragilities, and LandscapeExcitation Profiles. J. Phys.: Condens. Matter 1999, 11, A75−A94.(202) Angell, C. A. In Structure and Properties of Glassy Polymers;Tant, M. R., Hill, A. J., Eds.; American Chemical Society: Washington,DC, 1998; Chapter 3, pp 37−52.(203) Ferry, J. D. Viscoelastic Properties of Polymers, 3rd ed.; Wiley:New York, 1980.(204) 40 Years of Entropy and the Glass Transition, Special Issue;edited by McKenna, G. B., Glotzer Mauro, S. L., Loucks, J. C. J. Res.Natl. Inst. Stand. Technol. 1997, 102, 2.(205) Angell, C. A. Strong and Fragile Liquids. In Relaxations inComplex Systems; Ngai, K. L., Wright, G. B., Eds.; Naval ResearchLaboratory: Washington, DC, 1985; p 3−11.(206) Matyushov, D. V.; Angell, C. A. Two-Gaussian ExcitationsModel for the Glass Transition. J. Chem. Phys. 2005, 123, 34506.(207) Ruocco, G.; Sciortino, F.; Zamponi, F.; De Michele, C.;Scopigno, T. Landscapes and Fragilities. J. Chem. Phys. 2004, 120,10666−10680.(208) Stillinger, F. H.; Debenedetti, P. G. Energy LandscapeDiversity and Supercooled Liquid Properties. J. Chem. Phys. 2002,116, 3353−3361.
(209) Velikov, V.; Borick, S.; Angell, C. A. Molecular Glasses withHigh Fictive Temperatures for Energy Landscape Evaluations. J. Phys.Chem. B 2002, 106, 1069−1080.(210) Angell, C. A. Ten Questions on Glassformers, and A RealSpace “Excitations” Model with Some Answers on Fragility and PhaseTransitions. J. Phys.: Condens. Matter 2000, 12, 6463−6475.(211) Stevenson, J. D.; Wolynes, P. G. Thermodynamic-kineticCorrelations in Supercooled Liquids: A Critical Survey ofExperimental Data and Predictions of the Random First OrderTransition Theory of Glasses. J. Phys. Chem. B 2005, 109, 1−15.(212) Cangialosi, D.; Alegría, A.; Colmenero, J. A ThermodynamicApproach to the Fragility of Glass-forming Polymers. J. Chem. Phys.2006, 124, 024906.(213) Prevosto, D.; Lucchesi, M.; Capaccioli, S.; Casalini, R.; Rolla,P. A. Correlation between Configurational Entropy and StructuralRelaxation Time in Glass-forming Liquids. Phys. Rev. B: Condens.Matter Mater. Phys. 2003, 67, 174202.(214) Wang, L. M.; Angell, C. A.; Richert, R. Fragility andThermodynamics in Nonpolymeric Glass-forming Liquids. J. Chem.Phys. 2006, 125, 074505.(215) Xia, X.; Wolynes, P. G. Fragilities of Liquids Predicted fromthe Random First Order Transition Theory of Glasses. Proc. Natl.Acad. Sci. U. S. A. 2000, 97, 2990−2994.(216) Stevenson, J. D.; Wolynes, P. G. Thermodynamic-kineticCorrelations in Supercooled Liquids: A Critical Survey ofExperimental Data and Predictions of the Random First-orderTransition Theory of Glasses. J. Phys. Chem. B 2005, 109, 15093−15097.(217) Yue, Y. Z.; Zheng, Q. J. Fiber Spinnability of Glass Melts. Int.J. Appl. Glass Sci. 2017, 8, 37−47.(218) Fulcher, G. S. Analysis of Recent Measurements of theViscosity of Glasses. J. Am. Ceram. Soc. 1925, 8, 339−355.(219) McMillan, P. F.; Wilson, M.; Wilding, M. C.; Daisenberger,D.; Mezouar, M.; Greaves, G. N. Polyamorphism and Liquid−liquidPhase Transitions: Challenges for Experiment and Theory. J. Phys.:Condens. Matter 2007, 19, 415101.(220) Mishima, O.; Calvert, L. D.; Whalley, E. An Apparently 1st-order Transition between Two Amorphous Phases of Ice Induced byRessure. Nature 1985, 314, 76−78.(221) Gallo, P.; Amann-Winkel, K.; Angell, C. A.; Anisimov, M. A.;Caupin, F.; Chakravarty, C.; Lascaris, E.; Loerting, T.;Panagiotopoulos, A. Z.; Russo, J.; et al. Water: A Tale of TwoLiquids. Chem. Rev. 2016, 116, 7463−7500.(222) Woutersen, S.; Ensing, B.; Hilbers, M.; Zhao, Z.; Angell, C. A.A Liquid-liquid Transition in Supercooled Aqueous Solution Relatedto the HDA-LDA Transition. Science 2018, 359, 1127−1131.(223) Chatterjee, S.; Debenedetti, P. G. Fluid-phase Behavior ofBinary Mixtures in Which One Component Can Have Two CriticalPoints. J. Chem. Phys. 2006, 124, 154503.(224) Anisimov, M. A. Cold and Supercooled Water: A NovelSupercritical-fluid Solvent. Russ. J. Phys. Chem. B 2012, 6, 861−867.(225) Biddle, J. W.; Holten, V.; Anisimov, M. A. Behavior ofSupercooled Aqueous Solutions Stemming from Hidden Liquid−liquid Transition in Water. J. Chem. Phys. 2014, 141, 074504.(226) Greaves, G. N.; Meneau, F.; Kargl, F.; Ward, D.; Holliman, P.;Albergamo, F. Zeolite Collapse and Polyamorphism. J. Phys.: Condens.Matter 2007, 19, 415102.(227) Loerting, T.; Giovambattista, N. Amorphous Ices: Experi-ments and Numerical Simulations. J. Phys.: Condens. Matter 2006, 18,R919−R977.(228) Mishima, O.; Calvert, L. D.; Whalley, E. ‘Melting ice’ I at 77 Kand 10 kbar: A New Method of Making Amorphous Materials. Nature1984, 310, 393−395.(229) Poole, P. H.; Grande, T.; Angell, C. A.; McMillan, P. F.Polymorphic Phase Transitions in Liquids and Glasses. Science 1997,275, 322−323.(230) Aasland, S.; McMillan, P. F. Density-driven Liquid−liquidPhase Separation in the System Al2O3−Y2O3. Nature 1994, 369, 633−636.
Chemical Reviews Review
DOI: 10.1021/acs.chemrev.8b00510Chem. Rev. XXXX, XXX, XXX−XXX
CC

(231) Greaves, G. N.; Wilding, M. C.; Fearn, S.; Langstaff, D.; Kargl,F.; Cox, S.; Van, Q.; Majerus, O.; Benmore, C. J.; Weber, R.; et al.Detection of First-Order Liquid/Liquid Phase Transitions in YttriumOxide-Aluminum Oxide Melts. Science 2008, 322, 566−570.(232) Greaves, G. N.; Wilding, M. C.; Langstaff, D.; Kargl, F.;Hennet, L.; Benmore, C. J.; Weber, J. K. R.; Van, Q. V.; Majerus, O.;McMillan, P. F. Composition and Polyamorphism in SupercooledYttria−alumina Melts. J. Non-Cryst. Solids 2011, 357, 435−441.(233) Barnes, A. C.; Skinner, L. B.; Salmon, P. S.; Bytchkov, A.;Pozdnyakova, I.; Farmer, T. O.; Fischer, H. E. Liquid-liquid PhaseTransition in Supercooled Yttria-alumina. Phys. Rev. Lett. 2009, 103,225702.(234) Inamura, Y.; Katayama, Y.; Utsumi, W.; Funakoshi, K. I.Transformations in the Intermediate-range Structure of SiO2 Glassunder High Pressure and Temperature. Phys. Rev. Lett. 2004, 93,015501.(235) Richet, P.; Gillet, P. Pressure-induced Amorphisation ofMinerals: A Review. Eur. J. Mineral. 1997, 9, 907−934.(236) Haines, J.; Levelut, C.; Isambert, A.; Hebert, P.; Kohara, S.;Keen, D. A.; Hammouda, T.; Andrault, D. Topologically OrderedAmorphous Silica Obtained from the Collapsed Siliceous Zeolite,Silicalite-1-F: A Step toward “Perfect” Glasses. J. Am. Chem. Soc. 2009,131, 12333−12338.(237) Bennett, T. D.; Goodwin, A. L.; Dove, M. T.; Keen, D. A.;Tucker, M. G.; Barney, E. R.; Soper, A. K.; Bithell, E. G.; Tan, J. C.;Cheetham, A. K. Structure and Properties of an Amorphous Metal-organic Framework. Phys. Rev. Lett. 2010, 104, 115503.(238) Sharma, S. M.; Sikka, S. K. Pressure-induced Amorphisation ofMaterials. Prog. Mater. Sci. 1996, 40, 1−77.(239) Colyer, L. M.; Greaves, G. N.; Carr, S. W.; Fox, K. K. Collapseand Recrystallization Processes in Zinc-Exchanged Zeolite-A: ACombined X-ray Diffraction, XAFS, and NMR Study. J. Phys. Chem.B 1997, 101, 10105−10114.(240) Wondraczek, L.; Pan, Z.; Palenta, T.; Erlebach, A.; Misture, S.T.; Sierka, M.; Micoulaut, M.; Hoppe, U.; Deubener, J.; Greaves, G.N. Kinetics of Decelerated Melting. Adv. Sci. 2018, 5, 1700850.(241) Dove, M. T.; Hammonds, K. D.; Trachenko, K. In RigidityTheory and Applications; Thorpe, M. F., Duxbury, P. M., Eds.;Springer, 1999; pp 217−238.(242) Hammonds, K. D.; Deng, H.; Heine, V.; Dove, M. T. HowFloppy Modes Give Rise to Adsorption Sites in Zeolites. Phys. Rev.Lett. 1997, 78, 3701−3704.(243) Villaescusa, L. A.; Lightfoot, P.; Teat, S. J.; Morris, R. E.Variable-temperature Microcrystal X-ray Diffraction Studies ofNegative Thermal Expansion in the Pure Silica Zeolite IFR. J. Am.Chem. Soc. 2001, 123, 5453−5459.(244) Sciortino, F.; Essmann, U.; Stanley, H. E.; Hemmati, M.; Shao,J.; Wolf, G. H.; Angell, C. A. Crystal Stability Limits at Positive andNegative Pressures, and Crystal-to-glass Transitions. Phys. Rev. E: Stat.Phys., Plasmas, Fluids, Relat. Interdiscip. Top. 1995, 52, 6484−6491.(245) Greaves, G. N.; Meneau, F.; Sapelkin, A.; Colyer, L. M.; ApGwynn, I.; Wade, S.; Sankar, G. The Rheology of Collapsing ZeolitesAmorphized by Temperature and Pressure. Nat. Mater. 2003, 2, 622−629.(246) Wharmby, M. T.; Henke, S.; Bennett, T. D.; Bajpe, S. R.;Schwedler, I.; Thompson, S. P.; Gozzo, F.; Simoncic, P.; Mellot-Draznieks, C.; Tao, H. Z.; et al. Extreme Flexibility in a ZeoliticImidazolate Framework: Porous to Dense Phase Transition inDesolvated ZIF 4. Angew. Chem., Int. Ed. 2015, 54, 6447−6451.(247) Tao, H. Z.; Bennett, T. D.; Yue, Y. Z. Melt-Quenched HybridGlasses from Metal-organic Frameworks. Adv. Mater. 2017, 29,1601705.(248) Bennett, T. D.; Cheetham, A. K. Amorphous Metal-organicFrameworks. Acc. Chem. Res. 2014, 47, 1555−1562.(249) van de Voorde, B.; Stassen, I.; Bueken, B.; Vermoortele, F.; deVos, D.; Ameloot, R.; Tan, J. C.; Bennett, T. D. Improving theMechanical Stability of Zirconium-based Metal-organic Frameworksby Incorporation of Acidic Modulators. J. Mater. Chem. A 2015, 3,1737−1742.
(250) Park, K. S.; Ni, Z.; Cote, A. P.; Choi, J. Y.; Huang, R. D.;Uribe- Romo, F. J.; Chae, H. K.; O’Keeffe, M.; Yaghi, O. M.Exceptional Chemical and Thermal Stability of Zeolitic ImidazolateFrameworks. Proc. Natl. Acad. Sci. U. S. A. 2006, 103, 10186−10191.(251) Tian, Y. Q.; Zhao, Y. M.; Chen, Z. X.; Zhang, G. N.; Weng, L.H.; Zhao, D. Y. Design and Generation of Extended Zeolitic Metal-organic Frameworks (ZMOFs): Synthesis and Crystal Structures ofZinc(II) Imidazolate Polymers with Zeolitic Topologies. Chem. - Eur.J. 2007, 13, 4146−4154.(252) Chapman, K. W.; Sava, D. F.; Halder, G. J.; Chupas, P. J.;Nenoff, T. M. Trapping Guests within A Nanoporous Metal-organicFramework through Pressure-induced Amorphization. J. Am. Chem.Soc. 2011, 133, 18583.(253) Horcajada, P.; Serre, C.; Vallet-Regi, M.; Sebban, M.; Taulelle,F.; Ferey, G. Metal-organic Frameworks as Efficient Materials forDrug Delivery. Angew. Chem., Int. Ed. 2006, 45, 5974−5978.(254) Bennett, T. D.; Yue, Y. Z.; Li, P.; Qiao, A.; Tao, H. Z.;Greaves, G. N.; Richards, T.; Lampronti, G. I.; Redfern, S. A. T.;Blanc, F.; et al. Melt-quenched Glasses of Metal-organic Frameworks.J. Am. Chem. Soc. 2016, 138, 3484−3492.(255) Qiao, A.; Bennett, T. D.; Tao, H. Z.; Krajnc, A.; Mali, G.;Doherty, C. M.; Thornton, A. W.; Mauro, J. C.; Greaves, G. N.; Yue,Y. Z. A Metal-organic Framework with Ultrahigh Glass-formingAbility. Sci. Adv. 2018, 4, No. eaao6827.(256) MacMillan, J. A.; Los, S. C. Kinetics of Glass Transformationby Thermal Analysis. I. Glycerol. J. Chem. Phys. 1965, 42, 3497−3501.(257) Greaves, G. N. Hybrid Glasses: from Metal Organic Frameworksand Co-ordination Polymers to Hybrid Perovskites; Musgraves, J. D., Hu,J., Calvez, L., Eds.; Springer Handbook of Glass; Springer: Cham,2019.(258) Hofer, K.; Mayer, E.; Johari, G. P. Glass-liquid Transition ofWater and Ethylene Glycol Solution in Poly(2-hydroxyethylmethacrylate) Hydrogel. J. Phys. Chem. 1990, 94, 2689−2696.(259) Johari, G. P.; Hallbrucker, A.; Mayer, E. The Glass Transitionof Hyperquenched Glassy Water. Nature 1987, 330, 552−553.(260) Hofer, K.; Hallbrucker, A.; Mayer, E.; Johari, G. P. VitrifiedDilute Aqueous-solutions. 3. Plasticization of Waters H-bondedNetwork and the Glass-transition Temperatures Minimum. J. Phys.Chem. 1989, 93, 4674−4677.(261) Angell, C. A. Insights into Phases of Liquid Water from Studyof Its Unusual Glass-Forming Properties. Science 2008, 319, 582−587.(262) Longley, L.; Collins, S. M.; Zhou, C.; Smales, G. J.; Norman,S. E.; Brownbill, N. J.; Ashling, C. W.; Chater, P. A.; Tovey, R.;Schonlieb, C.; et al. Liquid Phase Blending of Metal-organicFrameworks. Nat. Commun. 2018, 9, 2135.(263) Singh, S.; Ediger, M. D.; de Pablo, J. J. Ultrastable Glassesfrom in Silico Vapour Deposition. Nat. Mater. 2013, 12, 139−144.(264) Perez-Castaneda, T.; Rodriguez-Tinoco, C.; Rodriguez-Viejo,J.; Ramos, M. A. Suppression of Tunneling Two-level Systems inUltrastable Glasses of Indomethacin. Proc. Natl. Acad. Sci. U. S. A.2014, 111, 11275−11280.(265) Navrotsky, A.; Tian, Z. R. Systematics in the Enthalpies ofFormation of Anhydrous Aluminosilicate Zeolites, Glasses, and DensePhases. Chem. - Eur. J. 2001, 7, 769−774.(266) Peral, I.; Iniguez, J. Amorphization Induced by Pressure:Results for Zeolites and General Implications. Phys. Rev. Lett. 2006,97, 225502.(267) Rogez, G.; Viart, N.; Drillon, M. Multiferroic Materials: TheAttractive Approach of Metal-organic Frameworks (MOFs). Angew.Chem., Int. Ed. 2010, 49, 1921−1923.(268) Stillinger, F. H.; Weber, T. A. Dynamics of StructuralTransitions in Liquids. Phys. Rev. A: At., Mol., Opt. Phys. 1983, 28,2408.(269) Wales, D. J. Energy Landscapes with Applications to Clusters,Biomolecules and Glasses; Cambridge University Press: Cambridge,2003.(270) Goldstein, M. Viscous Liquids and the Glass Transition: APotential Energy Barrier Picture. J. Chem. Phys. 1969, 51, 3728−3739.
Chemical Reviews Review
DOI: 10.1021/acs.chemrev.8b00510Chem. Rev. XXXX, XXX, XXX−XXX
CD
(271) Stillinger, F. H. A Topographic View of Supercooled Liquidsand Glass Formation. Science 1995, 267, 1935−1939.(272) Angelani, L.; Leonardo, R. D.; Ruocco, G.; Scala, A.; Sciortino,F. Saddles in the Energy Landscape Probed by Supercooled Liquids.Phys. Rev. Lett. 2000, 85, 5356−5359.(273) Angell, C. A. Calorimetric Studies of the Energy Landscapes ofGlass Formers by Hyperquenching Methods. J. Therm. Anal. Calorim.2002, 69, 785−794.(274) Hu, L. N.; Yue, Y. Z. Secondary Relaxation Behavior in aStrong Glass. J. Phys. Chem. B 2008, 112, 9053−9057.(275) Stillinger, F. H. Supercooled Liquids, Glass Transitions, andThe Kauzmann Paradox. J. Chem. Phys. 1988, 88, 7818−7825.(276) Diezemann, G. A Free-energy Landscape Model for PrimaryRelaxation in Glass-forming Liquids: Rotations and DynamicHeterogeneities. J. Chem. Phys. 1997, 107, 10112−10120.(277) Diezemann, G.; Sillescu, H.; Hinze, G.; Bohmer, R. RotationalCorrelation Functions and Apparently Enhanced TranslationalDiffusion in a Free-energy Landscape Model for the α Relaxation inGlass-forming Liquids. Phys. Rev. E: Stat. Phys., Plasmas, Fluids, Relat.Interdiscip. Top. 1998, 57, 4398−4410.(278) Diezemann, G. Aging in a Free-energy Landscape Model forGlassy Relaxation. J. Chem. Phys. 2005, 123, 204510.(279) Diezemann, G.; Mohanty, U.; Oppenheim, I. Slow SecondaryRelaxation in a Free-energy Landscape Model for Relaxation in Glass-forming Liquids. Phys. Rev. E: Stat. Phys., Plasmas, Fluids, Relat.Interdiscip. Top. 1999, 59, 2067−2083.(280) Johari, G. P. Disorder, Configurational Relaxations and HeatCapacity of Glasses. Phase Transitions 1985, 5, 277−300.(281) Ngai, K. L.; Paluch, M. Classification of Secondary Relaxationin Glass-formers Based on Dynamic Properties. J. Chem. Phys. 2004,120, 857−870.(282) Ngai, K. L.; Tsang, K. Y. Similarity of Relaxation inSupercooled Liquids and Interacting Arrays of Oscillators. Phys. Rev.E: Stat. Phys., Plasmas, Fluids, Relat. Interdiscip. Top. 1999, 60, 4511−4517.(283) Mauro, J. C.; Smedskjaer, M. M. Minimalist Landscape Modelof Glass Relaxation. Phys. A 2012, 391, 3446−3459.(284) Mauro, J. C.; Loucks, R. J. Selenium Glass Transition: AModel Based on the Enthalpy Landscape Approach and Non-equilibrium Statistical Mechanics. Phys. Rev. B: Condens. Matter Mater.Phys. 2007, 76, 174202.(285) Mauro, J. C.; Varshneya, A. K. Model Interaction Potentialsfor Selenium from ab initio Molecular Simulations. Phys. Rev. B:Condens. Matter Mater. Phys. 2005, 71, 214105.(286) Mauro, J. C.; Loucks, R. J.; Balakrishnan, J. Split-StepEigenvector-Following Technique for Exploring Enthalpy Landscapesat Absolute Zero. J. Phys. Chem. B 2006, 110, 5005.(287) Hu, L. N.; Yue, Y. Z. Secondary Relaxation in Metallic GlassFormers: Its Correlation with the Genuine Johari-GoldsteinRelaxation. J. Phys. Chem. C 2009, 113, 15001−15006.(288) Wang, L. M.; Borick, S.; Angell, C. A. An ElectrosprayTechnique for Hyperquenched Glass Calorimetry Studies: PropyleneGlycol and di-n-butyl Phthalate. J. Non-Cryst. Solids 2007, 353, 3829−3837.(289) Tool, A. Q. Relation between Inelastic Deformability andThermal Expansion of Glass in Its Annealing Range. J. Am. Ceram.Soc. 1946, 29, 240−253.(290) Inoue, A.; Masumoto, T.; Chen, H. S. Enthalpy RelaxationBehaviour of Metal-metal (Zr-Cu) Amorphous Alloys uponAnnealing. J. Mater. Sci. 1985, 20, 4057−4068.(291) Yue, Y. Z.; Jensen, S. L.; Christiansen, J. deC Physical Aging ina Hyperquenched Glass. Appl. Phys. Lett. 2002, 81, 2983−2985.(292) Yue, Y. Z. Influence of Physical Ageing on the Excessive HeatCapacity of Hyperquenched Silicate Glass Fibers. J. Non-Cryst. Solids2004, 348, 72−77.(293) Hornbøll, L.; Yue, Y. Z. Enthalpy Relaxation of Hyper-quenched Glasses and Its Possible Link to α and β -relaxations. J. Non-Cryst. Solids 2008, 354, 350−354.
(294) Yue, Y. Z. Relaxation in Glasses Far from Equilibrium State. J.Shandong University − Eng. Ed. 2009, 39, 1−26.(295) Zhang, Y. F.; Hu, L. N.; Liu, S. J.; Zhu, C. F.; Yue, Y. Z. Sub-Tg Enthalpy Relaxation in an Extremely Unstable Oxide Glass and ItsImplication for Structural Heterogeneity. J. Non-Cryst. Solids 2013,381, 23−28.(296) Guo, X. J.; Mauro, J. C.; Potuzak, M.; Yue, Y. Z. StructuralRelaxation in Annealed Hyperquenched Basaltic Glasses: Insightsfrom Calorimetry. J. Non-Cryst. Solids 2012, 358, 1356−1361.(297) Wang, X. H.; Inoue, A.; Kong, F. L.; Zhu, S. L.; Wang, H.;Shalaan, E.; Al-Marzouki, F. Annealing-induced Enthalpy RelaxationBehavior of Ni-Pd-P-B Bulk Glassy Type Alloys. Mater. Sci. Eng., A2016, 674, 250−255.(298) Slipenyuk, A.; Eckert, J. Correlation between Enthalpy Changeand Free Volume Reduction during Structural Relaxation ofZr55Cu30Al10Ni5 Metallic Glass. Scr. Mater. 2004, 50, 39−44.(299) Zhu, F.; Nguyen, H. K.; Song, S. X.; Aji, D. P. B.; Hirata, A.;Wang, H.; Nakajima, K.; Chen, M. W. Intrinsic Correlation betweenβ-relaxation and Spatial Heterogeneity in a Metallic Glass. Nat.Commun. 2016, 7, 11516.(300) Senapati, H.; Angell, C. A. Glass Formation and AnomalousAnnealing Effects in the Mixed Oxyanion System AgI Ag2SO4Ag2WO4. J. Non-Cryst. Solids 1991, 130, 58−66.(301) Yue, Y. Z.; Angell, C. A. Glass Transition in HyperquenchedWater? Reply. Nature 2005, 435, E1−E2.(302) Kohlrausch, R. Nachtrag uber die elastiche Nachwirkung beimCocon und Glasladen. Prog. Ann. Phys. 1847, 12, 393.(303) Kohlrausch, R. Theorie des elektrischen Ruckstandes in derLeidener Flasche. Ann. Phys. 1854, 167, 179.(304) Williams, G.; Watts, D. C. Non-symmetrical DielectricRelaxation Behaviour Arising from a Simple Empirical DecayFunction. Trans. Faraday Soc. 1970, 66, 80−85.(305) Yue, Y. Z. Anomalous Enthalpy Relaxation in Vitreous Silica.Front. Mater. 2015, 2, 54.(306) Hornbøll, L.; Yue, Y. Z. Enthalpy Relaxation in Hyper-quenched Glasses of Different Fragility. J. Non-Cryst. Solids 2008, 354,1862−1870.(307) Huang, J.; Gupta, P. K. Temperature Dependence of theIsostructural Heat Capacity of a Soda Lime Silicate Glass. J. Non-Cryst. Solids 1992, 139, 239−247.(308) Ducroux, J. P.; Rekhson, S. M.; Merat, F. L. StructuralRelaxation in Thermorheologically Complex Materials. J. Non-Cryst.Solids 1994, 172−174, 541−553.(309) Giovambattista, N.; Angell, C. A.; Sciortino, F.; Stanley, H. E.Glass-Transition Temperature of Water: A Simulation Study. Phys.Rev. Lett. 2004, 93, 047801.(310) Giovambattista, N.; Angell, C. A.; Sciortino, F.; Stanley, H. E.Structural Relaxation in the Glass Transition Region of Water. Phys.Rev. E 2005, 72, 011203.(311) Hornbøll, L.; Knusen, T.; Yue, Y. Z.; Guo, X. J.Heterogeneous Enthalpy Relaxation in Glasses far from Equilibrium.Chem. Phys. Lett. 2010, 494, 37−40.(312) Zhang, Y. F.; Guo, X. J.; Yue, Y. Z. Effect of the Initial Stage ofAnnealing on Modeling of Enthalpy Relaxation in a HyperquenchedGlass. J. Non-Cryst. Solids 2013, 378, 121−125.(313) Guo, X.; Smedskjaer, M. M.; Mauro, J. C. Linking Equilibriumand Nonequilibrium Dynamics in Glass-Forming Systems. J. Phys.Chem. B 2016, 120, 3226−3231.(314) Guo, X.; Mauro, J. C.; Allan, D. C.; Smedskjaer, M. M.Predictive Model for the Composition Dependence of GlassyDynamics. J. Am. Ceram. Soc. 2018, 101, 1169−1179.(315) Wilkinson, C. J.; Mauro, Y. Z.; Mauro, J. C. RelaxPy: PythonCode for Modeling of Glass Relaxation Behavior. SoftwareX 2018, 7,255−258.(316) Chumakov, A. I.; Monaco, G.; Fontana, A.; Bosak, A.;Hermann, R. P.; Bessas, D.; Wehinger, B.; Crichton, W. A.; Krisch,M.; Ruffer, R.; Baldi, G.; Carini, G.; D’Angelo, G.; Gillioli, E.;Tripodo, G.; Zanatta, M.; Winkler, B.; Milman, V.; Refson, K.;Tucker, M.; Dubrovinsky, L.; Keding, R.; Yue, Y. Z. Role of Disorder
Chemical Reviews Review
DOI: 10.1021/acs.chemrev.8b00510Chem. Rev. XXXX, XXX, XXX−XXX
CE

in the Thermodynamics and Atomic Dynamics of Glasses. Phys. Rev.Lett. 2014, 112, 025502.(317) Chumakov, A. I.; Monaco, G.; Monaco, A.; Crichton, W. A.;Bosak, A.; Ruffer, R.; Meyer, A.; Kargl, F.; Comez, L.; Fioretto, D.;Giefers, H.; Roitsch, S.; Wortmann, G.; Manghnani, M. H.; Hushur,A.; Williams, Q.; Balogh, J.; Parlinski, K.; Jochym, P.; Piekarz, P.Equivalence of the Boson Peak in Glasses to the Transverse Acousticvan Hove Singularity in Crystals. Phys. Rev. Lett. 2011, 106, 225501.(318) Shintani, H.; Tanaka, H. Universal Link between TransversePhonons in Glass. Nat. Mater. 2008, 7, 870−877.(319) Greaves, G. N.; Greer, A. L.; Lakes, R. S.; Rouxel, T. Poisson’sRatio and Modern Materials. Nat. Mater. 2011, 10, 823−837.(320) Kearns, K. L.; Swallen, S. F.; Ediger, M. D.; Wu, T.; Sun, Y.;Yu, L. Hiking down the Energy Landscape: Progress toward theKauzmann Temperature via Vapor Deposition. J. Phys. Chem. B 2008,112, 4934−4942.(321) Dawson, K. J.; Kearns, K. L.; Yu, L.; Steffen, W.; Ediger, M. D.Physical Vapor Deposition as a Route to Hidden Amorphous States.Proc. Natl. Acad. Sci. U. S. A. 2009, 106, 15165−15170.(322) Kearns, K. L.; Still, T.; Fytas, G.; Ediger, M. D. High-ModulusOrganic Glasses Prepared by Physical Vapor Deposition. Adv. Mater.2010, 22, 39−42.(323) Fakhraai, Z.; Still, T.; Fytas, G.; Ediger, M. D. StructuralVariations of an Organic Glassformer Vapor-deposited onto aTemperature Gradient Stage. J. Phys. Chem. Lett. 2011, 2, 423−427.(324) Yu, H. B.; Luo, Y. S.; Samwer, K. Ultrastable Metallic Glass.Adv. Mater. 2013, 25, 5904−5908.(325) Leonard, S.; Harrowell, P. Macroscopic Facilitation of GlassyRelaxation Kinetics: Ultrastable Glass Films with Frontlike ThermalResponse. J. Chem. Phys. 2010, 133, 244502.(326) Kearns, K. L.; Swallen, S. F.; Ediger, M. D.; Wu, T.; Yu, L.Influence of Substrate Temperature on the Stability of GlassesPrepared by Vapor Deposition. J. Chem. Phys. 2007, 127, 154702.(327) Kearns, K. L.; Krzyskowski, P.; Devereaux, Z. UsingDeposition Rate to Increase the Thermal and Kinetic Stability ofVapor-deposited Hole Transport Layer Glasses via a SimpleSublimation Apparatus. J. Chem. Phys. 2017, 146, 203328.(328) Whitaker, K. R.; Tylinski, M.; Ahrenberg, M.; Schick, C.;Ediger, M. D. Kinetic Stability and Heat Capacity of Vapor-depositedGlasses of o-terphenyl. J. Chem. Phys. 2015, 143, 084511.(329) Yu, H. B.; Tylinski, M.; Guiseppi-Elie, A.; Ediger, M. D.;Richert, R. Suppression of β Relaxation in Vapor-deposited Ultra-stable Glasses. Phys. Rev. Lett. 2015, 115, 185501.(330) Kearns, K. L.; Swallen, S. F.; Ediger, M. D.; Sun, Y.; Yu, L.Calorimetric Evidence for Two Distinct Molecular Packing Arrange-ments in Stable Glasses of Indomethacin. J. Phys. Chem. B 2009, 113,1579−1586.(331) Sepulveda, A.; Leon-Gutierrez, E.; Gonzalez-Silveira, M.;Clavaguera-Mora, M. T.; Rodríguez-Viejo, J. Anomalous Trans-formation of Vapor-Deposited Highly Stable Glasses of Toluene intoMixed Glassy States by Annealing Above Tg. J. Phys. Chem. Lett. 2012,3, 919−923.(332) Swallen, S. F.; Traynor, K.; McMahon, R. J.; Ediger, M. D.Stable Glass Transformation to Supercooled Liquid via Surface-Initiated Growth Front. Phys. Rev. Lett. 2009, 102, 065503.(333) Ermakov, A. E.; Yurchikov, E. E.; Barinov, V. A. The MagneticProperties of Amorphous Yttrium–Cobalt Alloy Powders Obtained byMechanical Comminution. Fiz. Metal. Metalloved. 1981, 52, 1184−1193.(334) Ermakov, A. E.; Barinov, V. A.; Yurchikov, E. E. Changes inthe Magnetic Properties of Powders of Alloys in the Gd-Co System asa Result of Their Amorphization by Milling. Fiz. Metal. Metalloved.1982, 54, 935−941.(335) Koch, C. C.; Cavin, O. B.; McKamey, C. G.; Scarbrough, J. O.Preparation of ‘‘Amorphous’’ Ni60Nb40 by Mechanical Alloying. Appl.Phys. Lett. 1983, 43, 1017.(336) Kim, K. J.; El-Eskandarany, M. S.; Sumiyama, K.; Suzuki, K.Structural and Calorimetric Studies of Amorphous Cu71Ni11P18 AlloyProduced by Ball-milling. J. Non-Cryst. Solids 1993, 155, 165−170.
(337) Shao, H.; Xu, Y.; Shi, B.; Yu, C.; Hahn, H.; Gleiter, H.; Li, J.High Density of Shear Bands and Enhanced Free Volume Induced inZr70Cu20Ni10 Metallic Glass by High-energy Ball Milling. J. AlloysCompd. 2013, 548, 77−81.(338) Kim, Y. J.; Suzuki, T.; Hagiwara, T.; Yamaji, I.; Takai, R.Enthalpy Relaxation and Glass to Rubber Transition of AmorphousPotato Starch Formed by Ball-milling. Carbohydr. Polym. 2001, 46, 1−6.(339) Descamps, M.; Aumelas, A.; Desprez, S.; Willart, J. F. TheAmorphous State of Pharmaceuticals Obtained or Transformed byMilling: Sub-Tg Features and Rejuvenation. J. Non-Cryst. Solids 2015,407, 72−80.(340) Noi, K.; Hayashi, A.; Tatsumisago, M. Structure andProperties of the Na2S-P2S5 Glasses and Glass-ceramics Prepared byMechanical Milling. J. Power Sources 2014, 269, 260−265.(341) Qiao, A.; Tao, H. Z.; Yue, Y. Z. Sub-Tg Enthalpy Relaxation ina Milling-derived Chalcogenide Glass. J. Am. Ceram. Soc. 2017, 100,968−974.(342) Ya, M.; Deubener, J.; Yue, Y. Z. Enthalpy and AnisotropyRelaxation of Glass Fibers. J. Am. Ceram. Soc. 2008, 91, 745−752.(343) Wu, J. S.; Deubener, J.; Stebbins, J. F.; Grygarova, L.; Behrens,H.; Wondraczek, L.; Yue, Y. Z. Structural Response of a HighlyViscous Aluminoborosilicate Melt to Isotropic and AnisotropicCompressions. J. Chem. Phys. 2009, 131, 104504.(344) Braun, M.; Yue, Y. Z.; Russel, C.; Jager, C. Two-dimensionalNuclear Magnetic Resonance Evidence for Structural Orientation inExtruded Phosphate Glass. J. Non-Cryst. Solids 1998, 241, 204−207.(345) Yue, Y. Z.; Bruckner, R. A New Description and Interpretationof the Flow Behaviour of Glass Forming Melts. J. Non-Cryst. Solids1994, 180, 66−79.(346) Szewczyk, R. Extension of the Model of the MagneticCharacteristics of Anisotropic Metallic Glasses. J. Phys. D: Appl. Phys.2007, 40, 4109−4113.(347) Tanaka, K.; Ishida, K. Photoinduced Anisotropic Structures inChalcogenide Glasses. J. Non-Cryst. Solids 1998, 227, 673−676.(348) Lu, X.; Arruda, E. M.; Schultz, W. W. The Effect of ProcessingParameters on Glass Fiber Birefringence Development andRelaxation. J. Non-Newtonian Fluid Mech. 1999, 86, 89−104.(349) Martin, B.; Wondraczek, L.; Deubener, J.; Yue, Y. Z.Mechanically Induced Excess Enthalpy in Inorganic Glasses. Appl.Phys. Lett. 2005, 86, 121917.(350) Hornbøll, L.; Lonnroth, N.; Yue, Y. Z. Energy Release inIsothermally Stretched Silicate Glass fibers. J. Am. Ceram. Soc. 2006,89, 70−74.(351) Deubener, J.; Yue, Y. Z.; Bornhoft, H.; Ya, M. Decouplingbetween Birefringence Decay, Enthalpy Relaxation and Viscous Flowin Calcium Boroalumosilicate Glasses. Chem. Geol. 2008, 256, 298−304.(352) Zhang, Y. F.; Yang, G.; Yue, Y. Z. Calorimetric Signature ofStructural Heterogeneity in a Ternary Silicate Glass. J. Am. Ceram.Soc. 2013, 96, 3035−3037.(353) Zhou, C.; Yue, Y. Z.; Hu, L. N. Revealing the Connectionbetween the Slow β Relaxation and Sub-Tg Enthalpy Relaxation inMetallic Glasses. J. Appl. Phys. 2016, 120, 225110.(354) Vyazovkin, S.; Dranca, I. A DSC Study of α- and β-Relaxationsin a PS-Clay System. J. Phys. Chem. B 2004, 108, 11981−11987.(355) Tombari, E.; Ferrari, C.; Johari, G. P.; Shanker, R. M.Calorimetric Relaxation in Pharmaceutical Molecular Glasses and ItsUtility in Understanding Their Stability against Crystallization. J. Phys.Chem. B 2008, 112, 10806−10814.(356) Vyazovkin, S.; Dranca, I. Comparative Relaxation Dynamics ofGlucose and Maltitol. Pharm. Res. 2006, 23, 2158−2164.(357) Capaccioli, S.; Paluch, M.; Prevosto, D.; Wang, L. M.; Ngai, K.L. Many-Body Nature of Relaxation Processes in Glass-FormingSystems. J. Phys. Chem. Lett. 2012, 3, 735−743.(358) Hu, L. N.; Zhang, C. Z.; Yue, Y. Z.; Bian, X. F. A NewThreshold of Uncovering the Nature of Glass Transition: The slow βRelaxation in Glassy States. Chin. Sci. Bull. 2010, 55, 457−472.
Chemical Reviews Review
DOI: 10.1021/acs.chemrev.8b00510Chem. Rev. XXXX, XXX, XXX−XXX
CF

(359) Ngai, K. L.; Capaccioli, S. Relation between the ActivationEnergy of the Johari-Goldstein β Relaxation and Tg of Glass Formers.Phys. Rev. E 2004, 69, 031501.(360) Rivera, A.; Rossler, E. A. Evidence of Secondary Relaxations inthe Dielectric Spectra of Ionic Liquids. Phys. Rev. B: Condens. MatterMater. Phys. 2006, 73, 212201.(361) Zhao, Z. F.; Wen, P.; Wang, W. H.; Shek, C. H. Observationof Secondary Relaxation in a Fragile Pd40Ni10Cu30P20 Bulk MetallicGlass. Appl. Phys. Lett. 2006, 89, 071920.(362) Wang, Z.; Yu, H. B.; Wen, P.; Bai, H. Y.; Wang, W. H.Pronounced Slow β-relaxation in La-based Bulk Metallic Glasses. J.Phys.: Condens. Matter 2011, 23, 142202.(363) Qiao, A.; Wang, P. P.; Tao, H. Z.; Yue, Y. Z. Sub-Tg EnthalpyRelaxation in Milled and Quenched As2S3 Glasses. J. Non-Cryst. Solids2018, 500, 225−230.(364) Donth, E. The Glass Transition: Relaxation Dynamics in Liquidsand Disordered Materials; Springer: Berlin, 2001.(365) Kudlik, A.; Tschirwitz, C.; Blochowicz, T.; Benkhof, S.;Rossler, E. Slow Secondary Relaxation in Simple Glass Formers. J.Non-Cryst. Solids 1998, 235−237, 406−411.(366) Yu, H. B.; Wang, W. H.; Bai, H. Y.; Wu, Y.; Chen, M. W.Relating Activation of Shear Transformation Zones to β Relaxationsin Metallic Glasses. Phys. Rev. B: Condens. Matter Mater. Phys. 2010,81, 220201.(367) Sun, Q. J.; Hu, L. N.; Zhou, C.; Zheng, H. J.; Yue, Y. Z.Correlation between Supercooled Liquid Relaxation and GlassPoisson’S Ratio. J. Chem. Phys. 2015, 143, 164504.(368) Ngai, K. L.; Wang, Z.; Gao, X. Q.; Yu, H. B.; Wang, W. H. AConnection between the Structural α-relaxation and the β-relaxationFound in Bulk Metallic Glass-formers. J. Chem. Phys. 2013, 139,014502.(369) Hachenberg, J.; Bedorf, D.; Samwer, K.; Richert, R.; Kahl, A.;Demetriou, M. D.; Johnson, W. L. Merging of the α and β Relaxationsand Aging via the Johari-Goldstein Modes in Rapidly QuenchedMetallic Glasses. Appl. Phys. Lett. 2008, 92, 131911.(370) Miracle, D. B. A Structural Model for Metallic Glasses. Nat.Mater. 2004, 3, 697−702.(371) Sheng, H. W.; Luo, W. K.; Alamgir, F. M.; Bai, J. M.; Ma, E.Atomic Packing and Short-to-medium-range Order in MetallicGlasses. Nature 2006, 439, 419−425.(372) Fan, G. J.; Fecht, H. J. A Cluster Model for the Viscous Flowof Glass-Forming Liquids. J. Chem. Phys. 2002, 116, 5002−5006.(373) Yu, H. B.; Wang, W. H.; Samwer, K. The β Relaxation inMetallic Glasses: An Overview. Mater. Mater. Today 2013, 16, 183−191.(374) Yu, H. B.; Samwer, K.; Wu, Y.; Wang, W. H. Correlationbetween β Relaxation and Self-Diffusion of the Smallest ConstitutingAtoms in Metallic Glasses. Phys. Rev. Lett. 2012, 109, 095508.(375) Chen, M. W. Mechanical Behavior of Metallic Glasses:Microscopic Understanding of Strength and Ductility. Annu. Rev.Mater. Res. 2008, 38, 445−469.(376) Ngai, K. L. Relaxation and Diffusion in Complex Systems;Springer: New York, NY, 2011.(377) Qiao, J. C.; Casalini, R.; Pelletier, J. M. Effect of PhysicalAging on Johari-Goldstein Relaxation in La-based Bulk Metallic Glass.J. Chem. Phys. 2014, 141, 104510.(378) Yu, H. B.; Samwer, K.; Wang, W. H.; Bai, H. Y. ChemicalInfluence on β-relaxations and the Formation of Molecule-likeMetallic Glasses. Nat. Commun. 2013, 4, 2204.(379) Yu, H. B.; Wang, Z.; Wang, W. H.; Bai, H. Y. Relationbetween β Relaxation and Fragility in LaCe-based Metallic Glasses. J.Non-Cryst. Solids 2012, 358, 869−971.(380) Wang, Z.; Sun, B. A.; Bai, H. Y.; Wang, W. H. Evolution ofHidden Localized Flow during Glass-to-liquid Transition in MetallicGlass. Nat. Commun. 2014, 5, 5823.(381) Evenson, Z.; Naleway, S. E.; Wei, S.; Gross, O.; Kruzic, J. J.;Gallino, I.; Possart, W.; Stommel, M.; Busch, R. β Relaxation andLow-temperature Aging in a Au-based Bulk Metallic Glass: From
Elastic Properties to Atomic-scale Structure. Phys. Rev. B: Condens.Matter Mater. Phys. 2014, 89, 174204.(382) Struik, L. C. E. Physical Aging in Amorphous Polymers andOther Materials; Elsevier: Netherlands, 1978.(383) Ngai, K. L. Do Theories of Glass Transition That AddressOnly the α-relaxation Need a New Paradigm? J. Non-Cryst. Solids2005, 351, 2635−2642.(384) Ngai, K. L. Correlation between the Secondary β-relaxationTime at Tg and the Kohlrausch Exponent of the Primary α-relaxation.Phys. A 1998, 261, 36−50.(385) Ngai, K. L. Correlation between the Secondary β-relaxationTime at Tg with the Kohlrausch Exponent of the Primary α Relaxationor the Fragility of Glass-forming Materials. Phys. Rev. E: Stat. Phys.,Plasmas, Fluids, Relat. Interdiscip. Top. 1998, 57, 7346−7349.(386) Vij, J. K.; Power, G. Physical Ageing and the Johari-GoldsteinRelaxation in Molecular Glasses. J. Non-Cryst. Solids 2011, 357, 783−792.(387) Doß, A.; Paluch, M.; Sillescu, H.; Hinze, G. Dynamics inSupercooled Polyalcohols: Primary and Secondary Relaxation. J.Chem. Phys. 2002, 117, 6582−6589.(388) Vogel, M.; Medick, P.; Rossler, E. A. Secondary RelaxationProcesses in Molecular Glasses Studied by Nuclear MagneticResonance Spectroscopy. Annu. Rep. NMR Spectrosc. 2005, 56,231−299.(389) Correia, N. T.; Alvarez, C.; Ramos, J. J. M.; Descamps, M.Molecular Motions in Molecular Glasses as Studied by ThermallyStimulated Depolarisation Currents (TSDC). Chem. Phys. 2000, 252,151−163.(390) Li, G.; Du, W. M.; Sakai, A.; Cummins, H. Z. Light-scatteringInvestigation of α and β Relaxation near the Liquid-glass Transition ofthe Molecular Glass Salol. Phys. Rev. A: At., Mol., Opt. Phys. 1992, 46,3343−3356.(391) Ngai, K. L. Johari-Goldstein Secondary Relaxation inMethylated Alkanes. Phys. Rev. B: Condens. Matter Mater. Phys.2005, 71, 214201.(392) Capaccioli, S.; Prevosto, D.; Lucchesi, M.; Rolla, P. A.;Casalini, R.; Ngai, K. L. Identifying the Genuine Johari−Goldstein β-relaxation by Cooling, Compressing, and Aging Small MolecularGlass-formers. J. Non-Cryst. Solids 2005, 351, 2643−2651.(393) Liu, Y. T.; Bhandari, B.; Zhou, W. Study of Glass Transitionand Enthalpy Relaxation of Mixtures of Amorphous Sucrose andAmorphous Tapioca Starch Syrup Solid by Differential ScanningCalorimetry (DSC). J. Food Eng. 2007, 81, 599−610.(394) Sakatsuji, W.; Konishi, T.; Miyamoto, Y. Effects of ThermalHistory on Enthalpy Relaxation. J. Therm. Anal. Calorim. 2013, 113,1129−1134.(395) Hodge, I. M.; Heslin, R. Effects of Thermal History onEnthalpy Relaxation in Glasses 7. Thermal Time Constants. J. Non-Cryst. Solids 2010, 356, 1479−1487.(396) Wang, L. M. Enthalpy Relaxation upon Glass Transition andKinetic Fragility of Molecular Liquids. J. Phys. Chem. B 2009, 113,5168−5171.(397) Vyazovkin, S.; Dranca, I. Probing Beta Relaxation inPharmaceutically Relevant Glasses by Using DSC. Pharm. Res.2006, 23, 422−428.(398) Berens, A. R.; Hodge, I. M. Effects of Annealing and PriorHistory on Enthalpy Relaxation in Glassy Polymers. 1. ExperimentalStudy on Poly(viny1 chloride). Macromolecules 1982, 15, 756−761.(399) Descamps, N.; Palzer, S.; Zuercher, U. The Amorphous Stateof Spray-dried Maltodextrin: Sub−sub-Tg Enthalpy Relaxation andImpact of Temperature and Water Annealing. Carbohydr. Res. 2009,344, 85−90.(400) Kudlik, A.; Benkhof, S.; Blochowicz, T.; Tschirwitz, C.;Rossler, E. The Dielectric Response of Simple Organic Glass Formers.J. Mol. Struct. 1999, 479, 201−218.(401) Pan, P. J.; Zhu, B.; Inoue, Y. Enthalpy Relaxation andEmbrittlement of Poly(L-lactide) during Physical Aging. Macro-molecules 2007, 40, 9664−9671.
Chemical Reviews Review
DOI: 10.1021/acs.chemrev.8b00510Chem. Rev. XXXX, XXX, XXX−XXX
CG

(402) Haque, M. K.; Kawai, K.; Suzuki, T. Glass Transition andEnthalpy Relaxation of Amorphous Lactose Glass. Carbohydr. Res.2006, 341, 1884−1889.(403) Urbani, R.; Sussich, F.; Prejac, S.; Cesaro, A. EnthalpyRelaxation and Glass Transition Behavior of Sucrose by Static andDynamic DSC. Thermochim. Acta 1997, 304−305, 359−367.(404) Kilburn, D.; Claude, J.; Schweizer, T.; Mezzenga, R.; Dlubek,G.; Alam, A.; Ubbink, J. Water in Glassy Carbohydrates: Opening Itup at the Nanolevel. J. Phys. Chem. B 2004, 108, 12436−12441.(405) Imran, M. M. A.; Al-Shawabkeh, A. F. Structural Relaxationdue to Sub-Tg Annealing of Se98In1.5Sn0.5 Chalcogenide Glass. J. AlloysCompd. 2010, 500, 237−240.(406) Lucas, P.; King, E. A.; Gueguen, Y.; Sangleboeuf, J.; Keryvin,V.; Erdmann, R. G.; Delaizir, G.; Boussard-Pledel, C.; Bureau, B.;Zhang, X. H.; et al. Correlation Between Thermal and MechanicalRelaxation in Chalcogenide Glass Fibers. J. Am. Ceram. Soc. 2009, 92,1986−1992.(407) Lucas, P.; Doraiswamy, A.; King, E. A. PhotoinducedStructural Relaxation in Chalcogenide Glasses. J. Non-Cryst. Solids2003, 332, 35−42.(408) Lucas, P.; King, E. A.; Horner, A. D.; Johnson, B. R.;Sundaram, S. K. Photostructural Relaxation in As-Se-S Glasses: Effectof Network Fragility. J. Non-Cryst. Solids 2006, 352, 2067−2072.(409) Thorpe, M. F. Continuous Deformations in RandomNetworks. J. Non-Cryst. Solids 1983, 57, 355−370.(410) Tatsumisago, M.; Halfpap, B. L.; Green, J. L.; Lindsay, S. M.;Angell, C. A. Fragility of Ge-As-Se Glass-forming Liquids in Relationto Rigidity Percolation, and the Kauzmann Paradox. Phys. Rev. Lett.1990, 64, 1549.(411) Stolen, S.; Grande, T.; Johnsen, H. B. Fragility Transition inGeSe2-Se Liquids. Phys. Chem. Chem. Phys. 2002, 4, 3396−3399.(412) Golovchak, R. Y.; Gorecki, C.; Kozdras, A.; Shpotyuk, O. I.Physical Ageing Effects in Vitreous Arsenic Selenides. Solid StateCommun. 2006, 137, 67−69.(413) Saiter, J. M.; Arnoult, M.; Grenet, J. Very Long PhysicalAgeing in Inorganic Polymers Exemplified by the GexSe1‑x VitreousSystem. Phys. B 2005, 355, 370−376.(414) Saiter, J. M.; Assou, A.; Grenet, J.; Vautier, C. RelaxationProcesses and Structural Models in Glassy Chalcogenide Materials:Application to the Se1‑xGex Alloys. Philos. Mag. B 1991, 64, 33−47.(415) Cortes, P.; Montserrat, S.; Ledru, J.; Saiter, J. M. EnthalpyRelaxation in GexSe1‑x Chalcogenide Glasses. J. Non-Cryst. Solids1998, 235−237, 522−526.(416) Saiter, J. M. Physical Ageing in Chalcogenide Glasses. J.Optoelectron. Adv. M. 2001, 3, 685−694.(417) Malek, J.; Svoboda, R.; Pustkova, P.; Cicmanec, P. Volumeand Enthalpy Relaxation of a-Se in the Glass Transition Region. J.Non-Cryst. Solids 2009, 355, 264−272.(418) Svoboda, R.; Pustkova, P.; Malek, J. Relaxation in Ge2Se98 andAs2Se98 Glasses. J. Non-Cryst. Solids 2010, 356, 447−455.(419) Svoboda, R.; Honcova, P.; Malek, J. Enthalpic Relaxation inGe2Sb2Se5 Glass. J. Non-Cryst. Solids 2012, 358, 804−809.(420) Svoboda, R.; Malek, J. Enthalpy Relaxation in Ge-Se GlassySystem. J. Therm. Anal. Calorim. 2013, 113, 831−842.(421) Svoboda, R.; Malek, J. Enthalpy Relaxation Kinetics of GeTe4Glass. J. Non-Cryst. Solids 2015, 422, 51−56.(422) Imran, M. M. A.; Bhandari, D.; Saxena, N. S. EnthalpyRecovery during Structural Relaxation of Se96In4 Chalcogenide Glass.Phys. B 2001, 293, 394−401.(423) Xu, D.; Liu, Y.; Tian, Y. J.; Wang, L. M. Communication:Enthalpy Relaxation in a Metal-organic Zeolite Imidazole Framework(ZIF-4) Glass-former. J. Chem. Phys. 2017, 146, 121101.(424) Zhou, C.; Stepniewska, M.; Longley, L.; Chater, P. A.; Keen,D. A.; Bennett, T. D.; Yue, Y. Z. Thermodynamic Features andEnthalpy Relaxation in a Metal-organic Framework Glass. Phys. Chem.Chem. Phys. 2018, 20, 18291−18296.(425) Ediger, M. D. Spatially Heterogeneous Dynamics inSupercooled Liquids. Annu. Rev. Phys. Chem. 2000, 51, 99−128.
(426) Sillescu, H. Heterogeneity at the Glass Transition: A Review.J. Non-Cryst. Solids 1999, 243, 81−108.(427) Glotzer, S. C. Spatially Heterogeneous Dynamics in Liquids:Insights from Simulation. J. Non-Cryst. Solids 2000, 274, 342−355.(428) Matharoo, G. S.; Razul, M. S. G.; Poole, P. H. Structural andDynamical Heterogeneity in a Glass-forming Liquid. Phys. Rev. E2006, 74, No. 050502(R).(429) Huo, L. S.; Zeng, J. F.; Wang, W. H.; Liu, C. T.; Yang, Y. TheDependence of Shear Modulus on Dynamic Relaxation and Evolutionof Local Structural Heterogeneity in a Metallic Glass. Acta Mater.2013, 61, 4329−4338.(430) Li, W. D.; Bei, H.; Tong, Y.; Dmowski, W.; Gao, Y. F.Structural Heterogeneity Induced Plasticity in Bulk Metallic Glasses:From Well-relaxed Fragile Glass to Metal-like Behavior. Appl. Phys.Lett. 2013, 103, 171910.(431) Yue, Y. Z. Experimental Evidence for the Existence of anOrdered Structure in a Silicate Liquid above Its Liquidus Temper-ature. J. Non-Cryst. Solids 2004, 345−346, 523−527.(432) Yue, Y. Z. Calorimetric Studies of the StructuralHeterogeneity of Silicate Liquids. Ceram. Trans. 2004, 170, 31−45.(433) Liu, Y. H.; Wang, D.; Nakajima, K.; Zhang, W.; Hirata, A.;Nishi, T.; Inoue, A.; Chen, M. W. Characterization of NanoscaleMechanical Heterogeneity in a Metallic Glass by Dynamic ForceMicroscopy. Phys. Rev. Lett. 2011, 106, 125504.(434) Schmidt-Rohr, K.; Spiess, H. W. Nature of NonexponentialLoss of Correlation above the Glass Transition Investigated byMultidimensional NMR. Phys. Rev. Lett. 1991, 66, 3020.(435) Li, M. Z.; Wang, C. Z.; Hao, S. G.; Kramer, M. J.; Ho, K. M.Structural Heterogeneity and Medium-range Order in ZrxCu100−xMetallic Glasses. Phys. Rev. B: Condens. Matter Mater. Phys. 2009,80, 184201.(436) Hu, L. N.; Yue, Y. Z.; Zhang, C. Z. Abnormal Sub-Tg EnthalpyRelaxation in the CuZrAl Metallic Glasses Far from Equilibrium. Appl.Phys. Lett. 2011, 98, 081904.(437) Hu, L. N.; Zhou, C.; Zhang, C. Z.; Yue, Y. Z. ThermodynamicAnomaly of the Sub-Tg Relaxation in Hyperquenched MetallicGlasses. J. Chem. Phys. 2013, 138, 174508.(438) Yue, Y. Z. Features of the Relaxation in HyperquenchedInorganic Glasses during Annealing. Phys. Chem. Glasses 2005, 46,354−358.(439) Zhang, Y. F.; Zhao, D. H.; Yue, Y. Z. Phase Transitions andGlass Transition in a Hyperquenched Silica-alumina Glass. J. Am.Ceram. Soc. 2017, 100, 3434−3439.(440) Zhang, Y. F.; Liu, S. J.; Tao, H. Z.; Zhao, D. H.; Yue, Y. Z.Structural Response to Sub-Tg Annealing in a hyperquenched SiO2-Al2O3 Glass. J. Alloys Compd. 2018, 741, 331−336.(441) Takahashi, Y.; Osada, M.; Masai, H.; Fujiwara, T. StructuralHeterogeneity and Homogeneous Nucleation of 1BaO-2SiO2 glass.Appl. Phys. Lett. 2009, 94, 211907.(442) Kjeldsen, J.; Yue, Y. Z.; Bragatto, C. B.; Rodrigues, A. C. M.Electronic Conductivity of Vanadium-Tellurite Glass-Ceramics. J.Non-Cryst. Solids 2013, 378, 196−200.(443) Zhang, Y. F.; Wang, P. X.; Li, G. D.; Fan, J. H.; Gao, C. W.;Wang, Z. Y.; Yue, Y. Z. Clarifying the Charging Induced Nucleation inGlass Anode of Li-ion Batteries and Its Enhanced Performances. NanoEnergy 2019, 57, 592−599.(444) Zhang, Y. F.; Wang, P. X.; Zheng, T.; Li, D. M.; Li, G. D.; Yue,Y. Z. Enhancing Li-ion Battery Anode Performances via Disorder/order Engineering. Nano Energy 2018, 49, 596−602.(445) Zhou, C.; Hu, L. N.; Sun, Q. J.; Zheng, H. J.; Zhang, C. Z.;Yue, Y. Z. Structural Evolution during Fragile-to-strong Transition inCuZr(Al) Glass-forming Liquids. J. Chem. Phys. 2015, 142, 064508.(446) Huth, H.; Minakov, A. A.; Serghei, A.; Kremer, F.; Schick, C.Differential AC-chip Calorimeter for Glass Transition Measurementsin Ultra Thin Polymeric Films. Eur. Phys. J.: Spec. Top. 2007, 141,153−160.(447) Zhou, D.; Huth, H.; Gao, Y.; Xue, G.; Schick, C. CalorimetricGlass Transition of Poly(2,6-dimethyl-1,5-phenylene oxide) ThinFilms. Macromolecules 2008, 41, 7662−7666.
Chemical Reviews Review
DOI: 10.1021/acs.chemrev.8b00510Chem. Rev. XXXX, XXX, XXX−XXX
CH

(448) Dhotel, A.; Rijal, B.; Delbreilh, L.; Dargent, E.; Saiter, A.Combining Flash DSC, DSC and Broadband Dielectric Spectroscopyto Determine Fragility. J. Therm. Anal. Calorim. 2015, 121, 453−461.(449) Pilar, R.; Honcova, P.; Schulz, G.; Schick, C.; Malek, J.Enthalpy Relaxation of Selenium Observed by Fast ScanningCalorimetry. Thermochim. Acta 2015, 603, 142−148.(450) Pogatscher, S.; Leutenegger, D.; Hagmann, A.; Uggowitzer, P.J.; Loffler, J. F. Characterization of Bulk Metallic Glasses via FastDifferential Scanning Calorimetry. Thermochim. Acta 2014, 590, 84−90.(451) Gao, S.; Koh, Y. P.; Simon, S. L. Calorimetric Glass Transitionof Single Polystyrene Ultrathin Films. Macromolecules 2013, 46, 562−570.(452) Gao, S.; Simon, S. L. Measurement of the Limiting FictiveTemperature over Five Decades of Cooling and Heating Rates.Thermochim. Acta 2015, 603, 123−127.(453) Shamim, N.; Koh, Y. P.; Simon, S. L.; McKenna, G. B. GlassTransition Temperature of Thin Polycarbonate Films Measured byFlash Differential Scanning Calorimetry. J. Polym. Sci., Part B: Polym.Phys. 2014, 52, 1462−1468.(454) Schawe, J. E. K. Measurement of the Thermal Glass Transitionof Polystyrene in A Cooling Rate Range of More than Six Decades.Thermochim. Acta 2015, 603, 128−134.(455) Williams, M. L.; Landel, R. F.; Ferry, J. D. The TemperatureDependence of Relaxation Mechanisms in Amorphous Polymers andOther Glass-forming Liquids. J. Am. Chem. Soc. 1955, 77, 3701−3707.(456) Fakhraai, Z.; Forrest, J. A. Probing Slow Dynamics inSupported Thin Polymer Films. Phys. Rev. Lett. 2005, 95, 025701.(457) Arranz-Andres, J.; Cerrada, M. L.; Perez, E. Fast ScanningCalorimetry Study of the Structural Relaxation in A RandomPropylene-co-1-octene Copolymer. Thermochim. Acta 2015, 603,116−122.(458) Androsch, R.; Schick, C.; Schmelzer, J. W. P. Sequence ofEnthalpy Relaxation, Homogeneous Crystal Nucleation and CrystalGrowth in Glassy Polyamide 6. Eur. Polym. J. 2014, 53, 100−108.(459) Wang, J. Q.; Shen, Y.; Perepezko, J. H.; Ediger, M. D.Increasing the Kinetic Stability of Bulk Metallic Glasses. Acta Mater.2016, 104, 25−32.(460) Wang, J. Q.; Chen, N.; Liu, P.; Wang, Z.; Louzguine-Luzgin,D. V.; Chen, M. W.; Perepezko, J. H. The Ultrastable KineticBehavior of An Au-based Nanoglass. Acta Mater. 2014, 79, 30−36.(461) Monnier, X.; Saiter, A.; Dargent, E. Physical Aging in PLAthrough Standard DSC and Fast Scanning Calorimetry Investigations.Thermochim. Acta 2017, 648, 13−22.(462) Badrinarayanan, P.; Zheng, W.; Li, Q.; Simon, S. L. The GlassTransition Temperature versus the Fictive Temperature. J. Non-Cryst.Solids 2007, 353, 2603−2612.(463) Evans, C. M.; Deng, H.; Jager, W. F.; Torkelson, J. M. Fragilityis a Key Parameter in Determining the Magnitude of Tg-ConfinementEffects in Polymer Films. Macromolecules 2013, 46, 6091−6103.(464) Vogel, H. The Law of the Relation between the Viscosity ofLiquids and the Temperature. Phys. Z. 1921, 22, 645−646.(465) Koh, Y. P.; Grassia, L.; Simon, S. L. Structural Recovery of ASingle Polystyrene Thin Film using Nanocalorimetry to Extend theAging Time and Temperature Range. Thermochim. Acta 2015, 603,135−141.(466) Koh, Y. P.; Gao, S.; Simon, S. L. Structural Recovery of ASingle Polystyrene Thin Film using Flash DSC at Low AgingTemperatures. Polymer 2016, 96, 182−187.(467) Koh, Y. P.; Simon, S. L. The Glass Transition and EnthalpyRecovery of A Single Polystyrene Ultrathin Film using Flash DSC. J.Chem. Phys. 2017, 146, 203329.(468) Echeverría, I.; Kolek, P. L.; Plazek, D. J.; Simon, S. L. EnthalpyRecovery: Creep and Creep-recovery Measurements during PhysicalAging of Amorphous Selenium. J. Non-Cryst. Solids 2003, 324, 242−255.(469) Svoboda, R.; Pustkova, P.; Malek, J. Relaxation Behavior ofGlassy Selenium. J. Phys. Chem. Solids 2007, 68, 850−854.
(470) Matsuishi, K.; Nogi, K.; Ogura, H.; Onari, S.; Arai, T.Dynamics of Glass Transition of Bulk a-Se and Se ClustersIncorporated into Zeolites. J. Non-Cryst. Solids 1998, 230, 799−803.(471) Svoboda, R.; Pustkova, P.; Malek, J. Volume Relaxation of a-Se Studied by Mercury Dilatometry. J. Non-Cryst. Solids 2006, 352,4793−4799.(472) Cubeta, U. S. Fast Scanning Calorimetry Studies of MolecularDynamics in Crystals, Liquids, and Glasses. The George WashingtonUniversity, Ph.D. thesis, 2018.(473) Ediger, M. D.; Angell, C. A.; Nagel, S. R. Supercooled Liquidsand Glasses. J. Phys. Chem. 1996, 100, 13200−13212.(474) Schawe, J. E. K. A. Comparison of Different EvaluationMethods in Modulated Temperature DSC. Thermochim. Acta 1995,260, 1−16.(475) Schawe, J. E. K. Principles for the Interpretation of ModulatedTemperature DSC measurements. Part 1. Glass transition. Thermo-chim. Acta 1995, 261, 183−194.(476) Birge, N. O.; Nagel, S. R. Specific-Heat Spectroscopy of theGlass Transition. Phys. Rev. Lett. 1985, 54, 2674.(477) Birge, N. O. Specific-heat Spectroscopy of Glycerol andPropylene Glycol near the Glass Transition. Phys. Rev. B: Condens.Matter Mater. Phys. 1986, 34, 1631−1642.(478) Mauro, J. C.; Loucks, R. J.; Sen, S. Response to “Comment on‘Heat Capacity, Enthalpy Fluctuations, and Configurational Entropyin Broken Ergodic Systems’” [J. Chem. Phys. 134, 147101 (2011)]. J.Chem. Phys. 2011, 134, 147102.(479) Gulbiten, O.; Mauro, J. C.; Guo, X.; Boratav, O. N. ViscousFlow of Medieval Cathedral Glass. J. Am. Ceram. Soc. 2018, 101, 5−11.(480) Garden, J. L. Macroscopic Non-equilibrium Thermodynamicsin Dynamic Calorimetry. Thermochim. Acta 2007, 452, 85−105.(481) Toll, J. S. Causality and the Dispersion Relation: LogicalFoundations. Phys. Rev. 1956, 104, 1760−1770.(482) Schawe, J. E. K.; Hohne, G. W. H. The Analysis ofTemperature Modulated DSC Measurements by Means of the LinearResponse Theory. Thermochim. Acta 1996, 287, 213−223.(483) Reading, M. The Use of Modulated Temperature Programs inThermal Methods. J. Therm. Anal. Calorim. 2001, 64, 7.(484) Yang, G.; Gulbiten, O.; Gueguen, Y.; Bureau, B.; Sangleboeuf,J.-C.; Roiland, C.; King, E. A.; Lucas, P. Fragile-strong Behavior in theAsxSe1‑x Glass Forming System in Relation to Structural Dimension-ality. Phys. Rev. B: Condens. Matter Mater. Phys. 2012, 85, 144107.(485) Simon, S. L.; McKenna, G. B. The Effects of StructuralRecovery and Thermal Lag in Temperature-nodulated DSC Measure-ments. Thermochim. Acta 1997, 307, 1−10.(486) Simon, S. L.; McKenna, G. B. Quantitative Analysis of Errorsin TMDSC in the Glass Transition Region. Thermochim. Acta 2000,348, 77−89.(487) Bechgaard, T. K.; Gulbiten, O.; Mauro, J. C.; Smedskjaer, M.M. Parametric Study of Temperature-modulated Differential ScanningCalorimetry for High-temperature Oxide Glasses with VaryingFragility. J. Non-Cryst. Solids 2018, 484, 84−94.(488) Lucas, P.; King, E. A.; Gulbiten, O.; Yarger, J. L.; Soignard, E.;Bureau, B. Bimodal Phase Percolation Model for the Structure of Ge-Se Glasses and the Existence of the Intermediate Phase. Phys. Rev. B:Condens. Matter Mater. Phys. 2009, 80, 214114.(489) Golovchak, R.; Jain, H.; Shpotyuk, O.; Kozdras, A.; Saiter, A.;Saiter, J. M. Experimental Verification of the Reversibility WindowConcept in Binary As-Se Glasses Subjected to A Long-term PhysicalAging. Phys. Rev. B: Condens. Matter Mater. Phys. 2008, 78, 014202.(490) Shpotyuk, O.; Kozdras, A.; Saiter, J.-M.; Golovchak, R.Comment on “Molecular Origin of Aging of Pure Se glass: Growth ofInter-chain Structural Correlations, Network Compaction, and PartialOrdering,”. J. Chem. Phys. 2018, 148, 157101.(491) Bhageria, R.; Gunasekera, K.; Boolchand, P.; Micoulau, t. M.Fragility and Molar Volumes of Non-stoichiometric Chalcogenides:The Crucial Role of Melt/Glass Homogenization. Phys. Status Solidi B2014, 251, 1322−1329.
Chemical Reviews Review
DOI: 10.1021/acs.chemrev.8b00510Chem. Rev. XXXX, XXX, XXX−XXX
CI

(492) Cernoskova, E.; Qu, T.; Mamedov, S.; Cernosek, Z.;Holubova, J.; Boolchand, P. Reversibility Window in As-quenchedGe-As-S Glasses. J. Phys. Chem. Solids 2005, 66, 185−189.(493) Feng, X.; Bresser, W. J.; Boolchand, P. Direct Evidence forStiffness Threshold in Chalcogenide Glasses. Phys. Rev. Lett. 1997, 78,4422−4425.(494) Georgiev, D. G.; Boolchand, P.; Micoulaut, M. RigidityTransitions and Molecular Structure of AsxSe1‑x Glasses. Phys. Rev. B:Condens. Matter Mater. Phys. 2000, 62, R9228−R9231.(495) Bhosle, S.; Gunasekera, K.; Boolchand, P.; Micoulaut, M. MeltHomogenization and Self-Organization in Chalcogenides-Part II. Int.J. Appl. Glass. Sci. 2012, 3, 205−220.(496) Vempati, U.; Boolchand, P. The Thermally Reversing Windowin Ternary Gex Px S1−2x Glasses. J. Phys.: Condens. Matter 2004, 16,S5121.(497) Wang, Y.; Wells, J.; Georgiev, D. G.; Boolchand, P.; Jackson,K.; Micoulaut, M. Sharp Rigid to Floppy Phase Transition Induced byDangling Ends in a Network Glass. Phys. Rev. Lett. 2001, 87, 185503.(498) Taylor, H. E. The Dielectric Relaxation Spectrum of Glass.Trans. Faraday Soc. 1956, 52, 873−881.(499) Kakiuchida, H.; Saito, K.; Ikushima, A. J. Dielectric Relaxationin Silica Glass. J. Appl. Phys. 1999, 86, 5983−5987.(500) Simon, S. L.; McKenna, G. B. Interpretation of the dynamicheat capacity observed in glass-forming liquids. J. Chem. Phys. 1997,107, 8678−8685.(501) Reading, M. Comments on “A Comparison of DifferentEvaluation Methods in Modulated-Temperature DSC”. Thermochim.Acta 1997, 292, 179−187.(502) Guo, X.; Mauro, J. C.; Allan, D. C.; Yue, Y. On the FrequencyCorrection in Temperature-Modulated Differential Scanning Calo-rimetry of the Glass Transition. J. Non-Cryst. Solids 2012, 358, 1710−1715.(503) Carpentier, L.; Bustin, O.; Descamps, M. Temperature-modulated Differential Scanning Calorimetry as a Specific HeatSpectroscopy. J. Phys. D: Appl. Phys. 2002, 35, 402.(504) Alvarez, C.; Moura-Ramos, J. J. The Glass TransitionRelaxation in a Side-chain Liquid Crystalline Polymer Studied byModulated Temperature Differential Scanning Calorimetry. Phys.Chem. Chem. Phys. 2000, 2, 4743−4747.(505) Yang, G.; Bureau, B.; Rouxel, T.; Gueguen, Y.; Gulbiten, O.;Roiland, C.; Soignard, E.; Yarger, J. L.; Troles, J.; Sangleboeuf, J.-C.;Lucas, P. Correlation between Structure and Physical Properties ofChalcogenide Glasses in the AsxSe1‑x System. Phys. Rev. B: Condens.Matter Mater. Phys. 2010, 82, 195206.(506) Hutchinson, J. M.; Tong, A. B.; Jiang, Z. Aging ofPolycarbonate Studied by Temperature Modulated DifferentialScanning Calorimetry. Thermochim. Acta 1999, 335, 27−42.(507) Golovchak, R.; Oelgoetz, J.; Vlcek, M.; Esposito, A.; Saiter, A.;Saiter, J.-M.; Jain, H. Complex Structural Rearrangements in As-SeGlasses. J. Chem. Phys. 2014, 140, 054505.(508) Mauro, J. C.; Uzun, S. S.; Bras, W.; Sen, S. NonmonotonicEvolution of Density Fluctuations during Glass Relaxation. Phys. Rev.Lett. 2009, 102, 155506.(509) Fukawa, Y.; Matsuda, Y.; Kawashima, M.; Kojima, S.Determination of Complex-specific Heat and Fragility of SodiumBorate Glasses by Temperature-modulated DSC. J. Therm. Anal.Calorim. 2010, 99, 39−44.(510) Bechgaard, T. K.; Gulbiten, O.; Mauro, J. C.; Hu, Y.; Bauchy,M.; Smedskjær, M. M. Temperature-modulated Differential ScanningCalorimetry Analysis of High-temperature Silicate Glasses. Am.Ceram. Soc. Bull. 2018, 97, 31−33.(511) Matsuda, Y.; Fukawa, Y.; Ike, Y.; Kodama, M.; Kojima, S.Dynamic Specific Heat, Glass Transition, and Non-Debye Nature ofThermal Relaxation in Lithium Borate Glasses. J. Phys. Soc. Jpn. 2008,77, 084602.(512) Cole, K. S.; Cole, R. H. Dispersion and Absorption inDielectrics I. Alternating Current Characteristics. J. Chem. Phys. 1941,9, 341−351.
(513) Havriliak, S.; Negami, S. A Complex Plane Representation ofDielectric and Mechanical Relaxation Processes in Some Polymers.Polymer 1967, 8, 161−210.(514) Alvarez, F.; Alegra, A.; Colmenero, J. Relationship betweenthe Time-domain Kohlrausch-Williams-Watts and Frequency-domainHavriliak-Negami Relaxation Functions. Phys. Rev. B: Condens. MatterMater. Phys. 1991, 44, 7306−7312.(515) Boolchand, P.; Goodman, B. Glassy Materials with EnhancedThermal Stability. MRS Bull. 2017, 42, 23−28.(516) Selvanathan, D.; Bresser, W. J.; Boolchand, P.; Goodman, B.Thermally Reversing Window and Stiffness Transitions in Chalcoge-nide Glasses. Solid State Commun. 1999, 111, 619−624.(517) Shatnawi, M. T. M.; Farrow, C. L.; Chen, P.; Boolchand, P.;Sartbaeva, A.; Thorpe, M. F.; Billinge, S. J. L. Search for a StructuralResponse to the Intermediate Phase in GexSe1‑x Glasses. Phys. Rev. B:Condens. Matter Mater. Phys. 2008, 77, 094134.(518) Zeidler, A.; Salmon, P. S.; Whittaker, D. A. J.; Pizzey, K. J.;Hannon, A. C. Topological Ordering and Viscosity in the Glass-Forming Ge-Se System: The Search for a Structural or DynamicalSignature of the Intermediate Phase. Front. Mater. 2017, 4, 32.(519) Mauro, J. C.; Varshneya, A. K. Multiscale Modeling of ArsenicSelenide Glass. J. Non-Cryst. Solids 2007, 353, 1226−1231.(520) Bhosle, S.; Gunasekera, K.; Boolchand, P.; Micoulaut, M. MeltHomogenization and Self-Organization in Chalcogenides-Part II. Int.J. Appl. Glass. Sci. 2012, 3, 205−220.(521) Li, P.; Zhang, Y.; Chen, Z.; Gao, P.; Wu, T.; Wang, L.-M.Relaxation Dynamics in the Strong Chalcogenide Glass-former ofGe22Se78. Sci. Rep. 2017, 7, 40547.(522) Gunasekera, K.; Bhosle, S.; Boolchand, P.; Micoulaut, M.Superstrong Nature of Covalently Bonded Glass-forming Liquids atSelect Compositions. J. Chem. Phys. 2013, 139, 164511.(523) Karpukhina, N.; Hill, R. G.; Law, R. V. Crystallisation inOxide Glasses - A Tutorial Review. Chem. Soc. Rev. 2014, 43, 2174−2186.(524) Komatsu, T. Design and Control of Crystallization in OxideGlasses. J. Non-Cryst. Solids 2015, 428, 156−175.(525) Rodrigues, A. M.; Cassar, D. R.; Fokin, V. M.; Zanotto, E. D.Crystal Growth and Viscous Flow in Barium Disilicate Glass. J. Non-Cryst. Solids 2018, 479, 55−61.(526) Zanotto, E. D. Glass Crystallization Research - A 36-YearRetrospective. Part I, Fundamental Studies. Int. J. Appl. Glass Sci.2013, 4, 105−116.(527) Zanotto, E. D. Glass Crystallization Research - A 36-YearRetrospective. Part II, Methods Of Study And Glass-Ceramics. Int. J.Appl. Glass Sci. 2013, 4, 117−124.(528) Holand, W.; Beall, G. Glass-ceramic Technology, 2nd ed.; TheAmerican Ceramic Society & John Wiley and Sons Inc.: USA, 2012.(529) Zanotto, E. D. A. Bright Future for Glass-Ceramics. Am.Ceram. Soc. Bull. 2010, 89, 19−27.(530) Montazerian, M.; Zanotto, E. D. A Guided Walk throughLarry Hench’s Monumental Discoveries. J. Mater. Sci. 2017, 52,8695−8732.(531) Montazerian, M.; Zanotto, E. D. Bioactive and Inert DentalGlass-Ceramics. J. Biomed. Mater. Res., Part A 2017, 105, 619−639.(532) Montazerian, M.; Zanotto, E. D. History and Trends ofBioactive Glass-Ceramics. J. Biomed. Mater. Res., Part A 2016, 104,1231−1249.(533) Fokin, V. M.; Yuritsyn, N. S.; Zanotto, E. D. Nucleation andCrystallization Kinetics in Silicate Glasses: Theory and Experiment. InNucleation Theory and Applications; Schmelzer, J. W. P., Ed.; Wiley:USA, 2005; pp 74−125.(534) Zanotto, E. D.; Tsuchida, J. E.; Schneider, J. F.; Eckert, H.Thirty-year Quest for Structure-Nucleation Relationships in OxideGlasses. Int. Mater. Rev. 2015, 60, 376−391.(535) Schmelzer, J. W. P. Introduction. In Nucleation Theory andApplications; Schmelzer, J. W. P., Ropke, G., Priezzhev, V. B., Eds.;Joint Institute for Nuclear Research Publishing House: Dubna, Russia,1999; p 1.
Chemical Reviews Review
DOI: 10.1021/acs.chemrev.8b00510Chem. Rev. XXXX, XXX, XXX−XXX
CJ
(536) Tammann, G. Uber die Abhangigkeit der Zajl der Kerne. Z.Phys. Chem. 1898, 25, 441−479.(537) Fokin, V. M.; Zanotto, E. D.; Yuritsyn, N. S.; Schmelzer, J. W.P. Homogeneous Crystal Nucleation in Silicate Glasses: A 40 YearsPerspective. J. Non-Cryst. Solids 2006, 352, 2681−2714.(538) Marotta, A.; Buri, A.; Branda, F. Nucleation in Glass andDifferential Thermal Analysis. J. Mater. Sci. 1981, 16, 341−344.(539) Marotta, A.; Buri, A.; Branda, F.; Saiello, S. Nucleation andCrystallization of Li2O.2SiO2 Glass - A DTA Study. Adv. Ceram. 1982,4, 146−152.(540) Marotta, A.; Buri, A.; Branda, F.; Saiello, S. Nucleation inGlass-Forming Systems. A DTA Study. Thermochim. Acta 1985, 85,231−234.(541) Ray, C. S.; Day, D. E. Determining the Nucleation Rate Curvefor Lithium Disilicate Glass by Differential Thermal Analysis. J. Am.Ceram. Soc. 1990, 73, 439−442.(542) Xu, X. J.; Ray, C. S.; Day, D. E. Nucleation and Crystallizationof Na2O·2CaO·3SiO2 Glass by Differential Thermal Analysis. J. Am.Ceram. Soc. 1991, 74, 909−914.(543) Ray, C. S.; Day, D. E. An Analysis of Nucleation-Rate Type ofCurves in Glass as Determined by Differential Thermal Analysis. J.Am. Ceram. Soc. 1997, 80, 3100−3108.(544) Weinberg, M. C. Interpretation of DTA Experiments Used forCrystal Nucleation Rate Determinations. J. Am. Ceram. Soc. 1991, 74,1905−1909.(545) Kelton, K. F. Estimation of the Nucleation Rate by DifferentialScanning Calorimetry. J. Am. Ceram. Soc. 1992, 75, 2449−2452.(546) Fokin, V. M.; Cabral, A. A.; Reis, R. M. C. V.; Nascimento, M.L. F.; Zanotto, E. D. Critical Assessment of DTA-DSC Methods forthe Study of Nucleation Kinetics in Glasses. J. Non-Cryst. Solids 2010,356, 358−367.(547) Xia, X.; Dutta, I.; Mauro, J. C.; Aitken, B. G.; Kelton, K. F.Temperature Dependence of Crystal Nucleation in BaO·2SiO2 and5BaO·8SiO2 Glasses Using Differential Thermal Analysis. J. Non-Cryst. Solids 2017, 459, 45−50.(548) Ray, C. S.; Fang, X.; Day, D. E. New Method for Determiningthe Nucleation and Crystal-Growth Rates in Glasses. J. Am. Ceram.Soc. 2000, 83, 865−872.(549) Ranasinghe, K. S.; Ray, C. S.; Day, D. E. A GeneralizedMethod for Determining the Crystal Nucleation and Growth Rates inGlasses by Differential Thermal Analysis. J. Mater. Sci. 2002, 37, 547−555.(550) Johnson, W. A.; Mehl, R. F. Reaction Kinetics in Processes ofNucleation and Growth. Am. Inst. Min. Metall. Eng. 1939, 135, 416−458.(551) Avrami, M. Kinetics of Phase Change. I: General Theory. J.Chem. Phys. 1939, 7, 1103−1112.(552) Yerofyeyev, B. V. Generalized Equation of Chemical Kineticsand Its Application to the Solid-State Reactions. Dokl. Akad. NaukUSSR 1964, 52, 511 (in Russian). .(553) Kolmogorov, A. N. Statistical Theory of Crystallization ofMetals. Izv. Akad. Nauk. USSR 1937, 1, 355 (in Russian). .(554) Ranasinghe, K. S.; Wei, P. F.; Kelton, K. F.; Ray, C. S.; Day, D.E. Verification of an Analytical Method for Measuring CrystalNucleation Rates in Glasses from DTA Data. J. Non-Cryst. Solids2004, 337, 261−267.(555) Cabral, A. A.; Ferreira, E. B.; Villas-Boas, M. O. C.; Zanotto,E. D. On the Determination of the Concentration of Crystal Nuclei inGlasses by DSC. J. Am. Ceram. Soc. 2013, 96, 2817−2823.(556) Deubener, J.; Montazerian, M.; Kruger, S.; Peitl, O.; Zanotto,E. D. Heating Rate Effects in Time-Dependent HomogeneousNucleation in Glasses. J. Non-Cryst. Solids 2017, 474, 1−8.(557) Ranasinghe, K. S.; Ray, C. S.; Day, D. E.; Humble, G.Heterogeneous Nucleation on Platinum Doped Li2O·2SiO2 Glass byDifferential Thermal Analysis. J. Non-Cryst. Solids 2017, 473, 141−146.(558) Gupta, P. K.; Baranta, G.; Denry, I. L. DTA Peak Shift Studiesof Primary Crystallization in Glasses. J. Non-Cryst. Solids 2003, 317,254−269.
(559) Uttormark, M. J.; Zanter, J. W.; Perepezko, J. H. RepeatedNucleation In an Undercooled Aluminum Droplet. J. Cryst. Growth1997, 177, 258−264.(560) Wilde, G.; Sebright, J. L.; Perepezko, J. H. Bulk LiquidUndercooling and Nucleation in Gold. Acta Mater. 2006, 54, 4759−4769.(561) Yang, D.; Abyzov, A. S.; Zhuravlev, E.; Gao, Y.; Schmelzer, J.W. P.; Schick, C. Size and Rate Dependence of Crystal Nucleation inSingle Tin Drops by Fast Scanning Calorimetry. J. Chem. Phys. 2013,138, 054501.(562) Heneghan, A. F.; Wilson, P. W.; Haymet, A. D. J.Heterogeneous Nucleation of Supercooled Water, and the Effect ofan Added Catalyst. Proc. Natl. Acad. Sci. U. S. A. 2002, 99, 9631−9634.(563) Maeda, M.; Wells, D.; Becker, N. C.; Hartley, P. G.; Wilson, P.W.; Haymet, A. D. J.; Kozielski, K. A. Development of a HighPressure Automated Lag Time Apparatus for Experimental Studiesand Statistical Analyses of Nucleation and Growth of Gas Hydrates.Rev. Sci. Instrum. 2011, 82, 065109.(564) Kruger, S.; Deubener, J. Stochastic Nature of the Liquid-To-Crystal Heterogeneous Nucleation of Supercooled Lithium DisilicateLiquid. J. Non-Cryst. Solids 2014, 388, 6−9.(565) Kruger, S.; Deubener, J. The TTT Curves of theHeterogeneous and Homogeneous Crystallization of LithiumDisilicate − A Stochastic Approach to Crystal Nucleation. Front.Mater. 2016, 3, 42.(566) Perepezko, J. H.; Hebert, R. J.; Tong, W. S.; Hamann, J.;Rosner, H. R.; Wilde, G. Nanocrystallization Reactions in AmorphousAluminum Alloys. Mater. Trans. 2003, 44, 1982−1992.(567) Sieber, H.; Park, J. S.; Weissmuller, J.; Perepezko, J. H.Structural Evolution and Phase Formation in Cold-rolled Aluminum-nickel Multilayers. Acta Mater. 2001, 49, 1139−1151.(568) Kruger, S.; Deubener, J. Heterogeneous Surface Nucleation ofLithium Disilicate Glass: An Isothermal DSC Study. J. Non-Cryst.Solids 2015, 417−418, 45−51.(569) Kruger, S.; Deubener, J. Lag Time to Crystal Nucleation ofSupercooled Lithium Disilicate Melts: A Test of the ClassicalNucleation Theory. J. Non-Cryst. Solids 2015, 426, 1−6.(570) Kruger, S.; Deubener, J. Thermal analysis of Repetitive SingleCrystallization Events in Glass-forming Liquids at Low Undercooling.J. Non-Cryst. Solids 2018, 501, 36−42.(571) Reis, R. M. C. V.; Fokin, V. M.; Zanotto, E. D. Determinationof Crystal Growth Rates in Glasses over a Temperature Range Using aSingle DSC Run. J. Am. Ceram. Soc. 2016, 99, 2001−2008.(572) Moesgaard, M.; Pedersen, H. D.; Yue, Y. Z.; Nielsen, E. R.Crystallization in Stone Wool Fibres. J. Non-Cryst. Solids 2007, 353,1101−1108.(573) Neuville, D. R., Cormier, L., Caurant, D., Montagne, L., Eds.From Glass to Crystal. Nucleation, Growth and Phase Separation: FromResearch to Applications, 1st ed.; EDP Sciences: Les Ulis, 2017.(574) Illekova, E.; Sestak, J. Crystallization of Metallic Micro-,Nano-, and Non-Crystalline Alloys. In Thermal Analysis of Micro,Nano- and Non-Crystalline Materials: Transformation, Crystallization,Kinetics and Thermodynamics; Sestak, J., Simon, P., Eds.; Springer:Netherlands, 2013; Chapter 13.(575) Ray, C. S.; Huang, W.; Day, D. E. Crystallization Kinetics of aLithia−Silica Glass: Effect of Sample Characteristics and ThermalAnalysis Measurement Techniques. J. Am. Ceram. Soc. 1991, 74, 60−66.(576) Ray, C. S.; Zhang, T.; Reis, S. T.; Brow, R. K. DeterminingKinetic Parameters for Isothermal Crystallization of Glasses. J. Am.Ceram. Soc. 2007, 90, 769−773.(577) Blaine, R. L.; Kissinger, H. E. Homer Kissinger and theKissinger Equation. Thermochim. Acta 2012, 540, 1−6.(578) Marques, L. E.; Costa, A. M. C.; Crovace, M. C.; Rodrigues, A.C. M.; Cabral, A. A. Influence of Particle Size on NonisothermalCrystallization in a Lithium Disilicate Glass. J. Am. Ceram. Soc. 2015,98, 774−780.
Chemical Reviews Review
DOI: 10.1021/acs.chemrev.8b00510Chem. Rev. XXXX, XXX, XXX−XXX
CK
(579) Ozawa, T. Kinetics of Non-Isothermal Crystallization. Polymer1971, 12, 150−158.(580) Augis, J. A.; Bennett, J. E. Calculation of the AvramiParameters for Heterogeneous Solid-State Reactions Using aModification of the Kissinger Method. J. Therm. Anal. Calorim.1978, 13, 283−292.(581) Piloyan, G. O.; Ryabchikov, I. D.; Novikova, O. S.Determination of Activation Energies of Chemical Reactions byDifferential Thermal Analysis. Nature 1966, 212, 1229.(582) Borchardt, H. J. Initial Reaction Rates from DTA. J. Inorg.Nucl. Chem. 1960, 12, 252−254.(583) Coats, A. W.; Redfern, J. P. Kinetic Parameters fromThermogravimetric Data. Nature 1964, 201, 68−69.(584) Sestak, J. Applicability of DTA to the Study of CrystallisationKinetics of Glasses. Phys. Chem. Glasses 1974, 15, 137−140.(585) Sestak, J. On the Applicability of the P(X)-Function to theDetermination of Reaction Kinetics under Non-Isothermal Con-ditions. Thermochim. Acta 1971, 3, 150−154.(586) Ligero, R. A.; Vazques, J.; Villares, P.; Jimenez-Garay, R. AStudy of the Crystallization Kinetics of Some Cu−As−Te Glasses. J.Mater. Sci. 1991, 26, 211−215.(587) Vyazovkin, S.; Burnham, A. K.; Criado, J. M.; Perez-Maqueda,L. A.; Popescu, C.; Sbirrazzuoli, N. ICTAC Kinetics CommitteeRecommendations for Performing Kinetic Computations on ThermalAnalysis Data. Thermochim. Acta 2011, 520, 1−19.(588) Vyazovkin, S.; Chrissafis, K.; Di Lorenzo, M. L.; Koga, N.;Pijolat, M.; Roduit, B.; Sbirrazzuoli, N.; Sunol, J. J. ICTAC KineticsCommittee Recommendations for Collecting Experimental ThermalAnalysis Data for Kinetic Computations. Thermochim. Acta 2014, 590,1−23.(589) Henderson, D. W. Thermal Analysis of Non-IsothermalCrystallization Kinetics in Glass Forming Liquids. J. Non-Cryst. Solids1979, 30, 301−315.(590) Henderson, D. W. Experimental Analysis of Non-IsothermalTransformations Involving Nucleation and Growth. J. Therm. Anal.1979, 15, 325−331.(591) Matusita, K.; Sakka, S. Kinetic Study of The Crystallisation ofGlass By Differential Scanning Calorimetry. Phys. Chem. Glasses 1979,20, 81−84.(592) Yinnon, H.; Uhlmann, D. R. Applications of ThermoanalyticalTechniques to the Study of Crystallization Kinetics in Glass-FormingLiquids, Part I: Theory. J. Non-Cryst. Solids 1983, 54, 253−275.(593) Malek, J. The Applicability of Johnson-Mehl-Avrami Model inthe Thermal Analysis of the Crystallization Kinetics of Glasses.Thermochim. Acta 1995, 267 (C), 61−73.(594) Sestak, J. The Quandary Aspects of Non-Isothermal KineticsBeyond the ICTAC Kinetics Committee Recommendations.Thermochim. Acta 2015, 611, 26−35.(595) Koga, N.; Sestak, J.; Strnad, Z. Kinetics of Crystallization inthe Soda-Lime-Silica System? Part 1. Na2O.CaO.2SiO2 andNa2O.CaO.3SiO2 Glasses. Thermochim. Acta 1992, 203, 361−372.(596) Koga, N.; Sestak, J. Influence of Preliminary Nucleation on thePhysicogeometric Kinetics of Glass Crystallization. In ThermalAnalysis of Micro, Nano- and Non-Crystalline Materials: Transformation,Crystallization, Kinetics and Thermodynamic; Sestak, J., Simon, P., Eds.;Springer: Netherlands, 2013; Chapter 10.(597) Ozawa, T. Kinetics of Growth from Pre-Existing SurfaceNuclei. J. Therm. Anal. Calorim. 2005, 82, 687−690.(598) Everton, L. S.; Cabral, A. A. Determining the KineticParameters for Isothermal Crystallization in a Lithium Disilicate(LS2) Glass by OM And DSC. J. Am. Ceram. Soc. 2014, 97, 157−162.(599) Elder, J. P. The General Application of the Kissinger Equationin Thermal Analysis. J. Therm. Anal. 1985, 30, 657−669.(600) Boswell, P. G. On the Calculation of Activation EnergiesUsing a Modified Kissinger Method. J. Therm. Anal. 1980, 18, 353−358.(601) Matusita, K.; Sakka, S. Kinetic Study on Crystallization ofGlass by Differential Thermal Analysis: Criterion on Application ofKissinger Plot. J. Non-Cryst. Solids 1980, 38−39, 741−746.
(602) Matusita, K.; Komatsu, T.; Yokota, R. Kinetics of Non-Isothermal Crystallization Process and Activation Energy for CrystalGrowth in Amorphous Materials. J. Mater. Sci. 1984, 19, 291−296.(603) Ozawa, T. Nonisothermal Kinetics of Crystal Growth fromPre-existing Nuclei. Bull. Chem. Soc. Jpn. 1984, 57, 639−643.(604) Kemeny, T.; Sestak, J. Comparison of Crystallization KineticsDetermined by Isothermal and Nonisothermal Methods. Thermochim.Acta 1987, 110, 113−129.(605) Koga, N.; Sestak, J. Kinetic Modeling of Advanced InorganicGlass-Ceramics Formation by Crystal Growth from Pre-ExistingNuclei. J. Therm. Anal. Calorim. 2000, 60, 667−674.(606) Koga, N.; Sestak, J. Crystal Nucleation and Growth in LithiumDiborate Glass by Thermal Analysis. J. Am. Ceram. Soc. 2000, 83,1753−1760.(607) Koga, N.; Yamaguchi, K.; Sestak, J. Crystallization Kinetics ofLithium Diborate Glass by DTA. J. Therm. Anal. Calorim. 1999, 56,755−761.(608) Simon, P.; Thomas, P. S. Application of IsoconversionalMethods for the Processes Occurring in Glassy and AmorphousMaterials. In Thermal Analysis of Micro, Nano- and Non-CrystallineMaterials: Transformation, Crystallization, Kinetics and Thermodynam-ics; Sestak, J., Simon, P., Eds.; Springer: Netherlands, 2013; Chapter11.(609) Vyazovkin, S. Is The Kissinger Equation Applicable to theProcesses that Occur on Cooling? Macromol. Rapid Commun. 2002,23, 771−775.(610) Koga, N. Ozawa’s Kinetic Method for Analyzing Thermoa-nalytical Curves: History and Theoretical Fundamentals. J. Therm.Anal. Calorim. 2013, 113, 1527−1541.(611) Muller, R. The Influence of Grain Size on the Overall Kineticsof Surface-Induced Glass Crystallization. J. Therm. Anal. 1989, 35,823−835.(612) Sandu, C.; Singh, R. K. Modeling Differential ScanningCalorimetry. Thermochim. Acta 1990, 159, 267−298.(613) Reis, R. M. C. V.; Zanotto, E. D. Simple Model for ParticlePhase Transformation Kinetics. Acta Mater. 2018, 154, 228−236.(614) Fernandes, R. G.; Ferreira, E. B. The Shape of Diopside GlassParticles Probed by the Non-Isothermal Crystallization Kinetics andDifferential Scanning Calorimetry. J. Non-Cryst. Solids 2018, 497, 63−70.(615) Scherer, G. W. Glass and Amorphous Materials. In Mater. Sci.Technol. Cahn, R. W., Haasen, P., Kramer, E. J., Eds.; VCHPublications: New York, 1991; Vol. 9, Chapter 3.(616) Uhlmann, D. R.; Yinnon, H. Glass Science and Technology. InGlass Forming Systems; Uhlmann, D. R., Kreidl, N. J., Eds., Academic:New York, 1983; Vol. 1, Chapter 1.(617) Ray, C. S.; Reis, S. T.; Brow, R. K.; Holand, W.; Rheinberger,V. A New DTA Method for Measuring Critical Cooling Rate for GlassFormation. J. Non-Cryst. Solids 2005, 351, 1350−1358.(618) Weinberg, M. C.; Uhlmann, D. R.; Zanotto, E. D. “NoseMethod” of Calculating Critical Cooling Rates for Glass Formation. J.Am. Ceram. Soc. 1989, 72, 2054−2058.(619) Weinberg, M. C.; Zelinski, B. J.; Uhlmann, D. R.; Zanotto, E.D. Critical Cooling Rate Calculations for Glass Formation. J. Non-Cryst. Solids 1990, 123, 90−96.(620) Barandiaran, J. M.; Colmenero, J. Continuous CoolingApproximation for the Formation of a Glass. J. Non-Cryst. Solids1981, 46, 277−287.(621) Whichard, G.; Day, D. E. Glass Formation and Properties inthe Gallia-Calcia System. J. Non-Cryst. Solids 1984, 66, 477−487.(622) Huang, W.; Ray, C. S.; Day, D. E. Dependence of the CriticalCooling Rate for Lithium-Silicate Glass on Nucleating Agents. J. Non-Cryst. Solids 1986, 86, 204−212.(623) Havermans, A. C. J.; Stein, H. N.; Stevels, J. M. CriticalCooling Rates in Alkali Silicate Systems. J. Non-Cryst. Solids 1970, 5,66−69.(624) Cormier, L. Nucleation in Glasses − New ExperimentalFindings and Recent Theories. Procedia Mater. Sci. 2014, 7, 60−71.
Chemical Reviews Review
DOI: 10.1021/acs.chemrev.8b00510Chem. Rev. XXXX, XXX, XXX−XXX
CL

(625) Mastelaro, V. R.; Zanotto, E. D. X-ray Absorption FineStructure (XAFS) Studies of Oxide Glasses - A 45-year Overview.Materials 2018, 11, 204.(626) Sosso, G. C.; Chen, J.; Cox, S. J.; Fitzner, M.; Pedevilla, P.;Zen, A.; Michaelides, A. Crystal Nucleation in Liquids: OpenQuestions and Future Challenges in Molecular Dynamics Simulations.Chem. Rev. 2016, 116, 7078−7116.(627) Bras, W.; Clark, S. M.; Greaves, G. N.; Kunz, M.; Van Beek,W.; Radmilovic, V. Nanocrystal Growth in Cordierite Glass CeramicsStudied with X-ray Scattering. Cryst. Growth Des. 2009, 9, 1297−1305.(628) Kleebusch, E.; Patzig, C.; Hoche, T.; Russel, C. Effect of theConcentrations of Nucleating Agents ZrO2 and TiO2 on theCrystallization of Li2O−Al2O3−SiO2 Glass: an X-ray Diffraction andTEM Investigation. J. Mater. Sci. 2016, 51, 10127−10138.(629) Hoell, A.; Varga, Z.; Raghuwanshi, V. S.; Krumrey, M.;Bocker, C.; Russel, C. ASAXS Study of CaF2 NanoparticlesEmbedded in a Silicate Glass Matrix. J. Appl. Crystallogr. 2014, 47,60−66.(630) Fernandez-Martin, C.; Bruno, G.; Crochet, A.; Ovono Ovono,D.; Comte, M.; Hennet, L. Nucleation and Growth of Nanocrystals inGlass-ceramics: An In Situ SANS Perspective. J. Am. Ceram. Soc.2012, 95, 1304−1312.(631) Cebe, P. Recent Developments in Thermal Analysis ofPolymers: Calorimetry in the Limit of Slow and Fast Heating Rates. J.Polym. Sci., Part B: Polym. Phys. 2005, 43, 629−636.(632) Drzezdzon, J.; Jacewicz, D.; Sielicka, A.; Chmurzynski, L.Characterization of Polymers Based on Differential ScanningCalorimetry Based Techniques. TrAC, Trends Anal. Chem. 2019,110, 51−56.(633) Trevino-Quintanilla, C. D.; Krishnamoorti, R.; Bonilla-Ríos, J.Flash DSC Crystallization Study of Blown Film Grade Bimodal HighDensity Polyethylene (HDPE) Resins. Part 2. Non-isothermalkinetics. J. Polym. Sci., Part B: Polym. Phys. 2017, 55, 1822−1827.(634) Li, Z.; Ye, X.; Wang, D.; Zeng, Y.; Zhou, H.; Guo, W. NovelExperimental Protocol Used To Determine The Nucleation Kineticsof Polymer Realized By Flash DSC: The Case of poly (l-lactic acid)/poly (d-lactic acid) blends. Polym. Test. 2018, 66, 251−255.(635) Zhuravlev, E.; Schmelzer, J. W. P.; Wunderlich, B.; Schick, C.Kinetics of Nucleation and Crystallization in Poly(ε-caprolactone)(PCL). Polymer 2011, 52, 1983−1997.(636) Supaphol, P.; Spruiell, J. E. Isothermal Melt- and ColdCrystallization Kinetics and Subsequent Melting Behavior inSyndiotactic Polypropylene: A Differential Scanning CalorimetryStudy. Polymer 2001, 42, 699−712.(637) Long, Y.; Shanks, R. A.; Stachurski, Z. H. Kinetics of PolymerCrystallization. Prog. Polym. Sci. 1995, 20, 651−701.(638) Toda, A.; Androsch, R.; Schick, C. Insights into PolymerCrystallization and Melting From Fast Scanning Chip Calorimetry.Polymer 2016, 91, 239−263.(639) Li, Z.; Zhou, D.; Hu, W. Recent Progress on Flash DSC Studyof Polymer Crystallization and Melting. Acta Polym. Sin. 2016, 1179−1197.(640) Wang, J.; Li, Z.; Perez, R. A.; Mueller, A. J.; Zhang, B.;Grayson, S. M.; Hu, W. Comparing Crystallization Rates BetweenLinear and Cyclic Poly(Epsilon-Caprolactones) via Fast-Scan Chip-Calorimeter Measurements. Polymer 2015, 63, 34−40.(641) Liu, S. J.; Tao, H. Z.; Zhang, Y. F.; Yue, Y. Z. A NewApproach for Determining the Critical Cooling Rates of Nucleation inGlass-Forming Liquids. J. Am. Ceram. Soc. 2017, 100, 3875−3882.(642) Turnbull, D. Formation of crystal nuclei in liquid metals. J.Appl. Phys. 1950, 21, 1022.(643) Thompson, C. V.; Spaepen, F. On the approximation of thefree energy change on crystallization. Acta Metall. 1979, 27, 1855−59.(644) Kozmidis-Petrovic, A.; Sestak, J. Forty Years of the Hruby Glass-Forming Coefficient via DTA when Comparing Other Criteriain Relation to the Glass Stability and Vitrification Ability. J. Therm.Anal. Calorim. 2012, 110, 997−1004.
(645) Hruby, A. Evaluation of glass-forming tendency by means ofDTA. Czech. J. Phys. 1972, 22, 1187−1193.(646) Saad, M.; Poulain, M. Glass Forming Ability Criterion. Mater.Sci. Forum 1987, 19−20, 11−18.(647) Weinberg, M. C. Assessment of Glass Stability Criteria. Phys.Chem. Glasses 1994, 35, 119−123.(648) Lu, Z. P.; Liu, C. T. A New Glass-Forming Ability Criterionfor Bulk Metallic Glasses. Acta Mater. 2002, 50, 3501−3512.(649) Lu, Z. P.; Liu, C. T. Glass Formation Criterion for VariousGlass-Forming Systems. Phys. Rev. Lett. 2003, 91, 1155051−1155054.(650) Zhang, P.; Wei, H.; Wei, X.; Long, Z.; Su, X. Evaluation ofGlass-Forming Ability for Bulk Metallic Glasses Based on Character-istic Temperatures. J. Non-Cryst. Solids 2009, 355, 2183−2189.(651) Du, X. H.; Huang, J. C.; Liu, C. T.; Lu, Z. P. New Criterion ofGlass Forming Ability for Bulk Metallic Glasses. J. Appl. Phys. 2007,101, 086108.(652) Fan, G. J.; Choo, H.; Liaw, P. K. A New Criterion for theGlass-forming Ability of Liquids. J. Non-Cryst. Solids 2007, 353, 102−107.(653) Long, Z.; Xie, G.; Wei, H.; Su, X.; Peng, J.; Zhang, P.; Inoue,A. On the New Criterion to Assess the Glass-forming Ability ofMetallic Alloys. Mater. Sci. Eng., A 2009, 509, 23−30.(654) Yuan, Z. Z.; Bao, S. L.; Lu, Y.; Zhang, D. P.; Yao, L. A NewCriterion for Evaluating the Glass-Forming Ability of Bulk GlassForming Alloys. J. Alloys Compd. 2008, 459, 251−260.(655) Weinberg, M. C. Glass-forming Ability and Glass Stability inSimple Systems. J. Non-Cryst. Solids 1994, 167, 81−88.(656) Cabral, A. A.; Fredericci, C.; Zanotto, E. D. A Test of theHruby Parameter to Estimate Glass-Forming Ability. J. Non-Cryst.Solids 1997, 219, 182−186.(657) Avramov, I.; Zanotto, E. D.; Prado, M. O. Glass-formingAbility versus Stability of Silicate Glasses. II. Theoretical Demon-stration. J. Non-Cryst. Solids 2003, 320, 9−20.(658) Cabral, A. A.; Cardoso, A. A. D.; Zanotto, E. D. Glass-formingAbility versus Stability of Silicate Glasses. I. Experimental Test. J. Non-Cryst. Solids 2003, 320, 1−8.(659) Nascimento, M. L. F.; Souza, L. A.; Ferreira, E. B.; Zanotto, E.D. Can Glass Stability Parameters Infer Glass Forming Ability? J. Non-Cryst. Solids 2005, 351, 3296−3308.(660) Ranasinghe, K. S.; Ray, C. S.; Day, D. E.; Rogers, J. R.; Hyers,R. W.; Rathz, T. Containerless Processing of a Lithium DisilicateGlass. J. Mater. Sci. 2007, 42, 4291−4297.(661) Ferreira, E. B.; Zanotto, E. D.; Feller, S.; Lodden, G.; Banerjee,J.; Edwards, T.; Affatigato, M. Critical Analysis of Glass StabilityParameters and Application to Lithium Borate Glasses. J. Am. Ceram.Soc. 2011, 94, 3833−3841.(662) Marques, T. V. R.; Cabral, A. A. Influence of the HeatingRates on the Correlation between Glass-Forming Ability (GFA) andGlass Stability (GS) Parameters. J. Non-Cryst. Solids 2014, 390, 70−76.(663) Qiao, A.; Bennett, T. D.; Tao, H. Z.; Krajnc, A.; Mali, G.;Doherty, C. M.; Thornton, A. W.; Mauro, J. C.; Greaves, G. N.; Yue,Y. Z. A Metal-organic Framework with Ultrahigh Glass-formingAbility. Sci. Adv. 2018, 4, No. eaao6827.(664) Zanotto, E. D.; Cassar, D. R. The Microscopic Origin of theExtreme Glass-forming Ability of Albite and B2O3. Sci. Rep. 2017, 7,43022.(665) ASTM Standard Practices for Measurement of LiquidusTemperature of Glass by Gradient Furnace Method, Annual Book ofASTM Standards, C829-81; American Society for Testing andMaterials: Gaithersburg, MD, 1990.(666) Beerkens, R. G. C.; Conradt, R. Round Robin Test onLiquidus Temperature of Soda-Lime-Magnesia-Silica Float GlassSamples: A Technical Report of the ICG Technical Committee(TC 18) on Properties of Glass Forming Melts. Glass Technol.: Eur. J.Glass Sci. Technol., Part A 2008, 49, 205−212.(667) Rao, Q.; Piepel, G. F.; Hrma, P.; Crum, J. V. LiquidusTemperatures of HLW Glasses with Zirconium-Containing PrimaryCrystalline Phases. J. Non-Cryst. Solids 1997, 220, 17−29.
Chemical Reviews Review
DOI: 10.1021/acs.chemrev.8b00510Chem. Rev. XXXX, XXX, XXX−XXX
CM

(668) Dreyfus, C.; Dreyfus, G. A Machine Learning Approach to theEstimation of the Liquidus Temperature of Glass-Forming OxideBlends. J. Non-Cryst. Solids 2003, 318, 63−78.(669) Wondraczek, L.; Beunet, L. Liquidus Prediction in Multi-component Lithium Alumosilicate Glasses. J. Am. Ceram. Soc. 2008,91, 1309−1311.(670) Verdonck, E.; Schaap, K.; Thomas, L. C. A Discussion of thePrinciples and Applications of Modulated Temperature DSC(MTDSC). Int. J. Pharm. 1999, 192, 3−20.(671) Garidel, P.; Johann, C.; Blume, A. The Calculation of HeatCapacity Curves and Phase Diagrams Based on Regular SolutionTheory. J. Therm. Anal. Calorim. 2005, 82, 447−455.(672) Pedersen, A. S.; Pryds, N.; Linderoth, S.; Larsen, P. H.;Kjoller, J. The Determination of Dynamic and Equilibrium Solid/Liquid Transformation Data for Sn-Pb Using DSC. J. Therm. Anal.Calorim. 2001, 64, 887−894.(673) Young, P. H.; Dollimore, D.; Schall, C. A. Thermal Analysis ofSolid-Solid Interactions in Binary Mixtures of Alkylcyclohexanes usingDSC. J. Therm. Anal. Calorim. 2000, 62, 163−175.(674) Charsley, E. L.; Laye, P. G.; Palakollu, V.; Rooney, J. J.;Joseph, B. DSC Studies on Organic Melting Point TemperatureStandards. Thermochim. Acta 2006, 446, 29−32.(675) Hohne, G. W. H.; Hemminger, W.; Flammersheim, H. J.Differential Scanning Calorimetry - An Introduction for Practitioners;Springer Verlag: Berlin, 1996.(676) Ferreira, E. B.; Lima, M. L.; Zanotto, E. D. DSC Method forDetermining the Liquidus Temperature of Glass-forming Systems. J.Am. Ceram. Soc. 2010, 93, 3757−3763.(677) Wakasugi, T.; Ota, R.; Fukunaga, J. Glass-forming Ability andCrystallization Tendency Evaluated by the DTA Method in theNa2O−B2O3−Al2O3 System. J. Am. Ceram. Soc. 1992, 75, 3129−3132.(678) Veit, U.; Houet, Y.; Laurent, D.; Russel, C. LiquidusTemperatures of Calcium Magnesium Alumosilicate Glass-formingCompositions Determined via Gradient Furnace and from theMelting Peak by Differential Thermal Analysis. Thermochim. Acta2015, 618, 1−5.(679) Deubener, J.; Allix, M.; Davis, M. J.; Duran, A.; Hoche, T.;Honma, T.; Komatsu, T.; Kruger, S.; Mitra, I.; Muller, R.; et al.Updated Definition of Glass-ceramics. J. Non-Cryst. Solids 2018, 501,3(680) Marghussian, V. Nano-Glass Ceramics: Processing, Propertiesand Applications; Elsevier: Netherland, 2015.(681) Mauro, J. C.; Ellison, A. J.; Pye, L. D. Glass: TheNanotechnology Connection. Int. J. Appl. Glass Sci. 2013, 4, 64−75.(682) Zanotto, E. D. Crystals in Glass: A Hidden Beauty; John Wileyand Sons, Inc. and the American Ceramic Society: NJ, 2013.
Chemical Reviews Review
DOI: 10.1021/acs.chemrev.8b00510Chem. Rev. XXXX, XXX, XXX−XXX
CN