unclassified ffffffffffff nonesruciv testing for light
TRANSCRIPT

AD-A083 597 ARMY ENGINEER WATERWAYS EXPERIMENT STATION VICKSBURG--ET / /NONESRUCIV TESTING FOR LIGHT AIRCRAFT PAVEMENTS. PHASE 1. E-E~UJAN 80A .1 BUSH OT-FATSWAI-848
UNCLASSIFIED FAA-RO-80-9 NL
2 ffffffffffff

Report No. FAA-RD-80-9 LNONDESTRUCTIVE TESTING FOR LIGHT
AIRCRAFT PAVEMENTS
PHASE I
Evaluation Of Nondestructive Testing Devices
Albert 1. Bush ZI[
U. S. Army Engineer Waterways Experiment StationGeotechnical Laboratory
P. 0. Box 631, Vicksburg, Miss. 39180
4i. : i
JANUARY 1980FINAL REPORT
Document is available to the public through the
National Technical Information Service,Springfield, Va. 22151
Prepared for
U. S. DEPARTMENT OF TRANSPORTATIONFEDERAL AVIATION ADMINISTRATION
Systems Research & Development ServiceWashington, D. C. 20591
8o 4 25002

NOTICES
This document is disseminated under the sponsorship of the Departmentof Transportation in the interest of information exchange. The UnitedStates Government assumes no liability for its contents or use thereof.
The United States Government does not endorse products or manufacturers.* Trade or manufacturers' names appear herein solely because they are con-
sidered essential to the object of this report.

0. Abert J s h I
eeeral Aviation Docuadmtoroatin
R Systems Research and Development Service N4. Sponsoring Agency Code
* Washington, D. C. 20591 _____________
15. Supplementary Notes
' Methodologies have been developed for nondestructive testing (NDT) and
evaluation of air carrier airport pavements. This study, a two-phase program,addresses those pavements that are designed to support aircraft with gross weightsof less than 30,000 lb. Phase I, reported herein, is to evaluate commerciallyavailable NDT devices with respect to operational characteristics, costs, trans-
portability by cargo aircraft, accuracy, and reproducibility of measurements, andsuitability for use in evaluating light aircraft pavements. The equipment
evaluated included the Benkelman Beam, Dynaflect, Falling Weight Deflectometer,- and Models h00, 510, and 2008 Road Raters. The WES 16-kip vibrator was used as
a comparison device. Based on the evaluation parameters, the Dynaflect, Model 2008• Road Rater, and Falling Weight Deflectometer are evaluated applicable for testing
light aircraft pavements.
17. Key Words 18. Distribution Statement
Nondestructive testing Document is available to thePavement evaluation public through the NationalVibratory test equipment Technical Information Service,Impulse load testing equipment Springfield, Va. 22151
19. Security C Dssif. (of this report) 20. Security Clossif. (of this page) 21. No. of Pages 22. Price
Unclassifled Unclassified 103
411
evauaim D o ai carr0.7 ai)rproto ofampeted page sudatopaeporm
addeses hoe aveens hatar dsigedtosupor arcrftwih gos w ight

pIL 6
0~00
* 1.
"Me -1C
*E US -dc-e1 d @
0 at
3€ e
E E Ef l - ''E:!*iIII 1111I1 2
IC
o
V JI t C Z' Ia
rL,
i4li
I
.. Il I-.,i i 91 i ,,11 -:
'aam
i i "i I i lii I- i
i- 96 6 9 4-' 3 2Euj
3 ~ a Ise I2 EII!--"
ii"
V MO
- I

... ,
PREFACE
This study, a two-phase program, was sponsored by the Federal
Aviation Administration through Inter-Agency Agreement No. DOT FA78WAI-
848, "Nondestructive Testing for Light Aircraft Pavements." Phase I of
the study, which is reported herein, was conducted during the period
April 1978 - July 1979 under the direction of Messrs. J. P. Sale, Chief,
deotecinical Laborafory (GL); R. G. Ahlvin, Assistant Chief, GL; R. L.
* Hutchinson, Pavement Program Manager; A. H. Joseph, Chief, Pavement
Investigations Division; and J. W. Hall, Jr., Chief, Evaluation Branch,
of the U. S. Army Engineer Waterways Experiment Station (WES).
Messrs. J. L. Green, D. R. Elsea, and A. J. Bush III actively partici-
pated in the study. The report was prepared by Mr. Bush.
Acknowledgement is made to Dr. M. C. Wang and the Pennsylvania
Transportation Institute for allowing the testing and providing data on
the Pennsylvania Transportation Research Facility. Special thanks are
also extended to Messrs. Gaylord Cumberledge, the Pennsylvania Depart-
ment of Transportation; Paul Teng, the Mississippi State Highway Depart-
meni; T. 0. Edick, Region 15, Federal Highway Administration; and D. M.
Greer and R. N. Stubstad, private consulting engineers, for the use of
their nondestructive test devices.
Directors of the WES during the conduct of the investigation and
the preparation of this report were COL John L. Cannon, CE, and
COL Nelson P. Conover, CE. Technical Director was Mr. F. R. Brown.
*6-*' iiinF
-nf

TABLE OF CONTENTS
Page
INTRODUCTION .. .......... .................. 1
BACKGROUND................... . . ... . .. .. .. .. .. ... 1PURPOSE .. .......... .................SCOPE .. .......... .................. 2
DESCRIPTION OF DEVICES TESTED .. ................... 3
BENKELMAN BEAM. .......... ............. 3*DYNAFIJECT .. ........... .............. 5*FALLING WEIGHT DEFLECTOMETER .. ................ 6
MODEL 400 ROAD RATER .. ................... 10MODEL 510 ROAD RATER .. ................... 14MODEL 2008 ROAD RATER. .. .................. 16WES 16-KIP VIBRATOR. .. ................... 18
EVALUATION RESULTS. .. ....................... 21
OPERATIONAL CHARACTERISTICS .. ............ .... 21COSTS. .. .......................... 23TRANSPORTABILITY BY CARGO AIRCRAFT. ............. 26ACCURACY ANlD REPRODUCIBILITY OF MEASUREMENTS. ........ 26DEPTH OF SIGNIFICANT INFLUENCE. ............ ... 42SUITABILITY FOR USE IN EVALUATING LIGHT AIRCRAFT
PAVEM1ENTS. .. ........................ 0
ANALYSIS OF RESULTS ....................... 8
CONCLUSIONS AND RECOMMENATIONS...................92
CONCLUSIONS. .. ....................... 92RECOMMENDATIONS................. . . . ... .. .. .. ..
REFERENCES. .. ........................ ... 93
LIST OF ILLUSTRATIONS
FigureNo.
1 Benkelman Beam. .......... ............. 5
2 Dynaflect .. ............. ............ 6
V
Figure
No. Page
3 Dynaflect standard control unit .... ... .............. 7
4 Dynaflect digital control unit ... .... .............. 7
5 Overall view of the FWD ......... .................. 8
6 Closeup of the FWD .......... .................... 9
7 FWD signal conditioning unit ... .. ............... . .11
, 8 Model 400 Road Rater ... .... ................... ... 12
* 9 Road Rater readout unit ....... .................. ... 12
10 Static load versus system pressure for Models ",00and 510 Road Raters ....... ................... ... 13
11 Model 510 Road Rater ... .... ................... ... 15
12 Mass displacement versus dynamic force for theModel 510 Road Rater ....... .................. ... 15
13 Model 2008 Road Rater ....... ................... ... 16
14 Model 2008 Road Rater control unit .... ............ . 17
15 Overall view of the WES 16-kip vibrator ... .......... . 19
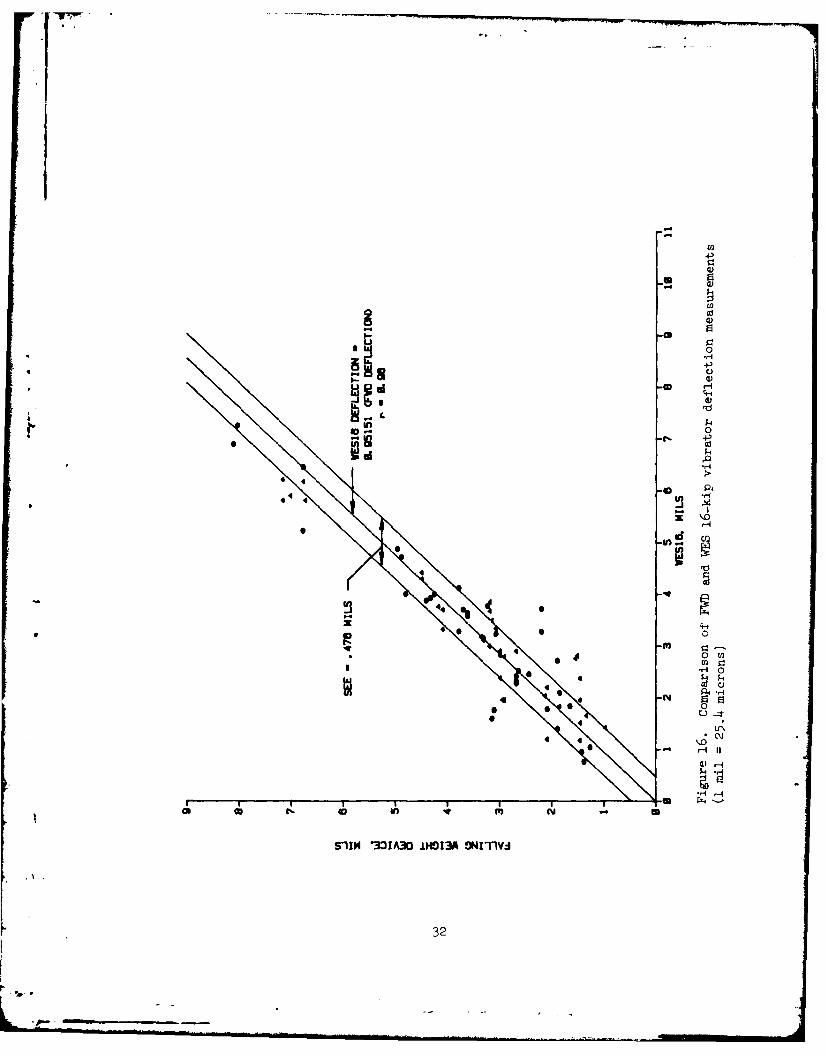
16 Comparison of FWD and WES 16-kip vibrator deflection* measurements ......... ...................... . 32
17 Dynaflect signals ........ ..................... ... 39
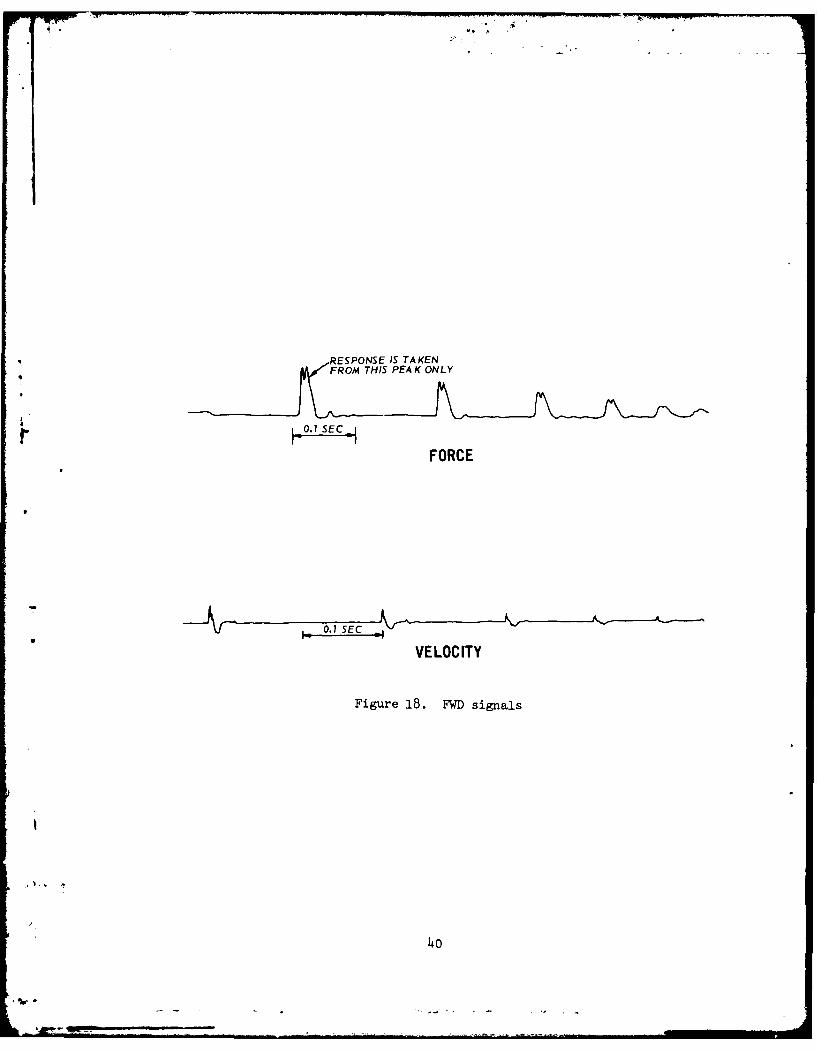
18 YWD signals .... ...... ........................ ... 40
19 Model 510 Road Rater force signals .... ............ .41
20 Model 2008 Road Rater force signals .... .. ............ 43
21 Model 2008 Road Rater velocity signals ... .......... .44
22 Model 2008 Road Rater deflection signals .... ......... 45
23 WES 16-kip vibrator force signals .... .. ............. 46
24 WES 16-kip vibrator velocity signals ... ........... ... 47
25 WES 16-kip vibrator deflection signals ... .. .......... 48
vi

Figure
No. Page
26 Layout of the AC/PCC instrumented section .. ......... 49
27 Layout of the AC instrumented section ..... ........... 49
28 Depth of influence contours for the Dynaflect andWES 16-kip vibrator on the AC instrumented section . . . . 51
29 Depth of influence contours for the FWD on the ACinstrumented section ....... ................... ... 51
30 Depth of influence contours for the Model 2008 Road* Rater and the WES 16-kip vibrator on the AC
instrumented section ....... ................... ... 52
31 Depth of influence contours for the Dynaflect and WES16-kip vibrator on the AC/PCC instrumented section . . .. 52
32 Depth of influence contours for the FWD on theAC/PCC instrumented section ..... ............... ... 53
33 Depth of influence contours for the Model 2008Road Rater on the AC/PCC instrumented section ....... .. 53
34 Depth of influence contours for the WES 16-kip vibratoron the AC/PCC instrumented section operating at anormal force level ......... .................... 54
35 Layout and description of pavements at the PTRF ....... .. 55
36 Comparison of temperature adjustment factors .......... . 58
37 Average deflection in each test item for eachNDT device .......... ........................ ... 59
38 Model 2008 Road Rater loading plate on superelevatedpavement .......... ......................... ... 59
39 Coefficient of variation of measurements for eachdevice in each test section ..... ............... ... 60
40 Comparison of DSM averages and coefficient ofvariation for the Model 2008 Road Rater and theWES 16-kip vibrator ......... ................... 62
41 Deflection A for the PCC pavements ... ........... ... 69
42 Deflection ratio A3 6/A for the PCC pavements ....... .70
vii

FigureNo. Page
43 Deflection ratio A36 /A1 8 for the PCC pavements ........ . 72
44 DSM comparisons on the PCC pavements ...... ............ 74
45 Deflection basins on Slab No. 6 of the PCC road ....... .. 75
46 Deflection basins on Slab No. 7 of the PCC road ... ...... 75
47 Deflection basins on Slab No. 11 of the PCC road ........ .. 76
48 Deflection basin on test location IS ...... ............ 78
49 Deflection basin on test location OS .... ............ ... 78
50 Dynaflect deflection basin and projected 1000-lbdeflection basin for the FWD, the Model 2008 RoadRater, and the WES 16-kip vibrator on test location IS . 80
51 Dynaflect deflection basin and projected 1000-lbdeflection basin for the FWD, the Model 2008 RoadRater, and the WES 16-kip vibrator on test location OS . . 80
52 Deflection basins on test location IA ... ........... ... 81
53 Deflection basins on test location OA ... ........... ... 81
54 Deflection basins with the WES 16-kip vibrator and theFWD on weak AC pavements ...... ................. ... 82
55 Three-year total costs ....... ................... ... 86
LIST OF TABLES
Table
No.
1 Nondestructive Test Device Loading Characteristics .. ..... 4
2 Speed of Operation ........ ..................... ... 23
3 Manpower Requirements ......... ................... 24
4 Equipment Costs ......... ...................... . 24
5 Accuracy of Benkelman Beam Deflection Measurements .. ..... 27
viii
' - .. . . . . . .. . . . . . .. . . .. ... .. .. ... ... ....

Table
No. Page
6 Accuracy Test of Dynaflect Velocity Sensors ......... ... 28
7 Accuracy Test of Model 510 Road Rater VelocitySensor .......... ........................ ... 30
8 Accuracy Test of Model 2008 Road Rater VelocitySensors ......... ........................ ... 31
9 Accuracy Test for Dynaflect Force and Frequency .. ..... 34
10 Accuracy Test for FWD Force ....... ............... 34
11 Comparisons of Calculated and Measured Loads for the* Model 510 Road Rater ..... ................. ... 35
12 Accuracy Test for Model 2008 Road Rater Force andFrequency (Measured Force Unfiltered) .. ......... ... 37
13 Accuracy Test for Model 2008 Road Rater Force and
Frequency (Measured Force Filtered) ... .......... ... 38
14 Test Loads and Frequencies for Vibrators . ........ ... 56
15 PTRF Regression Analysis for the Benkelman Beam ....... 64
16 PTRF Regression Analysis for the Dynaflect . ....... . 65
17 PTRF Regression Analysis for the Model 400 Road Rater 66
18 PTRF Regression Analysis for the Model 510 Road Rater 67
19 PTRF Regression Analysis for the Model 2008 Road Rater 68
20 Regression Analysis for PCC Pavements ... .......... ... 73
21 Physical Properties of WES AC Pavements .. ......... ... 77
22 Regression Analysis of Dulles Data ... ........... ... 83
23 Yearly Operating Costs ...... ................. ... 86
24 Summary of Accuracy Data ..... ................ ... 87
25 Summary of Regression Analysis Data ... ........... ... 89
26 Ranking of Candidate Devices by Evaluation Parameters 90
ix

INTRODUCTION
BACKGROUND
The Federal Aviation Administration (FAA) has sponsored several
studies to develop methodologies for nondestructive testing (NDT)
evaluation and overlay design for air carrier airport pavements. These
studies, reported by Green and Hall,* Weiss,** and Yang, all utilized
the U. S. Army Engineer Waterways Experiment Station (WES) 16-kip (7.3-
metric ton) vibrator, which applies a maximum peak-to-peak load on a
pavement of 30,000 lb (133.4 RN). The WES 16-hip vibrator is considered
undesirable for light aircraft pavements (design gross loading less than
30,000 lb (133.4 kN)) because this load may overstress the light air-
craft pavement; smaller, less expensive, and more air-transportable
equipment may provide an accurate evaluation for thinner pavements.
Therefore, the FAA sponsored the research project described herein to
evaluate the applicability of loads lighter than those produced by the
WES 16-kip vibrator for testing light aircraft pavements.
The overall study of NDT for light aircraft pavements is a two-
phase program. Phase I, which is reported herein, is for the evalu-
ation of the applicability of light load devices for the NDT of light
aircraft pavements. Phase II will develop a methodology for evaluation
of light aircraft pavements based upon multilayered elastic models and
limiting stress/strain criteria.
* J. L. Green and J. W. Hall, Jr., "Nondestructive Vibratory Testing
of Airport Pavements," Evaluation Methodology and Experimental TestResults, Vol 1, Report No. FAA-RD-73-305-1, Department of Transporta-tion, Federal Aviation Administration, Washington, D. C., 1975.
** R. A. Weiss, "Pavement Evaluation and Overlay Design by CombinedMethods of Layered Elastic Theory and Vibratory Nondestructive
Testing" (in preparation), Department of Transportation, FederalAviation Administration, Washington, D. C.
t N. C. Yang, "Nondestructive Evaluation of Civil Airport Pavements,
Nondestructive Tests-Frequency Sweep Method, Part I," Report No.FAA-RD-76-83, Department of Transportation, Federal Aviation Admin-
istration, Washington, D. C., 1976.
* 1

PURPOSE
The purpose of Phase I of this study is to evaluate the loading
required for the NDT of light aircraft pavements with respect to pavement
response monitoring, equipment size and transportability, and equipment
initial and operating cost.
SCOPE
The study will only include equipment that is commercially avail-
able and measures the structural characteristics of the entire pavement
section by means of steady-state vibration, static loading or impact
* loading, and the resulting deflection measurements. Optimization of the
loading devices will be accomplished through both laboratory and field
pavement tests.
2

DESCRIPTION OF DEVICES TESTED
The devices evaluated during this investigation were limited to
those that are commercially available to consulting engineers or airport
administrators. They include the Benkelman Beam, the Dynaflect, the
Falling Weight Deflectometer (FWD), and three models of the Road Rater.
The WES 16-kip (7.3-metric ton) vibrator is also included since it was
used as a standard to which these devices were compared. Table 1 pre-
sents the loading characteristics of all devices tested. The following
paragraphs describe each device In detail.
BENKELMAN BEAM
* The Benkelman Beam was developed at the WASHO Road Test* for the
purpose of measuring the deflection of a flexible pavement under a
loaded pneumatic tire. It consists of a lever rotating about a fulcrum
that is fixed to a datum beam. The datum beam is supported on the
pavement at three points. Figure 1 shows the dimensions of the beam.
A variation of the Benkelman Beam was developed by the California
Highway Department in the form of a truck-mounted device. As the truck
moves continuously along the road surface, a beam is alternately placed
on the pavement and permitted to rest at a specific point until the
wheel passes over the reference point. After this reading is taken,
the beam is mechanically moved forward; the readings are repeated. The
truck travels at a speed of one-half mile (0.8 km) per hour and is
capable of taking continuous readings at 20-ft (6.1-m) intervals. This
variation was not tested during this study primarily because it would
not be air-transportable.
The procedure for testing with the Benkelman Beam was taken from
the Asphalt Institute.** Basically, the toe of the beam is placed
* Highway Research Board, "The WASHO Road Test, Part I," Report No.
HRB Special Report 18, National Academy of Sciences, National Re-search Council, Washington, D. C., 1954.
"The WASHO Iload Test, Part II," Report No. HEB SpecialReport 22, National Academy of Sciences, National Research Council,Washington, D. C., 1955.
* Asphalt Institute, "Asphalt Overlays and Pavement Rehabilitation,"Manual Series No. 17, College Park, Md., 1977.
3
11i

4)
t44.>
4' 4)
4,1.0 4) 4)
44 4) N4 ~ .
4) 0 )4, 4'.4 ul 4 4 ) 4
.14 4'4,1
.44 4 ) 4 .4,ol)) 4) 4 ) 4
4. - '444 4' 4' -

DIALMICROM*TERGAG&
DIAL RACKET SEAM LOCK SEE VIEWB~UZZER B UZZER "AMqF~qNE
SWITCHAD;STA9L9(CREFERENCE BATTERYCARR NO REAR LEG
PROBE SEAM X: HAOUfY1MEASUREMENTRO
SEAM GUIDE PROSE BEAM 1.407. 14 .7.GKAUIO I.I~ 4." FRON T LMG
2S4-m I IW"I
RIGI DJOINT -- SALL BEARING PIVOT
;I1444. IVt')
Figure 1. Benkelman Beam
between the dual wheels of a single axle loaded to 18,000 lb (8,615 kg).
The dials are zeroed and the truck is driven forward at m ast 30 ft (9.1
m). The rebound deflection is then measured.
D YNAFLECT
The Dynaflect is an electromechanical system for measuring the
dynamic deflection of a pavement caused by an oscillatory load. It is
manufactured by SIE, Inc., Fort Worth, Texas. The trailer-mounted
device (Figure 2) applies a 1000-lb (hh8-N) peak-to-peak sinusoidal
load to the pavement. This load is generated by two counterrotating
masses that are rotating at a constant frequency of 8 Hz. The force is
transmitted to the pavement through two 4-in.- (10.2-cm-) wide, 16 -in.-
(h0.6-cm-) OD polyurethane-coated steel wheels spaced 20 in. (50.8 cm)
apart. The Dynaflect applies a 2000-lb (907-kg) static weight to the
pavement.
The pavement response to the dynamically applied load is measured
with 210-ohm, h.5-Hz geophones that are shunted to a damping factor of
approximately 0.7. One geophone is located directly between the two
steel wheels. The other four geophones are spaced at 1-ft (30.5-cm)
intervals to the front of the trailer.
5

. " DYNAFLECT
4r
Figure 2. Dynaflect
Two types of signal conditioning and recording devices are avail-
able with the Dynaflect. With the standard control unit, the frequency
(8 Hz) is monitored on a meter, but the deflections from each of the five
sensors must be hand-recorded from a single meter by switching an indi-
cator to each of five positions (Figure 3). The optional device is a
digital control system (Figure 4), which has a digital display for each
of the five sensors as well as a meter for monitoring frequency. A
thermal printer can be attached to the optional recorder that will
record each of the five deflections and a test number.
FALLING WEIGHT DEFLECTOMETER
The FWD (Figure 5) is a relatively new NDT device, particularly
to the United States. Extensive research has been performed with the FWD
in Europe by different researchers.*,** Basical~y, a mass (Figure 6)
* A. Bohn et al., "Danish Experiments with the t'rench Falling Weight
Deflectometer," Proceedings of the Third International Conference onStructural Design of Asphalt Pavements, Vol 1, London, 1972.
** A. Claessen et al., "Pavement Evaluation with the Falling Weight
Deflectometer," Proceedings of the Association of Asphalt PavingTechnologists, Vol 45, 1975.
6
.p,.. Ia .... !. . ... ' ... .

4L-
* .4
1* 00.
a 0
4-3
Cd
'I 0o

Figure 5. Overall view of the FWD

4.
-Figure 6. Closeup of the FWD
9

weighing 330.7 lb (150 kg) is dropped on a set of rubber cushions, and
the resulting force and deflection are measured by load cells and
velocity transducers. The drop height can be varied from 0 to 15.7 in.
(40 cm) to produce a force from 0 to 13,488 lb (60 kN). The device is
trailer-mounted, having a total weight of 1,200 lb (544 kg). The load
.s transmitted to the pavement through an ll. 8-in. (30-cm) plate that
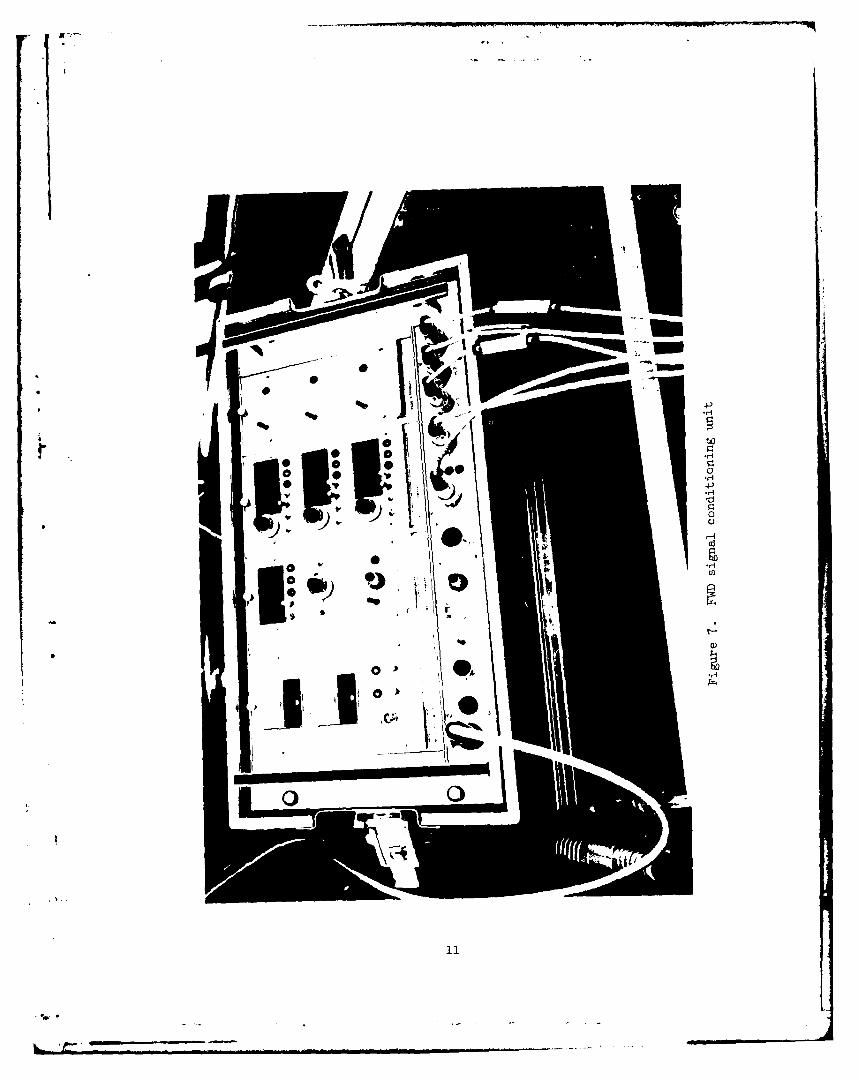
has a rubber cushion attached. The signal conditioning equipment
(Figure 7) displays the resulting pressure in kilopascals and the maxi-
mum peak displacement in micrometres. As many as three displacement
* _sensors may be recorded. Two people are required for an efficient
operation.
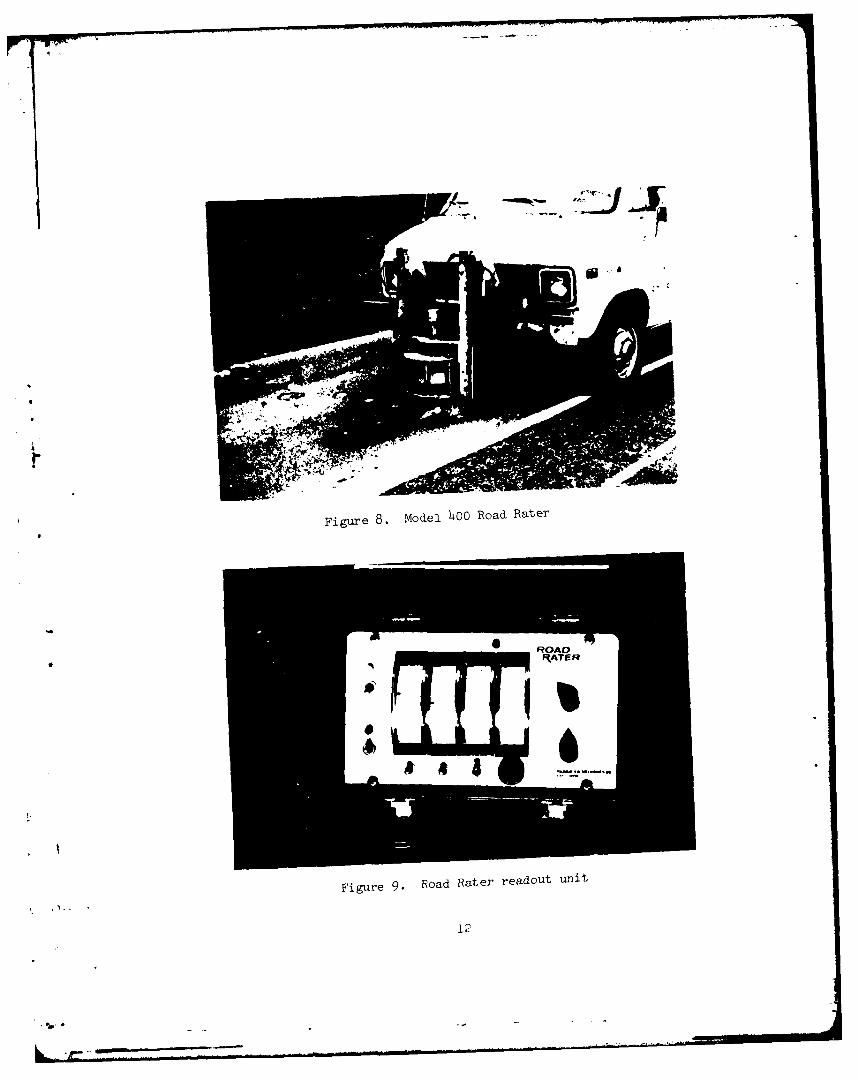
MODEL 400 ROAD RATER
The Road Raters are manufactured by Foundation Mechanics, Inc.,
El Segundo, California. The Model 400 is an electrohydraulic loading
device mounted on the front of a truck or van (Figure 8). The control
display console (Figure 9) contains all the controls and readout meters
required to operate the hydraulic system and read the data. Power for
this unit is from the vehicle's 12-volt electrical system.
The mass weight of 160 lb (73 kg) and the actuator (hydraulic ram)
are mounted with the rod end upward. (The opposite is true for the 16-
kip (7.3-metric ton) vibrator.) The actuator is capable of a 0.3-in.
* (7.6-mm) peak-to-peak stroke and produces a vibratory load ranging from
0 to 800 lb (3558 N). The dynamic load is transferred to the pavement
surface through two 7- by 4-in. (17.8- by 10.2-cm) rectangular steel
pads, which are spaced 6 in. (15.2 cm) apart (10 in. (25.4 cm) center-to-
center). The static weight of the Model 400 Road Rater can be varied
through hydraulic lines that are separated from those used for the
oscillation to system pressure. Figure 10 shows the relationship of
static load versus system pressure. Normal pressure for the MoHl 400
is 600 psi (421,860 kg/m2 ). Pavement deflection is monitored with four
velocity sensors. One is located between the two steel pads. The
others are equally spaced at 1-ft (30.5-cm) intervals away from the
first one. Variation of force and frequency is provided through a four-
way servo valve, which allows flow to either chamber of the vibrator
10
A
ViA~ 4-,
0
4-,
0-,
o
II' ?
11
1-7
Figure 8. Model 400 Road Rater
Figure 9. Road Rater readout unit
12

2000
CJ
d
30 40 500 600 70 80 900
SYSTEM PRESURE, PSI
Figure 10. Static load versus system pressure fgrModels 400 and 510 Road Raters (1 psi = 703 kg/m1 lb m 0.45 kg)
m
actuator in direct proportion to an oscillating electrical current
applied to a torque motor withinthe valve.
Force and deflections are measured as percentages of full-scale
readings on the scales of the control display console (Figure 9). A
range switch selects the range value of the displacement readout meters.
For example, when the range switch is set at "l," all meters will read
displacement as a percentage of 0.001 in. (0.025 mm). Range switches
may be set at 1, 2, 3, 5, 10, and 20. Frequency is controlled by a
five-position rotary switch, which provides for oscillation at 10, 20,
25, 30, and 40 Hz.
The Model 400 Road Rater has no load cells. Force indicated on
the display console is the theoretical calculated force that is based
on the sinusoidal oscillation of the mass (acceleration is the second
13
L7

derivative of the displacement equation for sinusoidal motion). The
dynamic force can be calculated from the following equation:
2F = mW x
where
F = dynamic force coincident with deflection
m = mass of the vibrator
w = angular frequency
x = dynamic deflections
For a frequency of 20 Hz and a mass displacement of 0.10 in. (2.54 mm),
the force is
160 lb ( 2irRad 2F ×20 cycles/e
32.2 ft/sec2 cycle
x 0.10 in. x 1ft.12 in.
F = 654 lb peak to peak (2909 N)
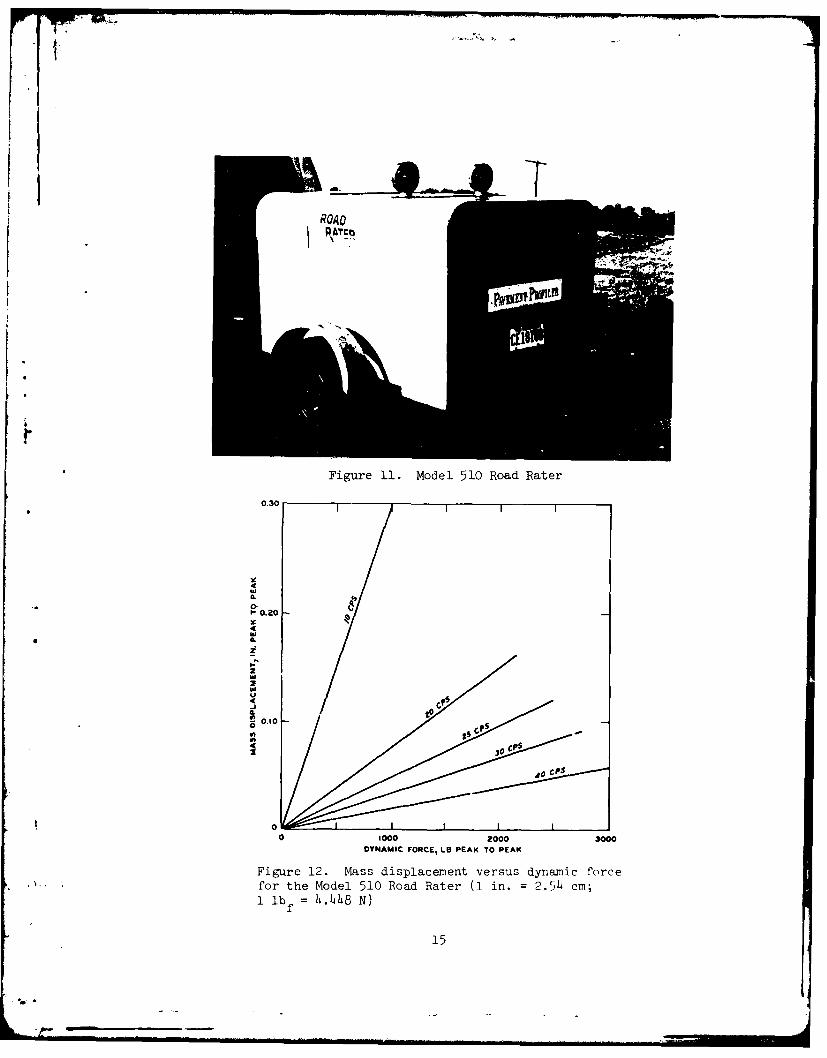
MODEL 510 ROAD RATER
The Model 510 is basically the same device as the Model 400 Road
Rater with three major exceptions. First, the Model 510 is housed in
a 5- by 6-ft (1.5- by 1.8-m) two-wheeled trailer (Figure 11). The mass
weighs 320 lb (145 kg) compared with 160 lb (73 kg) for the Model 400
Road Rater. Last, the electrical power is supplied by a self-contained
12-volt direct current (d-c) electrical system.
As with the Model 400, the static weight of the Model 510 is
dependent on the system pressure (Figure 10). Normal pressure for the
Model 510 is 575 +25 psi (404,283 +17,578 kg/m2 ) for a static weight of
1,350 lb (6.12 kg). The dynamic force is also calculated the same as
with the Model 400. Figure 12 shows a relationship for this force
versus the frequency and mass displacement.
The controls for the Model 510 (Figure 9) can be operated from
the driver's seat of tne towing vehicle. One man can operate this
14
Z. .. _ .. .. ,+
R1A
* Figure 11. Model 510 Road Rater
0.30 - - - - -
0.20
14CP
*0
0 0020030
DYAIzOCLBPA OPAFiue1.Ms ipaeetvru yai oc
fo h oe 1 odRae 1i.=25 m
16#1

device, but two would be more efficient by having one man drive, operate
the controls, and read out the data while the other records.
MODEL 2008 ROAD RATER
As with the Model 510, the Model 2008 Road Rater is a trailer-
mounted, electrohydraulic vibrator (Figure 13). Also, like the WES
16-kip vibrator, the Model 2008 has a variable force and frequency
capability. Furthermore, the Model 2008 has a digital control unit
(Figure 14) with a light-emitting diode (LED) display that by activating
the proper switch, the force, frequency, or any one of four of the
* velocity sensors can be monitored during a test. Data for the Model
2008 are recorded on a thermal printer located in the control console.
The test label number (0-9999), frequency, force, and four deflections
are recorded either on the operator's command or during the automatic
mode. Under the automatic mode, the operator activates the mode by
pushing one switch. The mass is lowered to the pavement, the vibrator
is turned on, vibrations are generated at a preselected force and
frequency, data are recorded by the printer, and the vibrator is
turned off and raised from the pavement.
Figure 13. Model 2008 Road Rater
16

II
Figure 14. Model 2008 Road Rater control unit
The Model 2008 has a self-contained power supply. The gasoline
engine supports the hydraulic and electrical systems of the device.
The mass of the Model 2008 is 4000 lb (1814 kg). During this research
effort, the 4000-lb (1814-kg) mass was lowered to the pavement and
disconnected from the trailer. A recent modification was made that
allows the use of the trailer for the reaction force similar to the
Model 510.
The Model 2008 Road Rater has three load cells to monitor the
force. The loads are summed for a total force output. Deflection is
monitored by four velocity sensors. The first is located in the center
of the 18-in.- (45.7-cm-) diam load plate. The sensor actually rests
on the pavement in a hole in the load plate. The other sensors are
spaced at 1-ft (30.5-cm) intervals to the rear of the trailer from the
first sensor.
17

WES 16-KIP VIBRATOR
Part of the description of the WES 16-kip vibrator given by Green
and Hall* is repeated here for the convenience of the reader. The 16-
kip vibrator, which is an experimental prototype model, operates elec-
trohydraulically and is housed in a 36-ft (11-m) semitrailer that
contains supporting power supplies and automatic data recording systems.
The vibrator mass assembly consists of an electrohydraulic actuator
surrounded by a 16,000-lb (7,257-kg) lead-filled steel box. The actuatoruses up to a 2-in. (5.1-cm) double-amplitude stroke to produce a vibra-
. tory load ranging from 0 to 30,000 lb (133.h kN) peak to peak with a
frequency range of 5 to 100 Hz for each load setting. Electric power
is supplied by a 25-kw diesel-driven generator set. The hydraulic
power unit is diesel-driven and has a pump that can deliver 38 gal/min
(1h3 k/min) at 3,000 psi (2,109,300 kg/m2 ).
Major items of electronic equipment are a set of three load
cells (BLH Electronic Model U3Ll, 20,000-lb (88.9 kN) capacity), which
measure the load applied to the pavement; velocity transducers (Mark
Product Model L-l-U) located in the 18-in.- (45.7-cm-) diam steel load
plate and at points away from the load plate, which are calibrated to
measure deflections; a servomechanism, which allows variation of fre-
quency and load; an X-Y recorder, which produces load versus deflection
and frequency versus deflection curves; and a printer, which provides
data in digital form. Figure 15 shows an overall view of the 16-kip
vibrator.
With this equipment, the vibratory load can be varied at constant
frequencies, and load versus deflection can be plotted. These load-
deflection data are used to compute the dynamic stiffness modulus (DSM)
for a pavement structure. Frequency can be varied from approximately 5
to 100 Hz at constant force levels to produce the frequency response of
the pavement structure. Also, at any selected load or frequency, a plot
of the deflection basin shape can be drawn using data from the velocity
* Green and Hall, op. cit., p. 1.
18

'.. *4~* ,-.. -
I
a, s-I0
s-I
rH
'3)
~I-4a
0)
______________________ H
'3)
0
'3)
H
19

transducers. The WES 16-kip vibrator can also be used to measure the
velocity of shear waves propagated through various pavement layers.
Wavelengths can be measured by manually moving a velocity transducer on
the ground, observing the results on an oscilloscope, and manually
recording the results. This procedure is repeated for different fre-
quencies of loading, and the wave velocity is obtained by multiplying
the frequency times the corresponding wavelengths.
20

EVALUATION RESULTS
OPERATIONAL CHARACTERISTICS
EASE
In evaluating each device for ease of operation, one important
evaluation criterion was the operator training required before opera-
tion. Another criterion was the amount of physical labor required for
a test. Both of these criteria were evaluated equally. The Benkelinan
Beam is the simplest device of all, but in terms of operator training,
* it requires probably as much or more than any of the other devices. The
Benkelman test is a cumbersome test. A truck must be positioned and the
arm placed between the dual tires, the gages zeroed, the truck moved
away, the gage read and recorded, and then the equipment picked up and
moved to the next test location.
The Dynaflect requires about one hour of operator training. The
* velocity pickups must be calibrated, then attached to the device. After
the initial warmup and calibration, the Dynaflect is relatively simple
to operate. There were two different models evaluated under this
project. One had a digital control unit, while the other had a standard
analog control. The digital system had an optional printer system,
which was not evaluated. The digital unit displays the results from all
* four or five velocity sensors. The standard control requires changing
a dial so that each sensor can be monitored using only one meter. To
conduct a test, the vibratory wheels are lowered to the test position.
Another switch is tripped to lower the velocity pickups, the displays
are allowed to stabilize, and the values recorded. The pickups are then
raised. If the test interval is short enough and the pavement is smooth,
the vibrator is left running with the wheels down. When the next posi-
tion is reached, only the pickups have to be lowered. After the initial
setup, and if the vibrator wheels can be left down, the Dynaflect with
the digital control is the easiest to operate of all devices evaluated.
The operational ease of the Models 400 and 510 Road Raters will
be discussed together since they are so similar. These vibrators
r 6 21

require very little calibration. The manufacturer recommends calibra-
tion once a month. The operation then consists of initially removing a
locking mechanism that holds the vibrator in the "up" position. Then,
for a series of tests, the vibrator is lowered to the pavement and
activated at the desired frequency, the force output is checked, and a
switch is engaged to allow reading all four velocity sensors. The
vibrator is then raised and the vehicle moved to the next location. In
comparing the two vibrators, the Model 400 allows easier operation than
the Model 510 since the operator does not have to maneuver a trailer.
The Model 400 with a mirror positioned correctly allows the driver to
easily position the device over a preselected test point. All other
devices require another person to guide over a preselected point.The Model 2008 Road Rater has a digital control unit that also
allows for simple operation. On a normal setup, the support arm for the
velocity gages and the gages must be installed and the pressure in the
* air bags checked. A set of locking bars are removed so that the mass
can be lowered by the hydraulic lift cylinders, and the device is then
ready for operation. In the automatic cycle setting, one switch causes
the vibrator to conduct the test, record the data, and prepare to move
to the next location.
SPEED
The criterion for evaluating speed was established as the time
required to conduct one test, move 100 ft (30.5 in), and then be prepared
to begin the second test. Speed of operation is a function of manpower
requirements. For this evaluation, the optimum case was selected to
evaluate speed. Hence, if a device can be operated by one person but
two are more efficient, speed was evaluated with two operators. The
Road Raters have the capability of operating at varying loads and fre-
quencies. The load of the FWD can be varied by changing the drop height.
For evaluation of operation speed, only one test load and one frequency
were considered.
According to the results of the speed evaluation given in Table 2,
the Benkelman beam and the FWD rank first and second, respectively, in
22

Table 2
Speed of Operation
Daily Time RequiredSet-Up/Calibration per Test
Device Time, min min
Benkelman Beam 10 3-1/h
Dynaflect
Standard Control Unit 20 1-1/4Digital Control Unit 20 3/4
FWD 20 1-1/2*
Model 400 Road Rater 15 1Model 510 Road Rater 15 1
Model 2008 Road Rater 15 1
WES 16-kip Vibrator 60 1-1/2
* Estimated (no production-type tests were conducted).
consuming more time per test than the other candidate devices. The FWD
time could be reduced if the velocity sensors could be mechanically
placed rather than hand placed.
MANPOWER REQUIREMENTS
* Table 3 lists the manpower requirements for each device. Each
device that requires recording of the data by hand is more efficiently
operated by one additional person. Those devices with automatic re-
cording (Dynaflect and Model 2008 Road Rater) do not require the addi-
tional person.
COSTS
INITIAL
Table 4 presents the initial costs based on manufacturers' 1979
prices. Note that the Road Rater is listed in this table as the Model
400A. After completion of the evaluation tests on these devices, it was
learned that neither the Model 510 nor the Model 400 were any longer in
production. Difficulties with the front mounting of the Model 400
23
"PPE,

1q
Table 3
Manpower Requirements
Minimum OptimumDevice No. No.
Benkelman Beam 2 2
Dynaflect
Standard Control Unit 1 2, Digital Control Unit 1 l*
FWD 1 2
Model 400 Road Rater 1 2
Model 510 Road Rater 1 2
Model 2008 Road Rater 1 1
WES 16-kip vibrator 3 h
* With printer.
Table hE.quipment Costs
0
Device Cost
Benkelman Beam $ 666
Dynaflect
With Standard Control Unit 16,000With Digital Control Unit 19,333
FWD (Hydraulic lift, measuresload and three deflections) 28,000
Model 400A Road Rater (doesnot include vehicle) 22,000
Model 2008 Road Rater ho,000
24

resulted in a unit mounted in the rear of' the van, hence the Model 400A.
The mass of the Model 4oQA is 320 lb (145 kg), the same as the Model
510. A Road Rater Model 2000 is also manufactured with a 2,000-lb (907-
kg) mass at a cost of $36,000. This model was not tested during this
study but will deliver one-half the force of the Model 2008.
OPERATING
During this study, the devices were not operated for a long enough
period to establish a precise operating expense comparison. Observations
made during this study and during other projects where candidate
devices were used will be discussed.
The primary cost for operating all the candidate devices will be
attributed to the cost of labor required for operation, assuming that
vehicles are available to tow the trailer-mounted rigs (Dynaflect, and
Models 510 and 2008 Road Raters) and that there is a truck for the
Benkelman Beam. Fuel costs would be approximately the same for all
candidate devices. The Models 510 and 2008 would require some addi-
tional fuel for their power supply engines, but these engines only use
about 5 gal (19 k) in an 8-hr day. This cost would be minimal when an
operator cost of $100 per day is estimated.
Maintenance costs would be nil for the Benkelman Beam. The
- Dynaflect seems to require little maintenance, particularly if it is not
abused. Maintenance was required on two of the three Dynaflects we
observed. One case was caused by not operating according to the manu-
facturer's recommendations (i.e., driving too fast with the wheels down
in the vibratory mode). In the other case, maintenance was required to
the digital system, probably because of lack of use for long periods of
time. In both cases, the devices were corrected in the field with
minimum delays.
The Models 400 and 510 Road Raters require very little mainte-
nance. Maintenance costs are insignificant if a few preventive mainte-
nance steps are followed. The Model 2008 Road Rater is relatively new.
Effects of age and continued use cannot be evaluated. The FWD should
not require any maintenance costs, since it is a very simple apparatus.
25

Therefore, because maintenance requirements are few and fuel costs are
very nearly equal, the operator cost will govern the operating cost for
all devices.
TRANSPORTABILITY BY CARGO AIRCRAFT
The problems associated with transporting the WES 16-kip vibrator
overseas led to the evaluation parameter of transportability. Since
this ?.arge device can only be carried by the C-5 aircraft, any commer-
cial transportation is eliminated. In the evaluation of this parameter,
* it was found that the Benkelman Beam is completely transportable by
practically any means. Since the Model 400 Road Rater has to be per-
manently attached, it has to be evaluated with the truck attached, which
also makes it the largest of the candidates.
In evaluating the trailer devices, it was found that if the air-
port is serviced by a major cargo carrier, all can be transported. If
* the airport does not have a cargo carrier, it will depend on the local
situation as to the transportability. Different carriers have different
operating procedures, and airports have different loading equipment. Gen-
erally, ranking of the trailer devices in terms of their gross weight
would be in the order of the FWD, the Dynaflect, the Model 510, and the
Model 2008. However, according to air cargo personnel at several a4r-
* ports, each of these devices would require the same aircraft. The size
of the van on which the Model 400 Road Rater was mounted would restrictthis device to some extent (i.e., would not fit in the cargo area of a
B-727). Therefore, in rating air transportability, the Benkelman Beam
is first, the Model 400 Road Rater is last, and all the others aregrouped between these two devices.
ACCURACY AND REPRODUCIBILITY
OF MASUREMEThNTS
DEFLECTION
The accuracy of the deflection measurement of the Benkelman Beam
was checked by placing premeasured calibration shims under the beam toe
and recording the readings. A wide range of deflections was selected
26

since the static deflections measured in the Benkelman Beam tests are
generally larger than the dynamic deflections under the vibrators.
Table 5 presents the results of these tests.
Table 5
Accuracy of Benkelman Beam Deflection Measurements
Known Input Measured Deflection Percentin. in. Error
0.0640 0.066 3.1
0.0372 0.036 -3.3
0.0270 0.0279 3.3
0.0220 0.0238 8.2
0.0140 0.0160 14.3
0.0080 0.0083 3.8
0.0190 0.0200 5.3
0.0050 0.0047 -6.0
0.0030 0.0036 20.0
0.0020 0.0024 20.0
Mean Percent Error 8.7
Note: 1 in. = 2.54 cm.
To determine the accuracy of deflection measurements of the
vibrators, a calibrated shake table was used. Each transducer was
vibrated at known deflections on the shake table, and the output signal
from each transducer was recorded on the particular device's data acquisi-
tion system. The calibration of the shake table was based on an MB
Model 1241 vibration transducer, which was precision-calibrated by MB
Electronics.
In Table 6, the results of the tests on the five Dynaflect sensors
are tabulated. Each sensor was vibrated at six different known deflec-
tions ranging from 0.5 to 20 mils (0.012 to 0.51 mm), and the measured
Dynaflect deflection recorded. The percent error in each Dynaflect
reading was also computed (Table 6).
27

4)0
ID -4 N a? -* a
N
Ln4)
CI.. 14 0 U' 0 0 O0 0
0 m. '.0 Hq '0 N m ~
U) r~ H~ r4 0 0 o 00J N o
0. P 0 0 0 0 0 0
0 )
0)0
N
414)
0*493 0 M' 04 \0G". aM . - co N N4 0~ -T
tr) 0v) 0 H U' Nm 0 0
0 4 4)9H 0. U' 0 0 C' 0 0 C
0) 0)0
0r4) 0
0) H, (1 1 u \ \
H- i-= 04
o2 ) . 0 0 U'\ N~ H 000 N: Hj 0 0 0 0d .2 0 0 0 0 0 0
.4 P. 0 0 0 0 0 0 00
o4)o Y 0 0 IL
0 0 .'.
0 15.. U' 0 0 U' 0; 0
d 0)0
0. 05. t') H l N . ' 0 k0 0 H
o N)
.0000) ". U' 9 9 9 -
P. 0 0 0 0 0 0
028

Deflections were measured with the Model 510 Road Rater for eight
known input deflections at frequencies of 10, 20, 25, 30, and 140 Hz
(Table 7). The mean percent error varied with frequency from -3.3
percent at 40 Hz to -26 percent at 10 Hz and with known deflection from
+1.14 percent at 0.00140 in. (0.035 mm) to -16 percent at 0.00040 in.
(0.01 mm) (smallest known input). The mean percent error was greater
than 10 percent for only measurements at 10 Kz and known input deflec-
tions of less than 0.00080 in. (0.02 mm) peak to peak. Velocity trans-
ducers of the Model 510 Road Rater and the WES 16-kip vibrator are
comparable in the accuracy of their measurements. Velocity sensors of
the Model 400 Road Rater are the same as those of the Model 510. The
control box is also the same; therefore, the accuracy will be assumed
similar for both devices.The accuracy data for the velocity sensors of the Model 2008
Road Rater are summarized in Table 8. Note that the deflections pre-
sented are the average for frequencies of 5, 8, 15, 25, and 50 Hz and
* the percent errors presented in the lower part of the table are averaged
for the six known deflections ranging from 0.5 to 20 mils (0.012 to 0.51
mm). Again, this is very similar to the accuracy for the WES 16-kip
vibrator in that the error is greater at 5 Hz and becomes more con-sistent at the other frequencies.
Accuracy tests for the FWD consisted of placing the velocity
sensor of the 'hES 16-kip vibrator beside the sensor of the FWD and
comparing results (Figure 16). This check is not as precise as the
use of the calibrated shake table; therefore, the differences in method
should be considered when comparing the FWD accuracy with the accuracy
of the other devices. This expedient method was used due to constraints
of time and funding.
FORCE AND FREQUENCY
To test the accuracir of force for each device, load cells were
used to measure the output. Frequencies were counted electronically
from the load cell signal in the form of periods.
To measure the dynamic force output from the Dynaflect, a BLH
29

00
0% u 0 00 HH1'0
00.
0
0 81~J 0 N IDOco 00 0 0.0
aO C 000!0000000 C 100000000
r -- --0
0 0)0 N
00~ ~~~C 0) 0.'~0HX0t
0)~~~ CF t~-000 C,
0H0000r00 (
H +4++ +
0 00000)0
0) . 000000000)0
0)
00 0, 00
0) ~ ~ N a, t0 \H 0.-0O cLO
41 0a))
o~ o) N oHCOLooo.o s000000
0)41 N r0) H o c o
0 -SH01 0-.-'000 0.0
3oO~C0t-S0.C

4'
co4 0 ~' zr. 00H 0
(D H H 0 0 H 0 0
r* 9~ tr - 09 -Z!t- -(0 H) 00 0 0
5-1 o M CMN H \D0 \-O _zr I\ 0) CM\D \10 CM' .D0 4 H1 1 1 1 1 1 r E CM
00
004-)0 -3 * C :T 0 ~Cd
0 -t c -0 I' 0 -- t
oC) 0 * C\J a\~ H-T - 0 0 0 P
H 0ND. 0 0 0 0 0 U.H0 a q 0 0 0 0 0 0 r-
a) 4- * r
Cl)j
C. -3 q ~ 0 L \ L\ 0 0 (Y) ON t- CMj H L
c UC-) OH ON ON 00 ON\ 'd0) ON U C0 t:0 X0 $L4F- H H I I H- I > H I I I
C Oc 0) 1 U cd0 1+3 C0 PL
002 0 (1)
E-1 0000j L f\\ ON4 r- 0 \
CMc Lr\ H o H O W U
a) c -1 H 0 0 0 H 0 0 04-' 0lI ) rl 0 0 0 0 0 0 Q).0P C)
Q~C C)) 0
00
a;~~~r 0~- W4 H 0 M Zt~ - 0
Q )Q 0 0
4 I 1 1 1 H- I H I I I I j
C)j 01 I-q _:I m L p(n~~ ~ ~ -i \0 oc -
V co H\ W O O r- 0 .4
0d -1 0 N - 0 0 a) M 0);-Q) Hi 00 0 00 pq0i
0 ) 0 H
00 0) 0 0 U\04
4-) 0 0 U-\CM H O 0 w. 0CM H - 0 00 0 W UNO co Lr 0 2)
0 040C C )C 0 N~ Lr 4 *
31
.4-3
0
4-0
s0
-CD
10Hj~c
0
4 44444
UI
H
4L -,q
4r-4
SI *3*3 0H13 0)II~
320
77* A-
load cell was placed under each of the steel loading wheels, and the
results were tabulated (Table 9). Since the Dynaflect force is a com-
puted value and is assumed to be constant, tests were conducted to see
if this force actually remained constant with variations in deflection
of the loaded surface. Both rigid and flexible pavements were tested
to determine if the high deflections on flexible and lower values for
rigid might influence the force output. Changing the amuount of deflec-
tion did change the error in load. The frequency dial on the Dynaflect
control is divided by tick marks with 8 Hz being in the center of the
dial. Frequency was measured with the frequency adjusted so that the
dial registered one mark above and again at one mark below 8 Hz.
* Table 9 also presents these test results.
The impulse load input to the ground surface was measured for the
FWD by dropping the weight on three BLH load cells sandwiched between
two 18-in.- (45.7-cm-) diam steel plates. Plates were firmly bolted to
the load cells. The FWD plate was placed on top of this sandwiched
construction. Measured loads were determined from oscillograph records
of the load signal. Table 10 summarizes the results of these tests.
As noted, the measured force was consistently higher for the different
drop heights.
For the Model 510 Road Rlater, the same sandwiched load cell
apparatus was used to measure the load. Table 11 shows the comparisons
of calculated to measured peak-to-peak loads. Loads were compared
at frequencies of 10, 20, 25, 30, and 40 Hz. Calculated loads were
consistently higher than measured loads but tend to agree best at high
loads and higher frequencies. The worst agreement was at a measured
load of 1100 lb (4893 N) and 25 Hz where the calculated load minus the
measured load expressed as a percentage of the measured load was -57.3
percent. The best agreement was also at 25 Hz and measured load of 2075
lb (9230 N) where the percent difference, computed as above, was -12.3
percent.
rAgain, the Model 400 was not tested, but being so similar to
the Model 510, differences in measured and calculated loads should be
similar. Accuracy of frequency was not tested on the Model 510 Road
33
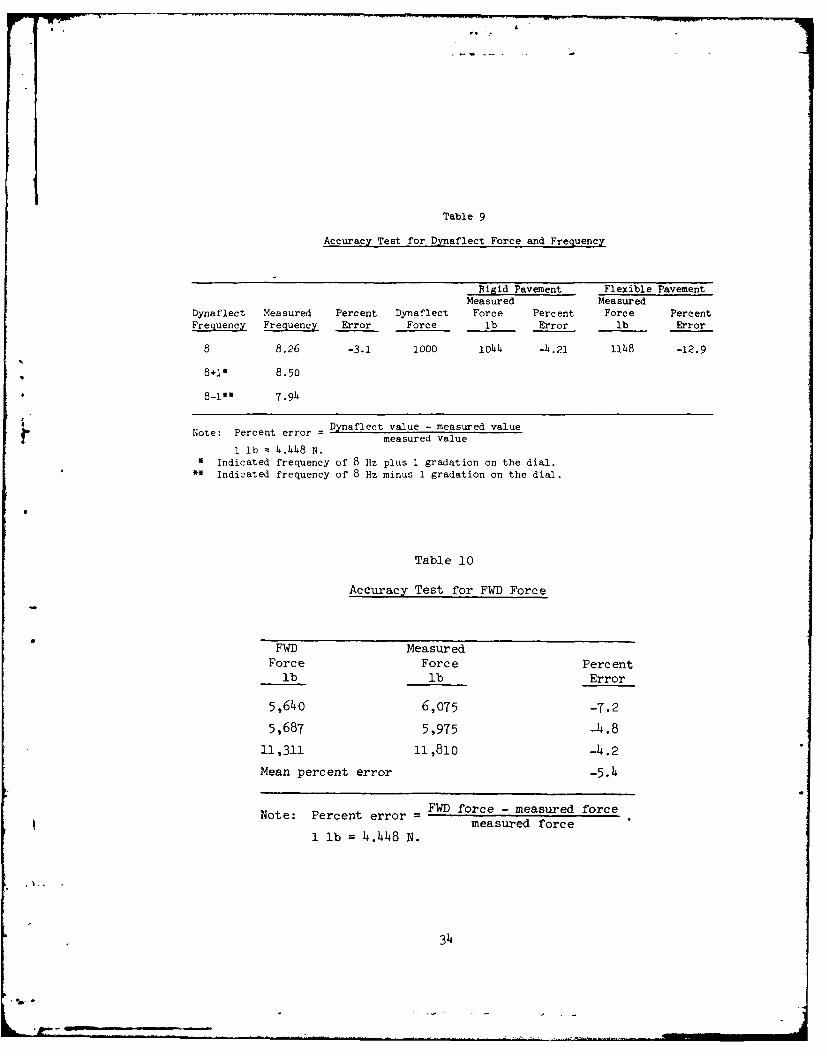
Table 9
Accuracy Test for Dynaflect Force and Frequency
Rigid Pavement Flexible PavementMeasured Measured
Dynaflect Measured Percent Dynaflect Force Percent Force PercentFrequency Frequency Error Force lb Error lb Error
8 8.26 -3.1 1000 104 -h.21 l148 -12.9
8+1" 8.50
* 8-i** 7.94
Note: Percent err Dynaflect value - measured valueerror measured value
1 lb = 4.4h8 N.Indicated frequency of 8 Hz plus 1 gradation on the dial.
* Indicated frequency of 8 Hz minus 1 gradation on the dial.
Table 10
Accuracy Test for FWD Force
FWD MeasuredForce Force Percent
lb lb Error
5,64o 6,075 -7.2
5,687 5,975 -4.8
11,311 ii,81o -4.2
Mean percent error -5.4
FWD force - measured forceNote: Percent error =measured force
1 lb = 4.448 N.
34

Hox
-P0). . . .
to Iw \I C; i III l lir \116
0
0.
.4J O%
H. 01
'-I H- ., rI 000U\ r- 0000 0 00C)0 000 00
0 N m t- cm 00 0O0o _c-0 C\ L\0 4 l 00 Y)t 0LI m.00
t.- HH HH\J H CJ'
0.)a) N+ ID0 0 0 0 3\L\U\ 0 0 0
-400 0
r%) A~
*3

Rater, but by counting cycles on oscillograph output, a good agreement
in frequency was indicated.
Being a vibrator with a variable frequency and force capability,
the Model 2008 Road Rater required much more testing. The force and
frequency were varied to check the accuracy. Accuracy checks (Table 12)
were made at two force levels of 3,000 (13,445 N) and 5,000 lb (22,241
N) over a frequency range from 5 to 50 Hz. The frequency was generally
between 3 and 4 percent higher than the measured frequency, whereas the
indicated load was about 4.5 percent lower than the actual measured
load. During another test for accuracy, the force signal was filtered
* with a band pass filter which removed all harmonics that may add to or
' subtract from the input signal. By filtering the force signal, the
percent error was reduced to less than 1 percent (Table 13). The
force signal will be presented later to illustrate this error.
FORCE, VELOCITY, AND
DEFLECTION SIGNALS
* To better understand the parameters inputted to the pavement and
the response of the pavement to these parameters, traces of the force,
velocity, and deflection are discussed. Figure 17 presents the Dyna-
flect signals. The sine wave for each parameter is excellent; however,
the velocity signal does show some overriding noise. Figure 18 shows
the force and velocity for the FWD. Note that the response on the FWD
registration equipment records only the first peak. During accuracy
testing of the FWD and also on the depth of influence tests to be dis-
cussed later, deflections were calculated by measuring with a planimeter
the area under the velocity trace. The electronic system used for
accuracy tests on the other vibrators required a steady-state signal to
integrate velocity for deflection determination.
For the Model 510 Road Rater, only the force signal was recorded.
The traces are for loads near the upper limits for frequencies of 10,
20, 25, 30, and 40 Hz (Figure 19). These traces approach a sinusoidal
solution. The Model 400 Road Rater was not available for this type
testing, but except for magnitude, the shapes will be similar to those
of the Model 510.
36

r ~ VW - ..
0 0
41
0 l 40u fn0NY% C0U' tU' W% t- -- _r v 0
I l 0mf 0 W' N' 0 C' CY 0-0 t- 0 0000 U' (M - CM' 0 -k00 l UC 001 0C huU%0Gomt %000Uct%14 It C% M t -1 t
.o 0%0.04 C 0 0 H U'I H 00 0%0 0 0 0 O0O
m 0 m : : z c %% 0t otI -C uw
4) 0
*v -d o' m\ 0 U'O %O%0 H- 0 ()%-v U'% ('U'- U'0 U'H M ^04 mc \mcj0 \G ot o\ HH HH HH NN \-t(I( n .I3. *U'H
0l v c \ar0 00'0-o mU'00000a,0
o~4 0)1
00C)) 0 4 C4%) fc t- -
S. a r oL - ~ : - z nt o_ - T0( A1o4 ad 410 O %-T0MD AM\D0 r ' -f000 I 0Mx 4
0 ) .-
441 oD 0 c c n- 9o .t-) NU . Nu\u - u -Cj0 Nc r r mL\
w F4f N m m N~ 3 41 H 4)
41 mNN m 4) 40
443In 1.1 0''00 k9UUU''UU'0' In4) \ 1 9r - ! ?1 9rc\
I I)1 ~-4m0m-\00U''UM005NN 5.--N40NC1''%U 0 4 a0
M . >~" (vNN 1 ' Mt N ~ N % O 04
_v 0%v 4\ 1 G 4 0000W 0 . -00
o0 H ) 4) 0- 4' 4C cj(4C \o
0 43
0 o
1:0
$4 0
37.

Table 13
Accuracy Test for Model 2008 Road Rater Force and Frequency(Measured Force Filtered)
RR2008 Measured RR2008 MeasuredFrequency Period Frequency Percent Force Force Percent
Hz millisec Hz Error lb lb Error
5 226.0 4.43 12.9 5187.5 4743.5 9.46 186.0 5.38 11.5 5307.5 5078.3 4.57 156.6 6.39 9.5 5150.0 5213.5 -1.2
, 8 134.5 7.43 7.7 5152.2 5252.2 -1.99 118.2 8.46 6.4 5055.0 5118.1 -1.2
10 105.0 9.52 5.0 5010.0 4913.1 2.011 95.0 10.53 4.5 5005.0 5085.5 -1.612 86.8 11.52 4.2 5042.5 5106.0 -1.213 79.3 12.61 3.0 5087.5 5226.2 -2.714 73.7 13.57 3.2 5077.5 5219.0 -2.715 68.5 14.60 2.7 5082.5 5029.7 1.016 64.2 15.58 2.7 5077.5 5115.4 -0.718 56.6 17.67 1.9 5047.5 5064.2 -0.320 50.8 19.69 1.6 4975.0 4905.4 1.422 45.8 21.83 0.8 5000.0 4912.5 1.824 42.0 23.81 0.8 4997.5 5111.9 -2.226 38.4 26.04 -0.2 4970.0 5016.9 -0.928 35.6 28.09 -0.3 4982.5 5030.3 -1.030 33.3 30.03 -0.1 5250.0 5169.2 1.635 28.2 35.46 -1.3 5037.5 5169.6 -2.6
- 40 24.6 4o.65 -1.6 5062.5 5303.7 -4.545 21.8 45.87 -1.9 3950.0 4174.3 -5.4
* 50 19.7 50.76 -1.5 2985.0 3261.5 -8.5
RR2008 value - measured valueNote: Percent error = × 100 .measured value
1 lb = 4.448 N.
38

0.1 SEC
8 Hz, FORCEI
0.1 SEC
8 Hz, D,,VELOCITY
0.1 SEC
8 Hz, D,,DEFLECTION
Figure 17. Dynaflect signals
39
..7; .
RESPONSE IS TAKENFROM THIS PEA K ONLY
FORCE
VELOCITY
Figure 18. FWD sinl
* .-. .4o

10 HZ 20 HZ
*0.1 SEC 0.01 SEC
25 HZ 30 HZ
0.01 SEC 0.01 SEC
40 HZ
0.01 SEC
Figure 19. Model 510 Road Rater force signals
* ~* *41

Figure 20 precents the force signals for the Model 2008 Road
Rater. Note that at low frequencies the signal does not resemble a
sinusoidal motion. Thus, when this signal is filtered as reported
previously, there is a much better agreement to the load reported by the
Model 2008. According to the manufacturer, the load signals from each of
the three load cells are summed and the peaks are averaged to give the
dynamic force. The signal equipment used to monitor these loads during
the accuracy test.'ng, which is the same as used by the WES 16-kip
vibrator, selects the peak force signal and holds this until the voltage
(signal) crosses zero. At this time, it resets and captures the next
peak. Filtering of these signals provides a much improved sinusoidal
motion to be sampled. Figure 21 presents the Model 2008 Road Rater
velocity signals. Again, only at the higher frequencies do they even
approach a sine wave. The Model 2008 deflection signals (Figure 22)
are shown for three different frequencies. Even after integration the
signal at 5 Hz is ragged. Both the 15- and 26-liz signals approach a
sine wave.
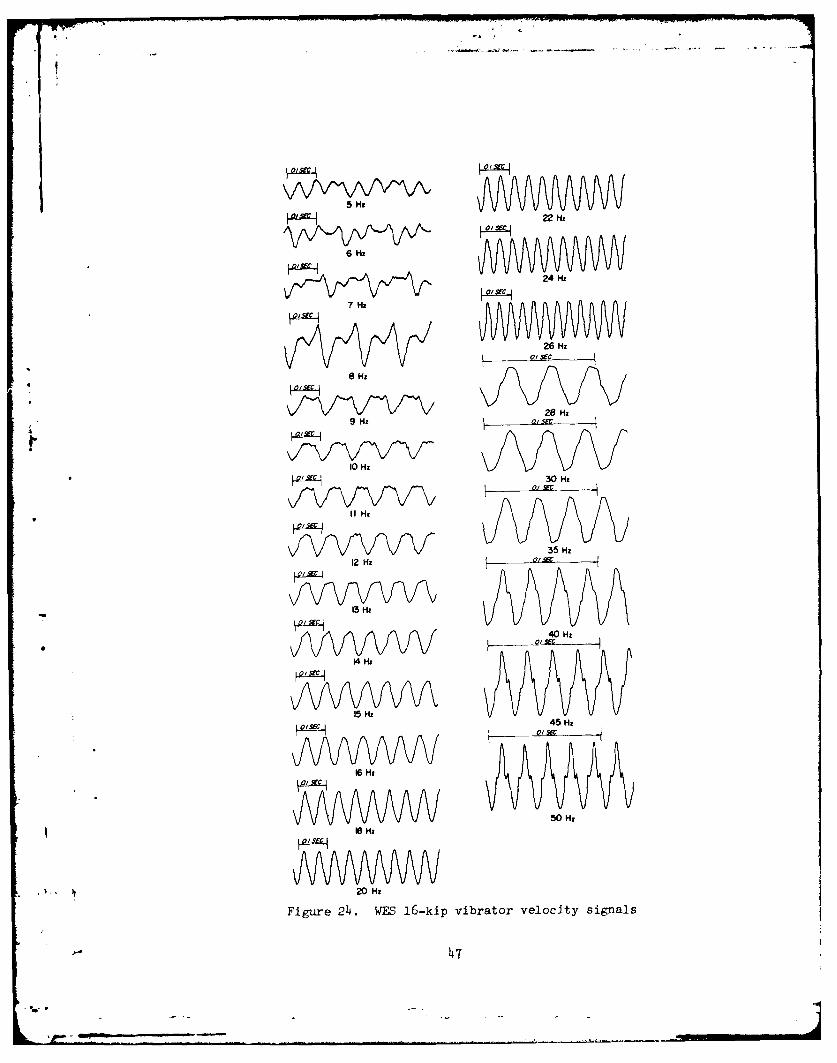
To compare the signals of these devices, the force, velocity,
and deflection signals from the WES 16-kip vibrator are presented. The
force signals (Figure 23) are ragged below 10 Hz and above 35 Hz.
Between these extremes, the sinusoidal motion is good. This band is
narrowed for the velocity signals between 15 Hz and 24 Hz (Figure 24).
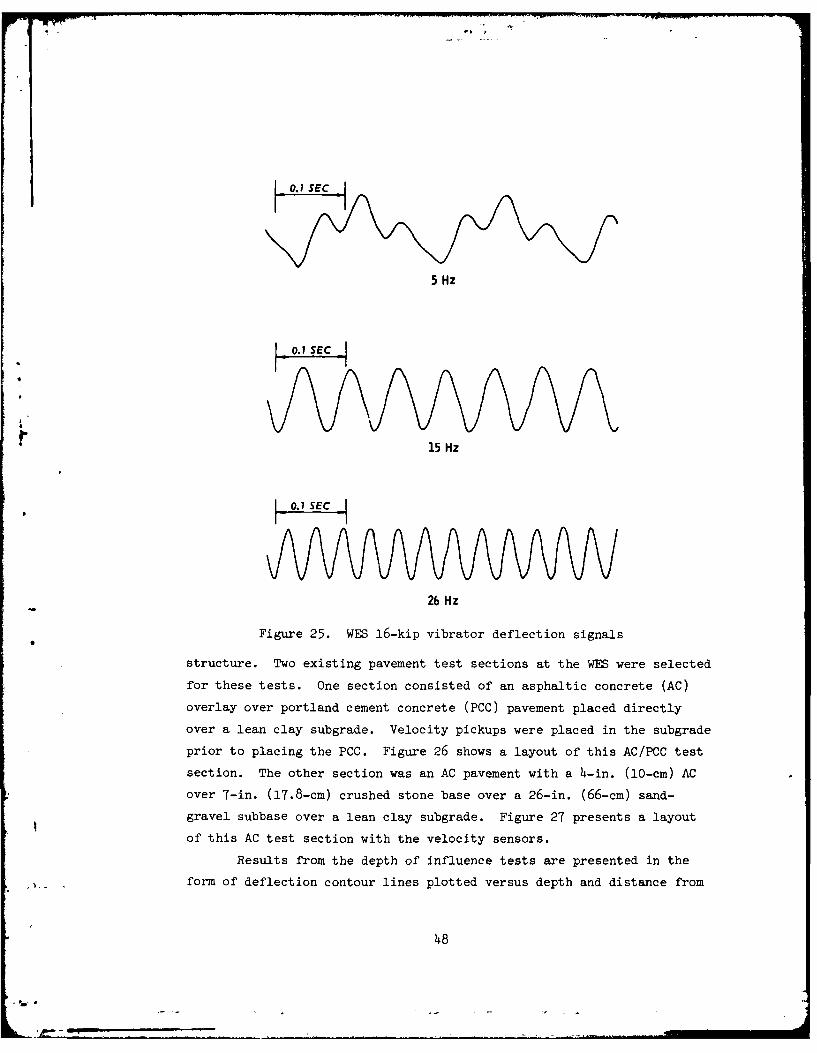
* Deflection signals are shown for three frequencies (Figure 25). As with
the Model 2008 Road Rater, the 5-Hz signal is very ragged, whereas the
15- and 25-liz signals are sinusoidal.
DEPTH OF SIGNIFICANT INFLUENCE
The determination of the depth of significant or measurable
dynamic influence from the various devices was accomplished by placing
velocity transducers iii h'e pavement foundation at different depths.
Deflections were then measured at the different depths as a result of
the input loading. The loading device was located directly over the
velocity transducer and at various offset distances to evaluate the
capability of the input loading to adequately excite the entire pavement
42

5 Hz 12 Hz 24 Hz
6 Hz 13 Hz 26Hz
• 28 Hz
7 Hz 14Hz oSC28H
I2Lv SE 0 SEC
\/30 Hz15 Hz
8 Hz
/
oA
V35 HZ
II 6Hz
9Hz 01 Sir
40HZi
~L I 10 Hz 0/SE
45 Ht20H Ki~
11 Hz
50 Hz
22 Hz
Figure 20. Model 2008 Road Rater force signals
143

5 Hil 15"HZ
6Hz 30Hz
16 Hz
I 18Hz 35 Hz8Hz
9 Hz
22 Hz
2 Hz
45 Hz
00
24 th12 Hz / E
50 Hz
13 Hz I26 He
14 Hz
28 Hz
k. Figure 21. Model 2006 Road Rater velocity signals
4)4

0. 1 SEC
5 Hz
0.1 SEC
15 Hz
0.1 SEC
26 Hz
Figure 22. Model 2008 Road Rater deflection signals
45

5 Hz 16 z
6 Hz 18 HE
7 Hz
8f J22 H
24 Hz
. I 0 si
VI(0 Hi
28 Hz
I0 Hz
12 Hz 35 Hz
\f~~fVVV\01 SECf\f /13 Hz 40 Hz
\/VVw~\N y &YAmKVv14 Hz 45 Hz
fAJNVv"A vVN15 Hz 50 HE
Figure 23. WES 16-kip vibrator force signals
46
5HzH
6 Hz
724H
26Hz
9 Hz
28Hz
0OHz x
* I2LM~A30 Hz
35Hz12 Hz
Ip/w13Hz
40 Hz
14Hz
15Hz N45 Hz
16Hz
6Hz~
Figure 214. wEs 16-kip vibrator velocity signals
5 Hz
0.1 SE C
15 Hz
26 Hz
Figure 25. WES 16-kip vibrator deflection signals
structure. Two existing pavement test sections at the WES were selected
for these tests. One section consisted of an asphaltic concrete (AC)
overlay over portland cement concrete (PCC) pavement placed directly
over a lean clay subgrade. Velocity pickups were placed in the subgrade
prior to placing the PCC. Figure 26 shows a layout of this AC/PCC test
section. The other section was an AC pavement with a h-in. (10-cm) AC
over 7-in. (17.8-cm) crushed stone base over a 26-in. (66-cm) sand-
gravel subbase over a lean clay subgrade. Figure 27 presents a layout
of this AC test section with the velocity sensors.
Results from the depth of influence tests are presented in theform of deflection contour lines plotted versus depth and distance from
h8

40P AC
11" PCC
37" 03 vp-i
68 ___, _LEAN CLAY SUBGRADEo VP-2
0 VP-3
Figure 26. Layout of the AC/PCC instrumentationsection (1 in. = 2.54 cm)
- E I 4" AC3 vp1 7" CRUSHED STONE BASE
S m 0 VP-2
• 37"
26" SAND GRAVEL SUBBASE
72" _ _ _ _ _ _ _ _ _ _ _ _ _ _ _ _ _ _ _ _ _
o VP-3
LEAN CLAY SUBGRADE
03 VP4Figure 27. Layout of the AC instrumentationsection (1 in. = 2.54 cm)
49
r F7' 7.. .. ,
the applied load. Figure 28 shows the test results of the Dynaflect
and the WES 16-kip (7.3-metric ton) vibrator operating at the same load
and frequency on the AC section. Note that the Dynaflect has higher
deflections near the surface and center of the load. This is due to the
smaller contact area. Away from this area, the contours are similar.
The FWD tests on the AC section (Figure 29) produced about 10 times
greater deflections than the Dynaflect at the 60-in. (1.5-m) depth.
Figure 30 illustrates the contours for the Model 2008 Road Rater and the
WES 16-kip vibrator operating at 15 Hz and 7,000-lb (31,138-N) force.
* These deflections at 60 in. (1.5 m) are similar to those for the FWD but
are less near the surface under the applied load. Again, the contact
pressure is greater for the FWD. (One hundred psi (70,310 kg/m2 ) for
the FWD and 27.5 psi (19,335 kg/m2 ) for the Model 2008 Road Rater.)
Tests were not conducted on these sections with either the Model 400 or
Model 510 Road Rater.
Figure 31 shows the depth of influence contours for the Dynaflect
and the WES 16-kip vibrator on the AC/PCC instrumented section. The
deflections of the WES 16-kip vibrator are greater than those for the
Dynaflect at all locations but particularly near the surface. This
could be attributed to the mass of the vibrator. The higher contact
pressure for the Dynaflect will have little significance on the PCC
pavement due to the stiffness of the upper layer. The FWD tests on the
AC/PCC section (Figure 32) again obtained roughly 10 times the deflec-
tion of the Dynaflect with depth. Figure 33 illustrates the results of
the Model 2008 Road Rater and WES 16-kip vibrator tests. As expected,
these deflection contours are less than the FWD. To compare all deflec-
tions, the WES 16-kip vibrator was tested at a normal operating force
level of 10,000 lb (44.48 kN) peak (20,000 lb (88.96 kN) peak to peak).
The tests results shown in Figure 34 indicate that these deflections are
3 to 4 times the values of the FWD and Model 2008 Road Rater, and 25
times the Dynaflect.
SUITABILITY FOR USE IN EVALUATINGLIGHT AIRCRAFT PAVEMENTS
Suitability for use in evaluating light aircraft pavements was
50

DISTANCE FROM CENTER OF LOAD, IN.10 20 30 40 so so 70 80 90 100 110 120
0*.. -S
20
/ ~ IfIIf /1 # // / I
i5 / / . / / I / •
-/ _° $ .. / / / /60o / ,/ /+
/-o I I //>8HZ, 1000 LB, PEAK-PEAK
,70 -WES 16-KIP VIBRATOR
,-Y/ / //
Figure 2 . Depth of influence contours for the Dynaflectand the WES l6-kip vibrator on the AC instrumented section(i mul 25.14 microns; 1 in. = 2.514 cm; 1lib = 4.1448 N)
DISTANCE FROM CENTER OF LOAD, IN.
Uo0 10 20 30 40 50 60 70 80 90 1i00 110 120
4L
0
30
2
S11H 000 LB, PEAK
uJ FALLING WEIGHT
70 -
8o
Figure 29. Depth of influence contours for the WD on theAC instrumented section (1 mil = 25.4 microns; 1 in. =
2.54 cm; 1 lb = 4.448 N)
51
bo .S,

DISTANCE FROM CENTER OF LOAD, IN.10 20 30 40 50 60 70 s0 90 100 110 120
10-
2; I
20
- I
Z
.W
44
80 'w .0,.1 o 15 HZ, 7000 LS, PEAK-PEAK-
.0, --,- WES 16-KIP VIBRATOR70 - / --- MODEL ROAD RATER 2M
80--
Figure 30. Depth of influence contours for the Model 2008 Road Raterand the WES 16-kip vibrator on the AC instrumented section (1 mil25.4 microns; 1 in. = 2.54 cm; 1 lb = 4.448 N)
DISTANCE FROM CENTER OF LOAD. IN.0 10 20 30 40 50 60 70 80 90 100 110 120
0 1 1 1 1 1 14-AC I I I I I I
10 11" PCC
3
>0 -ro
.0
€' / --__
PW .ao~a:
7o L 8 HZ, 1000 LB, PEAK-PEAK
-WES 16-KIP VIBRATOR-- DYNAFLECT
Figure 31. Depth of influence contours for the Dynaflect and theWES 16-kip vibrator on the AC/PCC instrumented section (1 mil =25.4 microns; 1 In. = 2.54 cm; 1 lb = 4.448 N)
52

DISTANCE FROM CENTER OF LOAD. IN.
0 10 20 30 40 50 s0 70 80 90 100 110 120
1~4 AC1
10 1., PCC
7U
U) ,
30
w
> 40a.
2 4
a 0-S - 11,000 LB, PEAKa QFALLING WEIGHT
60
70 .
Figure 32. Depth of influence contours for the FWD on the AC/PCCinstrumented section (1 mil = 25.4 microns; 1 in. 2.54 cm;1 lb = 4.448 N)
DISTANCE FROM CENTER OF LOAD, IN.) 10 20 30 40 50 60 70 80 90 100 110
I I I I I I4" AC 1 I I 1
10- 11 PCC
" -.20 - 01 I
U) //U'30 -- 3 0il10
I.-- /
/ 2.
> 0
__ _.,,....--/ 15 HZ, 7000 lb, PEAK.PEAK/ " -WES 16-KIP VIBRATOR
70 // -- - MODEL ROAD RATER 2006
Figure 33. Depth of influence contours for the Model 2008 Hoad'.- R ater on the AC/PCC instrumented section (1 mil =25.4 microns;
1 in. = 2.514 cm; 1 lb = 14.418 N)
53• ~~ ~ s ." -e tt,, .. I II

DISTANCE FROM CENTER OF LOAD, IN.
0 10 20 30 40 50 60 70 s0 90 100 110 1200 I ! I
1 4"AC' i I I ,10 - 11" PCC
0-0......... .. .AIDIL 6
z" 50-
0
15 HZ, 20.000 LB.PEAK-PEAK
70- WES 16-KIP VIBRATOR
Figure 34. Depth of influence contours for the WES 16-kip
vibrator on the AC/PCC instrumented section operating at anormal force level (1 mil = 25.4 microns; 1 in. = 2.54 cm;
1 lb = 4.448 N)
rated in the final analysis based upon the ability of the input loading
to produce a pavement response of sufficient magnitude to achieve con-
sistently reliable measurements for a full range of light aircraft pave-
ment thicknesses and foundation conditions.
PENNSYLVANIA TRANSPORTATIONRESEARCH FACILITY TESTS
The Pennsylvania Transportation Research Facility (PTRF), de-
scribed by Kilareski et al.,* was used as one of the field test sites.
The PTRF has 21 flexible pavement test sections with varying thicknesses
of AC, base and subbase (Figure 35). Three of the sections, 9, H, and
14, were rutted and thus were not tested. Sections la-ld, 7, and 8 were
superelevated. The Models 400, 510, and 2008 Road Raters, the Dynaflect,
* W. P. Kilareski et al., "Modification Construction and Instrumenta-
tion of an Experimental Highway," Report No. PT17607, PennsylvaniaDepartment of Transportation, Harrisburg, Pa., 1976.
54

ENTRANCE
4 14
+ 2 8 A 2 28E
1C
0 00822 22 88 22 22 22
++ + 01 0
0 86
. .... .. .. .. .. .. LEGEND.. ..
AGGREATE EMEN E.:.. SBBAS
BIUINU SURAC SUaIGRADE, 0
E J BIUINU COCRT TRNITO +ONE
NOTE:N SETO BmIETN GRGTSECIO C Mtn AGGREGATEN1
SETO RVLAGGREGATESUBE
at Ithe INOUF (hCNEsEs are SIIO in Onc Es 1inAGRGT BI.5INOU cm)GTELM PZOA
OE5 RUHD5TN

and the WES 16-kip vibrator were used in the testing. Tests were con-
ducted at 25-ft (7.6-n) intervals alternating between the inner and
outer wheel paths. In addition, four Benkelman Beam tests were conducted
in each section at designated positions. These were paired tests with
one in each wheel path. The beam testing was completed two weeks prior
to the dynamic testing. Additional tests with the vibrators were con-
ducted in the shorter alphabetically labeled sections to give a better
statistical average. Generally, there were 8 to 15 test locations in
each test section. These additional tests were located in the opposite
* wheel paths. Table 14 presents the loads and frequencies at which the
vibrators were tested.
Table 14
Test Loads and Frequencies for Vibrators
Dynamic LoadFrequency Peak to Peak
*Device Hz lb
Dynafl ect 8 1000
Model 400 Road Rater 25 726
Model 510 Road Rater 25 1800
-Model 2008 Road Rater and 8 1000WES 16-kip vibrator 25 1800
15 10001530
15 300015 5000
Note: In addition to the above tests, a load sweep was conducted withthe WES 16-kip vibrator at 15 Hz with the load varied from0 to 15,000 lb (1 lb =4.448 N).
Temperature adjustment. During the testing at PTRF, the surface
temperature of the pavement was monitored at regular intervals. Using
the Asphalt Institute method,* which incorporates the previous five-day
mean air temperature, asphalt thickness, and surface temperature, mean
pavement temperatures were calculated for all test items and test
SAsphalt Institute, op. cit., p. 3.
56

r"- -
times. Mean pavement temperatures varied from a low of 68'F to a high
of 98*F. To establish an adjustment for temperature, selected test
points in items of varying AC thickness were tested with each device at
periods of high and low temperatures. Results from these tests were
inconclusive since the extreme high and low temperature times could ro
be anticipated. There was a trend in these data which indicated that
the adjustments given by Green and Hall* would apply. Further study
indicated that the corrections for the Benkelman Beam by the Asphalt
Institute bisect the geometric center of the Green and Hall* cor-
* rection (Figure 36). Additional temperature adjustment data were
obtained from the Minnesota Department of Transportation. These data
were taken with a Model 2000 Road Rater on conventional and full-depth
asphalt pavements. The results also presented in Figure 36 show that
the conventional pavement correction is near the 4-in. (10.2-cm) asphalt
curve and that full-depth approaches the 8-in. (20.3-cm) curve. Based
on these factors, it was decided to use the WES correction factors for
the PTRF temperature correction. For the DSM, the adjustmenL factors
are multiplied times the measured DSM to obtain the corrected value.
For deflection, the adjustment factors are divided into the measured
deflection to give the corrected deflection. Sections with AC thick-
nesses of less than 3.0 in. (7.6 cm) were not corrected.
Test results. Avelage deflections for each device given in
Figure 37 are corrected for temperature as described previously. For
the WES 16-kip vibrator and the Model 2008 Road Rater, the frequency was
15 Hz and the force was 7000 lb (31.135 kN) peak to peak. Note that
there are no data for the Model 2008 on sections ic, ld, and 7. This
was due to the superelevation of the test track. It was discovered that
the loading plate (Figure 38) would not contact the pavement evenly due
to the lowering mechanisms. Also, tests were not conducted in section D
because rutting would not allow the plate to rest evenly on the pave-
ment. Figure 39 shows the coefficient of variation for each test sec-
tion and each device. These coefficients correspond to the deflections
* Green and Hall, op. cit., p. 1.
57

C!
- C.
04 f
< ccw
0 a.
m - 'n
I p
2 OS00 0,Vd~J <Nhw. wV-
< < -4, - ------- -- -- a

o 5-
0-
Sj RR08
-r PT TST TE
RR91

40-
+ RR2008
* RR51035- RR400
WES16DYNA
30-
0 25-
20-
z
-15-
LL
W
10-
5-
0- -rI I I 1 1 -- 1 rT I I T •t 11
la lb 1c Id 2 3 4 5 6 7 8 A B C 0 E F GPTRF TEST ITEM
Figure 39. Coefficient of variation of measurements for* each device in each test section
in Figure 37. Since only four tests were conducted with the Benkelman
Beam, the coefficient of variation would be meaningless and is not
presented.
The primary test for evaluating airport pavements with the WES
16-kip vibrator has been the DSM. During this test, the load is varied
from 0 to 30,000 lb (133.4 kN) (peak to peak) and plotted against the
resulting deflection. The DSM is defined as the slope (load/deflection)
of the upper one-third portion of this line. The method for calculating
the DSM is as follows:
DSM 28 - 20 kips/in.A -A0(28) 0(20)
60
where
DSM = Dynamic Stiffness Modulus, kips/in.
28 - 20 = selected peak-to-peak force levels, kips
A = deflection of the loading plate from the0(28) 28-kip (124.5 kN) load, in., peak to peak
A = deflection on the loading plate from the0(20) 20-kip (88.96 kN) load, in., peak to peak
Since the Model 2008 Road Rater has the capability to vary loads as the
WEs 16-kip vibrator, another stiffness was calculated for comparison
during this study. Since the mass of the Model 2008 Road Rater is one-
fourth the size of the WES 16-kip, the force values in the DSM equation
• were divided by four and the DSM is termed LDSM. A DSM value for the
* WES 16-kip vibrator was computed at force levels comparable to the
*Model 2008 and is also termed LDSM. Therefore, the resulting modulus is
expressed as
LDSM (7) 5) kips/in.A -A0(7) 0(5)
where
F ( F7 = force level within 10 percent of 7 or 5 kipsF 7 j , (31.1 or 22.2 kN) peak to peak
A = deflection associated with the 7-kip (31.l-kN)
0(7) force, in., peak to peak
A = deflection associated with the 5-kip (22.2-kN)0(5) force, in., peak to peak
All modulus testing was conducted at 15-Hz frequency. In some cases for
the DSM, the resulting deflection associated with the 20- and 28-kip
(88.96- and 124.5-kN) loads would be of a magnitude that exceeded the
range of the velocity sensors. Therefore, the force would be terminated
at that point. The DSM in a case such as this would be the slope of the
upper one-third portion of the plotted line. The lower plot of Fig-
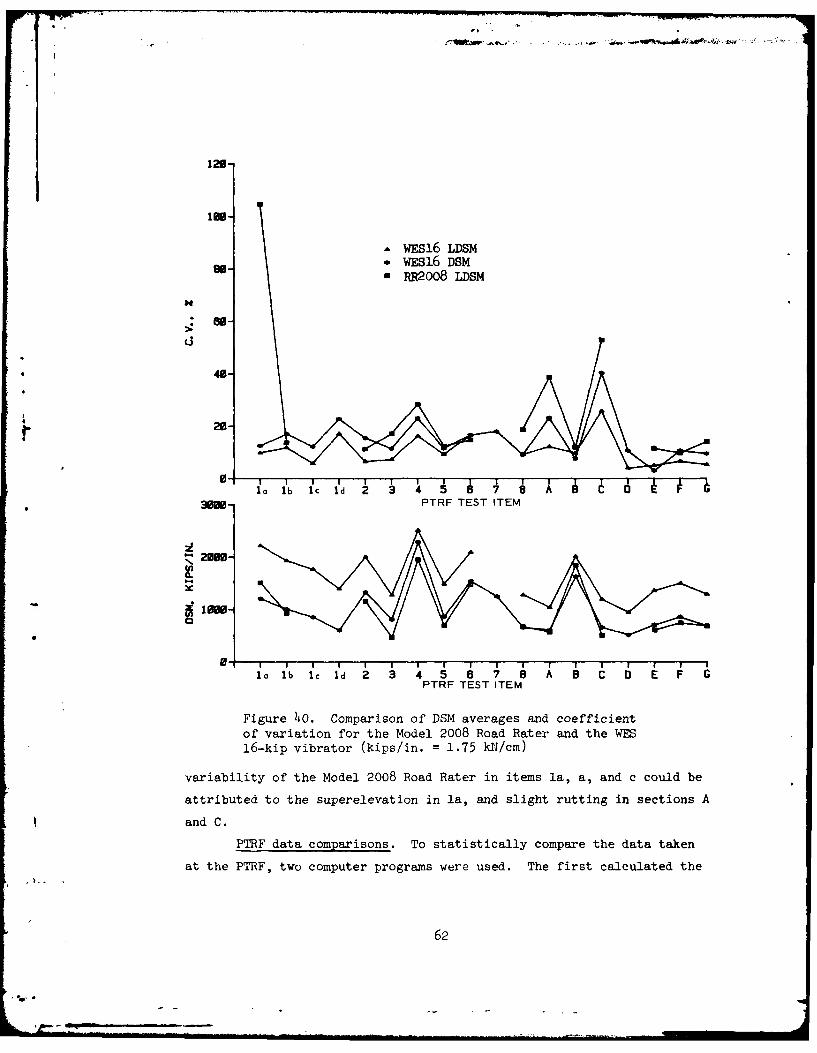
ure 40 shows a comparison of the average values for each test item of
the PTRF. A very interesting note is that the Model 2008 Road Rater
LDSM tracks very close to the DSM, not the LDSM. Also shown in Figure
40 is the coefficient of variation for each test item. The high
61
123-
in-
A WES16 LDSM1811 WEsl6 DSM
- RR2008 LDSM
4'-
20-
r° la b Ic Id 2 3 4 5 8 7 8 B C D E F G
3000- PTRF TEST ITEM
2!9
00
1. lb ic Id 2 3 4 5 6 7 8 A B C 0 E F GPTRF TEST ITEM
Figure 40. Comparison of DSM averages and coefficientof variation for the Model 2008 Road Rater and the WES16-kip vibrator (kips/in. = 1.75 kd-/cm)
variability of the Model 2008 Road Rater in items la, a, and c could be
attributed to the superelevation in la, and slight rutting in sections A
and C.
PTRF data comparisons. To statistically compare the data taken
at the PTRF, two computer programs were used. The first calculated the
62
--- -- - -

best fit line through the origin. The second program fit six different
curves to the data. These possible curves are given as
y = a + Bx
y = AeBx
y = AxB
y = A + B/x
y = 1/(A + Bx)
y = x/(A + Bx)
To compare these data, only those test locations where both of the
devices in question were tested were used. The results of the com-
parisons with the Benkelman Beam (Table 15) show that very poor corre-
lations were obtained in all cases. The comparisons for the Dynaflect
(Table 16) indicate that good correlation was obtained when compared
with the WES 16-kip DSM. The Model 400 Road Rater comparisons (Table
17) show that a fair correlation is obtained with the WES 16-kip DSM.
The comparisons for the Model 510 Road Rater (Table 18) show that the
best correlation with DSM is obtained in this case. Table 19 presents
the comparisons for the Model 2008 Road Rater. Summaries of these
tables are given in the analysis portion of this report.
TESTING ON PCC PAVEMENT
Tests were conducted on a PCC road at the WES with the WES 16-kip
vibrator, the Dynaflect, and the Model 2008 Road Rater. The Benkelman
Beam and the FWD were also used in a limited number of test locations.
The pavement section on this road consisted of a 6-in. (15.2-cm) wire-
reinforced PCC over a 6-in. (15.2-cm) clay gravel base over a lean clay
subgrade. Figure 41 presents the results of deflection tests, which
show a close relationship between deflections of the Model 2008 Road
Rater and the WES 16-kip vibrator and no relationship with deflection
of the Benkelman Beam. Figure 42 compares the slope of the deflection
basin Leasurements from the Dynaflect, the Model 2008 Road Rater, and
the WES 16-kip vibrator. The deflection basin is defined as a ratio of
the deflection 36 in. (91.4 cm) from the center of the applied load
divided by the deflection at the applied load. The Dynaflect follows
63

U, ~
00 "0
C~) -
1t 0 0 0 0 0 0 0 C) 0 0 0 0 0 C)
C) - 0. 0) -, 0) C- '0 ., - a -.0. 00~.0'0O.~-'0- 0 C) ( C
0) 0) - '0 '0 '0 --
~0)C 0'
0) CV' C) 0 0) .-~ C 0) 0 C- C)0 C- -s '
* -M~~ ~:K
0) 0 O~ .1 0) 0) 0) .'. '0 OCO - 00) 0 0) 20).3 C5) 0) 0.0 0 0).0 0)CC0).-I0)t--0 V )>0)
5.0 0 0 0 0 0 0 0 S 0 0 0 0 .0 C)* I I
* = - -. .> o 0000. .0 C' .r.(-.0 0 0 0 0 0 0 0 0 0 C) 0 C' C) CC
0. .00.0) 0. .-. -~ -. CC.C) 0 .0 C 0 C) 0) C) 0 Cc C) C'
0 0 0 0 0 0 05.0 0 CC 0 0 0 0 0 0 0 0 0 - 0 C
0 0 0 0. 0 0 0. 0
- 00 0 0 0 C 0 0 0 0 0 0 C) - 0
0 0 C 0 0 0 0 C) 0 0 C) 0) 'C
<0 >-o 0 .0 0 'C ~ .1~ ~
I I *~ I
I CS 0 '0 C.) CO CO 00 ( 0. 0 C) 0 CC
.0 0 .0 CO 0 0 0) 0
C) 0 0. 0. OCCOC) 0. 0
'.- )) 0 C' 0 5 CO 0 )
64

r
.0 .0 0 0 .j( ( -. . -
ti6 6 or,.
0~~~~ ~~~ ~ ~~ 0 0t O0 0 0 0 . 0 0 0 0 0
o 1 1 1 (0 I0 0 I0( 00 0 I oo o I ~ .
(0A- 0(0 ( 0( 0 ( 0
Ilk(0( , 0 ((0 ('(
Al 0 0 0(030 ( (0 ( ( (
(0 (00 0( 0(00 0'~0 0(65

o4 o m
14N 0 0 0 0 0 0 0 0 0 0 0 a 0 0 0 0 0 0 0 0 0 0
0 0
4) 44- 4) C' M- 1 0 0 U - C ' 0 ' 4 0
0~~ oN - . . 0 C ~ ' ' 4 ' 0. - ' ' 4 0 0 a - 0 a' U
o~~ ~ 0 0 0 0 0 0 C'0 ) 0 0 0 0 0 0 04
00 C- 00 - - 4 4 U N 4 0 0 ) .
UN U 00 .0 0 4 . 04 U'0 0 - 4 ) U
C- w U' ' 0 0 0N 4)0- 4 U ' .4 . 4 4 ) 0 U' 0 0 0
.0 U' 0. 0 0 o 0 o 0 0 0 0 .4 . 0 0 0 0 0 0o 0o 0o 0 0 0
'.4 '0 UN 0 0
U'~~~~ .- .. . .' .4 .4 4 .4 . . .
-. 0 0 0 4 0 0 000 4 4 C' 4 44C +
66~

Vt C! .0 A C 0 0- C -- U ~ U ~ . - C E
..'.. CC...0.N 0 Cr C C I U N . . 0 - C
6.I 0 0 0 0 0 0 0 0 0 0 0 0 0 0 0 0 0 0 00 0
o E E E O 0 w I4 0 I C
- 0o Cr UN CE 0 0 UN mN C C C C r C
- - 0 0 r ~ 0 CC -- C- 0 C 0 00 0 0
N 1 1 11 . CC U N .1 .0
loo I.C C % " C N Cr UoC C E 0 % -
oo o
I o o o o oo o o o o o o o o o o o o
o c o o o o
o o o o o o o o o o o - o o .
-- C-- CC . 0 C % 0% U 4 U O E . U .0 ."
• o ~~o o Q o o o o a o o o
x, CC Crx r C C - m, x r0 CC x, 0 ,
o 0r 0 0 0
0 -* o o a
67
C. C CilC CC CC C C I IIl CI II I CIIC
.... .I " - UN ," CC .4 - I0I II C .ii..I.. C

. . . . . .
o 0
oo-
. . .- . .
Q~~ ~ 6 o c c ; ;
.0 . o .o . . . .. .
o o .c
Q o o ooo o
to o
o 3 :3
.. ... . ' ... C. . . ON I -0 N ION - - - -: . ....... . ...C ON ...... . -.... . ON . - '
ON.. O O C N N ON O - O N O - ON N O .. N O N N ON68O
tO N 0 0 0 0 0 0 0 0 0 0 0 0 0 0 C
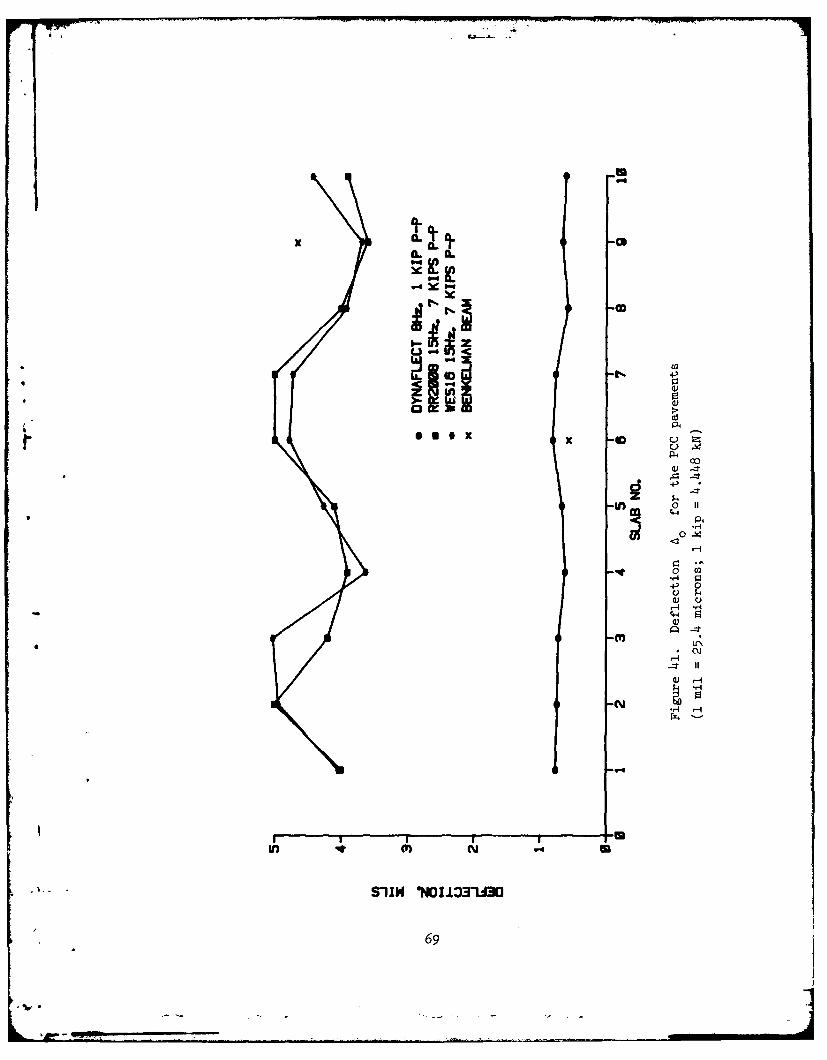
-Q4
xz
40
suex Ix -
+) -
$4
02 -4
+, 0
C) U
-4-4 r4
-4 N
-CY)
N *~-4H
* '.-S-IIN 'N0LL331430
69

9-4 U4
0I
0~0
I00
0-0'-'-4
4-)
d
4-'
)00
c'-4
700
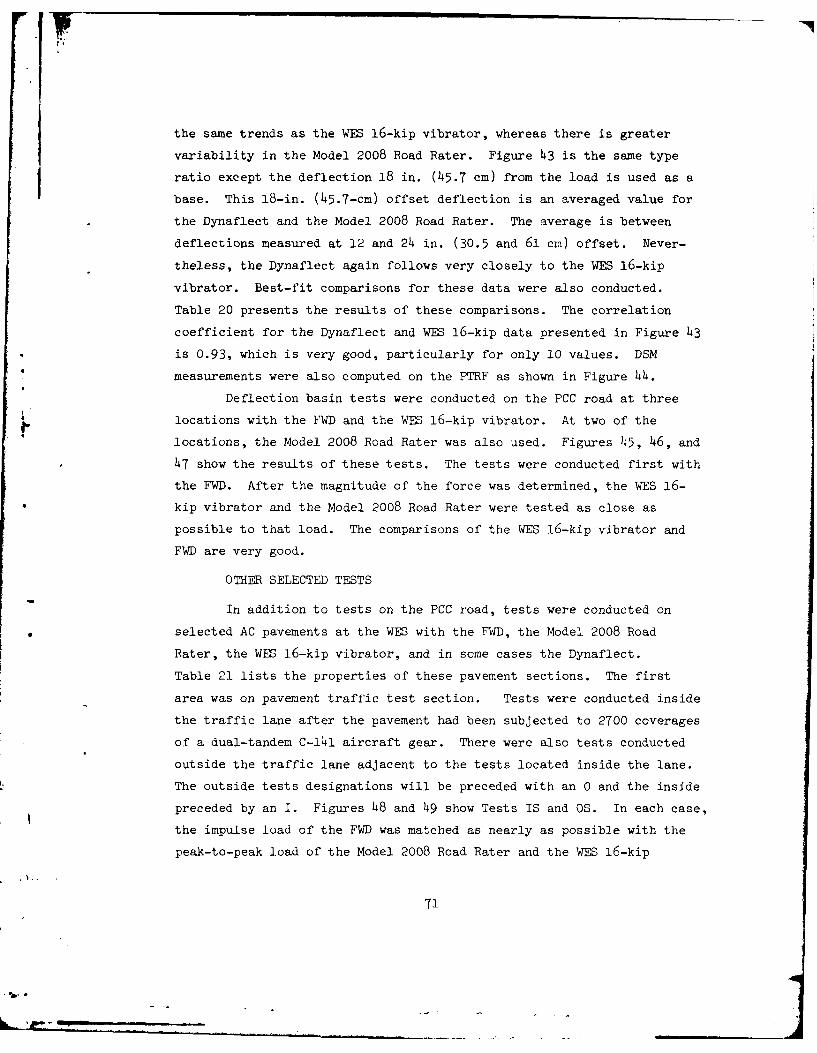
the same trends as the WES 16-kip vibrator, whereas there is greater
variability in the Model 2008 Road Rater. Figure 43 is the same type
ratio except the deflection 18 in. (45.7 cm) from the load is used as a
base. This 18-in. (45.7-cm) offset deflection is an averaged value for
the Dynaflect and the Model 2008 Road Rater. The average is between
deflections measured at 12 and 24 in. (30.5 and 61 cm) offset. Never-
theless, the Dynaflect again follows very closely to the WES 16-kip
vibrator. Best-fit comparisons for these data were also conducted.
Table 20 presents the results of these comparisons. The correlation
coefficient for the Dynaflect and WES 16-kip data presented in Figure 43
is 0.93, which is very good, particularly for only 10 values. DSM
measurements were also computed on the PTRF as shown in Figure 44.
Deflection basin tests were conducted on the PCC road at three
locations with the FWD and the WES 16-kip vibrator. At two of the
locations, the Model 2008 Road Rater was also used. Figures 45, 46, and
47 show the results of these tests. The tests were conducted first with
the FWD. After the magnitude of the force was determined, the WES 16-
kip vibrator and the Model 2008 Road Rater were tested as close as
possible to that load. The comparisons of the WES 16-kip vibrator and
FWD are very good.
OTHER SELECTED TESTS
In addition to tests on the PCC road, tests were conducted on
selected AC pavements at the WES with the FWD, the Model 2008 Road
Rater, the WES 16-kip vibrator, and in some cases the Dynaflect.
Table 21 lists the properties of these pavement sections. The first
area was on pavement traffic test section. Tests were conducted inside
the traffic lane after the pavement had been subjected to 2700 coverages
of a dual-tandem C-141 aircraft gear. There were also tests conducted
outside the traffic lane adjacent to the tests located inside the lane.
The outside tests designations will be preceded with an 0 and the inside
preceded by an I. Figures 48 and 49 show Tests IS and OS. In each case,
the impulse load of the FWD was matched as nearly as possible with the
peak-to-peak load of the Model 2008 Road Rater and the WES 16-kip
71

IS
-4L
0
CL 0.
400
LO- 4-4
4) c
'r-
''' l,'l'''Ill''I' ll''Ill''I'l' L ll''I'l''I'lll', 'l''''( ttC 11 td 0
td *t* -
S44I/)E JV 013.3
I-.Inz~ 72

~J-I
.0CCCO O C. ~ C 4 N CC O . :~I-.o
I
C C O ' C : CC 0 O N - O
•.,. CC a CC C' ON 0 r 4: CC C' CC , 4' : 4: C .CC.- o : '0 .: 4 : 4 0 C C ' 4 : .. .' '2 C
LC C C C C C C 4 C C C S 0 0 4 i
4'O
a/,i a 4: C- .0 -, C
3 - - -4 .- d d d - " -4"': -
Co . .o .oc C o .4oCI4 22 CC c 1 .. 4:.CC CC , .3 C C .0 .. .
4 , : . . C CC . . "- C ' <CC .0 CC
, 0 .o o' o. o' 0*' Co o2 ~ C, o C C
r : ::. .= = : . . . . .. . .
0 CiC
4 Cr -4 ." 4'T , . . . .. :
C C.C"~ ~ 4: ,
7 3 I : 0 4

0 0
U'\
744
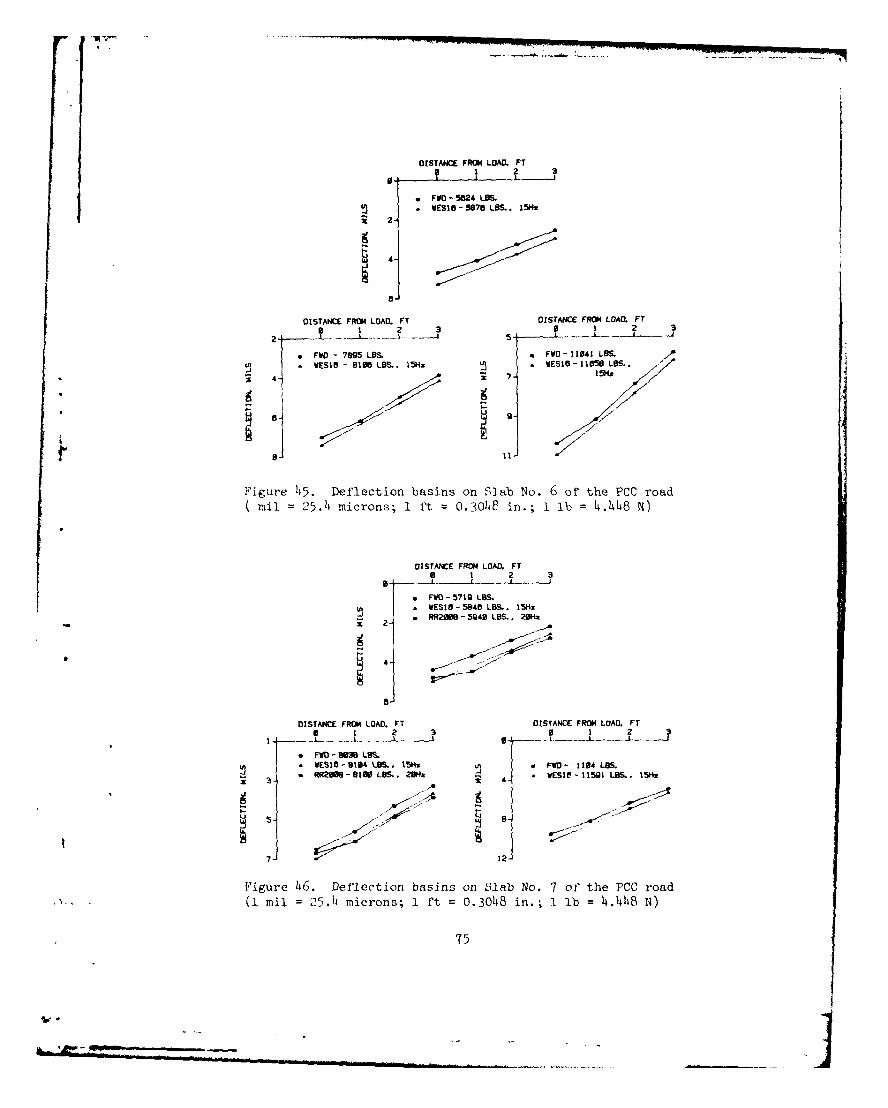
DISTANCE FROM LOAD. FT
* FWD - 5024 LBS.* WESIO-5878 LBS. 5Hz
DISTANCE FROM LOAD. FT DISTANCE FROM LOAD, FTa 1 2 3 2
FD - 7F5 LBS F 7- 11041 LBSSWZSIB - 8108 LOS.. E5Hz WES1 -11658 LB.
* 4-; 7- 15H*
Figure 45. Deflection basins on Slab No. 6 of the PCC roadmil= 25.14 microns; I ft, 0.30148 in.; 1 lb 4.1448 x)
DISTANCE FROM LOAD. FT1 2 3
FW -5719 LBS.-WE S 1 -584B L l. 15Hz
2, . - BRR2 - 5I940 LBS..r 204%
U 4 4DISTANCE FROM LOAD. PT DISTANCE FROM LOAD. FT3 1 2 3 0 1 2 3
FWD - M2B
S ' WESIB -194 LBS.. 154 * FWD - 1104 LBS.-RR2M -8 IS LBS.. 2W& .. WES1t' 11591 LBS.. 15Hz
7-12
Figure 46. Deflection basins on Slab No. 7 of the PCC road(1 mil = 25. microns; 1 ft = 0.3048 in.; 1 lb = 4.1414B N)
75
*1,*

DISTANCE FROM LOAD. FT9 1 2 3
0 FWD- 5519 LBS.- VES18-5875 LBS.. 15H. RR21M - 5879 LBS. . 29Hz
2
B-
DISTANCE FROM LOAD. FT DISTANCE FROM LOAD. FT
0 1 2 3 0 1 2 3I _ ± . 3 -- L1 . . .,.J
S 5-I . I- 5
U US10 FWD-7840 LBS.
1 WESIO-8121 LBS.. 15Hz . FWD I 1M LBS.
RR20B - SO LBS., 29Hz 7 *WESIB-1510 LOS..15 g"Z
Figure 47. Deflection basins on Slab No. 11 of the PCC road
(1 mil = 25.4 microns; 1 ft = 0.3048 in.; 1 Lb = 4.448 N)
76

~1I~I
U3
f)
ClQ)z4 H
"I. H~
,a v) E-iI I
0 r
00
Q >l
0 0C\J (n+--4>4
a . HdU d d-
I-iE -4 +' b D4
0q a) rir
F3 * -4 -r-4 -,4
"-4
ONi Cr\ V*\ U-\ L(\, U
4- C/ 4c-H 3-
U) 0H) 144
P-P
77I

, ,, ;, .. , , -- " "
DISTANCE FROM LOAD. FTa 1 2 3
-J
*FWD - 5624 LOS.5- WESl6 5M6 LBS.. 15Hz
SRR29MS- 5 LB&S. 20HZ
7-
DISTANCE FROM LOAD. FT DISTANCE FROM LOAD. FT
B 1 2 B1 2 30 ' I ? U ,
LOS.
LIj
a] FW-7LIBFW M B-~ ~ ~ 7 FV-4 LBS. LL FWD-1ULS- WES16-8J LBS.. 15Hz * ES1-11152 LBS..
RR2B-8180 LBS.. 20Hz 15Hz
12 15
Figure 48. Deflection basin on test location IS(1 mil = 25.4 microns; 1 ft = 0.3048 in.; 1 lb =
4.448 N)
DISTANCE FROM LOAD. FT0 1 2 3*lI I I
0-l 2 1
*FWD - 5655 LBS..- NS 15"57 LBS.. 15Hz
- RR299-56- SM. L U 2-UH22
*U
'4
DISTANCE FROM LOAD. FT DISTANCE FROM LOAD. FTa I 2 3 I 1 2 a
• 78
z4-
... -D-79 LBS. * FWD - 112U LOS.
. WESI.-BI. .LS.. 15Hz WES-11574 LBS.*RR2M -9150 LBS.. 20Hz 35Hz
71FD- 9LS 12
Figure 49. Deflection basin on test location OS(1 mul = 25.4 microns; 1 ft =0.3048 in.; 1 lb4.448 N)

vibrator. Using data from Figures 48 and 49, the force level versus
deflection could be projected through 0 so that deflections for the
force level of the Dynaflect (1000 lb (4448 N)) could be interpolated.
The results of these interpolations (Figures 50 and 51) indicate that
on all of the tests, the WES 16-kip vibrator and FWD deflections agree
with each other at distances of 2 and 3 ft from the applied load.
Tests on the conventional AC pavement, A, produced higher de-
flections (Figures 52 and 53), but again the basin data are consistent
at distances away from the applied load. Additional tests on the weaker
AC section (Table 21) produced the same results. Figure 54 presents
the results for only the FWD and the WES 16-kip vibrator at higher
loads.
In June 1978, an evaluation of Dulles International Airport (DIA)
was made using both the Dynaflect and the WES 16-kip vibrator. The
pavements at Dulles consist of 15 in. (38.1 cm) of PCC over a 9-in.
(22.9-cm) granular base over a silty clay subgrade. NDT data from both
the Dynaflect and the WES 16-kip devices were analyzed for the three
runways at DIA. The testing with the Dynaflect consisted of deflection
measurements at an 8-Hz frequency and 1000-lb peak-to-peak load. Two
types of tests were conducted with the WES 16-kip device: (a) deflec-
tion at 20,000-lb (88.9-kN) peak-to-peak load and 15-Hz frequercy,
and (b) dynamic stiffness modulus (DSM) at 15 Hz with the load swept from
* 0 to 30,000 lb (133.4 kN) peak to peak. Approximately twice as many
tests were conducted with the Dynaflect, but only data from the loca-
tions tested by both devices were used in this analysis. In this
comparison, the WES 16-kip deflections will be reported in peak-to-peak
values.
Tests at DIA were conducted at the center of the PCC slabs and
adjacent to the transverse joints. Table 22 summarizes the results of
regression analyses comparing data from the Dynaflect and WES 16-kip
vibrator. Equations of the best-fit lines were determined by selecting
the best correlation coefficient from six different curve equations from
the curve-fit computer program. The correlations are based on 319 data
points (159 center and 160 joint). The best agreement was obtained by
79

DISTANCE FROM LOAD. FT3 1 2 3 43 .] I I I I I I I I I
8.2-
1A-JX IL4,-
zU.L0 -
-W
RR20U8a. xDYNAFLECT
I. O
Figure 50. Dynaflect deflection basin and projected 1000-lb deflectionbasin for the FWD, the Model 2008 Road Rater, and the WES 16-kipvibrator on test location IS (1 mil = 25.4 microns; 1 ft 0.3048 in.;1 lb = 4.448 N)
DISTANCE FROM LOAD. FT3 1 2 3 4
•, , II I I I I I I J•L W0.4-
U.
L VES15
x DYNAFLECT
1.
Figure 51. Dynaflect deflection basin and projected 1000-lb deflection1.. ?basin for the FWD, the Model 2008 Road Rater, and the WES 16-kip
vibrator on test location OS (I mil = 25.4 microns; I ft = 0.3048 in.;1 lb = 4.448 N)
80
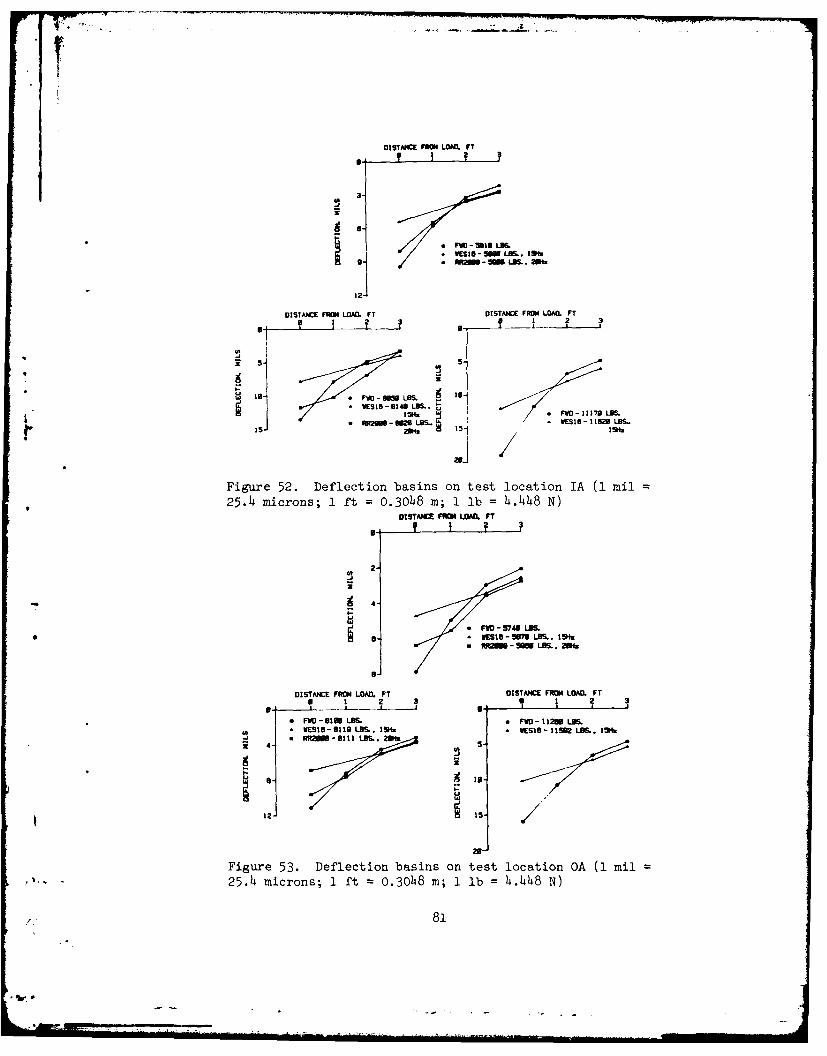
OSTAICE FR LOAD. FT
F :131 L.
WE•G W LB. 13R. 18
121
DISTANCE FROM LOAD. FT DISTANCE FRON LOAD. FT1 2 1
to- FWD - LOS. in-f~l-1I I
*VEI -04 L -
I5f FW - 1135- /LBS.ftR2BU-GM2BLBS..i ESIS-11582LB.
15 2M~z /5 15ft
1 /
Figure 52. Deflection basins on test location IA (1 mil
25.4 microns; 1 ft = 0.3048 m; 1 lb = 4.448 N)TTDISTANCE F LOAD. FT
U Y ; ?,
2-
eFW - 574 LBn.* WCESI-SMI .. l
6 Hz
. - 5M LBS. .M
DISTANCE FROM LOAD. FT DISTANCE FROM LOAD. FTU 1 2 3 U 9
* FWD -uI LBS. FW P1- It26 LBS.
UT WES15-9119 LBS.. 15H. * EStS- 11502 LBS.. 1569*RR2M-BIII LBS.. 2USfa
4-S
I
Figure 53. Deflection basins on test location OA (1 mil25.14 microns; 1 ft 0.30o48 m; 1 lb = 4.1448 N)
81

0U 4
0)0
U 01
IU-4
S-oU) ONU3-43.
m i-m8*-* 0
0 - 4) I
+)
LL,
e- 0)
05
-)
SlIMSI NOI11133Q 4-i
B2H

4d 0 ON P N ,04
Cd0 0 0 0
ca0 \ 00 -- T 0 0 10
H 0 H0 04-
0. Ct C C 0 00
\l)0 LiYs C ~ 0 0~
0- 00M0 0
-HO)
0 0 0 O\ 0 0
C-) U-
,aH - - ~ I 0)COO H' 0d 0 o -)c-
E- CM9 Z 0 r -j OCM, o 0 ! -t
Hi -4 - 4
2-A P4 au' P 0
o~r itiiiiI
o Q)
L4i)0) HO 0
*~~~. *H *H H H Hi4I
'-.0~~~~ \O '. '0 '0 00 -
HP HL HN HH
0-. 04-z
to 0Cl
+3 U) -4 H
CCM
4-3 U4-3 +)
83 *4-0
combining all the 319 data points, which produced a correlation coeffi-
cient of 0.76. This is not considered a very good agreement. Data from
the joints gave a higher correlation coefficient than the slab center
data. This is probably explained by the fact that the deflections are
larger at the joint. A very poor correlation was obtained using only
the slab center data, and this is the location at which the evaluation
tests are conducted.
84
II

ANALYSIS OF RESULTS
During this study, each of the candidate devices were evaluated
based on six parameters. These included operational characteristics,
* which encompass ease, speed, and manpower requirements. The second
parameter was cost, which was subdivided into initial cost and operating
* expenses. Accuracy was the third parameter. Both accuracy of force and
deflection were considered. Transportability by cargo aircraft was
fourth, the depth of measurable or significant influence was fifth, and
suitability for testing light aircraft pavements was sixth. No weight-
* ing was given to any parameter, and each device was evaluated in as near
* the samie manner as possible under the time and funding constraints.
4 The operational characteristics of the Dynaflect are better than
any of the other candidate devices. The FWD could be improved if the
pickups did not require hand placement.
Costs were evaluated based on a three-year life of the machine.
It was assumed that an owner would conduct 20,000 tests a year (50 days
at 400 tests per day). Based on this assumption and the time per test
data in Table 2, the optimum manpower requirement in Table 3, and a $100
per day labor charge, yearly operating costs can be determined (Table
23). By adding the initial cost and the yearly operating cost for three
years, total costs are compiled (Figure 55). Interest and inflation
* costs are neglected.
In the evaluation for accuracy of deflection and force, the
rating is based on the accuracy at the frequency at which the vibrator
is normally operated. For the Models 400 and 510 Road Raters, this is
25 Hz. For the Model 2008 Road Rater, the normal operating frequency is
15 Hz. The accuracy of the Benkelman Beam would be a function of
operator's ability to obtain an accurate test axle load of 18,000 lb
(8,165 kg), which is estimated to be within +1 percent. Table 24
summarizes the accuracy data.
Transportability by cargo aircraft did not differ for any of the
trailer-mounted devices. The Benkelman Beam was the most transportable,
85

Table 23
Yearly Operating Costs
No. ofDevice Tet/a as/Year Cost/Year
Benkelman Beam 150 134* $26,800
Dynaflect
Digital 64o0 31 3,100Standard 384* 52 10,400
FWD 320 63 12,600
Model 1*00 Road Rater 4*8o 42 8,1*00Model 510 Road Rater 4*8o 42 8,1*00
Model 2008 Road Rater 1*8o 63 4*,200
Note: Based on 20,000 tests per year and time per test in Table 2,optimum manpower requirements in Table 3, and a $100 per daylabor charge.
100
$81.066
$65.800
9 $52,6000
I-$47,200 $47,200 $47,200
$28,633
20-
0 -......BENKELMAN DIGITAL STANDARD FALLING ROAD ROAD ROAD
BEAM DYNAFLECT WEIGHT RATER RATER RATER
Figure 55. Thre-year totalcosts

AD-AO83 597 ARMY ENGINEER WATERWAYS EXPERIMENT STATION VICKSBURG--ETC F/S 1/5I NONDESTRUCTIVE TESTING FOR LIGHT AIRCRAFT PAVEMENTS. PHASE 1. E-ETCCU)IJAN 80 A J BUSH DOT-FA78WAI-848
UNCLASSIFIED FAA-RD-80-9 NLET
2 fl l ll2f 8
% .TTI

Table 24
Summary of Accuracy Data
Accuracy of Velocity Transducers/Deflection
Percent Error atDevice Operating Frequency
* Benkelman Beam 8.7
Dynaflect 5.5
FWD 5.1
Models 400 and 510 Road Raters 5.5
Model 2008 Road Rater 6.8
Accuracy of Applied ForcePercent Error at
Device Operating Frequency
- Benkelman Beam N/A
* Dynaflect
Rigid Pavement -4.2
Flexible Pavement -12.9
FWD -5.4
Models 400 and 510 Road Raters -12.3
Model 2008 Road Rater
Unfiltered -8.3Filtered +1.0
87

whereas the Model 400 Road Rater was the least, due to being mounted on
a truck.
Depth of influence evaluation is based primarily on the force
output. The Models 400 and 510 Road Raters were not tested during this
study, but data collected earlier with the Model 510 on 15-in. (38.1-cm)
P00 indicated that its ability to load pavement at depth was more than
the Dynaflect. The Benkelinan Beam was ranked No. 1 because of surface
deflection magnitudes.
The suitability ranking is based primarily on judgment and the
correlations obtained when comparing experimental data with data col-
* lected with the WES 16-kip vibrator. Table 25 summarizes these com-
parisons. There were not enough data collected with the FWD to place it
in these comparisons, but based on the limited data, the magnitude of
the force, and the accuracy of the measurements, it was ranked high for
suitability. The Benkelman Beam is rated last in suitability because of
the low correlation results with the PTRF data. Also, the Benkelman
Beam has not been reported as an evaluation tool for rigid pavements,
possibly because the reference beam may be within the deflection basin
and therefore will give erroneous results. The toe of the beam is only
8 ft (2.4k m) from the first reference support. On large slabs with the
WES 16-kip vibrator, deflections of sufficient magnitude to affect an 8-
* ft (2.4-n) reference have been measured.
Another factor in the suitability ranking is the feature of being
able to vary the dynamically applied force. It has been shown through
resilient modulus testing that the modulus values of both subgrade and
base materials are stress dependent. Therefore, in developing the
* evaluation methodology, the determination of this stress dependency by
varying the dynamic load may prove to be an important factor. Based on
these factors of correlations and variable force, the Model 2008 Road
Rater and the FWD would rank best.
In order to analyze the results of the six evaluation parameters
established for this study, a rating scheme was utilized, whereby each
device was ranked in order of comparison with the other devices (Table 26).
88

;..
0-
0
) - 0
00 0 0
co Q
< 0
a)
c C;
)
0'
1-4
.,j $-4 4
.,4 4)
00 C j D 0o co 00
0 0U) .0 < -1
00
0
0
+)0 0 0 0C\J ~ Lf CO I- a'
It
-' 4-. S.. 4
4894 o

0 0) IH
0 0
x~0 C~j 0J -4IV L\r- c
S.D r 0 .u
m. 0
02 4))c
00
99
00 043) N) )I co(V'l
oo
N,4a W4) L CY) U - )I -Tcil rH
0) 0)O

For the parameters that involved more than one evaluation, the parameter
ranking was based on the sum of the particular evaluations. For
example, accuracy was ranked based on the sum of rankings for accuracy
of force and accuracy of deflections.
91

CONCLUSIONS AND RECOMMENDATIONS
CONCLUSIONS
Based on the results of this study, it is concluded that:
a. The Dynaflect rated best in operational characteristics,the Model 2008 Road Rater second, and the Benkelman Beam
last.
b. When considering both initial and operating costs, theDynaflect ranked best of all devices.
c. The FWD rated best in overall accuracy.
d. The Benkelman Beam rated best in terms of air transportability
and the Model 400 Road Rater poorest.
e. The Benkelman Beam ranked best in the depth of influence andthe Model 400 Road Rater poorest.
f. The FWD and the Model 2008 Road Rater ranked best under theevaluation parameter of suitability.
This study also evaluated three devices, the Dynaflect, the
Model 2008 Road Rater, and the FWD, applicable for testing light aircraft
pavement. The Dynaflect presently leads the group in cost and opera-
tional characteristics. Modifications to the Model 2008 Road Rater to
improve its accuracy would improve its overall rating. Also, modifica-
tions to the FWD to allow mechanical placement of the velocity sensors
would improve its rating. Further study with the FWD would likely cause
a better rating for this device. The FWD was only tested for two days
during the study.
RECOMMENDATIONS
It is recommended that three devices be considered in the develop-
ment of the methodology for light airports: (a) the Dynaflect, (b) the
Model 2008 Road Rater, and (c) the FWD. Furthermore, additional data
should be collected with these three devices on rigid pavements and with
the FWD on flexible pavements.
92

REFERENCES
Asphalt Institute, "Asphalt Overlays and Pavement Rehabilitation,"Manual Series No. 17, College Park, Md., 1977.
Bohn, A. et al., "Danish Experiments with the French Falling WeightDeflectometer," Proceedings of the Third International Conference onStructural Design of Asphalt Pavements, Vol 1, London, 1972.
Claessen, A. et al., "Pavement Evaluation with the Falling WeightDeflectometer," Proceedings of the Association of Asphalt PavingTechnologists, Vol 75, 1975.
* Green, J. L. and Hall, J. W., Jr., "Nondestructive Vibratory Testing ofAirport Pavements," Evaluation Methodology and Experimental Test Results,Vol 1, Report No. FAA-RD-73-305-I, Department of Transportation, FederalAviation Administration, Washington, D. C., 1975.
Highway Research Board, "The WASHO Road Test, Part 1," Report No. HRBSpecial Report 18, National Academy of Sciences, National ResearchCouncil, Washington, D. C., 1954.
, "The WASHO Road Test, Part 2," Report No. HRB SpecialReport 22, National Academy of Sciences, National Research Council,Washington, D. C., 1955.
Kilareski, W. P. et al., "Modification Construction and Instrumentationof an Experimental Highway," Report No. PT17607, Pennsylvania Departmentof Transportation, Harrisburg, Pa., 1976.
Weiss, R. A., "Pavement Evaluation and Overlay Design by CombinedMethods of Layered Elastic Theory and Vibratory Nondestructive Testing"
* (in preparation), Department of Transportation, Federal AviationAdministration, Washington, D. C.
Yang, N. C., "Nondestructive Evaluation of Civil Airport Pavements,Nondestructive Test - Frequency Sweep Method, Part I," Report No.FAA-RD-76-83, Department of Transportation, Federal Aviation Administra-tion, Washington, D. C., 1976.
U.S. GOVERNMEN! PRINTING OFFICE: 1980 0- 671-455 '1421 REGION 3-1
93
V. .-