ultracapacitor/battery hybrid energy storage … · abstract ultracapacitor/battery hybrid energy...
TRANSCRIPT
Ultracapacitor/Battery Hybrid Energy Storage Systemsfor Electric Vehicles
by
Mazhar Moshirvaziri
A thesis submitted in conformity with the requirementsfor the degree of Master of Applied Science
Graduate Department of Electrical and Computer EngineeringUniversity of Toronto
Copyright © 2012 by Mazhar Moshirvaziri
Abstract
Ultracapacitor/Battery Hybrid Energy Storage Systems for Electric Vehicles
Mazhar Moshirvaziri
Master of Applied Science
Graduate Department of Electrical and Computer Engineering
University of Toronto
2012
This thesis deals with the design of Hybrid Energy Storage System (HESS) for Light
Electric Vehicles (LEV) and EVs. More specifically, a tri-mode high-efficiency non-
isolated half-bridge converter is developed for the LEV based HESS applications. A
2 kW, 100 V interleaved two-phase converter prototype was implemented. The peak
efficiency of 97.5% and a minimum efficiency of 88% over the full load range are achieved.
Furthermore, a power-mix optimizer utilizing the real-time Global Positioning System
(GPS) data for the EV based HESS is proposed. For a specific design, it is shown that
at the cost of less than 1.5% of the overall energy savings, the proposed scheme reduces
the peak battery charge and discharge rates by 76% and 47%, respectively. A 30 kW
bi-directional dc-dc converter is also designed and implemented for future deployment of
the designed HESS into a prototype EV, known as A2B.
ii

Acknowledgements
Foremost, I would like to express my sincere gratitude to my supervisor, Prof. Olivier
Trescases, whose support, encouragement, vision, motivation and inspiration guided me
through the thick and thin during my master study. I will always be grateful for his
patience, dedication and technical excellence through the course of my studies. His great
personality inspired me and he is and will remain a great influence in my life.
I would like to thank my dear friend and colleague, Omar Laldin, with whom we
established the basis of this research work that I built on afterwards. I sincerely wish
him great success in his PhD studies and future life. I would like to thank my dear friend
and colleague, Christo Malherbe, who helped me with implementing and controller design
of the dc-dc converter for the A2B . I would also like to thank my dear sister and colleague,
Andishe Moshirvaziri, who helped me in analyzing the GPS data from the experimental
drive-cycle. Without the support of Andishe and Christo, this project would not have
been feasible and I wish them continuing success in their studies and future life. I would
also like to appreciate the help of my dear friend and colleague, Chuanwei Li, who helped
me with the tri-mode dc-dc converter over the summer of 2011. I have been extremely
fortunate to have the opportunity to meet many dear friends in the Energy Systems
Group, Shahab Poshtkouhi, Mohammad Shawkat Zaman, Yue Wen, Shuze Zhao, Amir
Parayandeh and Behzad Mahdavikhah, and have them in my life.
I would like to thank the members of the Project Eve consortium, specifically Steve
Dallas, Chief Executive Officer of Toronto Electric, and Feisal Hurzook, Chief Technical
Officer of Archronix, for their support and the valuable experience they share with us in
the course of this project. It has been a great opportunity to collaborate with and learn
from them.
My family has always motivated me to move toward excellence and I can never thank
them enough for this and all the spiritual support they have offered me all these years.
Most importantly, I would like to wholeheartedly offer my regards and blessings to my
iii

parents, Masoud Moshirvaziri and Ghazal Navaby, whose support and unconditioned love
has always been there for me. To them I dedicate this thesis.
Last but not least, I offer my regards to those who have helped and supported me by
any means during this period. It has been a great pleasure to have you all in my life.
iv
Contents
1 Introduction 1
1.1 Modern Electric Vehicles . . . . . . . . . . . . . . . . . . . . . . . . . . . 1
1.1.1 Challenges in SESS EVs . . . . . . . . . . . . . . . . . . . . . . . 4
1.2 Hybrid Energy Storage System for EVs . . . . . . . . . . . . . . . . . . . 9
1.2.1 Detailed Comparison of Lithium-Ion Batteries vs. Ultracapacitors 11
1.2.2 Possible Ultracapacitor/Battery HESS Configurations and Control
Strategies . . . . . . . . . . . . . . . . . . . . . . . . . . . . . . . 15
1.3 Thesis Motivation and Objectives . . . . . . . . . . . . . . . . . . . . . . 21
2 A DC-DC Converter Design for LEV Based HESS 31
2.1 Introduction . . . . . . . . . . . . . . . . . . . . . . . . . . . . . . . . . . 31
2.2 Mode Description and Control Strategy . . . . . . . . . . . . . . . . . . . 35
2.2.1 Mode Description . . . . . . . . . . . . . . . . . . . . . . . . . . . 36
2.2.2 VFQR versus FFQR: Loss Comparison . . . . . . . . . . . . . . . 38
2.2.3 Closed-Loop Frequency and Dead-time Control Scheme . . . . . . 42
2.3 Dead-Time Extension Using Controllable Resonant Capacitance . . . . . 43
2.4 Experimental Results . . . . . . . . . . . . . . . . . . . . . . . . . . . . . 44
2.4.1 Steady-State Measurements . . . . . . . . . . . . . . . . . . . . . 45
2.4.2 FFQR and VFQR Comparison . . . . . . . . . . . . . . . . . . . 49
2.4.3 Dead-Time Extension Measurements . . . . . . . . . . . . . . . . 51
v
2.4.4 Dynamic Measurements . . . . . . . . . . . . . . . . . . . . . . . 55
2.5 Chapter Summary and Conclusions . . . . . . . . . . . . . . . . . . . . . 58
3 HESS Design for EVs with RT GPS Based Control Method 62
3.1 Introduction . . . . . . . . . . . . . . . . . . . . . . . . . . . . . . . . . . 62
3.1.1 The A2B Vehicle . . . . . . . . . . . . . . . . . . . . . . . . . . . 63
3.2 Drive-Cycle Data Acquisition . . . . . . . . . . . . . . . . . . . . . . . . 67
3.2.1 Drive-Cycle Analysis . . . . . . . . . . . . . . . . . . . . . . . . . 69
3.3 HESS Description . . . . . . . . . . . . . . . . . . . . . . . . . . . . . . . 72
3.3.1 Power Optimizer Algorithm . . . . . . . . . . . . . . . . . . . . . 74
3.3.2 Open Street Map and GPS Data Processing . . . . . . . . . . . . 76
3.3.3 Bi-directional DC-DC Converter . . . . . . . . . . . . . . . . . . . 77
Controller Design . . . . . . . . . . . . . . . . . . . . . . . . . . . 80
3.4 System Simulations based on Experimental Drive-Cycle . . . . . . . . . . 82
3.4.1 System Modeling . . . . . . . . . . . . . . . . . . . . . . . . . . . 82
3.4.2 Simulation Procedure and Test Scenarios . . . . . . . . . . . . . . 86
3.4.3 Simulation Results and discussion . . . . . . . . . . . . . . . . . . 88
3.5 Experimental Results of the DC-DC converter . . . . . . . . . . . . . . . 91
3.6 Chapter Summary and Conclusions . . . . . . . . . . . . . . . . . . . . . 95
4 Conclusions 98
4.1 Thesis Summary and Contributions . . . . . . . . . . . . . . . . . . . . . 98
4.2 Future Work . . . . . . . . . . . . . . . . . . . . . . . . . . . . . . . . . . 101
vi

List of Tables
1.1 specific-Energy for Different Battery Chemistry . . . . . . . . . . . . . . 7
1.2 Comparison of HESS Architectures . . . . . . . . . . . . . . . . . . . . . 20
2.1 Experimental System Parameters . . . . . . . . . . . . . . . . . . . . . . 46
2.2 Auxiliary MOSFET Parameters . . . . . . . . . . . . . . . . . . . . . . . 52
3.1 A2B Specifications . . . . . . . . . . . . . . . . . . . . . . . . . . . . . . 64
3.2 HESS System Parameters . . . . . . . . . . . . . . . . . . . . . . . . . . 73
3.3 HESS vs. SESS Comparison . . . . . . . . . . . . . . . . . . . . . . . . . 88
vii
List of Figures
1.1 (a) Parallel, (b) series hybrid electric vehicle (HEV) architecture. . . . . 2
1.2 EIA forecasts of global oil price based on the 2011 Annual Energy Outlook [6]. 3
1.3 Characteristic comparison of different Lithium-ion based batteries. . . . . 6
1.4 Specific-energy vs. specific-power for different storage technologies/propulsion
devices. . . . . . . . . . . . . . . . . . . . . . . . . . . . . . . . . . . . . 8
1.5 U-cap based HESS architecture for EVs. . . . . . . . . . . . . . . . . . . 10
1.6 Mass versus capacitance for commercially available (a) 2.5 V and (b) 2.7
V u-caps. . . . . . . . . . . . . . . . . . . . . . . . . . . . . . . . . . . . 11
1.7 ESR versus capacitance for commercially available (a) 2.5 V and (b) 2.7
V u-caps. . . . . . . . . . . . . . . . . . . . . . . . . . . . . . . . . . . . 12
1.8 Specific-power versus specific-energy for commercially available u-caps and
Lithium-based rechargeable batteries. . . . . . . . . . . . . . . . . . . . . 13
1.9 U-cap efficiency versus normalized extracted power. . . . . . . . . . . . . 13
1.10 Seven possible configurations for a two-source, single-load HESS. . . . . . 16
2.1 Architecture of a hybrid energy-storage system. . . . . . . . . . . . . . . 32
2.2 Synchronous boost converter used for interfacing the storage devices to
Vbus. Cx represent the lumped parasitic capacitance on the switching node,
vx. . . . . . . . . . . . . . . . . . . . . . . . . . . . . . . . . . . . . . . . 33
2.3 Ideal waveforms for ZVS operation. The optimal td1 and td2 depend on Iv
and IP respectively. . . . . . . . . . . . . . . . . . . . . . . . . . . . . . . 34
viii
2.4 Inductor current constraints. . . . . . . . . . . . . . . . . . . . . . . . . . 34
2.5 Converter current command, Ibt∗, and inductor current, iL, in different
modes of operation. . . . . . . . . . . . . . . . . . . . . . . . . . . . . . . 36
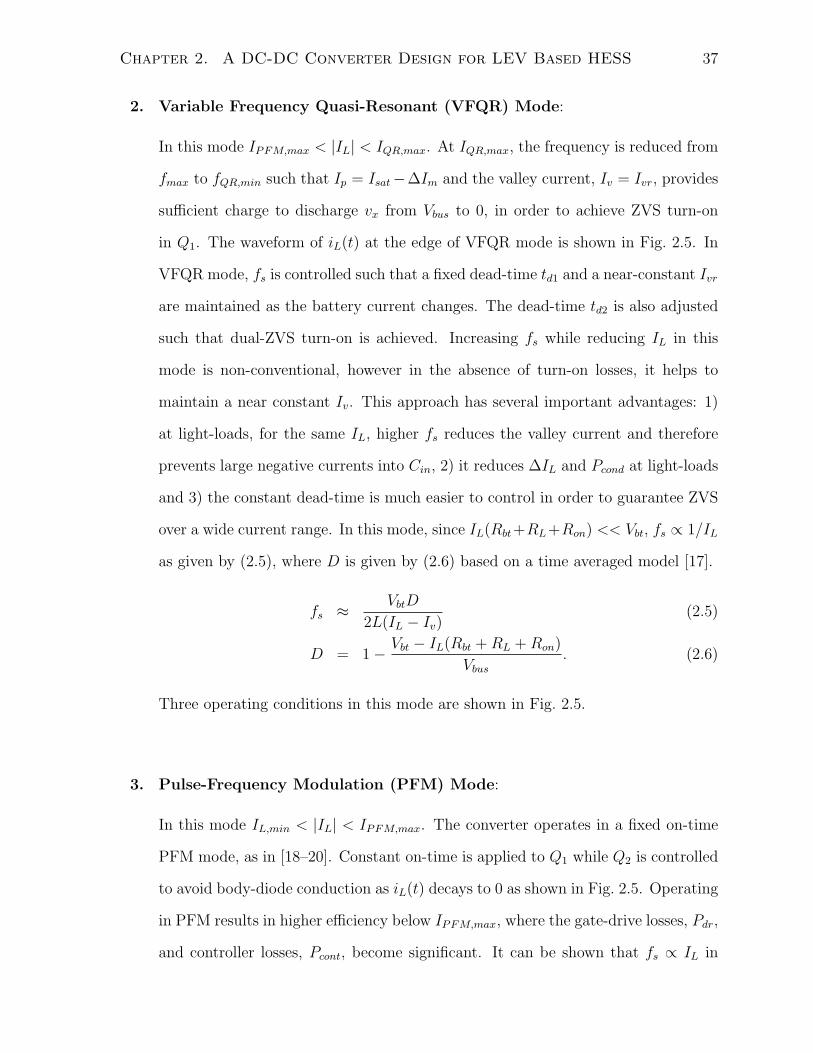
2.6 (a) Switching frequency variation and (b) dead-time control strategy for
different operating modes. . . . . . . . . . . . . . . . . . . . . . . . . . . 39
2.7 (a) Inductor current waveforms and (b) switching frequency in FFQR op-
eration. . . . . . . . . . . . . . . . . . . . . . . . . . . . . . . . . . . . . 40
2.8 (a) Inductor current waveforms and (b) switching frequency in VFQR
operation. . . . . . . . . . . . . . . . . . . . . . . . . . . . . . . . . . . . 41
2.9 (a) Simplified architecture of the VFQR controller. (b) Signal timing in
VFQR mode. . . . . . . . . . . . . . . . . . . . . . . . . . . . . . . . . . 43
2.10 Synchronous boost converter with auxiliary circuitry on the switching node. 44
2.11 Fabricated two-phase 2 kW quasi-resonant tri-mode converter prototype. 45
2.12 Measured steady-state waveforms of the converter operating in VFQR
mode. f-1: Vgs,Q2, 5 V/div; ch-2: vx, 49.6 V/div; ch-3: Vgs,Q1, 5 V/div;
f-4: iL, 5 A/div. . . . . . . . . . . . . . . . . . . . . . . . . . . . . . . . . 47
2.13 Measured steady-state waveforms of the converter operating in PFMmode.
f-1: Vgs,Q2, 5 V/div; ch-2: vx, 49.6 V/div; ch-3: Vgs,Q1, 5 V/div; f-4: iL, 2
A/div. . . . . . . . . . . . . . . . . . . . . . . . . . . . . . . . . . . . . . 47
2.14 Measured (a) dead-time and (b) switching frequency in the tri-mode bi-
directional converter. . . . . . . . . . . . . . . . . . . . . . . . . . . . . . 48
2.15 Measured efficiency in (a) different modes of operation and with (b) tri-
mode converter. . . . . . . . . . . . . . . . . . . . . . . . . . . . . . . . . 49
2.16 Measured switching frequency in FFQR and VFQR modes. . . . . . . . . 50
2.17 Measured efficiency of the converter in FFQR and VFQR modes. . . . . 50
2.18 IR images of the converter operating at IL = 10A in (a) FF mode. (b)
FFQR mode. (c) VFQR mode. . . . . . . . . . . . . . . . . . . . . . . . 51
ix
2.19 Comparison of td2 for the converter with and without the auxiliary circuitry
in VFQR mode. . . . . . . . . . . . . . . . . . . . . . . . . . . . . . . . . 52
2.20 Measured switching frequency with and without the auxiliary circuit in
VFQR mode. . . . . . . . . . . . . . . . . . . . . . . . . . . . . . . . . . 53
2.21 Measured efficiency with and without the auxiliary circuit in VFQR mode. 53
2.22 Measured (a) dead-time, (b) switching frequency and (c) efficiency of the
converter in VFQR mode with auxiliary circuit turned on only in the heavy
load range. . . . . . . . . . . . . . . . . . . . . . . . . . . . . . . . . . . . 54
2.23 Measured transient response of the converter due to a step in Ibt∗ from 15
A to 6.5 A. (a) Inductor current and internal digital control signals. ch-4:
iL, 10 A/div. fs adjustment = 0 indicates that the frequency is decreasing.
Dead-time adjustment = 0 indicates that the dead-time is increasing. (b)
Switching frequency during calibration process. . . . . . . . . . . . . . . 56
2.24 Measured transient response of the converter due to a step in Ibt∗ from 3 A
to 9 A. (a) Inductor current and internal digital adjustment signals. ch-4:
iL, 10 A/div. fs adjustment = 0 indicates that the frequency is decreasing.
Dead-time adjustment = 0 indicates that the dead-time is increasing. (b)
Switching frequency during calibration process. . . . . . . . . . . . . . . 57
3.1 EV Prototype design by Project Eve (The “A2B”). . . . . . . . . . . . . 63
3.2 Utilized HESS architecture. . . . . . . . . . . . . . . . . . . . . . . . . . 63
3.3 Valence U24-12XP capacity degradation over charge/discharge cycles [2]. 65
3.4 Valence U24-12XP discharge curves for various discharge currents [2]. . . 66
3.5 TM4 drivetrain performance curve [4]. . . . . . . . . . . . . . . . . . . . 66
3.6 Vehicle trajectory for the 3 hour urban drive-cycle. . . . . . . . . . . . . 68
3.7 Measured (a) vehicle speed, (b) motor speed and (c) motor torque during
the urban drive-cycle. . . . . . . . . . . . . . . . . . . . . . . . . . . . . . 70
x
3.8 Measured (a) battery voltage, (b) battery current and (c) load power dur-
ing the urban drive-cycle. . . . . . . . . . . . . . . . . . . . . . . . . . . 71
3.9 Estimated battery SOC during the drive-cycle. . . . . . . . . . . . . . . . 72
3.10 Controller modes based on u-cap SOC. . . . . . . . . . . . . . . . . . . . 75
3.11 A hypothetical driving situation with the stop signs and traffic signals
shown over a map. The route is shown in blue and the possible points
that the GPS data processor may pick up are marked in purple. . . . . . 78
3.12 Fabricated 30 kW 4-phase dc-dc converter (a) lower deck, half assembled
top view. (b) full assembled top and side view. . . . . . . . . . . . . . . . 79
3.13 (a) Multi-phase bidirectional dc-dc converter. (b) Ideal inductor current
in a 4 phase boost converter. . . . . . . . . . . . . . . . . . . . . . . . . . 80
3.14 Converter activated phases. . . . . . . . . . . . . . . . . . . . . . . . . . 80
3.15 Equivalent circuit of the multi-phase half-bridge converter. . . . . . . . . 81
3.16 Simplified controller implementation utilizing system symmetry. . . . . . 82
3.17 Utilized battery model. . . . . . . . . . . . . . . . . . . . . . . . . . . . . 83
3.18 Utilized u-cap model. . . . . . . . . . . . . . . . . . . . . . . . . . . . . . 84
3.19 (a) Measured vehicle speed, (b) real-time GPS stop/traffic signal flag dur-
ing the 3-hour urban drive-cycle. (c) Simulated Ibt for SESS with no limit
(blue), HESS without GPS (red) and HESS with GPS (green). (d) Simu-
lated U-cap SOC for HESS without GPS (red) and HESS with GPS (green). 89
3.20 (a) Simulated battery current histogram and (b) simulated battery current
versus SOCbt for the 3 hour urban drive-cycle. . . . . . . . . . . . . . . . 90
3.21 Measured converter efficiency at Vbt = 300 V with different Vuc. . . . . . 92
3.22 Converter nominal power versus u-cap voltage. . . . . . . . . . . . . . . . 93
3.23 Measured Vuc and Iuc for a sequence of u-cap current commands. ch-2:
Vuc, 15 V/div; ch-3: Iuc, 10 A/div. . . . . . . . . . . . . . . . . . . . . . . 93
xi

3.24 Converter transient response for reference current steps. Measured con-
verter (a) Total input current. ch-3: Iuc, 10 A/div. (b) Logged inductor
current using CRIO. . . . . . . . . . . . . . . . . . . . . . . . . . . . . . 94
xii
Chapter 1
Introduction
1.1 Modern Electric Vehicles
During the last few decades, the negative environmental impacts of petroleum based
vehicles have ignited the interest toward Electric Vehicles (EV) with low or zero emissions.
An Electric Vehicle uses one or more electric motors for propulsion. There are three types
of EVs [1] as follows,
1. Continuously powered from an external electric power station,
2. Powered by the electricity stored originally from an external electric power source,
3. Powered by an on-board electrical generator, such as an internal combustion engine
(ICE). This vehicle category is called Hybrid Electric Vehicle (HEV). If the electric
source of the HEV is also accessible from outside to recharge, the HEV is known
as Plug-in HEV (PHEV). HEV can have a parallel design, series design or a com-
bination of both with series configuration at low speeds and parallel configuration
for highways and accelerations [2]:
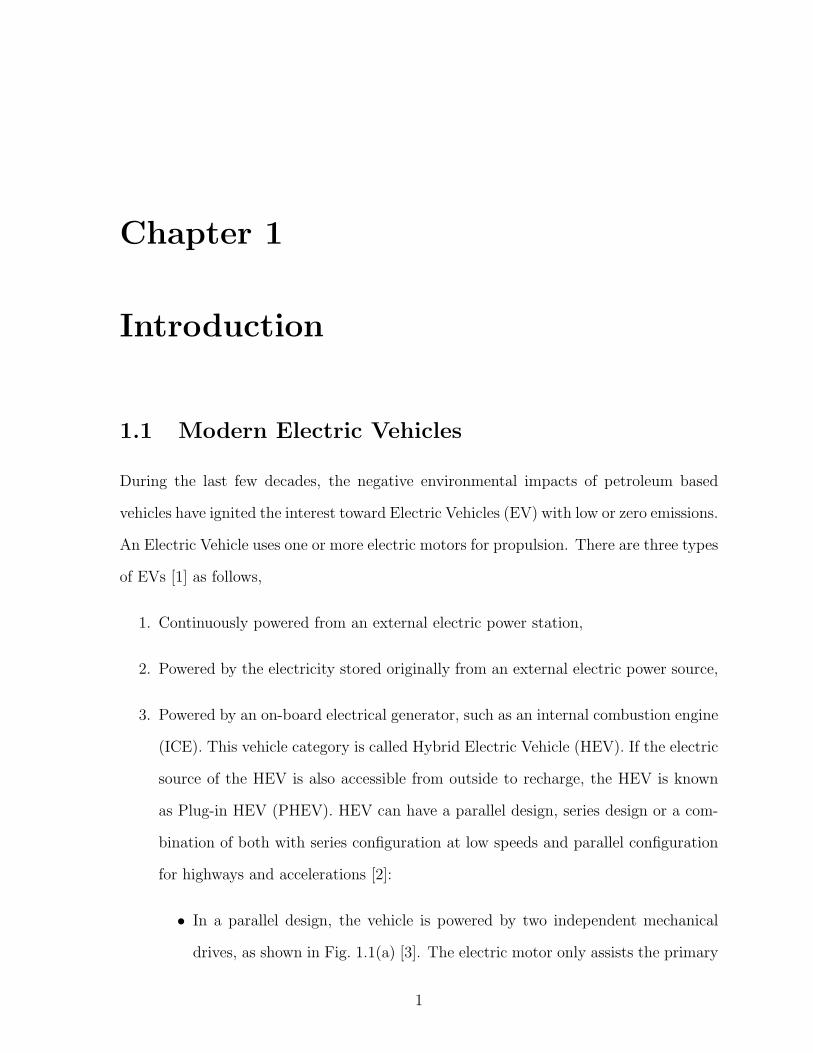
• In a parallel design, the vehicle is powered by two independent mechanical
drives, as shown in Fig. 1.1(a) [3]. The electric motor only assists the primary
1
Chapter 1. Introduction 2
engine in the events of acceleration, hill climbing, braking, etc [2].
• In a series design, the vehicle is powered only by one mechanical drive as
shown in Fig. 1.1(b) [3] and the primary engine charges the battery, which
drives the electric motor [2].
(Gasoline or
Diesel) Tank
Electric
Source
(Battery, Fuel
Cell, etc)
InverterTraction
Motor
Internal
Combustion
Engine
G
E
A
R
B
O
X Vbus
(a)
Energy Conversion
(Fuel Cells,
Diesel
Engines, etc)
Electric Source
(Battery,
Ultracapacitor,
etc)
VbusTraction
MotorInverter
(b)
Figure 1.1: (a) Parallel, (b) series hybrid electric vehicle (HEV) architecture.
EVs can also be categorized based on their power rating, since their power rating can
range from hundreds of watts in Light Electric Vehicles (LEV) to several hundreds of
kilowatts in heavy-duty vehicles. The power rating of LEVs, such as e-bikes, scooters,
segways™and lawnmowers are less than several kilowatts. The next power level includes
racing motorcycles [4] and sedan vehicles with a power rating in the range of 10-100 kW.
The highest power EV category, with power rating over 100 kW, includes heavy-duty
vehicles, such as buses and trucks.
EVs came into existence in the mid-19th century. Shortly after, they were driven to
the side by the ICE based vehicles due to several reasons, such as level of comfort and
Chapter 1. Introduction 3
the energy-density of their storage element. Electric power remained a common source
for vehicles like trains that are directly power from the grid and do not require an energy
storage. During the last few decades, oil price forecasts and environmental impacts
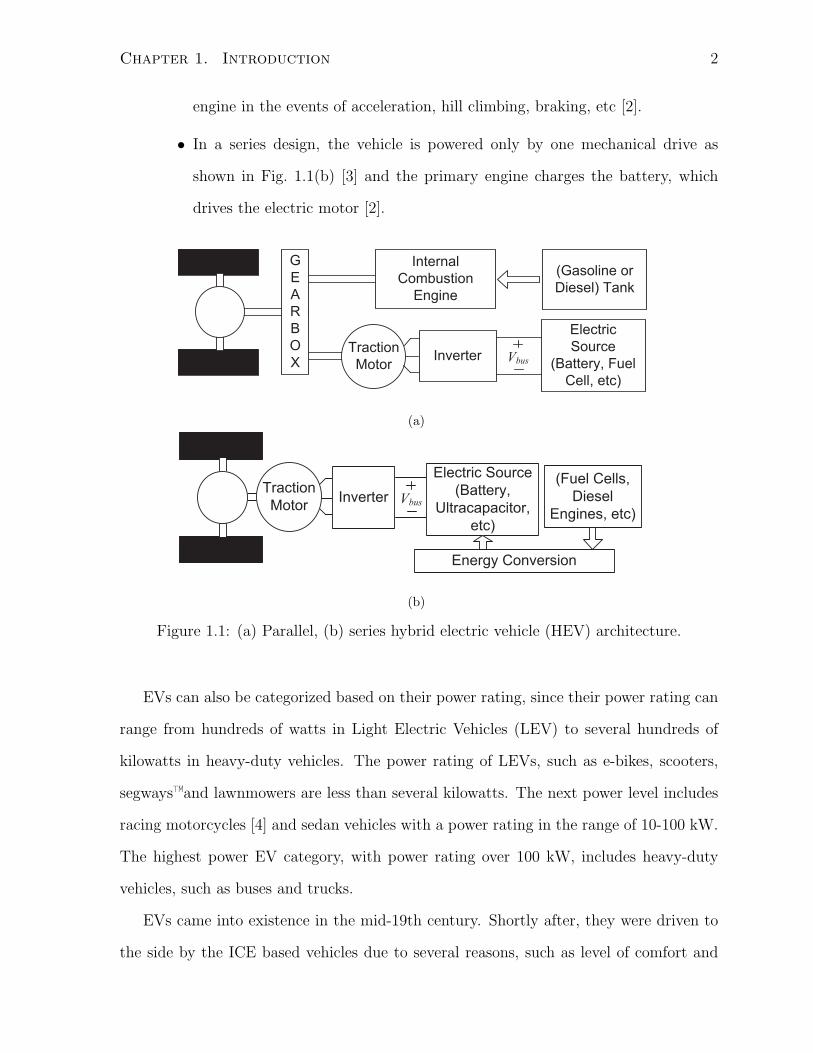
renewed the interest toward electric transportation infrastructure [5]. The global oil
price forecast shows a significant increase by 2035, according to the 2011 Annual Energy
Outlook published by the Energy Information Administration (EIA) [6], as shown in
Fig. 1.2. EVs can have a minimal environmental impact, since the energy consumed by
the EVs can be generated from many sources, including clean renewable energy sources.
Another key advantage to EVs is their ability to recover energy, that otherwise would be
lost during braking, which is known as Regenerative (Regen) braking.
0.0
20.0
40.0
60.0
80.0
100.0
120.0
140.0
1990 2000 2010 2020 2030 2040
Do
lla
rs p
er
ba
rre
l
Year
Figure 1.2: EIA forecasts of global oil price based on the 2011 Annual Energy Outlook [6].
As of the date of this writing, the Toyota Prius, the first mass-produced hybrid
gasoline-electric car, is the world’s best selling HEV. The Nissan leaf is the world’s top
selling highway capable EV and the Chevrolet Volt family is the best selling PHEV.
According to Pike Research [7], HEVs and PHEVs will represent 3.1% and 5.1% of the

Chapter 1. Introduction 4
total worldwide and U.S. auto sales by 2017, respectively [8]. EVs, which are the main
focus of this thesis, face many challenges in dominating the market. These challenges
will be discussed in the following section and some of them will be addressed throughout
this thesis.
1.1.1 Challenges in SESS EVs
One major challenge in the mass adoption of EVs and HEVs is their Energy Storage
System (ESS) [9, 10]. Classical electrochemical batteries have several limitations:
• Lower energy-density compared to petrol-based fuel, which affects the weight and
the range of the vehicles. The specific-energy of petrol and Lithium-Ion (Li-Ion)
batteries (the dominant battery chemistry in modern EVs) are 13 kWh/kg and 0.2
kWh/kg, respectively. Considering a typical energy efficiency of 20 % for the ICEs
and 90% for the electrical drives, the effective specific-energy of petrol is 14 times
higher than that of Lithium-Ion batteries, resulting in a very limited range for EVs.
The all-electric range of typical EVs is in the order of 100 km, based on the United
States Environmental Protection Agency (EPA) [11]. For example, the all-electric
range of the Chevy Volt and the Nissan Leaf is 56 km and 117 km, respectively.
• The charge time is another prohibitive factor [12] and charging time varies with
the charging levels [13]. For instance, using an on-board 3.3 kW charger, it takes 7
hours to fully charge the Nissan Leaf’s 24 kWh battery pack.
• The battery lifetime is another major concern and is usually not sufficient for
traction applications [12].
Numerous battery chemistries are available [14] and the best choice of battery is
application dependant. A brief summary of available battery chemistries is provided
below:

Chapter 1. Introduction 5
1. Lead-Acid Batteries:
Using Lead as the negative, Lead Oxide as the positive electrode and diluted Sulfu-
ric Acid as the electrolyte, Lead-Acid batteries provide many advantages for HEV
applications [14]; comparatively low cost, mature technology, and being mass pro-
duced are the advantages, while being limited to only 20% of the rated capacity in
its Depth of Discharge (DOD), limited life cycle if operated with low State of Charge
(SOC) and low specific-energy and power due to heavy Lead collectors [15, 16] are
the main disadvantages of this battery chemistry.
2. Nickel-Metal Hydride (NiMH) Batteries:
Using an Alkaline solution as the electrolyte, NiMH batteries consist of Nickel Hy-
droxide as the positive and an engineered alloy of Vanadium, Titanium, Nickel, and
other metals as the negative electrode [14]. With twice the specific-energy compared
to the Lead-Acid batteries, the NiMH batteries are environmental friendly and are
recyclable [17]. The NiMH battery is safe for high voltage operation and provides
several advantages, such as long cycle life, wide operating temperature range and
it is over charge and discharge resistance [18]. Repeatedly discharging at high load
currents reduces the NiMH lifetime to 200-300 cycles. The DOD should be lim-
ited to 20-50% of the rated capacity, to ensure the best battery performance [19].
Memory effect in the NiMH batteries limits the usable power [14].
3. Lithium-Ion Batteries:
Li-Ion batteries provide excellent performance in portable applications [20]. The
Positive electrode varies from Cobalt Oxide, Manganese Oxide, Iron Phosphate ,
Nickel Manganese Cobalt Oxide and Nickel Cobalt Aluminum Oxide [21]. Lithium
salt in an organic solvent is used as the electrolyte and Carbon material as the
negative electrode [14]. High specific-energy of over 100 Wh/kg, recyclability and
long cycle life of several thousands cycles are the most important advantages of this
Chapter 1. Introduction 6
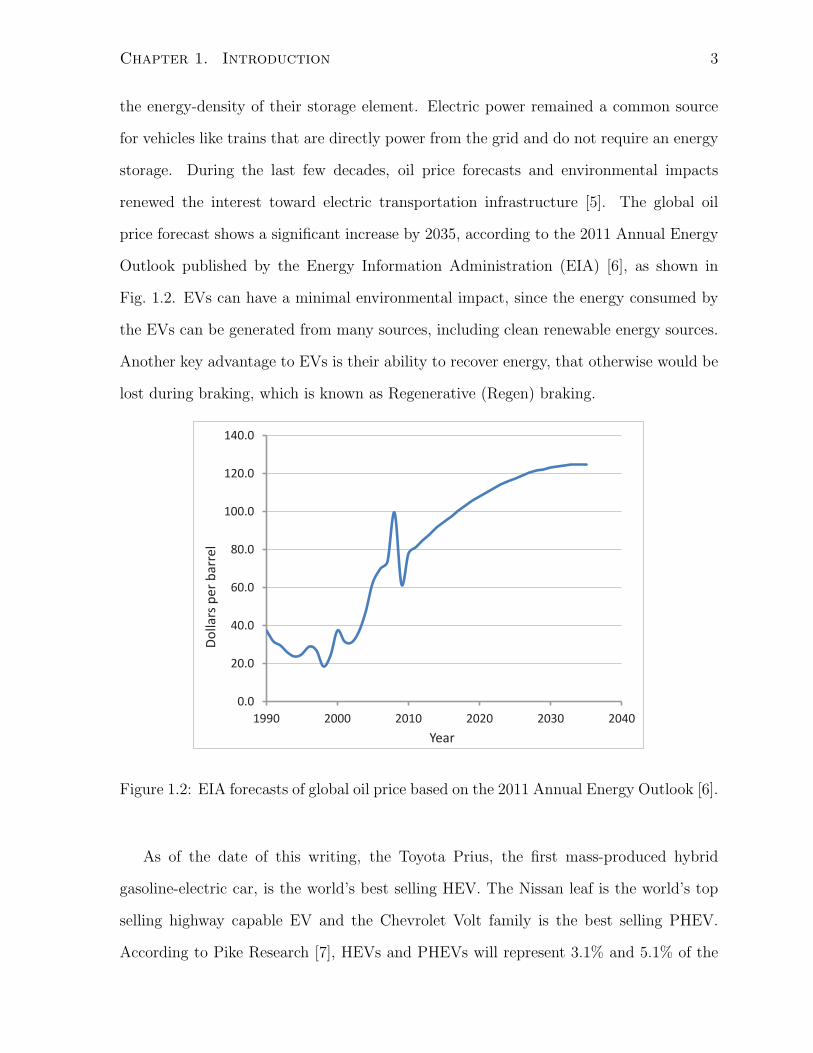
chemistry [22]. Fig. 1.3 shows a comparison of the most important characteristics of
various Li-Ion based batteries. Lithium Nickel Manganese Cobalt Oxide technology
is the preferred candidate for EVs [21], as it provides an excellent trade-off between
these important aspects, as shown in Fig. 1.3.
Specific Energy
Specific
PowerCost
Life
Span
Performance
Safety
Li Ni Mn Co Oxide
Li Mn Oxide
Li Fe Phosphate
Li Co Oxide
Figure 1.3: Characteristic comparison of different Lithium-ion based batteries.
4. Nickel-Zinc (Ni-Zn) Batteries:
These batteries provide high specific-energy and power with low-cost materials with
deep cycling capabilities [14]. They are environmental friendly but suffer from poor
lifetime due to the fast growth of dendrites [23].
5. Nickel-Cadmium (Ni-Cd) Batteries:
Ni-Cd batteries have a specific-energy of about 55 Wh/kg. Long lifetime and full
discharge capability without any damage are the advantages coming at the cost of
its higher price compared to other chemistries [14, 24,25].
A comparison of the specific-energy of different battery chemistries is provided in
Table 1.1 [21]. Although Lithium Cobalt has the highest specific-energy, Lithium Man-
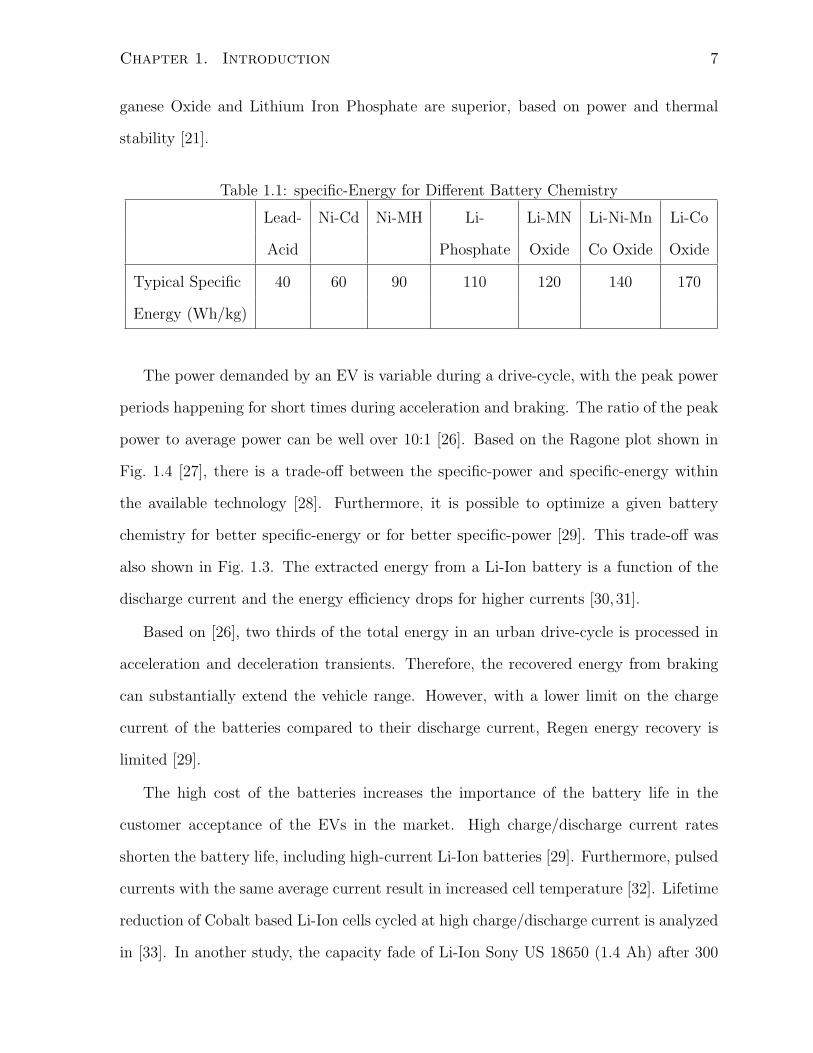
Chapter 1. Introduction 7
ganese Oxide and Lithium Iron Phosphate are superior, based on power and thermal
stability [21].
Table 1.1: specific-Energy for Different Battery Chemistry
Lead- Ni-Cd Ni-MH Li- Li-MN Li-Ni-Mn Li-Co
Acid Phosphate Oxide Co Oxide Oxide
Typical Specific 40 60 90 110 120 140 170
Energy (Wh/kg)
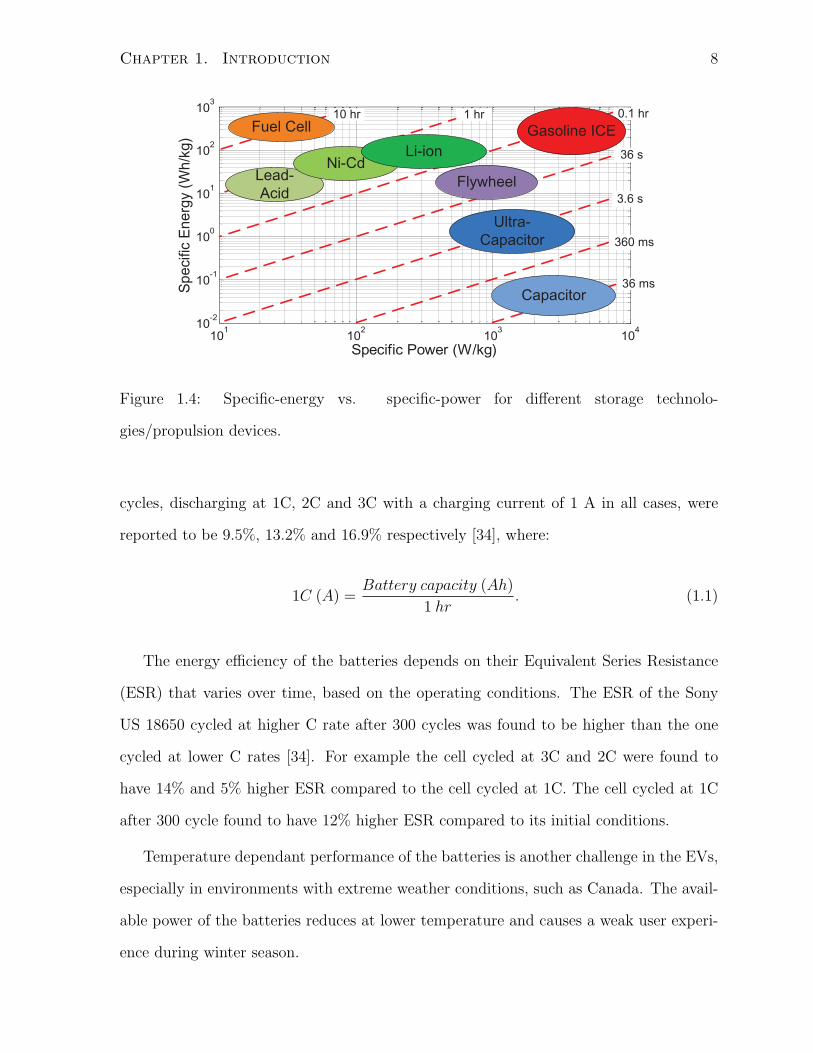
The power demanded by an EV is variable during a drive-cycle, with the peak power
periods happening for short times during acceleration and braking. The ratio of the peak
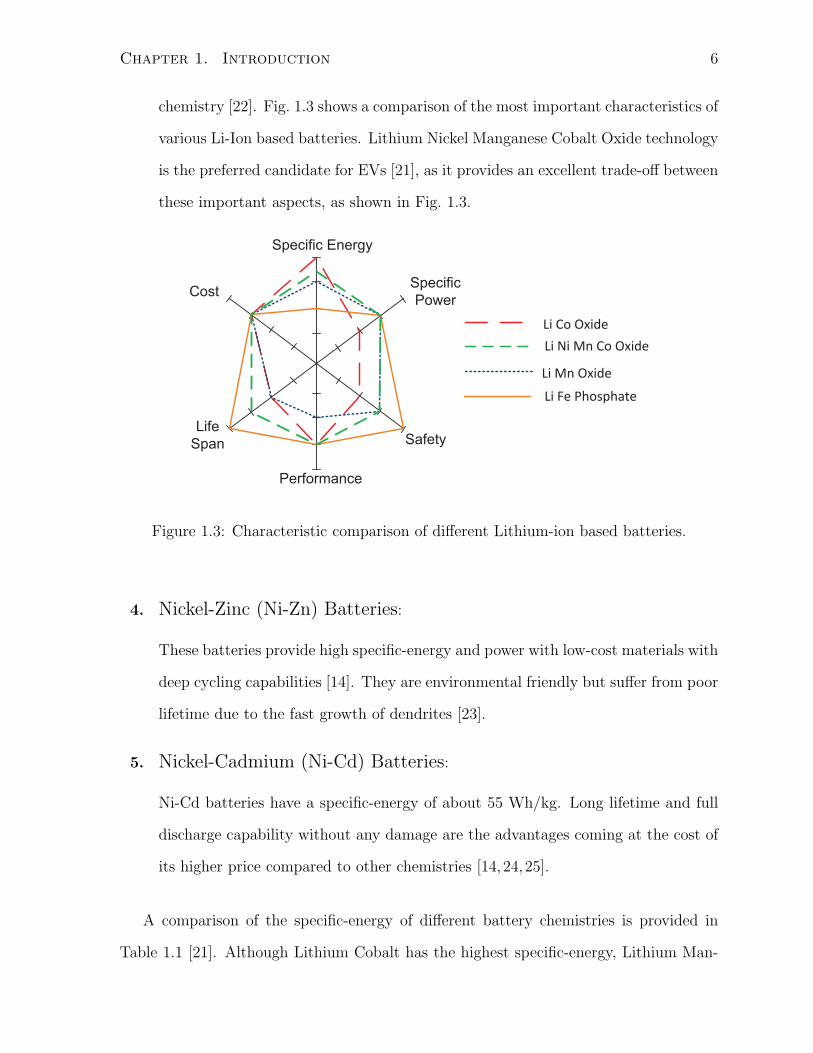
power to average power can be well over 10:1 [26]. Based on the Ragone plot shown in
Fig. 1.4 [27], there is a trade-off between the specific-power and specific-energy within
the available technology [28]. Furthermore, it is possible to optimize a given battery
chemistry for better specific-energy or for better specific-power [29]. This trade-off was
also shown in Fig. 1.3. The extracted energy from a Li-Ion battery is a function of the
discharge current and the energy efficiency drops for higher currents [30,31].
Based on [26], two thirds of the total energy in an urban drive-cycle is processed in
acceleration and deceleration transients. Therefore, the recovered energy from braking
can substantially extend the vehicle range. However, with a lower limit on the charge
current of the batteries compared to their discharge current, Regen energy recovery is
limited [29].
The high cost of the batteries increases the importance of the battery life in the
customer acceptance of the EVs in the market. High charge/discharge current rates
shorten the battery life, including high-current Li-Ion batteries [29]. Furthermore, pulsed
currents with the same average current result in increased cell temperature [32]. Lifetime
reduction of Cobalt based Li-Ion cells cycled at high charge/discharge current is analyzed
in [33]. In another study, the capacity fade of Li-Ion Sony US 18650 (1.4 Ah) after 300
Chapter 1. Introduction 8
101
102
103
104
10-2
10-1
100
101
102
103
Specific Power (W/kg)
Sp
ecific
En
erg
y (
Wh
/kg
)
36 ms
360 ms
3.6 s
36 s
0.1 hr1 hr10 hrFuel Cell
Lead-
AcidFlywheel
Gasoline ICE
Ultra-
Capacitor
Capacitor
Ni-CdLi-ion
Figure 1.4: Specific-energy vs. specific-power for different storage technolo-
gies/propulsion devices.
cycles, discharging at 1C, 2C and 3C with a charging current of 1 A in all cases, were
reported to be 9.5%, 13.2% and 16.9% respectively [34], where:
1C (A) =Battery capacity (Ah)
1 hr. (1.1)
The energy efficiency of the batteries depends on their Equivalent Series Resistance
(ESR) that varies over time, based on the operating conditions. The ESR of the Sony
US 18650 cycled at higher C rate after 300 cycles was found to be higher than the one
cycled at lower C rates [34]. For example the cell cycled at 3C and 2C were found to
have 14% and 5% higher ESR compared to the cell cycled at 1C. The cell cycled at 1C
after 300 cycle found to have 12% higher ESR compared to its initial conditions.
Temperature dependant performance of the batteries is another challenge in the EVs,
especially in environments with extreme weather conditions, such as Canada. The avail-
able power of the batteries reduces at lower temperature and causes a weak user experi-
ence during winter season.
Chapter 1. Introduction 9
With this limitations in mind, one can improve the ESS by combining different energy
storage devices into the storage system. This motivates us to take a look at the hybrid
energy storage systems (HESS) in the next section.
1.2 Hybrid Energy Storage System for EVs
Implementing low-cost, high-density and power-efficient energy storage system is one of
the key technological hurdles for enabling future mass-adoption of EVs. Different storage
technologies, such as fuel cell (FC), flywheel and ultracapacitor (u-cap), can be combined
with the batteries to form a HESS for an EV. Fuel cell generates electricity from the
reaction of the fuel and oxidant in an electrolyte. FC has several advantages including
high conversion efficiency, zero or very low emission, quiet operation, fuel flexibility,
durability and reliability. The main drawbacks of FCs are high cost and longer response
time compared to batteries and u-caps [14].
A flywheel stores mechanical energy that can be transformed into electrical energy
through an electrical machine with bi-directional operation capability. Flywheels have
symmetric input and output specific-power in the range of 1-12 kW/kg [28,35]. Flywheels
consist of environmental friendly materials and high number of charge/discharge cycles,
high DOD capability, simple and reliable SOC monitoring are the main advantages of
such storage systems [35,36]. However, flywheels are not suitable for power levels below
100 kW due to their higher capital cost compared to other storage systems, especially
u-caps [28].
Electrochemical double-layer capacitors (EDLC), also known as u-caps, have been
developed as a complimentary energy storage technology to batteries [37]. Today’s u-
caps have symmetric input and output specific-power in the range of 0.5-25 kW/kg [38],
which is at least one order of magnitude higher than typical Li-Ion based batteries [39].
The high specific-power and low ESR of modern u-caps allow their integration into smart,
Chapter 1. Introduction 10
electronically controlled HESS for EVs.
Effectively combining the high specific-power of u-caps and the high specific-energy of
Li-Ion batteries is a major challenge. In conventional EVs, the excess Regen power that
cannot be safely absorbed by the battery must be dissipated in the mechanical brakes.
The most important goals of the u-cap/battery HESS are:
• Maximize the re-use of Regen energy,
• Reduce the wear on the mechanical brakes and
• Minimize the strain on the battery during rapid acceleration/deccelerations.
The HESS concept has been previously studied through system-level simulations [40–44]
with reported driving-range improvements of up to 46 % [41].
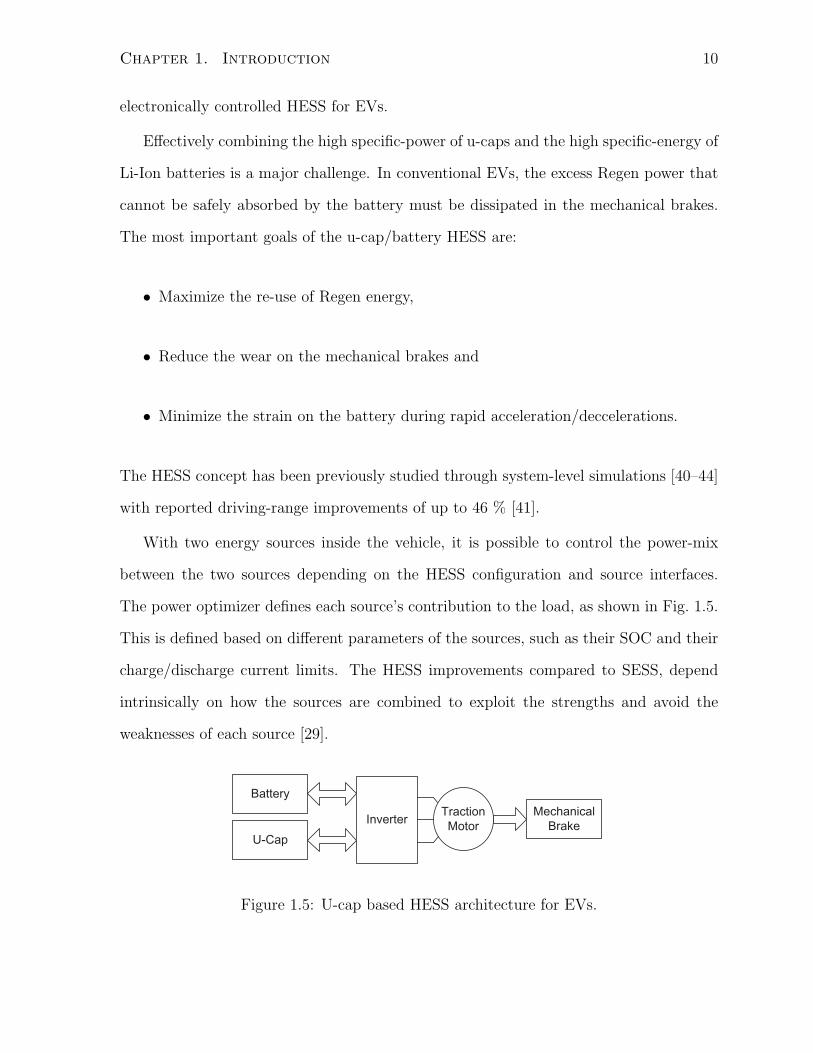
With two energy sources inside the vehicle, it is possible to control the power-mix
between the two sources depending on the HESS configuration and source interfaces.
The power optimizer defines each source’s contribution to the load, as shown in Fig. 1.5.
This is defined based on different parameters of the sources, such as their SOC and their
charge/discharge current limits. The HESS improvements compared to SESS, depend
intrinsically on how the sources are combined to exploit the strengths and avoid the
weaknesses of each source [29].
Battery
U-Cap
InverterTraction
Motor
Mechanical
Brake
Figure 1.5: U-cap based HESS architecture for EVs.
Chapter 1. Introduction 11
1.2.1 Detailed Comparison of Lithium-Ion Batteries vs. Ultra-
capacitors
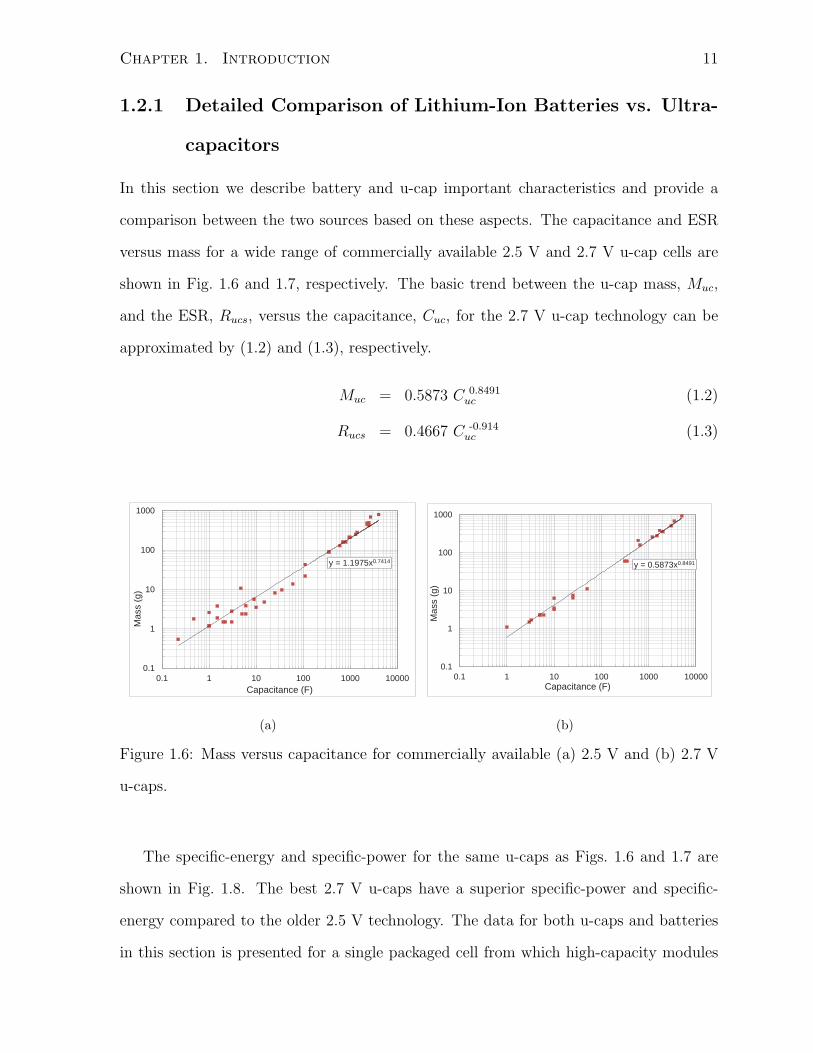
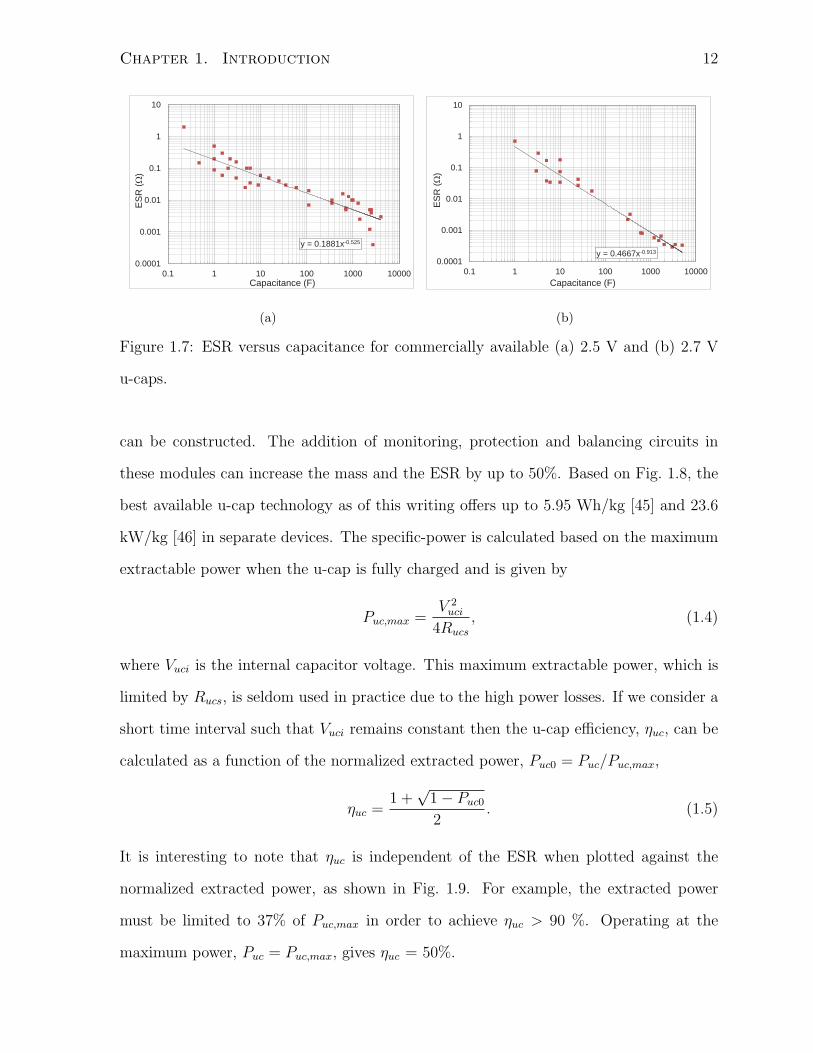
In this section we describe battery and u-cap important characteristics and provide a
comparison between the two sources based on these aspects. The capacitance and ESR
versus mass for a wide range of commercially available 2.5 V and 2.7 V u-cap cells are
shown in Fig. 1.6 and 1.7, respectively. The basic trend between the u-cap mass, Muc,
and the ESR, Rucs, versus the capacitance, Cuc, for the 2.7 V u-cap technology can be
approximated by (1.2) and (1.3), respectively.
Muc = 0.5873 C 0.8491uc (1.2)
Rucs = 0.4667 C -0.914uc (1.3)
y = 1.1975x0.7414
0.1
1
10
100
1000
0.1 1 10 100 1000 10000
Ma
ss (
g)
Capacitance (F)
(a)
y = 0.5873x0.8491
0.1
1
10
100
1000
0.1 1 10 100 1000 10000
Ma
ss (
g)
Capacitance (F)
(b)
Figure 1.6: Mass versus capacitance for commercially available (a) 2.5 V and (b) 2.7 V
u-caps.
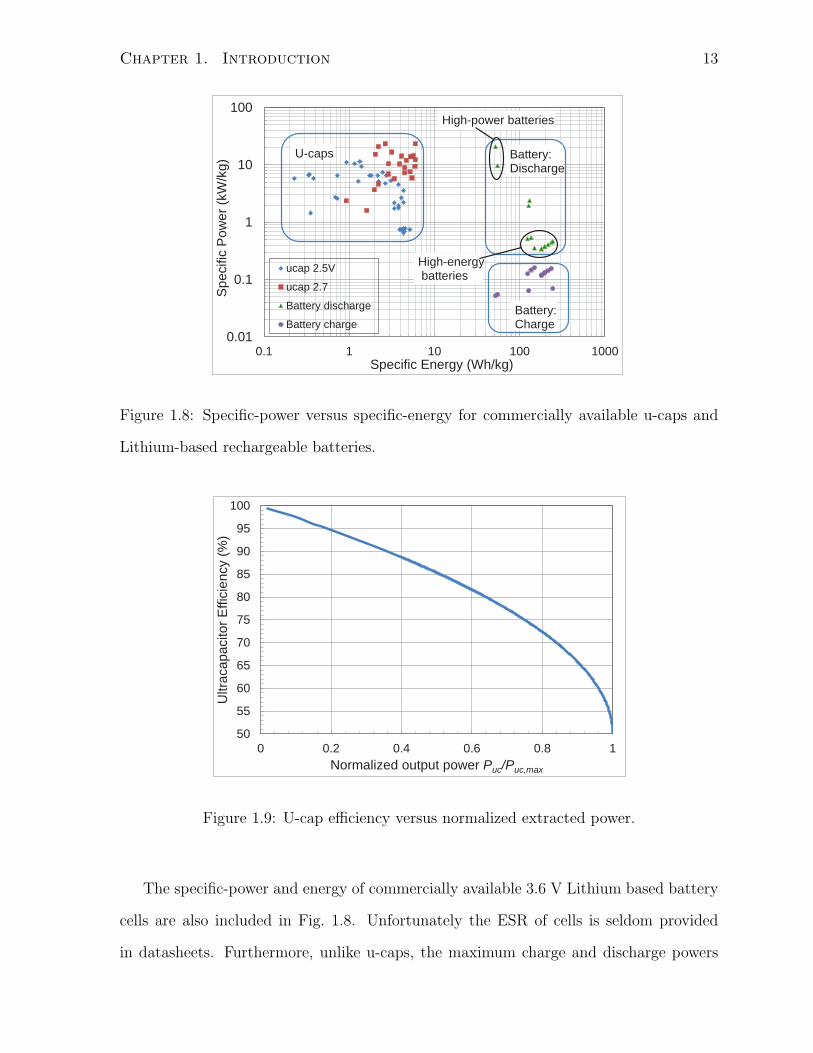
The specific-energy and specific-power for the same u-caps as Figs. 1.6 and 1.7 are
shown in Fig. 1.8. The best 2.7 V u-caps have a superior specific-power and specific-
energy compared to the older 2.5 V technology. The data for both u-caps and batteries
in this section is presented for a single packaged cell from which high-capacity modules
Chapter 1. Introduction 12
y = 0.1881x-0.525
0.0001
0.001
0.01
0.1
1
10
0.1 1 10 100 1000 10000
ES
R (
)
Capacitance (F)
(a)
y = 0.4667x-0.913
0.0001
0.001
0.01
0.1
1
10
0.1 1 10 100 1000 10000
ES
R (
)
Capacitance (F)
(b)
Figure 1.7: ESR versus capacitance for commercially available (a) 2.5 V and (b) 2.7 V
u-caps.
can be constructed. The addition of monitoring, protection and balancing circuits in
these modules can increase the mass and the ESR by up to 50%. Based on Fig. 1.8, the
best available u-cap technology as of this writing offers up to 5.95 Wh/kg [45] and 23.6
kW/kg [46] in separate devices. The specific-power is calculated based on the maximum
extractable power when the u-cap is fully charged and is given by
Puc,max =V 2uci
4Rucs
, (1.4)
where Vuci is the internal capacitor voltage. This maximum extractable power, which is
limited by Rucs, is seldom used in practice due to the high power losses. If we consider a
short time interval such that Vuci remains constant then the u-cap efficiency, ηuc, can be
calculated as a function of the normalized extracted power, Puc0 = Puc/Puc,max,
ηuc =1 +
√1− Puc0
2. (1.5)
It is interesting to note that ηuc is independent of the ESR when plotted against the
normalized extracted power, as shown in Fig. 1.9. For example, the extracted power
must be limited to 37% of Puc,max in order to achieve ηuc > 90 %. Operating at the
maximum power, Puc = Puc,max, gives ηuc = 50%.
Chapter 1. Introduction 13
0.01
0.1
1
10
100
0.1 1 10 100 1000
Sp
ecific
Po
we
r (k
W/k
g)
Specific Energy (Wh/kg)
ucap 2.5V
ucap 2.7
Battery discharge
Battery charge
U-caps Battery:Discharge
Battery:Charge
High-power batteries
High-energybatteries
Figure 1.8: Specific-power versus specific-energy for commercially available u-caps and
Lithium-based rechargeable batteries.
50
55
60
65
70
75
80
85
90
95
100
0 0.2 0.4 0.6 0.8 1
Ultra
ca
pa
cito
r E
ffic
ien
cy (
%)
Normalized output power Puc/Puc,max
Figure 1.9: U-cap efficiency versus normalized extracted power.
The specific-power and energy of commercially available 3.6 V Lithium based battery
cells are also included in Fig. 1.8. Unfortunately the ESR of cells is seldom provided
in datasheets. Furthermore, unlike u-caps, the maximum charge and discharge powers

Chapter 1. Introduction 14
are not equal and are significantly lower than the predicted values when one considers
the battery ESR, as in (1.4). It is apparent from Fig. 1.8 that there is a trade-off
between batteries having a high specific-power and specific-energy, depending on the cell
chemistry as was also shown in Fig. 1.3 for Li-Ion based batteries. Today’s high-power
batteries have a discharge specific-power approaching that of the best u-caps. At first
glance, it would appear from Fig. 1.8 that the benefit of introducing u-caps into a HESS
is mainly to achieve a more symmetric charge/discharge power capability. In fact, the
design considerations are considerably more subtle:
1. The long-term health of the battery is heavily dependent on the cumulative num-
ber of charge/discharge cycles, as well as the power profile. Even if the battery
can handle the peak power requirements in the application, off-loading the power
transients to the u-cap extends the battery lifetime [34].
2. The battery data in Fig. 1.8 is provided at nominal conditions. In practice, the
energy capacity and ESR are strong functions of temperature [47]. The benefits of
a HESS may therefore become much more attractive when considering the whole
automotive temperature range. To further complicate the design, the maximum
power capability of the u-cap depends on the state-of-charge (SOC).
3. Fig. 1.8 does not include economic considerations, which are rapidly evolving. In
general, the cost of using a high-power Li-Ion battery technology has to be weighed
against using a u-cap based HESS with a low-cost, high energy-density battery.
Today’s ultracapacitors offer improved cycling lifetime and withstand 500,000 to
1,000,000 cycles with less than 30% capacitance degradation and 100% ESR change
[38, 45, 46], which is orders of magnitudes higher than the typical Li-Ion batteries with
hundreds to thousands of cycles for 20% capacity fade [39,48,49]. U-caps do not suffer as
severely from high DOD effects as Li-Ion batteries [50,51]. [51] shows that by increasing

Chapter 1. Introduction 15
the DOD from 30% to 80%, a Li-Ion battery life is reduced from 2600 cycles to 1000
cycles.
Finally, u-caps can operate under a wider temperature range than batteries and when
used together, u-caps can compensate for the reduction in the available power from the
batteries in extreme weather conditions [29].
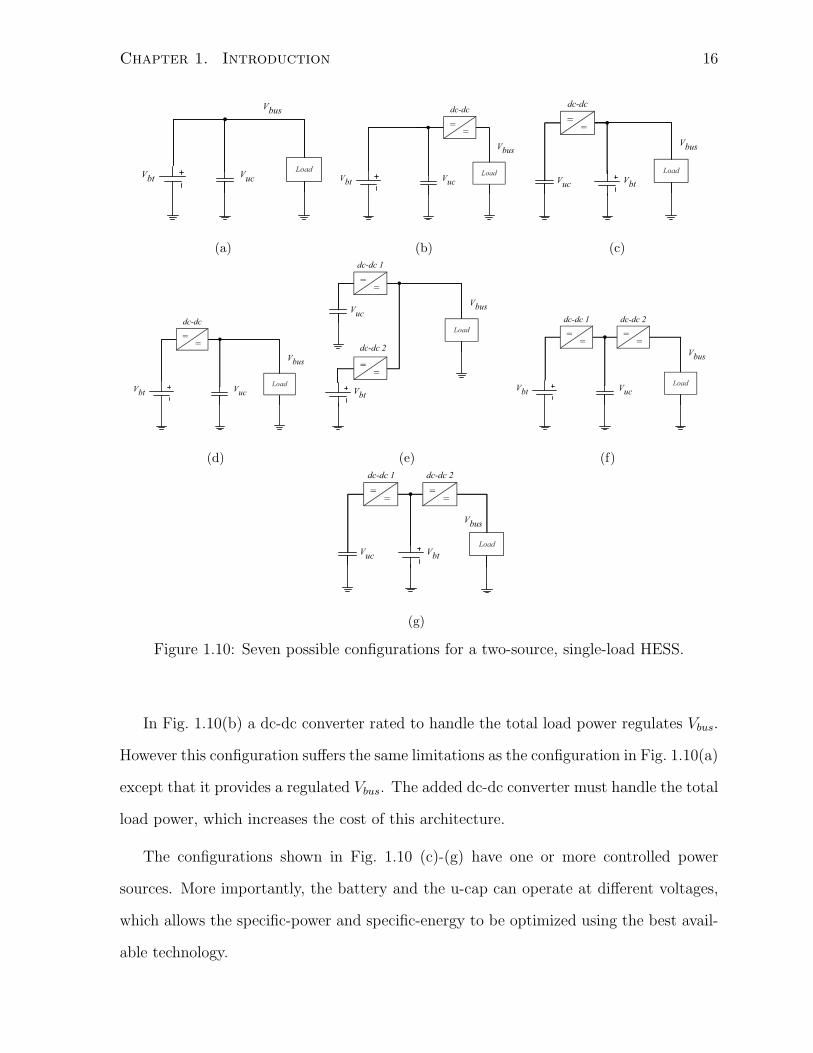
1.2.2 Possible Ultracapacitor/Battery HESS Configurations and
Control Strategies
A HESS with two energy storage elements and one load has seven possible configurations,
as shown in Fig. 1.10. The motor-drive load and all dc-dc converters have bi-directional
power capability. Choosing the most appropriate configuration depends on the applica-
tion and power level. The power optimizer control strategy is a strong function of the
HESS configuration and therefore they are considered with their corresponding topologies
in this thesis.
The simplest configuration choice is shown in Fig. 1.10(a), where the u-cap, battery
and load are directly connected in parallel. The simplicity of this system is attractive,
however it has several limitations:
1. The power sharing between the battery and u-cap is uncontrolled and dictated only
by the parasitic elements [52,53], which are not well known and vary with aging.
2. The energy capacity of the u-cap is under-utilized, since the voltage is restricted
to the narrow range of the battery, which typically ranges from 2.8 V to 4.2 V per
cell.
3. There is no flexibility in the choice of nominal battery and u-cap voltage.
4. The bus voltage, Vbus, is un-regulated and varies depending on the battery voltage
range, which impacts the inverter design in EV applications.
Chapter 1. Introduction 16
Vbt
Vuc
Load
Vbus
(a)
Vbt
Vuc
Load
Vbus
==
dc-dc
(b)
Vbt
Vuc
Load
Vbus
==
dc-dc
(c)
Vbt
Vuc
Load
Vbus
==
dc-dc
(d)
Vbt
Vuc
Load
Vbus
==
dc-dc 1
==
dc-dc 2
(e)
Vbt
Vuc
Load
Vbus
==
dc-dc 1
==
dc-dc 2
(f)
Vbt
Vuc
Load
Vbus
==
dc-dc 1
==
dc-dc 2
(g)
Figure 1.10: Seven possible configurations for a two-source, single-load HESS.
In Fig. 1.10(b) a dc-dc converter rated to handle the total load power regulates Vbus.
However this configuration suffers the same limitations as the configuration in Fig. 1.10(a)
except that it provides a regulated Vbus. The added dc-dc converter must handle the total
load power, which increases the cost of this architecture.
The configurations shown in Fig. 1.10 (c)-(g) have one or more controlled power
sources. More importantly, the battery and the u-cap can operate at different voltages,
which allows the specific-power and specific-energy to be optimized using the best avail-
able technology.
Chapter 1. Introduction 17
The power sharing between the u-cap and the battery in the topology shown in
Fig. 1.10(c) is well studied in the literature [3, 40, 41, 44, 54–58]. This topology offers a
narrow voltage range on the bus and therefore a better inverter operating efficiency com-
pared to Fig. 1.10(a), (d). In [40], a model predictive control of the HESS configuration
shown in Fig. 1.10(c) was demonstrated to reduce the discharge intensity of the battery
in a HEV to maximize its lifetime. In another study based on Fig. 1.10(c), the main
control objectives for HESS were stated as [54]:
1. Setting the power mix based on the optimal operating point of each source.
2. Minimizing the losses of the overall system.
3. Optimizing the u-cap SOC.
The HESS improves the driving performance, reduces the energy consumption of the
HEVs and improves the battery operating conditions based on the results published
in [55]. Utilizing the same HESS configuration for a LEV, [56] states the main controller
objectives to be the u-cap SOC control, while smoothing the battery current for optimal
battery performance. [41] uses a fuzzy sliding mode controller to recover more Regen
energy with the HESS assuming a battery charging current limit. A filter based control
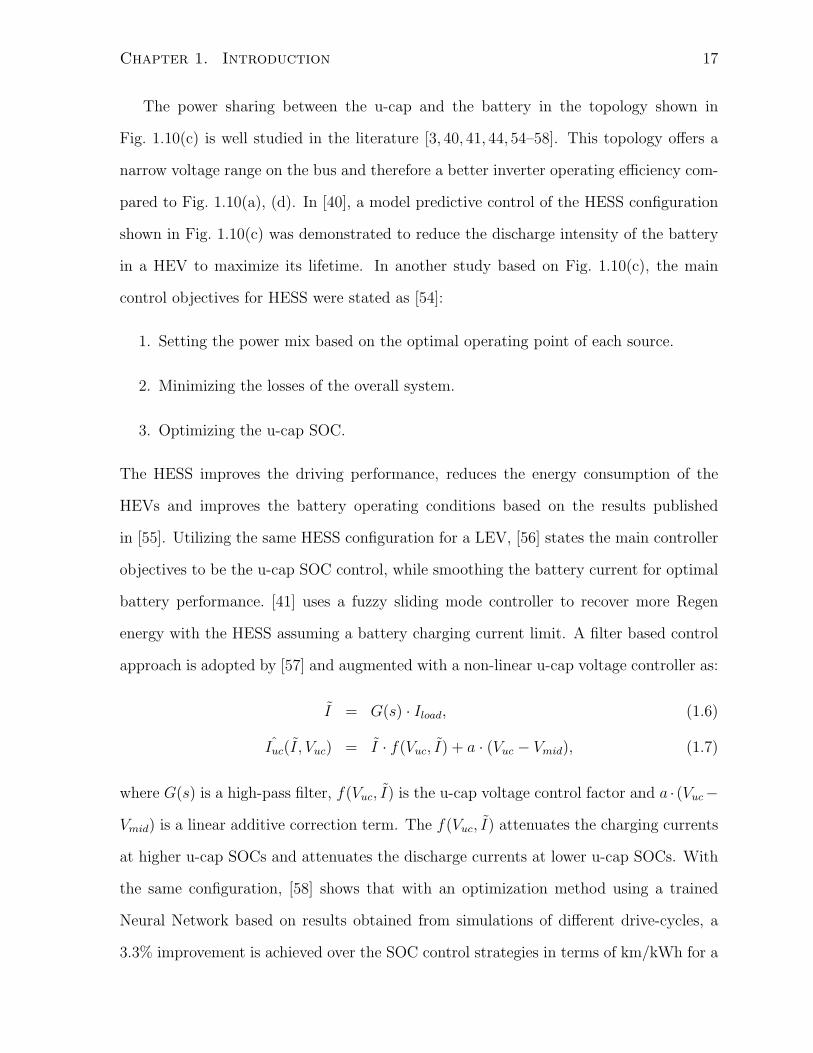
approach is adopted by [57] and augmented with a non-linear u-cap voltage controller as:
I = G(s) · Iload, (1.6)
Iuc(I , Vuc) = I · f(Vuc, I) + a · (Vuc − Vmid), (1.7)
where G(s) is a high-pass filter, f(Vuc, I) is the u-cap voltage control factor and a · (Vuc−
Vmid) is a linear additive correction term. The f(Vuc, I) attenuates the charging currents
at higher u-cap SOCs and attenuates the discharge currents at lower u-cap SOCs. With
the same configuration, [58] shows that with an optimization method using a trained
Neural Network based on results obtained from simulations of different drive-cycles, a
3.3% improvement is achieved over the SOC control strategies in terms of km/kWh for a

Chapter 1. Introduction 18
Chevrolet light utility vehicle. It also shows that with a primary source unable to receive
Regen energy, the improvement would be as high as 28.7% in terms of km/kWh. In
another study, [3] designed and implemented an ultracapacitor based HESS for an EV
with a 54 kW drivetrain. Two control strategies based on heuristics and optimization
model using neural networks are studied and the results were incorporated to an economic
evaluation of the system. Results shows that a battery life extension of 50% is required to
compensate for the HESS costs. Similar analysis were performed for a hypothetical fuel-
cell based hybrid vehicle showing that the u-cap based HESS is the most cost effective
solution.
In Fig. 1.10(d), the u-cap on Vbus provides the opportunity to efficiently capture the
Regen energy [59, 60]. However, the u-cap energy is under-utilized and the higher u-cap
rated voltage introduces weight and balancing challenges. Hysteretic control schemes
were applied to control Vuc in [59] for this configuration. It is shown that despite the
improvement of battery current profile, it can experience high discharge currents if Vuc
drops below Vbt. The specific-power improvement of this configuration has also been
studied for pulsed power applications in [60]. It is shown that power capability of the
configuration shown in Fig. 1.10(d) can be nearly 3 times greater than that of Fig. 1.10(a)
for a pulsating current at a rate of 0.2 Hz at a 10% duty ratio.
The configuration shown in Fig. 1.10(e) has flexible operating voltages and provides
explicit power sharing control at the expense of adding two dc-dc converters [12, 29, 37,
61,62]. A comparison of different control strategies such as:
1. Source resistance strategy that tries to minimize the losses when Iload > 0 and
redirect all the energy to the u-cap when Iload < 0.
2. Vehicle acceleration strategy where the u-cap provides all the acceleration power
while the battery provide the power to overcome global friction forces.
3. Filtration strategy by servicing the low-frequency component of the load power
Chapter 1. Introduction 19
from the battery.
4. Variable saturation current strategy to limit the battery charge/discharge current
to predefined values based on electrical consumption.
is presented in [12], where sizing and expected life-time of the batteries were considered.
For the same configuration, [29] uses the u-cap during transients to provide a smooth
battery current profile and then restores the u-cap SOC to a desired level afterward.
However, it does not describe the HESS system under Regen conditions. The configura-
tion is also used in [62] to control the power-flow and avoid over-stressing the battery and
the fuel-cell for a system containing a fuel-cell, battery and u-cap, in a hybrid vehicle. A
self-optimizing, multi-objective optimization technique is proposed in [61] used to con-
trol a NiMH based HESS. The algorithm defines the importance of the two objectives:
minimization of energy loss and maximization of the power reserve (i.e. the deviation of
the u-cap SOC from its midpoint). The authors consider an application of a RailCab,
containing predefined sets of short range load profiles (approx. 2 min), associated with
recognized turns and paths. In our prior work [37], we proposed a predictive power opti-
mization algorithm to control the power-mix in an HESS configured as Fig. 1.10(e) for a
LEV where the entire drive-cycle is considered unknown, using a state-based approach,
organized as a probability-weighted markov process to predict future load demands. A
real-time global optimizer is then used to control the appropriate power mix based on
the predictions and probabilities of state trajectories along with their associated system
losses.
The configurations shown in Fig. 1.10(f) and (g) offer the same control flexibility as
Fig. 1.10(d) and (c) but the extra dc-dc converter, dc-dc 2, must handle the total load
power, increasing the cost. The rated and peak power capability of dc-dc converters in
Fig. 1.10(c)-(e) can be lower than those of the load due to power sharing.
The salient features of the seven HESS configurations are summarized in Table 1.2.
The topology shown in Fig. 1.10(e) is a good candidate for LEV based HESS [37], as

Chapter 1. Introduction 20
considered in Chapter 2, since it offers the most flexibility in operating voltages and
provides effective control over the battery current, while minimizing the number of con-
version stages from battery to load. The configuration in Fig. 1.10(c) is considered in
Chapter 3 for high-power EV applications, where the additional cost of the second dc-
dc converter and the energy losses due to the conversion stage from battery to load is
prohibitive.
Table 1.2: Comparison of HESS Architectures
Fig. 1.10(a) Fig. 1.10(b) Fig. 1.10(c) Fig. 1.10(d) Fig. 1.10(e) Fig. 1.10(f) Fig. 1.10(g)
[52,53] [3, 40,41], [59,60] [12,29,37],
[44,54–58] [61,62]
DC-DC Converters 0 1 1 1 2 2 2
Constant Vbus N Y N N Y Y Y
Voltage Swing on Vuc Low Low High Low High High High
Controlled Iuc N N Y N Y Y Y
Controlled Ibt N N N Y Y Y Y
DC-DC Stages 0 1 0 1 1 2 1
from Vbt to Vbus
Chapter 1. Introduction 21
1.3 Thesis Motivation and Objectives
The goal of this work is to investigate and further improve the benefits of the ultracapac-
itor/battery based HESS in both LEVs and EVs. More specifically, we are addressing
an efficiency optimization of the dc-dc converter for a LEV based HESS. Furthermore,
we are investigating a HESS design for a prototype EV to evaluate the benefits of utiliz-
ing Real-Time (RT) Global Positioning System (GPS) data processing in the power-mix
optimizer.
The first objective is to design a high-efficiency bi-directional dc-dc converter to inter-
face the battery to the bus in the HESS architecture of a LEV, as shown in Fig. 1.10(e).
The converter must meet the following requirements, as described in Chapter 2:
• Simple architecture with low cost, mass and volume,
• Digitally controlled,
• High efficiency over a wide operating range,
• Limited bandwidth, since the current commands are updated at a slow rate in the
range of 1-10 Hz.
Although some research efforts were directed toward utilizing the information of the
drive-cycle in the power-mix decisions, the possible benefits of real-time GPS data pro-
cessing are not addressed in the literature. Therefore, the second objective of this thesis
is to:
• Design a HESS for a prototype EV,
• Design a relatively simple real-time GPS data processing scheme to obtain the
position of stop signs and traffic signals for a given current position of the vehicle,
• Design a power-mix optimizer with minimal computational requirements that uti-
lizes the GPS data information,
Chapter 1. Introduction 22
• Simulate the system level architecture to evaluate the benefits of the approach,
• Finally, implement the designed HESS and integrate it into a prototype EV.
Complex computational processings should be avoided, since they need to be done in
real-time, on a reasonably sized target processor based on the requirements of vehicular
application. Assuming the effectiveness of the approach, the minimal incremental cost
of the GPS data utilization will further justify the utilization of this scheme in HESS
architectures.
This thesis is organized as follows, Chapter 2 introduces a high efficiency bi-directional
dc-dc converter design for a LEV based HESS. A HESS design and a novel control strategy
based on real-time GPS processing for a Canadian made prototype EV are then presented
in Chapter 3. Furthermore, a 30kW bi-directional dc-dc converter is implemented for the
proposed HESS and experimental results of this converter are also provided in Chapter
3. Finally, the conclusions and future work are discussed in Chapter 4.
References
[1] A. Faiz, C. S. Weaver, and M. P. Walsh, Air Pollution from Motor Vehicles: Stan-
dards and Technologies for Controlling Emissions. World Bank Publications, 1996.
[2] “Hybrid electric vehicles.” National Renewable Energy Labratory, NREL. Accessed
July 2012, available at http://www.nrel.gov/vehiclesandfuels/hev/hevs.html.
[3] M. Ortuzar, J. Moreno, and J. Dixon, “Ultracapacitor-based auxiliary energy sys-
tem for an electric vehicle: Implementation and evaluation,” IEEE Transactions on
Industrial Electronics, vol. 54, pp. 2147 –2156, Aug. 2007.
[4] Brammo, Inc. Accessed in August 2012, available at
http://www.brammo.com/home/.
[5] D. U. Eberle and D. R. von Helmolt, “Sustainable transportation based on electric
vehicle concepts: a brief overview,” Energy Environ. Sci., vol. 3, pp. 689–699, 2010.
[6] United States Energy Information Administration (EIA). Accessed in August 2012,
available at http://www.eia.gov/.
[7] “Electric vehicle market forecasts.” Pike Research. Accessed July 2012, available at
http://www.pikeresearch.com/research/electric-vehicle-market-forecasts.
[8] “Electric vehicles to surpass 5 percent market share in the u.s. by
2017.” Green Retail Decisins. Accessed July 2012, available at
23
REFERENCES 24
http://www.greenretaildecisions.com/news/2011/12/08/electric-vehicles-to-
surpass-5-percent-market-share-in-the-us-by-2017.
[9] S. Lukic, J. Cao, R. Bansal, F. Rodriguez, and A. Emadi, “Energy storage systems
for automotive applications,” IEEE Transactions on Industrial Electronics, vol. 55,
pp. 2258 –2267, June 2008.
[10] A. Burke, “Batteries and ultracapacitors for electric, hybrid, and fuel cell vehicles,”
Proceedings of the IEEE, vol. 95, pp. 806 –820, Apr. 2007.
[11] United States Environmental Protection Agency (EPA). Accessed in July 2012,
available at http://www.epa.gov/.
[12] A. Allegre, R. Trigui, and A. Bouscayrol, “Different energy management strategies
of hybrid energy storage system (HESS) using batteries and supercapacitors for
vehicular applications,” in IEEE Vehicle Power and Propulsion Conference, VPPC,
pp. 1 –6, Sept. 2010.
[13] Electric Vehicle Charging Infrastructure Deployment
Guidelines. Accessed in August 2012, available at
http://www.e3fleet.com/ Library/docs/EVcharging infrastructure guidelines.pdf.
[14] A. Khaligh and Z. Li, “Battery, ultracapacitor, fuel cell, and hybrid energy storage
systems for electric, hybrid electric, fuel cell, and plug-in hybrid electric vehicles:
State of the art,” IEEE Transactions on Vehicular Technology, vol. 59, pp. 2806
–2814, July 2010.
[15] D. Edwards and C. Kinney, “Advanced lead acid battery designs for hybrid elec-
tric vehicles,” in The Sixteenth Annual Battery Conference on Applications and
Advances, pp. 207 –212, 2001.
REFERENCES 25
[16] A. Cooper and P. Moseley, “Progress in the development of lead-acid batteries for
hybrid electric vehicles,” in IEEE Vehicle Power and Propulsion Conference, VPPC,
pp. 1 –6, Sept. 2006.
[17] M. Fetcenko, S. Ovshinsky, B. Reichman, K. Young, C. Fierro, J. Koch, A. Zallen,
W. Mays, and T. Ouchi, “Recent advances in nimh battery technology,” Journal of
Power Sources, vol. 165, no. 2, pp. 544 – 551, 2007.
[18] H. Li, C. Liao, and L. Wang, “Research on state-of-charge estimation of battery
pack used on hybrid electric vehicle,” in Asia-Pacific Power and Energy Engineering
Conference, APPEEC, pp. 1 –4, Mar. 2009.
[19] M. Wehrey, “What’s new with hybrid electric vehicles,” IEEE Power and Energy
Magazine, vol. 2, pp. 34 – 39, Nov.-Dec. 2004.
[20] H. Venkatasetty and Y. Jeong, “Recent advances in lithium-ion and lithium-polymer
batteries,” in The Seventeenth Annual Battery Conference on Applications and Ad-
vances, pp. 173 –178, 2002.
[21] “Learn about batteries.” Battery University. Accessed July 2012, available at
http://batteryuniversity.com/learn/article/types of lithium ion.
[22] S. G. Chalk and J. F. Miller, “Key challenges and recent progress in batteries, fuel
cells, and hydrogen storage for clean energy systems,” Journal of Power Sources,
vol. 159, no. 1, pp. 73 – 80, 2006.
[23] R. Balch, A. Burke, and A. Frank, “The affect of battery pack technology and size
choices on hybrid electric vehicle performance and fuel economy,” in The Sixteenth
Annual Battery Conference on Applications and Advances, pp. 31 –36, 2001.
[24] J. Viera, M. Gonzalez, J. Anton, J. Campo, F. Ferrero, and M. Valledor, “Nimh vs
REFERENCES 26
nicd batteries under high charging rates,” in 28th Annual International Telecommu-
nications Energy Conference, INTELEC, pp. 1 –6, Sept. 2006.
[25] Y. Gao and M. Ehsani, “Investigation of battery technologies for the army’s hybrid
vehicle application,” in Proceedings of IEEE 56th Vehicular Technology Conference,
VTC, vol. 3, pp. 1505 – 1509, 2002.
[26] M. Ehsani, Y. Gao, S. E. Gay, and A. Emadi, Modern Electric, Hybrid Electric, and
Fuel Cell Vehicles. CRC Press, 2004.
[27] S. Moura, J. Siegel, D. Siegel, H. Fathy, and A. Stefanopoulou, “Education on
vehicle electrification: Battery systems, fuel cells, and hydrogen,” in Vehicle Power
and Propulsion Conference (VPPC), 2010 IEEE, pp. 1 –6, Sept. 2010.
[28] S. Holm, H. Polinder, J. Ferreira, P. van Gelder, and R. Dill, “A com-
parison of energy storage technologies as energy buffer in renewable energy
sources with respect to power capability.” Accessed in July 2012, available at
ftp://134.58.56.168/electa/IEEE YRS-2002/papers/17.pdf.
[29] F. Garcia, A. Ferreira, and J. Pomilio, “Control strategy for battery-ultracapacitor
hybrid energy storage system,” in Twenty-Fourth Annual IEEE Applied Power Elec-
tronics Conference and Exposition, APEC, pp. 826 –832, Feb. 2009.
[30] K. Kang, Y. S. Meng, J. Brger, C. P. Grey, and G. Ceder, “Electrodes with high
power and high capacity for rechargeable lithium batteries,” Science, vol. 311,
pp. 977–980, Feb. 2006.
[31] M. Pedram and Q. Wu, “Battery-powered digital cmos design,” in Design, Automa-
tion and Test in Europe Conference and Exhibition 1999. Proceedings, pp. 72 –76.
[32] A. Jossen, “Fundamentals of battery dynamics,” Journal of Power Sources, vol. 154,
pp. 530–538, Mar. 2006.
REFERENCES 27
[33] S. S. Choi and H. S. Lim, “Factors that affect cycle-life and possible degradation
mechanisms of a li-ion cell based on licoo2,” Journal of Power Sources, vol. 111,
pp. 130–136, Sept. 2002.
[34] G. Ning, B. Haran, and B. N. Popov, “Capcity fade study of lithium-ion batteries
cycled at high discharge rates,” Journal of Power Sources, vol. 117, pp. 160–169,
May 2003.
[35] R. Sepe, A. Steyerl, and S. Bastien, “Lithium-ion supercapacitors for pulsed
power applications,” in IEEE Energy Conversion Congress and Exposition (ECCE),
pp. 1813 –1818, Sept. 2011.
[36] R. Pena-Alzola, R. Sebastian, J. Quesada, and A. Colmenar, “Review of flywheel
based energy storage systems,” in International Conference on Power Engineering,
Energy and Electrical Drives (POWERENG), pp. 1 –6, May 2011.
[37] O. Laldin, M. Moshirvaziri, and O. Trescases, “Optimal power flow for hybrid ultra-
capacitor systems in light electric vehicles,” in IEEE Energy Conversion Congress
and Exposition, ECCE, pp. 2916 –2922, Sept. 2011.
[38] “48 v ultracapacitor specifications.” Maxwell Technolo-
gies Inc. Datasheet. Accessed in July 2012, available at
http://www.maxwell.com/products/ultracapacitors/products/48v-modules.
[39] “U-charge xp lithium iron magnesium phosphate battery.” Va-
lence Technology, datasheet. Accessed in July 2012, available at
http://www.valence.com/products/data-sheets.
[40] H. A. Borhan and A. Vahidi, “Model predictive control of a power-split hybrid elec-
tric vehicle with combined battery and ultracapacitor energy storage,” in Proceedings
of American Control Conference, ACC, pp. 5031–5036, 2010.
REFERENCES 28
[41] J. Cao, B. Cao, Z. Bai, and W. Chen, “Energy-regenerative fuzzy sliding mode con-
troller design for ultracapacitor-battery hybrid power of electric vehicle,” in Proceed-
ings of IEEE International Conference on Mechatronics and Automation, ICMA,
pp. 1570–1575, 2007.
[42] K. Kawashima, T. Uchida, and Y. Hori, “Development of a novel ultracapacitor
electric vehicle and methods to cope with voltage variation,” in Proceedings of IEEE
Vehicle Power and Propulsion Conference, VPPC, pp. 724–729, 2009.
[43] X. Liu, Q. Zhang, and C. Zhu, “Development of a novel ultracapacitor electric vehicle
and methods to cope with voltage variation,” in Proceedings of IEEE Vehicle and
Propulsion Conference, VPPC, pp. 1395–1398, 2009.
[44] V. Shah, S. Karndhar, R. Maheshwari, P. Kundu, and H. Desai, “An energy man-
agement system for a battery ultracapacitor hybrid electric vehicle,” in Proceedings
of International Conference on Industrial and Information Systems, pp. 408–413,
2009.
[45] “K2 series ultracapacitor specifications.” Maxwell Technolo-
gies Inc. datasheet. Accessed in July 2012, available at
http://www.maxwell.com/products/ultracapacitors/docs/datasheet k2 series 1015370.pdf.
[46] “Nesscap EDLC products.” Nesscap Energy Inc. datasheet. Accessed in July 2012,
available at http://www.nesscap.com/product/edlc small.jsp.
[47] Y. Zhang and C.-Y. Wang, “Cycle-life characterization of automotive lithium-ion
batteries with linio2 cathode,” Journal of The Electrochemical Society, vol. 156 (7),
pp. 527–535, May 2009.
[48] “High energy lithium-ion cell.” Saft batteries,
datasheet. Accessed in July 2012, available at
REFERENCES 29
http://www.saftbatteries.com/doc/Documents/liion/Cube572/54041 VL45E cell 0305.61b6a847-
bc8b-4fef-8a73-f196416b1758.pdf.
[49] “lithium-ion batteries.” Panasonic batteries, datasheet. Accessed in July 2012, avail-
able at http://www.panasonic.com/industrial/includes/pdf/Panasonic LiIon CGA103450A.pdf.
[50] J. Miller, P. McCleer, and M. Everett, “Comparative assessment of ultra-capacitors
and advanced battery energy storage systems in powersplit electronic-cvt vehicle
powertrains,” in IEEE International Conference on Electric Machines and Drives,
pp. 1513 –1520, May 2005.
[51] J. Miller, “Energy storage technology markets and application: ultracapacitors in
combination with lithium-ion,” in The 7th Internatonal Conference on Power Elec-
tronics, ICPE,, pp. 16 –22, Oct. 2007.
[52] V. Bolborici, F. Dawson, and K. Lian, “Sizing considerations for ultracapacitors in
hybrid energy storage systems,” in IEEE Energy Conversion Congress and Exposi-
tion, ECCE, pp. 2900 –2907, Sept. 2011.
[53] D. Haifeng and C. Xueyu, “A study on lead acid battery and ultra-capacitor hybrid
energy storage system for hybrid city bus,” in International Conference on Opto-
electronics and Image Processing (ICOIP), vol. 1, pp. 154 –159, Nov. 2010.
[54] T. Kohler, D. Buecherl, and H. G. Herzog, “Investigation of control strategies for
hybrid energy storage systems in hybrid electric vehicles,” in IEEE Vehicle Power
and Propulsion Conference, VPPC, pp. 1687 –1693, Sept. 2009.
[55] D. Jianmin and X. Min, “Simulation research on hybrid energy storage system of
hybrid electric vehicle,” in IEEE International Conference on Automation and Lo-
gistics (ICAL), pp. 197 –201, Aug. 2010.
REFERENCES 30
[56] J. Awerbuch and C. Sullivan, “Control of ultracapacitor-battery hybrid power source
for vehicular applications,” in IEEE Energy 2030 Conference, pp. 1 –7, Nov. 2008.
[57] J. Awerbuch and C. Sullivan, “Filter-based power splitting in ultracapacitor-battery
hybrids for vehicular applications,” in IEEE 12th Workshop on Control and Modeling
for Power Electronics, COMPEL, pp. 1 –8, June 2010.
[58] J. Moreno, M. Ortuzar, and J. Dixon, “Energy-management system for a hybrid
electric vehicle, using ultracapacitors and neural networks,” IEEE Transactions on
Industrial Electronics, vol. 53, pp. 614 – 623, Apr. 2006.
[59] J. Cao and A. Emadi, “A new battery/ultra-capacitor hybrid energy storage sys-
tem for electric, hybrid and plug-in hybrid electric vehicles,” IEEE Transactions on
Power Electronics, vol. PP, p. 1, Jan 2012.
[60] L. Gao, R. Dougal, and S. Liu, “Power enhancement of an actively controlled
battery/ultracapacitor hybrid,” IEEE Transactions on Power Electronics, vol. 20,
pp. 236 – 243, Jan. 2005.
[61] C. Romaus, J. Bocker, K. Witting, A. Seifried, and O. Znamenshchykov, “Optimal
energy management for a hybrid energy storage system combining batteries and dou-
ble layer capacitors,” in IEEE Energy Conversion Congress and Exposition, ECCE,
pp. 1640 –1647, Sept. 2009.
[62] J. Wong, N. Idris, M. Anwari, and T. Taufik, “A parallel energy-sharing con-
trol for fuel cell-battery-ultracapacitor hybrid vehicle,” in IEEE Energy Conversion
Congress and Exposition, ECCE, pp. 2923 –2929, Sept. 2011.
Chapter 2
A DC-DC Converter Design for
LEV Based HESS
2.1 Introduction
The main focus of this chapter is efficiency optimization in high-frequency non-isolated
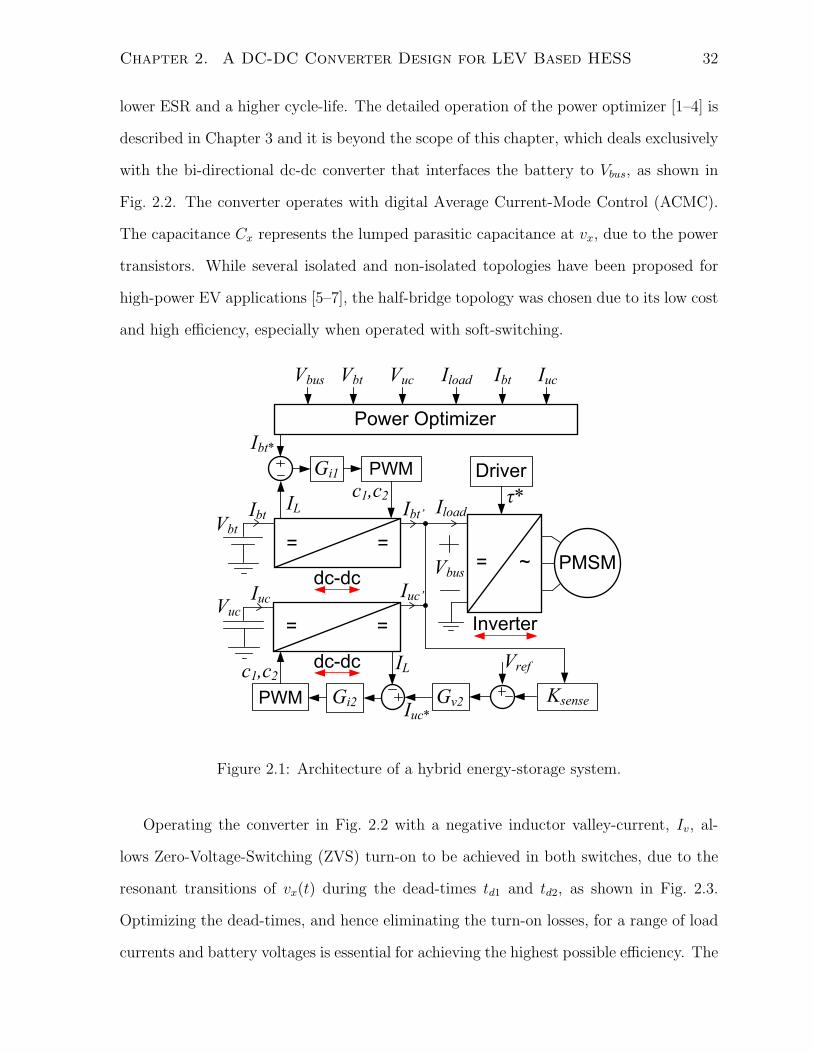
dc-dc converters. The target application is HESS for LEVs, as shown in Fig. 2.1. As
Li-Ion batteries become more affordable, there is a growing number of LEV applications,
including electric bicycles, scooters, motorcycles, small utility vehicles and personal mo-
bility devices. The HESS contains both a Li-Ion battery pack for high-energy density
and a u-cap module for high power-density [1]. The two energy sources are interfaced to
the bus voltage, Vbus, using two bi-directional, non-isolated dc-dc converters. A current-
command, Ibt∗, is periodically generated by the system power optimizer with an update
rate of 1-10 Hz in the targeted LEV application, based on the convergence time of the op-
timization algorithm presented in [2]. The current-command, Ibt∗, is calculated based on
the dynamic load requirements, and the battery/u-cap SOC. The u-cap converter directly
regulates Vbus using a standard voltage control loop. The system-level power optimizer
is used to off-load the large load-transients from the battery to the u-cap, which has a
31
Chapter 2. A DC-DC Converter Design for LEV Based HESS 32
lower ESR and a higher cycle-life. The detailed operation of the power optimizer [1–4] is
described in Chapter 3 and it is beyond the scope of this chapter, which deals exclusively
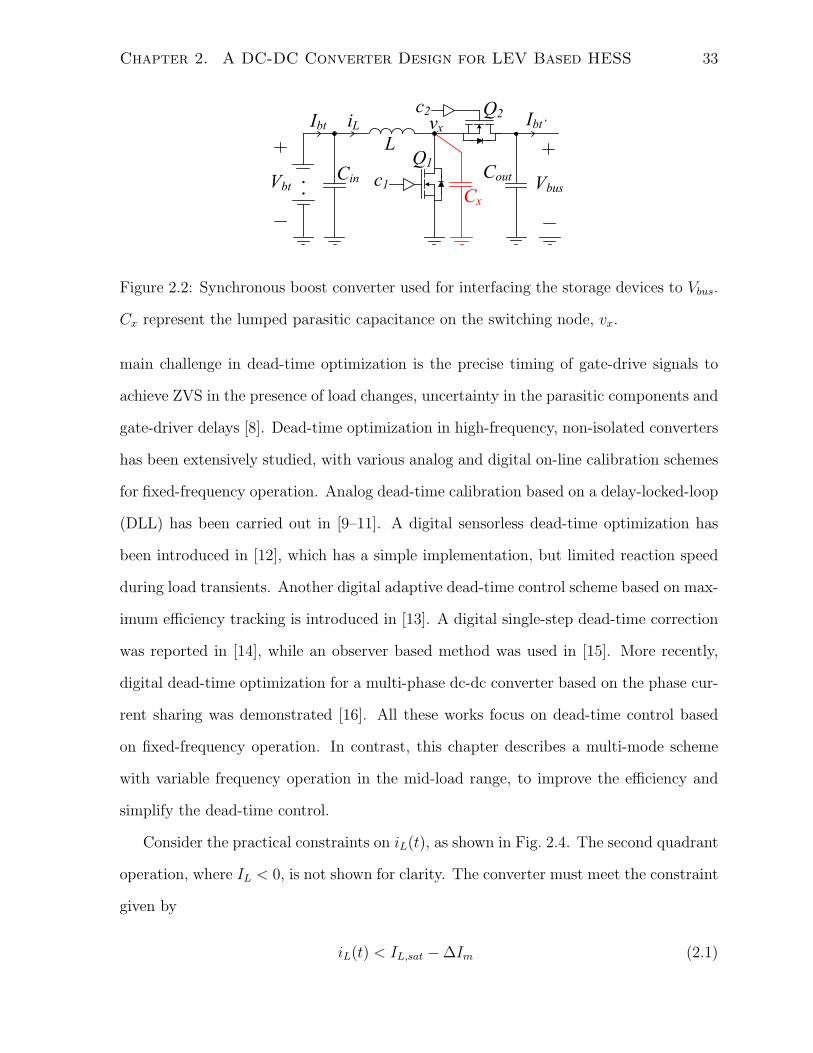
with the bi-directional dc-dc converter that interfaces the battery to Vbus, as shown in
Fig. 2.2. The converter operates with digital Average Current-Mode Control (ACMC).
The capacitance Cx represents the lumped parasitic capacitance at vx, due to the power
transistors. While several isolated and non-isolated topologies have been proposed for
high-power EV applications [5–7], the half-bridge topology was chosen due to its low cost
and high efficiency, especially when operated with soft-switching.
= =
Ibt Ibt’
Iuc Iuc’
Power Optimizer
Vbt Vuc Iload Ibt Iuc
Vbus
VbtIload
Ibt*
PWM Gi2 Gv2 Ksense
Vref
Iuc*
PWMGi1
ILc1,c2
ILc1,c2
= ~ PMSM
τ*
Driver
Vuc= =
Vbus
Inverter
dc-dc
dc-dc
Figure 2.1: Architecture of a hybrid energy-storage system.
Operating the converter in Fig. 2.2 with a negative inductor valley-current, Iv, al-
lows Zero-Voltage-Switching (ZVS) turn-on to be achieved in both switches, due to the
resonant transitions of vx(t) during the dead-times td1 and td2, as shown in Fig. 2.3.
Optimizing the dead-times, and hence eliminating the turn-on losses, for a range of load
currents and battery voltages is essential for achieving the highest possible efficiency. The
Chapter 2. A DC-DC Converter Design for LEV Based HESS 33
Ibt
Cout
Ibt’
L
CinVbt VbusCx
c1
c2iL vx
Q1
Q2
Figure 2.2: Synchronous boost converter used for interfacing the storage devices to Vbus.
Cx represent the lumped parasitic capacitance on the switching node, vx.
main challenge in dead-time optimization is the precise timing of gate-drive signals to
achieve ZVS in the presence of load changes, uncertainty in the parasitic components and
gate-driver delays [8]. Dead-time optimization in high-frequency, non-isolated converters
has been extensively studied, with various analog and digital on-line calibration schemes
for fixed-frequency operation. Analog dead-time calibration based on a delay-locked-loop
(DLL) has been carried out in [9–11]. A digital sensorless dead-time optimization has
been introduced in [12], which has a simple implementation, but limited reaction speed
during load transients. Another digital adaptive dead-time control scheme based on max-
imum efficiency tracking is introduced in [13]. A digital single-step dead-time correction
was reported in [14], while an observer based method was used in [15]. More recently,
digital dead-time optimization for a multi-phase dc-dc converter based on the phase cur-
rent sharing was demonstrated [16]. All these works focus on dead-time control based
on fixed-frequency operation. In contrast, this chapter describes a multi-mode scheme
with variable frequency operation in the mid-load range, to improve the efficiency and
simplify the dead-time control.
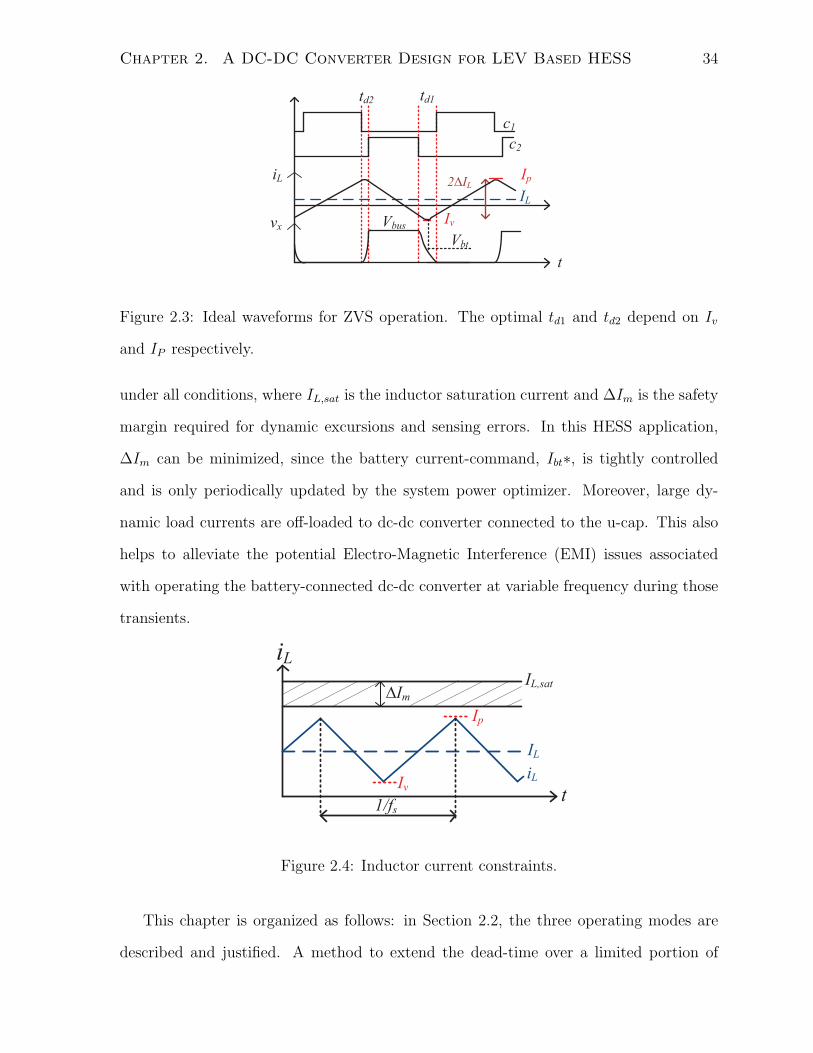
Consider the practical constraints on iL(t), as shown in Fig. 2.4. The second quadrant
operation, where IL < 0, is not shown for clarity. The converter must meet the constraint
given by
iL(t) < IL,sat −∆Im (2.1)
Chapter 2. A DC-DC Converter Design for LEV Based HESS 34
td2 td1
Ip
Iv
2∆IL
c1
c2
iL
t
IL
VbusVbt
vx
Figure 2.3: Ideal waveforms for ZVS operation. The optimal td1 and td2 depend on Iv
and IP respectively.
under all conditions, where IL,sat is the inductor saturation current and ∆Im is the safety
margin required for dynamic excursions and sensing errors. In this HESS application,
∆Im can be minimized, since the battery current-command, Ibt∗, is tightly controlled
and is only periodically updated by the system power optimizer. Moreover, large dy-
namic load currents are off-loaded to dc-dc converter connected to the u-cap. This also
helps to alleviate the potential Electro-Magnetic Interference (EMI) issues associated
with operating the battery-connected dc-dc converter at variable frequency during those
transients.
iLIL,sat
iL
IL
1/fs
∆Im
t
Ip
Iv
Figure 2.4: Inductor current constraints.
This chapter is organized as follows: in Section 2.2, the three operating modes are
described and justified. A method to extend the dead-time over a limited portion of

Chapter 2. A DC-DC Converter Design for LEV Based HESS 35
the load curve is discussed in Section 2.3. Finally, the experimental results for a 2 kW
prototype converter are reported in Section 2.4.
2.2 Mode Description and Control Strategy
Operating with Iv < 0 is required to achieve ZVS turn-on in both switches, which is
referred to as dual-ZVS. Achieving dual-ZVS turn-on is unpractical at the full-load con-
dition due to the large peak current, Ip, which requires an inductor with a very high
saturation current, leading to prohibitive cost. Operating with a large inductor current
ripple, ∆IL, in the full-load condition increases the conduction losses, Pcond, given by
Pcond =
(I2L +
∆I2L3
)(RL +Ron) + I2LRbt +
∆I2L3
RCin
+
(((IL − ILoad)
2 +∆I2L3
)D′ +DI2Load
)RCout ,
(2.2)
assuming RCin<< Rbt, where D is the steady-state duty-cycle of Q1, D′ = 1 − D
and Rbt, RL, RCin, RCout are the ESRs of the battery, inductor, input capacitor and
output capacitor, respectively. IL and ILoad are the average inductor and load current,
respectively, while ∆IL = IL− Iv. Assuming a switching-frequency of fs and td1,2 << Ts,
the converter can operate in dual-ZVS mode for IL given by (2.3), where Iv is given by
(2.4).
IL < Icrit =IL,sat −∆Im + Iv
2(2.3)
Iv ≈ −CxVbus
td1(2.4)
In this chapter, a tri-mode control scheme with variable switching frequency in the
mid-load range is proposed for achieving a high efficiency over the full load range, while
meeting the constraints of Fig. 2.4 and limiting the peak-to-peak inductor current. The
ideal inductor current waveform is shown in Fig. 2.5 for a steadily decreasing power, in
order to illustrate the three operating modes. The converter automatically transitions
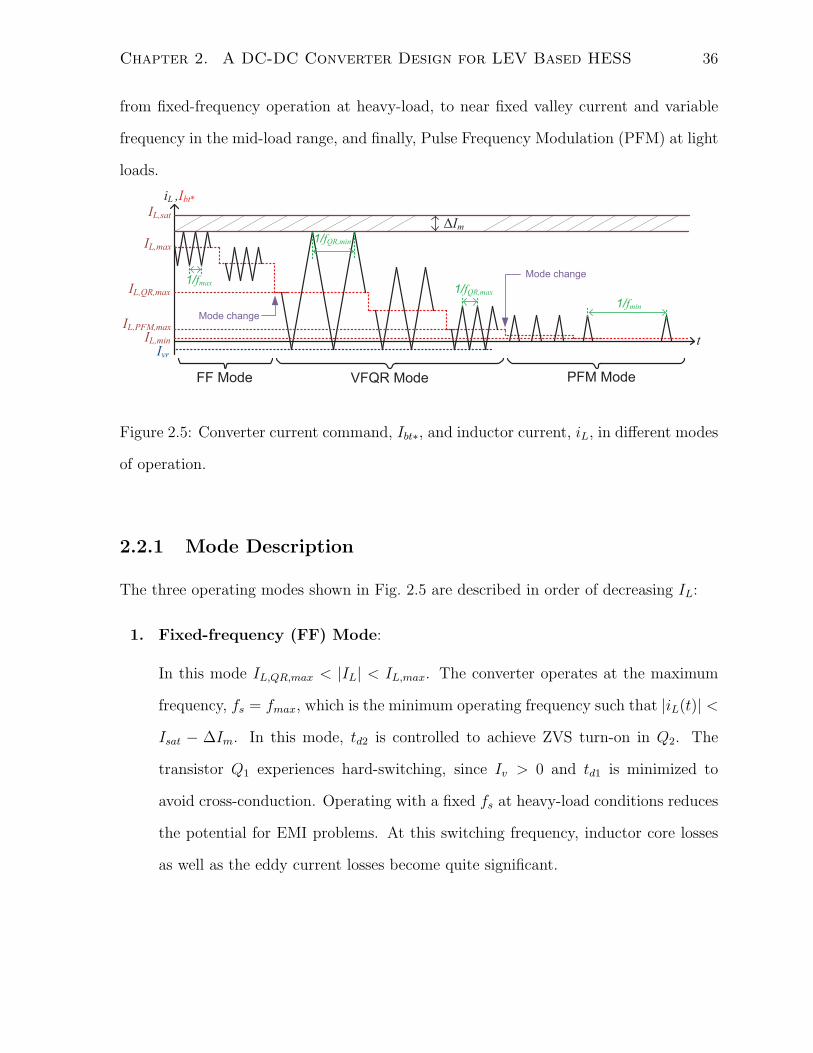
Chapter 2. A DC-DC Converter Design for LEV Based HESS 36
from fixed-frequency operation at heavy-load, to near fixed valley current and variable
frequency in the mid-load range, and finally, Pulse Frequency Modulation (PFM) at light
loads.
t
iL ,Ibt*
IL,QR,max
IL,satΔIm
IL,PFM,max
IL,max
IL,min
1/fmax
1/fQR,min
1/fmin
FF Mode VFQR Mode PFM Mode
Ivr
1/fQR,max
Mode change
Mode change
Figure 2.5: Converter current command, Ibt∗, and inductor current, iL, in different modes
of operation.
2.2.1 Mode Description
The three operating modes shown in Fig. 2.5 are described in order of decreasing IL:
1. Fixed-frequency (FF) Mode:
In this mode IL,QR,max < |IL| < IL,max. The converter operates at the maximum
frequency, fs = fmax, which is the minimum operating frequency such that |iL(t)| <
Isat − ∆Im. In this mode, td2 is controlled to achieve ZVS turn-on in Q2. The
transistor Q1 experiences hard-switching, since Iv > 0 and td1 is minimized to
avoid cross-conduction. Operating with a fixed fs at heavy-load conditions reduces
the potential for EMI problems. At this switching frequency, inductor core losses
as well as the eddy current losses become quite significant.
Chapter 2. A DC-DC Converter Design for LEV Based HESS 37
2. Variable Frequency Quasi-Resonant (VFQR) Mode:
In this mode IPFM,max < |IL| < IQR,max. At IQR,max, the frequency is reduced from
fmax to fQR,min such that Ip = Isat−∆Im and the valley current, Iv = Ivr, provides
sufficient charge to discharge vx from Vbus to 0, in order to achieve ZVS turn-on
in Q1. The waveform of iL(t) at the edge of VFQR mode is shown in Fig. 2.5. In
VFQR mode, fs is controlled such that a fixed dead-time td1 and a near-constant Ivr
are maintained as the battery current changes. The dead-time td2 is also adjusted
such that dual-ZVS turn-on is achieved. Increasing fs while reducing IL in this
mode is non-conventional, however in the absence of turn-on losses, it helps to
maintain a near constant Iv. This approach has several important advantages: 1)
at light-loads, for the same IL, higher fs reduces the valley current and therefore
prevents large negative currents into Cin, 2) it reduces ∆IL and Pcond at light-loads
and 3) the constant dead-time is much easier to control in order to guarantee ZVS
over a wide current range. In this mode, since IL(Rbt+RL+Ron) << Vbt, fs ∝ 1/IL
as given by (2.5), where D is given by (2.6) based on a time averaged model [17].
fs ≈ VbtD
2L(IL − Iv)(2.5)
D = 1− Vbt − IL(Rbt +RL +Ron)
Vbus
. (2.6)
Three operating conditions in this mode are shown in Fig. 2.5.
3. Pulse-Frequency Modulation (PFM) Mode:
In this mode IL,min < |IL| < IPFM,max. The converter operates in a fixed on-time
PFM mode, as in [18–20]. Constant on-time is applied to Q1 while Q2 is controlled
to avoid body-diode conduction as iL(t) decays to 0 as shown in Fig. 2.5. Operating
in PFM results in higher efficiency below IPFM,max, where the gate-drive losses, Pdr,
and controller losses, Pcont, become significant. It can be shown that fs ∝ IL in
Chapter 2. A DC-DC Converter Design for LEV Based HESS 38
PFM mode [19, 20]. The low-efficiency region |IL| < IL,min can be easily avoided
by the system power optimizer, due to the presence of two energy sources. The
limit IL,min is selected such that fmin > 20 kHz lies outside of the audible band.
Further efficiency improvements can be achieved using adaptive on-time PFM or
burst-mode [21].
The above mode descriptions apply only to the first quadrant, where IL > 0. In
the second quadrant, the control strategy is identical, while Q1, Q2, td1 and td2 have
opposite roles, as demonstrated in Section 2.4. In the second quadrant, the following
changes apply: 1) In FF mode, td1 is controlled to achieve ZVS turn-on in Q1, while
Q2 experiences hard-switching. 2) In VFQR mode, td2 is constant, while td1 and fs are
adjusted to achieve dual-ZVS turn-on, resulting in a near-constant Ip. 3) In PFM mode,
the fixed on-time is applied to Q2 and diode emulation is achieved using Q1. A summery
of chosen switching frequency and dead-time control strategy of the tri-mode converter
are illustrated in Fig. 2.6.
2.2.2 VFQR versus FFQR: Loss Comparison
The main purpose of this section is to specifically contrast VFQR mode with the more
conventional Fixed-Frequency Quasi-Resonant mode (FFQR) in the medium-load range.
While the discussion is limited to operation in the first quadrant for the sake of brevity,
the arguments can easily be extended to both quadrants.
Assume that the converter covers a current range, IL,QR,1 ≤ IL ≤ IL,QR,2, in the QR
mode. For a fair comparison, it is assumed that both schemes have same valley current,
Iv,QR,2, at the the edge of QR mode:
Iv,FFQR,2 = Iv,V FQR,2 = Iv,QR,2. (2.7)
In FFQR mode, fs is fixed and chosen such that QR operation is guaranteed over the
stated current range, with a negative valley current, Iv. fs is therefore chosen based on
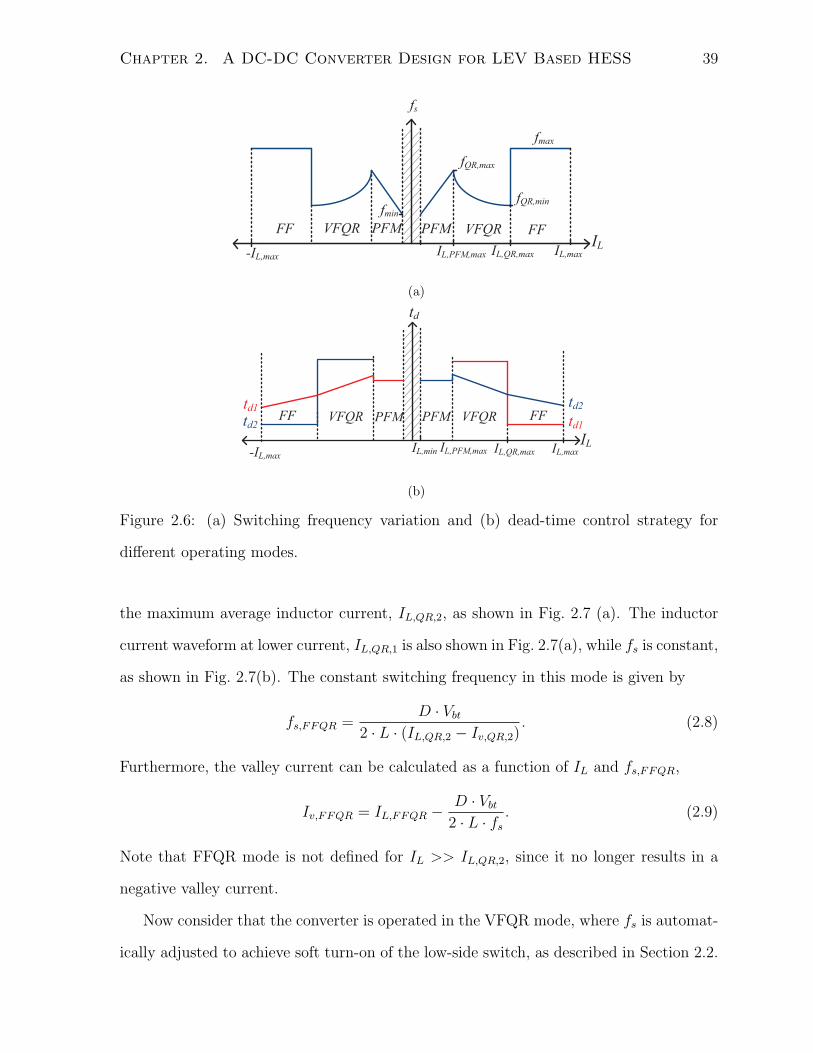
Chapter 2. A DC-DC Converter Design for LEV Based HESS 39
IL,QR,max IL,maxIL,PFM,max
fmax
fs
fQR,min
fQR,max
VFQR FFPFMPFMVFQRFF
fmin
IL-IL,max
(a)
PFM PFM VFQRVFQR FFFFtd2td1
td1td2
IL
td
IL,QR,maxIL,min IL,PFM,max-IL,max IL,max
(b)
Figure 2.6: (a) Switching frequency variation and (b) dead-time control strategy for
different operating modes.
the maximum average inductor current, IL,QR,2, as shown in Fig. 2.7 (a). The inductor
current waveform at lower current, IL,QR,1 is also shown in Fig. 2.7(a), while fs is constant,
as shown in Fig. 2.7(b). The constant switching frequency in this mode is given by
fs,FFQR =D · Vbt
2 · L · (IL,QR,2 − Iv,QR,2). (2.8)
Furthermore, the valley current can be calculated as a function of IL and fs,FFQR,
Iv,FFQR = IL,FFQR − D · Vbt
2 · L · fs. (2.9)
Note that FFQR mode is not defined for IL >> IL,QR,2, since it no longer results in a
negative valley current.
Now consider that the converter is operated in the VFQR mode, where fs is automat-
ically adjusted to achieve soft turn-on of the low-side switch, as described in Section 2.2.
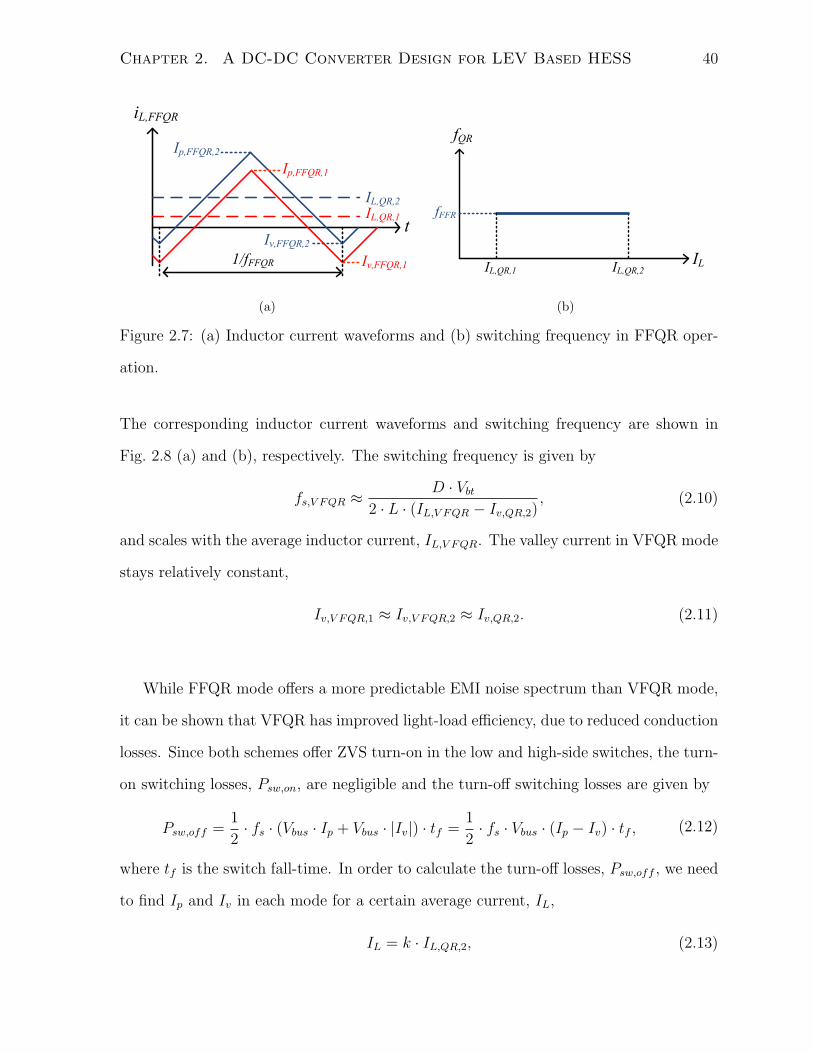
Chapter 2. A DC-DC Converter Design for LEV Based HESS 40
iL,FFQR
IL,QR,2IL,QR,1
1/fFFQR
tIv,FFQR,2
Iv,FFQR,1
Ip,FFQR,2
Ip,FFQR,1
(a)
fQR
fFFR
IL,QR,1ILIL,QR,2
(b)
Figure 2.7: (a) Inductor current waveforms and (b) switching frequency in FFQR oper-
ation.
The corresponding inductor current waveforms and switching frequency are shown in
Fig. 2.8 (a) and (b), respectively. The switching frequency is given by
fs,V FQR ≈ D · Vbt
2 · L · (IL,V FQR − Iv,QR,2), (2.10)
and scales with the average inductor current, IL,V FQR. The valley current in VFQR mode
stays relatively constant,
Iv,V FQR,1 ≈ Iv,V FQR,2 ≈ Iv,QR,2. (2.11)
While FFQR mode offers a more predictable EMI noise spectrum than VFQR mode,
it can be shown that VFQR has improved light-load efficiency, due to reduced conduction
losses. Since both schemes offer ZVS turn-on in the low and high-side switches, the turn-
on switching losses, Psw,on, are negligible and the turn-off switching losses are given by
Psw,off =1
2· fs · (Vbus · Ip + Vbus · |Iv|) · tf =
1
2· fs · Vbus · (Ip − Iv) · tf , (2.12)
where tf is the switch fall-time. In order to calculate the turn-off losses, Psw,off , we need
to find Ip and Iv in each mode for a certain average current, IL,
IL = k · IL,QR,2, (2.13)
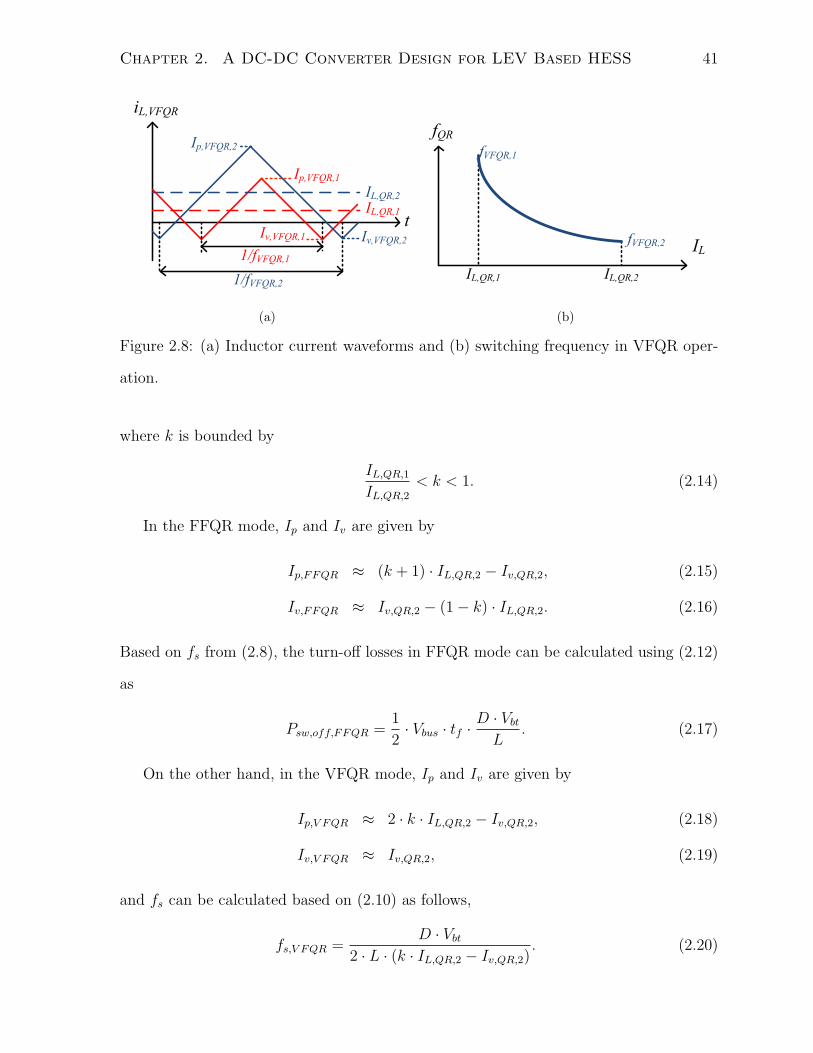
Chapter 2. A DC-DC Converter Design for LEV Based HESS 41
iL,VFQR
IL,QR,2IL,QR,1
1/fVFQR,2
t
1/fVFQR,1
Ip,VFQR,2
Ip,VFQR,1
Iv,VFQR,2Iv,VFQR,1
(a)
fQRfVFQR,1
IL,QR,1
IL
IL,QR,2
fVFQR,2
(b)
Figure 2.8: (a) Inductor current waveforms and (b) switching frequency in VFQR oper-
ation.
where k is bounded by
IL,QR,1
IL,QR,2
< k < 1. (2.14)
In the FFQR mode, Ip and Iv are given by
Ip,FFQR ≈ (k + 1) · IL,QR,2 − Iv,QR,2, (2.15)
Iv,FFQR ≈ Iv,QR,2 − (1− k) · IL,QR,2. (2.16)
Based on fs from (2.8), the turn-off losses in FFQR mode can be calculated using (2.12)
as
Psw,off,FFQR =1
2· Vbus · tf ·
D · Vbt
L. (2.17)
On the other hand, in the VFQR mode, Ip and Iv are given by
Ip,V FQR ≈ 2 · k · IL,QR,2 − Iv,QR,2, (2.18)
Iv,V FQR ≈ Iv,QR,2, (2.19)
and fs can be calculated based on (2.10) as follows,
fs,V FQR =D · Vbt
2 · L · (k · IL,QR,2 − Iv,QR,2). (2.20)
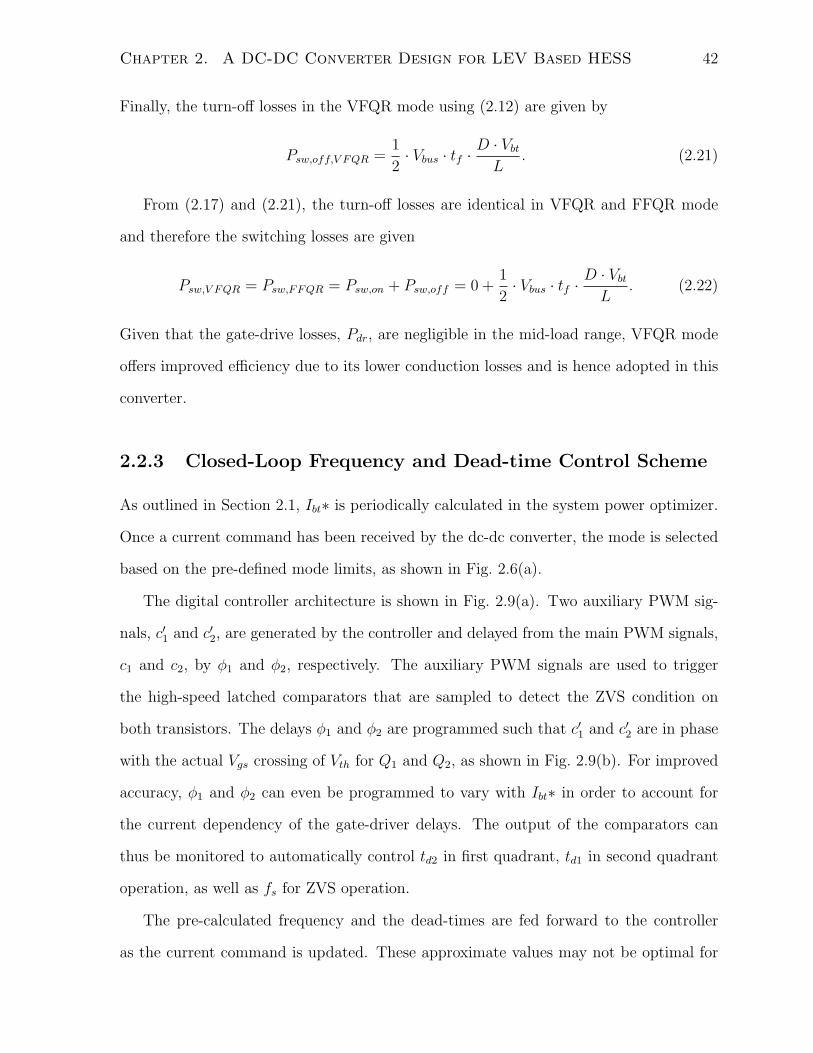
Chapter 2. A DC-DC Converter Design for LEV Based HESS 42
Finally, the turn-off losses in the VFQR mode using (2.12) are given by
Psw,off,V FQR =1
2· Vbus · tf ·
D · Vbt
L. (2.21)
From (2.17) and (2.21), the turn-off losses are identical in VFQR and FFQR mode
and therefore the switching losses are given
Psw,V FQR = Psw,FFQR = Psw,on + Psw,off = 0 +1
2· Vbus · tf ·
D · Vbt
L. (2.22)
Given that the gate-drive losses, Pdr, are negligible in the mid-load range, VFQR mode
offers improved efficiency due to its lower conduction losses and is hence adopted in this
converter.
2.2.3 Closed-Loop Frequency and Dead-time Control Scheme
As outlined in Section 2.1, Ibt∗ is periodically calculated in the system power optimizer.
Once a current command has been received by the dc-dc converter, the mode is selected
based on the pre-defined mode limits, as shown in Fig. 2.6(a).
The digital controller architecture is shown in Fig. 2.9(a). Two auxiliary PWM sig-
nals, c′1 and c′2, are generated by the controller and delayed from the main PWM signals,
c1 and c2, by ϕ1 and ϕ2, respectively. The auxiliary PWM signals are used to trigger
the high-speed latched comparators that are sampled to detect the ZVS condition on
both transistors. The delays ϕ1 and ϕ2 are programmed such that c′1 and c′2 are in phase
with the actual Vgs crossing of Vth for Q1 and Q2, as shown in Fig. 2.9(b). For improved
accuracy, ϕ1 and ϕ2 can even be programmed to vary with Ibt∗ in order to account for
the current dependency of the gate-driver delays. The output of the comparators can
thus be monitored to automatically control td2 in first quadrant, td1 in second quadrant
operation, as well as fs for ZVS operation.
The pre-calculated frequency and the dead-times are fed forward to the controller
as the current command is updated. These approximate values may not be optimal for
Chapter 2. A DC-DC Converter Design for LEV Based HESS 43
achieving dual ZVS turn-on due to the parameter variations and uncertainties associ-
ated with mass-production. Automatic adjustment is therefore necessary to achieve the
optimal efficiency under a wide range of conditions. In order to avoid the dead-time
and frequency adjustments interfering with the current-loop, the fine-tuning of the dead-
time and switching frequency is initiated when the current-loop has reached steady-state,
based on the internal digital error signal in the current-loop, e[n]. Automatic calibration
of the dead-time and switching frequency is done using a binary search algorithm around
the calculated feed-forward values, based on the comparators outputs.
Vbus
DPWM
Module
GiIbt* d(t)
Trig etd1
c1'
Trigetd2
c2'
DT & Freq.
Controller
td1td2fs
vx
Ibt*
Φ1,Φ2
c2c1
c1'c2'
Ibt
Cout
Ibt’L
CinVbt VbusCx
c1
c2iL vx
Q1
Q2IL
(a)
c2c1
c2'c1'
Vgs,Q2Vgs,Q1
Φ1
td2 td1
TS
Vth
t
t
t
Φ2
(b)
Figure 2.9: (a) Simplified architecture of the VFQR controller. (b) Signal timing in
VFQR mode.
2.3 Dead-Time Extension Using Controllable Reso-
nant Capacitance
In this section we address one of the common complaints about QR converters, namely
the challenge of achieving precise dead-time control in the presence of production spreads
in all the components, comparator delays and other non-idealities. In particular, td2 in
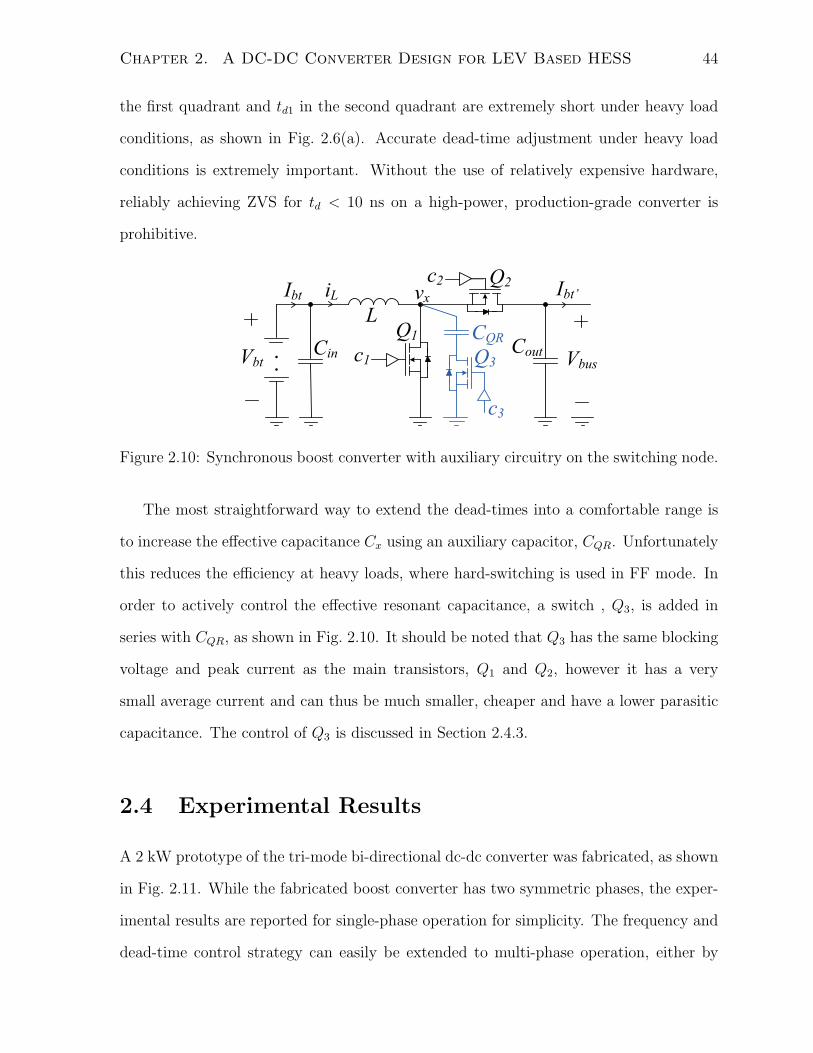
Chapter 2. A DC-DC Converter Design for LEV Based HESS 44
the first quadrant and td1 in the second quadrant are extremely short under heavy load
conditions, as shown in Fig. 2.6(a). Accurate dead-time adjustment under heavy load
conditions is extremely important. Without the use of relatively expensive hardware,
reliably achieving ZVS for td < 10 ns on a high-power, production-grade converter is
prohibitive.
IbtL
CinVbt c1
iL vx
Q1Cout
Ibt’
Vbus
c2 Q2
CQRQ3
c3
Figure 2.10: Synchronous boost converter with auxiliary circuitry on the switching node.
The most straightforward way to extend the dead-times into a comfortable range is
to increase the effective capacitance Cx using an auxiliary capacitor, CQR. Unfortunately
this reduces the efficiency at heavy loads, where hard-switching is used in FF mode. In
order to actively control the effective resonant capacitance, a switch , Q3, is added in
series with CQR, as shown in Fig. 2.10. It should be noted that Q3 has the same blocking
voltage and peak current as the main transistors, Q1 and Q2, however it has a very
small average current and can thus be much smaller, cheaper and have a lower parasitic
capacitance. The control of Q3 is discussed in Section 2.4.3.
2.4 Experimental Results
A 2 kW prototype of the tri-mode bi-directional dc-dc converter was fabricated, as shown
in Fig. 2.11. While the fabricated boost converter has two symmetric phases, the exper-
imental results are reported for single-phase operation for simplicity. The frequency and
dead-time control strategy can easily be extended to multi-phase operation, either by
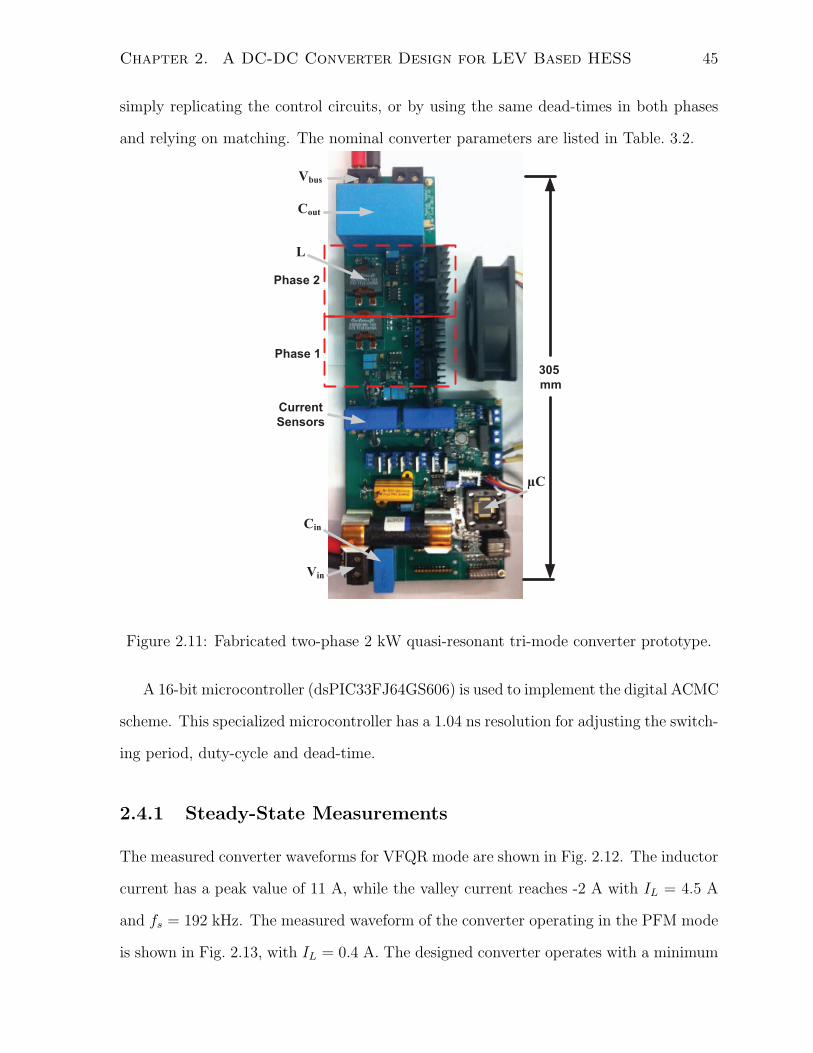
Chapter 2. A DC-DC Converter Design for LEV Based HESS 45
simply replicating the control circuits, or by using the same dead-times in both phases
and relying on matching. The nominal converter parameters are listed in Table. 3.2.
305
mm
Current
Sensors
µC
Cout
Vbus
L
Phase 2
Phase 1
Cin
Vin
Figure 2.11: Fabricated two-phase 2 kW quasi-resonant tri-mode converter prototype.
A 16-bit microcontroller (dsPIC33FJ64GS606) is used to implement the digital ACMC
scheme. This specialized microcontroller has a 1.04 ns resolution for adjusting the switch-
ing period, duty-cycle and dead-time.
2.4.1 Steady-State Measurements
The measured converter waveforms for VFQR mode are shown in Fig. 2.12. The inductor
current has a peak value of 11 A, while the valley current reaches -2 A with IL = 4.5 A
and fs = 192 kHz. The measured waveform of the converter operating in the PFM mode
is shown in Fig. 2.13, with IL = 0.4 A. The designed converter operates with a minimum
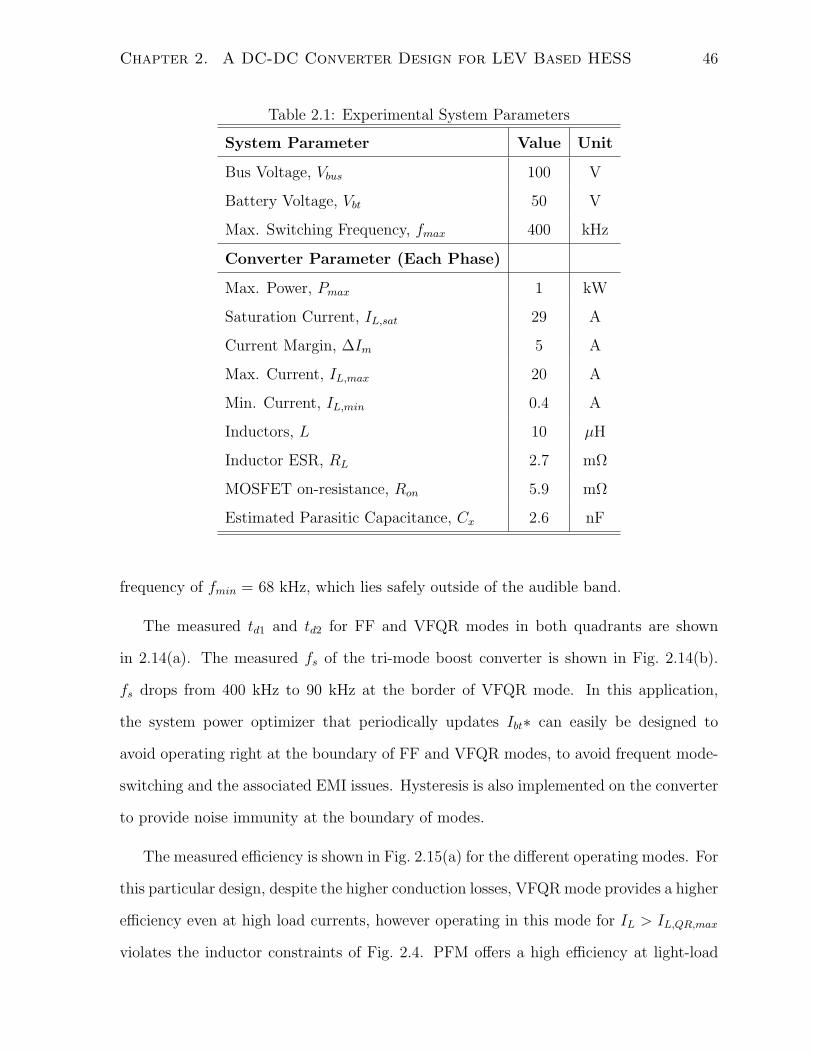
Chapter 2. A DC-DC Converter Design for LEV Based HESS 46
Table 2.1: Experimental System Parameters
System Parameter Value Unit
Bus Voltage, Vbus 100 V
Battery Voltage, Vbt 50 V
Max. Switching Frequency, fmax 400 kHz
Converter Parameter (Each Phase)
Max. Power, Pmax 1 kW
Saturation Current, IL,sat 29 A
Current Margin, ∆Im 5 A
Max. Current, IL,max 20 A
Min. Current, IL,min 0.4 A
Inductors, L 10 µH
Inductor ESR, RL 2.7 mΩ
MOSFET on-resistance, Ron 5.9 mΩ
Estimated Parasitic Capacitance, Cx 2.6 nF
frequency of fmin = 68 kHz, which lies safely outside of the audible band.
The measured td1 and td2 for FF and VFQR modes in both quadrants are shown
in 2.14(a). The measured fs of the tri-mode boost converter is shown in Fig. 2.14(b).
fs drops from 400 kHz to 90 kHz at the border of VFQR mode. In this application,
the system power optimizer that periodically updates Ibt∗ can easily be designed to
avoid operating right at the boundary of FF and VFQR modes, to avoid frequent mode-
switching and the associated EMI issues. Hysteresis is also implemented on the converter
to provide noise immunity at the boundary of modes.
The measured efficiency is shown in Fig. 2.15(a) for the different operating modes. For
this particular design, despite the higher conduction losses, VFQRmode provides a higher
efficiency even at high load currents, however operating in this mode for IL > IL,QR,max
violates the inductor constraints of Fig. 2.4. PFM offers a high efficiency at light-load
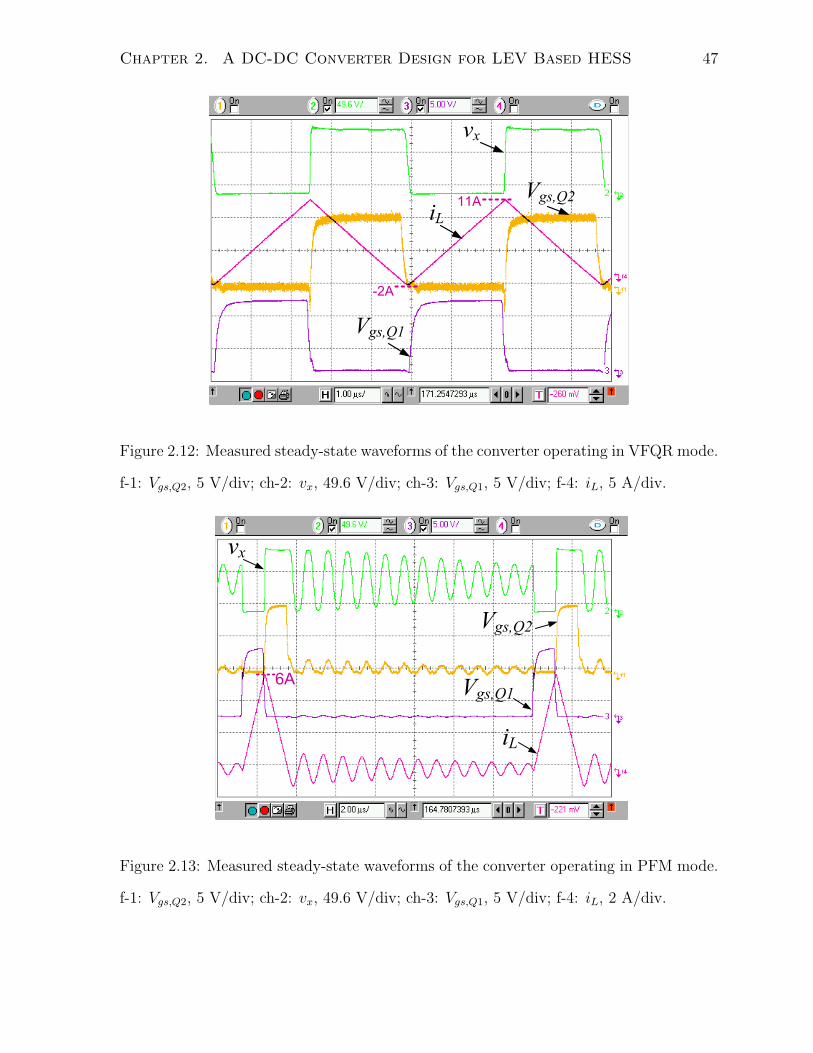
Chapter 2. A DC-DC Converter Design for LEV Based HESS 47
vx
iLVgs,Q2
Vgs,Q1
-2A
11A
Figure 2.12: Measured steady-state waveforms of the converter operating in VFQR mode.
f-1: Vgs,Q2, 5 V/div; ch-2: vx, 49.6 V/div; ch-3: Vgs,Q1, 5 V/div; f-4: iL, 5 A/div.
vx
iL
Vgs,Q2
Vgs,Q16A
Figure 2.13: Measured steady-state waveforms of the converter operating in PFM mode.
f-1: Vgs,Q2, 5 V/div; ch-2: vx, 49.6 V/div; ch-3: Vgs,Q1, 5 V/div; f-4: iL, 2 A/div.
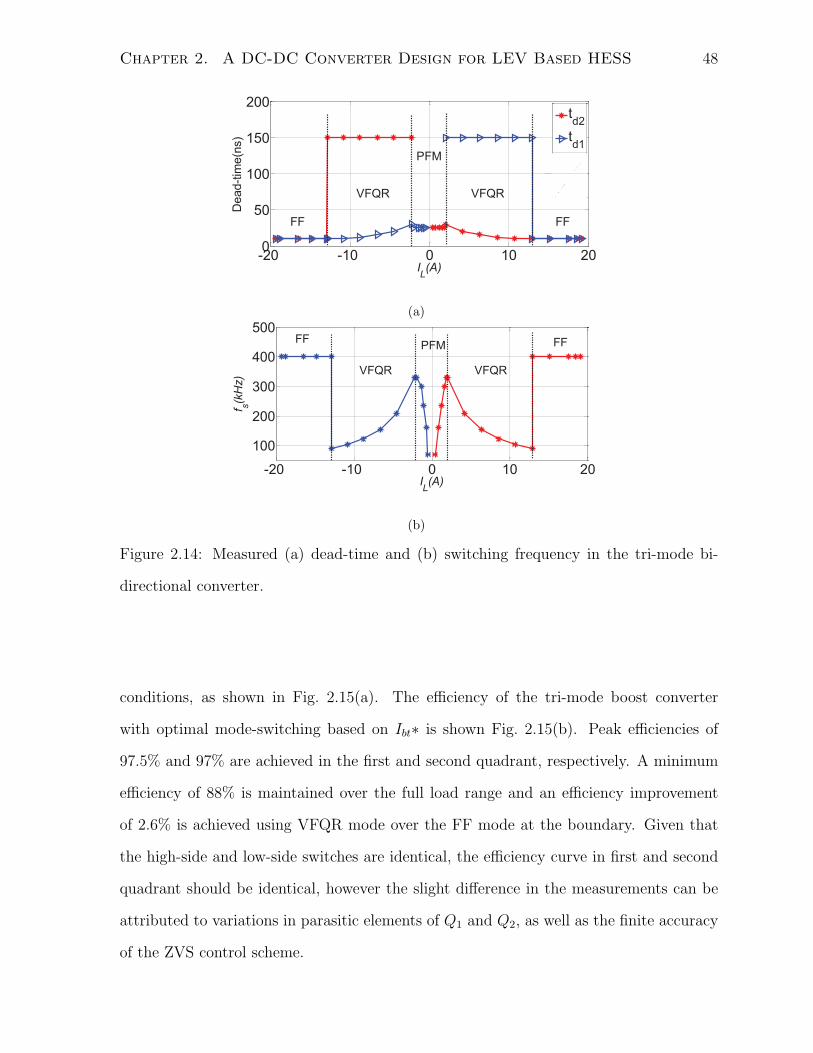
Chapter 2. A DC-DC Converter Design for LEV Based HESS 48
-20 -10 0 10 200
50
100
150
200
IL(A)
Dead-time(ns)
td2
td1
td2
td1FF
FF FF
VFQRVFQR
PFM
(a)
-20 -10 0 10 20
100
200
300
400
500
IL(A)
f s(kHz)
FFFFPFM
VFQR VFQR
(b)
Figure 2.14: Measured (a) dead-time and (b) switching frequency in the tri-mode bi-
directional converter.
conditions, as shown in Fig. 2.15(a). The efficiency of the tri-mode boost converter
with optimal mode-switching based on Ibt∗ is shown Fig. 2.15(b). Peak efficiencies of
97.5% and 97% are achieved in the first and second quadrant, respectively. A minimum
efficiency of 88% is maintained over the full load range and an efficiency improvement
of 2.6% is achieved using VFQR mode over the FF mode at the boundary. Given that
the high-side and low-side switches are identical, the efficiency curve in first and second
quadrant should be identical, however the slight difference in the measurements can be
attributed to variations in parasitic elements of Q1 and Q2, as well as the finite accuracy
of the ZVS control scheme.
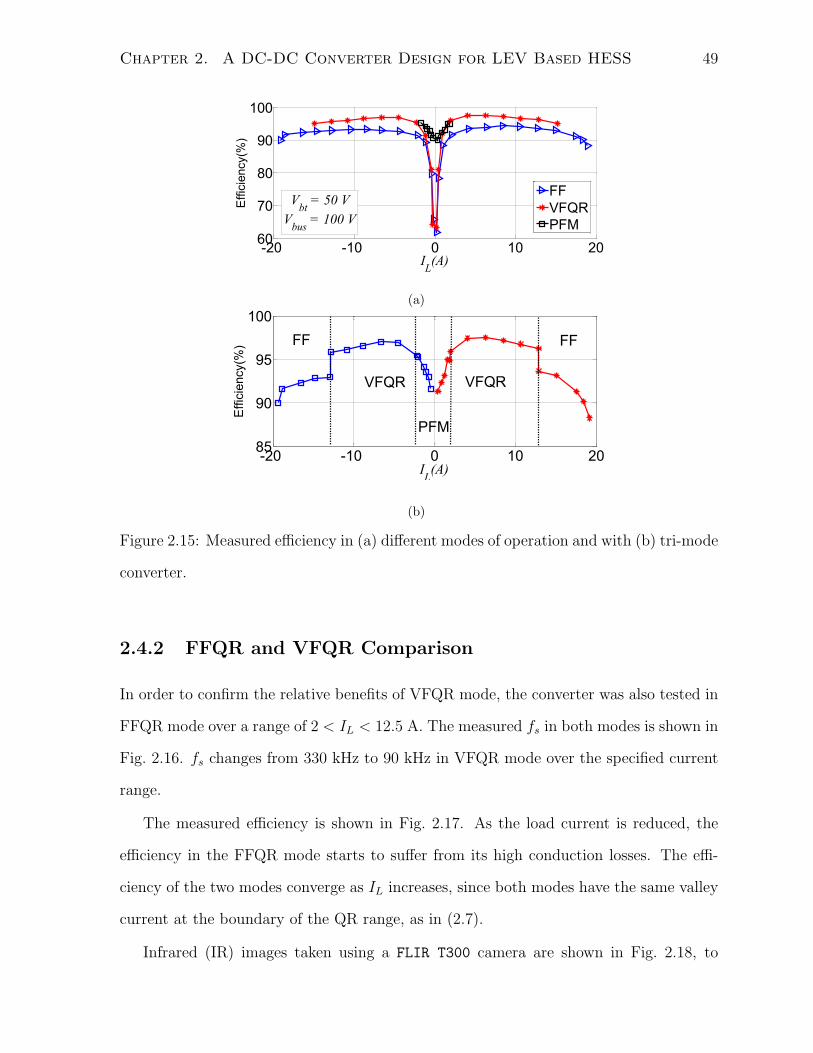
Chapter 2. A DC-DC Converter Design for LEV Based HESS 49
-20 -10 0 10 2060
70
80
90
100
IL(A)
Effic
iency(%
)
FF
VFQR
PFM
Vbt
= 50 V
Vbus
= 100 V
(a)
-20 -10 0 10 2085
90
95
100
IL(A)
Efficiency(%)
PFM
VFQR VFQR
FFFF
(b)
Figure 2.15: Measured efficiency in (a) different modes of operation and with (b) tri-mode
converter.
2.4.2 FFQR and VFQR Comparison
In order to confirm the relative benefits of VFQR mode, the converter was also tested in
FFQR mode over a range of 2 < IL < 12.5 A. The measured fs in both modes is shown in
Fig. 2.16. fs changes from 330 kHz to 90 kHz in VFQR mode over the specified current
range.
The measured efficiency is shown in Fig. 2.17. As the load current is reduced, the
efficiency in the FFQR mode starts to suffer from its high conduction losses. The effi-
ciency of the two modes converge as IL increases, since both modes have the same valley
current at the boundary of the QR range, as in (2.7).
Infrared (IR) images taken using a FLIR T300 camera are shown in Fig. 2.18, to
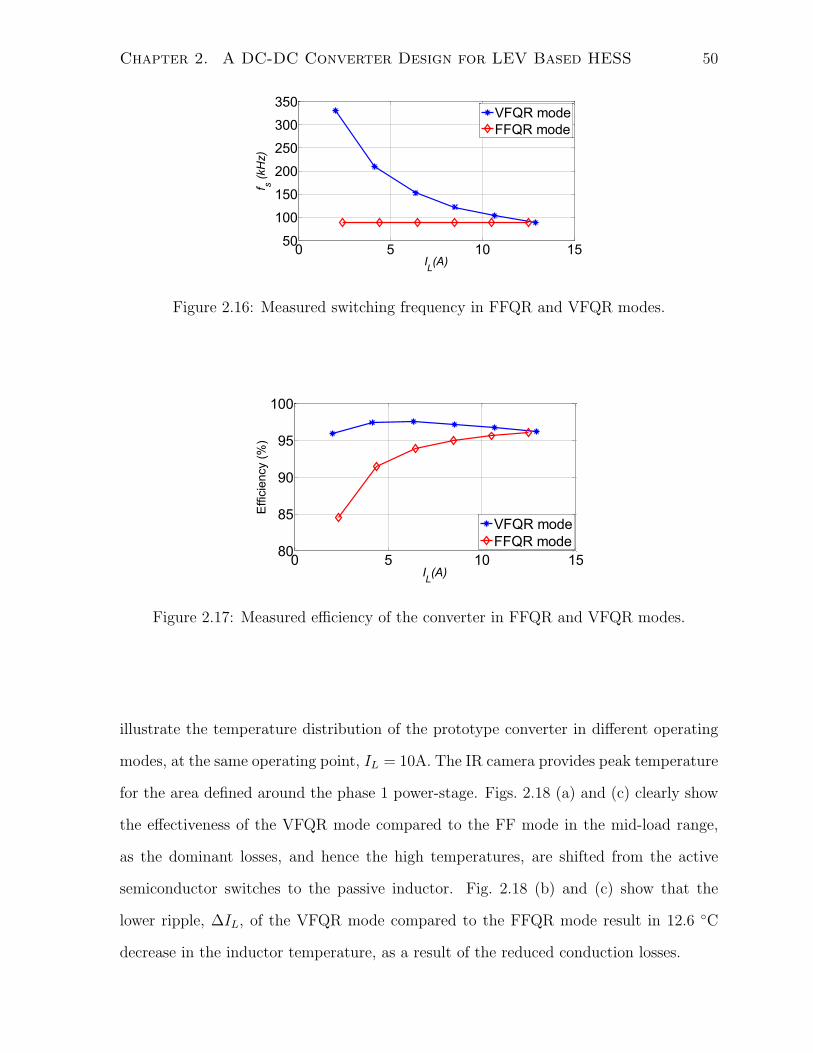
Chapter 2. A DC-DC Converter Design for LEV Based HESS 50
0 5 10 1550
100
150
200
250
300
350
IL(A)
f s (
kH
z)
VFQR mode
FFQR mode
Figure 2.16: Measured switching frequency in FFQR and VFQR modes.
0 5 10 1580
85
90
95
100
IL(A)
Effic
iency (
%)
VFQR mode
FFQR mode
Figure 2.17: Measured efficiency of the converter in FFQR and VFQR modes.
illustrate the temperature distribution of the prototype converter in different operating
modes, at the same operating point, IL = 10A. The IR camera provides peak temperature
for the area defined around the phase 1 power-stage. Figs. 2.18 (a) and (c) clearly show
the effectiveness of the VFQR mode compared to the FF mode in the mid-load range,
as the dominant losses, and hence the high temperatures, are shifted from the active
semiconductor switches to the passive inductor. Fig. 2.18 (b) and (c) show that the
lower ripple, ∆IL, of the VFQR mode compared to the FFQR mode result in 12.6 C
decrease in the inductor temperature, as a result of the reduced conduction losses.
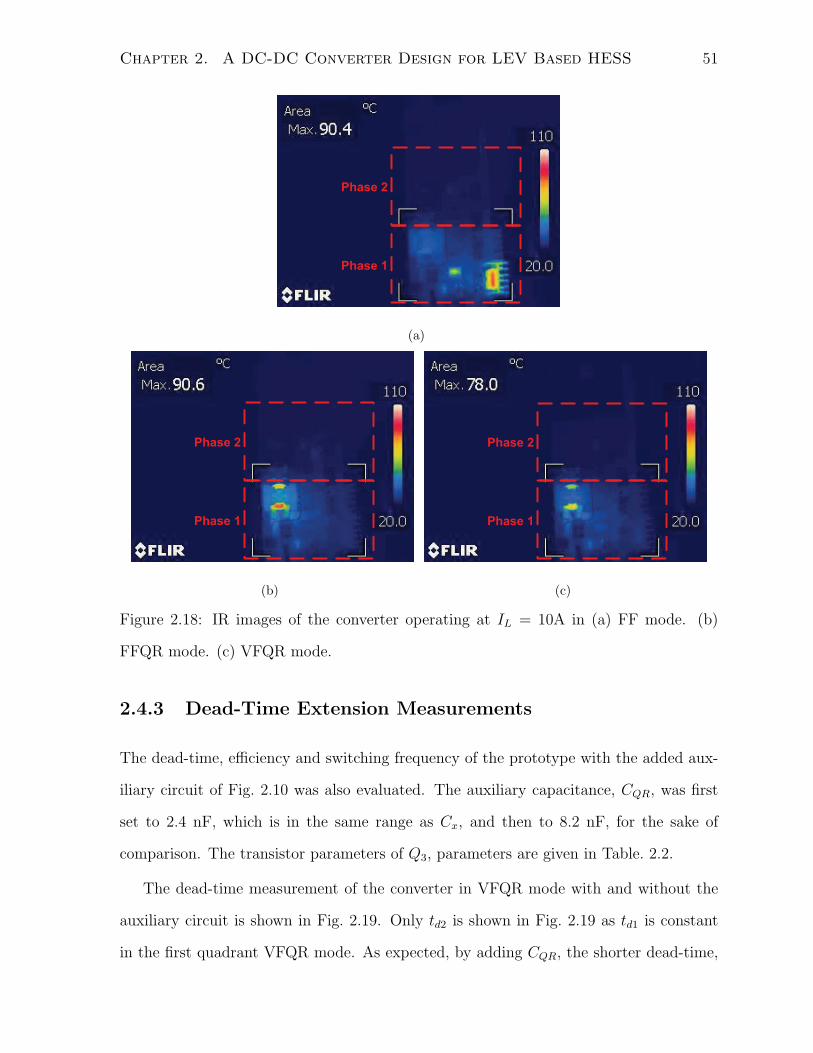
Chapter 2. A DC-DC Converter Design for LEV Based HESS 51
Phase 1
Phase 2
(a)
Phase 1
Phase 2
(b)
Phase 1
Phase 2
(c)
Figure 2.18: IR images of the converter operating at IL = 10A in (a) FF mode. (b)
FFQR mode. (c) VFQR mode.
2.4.3 Dead-Time Extension Measurements
The dead-time, efficiency and switching frequency of the prototype with the added aux-
iliary circuit of Fig. 2.10 was also evaluated. The auxiliary capacitance, CQR, was first
set to 2.4 nF, which is in the same range as Cx, and then to 8.2 nF, for the sake of
comparison. The transistor parameters of Q3, parameters are given in Table. 2.2.
The dead-time measurement of the converter in VFQR mode with and without the
auxiliary circuit is shown in Fig. 2.19. Only td2 is shown in Fig. 2.19 as td1 is constant
in the first quadrant VFQR mode. As expected, by adding CQR, the shorter dead-time,
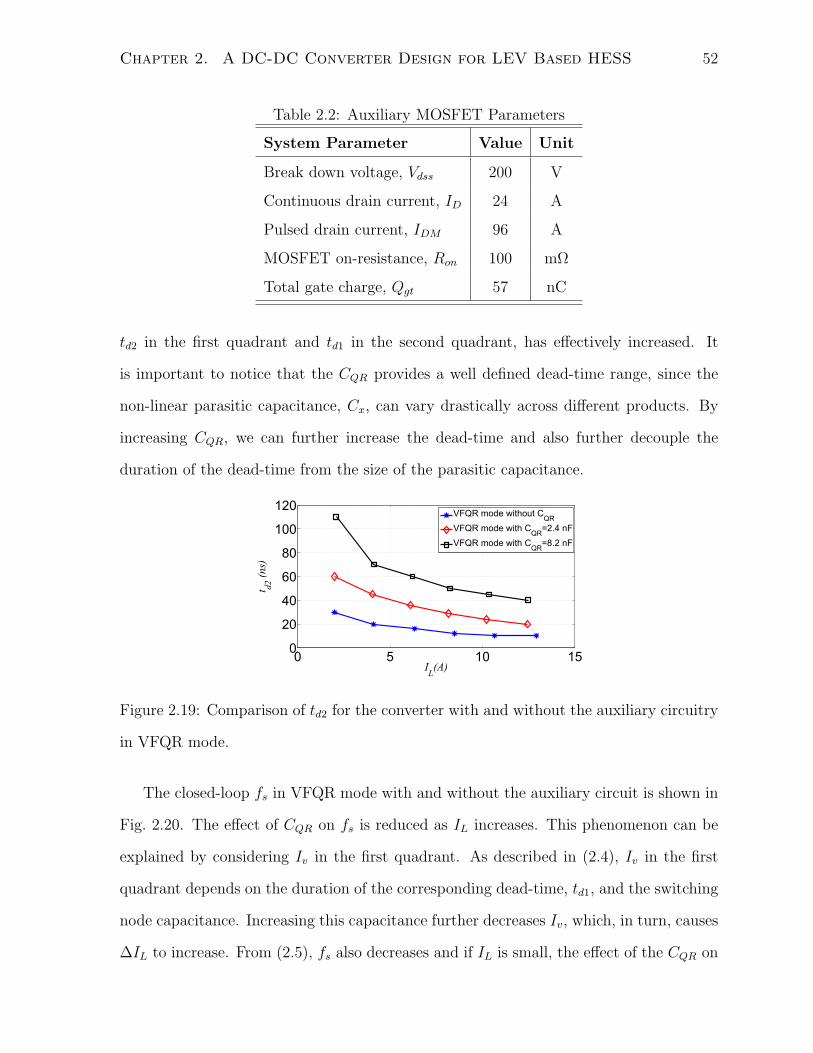
Chapter 2. A DC-DC Converter Design for LEV Based HESS 52
Table 2.2: Auxiliary MOSFET Parameters
System Parameter Value Unit
Break down voltage, Vdss 200 V
Continuous drain current, ID 24 A
Pulsed drain current, IDM 96 A
MOSFET on-resistance, Ron 100 mΩ
Total gate charge, Qgt 57 nC
td2 in the first quadrant and td1 in the second quadrant, has effectively increased. It
is important to notice that the CQR provides a well defined dead-time range, since the
non-linear parasitic capacitance, Cx, can vary drastically across different products. By
increasing CQR, we can further increase the dead-time and also further decouple the
duration of the dead-time from the size of the parasitic capacitance.
0 5 10 150
20
40
60
80
100
120
IL(A)
t d2 (
ns)
VFQR mode without CQR
VFQR mode with CQR
=2.4 nF
VFQR mode with CQR
=8.2 nF
Figure 2.19: Comparison of td2 for the converter with and without the auxiliary circuitry
in VFQR mode.
The closed-loop fs in VFQR mode with and without the auxiliary circuit is shown in
Fig. 2.20. The effect of CQR on fs is reduced as IL increases. This phenomenon can be
explained by considering Iv in the first quadrant. As described in (2.4), Iv in the first
quadrant depends on the duration of the corresponding dead-time, td1, and the switching
node capacitance. Increasing this capacitance further decreases Iv, which, in turn, causes
∆IL to increase. From (2.5), fs also decreases and if IL is small, the effect of the CQR on
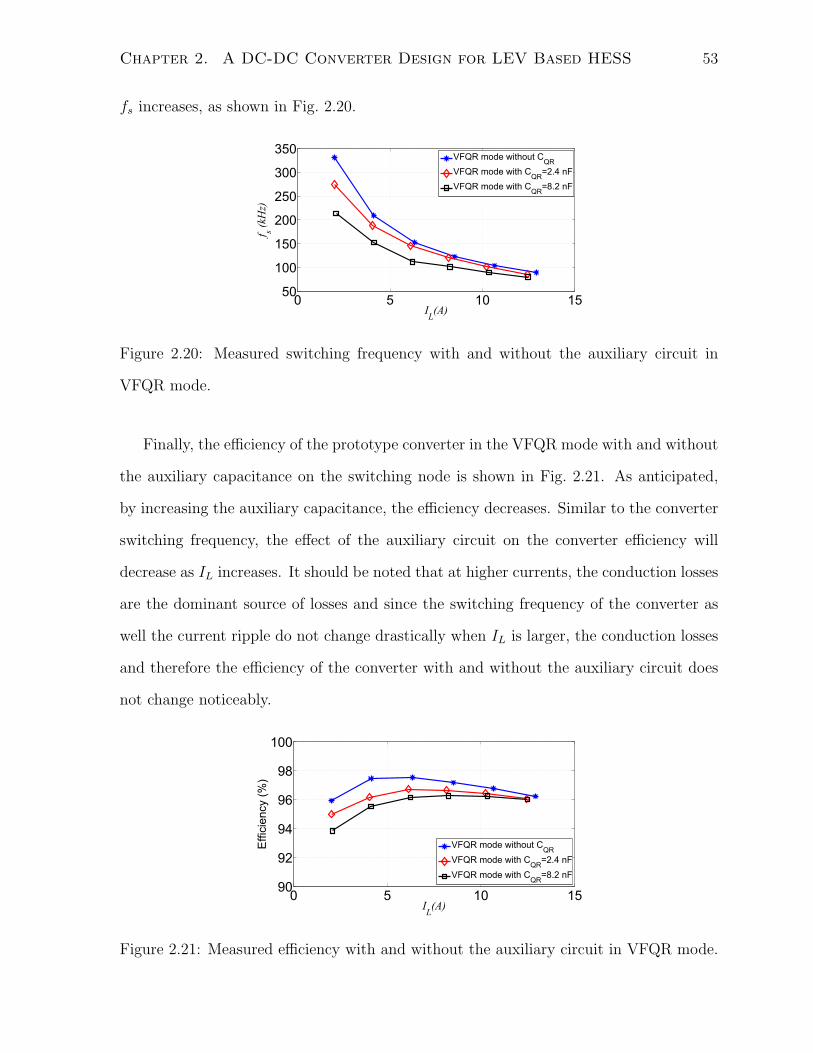
Chapter 2. A DC-DC Converter Design for LEV Based HESS 53
fs increases, as shown in Fig. 2.20.
0 5 10 1550
100
150
200
250
300
350
IL(A)
f s (kH
z)
VFQR mode without CQR
VFQR mode with CQR
=2.4 nF
VFQR mode with CQR
=8.2 nF
Figure 2.20: Measured switching frequency with and without the auxiliary circuit in
VFQR mode.
Finally, the efficiency of the prototype converter in the VFQR mode with and without
the auxiliary capacitance on the switching node is shown in Fig. 2.21. As anticipated,
by increasing the auxiliary capacitance, the efficiency decreases. Similar to the converter
switching frequency, the effect of the auxiliary circuit on the converter efficiency will
decrease as IL increases. It should be noted that at higher currents, the conduction losses
are the dominant source of losses and since the switching frequency of the converter as
well the current ripple do not change drastically when IL is larger, the conduction losses
and therefore the efficiency of the converter with and without the auxiliary circuit does
not change noticeably.
0 5 10 1590
92
94
96
98
100
IL(A)
Eff
icie
ncy (
%)
VFQR mode without CQR
VFQR mode with CQR
=2.4 nF
VFQR mode with CQR
=8.2 nF
Figure 2.21: Measured efficiency with and without the auxiliary circuit in VFQR mode.
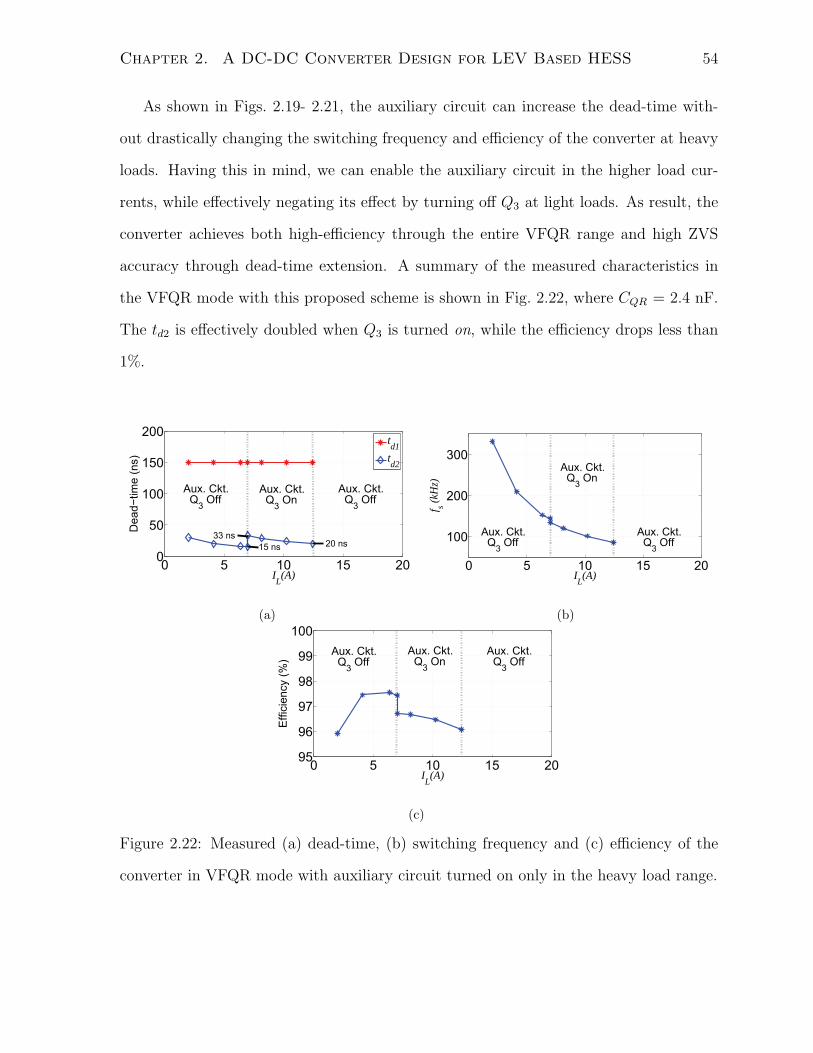
Chapter 2. A DC-DC Converter Design for LEV Based HESS 54
As shown in Figs. 2.19- 2.21, the auxiliary circuit can increase the dead-time with-
out drastically changing the switching frequency and efficiency of the converter at heavy
loads. Having this in mind, we can enable the auxiliary circuit in the higher load cur-
rents, while effectively negating its effect by turning off Q3 at light loads. As result, the
converter achieves both high-efficiency through the entire VFQR range and high ZVS
accuracy through dead-time extension. A summary of the measured characteristics in
the VFQR mode with this proposed scheme is shown in Fig. 2.22, where CQR = 2.4 nF.
The td2 is effectively doubled when Q3 is turned on, while the efficiency drops less than
1%.
0 5 10 15 200
50
100
150
200
IL(A)
Dead−
tim
e (
ns)
td1
td2
Aux. Ckt. Q
3 On
Aux. Ckt. Q
3 Off
33 ns
15 ns 20 ns
Aux. Ckt. Q
3 Off
(a)
0 5 10 15 20
100
200
300
IL(A)
f s (kH
z)
Aux. Ckt. Q
3 Off
Aux. Ckt. Q
3 On
Aux. Ckt. Q
3 Off
(b)
0 5 10 15 2095
96
97
98
99
100
IL(A)
Eff
icie
ncy (
%)
Aux. Ckt. Q
3 Off
Aux. Ckt. Q
3 Off
Aux. Ckt. Q
3 On
(c)
Figure 2.22: Measured (a) dead-time, (b) switching frequency and (c) efficiency of the
converter in VFQR mode with auxiliary circuit turned on only in the heavy load range.

Chapter 2. A DC-DC Converter Design for LEV Based HESS 55
2.4.4 Dynamic Measurements
The transient response of the converter due to a step in Ibt∗ from 15 A to 6.5 A is shown in
Fig. 2.23. The converter first operates in FF mode at 15 A and automatically switches to
VFQR mode following the command-step. The measured converter waveforms are shown
in Fig. 2.23(a). The measured fs in VFQR mode is shown in Fig. 2.23(b), during the
automatic adjustment process. fs is first updated based on a feed-forward and then fine-
tuned using a binary search algorithm, as described in Section 2.2. The dead-time and
frequency fine-tuning begin 7 ms after the command-step, when steady-state is detected.
The frequency and dead-time adjustment are done in less than 15 ms, which is an order
of magnitude faster than the update rate of Ibt∗ in the full system. While operating in
FF mode at 15 A, fs = 400 kHz while the optimized fs in VFQR mode at 6.5 A is 154
kHz with a valley current, Iv ≈ -2 A.
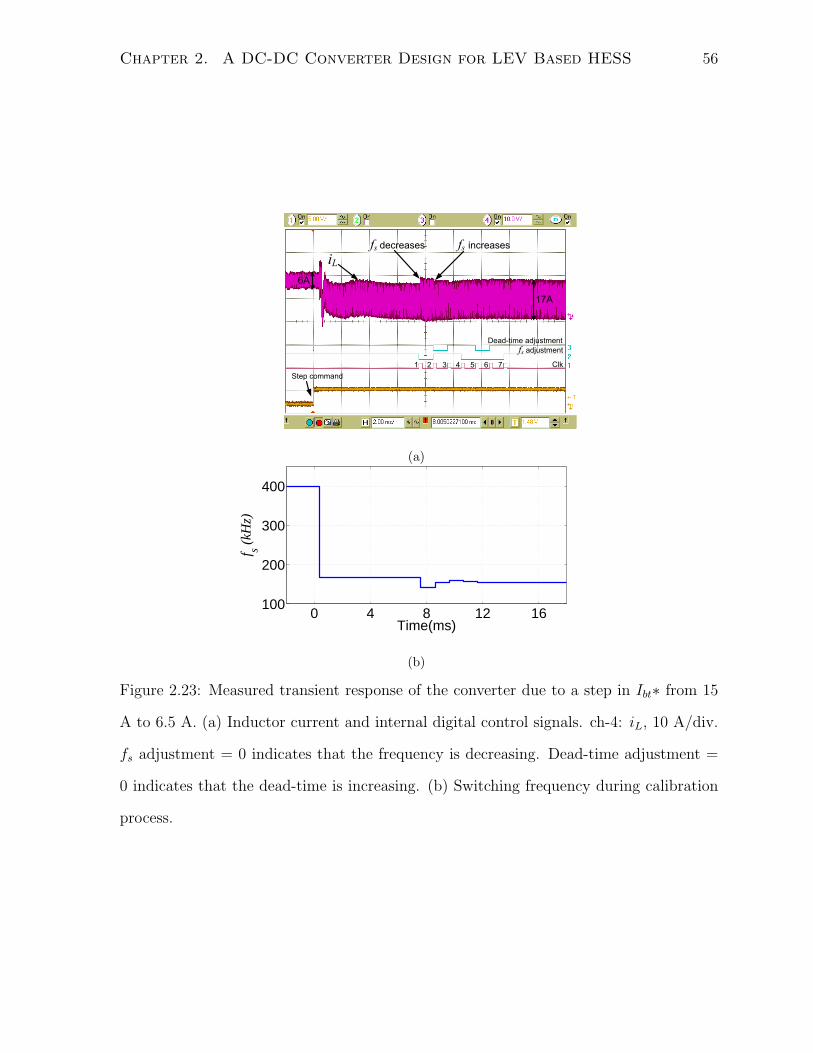
Chapter 2. A DC-DC Converter Design for LEV Based HESS 56
1 2 3 4 5 6 7 Clk
fs adjustmentDead-time adjustment
Step command
6A
17A
fs increasesfs decreases
iL
(a)
0 4 8 12 16100
200
300
400
Time(ms)
f s (kH
z)
(b)
Figure 2.23: Measured transient response of the converter due to a step in Ibt∗ from 15
A to 6.5 A. (a) Inductor current and internal digital control signals. ch-4: iL, 10 A/div.
fs adjustment = 0 indicates that the frequency is decreasing. Dead-time adjustment =
0 indicates that the dead-time is increasing. (b) Switching frequency during calibration
process.
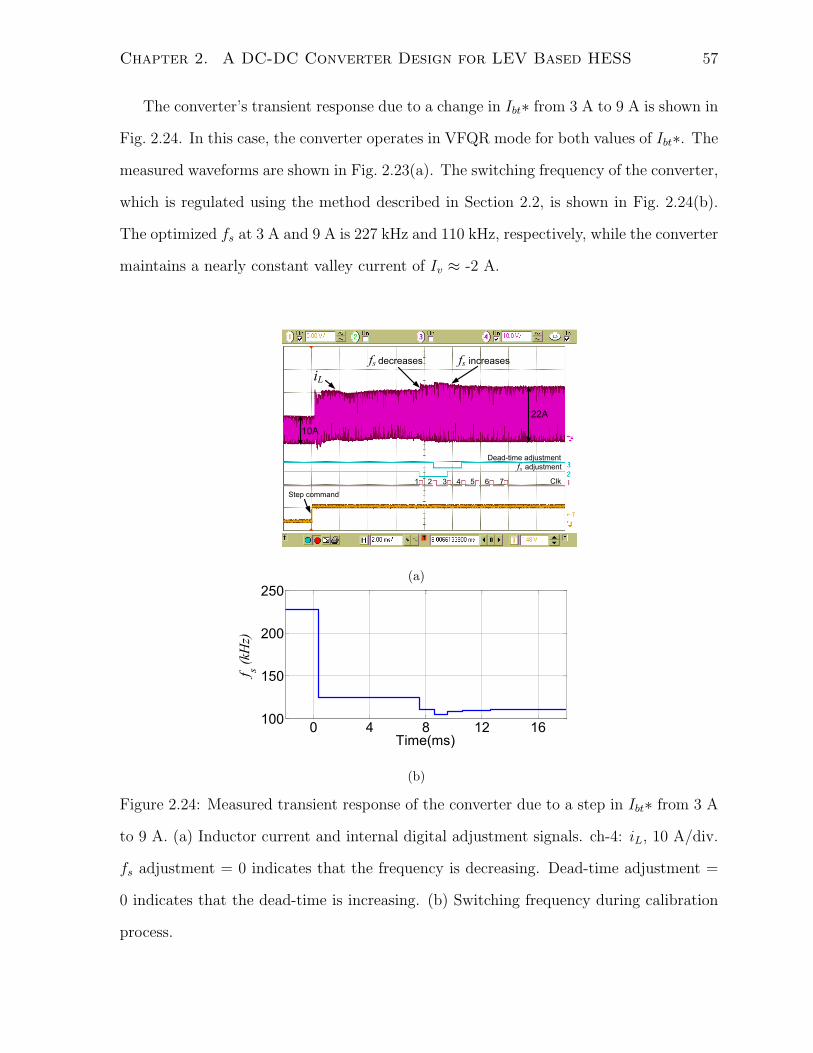
Chapter 2. A DC-DC Converter Design for LEV Based HESS 57
The converter’s transient response due to a change in Ibt∗ from 3 A to 9 A is shown in
Fig. 2.24. In this case, the converter operates in VFQR mode for both values of Ibt∗. The
measured waveforms are shown in Fig. 2.23(a). The switching frequency of the converter,
which is regulated using the method described in Section 2.2, is shown in Fig. 2.24(b).
The optimized fs at 3 A and 9 A is 227 kHz and 110 kHz, respectively, while the converter
maintains a nearly constant valley current of Iv ≈ -2 A.
10A
fs increasesfs decreases
iL
Step command
1 2 3 4 5 6 7
22A
Clk
fs adjustmentDead-time adjustment
(a)
0 4 8 12 16100
150
200
250
Time(ms)
f s (kH
z)
(b)
Figure 2.24: Measured transient response of the converter due to a step in Ibt∗ from 3 A
to 9 A. (a) Inductor current and internal digital adjustment signals. ch-4: iL, 10 A/div.
fs adjustment = 0 indicates that the frequency is decreasing. Dead-time adjustment =
0 indicates that the dead-time is increasing. (b) Switching frequency during calibration
process.
Chapter 2. A DC-DC Converter Design for LEV Based HESS 58
2.5 Chapter Summary and Conclusions
This chapter targets the design of a high efficiency bi-directional dc-dc converter for the
HESS applications in LEVs. The concept of variable-frequency quasi-resonant operation
was demonstrated for maintaining a constant dead-time and a near constant inductor val-
ley current in the mid-load range. We have compared this scheme with the conventional
fixed-frequency quasi-resonant scheme and it is shown that the VFQR mode provides
higher efficiency. Fixed frequency and PFM operating modes are combined with the
VFQR operation to obtain a tri-mode bi-directional converter that can operate with a
high efficiency over the full load range. The proposed auxiliary circuit is effective in
extending the dead-times for improved ZVS accuracy, without significantly deteriorating
the efficiency. The implemented prototype dc-dc converter achieves the peak efficiency
of 97.5% and maintains the efficiency of 88% over a wide load range. The benefits of
VFQR over FFQR mode and effectiveness of the proposed dead-time extension scheme
are confirmed in this power range using infrared images and efficiency measurements.
References
[1] J. Cao and A. Emadi, “A new battery/ultra-capacitor hybrid energy storage sys-
tem for electric, hybrid and plug-in hybrid electric vehicles,” IEEE Transactions on
Power Electronics, vol. PP, p. 1, Jan 2012.
[2] O. Laldin, M. Moshirvaziri, and O. Trescases, “Optimal power flow for hybrid ultra-
capacitor systems in light electric vehicles,” in IEEE Energy Conversion Congress
and Exposition, ECCE, pp. 2916 –2922, Sept. 2011.
[3] J. Cao, B. Cao, Z. Bai, and W. Chen, “Energy-regenerative fuzzy sliding mode con-
troller design for ultracapacitor-battery hybrid power of electric vehicle,” in Proceed-
ings of IEEE International Conference on Mechatronics and Automation, ICMA,
pp. 1570–1575, 2007.
[4] H. A. Borhan and A. Vahidi, “Model predictive control of a power-split hybrid elec-
tric vehicle with combined battery and ultracapacitor energy storage,” in Proceedings
of American Control Conference, ACC, pp. 5031–5036, 2010.
[5] R. Schupbach and J. Balda, “Comparing dc-dc converters for power management
in hybrid electric vehicles,” in IEEE Electric Machines and Drives Conference,
IEMDC, vol. 3, pp. 1369 – 1374 vol.3, June 2003.
[6] Y. Du, X. Zhou, S. Bai, S. Lukic, and A. Huang, “Review of non-isolated bi-
directional dc-dc converters for plug-in hybrid electric vehicle charge station ap-
59
REFERENCES 60
plication at municipal parking decks,” in Twenty-Fifth Annual IEEE Applied Power
Electronics Conference and Exposition, APEC, pp. 1145 –1151, Feb. 2010.
[7] P. Grbovic, P. Delarue, and P. Le Moigne, “Interface converters for ultra-capacitor
applications in power conversion systems,” in Fifteenth International Power Elec-
tronics and Motion Control Conference and Exposition, Sept. 2012.
[8] J. Wang, W. T. Ng, and O. Trescases, “Versatile capabilities of digitally controlled
integrated dc-dc converters,” in IEEE International Symposium on Circuits and
Systems, ISCAS, pp. 293 –296, May 2011.
[9] O. Trescases, W. T. Ng, and S. Chen, “Precision gate drive timing in a zero-voltage-
switching dc-dc converter,” in Proceedings of the 16th International Symposium on
Power Semiconductor Devices and ICs, ISPSD, pp. 55 – 58, May 2004.
[10] Y. U. Hong, B. K. Choi, Y. J. Woo, M. C. Lee, T. W. Kwak, H. P. Le, and G. H.
Cho, “Optimum efficiency-tracking gate driver using adaptive deadtime control for
single chip dc-dc converter,” in 37th IEEE Power Electronics Specialists Conference,
PESC, pp. 1 –5, June 2006.
[11] H.-W. Huang, K.-H. Chen, and S.-Y. Kuo, “Dithering skip modulation, width and
dead time controllers in highly efficient dc-dc converters for system-on-chip applica-
tions,” IEEE Journal of Solid-State Circuits, vol. 42, pp. 2451 –2465, Nov. 2007.
[12] V. Yousefzadeh and D. Maksimovic, “Sensorless optimization of dead times in dc-dc
converters with synchronous rectifiers,” IEEE Transactions on Power Electronics,
vol. 21, pp. 994 – 1002, July 2006.
[13] J. Abu-Qahouq, H. Mao, H. Al-Atrash, and I. Batarseh, “Maximum efficiency point
tracking (MEPT) method and digital dead time control implementation,” IEEE
Transactions on Power Electronics, vol. 21, pp. 1273 –1281, Sept. 2006.
REFERENCES 61
[14] A. Zhao, A. Shorten, H. Nishio, and W. Ng, “An intergrated dc-dc converter with
digital one-step dead-time correction,” in 22nd International Symposium on Power
Semiconductor Devices IC’s, ISPSD, pp. 57 –60, June 2010.
[15] T. Reiter, D. Polenov, H. Probstle, and H. G. Herzog, “Observer based PWM dead
time optimization in automotive dc/dc-converters with synchronous rectifiers,” in
IEEE Power Electronics Specialists Conference, PESC, pp. 3451 –3456, June 2008.
[16] T. Reiter, D. Polenov, H. Probstle, and H.-G. Herzog, “PWM dead time optimization
method for automotive multiphase dc/dc-converters,” IEEE Transactions on Power
Electronics, vol. 25, pp. 1604 –1614, June 2010.
[17] R. W. Erickson and D. Maksimovic’, Fundamentals of Power Electronics, 2nd Ed.
Kluwer Academic Publishers., 2001.
[18] O. Trescases and Y. Wen, “A survey of light-load efficiency improvement techniques
for low-power dc-dc converters,” in IEEE 8th International Conference on Power
Electronics and ECCE Asia, ICPE ECCE, pp. 326 –333, May 30 -June 3 2011.
[19] X. Liu, S. Guo, S. Wang, F. Xu, G. Du, and Y. Chang, “Analysis and design of
a high efficiency boost dc-dc converter based on pulse-frequency modulation,” in
International Symposium on Integrated Circuits, ISIC, pp. 398 –401, Sept. 2007.
[20] Y.-T. Chen and C.-H. Chen, “A dc-dc buck converter chip with integrated
PWM/PFM hybrid-mode control circuit,” in International Conference on Power
Electronics and Drive Systems, PEDS, pp. 181 –186, Nov. 2009.
[21] D. M. Dwelley, “Voltage mode feedback burst mode cir-
cuit.” Patent US 6 307 356, Oct. 2001. available at
http://www.google.com/patents/about?id=Wk0IAAAAEBAJ.
Chapter 3
HESS Design for EVs with RT GPS
Based Control Method
3.1 Introduction
Implementing low-cost, high-energy and high power-density storage that performs re-
liably for 10-15 years is crucial for the mass adoption of EVs. Advantages of U-cap
based HESS, including life-time extension of its storage elements, were discussed in de-
tails in Chapter 1. To summarize, the main objectives of an automotive HESS are to
(1) minimize the battery stress during rapid accelerations in order to limit long-term
capacity fading and (2) maximize the capture of the Regen, while reducing the wear on
the mechanical brakes. Accurately predicting the battery lifetime extension due to the
reduction in dynamic currents under real drive-cycle conditions is a major challenge, and
is currently under investigation.
This chapter targets a u-cap based HESS for the custom EV prototype, known as
A2B, shown in Fig. 3.1 [1]. The chosen HESS topology that is shown in Fig. 3.2 was
discussed in Section 1.2.2 and also shown in Fig. 1.10. The topology includes a non-
isolated bi-directional dc-dc converter between Vuc and Vbt. This architecture allows (1)
62
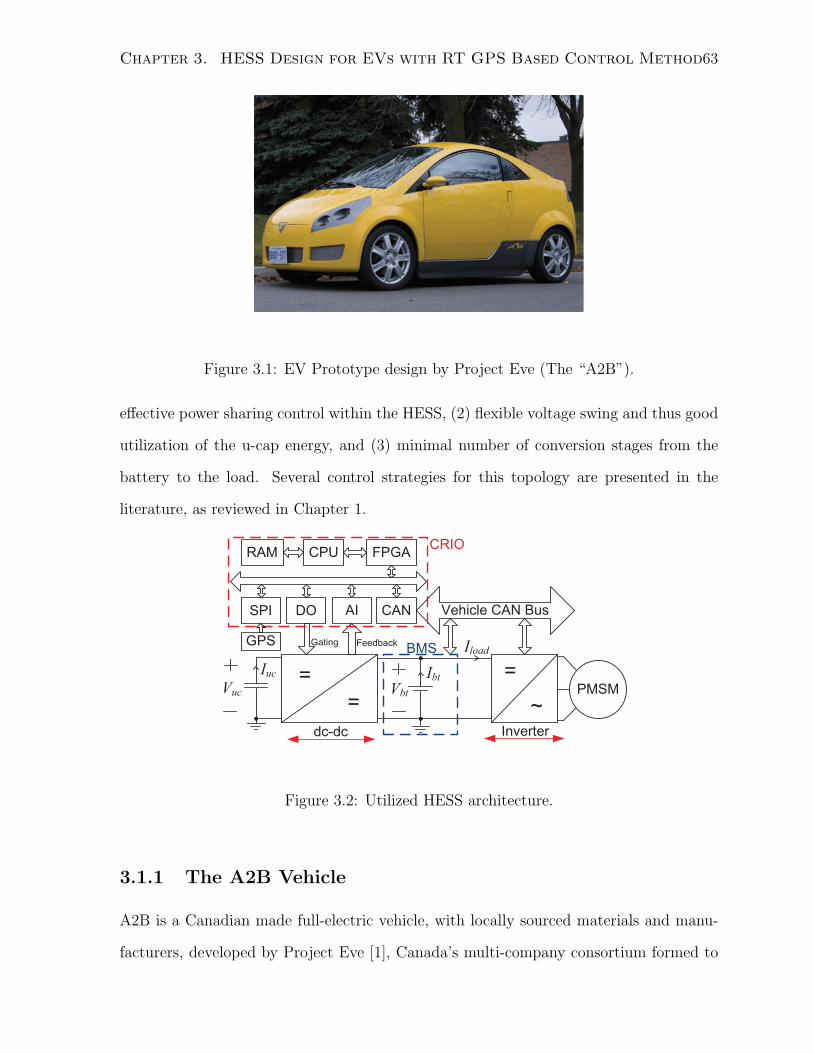
Chapter 3. HESS Design for EVs with RT GPS Based Control Method63
Figure 3.1: EV Prototype design by Project Eve (The “A2B”).
effective power sharing control within the HESS, (2) flexible voltage swing and thus good
utilization of the u-cap energy, and (3) minimal number of conversion stages from the
battery to the load. Several control strategies for this topology are presented in the
literature, as reviewed in Chapter 1.
Vbt
BMS
PMSM
Vehicle CAN Bus
GPS
Vuc
FeedbackGating
=
=
dc-dc Inverter
=
~
FPGACRIO
CPURAM
CANAIDOSPI
IbtIuc
Iload
Figure 3.2: Utilized HESS architecture.
3.1.1 The A2B Vehicle
A2B is a Canadian made full-electric vehicle, with locally sourced materials and manu-
facturers, developed by Project Eve [1], Canada’s multi-company consortium formed to
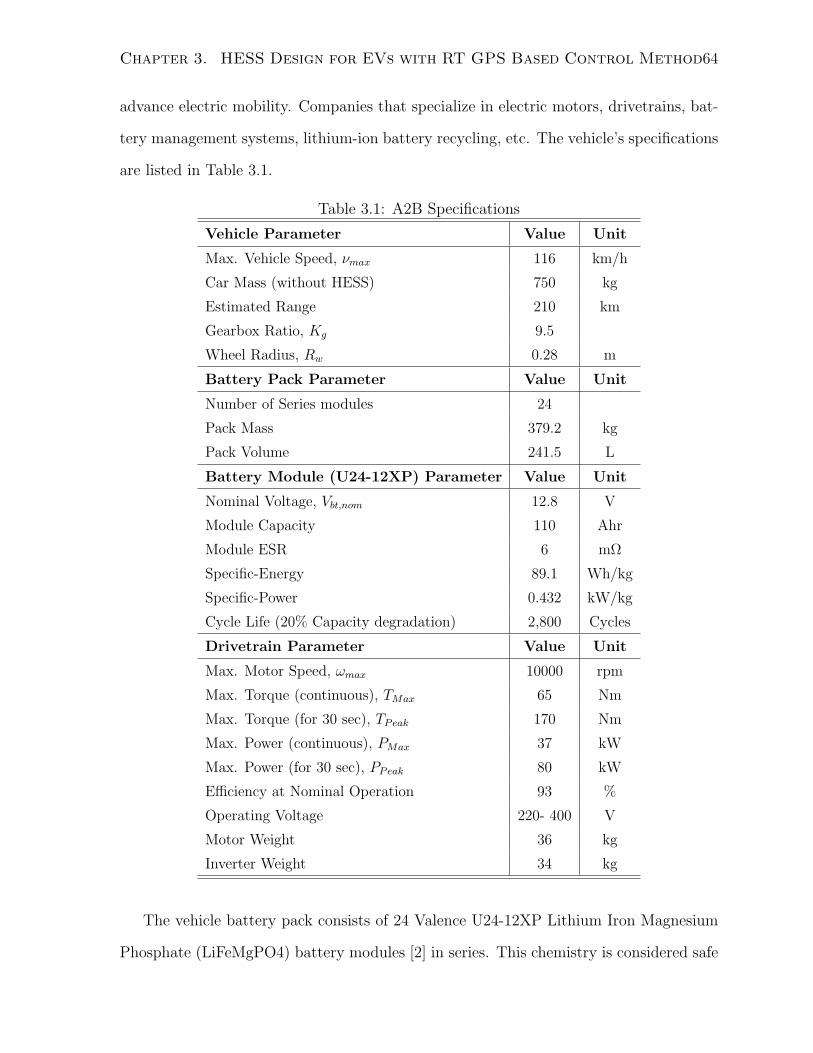
Chapter 3. HESS Design for EVs with RT GPS Based Control Method64
advance electric mobility. Companies that specialize in electric motors, drivetrains, bat-
tery management systems, lithium-ion battery recycling, etc. The vehicle’s specifications
are listed in Table 3.1.
Table 3.1: A2B Specifications
Vehicle Parameter Value Unit
Max. Vehicle Speed, νmax 116 km/h
Car Mass (without HESS) 750 kg
Estimated Range 210 km
Gearbox Ratio, Kg 9.5
Wheel Radius, Rw 0.28 m
Battery Pack Parameter Value Unit
Number of Series modules 24
Pack Mass 379.2 kg
Pack Volume 241.5 L
Battery Module (U24-12XP) Parameter Value Unit
Nominal Voltage, Vbt,nom 12.8 V
Module Capacity 110 Ahr
Module ESR 6 mΩ
Specific-Energy 89.1 Wh/kg
Specific-Power 0.432 kW/kg
Cycle Life (20% Capacity degradation) 2,800 Cycles
Drivetrain Parameter Value Unit
Max. Motor Speed, ωmax 10000 rpm
Max. Torque (continuous), TMax 65 Nm
Max. Torque (for 30 sec), TPeak 170 Nm
Max. Power (continuous), PMax 37 kW
Max. Power (for 30 sec), PPeak 80 kW
Efficiency at Nominal Operation 93 %
Operating Voltage 220- 400 V
Motor Weight 36 kg
Inverter Weight 34 kg
The vehicle battery pack consists of 24 Valence U24-12XP Lithium Iron Magnesium
Phosphate (LiFeMgPO4) battery modules [2] in series. This chemistry is considered safe
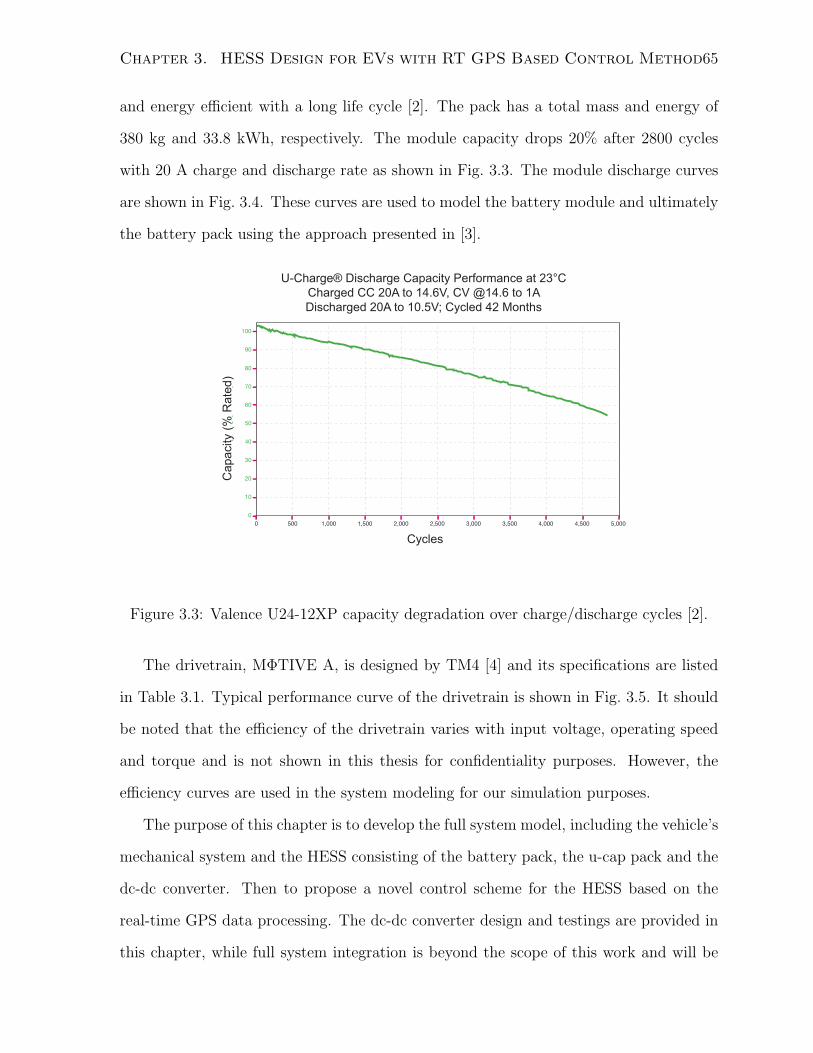
Chapter 3. HESS Design for EVs with RT GPS Based Control Method65
and energy efficient with a long life cycle [2]. The pack has a total mass and energy of
380 kg and 33.8 kWh, respectively. The module capacity drops 20% after 2800 cycles
with 20 A charge and discharge rate as shown in Fig. 3.3. The module discharge curves
are shown in Fig. 3.4. These curves are used to model the battery module and ultimately
the battery pack using the approach presented in [3].C
ap
ac
ity (
% r
ate
d)
100
90
80
60
40
20
70
50
30
10
0
0 5,0004,0002,000 3,5001,500500 1,000 2,500 3,000 4,500
Cycles
U-Charge®
Figure 3.3: Valence U24-12XP capacity degradation over charge/discharge cycles [2].
The drivetrain, MΦTIVE A, is designed by TM4 [4] and its specifications are listed
in Table 3.1. Typical performance curve of the drivetrain is shown in Fig. 3.5. It should
be noted that the efficiency of the drivetrain varies with input voltage, operating speed
and torque and is not shown in this thesis for confidentiality purposes. However, the
efficiency curves are used in the system modeling for our simulation purposes.
The purpose of this chapter is to develop the full system model, including the vehicle’s
mechanical system and the HESS consisting of the battery pack, the u-cap pack and the
dc-dc converter. Then to propose a novel control scheme for the HESS based on the
real-time GPS data processing. The dc-dc converter design and testings are provided in
this chapter, while full system integration is beyond the scope of this work and will be
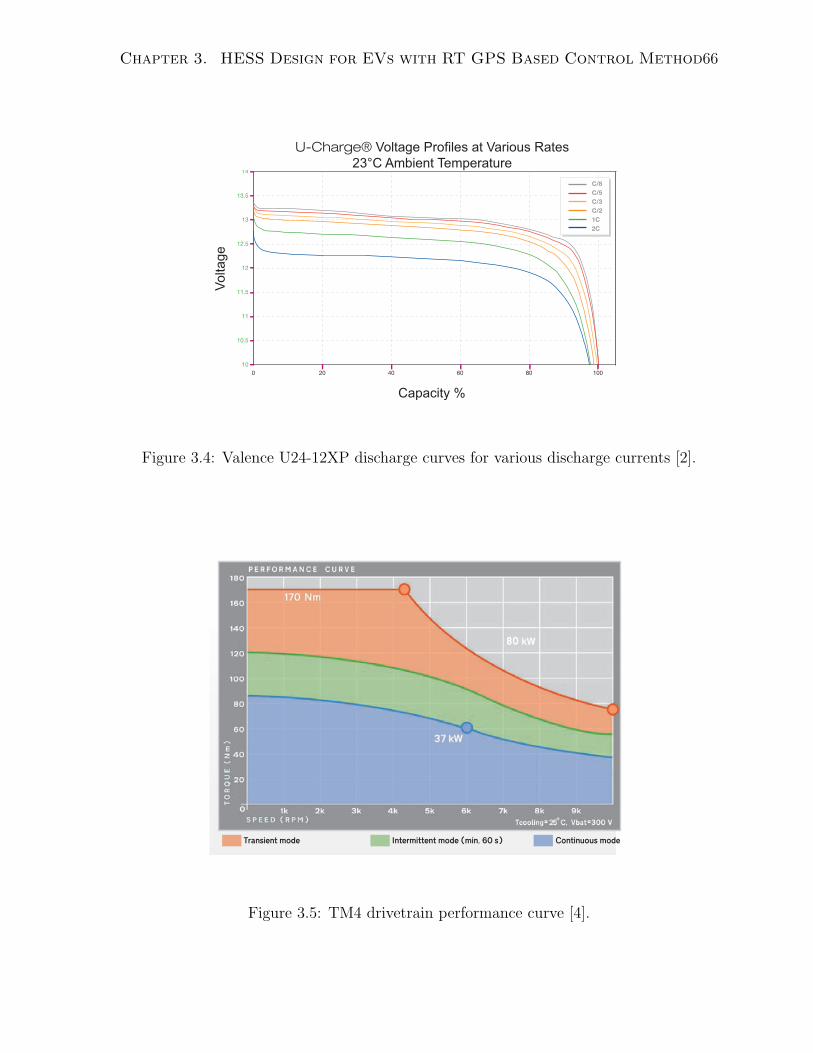
Chapter 3. HESS Design for EVs with RT GPS Based Control Method66
14
13
12
11
13.5
12.5
11.5
10.5
10
0 80 6020 40 100
C/8
C/5
C/3
C/2
1C
2C
U-Charge®
Capacity %
Voltage V
Voltage
Capacity %
Figure 3.4: Valence U24-12XP discharge curves for various discharge currents [2].
80
Figure 3.5: TM4 drivetrain performance curve [4].
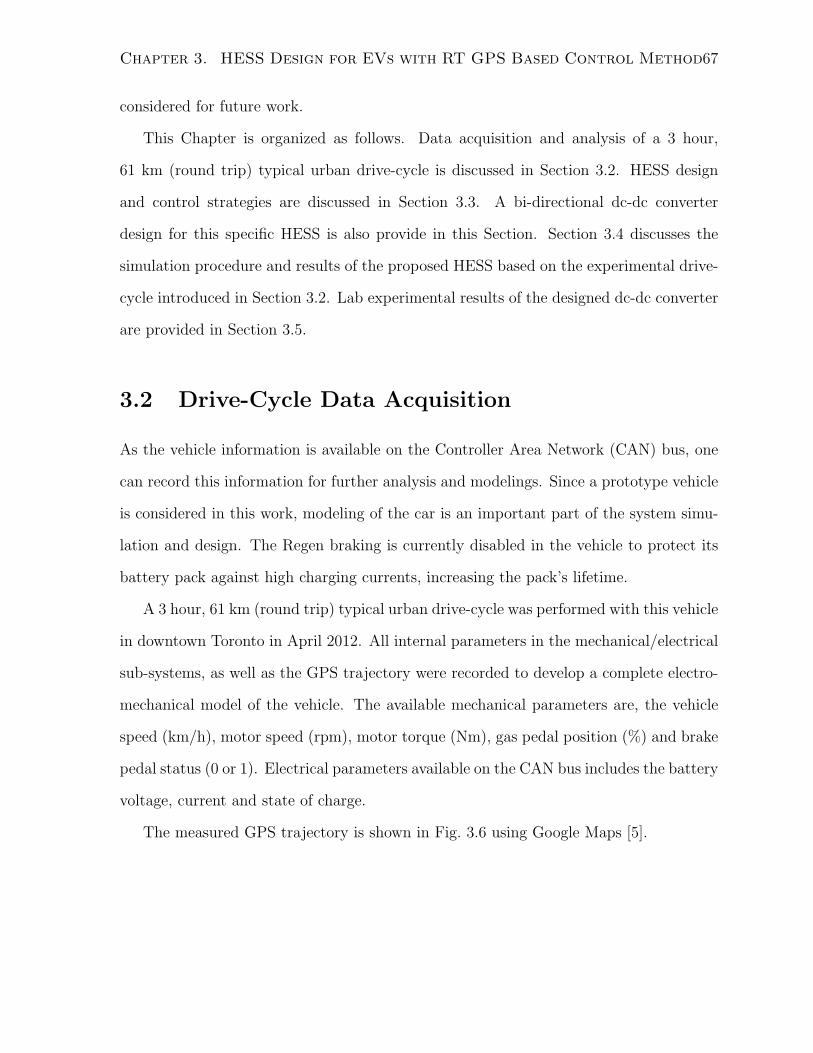
Chapter 3. HESS Design for EVs with RT GPS Based Control Method67
considered for future work.
This Chapter is organized as follows. Data acquisition and analysis of a 3 hour,
61 km (round trip) typical urban drive-cycle is discussed in Section 3.2. HESS design
and control strategies are discussed in Section 3.3. A bi-directional dc-dc converter
design for this specific HESS is also provide in this Section. Section 3.4 discusses the
simulation procedure and results of the proposed HESS based on the experimental drive-
cycle introduced in Section 3.2. Lab experimental results of the designed dc-dc converter
are provided in Section 3.5.
3.2 Drive-Cycle Data Acquisition
As the vehicle information is available on the Controller Area Network (CAN) bus, one
can record this information for further analysis and modelings. Since a prototype vehicle
is considered in this work, modeling of the car is an important part of the system simu-
lation and design. The Regen braking is currently disabled in the vehicle to protect its
battery pack against high charging currents, increasing the pack’s lifetime.
A 3 hour, 61 km (round trip) typical urban drive-cycle was performed with this vehicle
in downtown Toronto in April 2012. All internal parameters in the mechanical/electrical
sub-systems, as well as the GPS trajectory were recorded to develop a complete electro-
mechanical model of the vehicle. The available mechanical parameters are, the vehicle
speed (km/h), motor speed (rpm), motor torque (Nm), gas pedal position (%) and brake
pedal status (0 or 1). Electrical parameters available on the CAN bus includes the battery
voltage, current and state of charge.
The measured GPS trajectory is shown in Fig. 3.6 using Google Maps [5].

Chapter 3. HESS Design for EVs with RT GPS Based Control Method68
Figure 3.6: Vehicle trajectory for the 3 hour urban drive-cycle.
Chapter 3. HESS Design for EVs with RT GPS Based Control Method69
3.2.1 Drive-Cycle Analysis
The measured vehicle speed, motor speed and motor torque are shown in Fig. 3.7. The
motor torque is always positive, since the Regen braking is disabled in the vehicle as
shown in Fig. 3.7(c).
The battery voltage and current measured by the Battery Management System (BMS),
and the calculated load power are shown in Fig. 3.8. The estimated battery SOC, broad-
casted on the CAN bus by the BMS is shown in Fig. 3.9.
The vehicle traveled 61 km and consumed 11.97 kWh net electrical energy. The
results show an average energy consumption of 19.62 kWh per 100 km (706 kJ/km),
which compares favorably with the Chevy Volt [6] with an official EPA measurement of
22.4 kWh per 100 km (810 kJ/km).
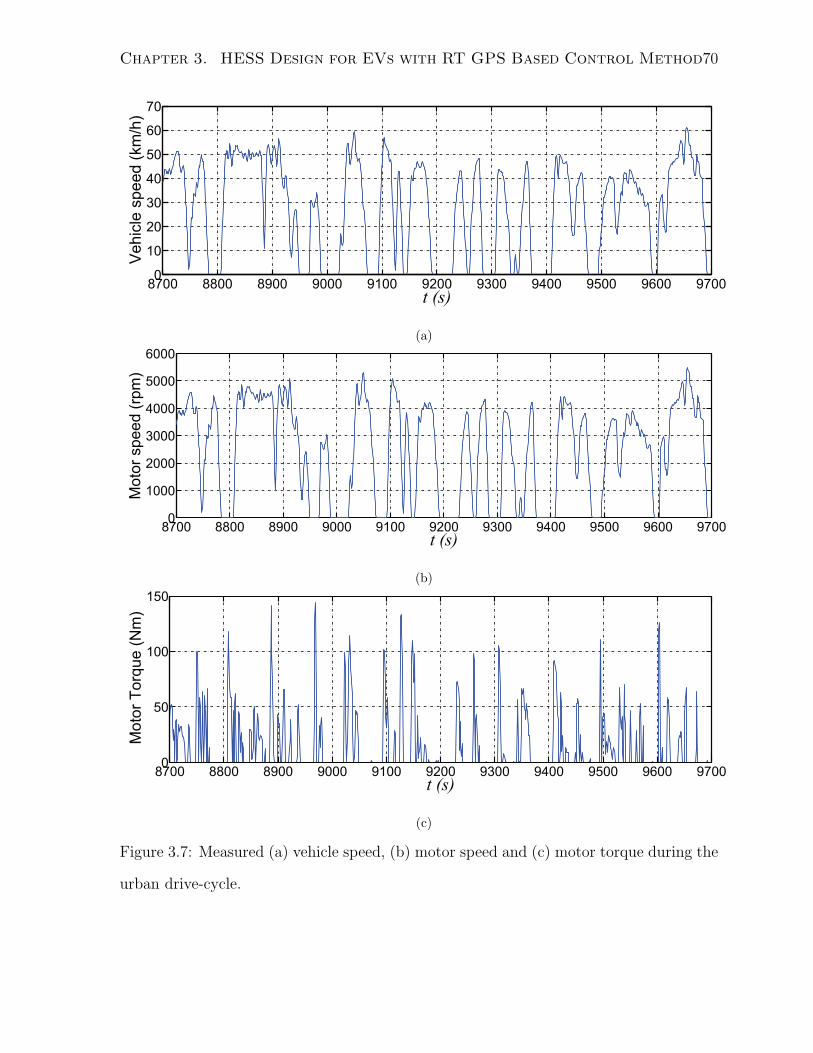
Chapter 3. HESS Design for EVs with RT GPS Based Control Method70
8700 8800 8900 9000 9100 9200 9300 9400 9500 9600 97000
10
20
30
40
50
60
70
t (s)
Vehic
le s
peed (
km
/h)
(a)
8700 8800 8900 9000 9100 9200 9300 9400 9500 9600 97000
1000
2000
3000
4000
5000
6000
t (s)
Moto
r speed (
rpm
)
(b)
8700 8800 8900 9000 9100 9200 9300 9400 9500 9600 97000
50
100
150
t (s)
Moto
r T
orq
ue (
Nm
)
(c)
Figure 3.7: Measured (a) vehicle speed, (b) motor speed and (c) motor torque during the
urban drive-cycle.
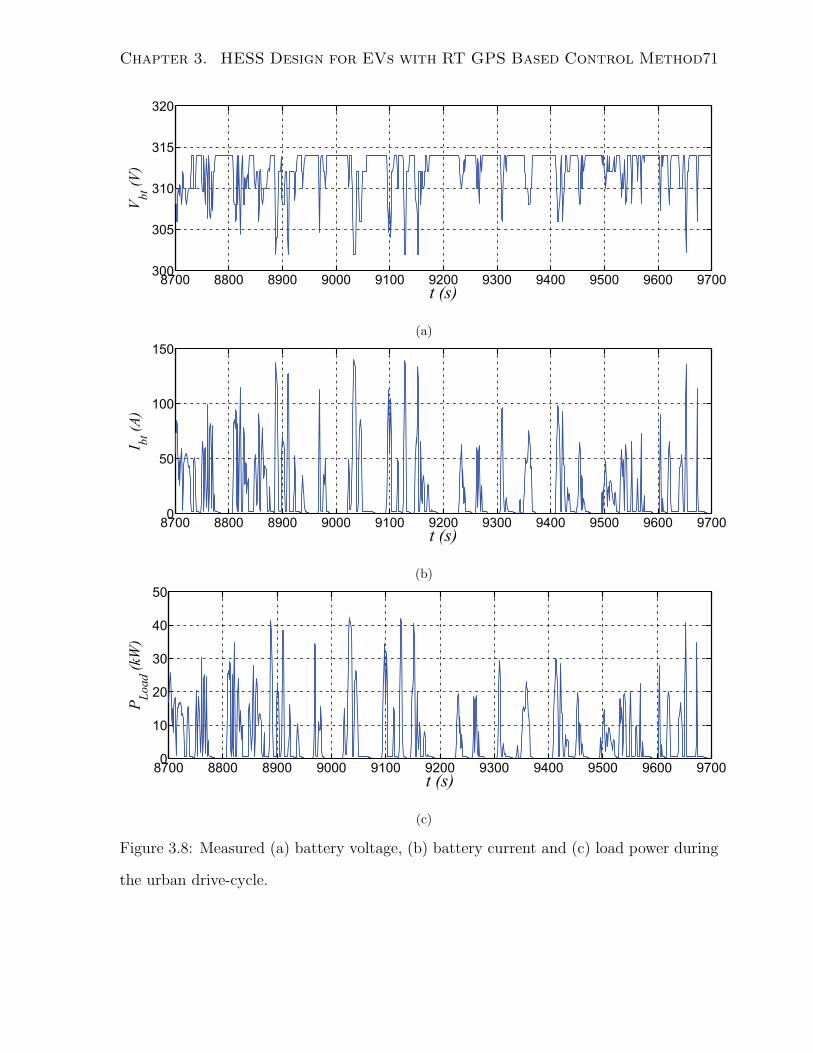
Chapter 3. HESS Design for EVs with RT GPS Based Control Method71
8700 8800 8900 9000 9100 9200 9300 9400 9500 9600 9700300
305
310
315
320
t (s)
Vb
t (V
)
(a)
8700 8800 8900 9000 9100 9200 9300 9400 9500 9600 97000
50
100
150
t (s)
I bt (
A)
(b)
8700 8800 8900 9000 9100 9200 9300 9400 9500 9600 97000
10
20
30
40
50
t (s)
PL
oad (
kW)
(c)
Figure 3.8: Measured (a) battery voltage, (b) battery current and (c) load power during
the urban drive-cycle.
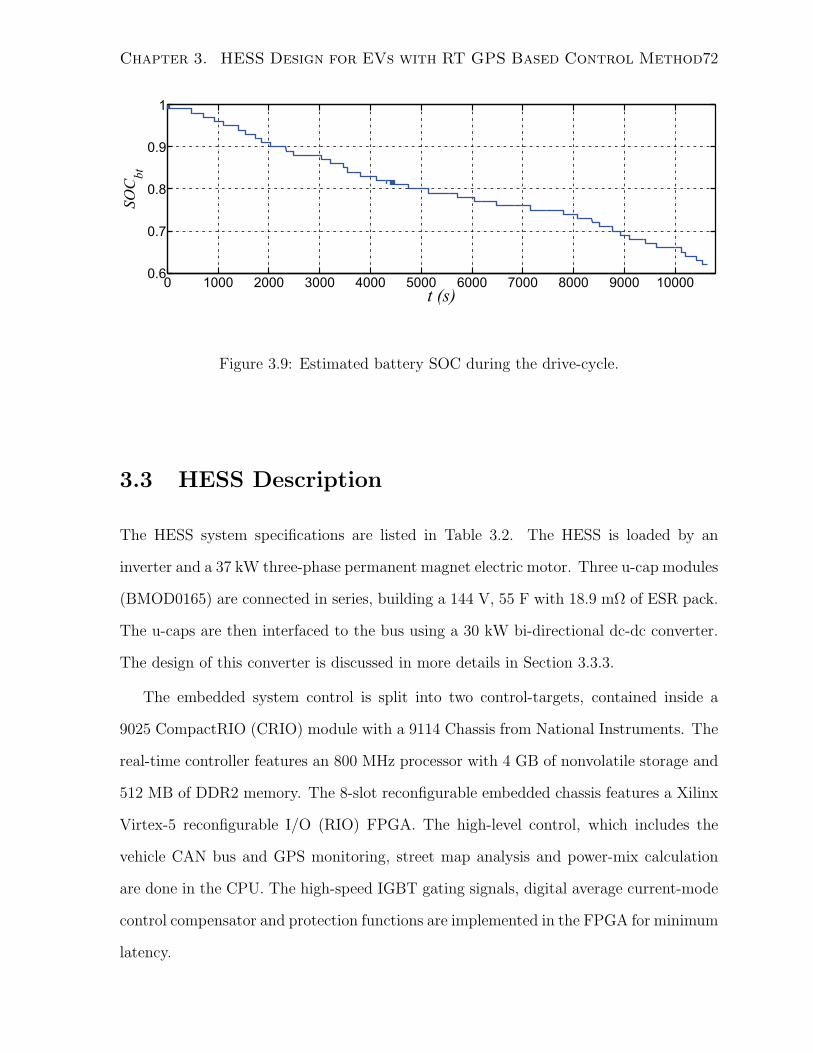
Chapter 3. HESS Design for EVs with RT GPS Based Control Method72
0 1000 2000 3000 4000 5000 6000 7000 8000 9000 100000.6
0.7
0.8
0.9
1
t (s)
SO
Cb
t
Figure 3.9: Estimated battery SOC during the drive-cycle.
3.3 HESS Description
The HESS system specifications are listed in Table 3.2. The HESS is loaded by an
inverter and a 37 kW three-phase permanent magnet electric motor. Three u-cap modules
(BMOD0165) are connected in series, building a 144 V, 55 F with 18.9 mΩ of ESR pack.
The u-caps are then interfaced to the bus using a 30 kW bi-directional dc-dc converter.
The design of this converter is discussed in more details in Section 3.3.3.
The embedded system control is split into two control-targets, contained inside a
9025 CompactRIO (CRIO) module with a 9114 Chassis from National Instruments. The
real-time controller features an 800 MHz processor with 4 GB of nonvolatile storage and
512 MB of DDR2 memory. The 8-slot reconfigurable embedded chassis features a Xilinx
Virtex-5 reconfigurable I/O (RIO) FPGA. The high-level control, which includes the
vehicle CAN bus and GPS monitoring, street map analysis and power-mix calculation
are done in the CPU. The high-speed IGBT gating signals, digital average current-mode
control compensator and protection functions are implemented in the FPGA for minimum
latency.
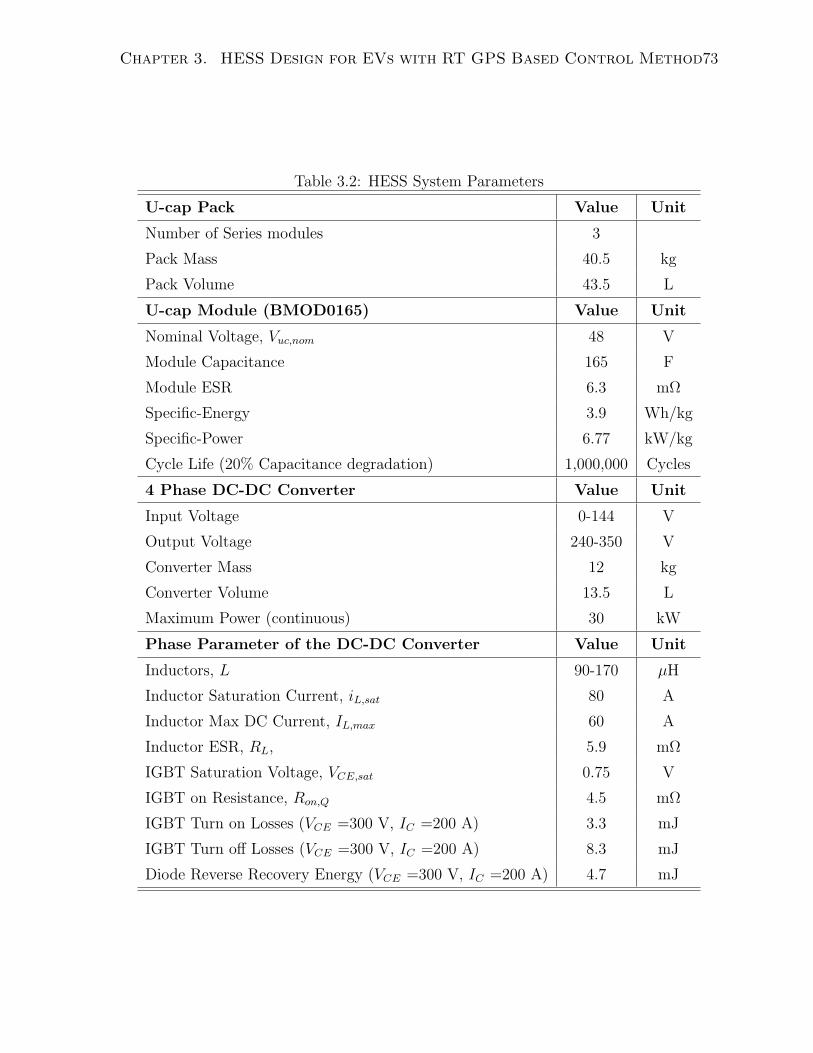
Chapter 3. HESS Design for EVs with RT GPS Based Control Method73
Table 3.2: HESS System Parameters
U-cap Pack Value Unit
Number of Series modules 3
Pack Mass 40.5 kg
Pack Volume 43.5 L
U-cap Module (BMOD0165) Value Unit
Nominal Voltage, Vuc,nom 48 V
Module Capacitance 165 F
Module ESR 6.3 mΩ
Specific-Energy 3.9 Wh/kg
Specific-Power 6.77 kW/kg
Cycle Life (20% Capacitance degradation) 1,000,000 Cycles
4 Phase DC-DC Converter Value Unit
Input Voltage 0-144 V
Output Voltage 240-350 V
Converter Mass 12 kg
Converter Volume 13.5 L
Maximum Power (continuous) 30 kW
Phase Parameter of the DC-DC Converter Value Unit
Inductors, L 90-170 µH
Inductor Saturation Current, iL,sat 80 A
Inductor Max DC Current, IL,max 60 A
Inductor ESR, RL, 5.9 mΩ
IGBT Saturation Voltage, VCE,sat 0.75 V
IGBT on Resistance, Ron,Q 4.5 mΩ
IGBT Turn on Losses (VCE =300 V, IC =200 A) 3.3 mJ
IGBT Turn off Losses (VCE =300 V, IC =200 A) 8.3 mJ
Diode Reverse Recovery Energy (VCE =300 V, IC =200 A) 4.7 mJ
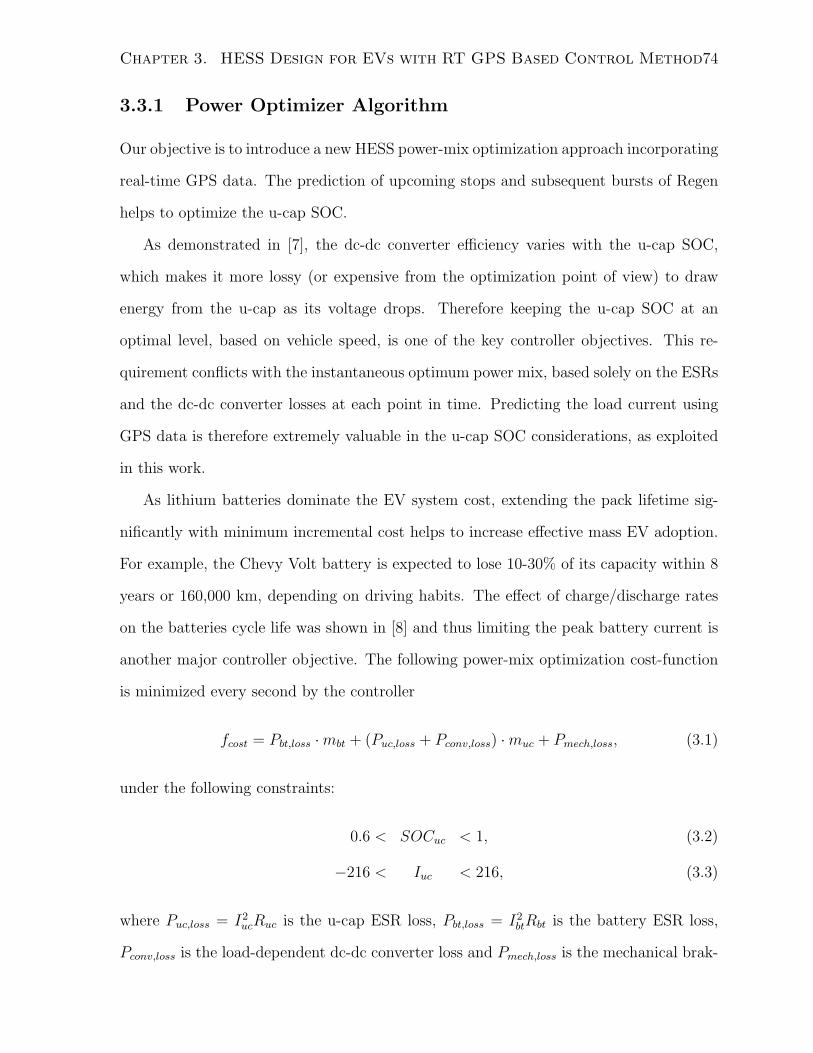
Chapter 3. HESS Design for EVs with RT GPS Based Control Method74
3.3.1 Power Optimizer Algorithm
Our objective is to introduce a new HESS power-mix optimization approach incorporating
real-time GPS data. The prediction of upcoming stops and subsequent bursts of Regen
helps to optimize the u-cap SOC.
As demonstrated in [7], the dc-dc converter efficiency varies with the u-cap SOC,
which makes it more lossy (or expensive from the optimization point of view) to draw
energy from the u-cap as its voltage drops. Therefore keeping the u-cap SOC at an
optimal level, based on vehicle speed, is one of the key controller objectives. This re-
quirement conflicts with the instantaneous optimum power mix, based solely on the ESRs
and the dc-dc converter losses at each point in time. Predicting the load current using
GPS data is therefore extremely valuable in the u-cap SOC considerations, as exploited
in this work.
As lithium batteries dominate the EV system cost, extending the pack lifetime sig-
nificantly with minimum incremental cost helps to increase effective mass EV adoption.
For example, the Chevy Volt battery is expected to lose 10-30% of its capacity within 8
years or 160,000 km, depending on driving habits. The effect of charge/discharge rates
on the batteries cycle life was shown in [8] and thus limiting the peak battery current is
another major controller objective. The following power-mix optimization cost-function
is minimized every second by the controller
fcost = Pbt,loss ·mbt + (Puc,loss + Pconv,loss) ·muc + Pmech,loss, (3.1)
under the following constraints:
0.6 < SOCuc < 1, (3.2)
−216 < Iuc < 216, (3.3)
where Puc,loss = I2ucRuc is the u-cap ESR loss, Pbt,loss = I2btRbt is the battery ESR loss,
Pconv,loss is the load-dependent dc-dc converter loss and Pmech,loss is the mechanical brak-
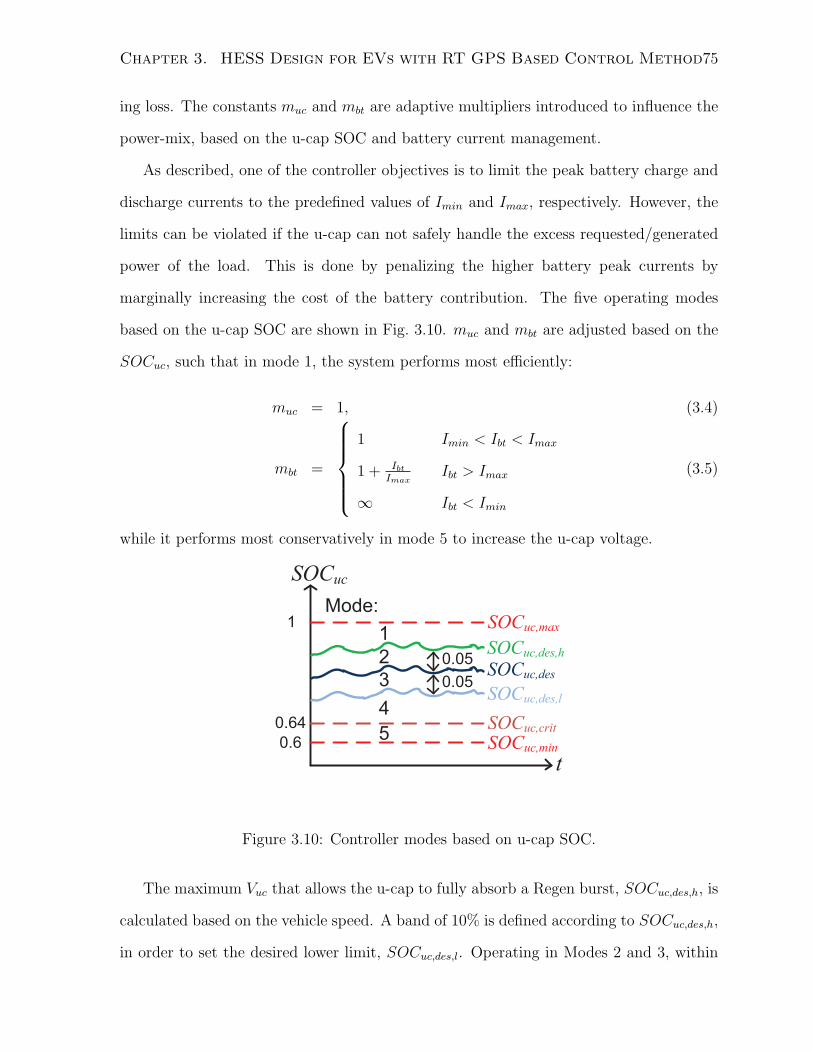
Chapter 3. HESS Design for EVs with RT GPS Based Control Method75
ing loss. The constants muc and mbt are adaptive multipliers introduced to influence the
power-mix, based on the u-cap SOC and battery current management.
As described, one of the controller objectives is to limit the peak battery charge and
discharge currents to the predefined values of Imin and Imax, respectively. However, the
limits can be violated if the u-cap can not safely handle the excess requested/generated
power of the load. This is done by penalizing the higher battery peak currents by
marginally increasing the cost of the battery contribution. The five operating modes
based on the u-cap SOC are shown in Fig. 3.10. muc and mbt are adjusted based on the
SOCuc, such that in mode 1, the system performs most efficiently:
muc = 1, (3.4)
mbt =
1 Imin < Ibt < Imax
1 + IbtImax
Ibt > Imax
∞ Ibt < Imin
(3.5)
while it performs most conservatively in mode 5 to increase the u-cap voltage.
SOCuc
SOCuc,max
tSOCuc,min
SOCuc,crit
SOCuc,des
SOCuc,des,h
SOCuc,des,l0.05
1
0.64
Mode:
1
2
3
4
5
0.05
0.6
Figure 3.10: Controller modes based on u-cap SOC.
The maximum Vuc that allows the u-cap to fully absorb a Regen burst, SOCuc,des,h, is
calculated based on the vehicle speed. A band of 10% is defined according to SOCuc,des,h,
in order to set the desired lower limit, SOCuc,des,l. Operating in Modes 2 and 3, within
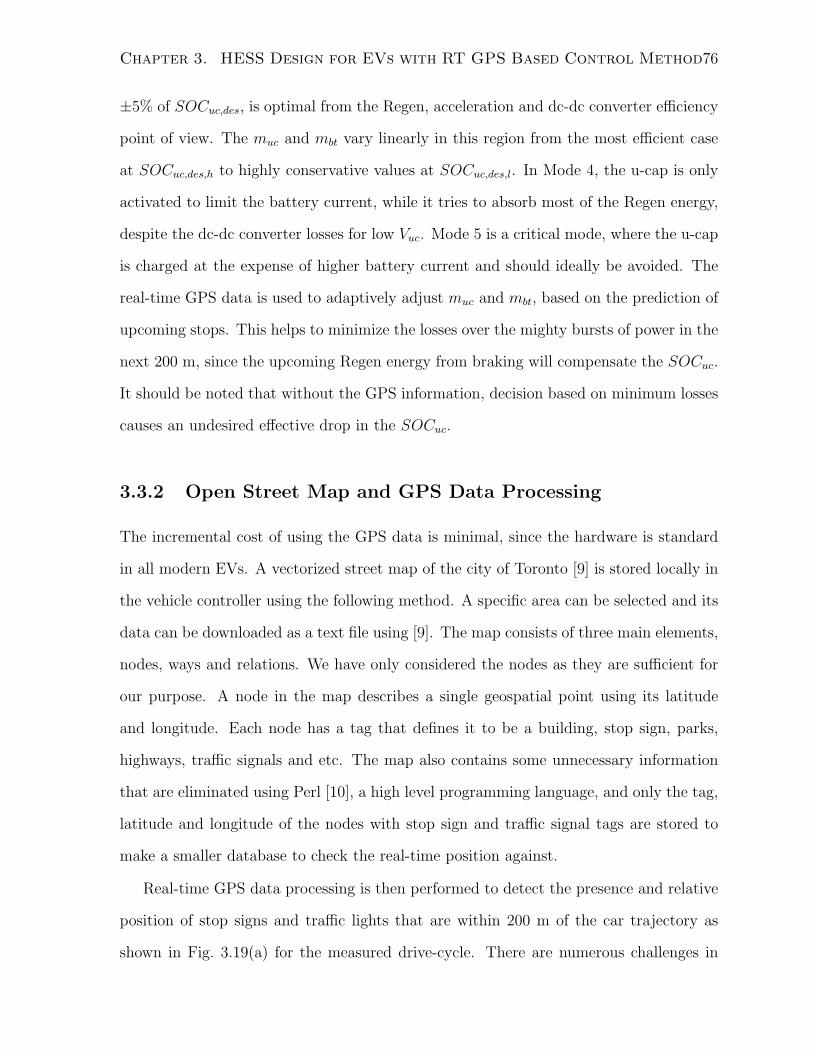
Chapter 3. HESS Design for EVs with RT GPS Based Control Method76
±5% of SOCuc,des, is optimal from the Regen, acceleration and dc-dc converter efficiency
point of view. The muc and mbt vary linearly in this region from the most efficient case
at SOCuc,des,h to highly conservative values at SOCuc,des,l. In Mode 4, the u-cap is only
activated to limit the battery current, while it tries to absorb most of the Regen energy,
despite the dc-dc converter losses for low Vuc. Mode 5 is a critical mode, where the u-cap
is charged at the expense of higher battery current and should ideally be avoided. The
real-time GPS data is used to adaptively adjust muc and mbt, based on the prediction of
upcoming stops. This helps to minimize the losses over the mighty bursts of power in the
next 200 m, since the upcoming Regen energy from braking will compensate the SOCuc.
It should be noted that without the GPS information, decision based on minimum losses
causes an undesired effective drop in the SOCuc.
3.3.2 Open Street Map and GPS Data Processing
The incremental cost of using the GPS data is minimal, since the hardware is standard
in all modern EVs. A vectorized street map of the city of Toronto [9] is stored locally in
the vehicle controller using the following method. A specific area can be selected and its
data can be downloaded as a text file using [9]. The map consists of three main elements,
nodes, ways and relations. We have only considered the nodes as they are sufficient for
our purpose. A node in the map describes a single geospatial point using its latitude
and longitude. Each node has a tag that defines it to be a building, stop sign, parks,
highways, traffic signals and etc. The map also contains some unnecessary information
that are eliminated using Perl [10], a high level programming language, and only the tag,
latitude and longitude of the nodes with stop sign and traffic signal tags are stored to
make a smaller database to check the real-time position against.
Real-time GPS data processing is then performed to detect the presence and relative
position of stop signs and traffic lights that are within 200 m of the car trajectory as
shown in Fig. 3.19(a) for the measured drive-cycle. There are numerous challenges in
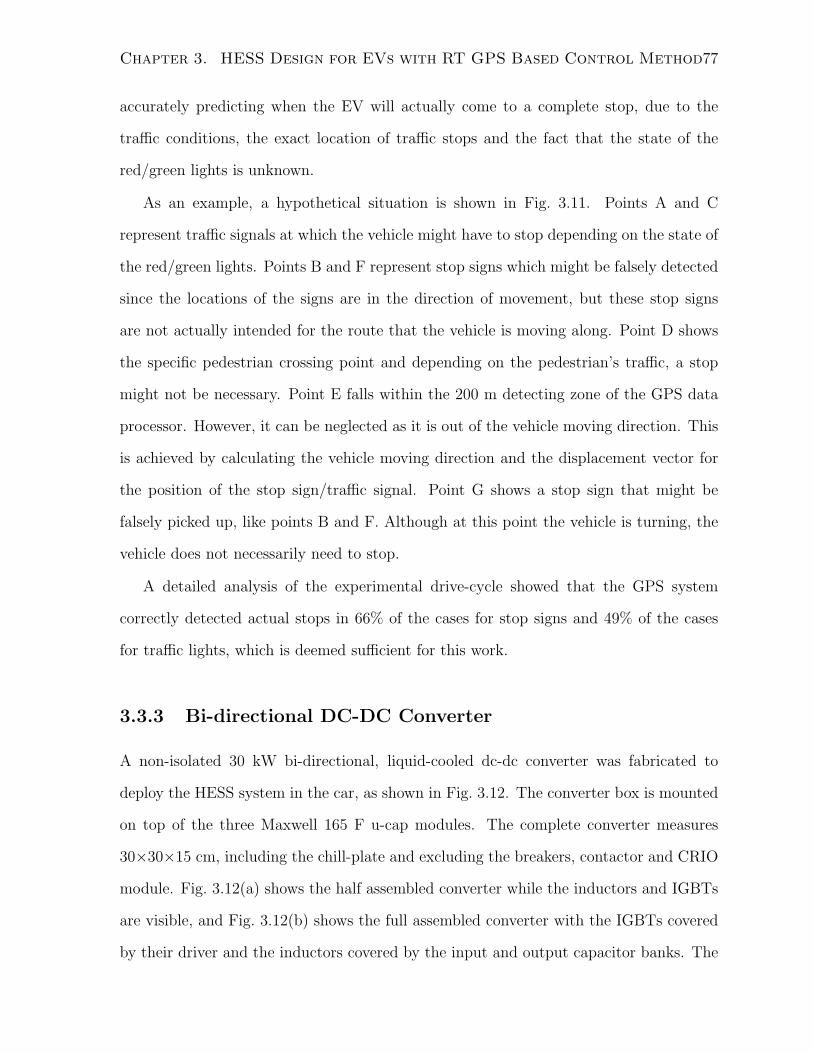
Chapter 3. HESS Design for EVs with RT GPS Based Control Method77
accurately predicting when the EV will actually come to a complete stop, due to the
traffic conditions, the exact location of traffic stops and the fact that the state of the
red/green lights is unknown.
As an example, a hypothetical situation is shown in Fig. 3.11. Points A and C
represent traffic signals at which the vehicle might have to stop depending on the state of
the red/green lights. Points B and F represent stop signs which might be falsely detected
since the locations of the signs are in the direction of movement, but these stop signs
are not actually intended for the route that the vehicle is moving along. Point D shows
the specific pedestrian crossing point and depending on the pedestrian’s traffic, a stop
might not be necessary. Point E falls within the 200 m detecting zone of the GPS data
processor. However, it can be neglected as it is out of the vehicle moving direction. This
is achieved by calculating the vehicle moving direction and the displacement vector for
the position of the stop sign/traffic signal. Point G shows a stop sign that might be
falsely picked up, like points B and F. Although at this point the vehicle is turning, the
vehicle does not necessarily need to stop.
A detailed analysis of the experimental drive-cycle showed that the GPS system
correctly detected actual stops in 66% of the cases for stop signs and 49% of the cases
for traffic lights, which is deemed sufficient for this work.
3.3.3 Bi-directional DC-DC Converter
A non-isolated 30 kW bi-directional, liquid-cooled dc-dc converter was fabricated to
deploy the HESS system in the car, as shown in Fig. 3.12. The converter box is mounted
on top of the three Maxwell 165 F u-cap modules. The complete converter measures
30×30×15 cm, including the chill-plate and excluding the breakers, contactor and CRIO
module. Fig. 3.12(a) shows the half assembled converter while the inductors and IGBTs
are visible, and Fig. 3.12(b) shows the full assembled converter with the IGBTs covered
by their driver and the inductors covered by the input and output capacitor banks. The
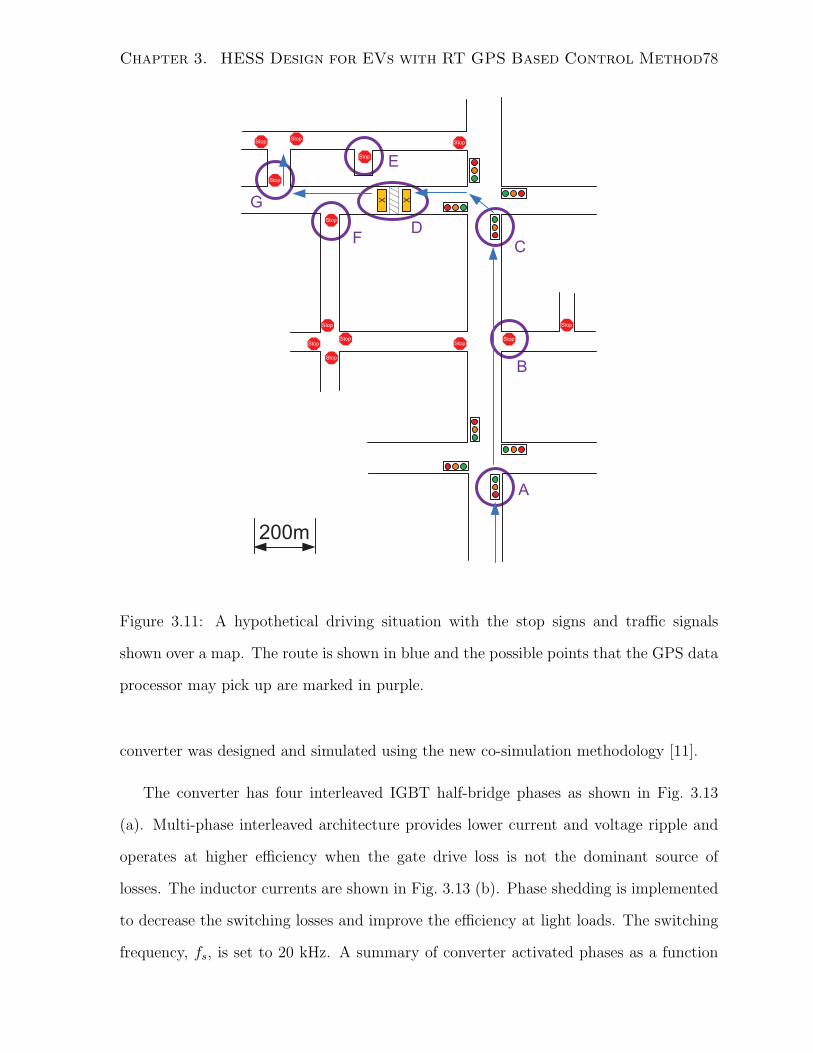
Chapter 3. HESS Design for EVs with RT GPS Based Control Method78
StopStop
Stop
Stop
Stop
Stop
Stop
Stop
Stop
XX
StopStop Stop
Stop
200m
A
B
C
D
E
F
G
Figure 3.11: A hypothetical driving situation with the stop signs and traffic signals
shown over a map. The route is shown in blue and the possible points that the GPS data
processor may pick up are marked in purple.
converter was designed and simulated using the new co-simulation methodology [11].
The converter has four interleaved IGBT half-bridge phases as shown in Fig. 3.13
(a). Multi-phase interleaved architecture provides lower current and voltage ripple and
operates at higher efficiency when the gate drive loss is not the dominant source of
losses. The inductor currents are shown in Fig. 3.13 (b). Phase shedding is implemented
to decrease the switching losses and improve the efficiency at light loads. The switching
frequency, fs, is set to 20 kHz. A summary of converter activated phases as a function
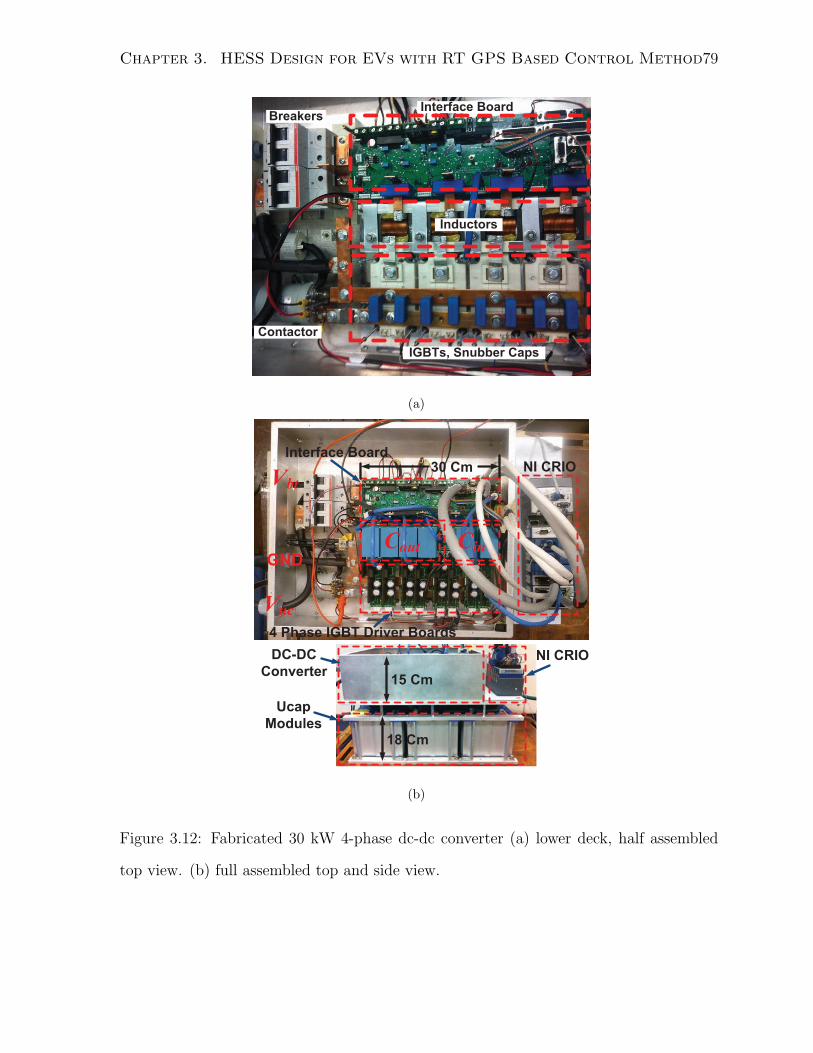
Chapter 3. HESS Design for EVs with RT GPS Based Control Method79
IGBTs, Snubber Caps
Interface Board
Inductors
Contactor
Breakers
(a)
Cin
30 Cm NI CRIO
4 Phase IGBT Driver Boards
Cout
Interface Board
Vbt
Vuc
GND
Ucap
Modules
DC-DC
ConverterNI CRIO
15 Cm
18 Cm
(b)
Figure 3.12: Fabricated 30 kW 4-phase dc-dc converter (a) lower deck, half assembled
top view. (b) full assembled top and side view.
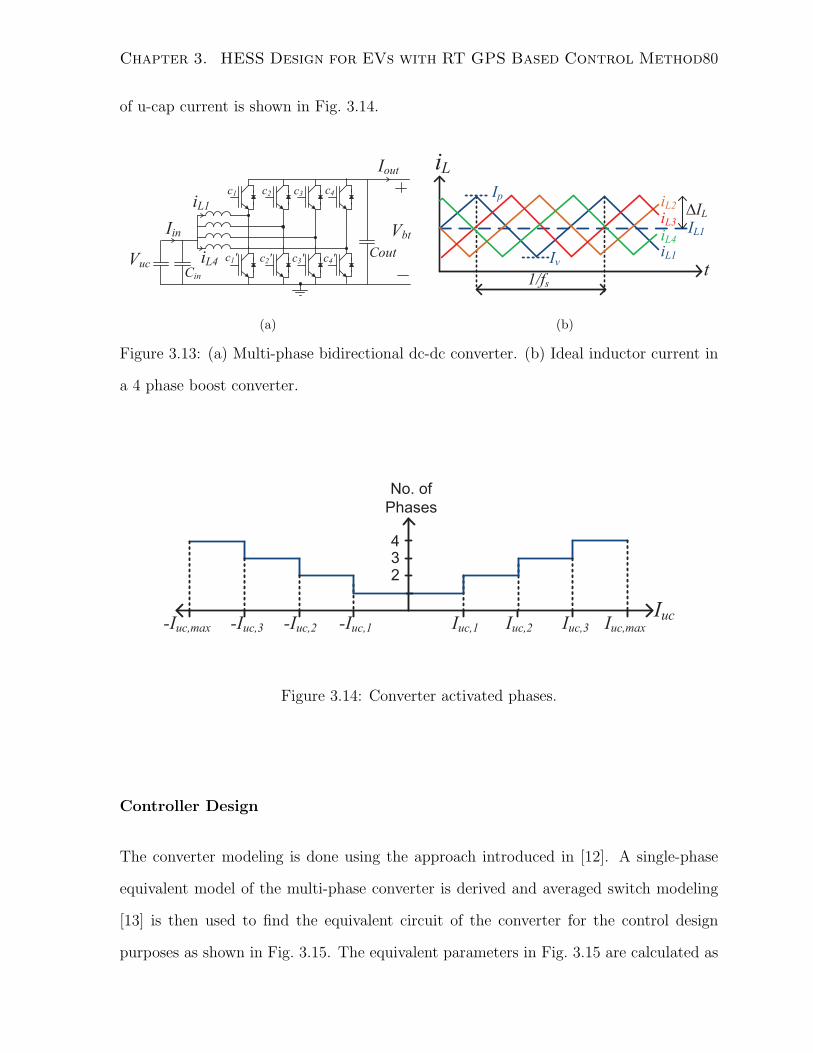
Chapter 3. HESS Design for EVs with RT GPS Based Control Method80
of u-cap current is shown in Fig. 3.14.
Vbt
Vuc
Iout
Iin
Cin
Cout
iL1
iL4
c1
c1'
c2 c3 c4
c2' c3' c4'
(a)
iL
iL1
IL1
1/fst
Ip
Iv
∆IL
iL4
iL3
iL2
(b)
Figure 3.13: (a) Multi-phase bidirectional dc-dc converter. (b) Ideal inductor current in
a 4 phase boost converter.
Iuc
No. of
Phases
Iuc,3Iuc,1 Iuc,2 Iuc,max-Iuc,1-Iuc,max -Iuc,3 -Iuc,2
4
3
2
Figure 3.14: Converter activated phases.
Controller Design
The converter modeling is done using the approach introduced in [12]. A single-phase
equivalent model of the multi-phase converter is derived and averaged switch modeling
[13] is then used to find the equivalent circuit of the converter for the control design
purposes as shown in Fig. 3.15. The equivalent parameters in Fig. 3.15 are calculated as
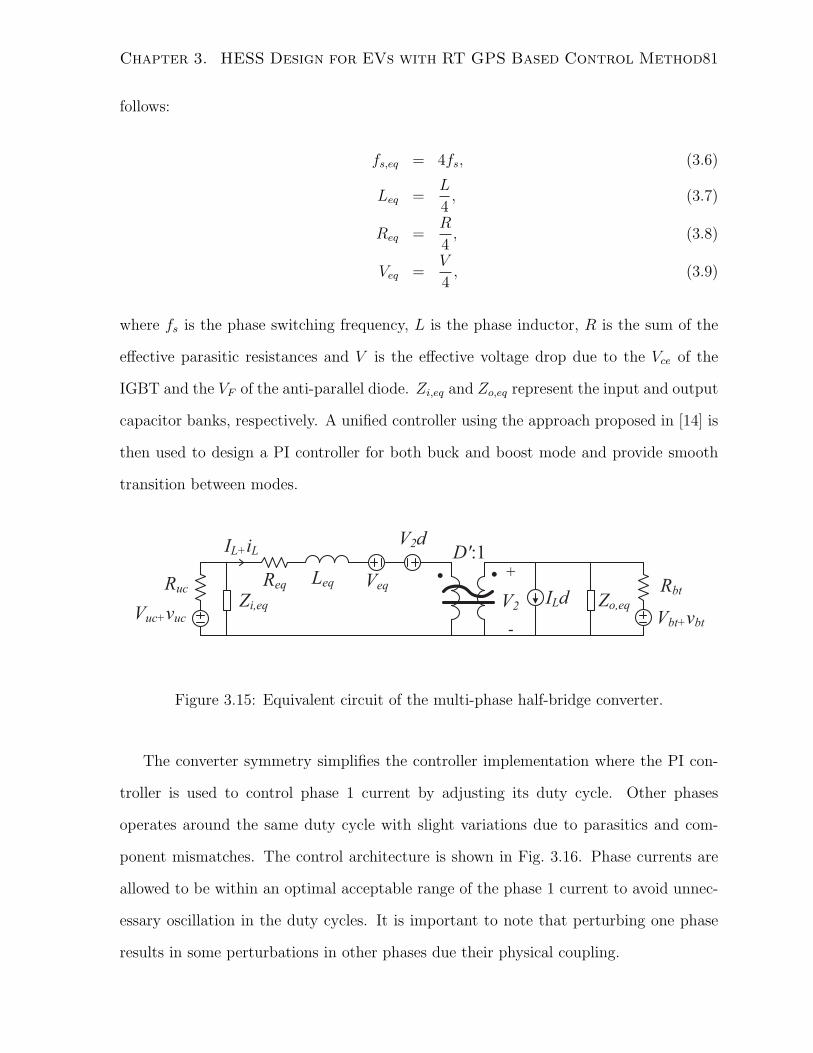
Chapter 3. HESS Design for EVs with RT GPS Based Control Method81
follows:
fs,eq = 4fs, (3.6)
Leq =L
4, (3.7)
Req =R
4, (3.8)
Veq =V
4, (3.9)
where fs is the phase switching frequency, L is the phase inductor, R is the sum of the
effective parasitic resistances and V is the effective voltage drop due to the Vce of the
IGBT and the VF of the anti-parallel diode. Zi,eq and Zo,eq represent the input and output
capacitor banks, respectively. A unified controller using the approach proposed in [14] is
then used to design a PI controller for both buck and boost mode and provide smooth
transition between modes.
Leq. .
Ruc ReqZi,eq Zo,eq
Rbt
D':1
Vuc+vuc
IL+iL
Veq
V2d
ILdV2
+
-Vbt+vbt
Figure 3.15: Equivalent circuit of the multi-phase half-bridge converter.
The converter symmetry simplifies the controller implementation where the PI con-
troller is used to control phase 1 current by adjusting its duty cycle. Other phases
operates around the same duty cycle with slight variations due to parasitics and com-
ponent mismatches. The control architecture is shown in Fig. 3.16. Phase currents are
allowed to be within an optimal acceptable range of the phase 1 current to avoid unnec-
essary oscillation in the duty cycles. It is important to note that perturbing one phase
results in some perturbations in other phases due their physical coupling.
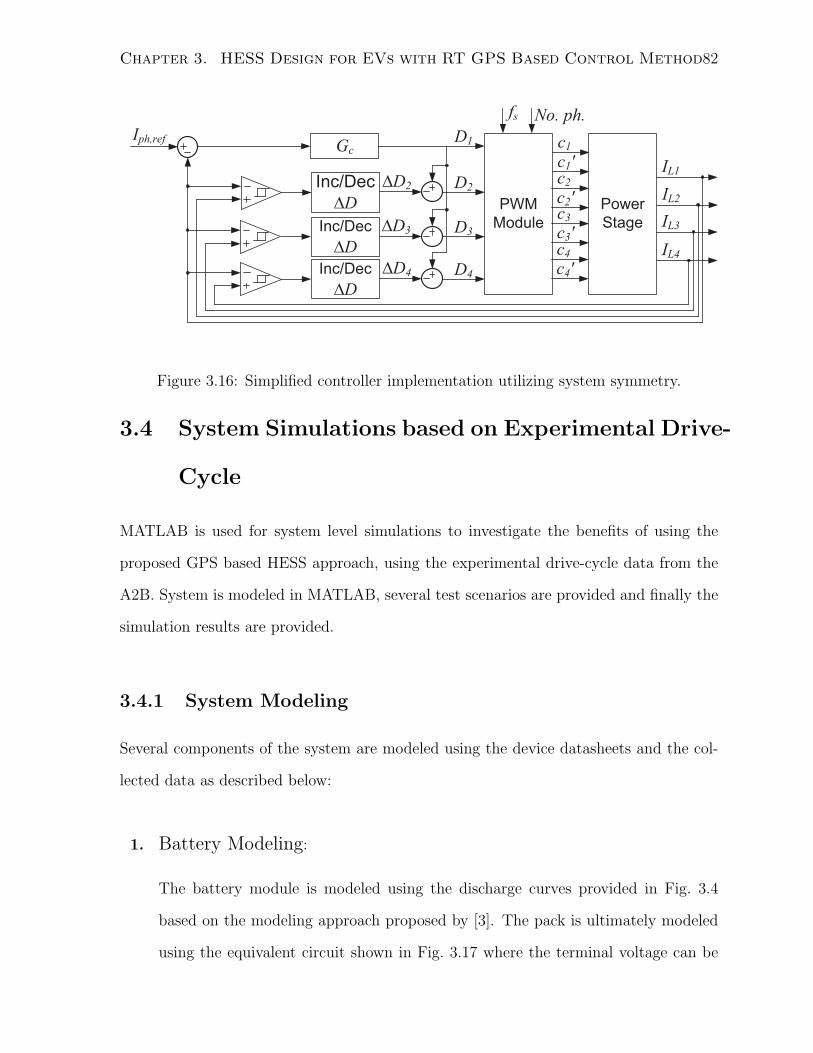
Chapter 3. HESS Design for EVs with RT GPS Based Control Method82
c1c1'
GcIph,ref
Inc/Dec
∆D
Inc/Dec
∆D
Inc/Dec
∆D
PWM
Module
∆D2 D2
D3
∆D4 D4
∆D3
D1
Power
Stage
c2c2'c3c3'c4c4'
IL1
IL2
IL3
IL4
fs No. ph.
Figure 3.16: Simplified controller implementation utilizing system symmetry.
3.4 System Simulations based on Experimental Drive-
Cycle
MATLAB is used for system level simulations to investigate the benefits of using the
proposed GPS based HESS approach, using the experimental drive-cycle data from the
A2B. System is modeled in MATLAB, several test scenarios are provided and finally the
simulation results are provided.
3.4.1 System Modeling
Several components of the system are modeled using the device datasheets and the col-
lected data as described below:
1. Battery Modeling:
The battery module is modeled using the discharge curves provided in Fig. 3.4
based on the modeling approach proposed by [3]. The pack is ultimately modeled
using the equivalent circuit shown in Fig. 3.17 where the terminal voltage can be

Chapter 3. HESS Design for EVs with RT GPS Based Control Method83
found using:
Vbt = Vbti −Rbt · Ibt, (3.10)
Vbti = E0 −K · Q
Q−∫ t
0Ibt dτ
+ A · e−B·∫ t0 Ibt dτ , (3.11)
where Rbt is the battery ESR, E0 is the battery constant voltage (V), Q is the
battery capacity (Ah), K is the polarisation voltage (V), A is the exponential zone
amplitude (V) and B is the exponential zone time constant inverse (Ah−1).
Rbt
Ibt
Vbti
+
-
Vbt
+
-
Figure 3.17: Utilized battery model.
2. U-cap Modeling:
The u-cap bank is modeled by the equivalent circuit shown in Fig. 3.18 consists
of an ideal capacitor in series with an equivalent resistance. The u-cap terminal
voltage can be calculated using:
Vuc = Vuci −Ruc · Iuc, (3.12)
Vuci = Vuci,0 −1
Cuc
∫ t
0
Iuc dτ, (3.13)
where Ruc is the u-cap ESR.
3. DC-DC Converter Modeling:
The converter is modeled to obtain the losses associated with its operation. Con-
duction losses and switching losses are considered and the gate drive losses are

Chapter 3. HESS Design for EVs with RT GPS Based Control Method84
Ruc
Iuc
Vuci
+
-
Vuc
+
-
Figure 3.18: Utilized u-cap model.
neglected for such high power converter. Switching losses including the IGBT
turn-on, turn-off losses and the diode reverse recovery losses are modeled using the
IGBT module’s datasheet. The model is derived based on the number of activated
phases, as shown in Fig. 3.14.
4. Vehicle Modeling:
Since Regen is disabled in the vehicle, a vehicle mechanical model has to be estab-
lished in order to generate the negative torque data associated with the braking.
The net force is given by
−−→Fnet =
−−→Facc +
−→FF +
−→FD, (3.14)
where−−→Facc is the needed force for acceleration,
−→FF is the rolling friction resistance
and−→FD is the drag resistance. The acceleration force can be calculated using
Facc = m · dνdt
, (3.15)
where m is the vehicle’s mass and ν is the vehicle speed. Rolling friction force is
modeled by:
FF = Crr ·N, (3.16)
where Crr is the dimensionless rolling resistance coefficient and N is the normal
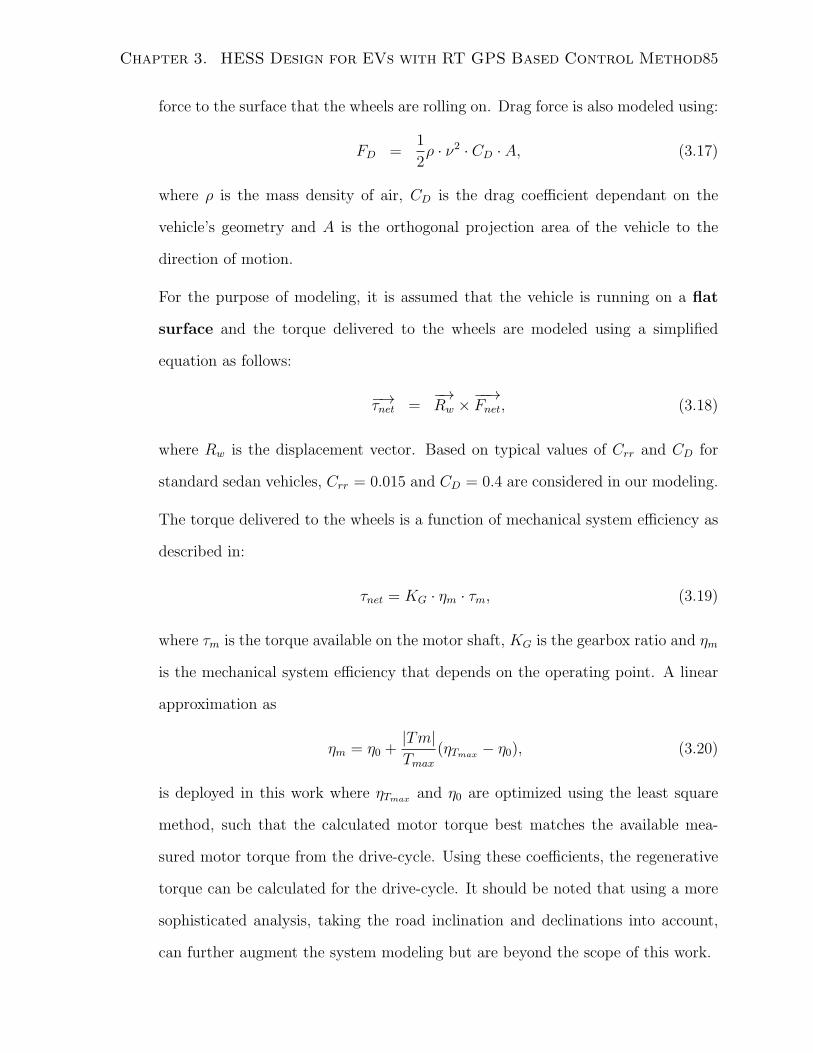
Chapter 3. HESS Design for EVs with RT GPS Based Control Method85
force to the surface that the wheels are rolling on. Drag force is also modeled using:
FD =1
2ρ · ν2 · CD · A, (3.17)
where ρ is the mass density of air, CD is the drag coefficient dependant on the
vehicle’s geometry and A is the orthogonal projection area of the vehicle to the
direction of motion.
For the purpose of modeling, it is assumed that the vehicle is running on a flat
surface and the torque delivered to the wheels are modeled using a simplified
equation as follows:
−→τnet =−→Rw ×
−−→Fnet, (3.18)
where Rw is the displacement vector. Based on typical values of Crr and CD for
standard sedan vehicles, Crr = 0.015 and CD = 0.4 are considered in our modeling.
The torque delivered to the wheels is a function of mechanical system efficiency as
described in:
τnet = KG · ηm · τm, (3.19)
where τm is the torque available on the motor shaft, KG is the gearbox ratio and ηm
is the mechanical system efficiency that depends on the operating point. A linear
approximation as
ηm = η0 +|Tm|Tmax
(ηTmax − η0), (3.20)
is deployed in this work where ηTmax and η0 are optimized using the least square
method, such that the calculated motor torque best matches the available mea-
sured motor torque from the drive-cycle. Using these coefficients, the regenerative
torque can be calculated for the drive-cycle. It should be noted that using a more
sophisticated analysis, taking the road inclination and declinations into account,
can further augment the system modeling but are beyond the scope of this work.

Chapter 3. HESS Design for EVs with RT GPS Based Control Method86
Now that we have the motor speed and motor torque, the load current can be
calculate using the efficiency data of the drivetrain by:
Ibt =Pe
Vbt
, (3.21)
Pe =Pm
ηD, (3.22)
where:
Pm = τ · ω, (3.23)
ηD = f(τ, ω). (3.24)
3.4.2 Simulation Procedure and Test Scenarios
Now that both the electrical and mechanical systems are modeled, the benefits of the
HESS based EVs compared to the conventional SESS based EVs can be exploited. Several
test scenarios are considered for simulations, as described below:
1. SESS with No Regen:
This case is similar to the experimental drive-cycle measurement and is used as
a reference. A comparison between the simulation result of this case versus the
experimental results verifies the accuracy of system modelings.
2. SESS with -0.25 C < Ibt:
This scenario represent a vehicle with Regen capability. However the battery is
unable to absorb all the Regen energy due to its limited charging current that
is set with respect to battery lifetime considerations. In those cases, all Regen
energy for which -0.25 C < Ibt is returned to the electrical system, while the rest
is dissipated in the mechanical brakes.
Chapter 3. HESS Design for EVs with RT GPS Based Control Method87
3. SESS with No Limits:
Similar to the previous case, with a battery capable of absorbing the Regen energy
at higher charging rates.
4. HESS without GPS Data Processing:
This scenario utilizes the HESS with the vehicle Regen enabled. The battery charg-
ing current is limited to -0.25 C and therefore having a u-cap with enough room for
the charge helps to recover more energy. The battery discharge current is unlimited,
but the power optimizer tries to limit battery discharge current to 0.75 C. This
limit can be violated if the u-cap SOC is too low and the u-cap is not capable of
handling the load demand with the limited battery current. This feature maintains
the user experience of the EV while provides improved battery lifetime. The u-cap
is targeted to operate within 0.6 < SOCuc < 1.
5. HESS with GPS Data Processing:
The final studied scenario is similar to the previous case with the GPS data being fed
to the power optimizer where mbt and muc are adjusted according to the prediction
of stop signs and traffic signals.
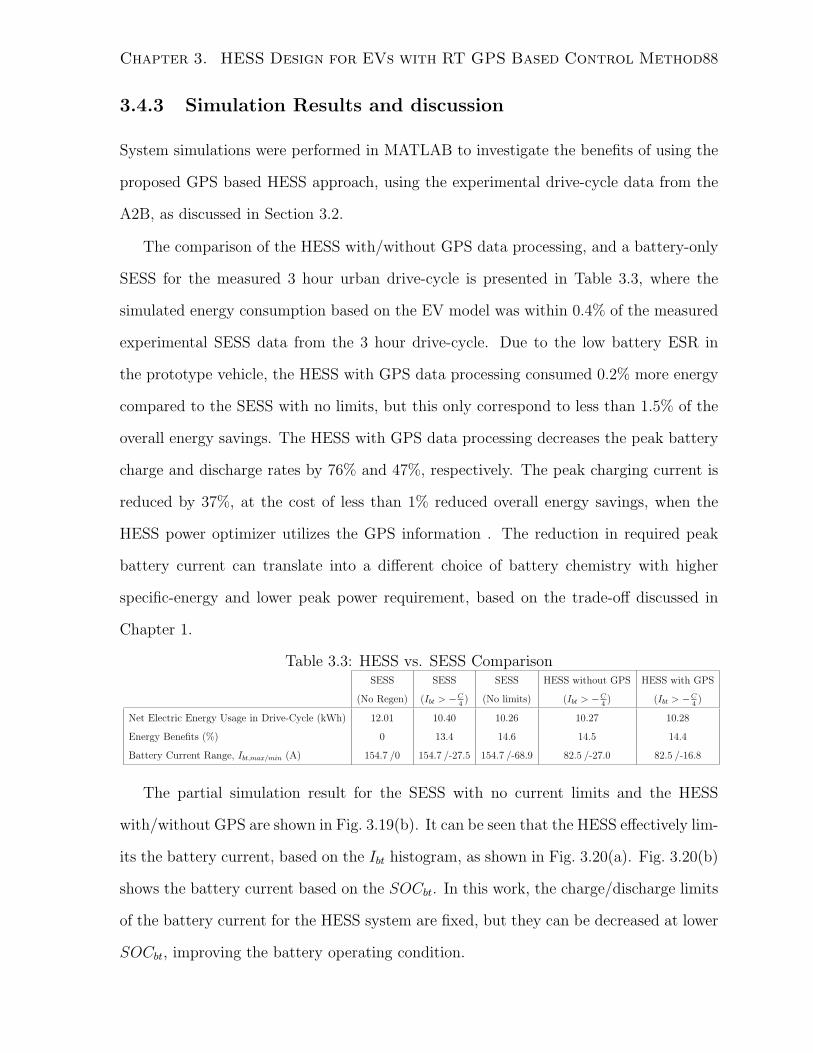
Chapter 3. HESS Design for EVs with RT GPS Based Control Method88
3.4.3 Simulation Results and discussion
System simulations were performed in MATLAB to investigate the benefits of using the
proposed GPS based HESS approach, using the experimental drive-cycle data from the
A2B, as discussed in Section 3.2.
The comparison of the HESS with/without GPS data processing, and a battery-only
SESS for the measured 3 hour urban drive-cycle is presented in Table 3.3, where the
simulated energy consumption based on the EV model was within 0.4% of the measured
experimental SESS data from the 3 hour drive-cycle. Due to the low battery ESR in
the prototype vehicle, the HESS with GPS data processing consumed 0.2% more energy
compared to the SESS with no limits, but this only correspond to less than 1.5% of the
overall energy savings. The HESS with GPS data processing decreases the peak battery
charge and discharge rates by 76% and 47%, respectively. The peak charging current is
reduced by 37%, at the cost of less than 1% reduced overall energy savings, when the
HESS power optimizer utilizes the GPS information . The reduction in required peak
battery current can translate into a different choice of battery chemistry with higher
specific-energy and lower peak power requirement, based on the trade-off discussed in
Chapter 1.
Table 3.3: HESS vs. SESS ComparisonSESS SESS SESS HESS without GPS HESS with GPS
(No Regen) (Ibt > −C4) (No limits) (Ibt > −C
4) (Ibt > −C
4)
Net Electric Energy Usage in Drive-Cycle (kWh) 12.01 10.40 10.26 10.27 10.28
Energy Benefits (%) 0 13.4 14.6 14.5 14.4
Battery Current Range, Ibt,max/min (A) 154.7 /0 154.7 /-27.5 154.7 /-68.9 82.5 /-27.0 82.5 /-16.8
The partial simulation result for the SESS with no current limits and the HESS
with/without GPS are shown in Fig. 3.19(b). It can be seen that the HESS effectively lim-
its the battery current, based on the Ibt histogram, as shown in Fig. 3.20(a). Fig. 3.20(b)
shows the battery current based on the SOCbt. In this work, the charge/discharge limits
of the battery current for the HESS system are fixed, but they can be decreased at lower
SOCbt, improving the battery operating condition.
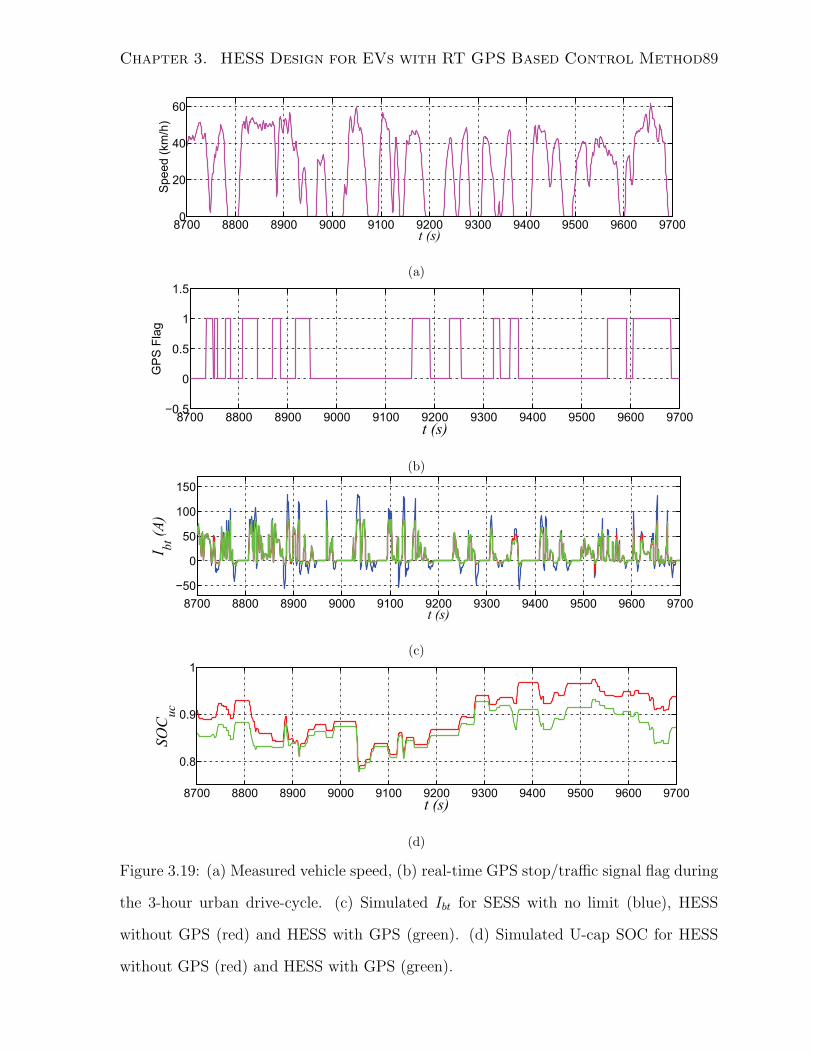
Chapter 3. HESS Design for EVs with RT GPS Based Control Method89
8700 8800 8900 9000 9100 9200 9300 9400 9500 9600 97000
20
40
60
t (s)
Speed (
km
/h)
(a)
8700 8800 8900 9000 9100 9200 9300 9400 9500 9600 9700−0.5
0
0.5
1
1.5
t (s)
GP
S F
lag
(b)
8700 8800 8900 9000 9100 9200 9300 9400 9500 9600 9700
−50
0
50
100
150
t (s)
I bt (
A)
(c)
8700 8800 8900 9000 9100 9200 9300 9400 9500 9600 9700
0.8
0.9
1
t (s)
SO
Cuc
(d)
Figure 3.19: (a) Measured vehicle speed, (b) real-time GPS stop/traffic signal flag during
the 3-hour urban drive-cycle. (c) Simulated Ibt for SESS with no limit (blue), HESS
without GPS (red) and HESS with GPS (green). (d) Simulated U-cap SOC for HESS
without GPS (red) and HESS with GPS (green).
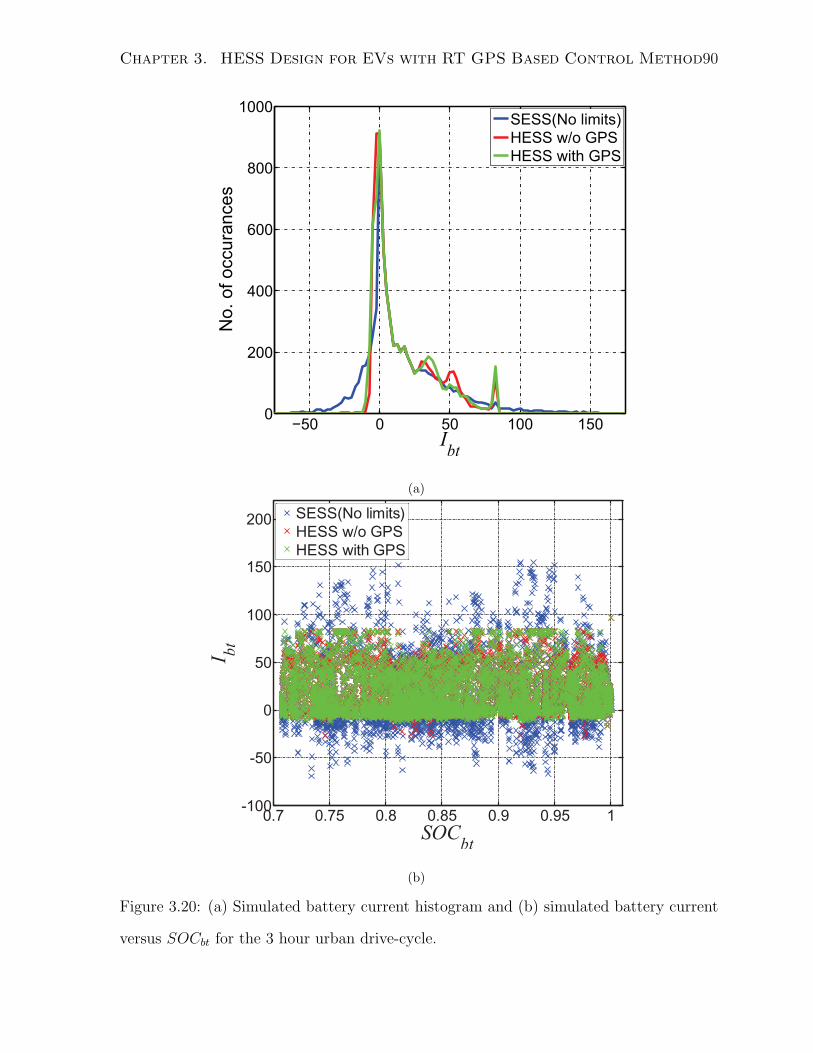
Chapter 3. HESS Design for EVs with RT GPS Based Control Method90
−50 0 50 100 1500
200
400
600
800
1000
Ibt
No.
of
occura
nces
SESS(No limits)
HESS w/o GPS
HESS with GPS
(a)
0.7 0.75 0.8 0.85 0.9 0.95 1-100
-50
0
50
100
150
200
SOCbt
I bt
SESS(No limits)
HESS w/o GPS
HESS with GPS
(b)
Figure 3.20: (a) Simulated battery current histogram and (b) simulated battery current
versus SOCbt for the 3 hour urban drive-cycle.
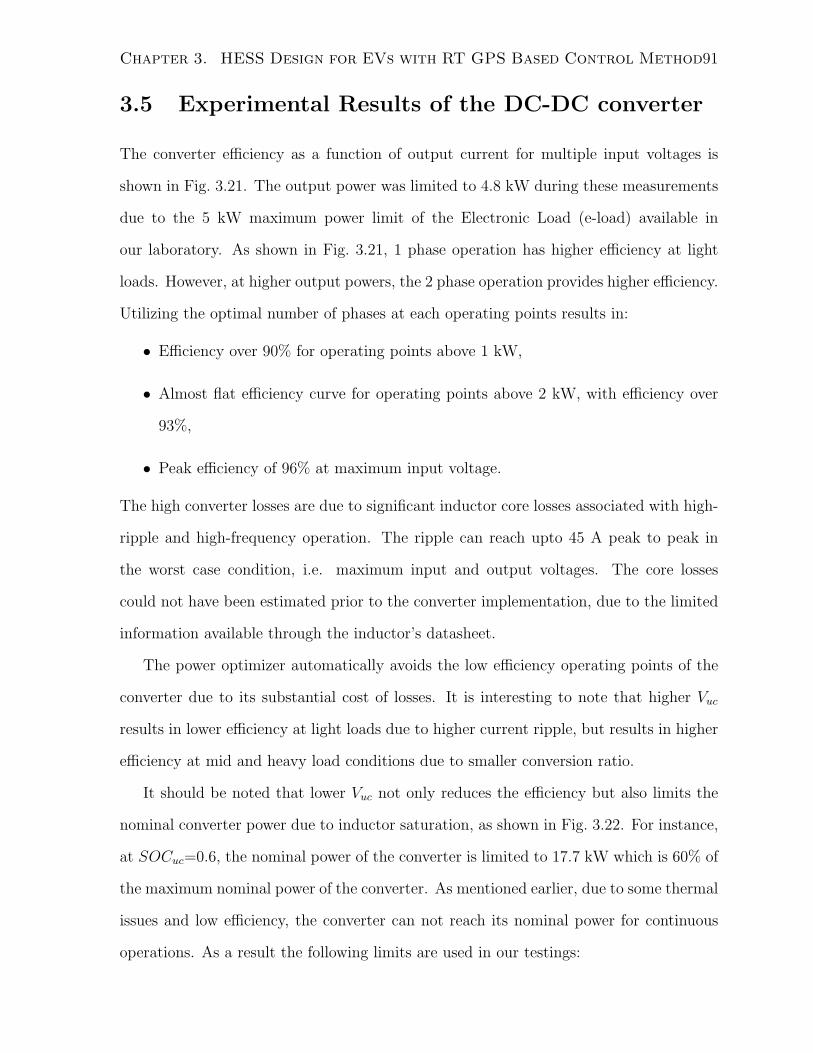
Chapter 3. HESS Design for EVs with RT GPS Based Control Method91
3.5 Experimental Results of the DC-DC converter
The converter efficiency as a function of output current for multiple input voltages is
shown in Fig. 3.21. The output power was limited to 4.8 kW during these measurements
due to the 5 kW maximum power limit of the Electronic Load (e-load) available in
our laboratory. As shown in Fig. 3.21, 1 phase operation has higher efficiency at light
loads. However, at higher output powers, the 2 phase operation provides higher efficiency.
Utilizing the optimal number of phases at each operating points results in:
• Efficiency over 90% for operating points above 1 kW,
• Almost flat efficiency curve for operating points above 2 kW, with efficiency over
93%,
• Peak efficiency of 96% at maximum input voltage.
The high converter losses are due to significant inductor core losses associated with high-
ripple and high-frequency operation. The ripple can reach upto 45 A peak to peak in
the worst case condition, i.e. maximum input and output voltages. The core losses
could not have been estimated prior to the converter implementation, due to the limited
information available through the inductor’s datasheet.
The power optimizer automatically avoids the low efficiency operating points of the
converter due to its substantial cost of losses. It is interesting to note that higher Vuc
results in lower efficiency at light loads due to higher current ripple, but results in higher
efficiency at mid and heavy load conditions due to smaller conversion ratio.
It should be noted that lower Vuc not only reduces the efficiency but also limits the
nominal converter power due to inductor saturation, as shown in Fig. 3.22. For instance,
at SOCuc=0.6, the nominal power of the converter is limited to 17.7 kW which is 60% of
the maximum nominal power of the converter. As mentioned earlier, due to some thermal
issues and low efficiency, the converter can not reach its nominal power for continuous
operations. As a result the following limits are used in our testings:
Chapter 3. HESS Design for EVs with RT GPS Based Control Method92
0 2 4 6 8 10 12 14 1660
65
70
75
80
85
90
95
100
Iout
(A)
Eff
icie
ncy (
%)
Vuc
=140, 1 phase
Vuc
=115, 1 phase
Vuc
=90, 1 phase
Vuc
=140, 2 phase
Vuc
=115, 2 phase
Vuc
=90, 2 phase
Figure 3.21: Measured converter efficiency at Vbt = 300 V with different Vuc.
• At Vuc=90V, the converter can achieve 2.25 kW (9 kW) output power per phase
(total) for continuous operation, while it can safely operate at the maximum current
with 4.86 kW (19.4 kW) output power per phase (total) for 1 minute.
• At Vuc=140V, the converter can only achieve 1 kW (4 kW) output power per phase
(total) for continuous operation.
The measured u-cap voltage and current based on a sequence of u-cap current com-
mands for an emulated drive-cycle are shown in Fig. 3.23, where time steps of 10 seconds
are chosen to provide visible Vuc excursion.
The measured converter step response based on a sequence of u-cap current commands
for an emulated drive-cycle is shown in Fig. 3.24. Steps are applied every 250 ms to clearly
show the details of the step response in the bi-directional operation. The converter
has a 70 ms settling time, and the response is over-damped to avoid saturation in the
inductors. The measured u-cap current is shown in Fig. 3.24(a), while Fig. 3.24(b) shows
the averaged inductor current logged using the CRIO.
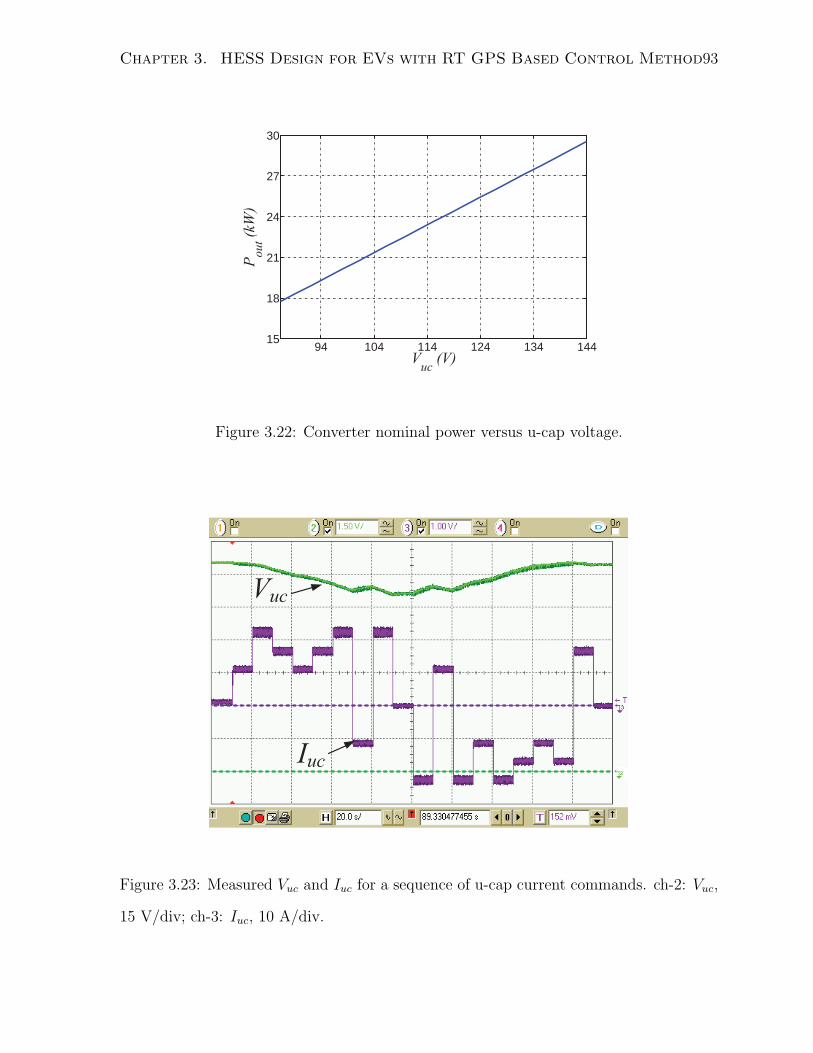
Chapter 3. HESS Design for EVs with RT GPS Based Control Method93
94 104 114 124 134 14415
18
21
24
27
30
Vuc
(V)
Po
ut (
kW)
Figure 3.22: Converter nominal power versus u-cap voltage.
Vuc
Iuc
Figure 3.23: Measured Vuc and Iuc for a sequence of u-cap current commands. ch-2: Vuc,
15 V/div; ch-3: Iuc, 10 A/div.
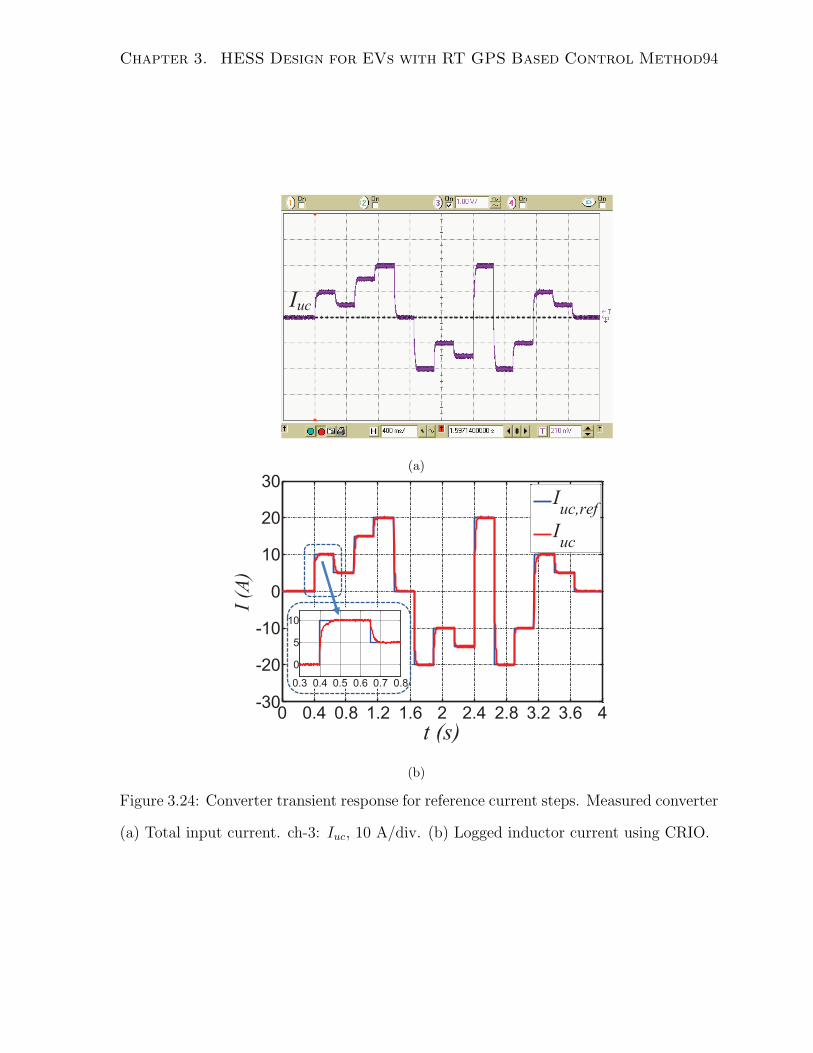
Chapter 3. HESS Design for EVs with RT GPS Based Control Method94
Iuc
(a)
0 0.4 0.8 1.2 1.6 2 2.4 2.8 3.2 3.6 4-30
-20
-10
0
10
20
30
t (s)
I (A
)
Iuc,ref
Iuc
0.3 0.4 0.5 0.6 0.7 0.8
0
5
10
t (s)
I (A
)
(b)
Figure 3.24: Converter transient response for reference current steps. Measured converter
(a) Total input current. ch-3: Iuc, 10 A/div. (b) Logged inductor current using CRIO.
Chapter 3. HESS Design for EVs with RT GPS Based Control Method95
3.6 Chapter Summary and Conclusions
In this Chapter, an HESS with a power-mix optimizer, that utilizes the real-time GPS
data for load distribution decisions, is developed. The full system modeling of the A2B
and the proposed HESS has been developed to provide a powerful tool for system simu-
lations. The benefits of introducing the GPS data processing in the power-mix optimizer
of the HESS for the A2B was then investigated. It is shown that utilizing the GPS data
in the power optimizer can reduce the battery charging peak current by 37%, without
significantly compromising the system efficiency and without substantially increasing the
cost, since the GPS is already available in the EV. The main advantage of the HESS
aside from increasing the battery lifetime by reducing the peak currents, is to allow the
use of batteries optimized for high specific-energy, while the peak power demands are
met by the u-cap.
The 30 kW bi-directional dc-dc converter used in the HESS was tested and lab ex-
perimental result of the converter shows stable closed-loop response in the presence of
reference steps. The converter has an over-damped characteristics with a 70 ms settling
time for steps in the reference current. The converter efficiency is greater than 93% for
load powers higher than 2 kW. The high converter losses are due to significant inductor
core losses associated with the high-ripple and high-frequency operation. Due to some
thermal management issues related with the core of the inductors, we were unable to test
the converter at the full power, which is 7.5 kW per phase. Therefore, the presently used
inductors need to be replaced with new parts suitable for high ripple, high frequency
operations. The integration of the proposed HESS in the A2B for further verification of
the proposed method are considered for future work.
References
[1] “Project Eve.” Available at http://www.projecteve.ca/.
[2] “U-charge xp lithium iron magnesium phosphate battery.” Va-
lence Technology, datasheet. Accessed in July 2012, available at
http://www.valence.com/products/data-sheets.
[3] O. Tremblay, L. Dessaint, and A. Dekkiche, “A generic battery model for the dy-
namic simulation of hybrid electric vehicles,” in Proceedings of IEEE Vehicle Power
and Propulsion Conference, VPPC, pp. 284–289, 2007.
[4] “TM4 MΦtive A-Electric Powerterain.” TM4 Electrodynamic Systems. Accessed in
July 2012, available at http://www.tm4.com/en/home.aspx.
[5] Google Maps. Accessed in August 2012, available at https://maps.google.com/.
[6] “Chevrolet volt brochur.” General Motors. Accessed in July 2012, available at
https://www.gm.ca/gm/english/vehicles/chevrolet/volt/brochures.
[7] O. Laldin, M. Moshirvaziri, and O. Trescases, “Optimal power flow for hybrid ultra-
capacitor systems in light electric vehicles,” in IEEE Energy Conversion Congress
and Exposition, ECCE, pp. 2916 –2922, Sept. 2011.
[8] G. Ning, B. Haran, and B. N. Popov, “Capcity fade study of lithium-ion batteries
cycled at high discharge rates,” Journal of Power Sources, vol. 117, pp. 160–169,
May 2003.
96
REFERENCES 97
[9] “Map data © OpenStreetMap contributors, CC BY-SA,” June 2012. Available
at http://www.openstreetmap.org/, and http://creativecommons.org/licenses/by-
sa/2.0/.
[10] The Perl Programming Language. Accessed in August 2012, available at
http://www.perl.org/.
[11] “Power Electronics Development Center.” National Instruments, 2012. available at
http://www.ni.com/powerdev.
[12] P.-L. Wong, Performance Improvements of Multi-Channel Interleaving Voltage Reg-
ulator Modules with Integrated Coupling Inductors. PhD thesis, Virginia Polytechnic
Institute and State University, USA, 2001.
[13] R. W. Erickson and D. Maksimovic’, Fundamentals of Power Electronics, 2nd Ed.
Kluwer Academic Publishers., 2001.
[14] J. Zhang, J.-S. Lai, and W. Yu, “Bidirectional dc-dc converter modeling and uni-
fied controller with digital implementation,” in Twenty-Third Annual IEEE Applied
Power Electronics Conference and Exposition, APEC, pp. 1747 –1753, Feb. 2008.

Chapter 4
Conclusions
4.1 Thesis Summary and Contributions
The focus of this work is to address one of the main challenges in the mass adoption of
EVs, namely implementing low-cost, high energy and high power-density storage system
that performs reliably for 10-15 years. The ultracapacitor/battery based HESS benefits
in LEVs and EVs are investigated and further improved in this thesis.
In Chapter 2, a digitally controlled bi-directional half-bridge converter is designed
specifically to meet the requirements of the battery interfacing dc-dc converter of a LEV
based HESS. This architecture was used for its low cost and high efficiency specifically
when operated with soft-switching. The novel contributions of this chapter include:
• Demonstrating the concept of variable-frequency quasi-resonant operation to main-
tain a constant dead-time and a near constant inductor valley current in the mid-
load range,
• Showing the superior efficiency of the VFQR scheme compared to the FFQR oper-
ation,
• Improving the dead-time adjustment accuracy with the dead-time extension tech-
98

Chapter 4. Conclusions 99
nique, using the proposed auxiliary circuit without significantly deteriorating the
efficiency,
• Combining fixed frequency and PFM operating modes with the VFQR mode to
obtain a tri-mode bi-directional converter that operates with high efficiency over a
wide load range.
The prototype converter achieves the measured peak efficiency of 97.5% and maintains
the efficiency of 88% over the full load range. The benefits of VFQR mode over the FFQR
mode are shown with efficiency measurements and infrared images. Measured dead-times
are effectively doubled, using the proposed scheme at the heavy load conditions during
VFQR mode, to provide dead-time adjustment accuracy.
Chapter 3 is devoted to a HESS design for a Canadian prototype EV, known as A2B.
The novel contributions of this chapter include:
• Proposing the concept of utilizing real-time GPS data processing in the power-
mix optimizer. The current location of the vehicle is processed to obtain some
information about upcoming stop signs and traffic signals based on a preloaded
map of a city.
• Proposing a computationally simple power-mix optimizer, that utilizes the real-
time GPS data. The proposed scheme adjusts the cost function multipliers based
on the GPS information. This simplified control architecture can be done on a
reasonably sized target processor. In this project an 800 MHz processor inside a
9025 CompactRIO (CRIO) module is used.
The following verification steps are also covered in this chapter:
• Full system model of the vehicle including the mechanical and electrical subsystems
are derived to provide a base for the system level simulations,
Chapter 4. Conclusions 100
• System level simulations are provided for different scenarios to investigate the ben-
efits of the proposed approach,
• A bi-directional dc-dc converter is designed and implemented to integrate the HESS
into the A2B and verify the simulation results with experimental measurements.
System level simulations shows that utilizing the GPS data can further reduce the bat-
tery charging peak current without significantly compromising the system efficiency and
without substantially increasing the cost, since the GPS is already available in the EV.
The HESS with GPS data processing reduces the peak battery charge and discharge
rates by 76% and 47% compared to the SESS with no limits, respectively. However, due
to the low battery ESR in the A2B, the energy saving with the SESS with no limits
exceeds that of the HESS with GPS data processing by 0.2%. It should be noted that,
this difference is less than 1.5% of the overall energy savings. The HESS with GPS data
processing also reduces the peak battery charging current by 37% compared to the HESS
design without the GPS data processing.
The half-bridge architecture is used for the 30 kW bi-directional dc-dc converter of
the proposed HESS. This architecture was chosen due to its low cost and high efficiency.
Four phase interleaved topology with phase shedding is utilized to provide high efficiency
over a wide load range. Lab experimental results of the converter shows stable closed-
loop response in the presence of reference steps. The converter shows an over-damped
characteristics and a 70 ms settling time for steps in the reference current. Bi-directional
operation of the converter was tested using the u-cap modules clearly showing the charge
and discharge events. The present converter design faces a thermal issue in the inductors,
due to the significant core losses which could not have been estimated with the limited
datasheet information prior to the implementation. The inductors need to be replaced
with new parts, with high-ripple high-frequency capabilities, prior to integration of the
HESS into the A2B.
Chapter 4. Conclusions 101
As discussed in chapter 1, there is a trade-off between the specific-energy and specific-
power within the battery technologies. Therefore, the main advantage of the HESS
presented in Chapter 3, aside from increasing the battery lifetime by reducing the peak
currents, is to allow the use of batteries optimized for high specific-energy, while the peak
power demands are met by the u-cap.
The research work presented in Chapter 2 is published as a conference publication [1],
while the content of Chapter 3 has been submitted for future publication [2].
4.2 Future Work
Based on the presented research work in this thesis, the following suggestions are provided
for further explorations:
• The dead-time extension technique using the proposed auxiliary circuit can be
applied to other quasi-resonant converter topologies. The trade-off between the in-
creased ZVS accuracy versus efficiency reduction should be studied in these topolo-
gies.
• Altitude information of the GPS data can be used for determining the road inclina-
tion and declinations and therefore providing a better load calculations. However,
this can further complicate the calculations that should be done in real-time.
• Real-time GPS data processing can be used in conjunction with more complex
power-mix optimizers, such as the one proposed in our prior work [3]. The GPS
data can be used to adjust the probability of the pathes and enhance the overall
prediction accuracy and system performance.
• Experimentally quantifying the capacity fade of batteries subjected to different
dynamic current profiles can be done to further estimate the long term benefits of
the HESS.

Chapter 4. Conclusions 102
• The research work presented in Chapter 3, needs to be completed by integrating
the designed HESS into the A2B and verifying the results of the simulations.
References
[1] M. Moshirvaziri, C. Li, and O. Trescases, “A quasi-resonant bi-directional tri-mode
dc-dc converter with limited valley current,” in Twenty-Seventh Annual IEEE Applied
Power Electronics Conference and Exposition (APEC), pp. 517 –523, Feb. 2012.
[2] M. Moshirvaziri, A. Moshirvaziri, C. Malherbe, and O. Trescases, “Ultracapaci-
tor/battery hybrid energy storage system integration into a 180 km range electric
vehicle with real-time gps based power-mix optimization,” in Twenty-Eighth Annual
IEEE Applied Power Electronics Conference and Exposition (APEC), Mar. 2013 (sub-
mitted).
[3] O. Laldin, M. Moshirvaziri, and O. Trescases, “Optimal power flow for hybrid ultra-
capacitor systems in light electric vehicles,” in IEEE Energy Conversion Congress
and Exposition, ECCE, pp. 2916 –2922, Sept. 2011.
103