uk trading & value indicator 20120423
TRANSCRIPT
8/2/2019 uk trading & value indicator 20120423
http://slidepdf.com/reader/full/uk-trading-value-indicator-20120423 1/15
23 April 2012
8/2/2019 uk trading & value indicator 20120423
http://slidepdf.com/reader/full/uk-trading-value-indicator-20120423 2/15
Intellisys www.intellisys.uk.com 23 April 2012
Page 2 of 15 ©Intellisys 23 April 2012
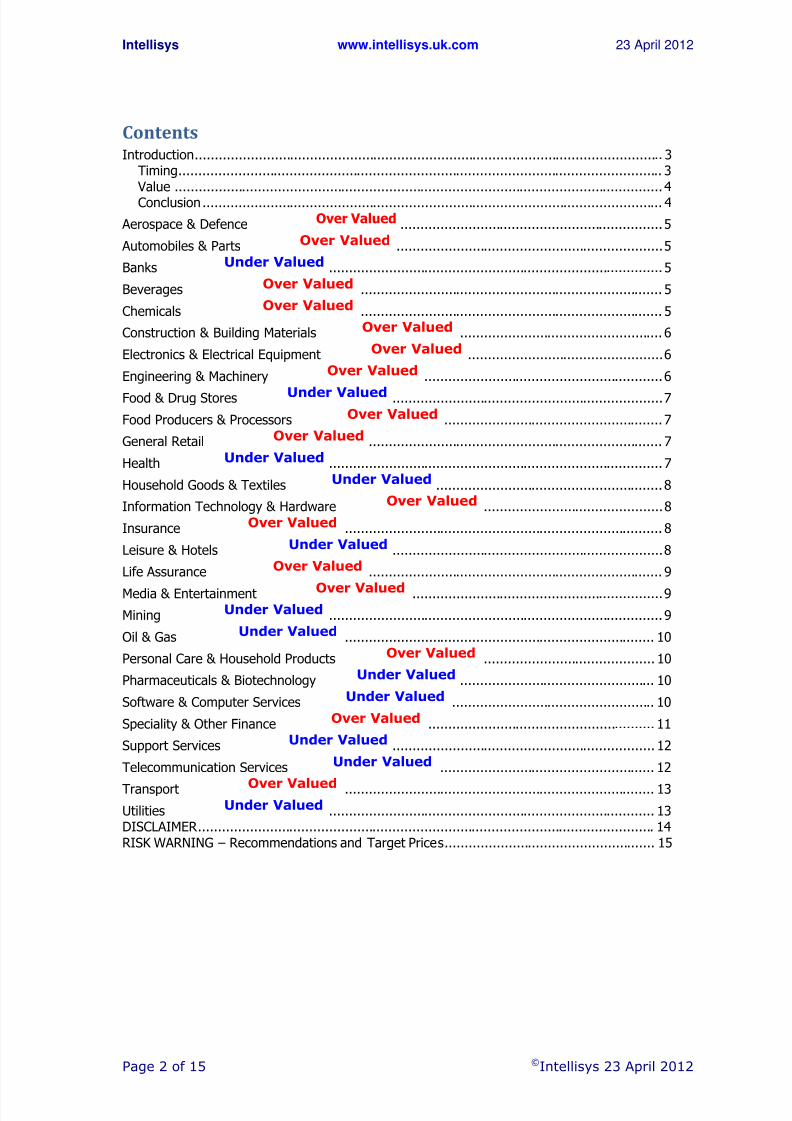
Contents
Introduction ...................................................................................................................... 3 Timing .......................................................................................................................... 3
Value ........................................................................................................................... 4 Conclusion .................................................................................................................... 4
Aerospace & Defence Over Valued .................................................................. 5 Automobiles & Parts Over Valued ................................................................... 5 Banks Under Valued .................................................................................... 5 Beverages Over Valued ............................................................................ 5 Chemicals Over Valued ............................................................................ 5 Construction & Building Materials Over Valued ................................................... 6 Electronics & Electrical Equipment Over Valued ................................................. 6 Engineering & Machinery Over Valued ............................................................ 6 Food & Drug Stores Under Valued .................................................................... 7 Food Producers & Processors Over Valued ....................................................... 7 General Retail Over Valued .......................................................................... 7 Health Under Valued .................................................................................... 7 Household Goods & Textiles Under Valued ......................................................... 8 Information Technology & Hardware Over Valued ............................................. 8 Insurance Over Valued ................................................................................ 8 Leisure & Hotels Under Valued .................................................................... 8 Life Assurance Over Valued .......................................................................... 9 Media & Entertainment Over Valued ............................................................... 9 Mining Under Valued .................................................................................... 9 Oil & Gas Under Valued .............................................................................. 10 Personal Care & Household Products Over Valued ........................................... 10 Pharmaceuticals & Biotechnology Under Valued ................................................. 10 Software & Computer Services Under Valued ................................................... 10 Speciality & Other Finance Over Valued ......................................................... 11 Support Services Under Valued .................................................................. 12 Telecommunication Services Under Valued ...................................................... 12 Transport Over Valued .............................................................................. 13 Utilities Under Valued .................................................................................. 13 DISCLAIMER ................................................................................................................... 14 RISK WARNING – Recommendations and Target Prices ..................................................... 15

8/2/2019 uk trading & value indicator 20120423
http://slidepdf.com/reader/full/uk-trading-value-indicator-20120423 3/15
Intellisys www.intellisys.uk.com 23 April 2012
Page 3 of 15 ©Intellisys 23 April 2012
Introduction
The overriding purpose of this daily report is to provide users with a quick guide that willidentify those shares that merit their investment attention in an increasingly time critical andinformation noisy trading environment.
The report is published daily and delivered to the subscriber’s personal email box, typically,
before the official open of the London Stock Markets.
Putting aside luck, Intellisys recognises that the timing and value of an investment are thetwo primary drivers behind a successful portfolio performance.
Timing
Intellisys has invested considerably in identifying what it believes are the key factors thatinfluence investment timing. Having identified the key parameters, these have beenestablished as rules that reflect market dynamics and cut through the daily investment noise.
Through this discipline, Intellisys has removed the emotional and sentimental factors as wellas the daily pressures exerted upon primary stock promoters (analysts and traders) to findstories for their investment meetings.
From an analysis of a year’s data for 40 stocks within Intellisys’ stock coverage, the tradingindicators appear to be, on average, about 77% accurate in identifying good trading points aswell as some 74% accurate for overall trend correlation.
The following chart provides an indication the accuracy scores for each of the 40 stocksanalysed.
Individual Stock Recommendation & Trend Accuracy Scores
Source: Intellisys
20.0%
30.0%
40.0%
50.0%
60.0%
70.0%
80.0%
90.0%
100.0%
110.0%
120.0%
1 2 3 4 5 6 7 8 9 10 11 12 13 14 15 16 17 18 19 20 21 22 23 24 25 26 27 28 29 30 31 32 33 34 35 36 37 38 39 40
20.0%
30.0%
40.0%
50.0%
60.0%
70.0%
80.0%
90.0%
100.0%
110.0%
120.0%
Best Buy/Sell Trend
8/2/2019 uk trading & value indicator 20120423
http://slidepdf.com/reader/full/uk-trading-value-indicator-20120423 4/15
Intellisys www.intellisys.uk.com 23 April 2012
Page 4 of 15 ©Intellisys 23 April 2012
Value
A similar discipline has been applied to the process of establishing ‘Target Prices’. On a dailybasis, Intellisys analyses as broad an array of historic data from not only the Profit & Loss
Account but also the Balance Sheet and Cash flow Statement and then utilises this datawithin its proprietary valuation models.
Intellisys’ architect, Philip Morrish, has successfully applied these disciplines to his investmentresearch for the last 15+ years. Additionally, these investment valuation techniques lendthemselves to accurate cross-border analysis.
The resultant ‘Target’ is also discounted to a Net Present Value to make the ‘Target’ asrealistically valid as possible.
Nevertheless, Intellisys recognises that ‘Target Price’ delivery is not only a function of marketlevels but a management team’s ability to establish and maintain a value generatingoperating environment set against a constantly changing global background.
The typical investment analyst’s approach to determining ‘target prices’ is to start with a
modest range of some 6 – 10 valuation measures and remove those that are not providingthe ‘intuitive’ result. Intellysis’ approach is the opposite we use as many valuationmethodologies as possible.
Further, Intellisys recognises that some target prices may appear strange or extreme.However, subscribers should not dismiss these outcomes but use them as starting points tochallenge their established or perceived valuation opinion of a stock.
In short, this disciplined approach provides an investment reality check to assist investorsfrom ‘falling in love’ with a stock or becoming mesmerised by ‘management cults’.
Conclusion
No investment methodology is 100% successful and like all trading and investment systemsactive position monitoring is critical for maximised investment performance.
Therefore, Intellisys recommends that its products should be used in conjunction with, andnot separate from subscriber’s existing investment systems as well as discussing investmentoptions with their financial advisers.
Philip Morrish ([email protected])
RISK WARNING – Recommendations and Target Prices
Intellisys does not make personal recommendations. The information in this publication isprovided solely to enable you to make your own investment decisions.
If you are unsure about dealing in shares and other equity investments, you should contactyour financial adviser as these types of investments may not be suitable for everyone.
The value of stocks and shares, and the income from them, can fall as well as rise and youmay not get back the full amount you originally invested. If denominated in a foreigncurrency, fluctuations in the exchange rate will also affect the value of stocks and shares andthe income from them. Past performance is not necessarily a guide to future performance.
8/2/2019 uk trading & value indicator 20120423
http://slidepdf.com/reader/full/uk-trading-value-indicator-20120423 5/15
Intellisys www.intellisys.uk.com 23 April 2012
Page 5 of 15 ©Intellisys 23 April 2012
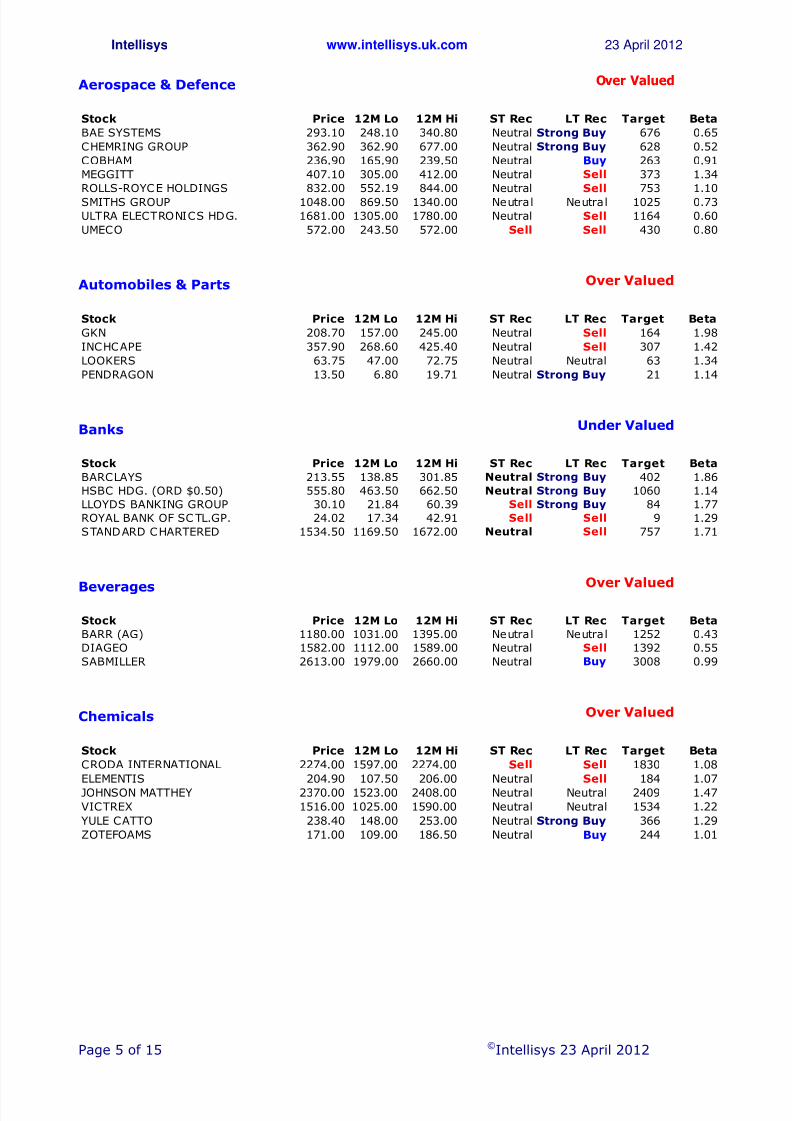
Aerospace & Defence Over Valued
Stock Price 12M Lo 12M Hi ST Rec LT Rec Target Beta
BAE SYSTEMS 293.10 248.10 340.80 Neutral Strong Buy 676 0.65
CHEMRING GROUP 362.90 362.90 677.00 Neutral Strong Buy 628 0.52
COBHAM 236.90 165.90 239.50 Neutral Buy 263 0.91
MEGGITT 407.10 305.00 412.00 Neutral Sell 373 1.34
ROLLS-ROYCE HOLDINGS 832.00 552.19 844.00 Neutral Sell 753 1.10
SMITHS GROUP 1048.00 869.50 1340.00 Neutral Neutral 1025 0.73
ULTRA ELECTRONICS HDG. 1681.00 1305.00 1780.00 Neutral Sell 1164 0.60
UMECO 572.00 243.50 572.00 Sell Sell 430 0.80
Automobiles & Parts Over Valued
Stock Price 12M Lo 12M Hi ST Rec LT Rec Target Beta
GKN 208.70 157.00 245.00 Neutral Sell 164 1.98
INCHCAPE 357.90 268.60 425.40 Neutral Sell 307 1.42
LOOKERS 63.75 47.00 72.75 Neutral Neutral 63 1.34
PENDRAGON 13.50 6.80 19.71 Neutral Strong Buy 21 1.14
Banks Under Valued
Stock Price 12M Lo 12M Hi ST Rec LT Rec Target Beta
BARCLAYS 213.55 138.85 301.85 Neutral Strong Buy 402 1.86
HSBC HDG. (ORD $0.50) 555.80 463.50 662.50 Neutral Strong Buy 1060 1.14
LLOYDS BANKING GROUP 30.10 21.84 60.39 Sell Strong Buy 84 1.77
ROYAL BANK OF SC TL.GP. 24.02 17.34 42.91 Sell Sell 9 1.29
STANDARD CHARTERED 1534.50 1169.50 1672.00 Neutral Sell 757 1.71
Beverages Over Valued
Stock Price 12M Lo 12M Hi ST Rec LT Rec Target Beta
BARR (AG) 1180.00 1031.00 1395.00 Neutral Neutral 1252 0.43
DIAGEO 1582.00 1112.00 1589.00 Neutral Sell 1392 0.55
SABMILLER 2613.00 1979.00 2660.00 Neutral Buy 3008 0.99
Chemicals Over Valued
Stock Price 12M Lo 12M Hi ST Rec LT Rec Target Beta
CRODA INTERNATIONAL 2274.00 1597.00 2274.00 Sell Sell 1830 1.08
ELEMENTIS 204.90 107.50 206.00 Neutral Sell 184 1.07
JOHNSON MATTHEY 2370.00 1523.00 2408.00 Neutral Neutral 2409 1.47
VICTREX 1516.00 1025.00 1590.00 Neutral Neutral 1534 1.22
YULE CATTO 238.40 148.00 253.00 Neutral Strong Buy 366 1.29
ZOTEFOAMS 171.00 109.00 186.50 Neutral Buy 244 1.01

8/2/2019 uk trading & value indicator 20120423
http://slidepdf.com/reader/full/uk-trading-value-indicator-20120423 6/15
Intellisys www.intellisys.uk.com 23 April 2012
Page 6 of 15 ©Intellisys 23 April 2012
Construction & Building Materials Over Valued
Stock Price 12M Lo 12M Hi ST Rec LT Rec Target Beta
BALFOUR BEATTY 268.60 214.60 333.70 Neutral Buy 318 0.84
BARRATT DEVELOPMENTS 130.80 67.50 151.50 Neutral Sell 69 1.45
BELLWAY 784.50 540.50 859.50 Neutral Sell 689 1.01
BERKELEY GROUP HDG.(THE) 1259.00 1025.00 1414.00 Buy Neutral 1288 0.68
BOVIS HOMES GROUP 468.90 326.50 518.50 Neutral Sell 212 1.07
CARILLION 272.20 272.20 403.20 Neutral Buy 378 1.09
CLARKE (T) 48.38 35.50 98.25 Neutral Strong Buy 203 0.80
COSTAIN GROUP 214.00 180.00 247.50 Neutral Strong Buy 782 0.56
GALLIFORD TRY 625.00 383.75 630.00 Neutral Sell 578 1.05
KELLER 434.00 239.25 671.50 Neutral Neutral 446 1.32
KIER GROUP 1151.00 1095.00 1489.00 Neutral Strong Buy 3206 1.04
LOW & BONAR 60.13 38.00 76.75 Neutral Strong Buy 146 1.11
MARSHALLS 97.50 83.25 124.50 Neutral Sell 71 1.35
MORGAN SINDALL GROUP 680.00 510.00 725.00 Neutral Strong Buy 1493 0.89
PERSIMMON 641.00 374.00 706.50 Neutral Neutral 627 1.10
REDROW 122.50 103.50 135.30 Neutral Sell 89 0.97
SIG 108.70 76.95 153.50 Neutral Sell 10 1.59
TAYLOR WIMPEY 49.89 28.71 52.75 Neutral Sell 13 1.50
TRAVIS PERKINS 1059.00 715.00 1125.00 Neutral Neutral 1100 1.89
WOLSELEY 2382.00 1404.00 2558.00 Neutral Sell 1814 1.44
Electronics & Electrical Equipment Over Valued
Stock Price 12M Lo 12M Hi ST Rec LT Rec Target Beta
DIALIGHT 1095.00 643.50 1095.00 Sell Sell 477 0.76
DOMINO PRINTING SCIENCES 610.00 434.30 701.50 Neutral Buy 739 1.18
E2V TECHNOLOGIES 141.00 86.75 146.50 Neutral Buy 165 1.35
INVENSYS 191.40 180.90 340.60 Neutral Strong Buy 405 1.47
LAIRD 216.10 128.50 222.00 Neutral Sell 197 2.17
OXFORD INSTRUMENTS 1285.00 714.00 1285.00 Neutral Sell 861 0.99
RENISHAW 1454.00 800.00 1886.00 Neutral Buy 2035 1.29
SPECTRIS 1840.00 1039.00 1857.00 Neutral Sell 1278 1.43
BIOME TECHNOLOGIES 0.19 0.14 0.28 Neutral Strong Buy 0 0.64
TT ELECTRONICS 179.00 120.50 208.00 Neutral Buy 254 1.60
XAAR 233.00 212.00 295.00 Neutral Sell 131 1.13
Engineering & Machinery Over Valued
Stock Price 12M Lo 12M Hi ST Rec LT Rec Target Beta
AGA RANGEMASTER GROUP 81.00 62.50 124.00 Neutral Strong Buy 263 1.32
BODYCOTE 415.20 225.60 426.50 Neutral Sell 318 1.59
CASTINGS 290.00 252.50 358.00 Neutral Strong Buy 481 0.98
COOKSON GROUP 738.00 395.80 747.50 Neutral Sell 688 2.29FENNER 448.00 280.00 483.70 Neutral Sell 424 1.41
HALMA 406.50 306.30 429.60 Sell Sell 346 0.76
HILL & SMITH 313.50 235.00 393.50 Neutral Strong Buy 540 1.41
IMI 992.00 636.50 1119.00 Neutral Buy 1308 1.40
METALRAX GROUP 8.00 7.25 12.00 Neutral Sell 4 0.86
MORGAN CRUCIBLE 328.90 224.00 360.00 Neutral Sell 312 1.77
ROTORK 2220.00 1501.00 2220.00 Neutral Sell 1722 0.99
SENIOR 202.00 135.60 204.80 Neutral Buy 223 1.77
SEVERFIELD-ROWEN 175.50 150.00 250.00 Neutral Sell 147 1.07
SPIRAX-SARCO 2300.00 1649.00 2300.00 Sell Sell 2141 0.85
VITEC GROUP 647.00 488.00 690.00 Neutral Neutral 672 1.52
WEIR GROUP 1700.00 1375.00 2236.00 Neutral Sell 1493 1.39
8/2/2019 uk trading & value indicator 20120423
http://slidepdf.com/reader/full/uk-trading-value-indicator-20120423 7/15
Intellisys www.intellisys.uk.com 23 April 2012
Page 7 of 15 ©Intellisys 23 April 2012
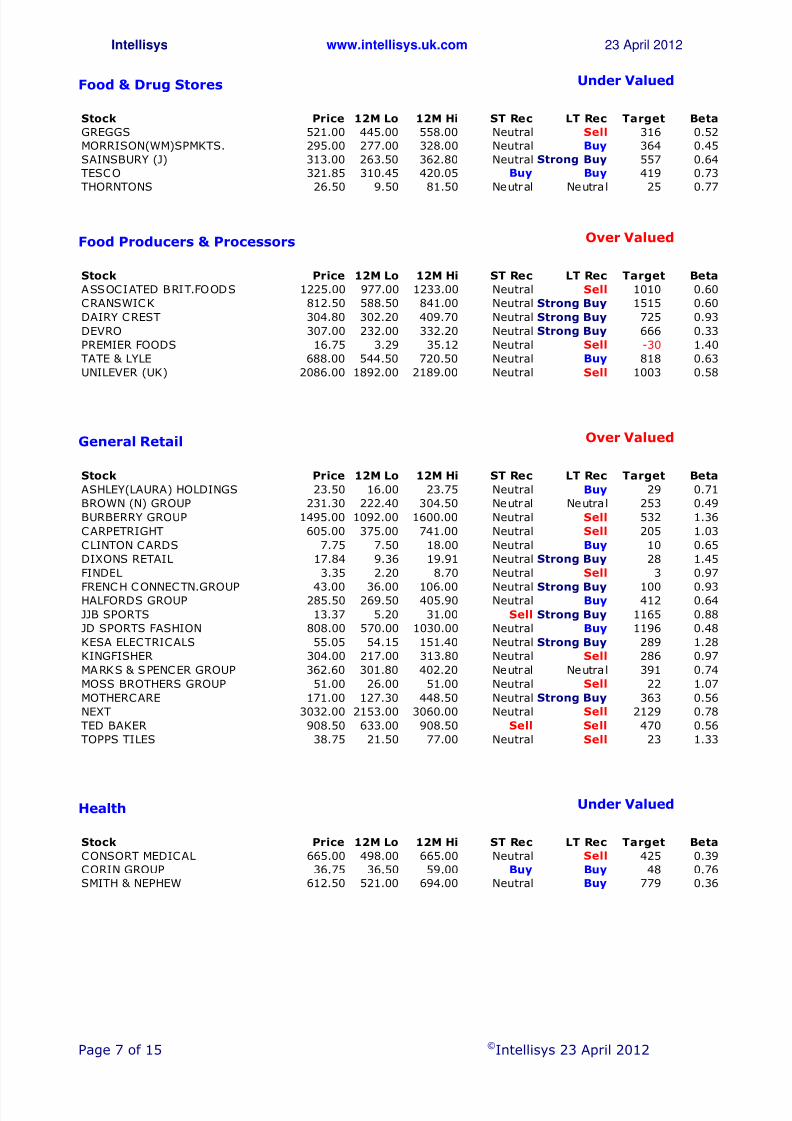
Food & Drug Stores Under Valued
Stock Price 12M Lo 12M Hi ST Rec LT Rec Target Beta
GREGGS 521.00 445.00 558.00 Neutral Sell 316 0.52
MORRISON(WM)SPMKTS. 295.00 277.00 328.00 Neutral Buy 364 0.45
SAINSBURY (J) 313.00 263.50 362.80 Neutral Strong Buy 557 0.64
TESCO 321.85 310.45 420.05 Buy Buy 419 0.73
THORNTONS 26.50 9.50 81.50 Neutral Neutral 25 0.77
Food Producers & Processors Over Valued
Stock Price 12M Lo 12M Hi ST Rec LT Rec Target Beta
ASSOCIATED BRIT.FOODS 1225.00 977.00 1233.00 Neutral Sell 1010 0.60
CRANSWICK 812.50 588.50 841.00 Neutral Strong Buy 1515 0.60
DAIRY CREST 304.80 302.20 409.70 Neutral Strong Buy 725 0.93
DEVRO 307.00 232.00 332.20 Neutral Strong Buy 666 0.33
PREMIER FOODS 16.75 3.29 35.12 Neutral Sell -30 1.40
TATE & LYLE 688.00 544.50 720.50 Neutral Buy 818 0.63
UNILEVER (UK) 2086.00 1892.00 2189.00 Neutral Sell 1003 0.58
General Retail Over Valued
Stock Price 12M Lo 12M Hi ST Rec LT Rec Target Beta
ASHLEY(LAURA) HOLDINGS 23.50 16.00 23.75 Neutral Buy 29 0.71
BROWN (N) GROUP 231.30 222.40 304.50 Neutral Neutral 253 0.49
BURBERRY GROUP 1495.00 1092.00 1600.00 Neutral Sell 532 1.36
CARPETRIGHT 605.00 375.00 741.00 Neutral Sell 205 1.03
CLINTON CARDS 7.75 7.50 18.00 Neutral Buy 10 0.65
DIXONS RETAIL 17.84 9.36 19.91 Neutral Strong Buy 28 1.45
FINDEL 3.35 2.20 8.70 Neutral Sell 3 0.97
FRENCH CONNECTN.GROUP 43.00 36.00 106.00 Neutral Strong Buy 100 0.93HALFORDS GROUP 285.50 269.50 405.90 Neutral Buy 412 0.64
JJB SPORTS 13.37 5.20 31.00 Sell Strong Buy 1165 0.88
JD SPORTS FASHION 808.00 570.00 1030.00 Neutral Buy 1196 0.48
KESA ELECTRICALS 55.05 54.15 151.40 Neutral Strong Buy 289 1.28
KINGFISHER 304.00 217.00 313.80 Neutral Sell 286 0.97
MARKS & SPENCER GROUP 362.60 301.80 402.20 Neutral Neutral 391 0.74
MOSS BROTHERS GROUP 51.00 26.00 51.00 Neutral Sell 22 1.07
MOTHERCARE 171.00 127.30 448.50 Neutral Strong Buy 363 0.56
NEXT 3032.00 2153.00 3060.00 Neutral Sell 2129 0.78
TED BAKER 908.50 633.00 908.50 Sell Sell 470 0.56
TOPPS TILES 38.75 21.50 77.00 Neutral Sell 23 1.33
Health Under Valued
Stock Price 12M Lo 12M Hi ST Rec LT Rec Target Beta
CONSORT MEDICAL 665.00 498.00 665.00 Neutral Sell 425 0.39
CORIN GROUP 36.75 36.50 59.00 Buy Buy 48 0.76
SMITH & NEPHEW 612.50 521.00 694.00 Neutral Buy 779 0.36
8/2/2019 uk trading & value indicator 20120423
http://slidepdf.com/reader/full/uk-trading-value-indicator-20120423 8/15
Intellisys www.intellisys.uk.com 23 April 2012
Page 8 of 15 ©Intellisys 23 April 2012
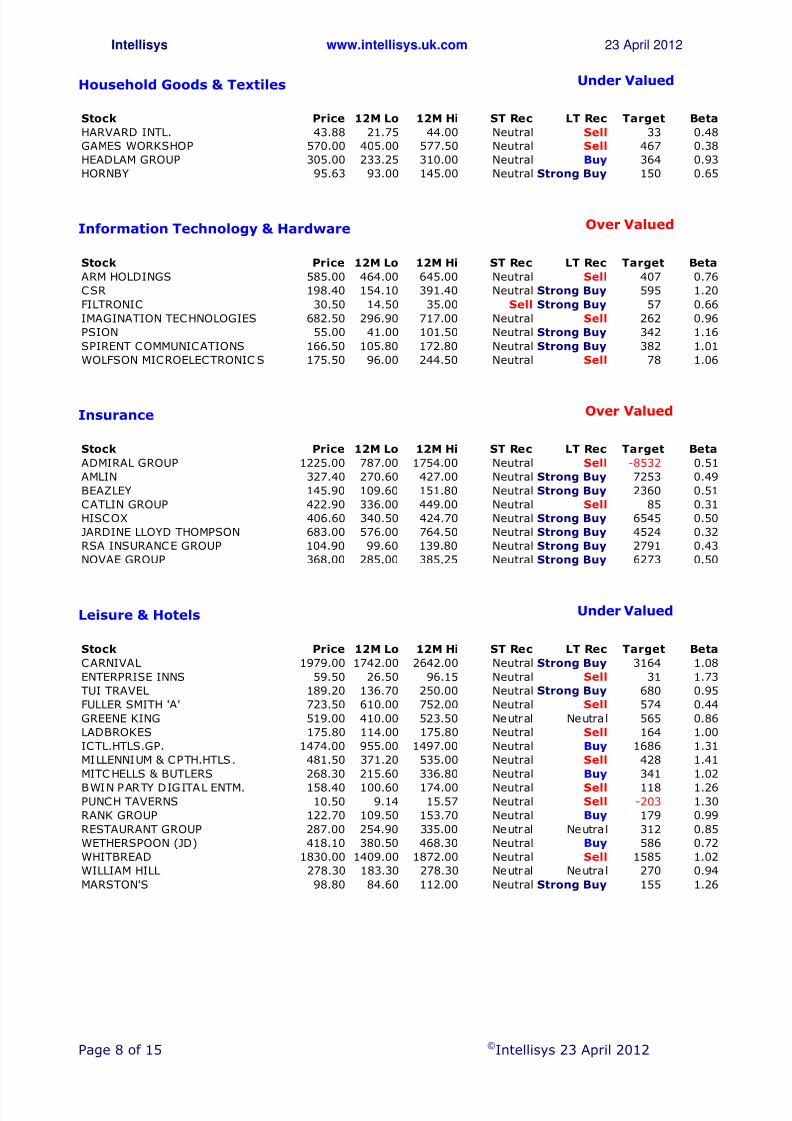
Household Goods & Textiles Under Valued
Stock Price 12M Lo 12M Hi ST Rec LT Rec Target Beta
HARVARD INTL. 43.88 21.75 44.00 Neutral Sell 33 0.48
GAMES WORKSHOP 570.00 405.00 577.50 Neutral Sell 467 0.38
HEADLAM GROUP 305.00 233.25 310.00 Neutral Buy 364 0.93
HORNBY 95.63 93.00 145.00 Neutral Strong Buy 150 0.65
Information Technology & Hardware Over Valued
Stock Price 12M Lo 12M Hi ST Rec LT Rec Target Beta
ARM HOLDINGS 585.00 464.00 645.00 Neutral Sell 407 0.76
CSR 198.40 154.10 391.40 Neutral Strong Buy 595 1.20
FILTRONIC 30.50 14.50 35.00 Sell Strong Buy 57 0.66
IMAGINATION TECHNOLOGIES 682.50 296.90 717.00 Neutral Sell 262 0.96
PSION 55.00 41.00 101.50 Neutral Strong Buy 342 1.16
SPIRENT COMMUNICATIONS 166.50 105.80 172.80 Neutral Strong Buy 382 1.01
WOLFSON MICROELECTRONIC S 175.50 96.00 244.50 Neutral Sell 78 1.06
Insurance Over Valued
Stock Price 12M Lo 12M Hi ST Rec LT Rec Target Beta
ADMIRAL GROUP 1225.00 787.00 1754.00 Neutral Sell -8532 0.51
AMLIN 327.40 270.60 427.00 Neutral Strong Buy 7253 0.49
BEAZLEY 145.90 109.60 151.80 Neutral Strong Buy 2360 0.51
CATLIN GROUP 422.90 336.00 449.00 Neutral Sell 85 0.31
HISCOX 406.60 340.50 424.70 Neutral Strong Buy 6545 0.50
JARDINE LLOYD THOMPSON 683.00 576.00 764.50 Neutral Strong Buy 4524 0.32
RSA INSURANCE GROUP 104.90 99.60 139.80 Neutral Strong Buy 2791 0.43
NOVAE GROUP 368.00 285.00 385.25 Neutral Strong Buy 6273 0.50
Leisure & Hotels Under Valued
Stock Price 12M Lo 12M Hi ST Rec LT Rec Target Beta
CARNIVAL 1979.00 1742.00 2642.00 Neutral Strong Buy 3164 1.08
ENTERPRISE INNS 59.50 26.50 96.15 Neutral Sell 31 1.73
TUI TRAVEL 189.20 136.70 250.00 Neutral Strong Buy 680 0.95
FULLER SMITH 'A' 723.50 610.00 752.00 Neutral Sell 574 0.44
GREENE KING 519.00 410.00 523.50 Neutral Neutral 565 0.86
LADBROKES 175.80 114.00 175.80 Neutral Sell 164 1.00
ICTL.HTLS.GP. 1474.00 955.00 1497.00 Neutral Buy 1686 1.31
MILLENNIUM & CPTH.HTLS. 481.50 371.20 535.00 Neutral Sell 428 1.41
MITCHELLS & BUTLERS 268.30 215.60 336.80 Neutral Buy 341 1.02
BWIN PARTY DIGITAL ENTM. 158.40 100.60 174.00 Neutral Sell 118 1.26PUNCH TAVERNS 10.50 9.14 15.57 Neutral Sell -203 1.30
RANK GROUP 122.70 109.50 153.70 Neutral Buy 179 0.99
RESTAURANT GROUP 287.00 254.90 335.00 Neutral Neutral 312 0.85
WETHERSPOON (JD) 418.10 380.50 468.30 Neutral Buy 586 0.72
WHITBREAD 1830.00 1409.00 1872.00 Neutral Sell 1585 1.02
WILLIAM HILL 278.30 183.30 278.30 Neutral Neutral 270 0.94
MARSTON'S 98.80 84.60 112.00 Neutral Strong Buy 155 1.26
8/2/2019 uk trading & value indicator 20120423
http://slidepdf.com/reader/full/uk-trading-value-indicator-20120423 9/15
Intellisys www.intellisys.uk.com 23 April 2012
Page 9 of 15 ©Intellisys 23 April 2012
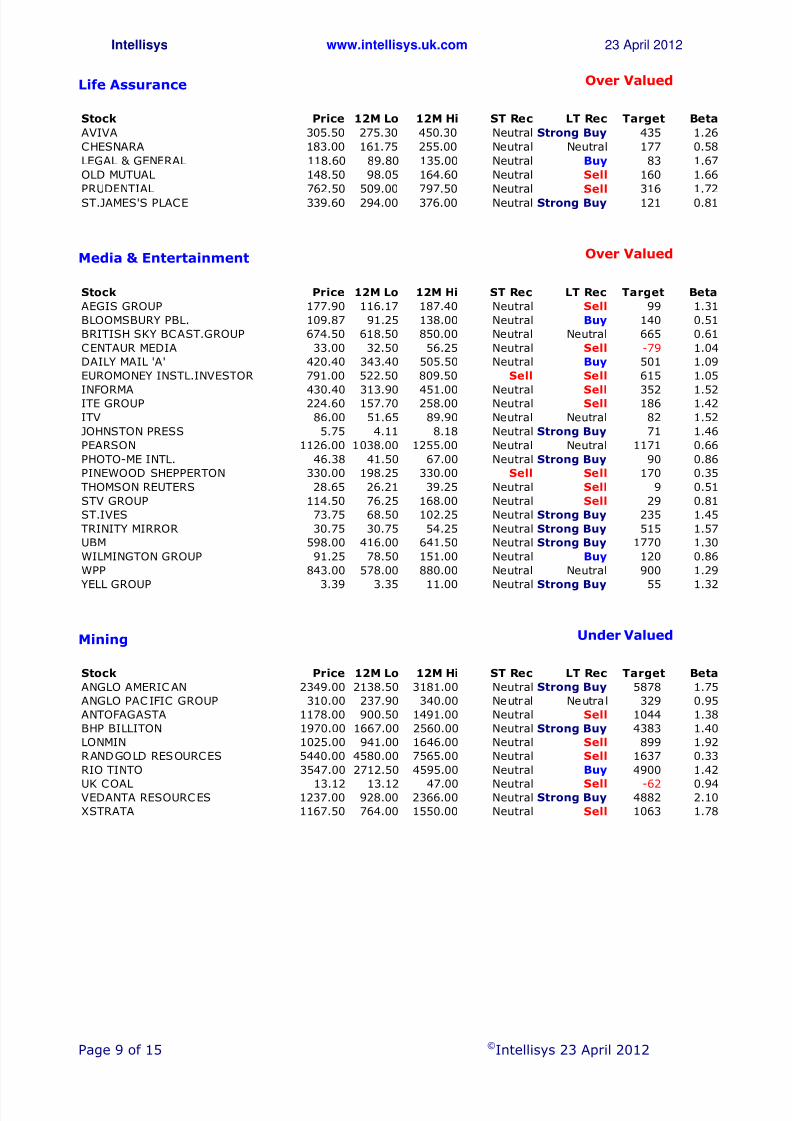
Life Assurance Over Valued
Stock Price 12M Lo 12M Hi ST Rec LT Rec Target Beta
AVIVA 305.50 275.30 450.30 Neutral Strong Buy 435 1.26
CHESNARA 183.00 161.75 255.00 Neutral Neutral 177 0.58
LEGAL & GENERAL 118.60 89.80 135.00 Neutral Buy 83 1.67
OLD MUTUAL 148.50 98.05 164.60 Neutral Sell 160 1.66
PRUDENTIAL 762.50 509.00 797.50 Neutral Sell 316 1.72
ST.JAMES'S PLACE 339.60 294.00 376.00 Neutral Strong Buy 121 0.81
Media & Entertainment Over Valued
Stock Price 12M Lo 12M Hi ST Rec LT Rec Target Beta
AEGIS GROUP 177.90 116.17 187.40 Neutral Sell 99 1.31
BLOOMSBURY PBL. 109.87 91.25 138.00 Neutral Buy 140 0.51
BRITISH SKY BCAST.GROUP 674.50 618.50 850.00 Neutral Neutral 665 0.61
CENTAUR MEDIA 33.00 32.50 56.25 Neutral Sell -79 1.04
DAILY MAIL 'A' 420.40 343.40 505.50 Neutral Buy 501 1.09
EUROMONEY INSTL.INVESTOR 791.00 522.50 809.50 Sell Sell 615 1.05
INFORMA 430.40 313.90 451.00 Neutral Sell 352 1.52ITE GROUP 224.60 157.70 258.00 Neutral Sell 186 1.42
ITV 86.00 51.65 89.90 Neutral Neutral 82 1.52
JOHNSTON PRESS 5.75 4.11 8.18 Neutral Strong Buy 71 1.46
PEARSON 1126.00 1038.00 1255.00 Neutral Neutral 1171 0.66
PHOTO-ME INTL. 46.38 41.50 67.00 Neutral Strong Buy 90 0.86
PINEWOOD SHEPPERTON 330.00 198.25 330.00 Sell Sell 170 0.35
THOMSON REUTERS 28.65 26.21 39.25 Neutral Sell 9 0.51
STV GROUP 114.50 76.25 168.00 Neutral Sell 29 0.81
ST.IVES 73.75 68.50 102.25 Neutral Strong Buy 235 1.45
TRINITY MIRROR 30.75 30.75 54.25 Neutral Strong Buy 515 1.57
UBM 598.00 416.00 641.50 Neutral Strong Buy 1770 1.30
WILMINGTON GROUP 91.25 78.50 151.00 Neutral Buy 120 0.86
WPP 843.00 578.00 880.00 Neutral Neutral 900 1.29
YELL GROUP 3.39 3.35 11.00 Neutral Strong Buy 55 1.32
Mining Under Valued
Stock Price 12M Lo 12M Hi ST Rec LT Rec Target Beta
ANGLO AMERIC AN 2349.00 2138.50 3181.00 Neutral Strong Buy 5878 1.75
ANGLO PACIFIC GROUP 310.00 237.90 340.00 Neutral Neutral 329 0.95
ANTOFAGASTA 1178.00 900.50 1491.00 Neutral Sell 1044 1.38
BHP BILLITON 1970.00 1667.00 2560.00 Neutral Strong Buy 4383 1.40
LONMIN 1025.00 941.00 1646.00 Neutral Sell 899 1.92
RANDGOLD RESOURCES 5440.00 4580.00 7565.00 Neutral Sell 1637 0.33
RIO TINTO 3547.00 2712.50 4595.00 Neutral Buy 4900 1.42
UK COAL 13.12 13.12 47.00 Neutral Sell -62 0.94VEDANTA RESOURCES 1237.00 928.00 2366.00 Neutral Strong Buy 4882 2.10
XSTRATA 1167.50 764.00 1550.00 Neutral Sell 1063 1.78
8/2/2019 uk trading & value indicator 20120423
http://slidepdf.com/reader/full/uk-trading-value-indicator-20120423 10/15
Intellisys www.intellisys.uk.com 23 April 2012
Page 10 of 15 ©Intellisys 23 April 2012
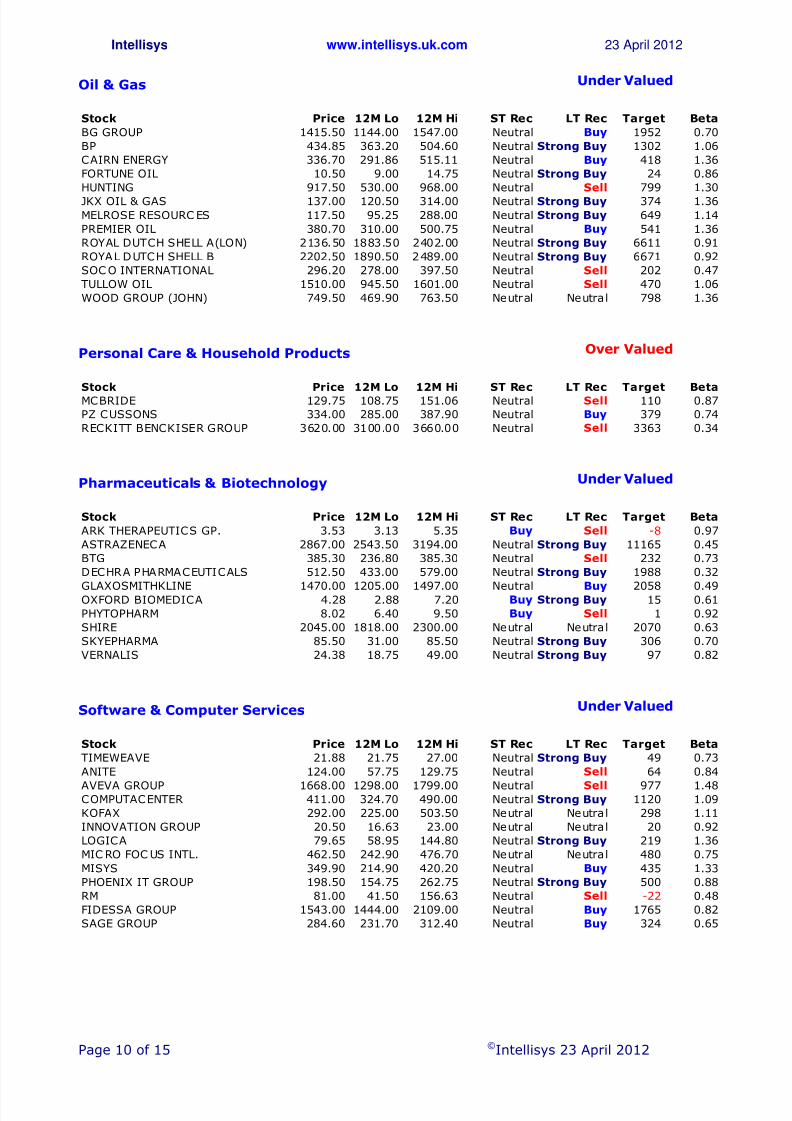
Oil & Gas Under Valued
Stock Price 12M Lo 12M Hi ST Rec LT Rec Target Beta
BG GROUP 1415.50 1144.00 1547.00 Neutral Buy 1952 0.70
BP 434.85 363.20 504.60 Neutral Strong Buy 1302 1.06
CAIRN ENERGY 336.70 291.86 515.11 Neutral Buy 418 1.36
FORTUNE OIL 10.50 9.00 14.75 Neutral Strong Buy 24 0.86
HUNTING 917.50 530.00 968.00 Neutral Sell 799 1.30
JKX OIL & GAS 137.00 120.50 314.00 Neutral Strong Buy 374 1.36
MELROSE RESOURC ES 117.50 95.25 288.00 Neutral Strong Buy 649 1.14
PREMIER OIL 380.70 310.00 500.75 Neutral Buy 541 1.36
ROYAL DUTCH SHELL A(LON) 2136.50 1883.50 2402.00 Neutral Strong Buy 6611 0.91
ROYAL DUTCH SHELL B 2202.50 1890.50 2489.00 Neutral Strong Buy 6671 0.92
SOC O INTERNATIONAL 296.20 278.00 397.50 Neutral Sell 202 0.47
TULLOW OIL 1510.00 945.50 1601.00 Neutral Sell 470 1.06
WOOD GROUP (JOHN) 749.50 469.90 763.50 Neutral Neutral 798 1.36
Personal Care & Household Products Over Valued
Stock Price 12M Lo 12M Hi ST Rec LT Rec Target BetaMCBRIDE 129.75 108.75 151.06 Neutral Sell 110 0.87
PZ CUSSONS 334.00 285.00 387.90 Neutral Buy 379 0.74
RECKITT BENCKISER GROUP 3620.00 3100.00 3660.00 Neutral Sell 3363 0.34
Pharmaceuticals & Biotechnology Under Valued
Stock Price 12M Lo 12M Hi ST Rec LT Rec Target Beta
ARK THERAPEUTICS GP. 3.53 3.13 5.35 Buy Sell -8 0.97
ASTRAZENECA 2867.00 2543.50 3194.00 Neutral Strong Buy 11165 0.45
BTG 385.30 236.80 385.30 Neutral Sell 232 0.73
DECHRA PHARMACEUTICALS 512.50 433.00 579.00 Neutral Strong Buy 1988 0.32
GLAXOSMITHKLINE 1470.00 1205.00 1497.00 Neutral Buy 2058 0.49OXFORD BIOMEDICA 4.28 2.88 7.20 Buy Strong Buy 15 0.61
PHYTOPHARM 8.02 6.40 9.50 Buy Sell 1 0.92
SHIRE 2045.00 1818.00 2300.00 Neutral Neutral 2070 0.63
SKYEPHARMA 85.50 31.00 85.50 Neutral Strong Buy 306 0.70
VERNALIS 24.38 18.75 49.00 Neutral Strong Buy 97 0.82
Software & Computer Services Under Valued
Stock Price 12M Lo 12M Hi ST Rec LT Rec Target Beta
TIMEWEAVE 21.88 21.75 27.00 Neutral Strong Buy 49 0.73
ANITE 124.00 57.75 129.75 Neutral Sell 64 0.84
AVEVA GROUP 1668.00 1298.00 1799.00 Neutral Sell 977 1.48COMPUTACENTER 411.00 324.70 490.00 Neutral Strong Buy 1120 1.09
KOFAX 292.00 225.00 503.50 Neutral Neutral 298 1.11
INNOVATION GROUP 20.50 16.63 23.00 Neutral Neutral 20 0.92
LOGICA 79.65 58.95 144.80 Neutral Strong Buy 219 1.36
MIC RO FOC US INTL. 462.50 242.90 476.70 Neutral Neutral 480 0.75
MISYS 349.90 214.90 420.20 Neutral Buy 435 1.33
PHOENIX IT GROUP 198.50 154.75 262.75 Neutral Strong Buy 500 0.88
RM 81.00 41.50 156.63 Neutral Sell -22 0.48
FIDESSA GROUP 1543.00 1444.00 2109.00 Neutral Buy 1765 0.82
SAGE GROUP 284.60 231.70 312.40 Neutral Buy 324 0.65
8/2/2019 uk trading & value indicator 20120423
http://slidepdf.com/reader/full/uk-trading-value-indicator-20120423 11/15
Intellisys www.intellisys.uk.com 23 April 2012
Page 11 of 15 ©Intellisys 23 April 2012
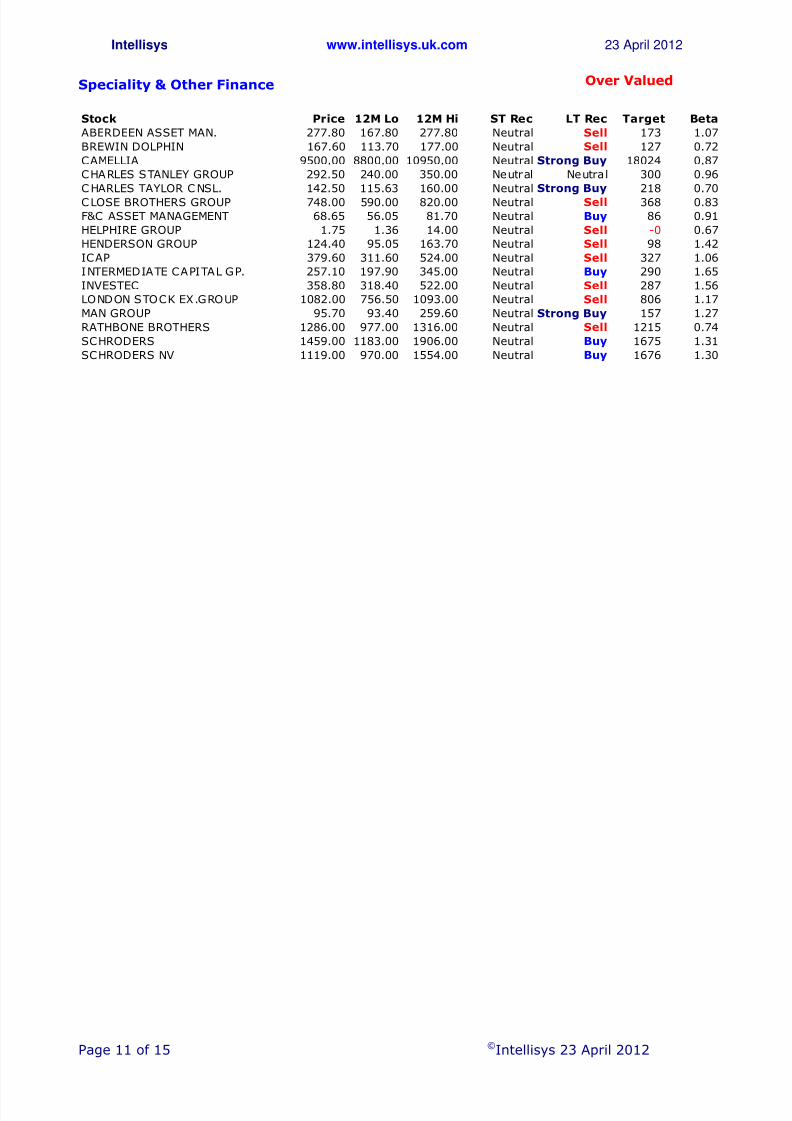
Speciality & Other Finance Over Valued
Stock Price 12M Lo 12M Hi ST Rec LT Rec Target Beta
ABERDEEN ASSET MAN. 277.80 167.80 277.80 Neutral Sell 173 1.07
BREWIN DOLPHIN 167.60 113.70 177.00 Neutral Sell 127 0.72
CAMELLIA 9500.00 8800.00 10950.00 Neutral Strong Buy 18024 0.87
CHARLES STANLEY GROUP 292.50 240.00 350.00 Neutral Neutral 300 0.96
CHARLES TAYLOR CNSL. 142.50 115.63 160.00 Neutral Strong Buy 218 0.70
CLOSE BROTHERS GROUP 748.00 590.00 820.00 Neutral Sell 368 0.83
F&C ASSET MANAGEMENT 68.65 56.05 81.70 Neutral Buy 86 0.91
HELPHIRE GROUP 1.75 1.36 14.00 Neutral Sell -0 0.67
HENDERSON GROUP 124.40 95.05 163.70 Neutral Sell 98 1.42
ICAP 379.60 311.60 524.00 Neutral Sell 327 1.06
INTERMEDIATE CAPITAL GP. 257.10 197.90 345.00 Neutral Buy 290 1.65
INVESTEC 358.80 318.40 522.00 Neutral Sell 287 1.56
LONDON STOCK EX.GROUP 1082.00 756.50 1093.00 Neutral Sell 806 1.17
MAN GROUP 95.70 93.40 259.60 Neutral Strong Buy 157 1.27
RATHBONE BROTHERS 1286.00 977.00 1316.00 Neutral Sell 1215 0.74
SCHRODERS 1459.00 1183.00 1906.00 Neutral Buy 1675 1.31
SCHRODERS NV 1119.00 970.00 1554.00 Neutral Buy 1676 1.30
8/2/2019 uk trading & value indicator 20120423
http://slidepdf.com/reader/full/uk-trading-value-indicator-20120423 12/15
Intellisys www.intellisys.uk.com 23 April 2012
Page 12 of 15 ©Intellisys 23 April 2012
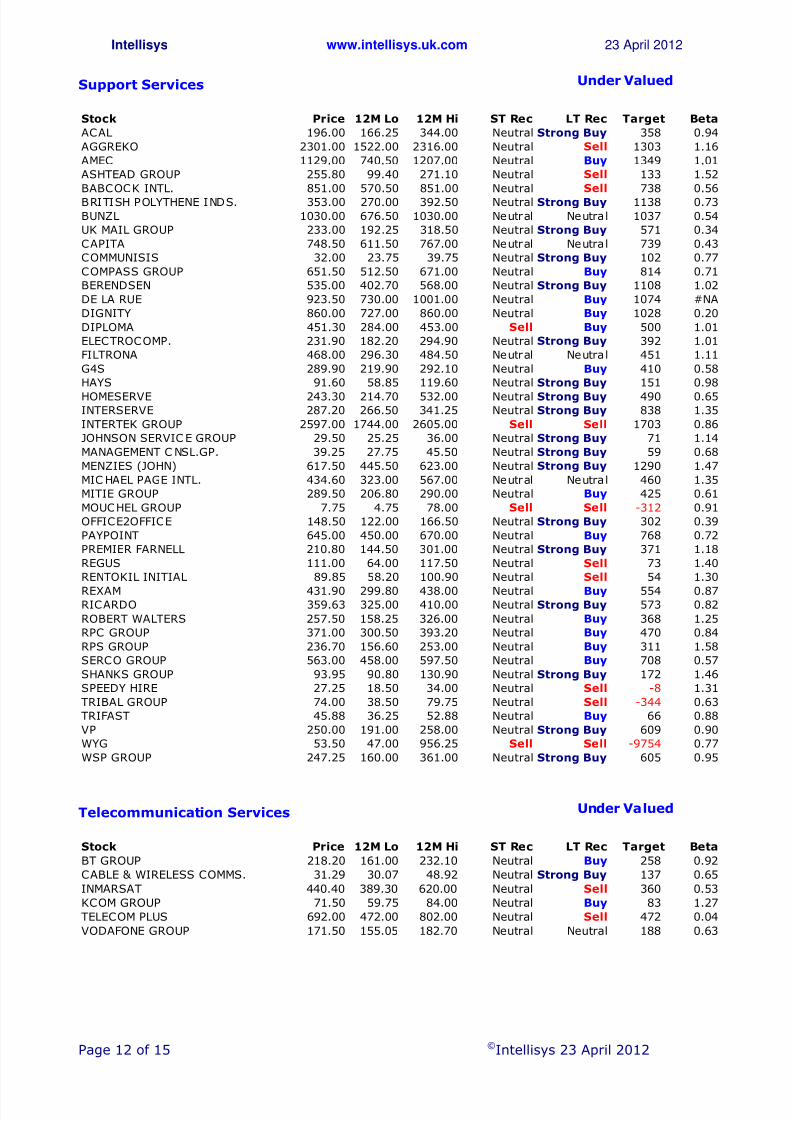
Support Services Under Valued
Stock Price 12M Lo 12M Hi ST Rec LT Rec Target Beta
ACAL 196.00 166.25 344.00 Neutral Strong Buy 358 0.94
AGGREKO 2301.00 1522.00 2316.00 Neutral Sell 1303 1.16
AMEC 1129.00 740.50 1207.00 Neutral Buy 1349 1.01
ASHTEAD GROUP 255.80 99.40 271.10 Neutral Sell 133 1.52
BABCOCK INTL. 851.00 570.50 851.00 Neutral Sell 738 0.56
BRITISH POLYTHENE INDS. 353.00 270.00 392.50 Neutral Strong Buy 1138 0.73
BUNZL 1030.00 676.50 1030.00 Neutral Neutral 1037 0.54
UK MAIL GROUP 233.00 192.25 318.50 Neutral Strong Buy 571 0.34
CAPITA 748.50 611.50 767.00 Neutral Neutral 739 0.43
COMMUNISIS 32.00 23.75 39.75 Neutral Strong Buy 102 0.77
COMPASS GROUP 651.50 512.50 671.00 Neutral Buy 814 0.71
BERENDSEN 535.00 402.70 568.00 Neutral Strong Buy 1108 1.02
DE LA RUE 923.50 730.00 1001.00 Neutral Buy 1074 #NA
DIGNITY 860.00 727.00 860.00 Neutral Buy 1028 0.20
DIPLOMA 451.30 284.00 453.00 Sell Buy 500 1.01
ELECTROCOMP. 231.90 182.20 294.90 Neutral Strong Buy 392 1.01
FILTRONA 468.00 296.30 484.50 Neutral Neutral 451 1.11
G4S 289.90 219.90 292.10 Neutral Buy 410 0.58
HAYS 91.60 58.85 119.60 Neutral Strong Buy 151 0.98
HOMESERVE 243.30 214.70 532.00 Neutral Strong Buy 490 0.65INTERSERVE 287.20 266.50 341.25 Neutral Strong Buy 838 1.35
INTERTEK GROUP 2597.00 1744.00 2605.00 Sell Sell 1703 0.86
JOHNSON SERVIC E GROUP 29.50 25.25 36.00 Neutral Strong Buy 71 1.14
MANAGEMENT C NSL.GP. 39.25 27.75 45.50 Neutral Strong Buy 59 0.68
MENZIES (JOHN) 617.50 445.50 623.00 Neutral Strong Buy 1290 1.47
MIC HAEL PAGE INTL. 434.60 323.00 567.00 Neutral Neutral 460 1.35
MITIE GROUP 289.50 206.80 290.00 Neutral Buy 425 0.61
MOUCHEL GROUP 7.75 4.75 78.00 Sell Sell -312 0.91
OFFICE2OFFICE 148.50 122.00 166.50 Neutral Strong Buy 302 0.39
PAYPOINT 645.00 450.00 670.00 Neutral Buy 768 0.72
PREMIER FARNELL 210.80 144.50 301.00 Neutral Strong Buy 371 1.18
REGUS 111.00 64.00 117.50 Neutral Sell 73 1.40
RENTOKIL INITIAL 89.85 58.20 100.90 Neutral Sell 54 1.30
REXAM 431.90 299.80 438.00 Neutral Buy 554 0.87RICARDO 359.63 325.00 410.00 Neutral Strong Buy 573 0.82
ROBERT WALTERS 257.50 158.25 326.00 Neutral Buy 368 1.25
RPC GROUP 371.00 300.50 393.20 Neutral Buy 470 0.84
RPS GROUP 236.70 156.60 253.00 Neutral Buy 311 1.58
SERCO GROUP 563.00 458.00 597.50 Neutral Buy 708 0.57
SHANKS GROUP 93.95 90.80 130.90 Neutral Strong Buy 172 1.46
SPEEDY HIRE 27.25 18.50 34.00 Neutral Sell -8 1.31
TRIBAL GROUP 74.00 38.50 79.75 Neutral Sell -344 0.63
TRIFAST 45.88 36.25 52.88 Neutral Buy 66 0.88
VP 250.00 191.00 258.00 Neutral Strong Buy 609 0.90
WYG 53.50 47.00 956.25 Sell Sell -9754 0.77
WSP GROUP 247.25 160.00 361.00 Neutral Strong Buy 605 0.95
Telecommunication Services Under Valued
Stock Price 12M Lo 12M Hi ST Rec LT Rec Target Beta
BT GROUP 218.20 161.00 232.10 Neutral Buy 258 0.92
CABLE & WIRELESS COMMS. 31.29 30.07 48.92 Neutral Strong Buy 137 0.65
INMARSAT 440.40 389.30 620.00 Neutral Sell 360 0.53
KCOM GROUP 71.50 59.75 84.00 Neutral Buy 83 1.27
TELECOM PLUS 692.00 472.00 802.00 Neutral Sell 472 0.04
VODAFONE GROUP 171.50 155.05 182.70 Neutral Neutral 188 0.63

8/2/2019 uk trading & value indicator 20120423
http://slidepdf.com/reader/full/uk-trading-value-indicator-20120423 13/15
Intellisys www.intellisys.uk.com 23 April 2012
Page 13 of 15 ©Intellisys 23 April 2012
Transport Over Valued
Stock Price 12M Lo 12M Hi ST Rec LT Rec Target Beta
BBA AVIATION 201.10 156.00 223.40 Neutral Sell 162 1.41
BRAEMAR SHIPPING SVS. 390.50 282.00 505.00 Neutral Strong Buy 648 0.94
CLARKSON 1337.00 1015.00 1367.00 Neutral Buy 1645 0.81
EASYJET 498.00 302.54 498.00 Neutral Neutral 538 0.77
FIRST GROUP 196.90 195.80 370.20 Buy Strong Buy 407 1.08
FISHER(JAMES)& SONS 582.50 440.50 615.00 Neutral Sell 333 0.83
GO-AHEAD GROUP 1150.00 1125.00 1598.00 Neutral Strong Buy 1764 0.94
NATIONAL EXPRESS 219.40 201.60 270.20 Neutral Sell 175 1.28
NORTHGATE 198.70 190.00 342.00 Neutral Strong Buy 385 1.38
STAGEC OAC H GROUP 253.10 219.96 287.40 Neutral Sell 206 0.88
WINCANTON 59.75 56.00 123.25 Neutral Strong Buy 158 0.85
Utilities Under Valued
Stock Price 12M Lo 12M Hi ST Rec LT Rec Target Beta
CENTRICA 322.80 278.80 333.00 Neutral Neutral 342 0.49
NATIONAL GRID 655.00 569.00 659.00 Neutral Buy 844 0.55PENNON GROUP 751.00 623.50 751.00 Neutral Sell 638 0.59
SEVERN TRENT 1720.00 1375.00 1720.00 Sell Sell 1463 0.46
UNITED UTILITIES GROUP 620.50 560.00 637.00 Neutral Neutral 652 0.58
8/2/2019 uk trading & value indicator 20120423
http://slidepdf.com/reader/full/uk-trading-value-indicator-20120423 14/15
Intellisys www.intellisys.uk.com 23 April 2012
Page 14 of 15 ©Intellisys 23 April 2012
DISCLAIMER
Intelligent Analysis Limited has prepared this report. Intellisys (“Intellisys”) is the trading name of Intelligent Analysis Limited.
Intelligent Analysis Limited is a provider of financial research reports that indicate the possible value of quoted company shares. The information contained within any and all of Intellisys’ reports are designed to
present an objective assessment of the possible value or relative value of a company and/or an actuarialsector or stock market index. Intellisys utilises as extensive as possible range of valuation tools andproprietary systems to derive its outputs. The base data for the models are derived from sources believed tobe accurate but Intelligent Analysis Limited does not warrant or guarantee the accuracy or reliability of thesource data or its models and proprietary systems. Subscribers, and casual readers, should not rely upon theIntellisys’ research outputs when forming specific investment decisions but should seek advice specific totheir situation and investment requirements from a person authorized under the Financial Services andMarkets Act 2000, before entering into any investment agreement.
Intelligent Analysis Limited has used reasonable care and skill in compiling the content of this report. Norepresentation or warranty, expressed or implied, is given by any person as to the accuracy or completenessor accuracy of the information and no responsibility or liability is accepted to the accuracy or sufficiency of
any of the information, for any errors, omissions or misstatements, negligent or otherwise. In no event willIntelligent Analysis Limited, Intellisys or any of its officers, employees or agents be liable to any other partyfor any direct, indirect, special or other consequential damages arising from the use of this report.
The Intelligent Analysis Limited and/or Intellisys reports are not directed to any person in any jurisdictionwhere (by reason of that person’s nationality, residence or otherwise) the publication or availability of theIntelligent Analysis Limited and/or Intellisys information may be prohibited. Persons in respect of whom suchprohibitions apply must not access the Intelligent Analysis Limited and/or Intellisys reports. Neither thisdocument, nor any copy in whatever form of media, may be taken or transmitted into the United States,Canada, Australia, Ireland, South Africa or Japan or into any jurisdiction where it would be unlawful to do so.
Any failure to comply with this restriction may constitute a violation of relevant local securities laws.Recipients of Intelligent Analysis Limited and/or Intellisys reports outside the UK are not covered by the
rules and regulations made for the protection of investors in the UK.
Any user distributing information taken from any Intelligent Analysis Limited or Intellisys report and/or theIntellisys website, in whatever form, to any other person, agrees to attach a copy of this Disclaimer and theTerms and Conditions of Use pages and obtain the agreement of such other person to comply with theterms set forth.
Intellisys' published reports are published for information purposes and only available to marketcounterparties, high net-worth and sophisticated individual investors.
No Intellisys report constitutes an offer or invitation to trade, sell, purchase or acquire any shares or otherfinancial instruments in any company or any interest therein, nor shall it form the basis of any contract
entered into for the sale of shares or any other financial instrument in any company.
Intelligent Analysis Limited believes that the information within each and any of its reports to be correct, butits accuracy or completeness cannot be guaranteed. No representation or warranty, expressed or implied, isgiven by any person as to the accuracy or completeness of the information and no responsibility or liability isaccepted for the accuracy or sufficiency of any of the information, for any errors, omissions or mis-statements, negligent or otherwise.
Intelligent Analysis Limited (including its Directors, employees and representatives) or a connected personmay have positions in or options or other financial instruments on any of the securities mentioned within areport, and may buy, sell or offer to purchase or sell such securities from time to time, subject to restrictionsimposed by internal rules.
8/2/2019 uk trading & value indicator 20120423
http://slidepdf.com/reader/full/uk-trading-value-indicator-20120423 15/15
Intellisys www.intellisys.uk.com 23 April 2012
Page 15 of 15 ©Intellisys 23 April 2012
Subscribers, and casual reader, are reminded that the value of shares in any company may go up or downand that past performance is not necessarily a guide to future performance.
Intelligent Analysis Limited is not registered with or regulated by any financial regulatory authority and doesnot offer, provide or purport to provide or offer investment advice.
RISK WARNING – Recommendations and Target Prices
Intellisys does not make personal recommendations. The information in this publication is provided solely toenable you to make your own investment decisions.
If you are unsure about dealing in shares and other equity investments, you should contact your financialadviser as these types of investments may not be suitable for everyone.
The value of stocks and shares, and the income from them, can fall as well as rise and you may not get back the full amount you originally invested. If denominated in a foreign currency, fluctuations in the exchangerate will also affect the value of stocks and shares and the income from them. Past performance is not
necessarily a guide to future performance.