uk trading & value indicator 20120217
TRANSCRIPT
8/3/2019 uk trading & value indicator 20120217
http://slidepdf.com/reader/full/uk-trading-value-indicator-20120217 1/25
17 February 2012
UK Trading &
ValueIndicator

8/3/2019 uk trading & value indicator 20120217
http://slidepdf.com/reader/full/uk-trading-value-indicator-20120217 2/25
Intellisys www.intellisys.uk.com 17 February 2012
Page 2 of 25 ©Intellisys 17 February 2012
Contents
Market Pictures - Indices ......................................................................... 5
FTSE 100 ................................................................................................ 5 FTSE 250 ................................................................................................ 6 FTSE All Share Index ................................................................................ 7 FTSE AIM All Share .................................................................................. 8
Market Pictures – Interest Rates ............................................................ 10 UK Bank Lending Rates ........................................................................... 10 Eurozone Lending Rates .......................................................................... 11 US Federal Funds Rate ........................................................................... 12
Market Pictures – Exchange Rates ......................................................... 13 Market Pictures - Oil............................................................................... 15 Aerospace & Defence ............................................. Over Valued 16 Automobiles & Parts .............................................. Over Valued 16 Banks ............................................................. Over Valued 16 Beverages ........................................................ Over Valued 16 Chemicals ........................................................ Over Valued 16 Construction & Building Materials .............................. Over Valued 17 Electronics & Electrical Equipment ............................. Under Valued 17 Engineering & Machinery ........................................ Over Valued 17 Food & Drug Stores ............................................... Under Valued 18 Food Producers & Processors ................................... Over Valued 18 General Retail ..................................................... Over Valued 18 Health .............................................................. Over Valued 18 Household Goods & Textiles .................................... Under Valued 18 Information Technology & Hardware .......................... Over Valued 19 Insurance ........................................................ Over Valued 19 Leisure & Hotels .................................................. Under Valued 19 Life Assurance .................................................. Over Valued 19 Media & Entertainment .......................................... Under Valued 20 Mining .............................................................. Under Valued 20 Oil & Gas ........................................................... Under Valued 20 Personal Care & Household Products .......................... Over Valued 20 Pharmaceuticals & Biotechnology .............................. Under Valued 21 Software & Computer Services ................................. Under Valued 21 Speciality & Other Finance
......................................
Over Valued21
Support Services .................................................. Under Valued 22 Telecommunication Services .................................... Under Valued 22 Transport ........................................................ Under Valued 23 Utilities ............................................................. Under Valued 23 DISCLAIMER ............................................................................................. 24

8/3/2019 uk trading & value indicator 20120217
http://slidepdf.com/reader/full/uk-trading-value-indicator-20120217 3/25
Intellisys www.intellisys.uk.com 17 February 2012
Page 3 of 25 ©Intellisys 17 February 2012
IntroductionThe overriding purpose of this daily report is to provide users with a quick guidethat will identify those shares that merit their investment attention in an
increasingly time critical and information noisy trading environment.
The report is published daily and delivered to the subscriber’s personal email box,
typically, before the official open of the London Stock Markets.
Putting aside luck, Intellisys recognises that the timing and value of aninvestment are the two primary drivers behind a successful portfolio performance.
TimingIntellisys has invested considerably in identifying what it believes are the key
factors that influence investment timing. Having identified the key parameters,these have been established as rules that reflect market dynamics and cutthrough the daily investment noise.
Through this discipline, Intellisys has removed the emotional and sentimentalfactors as well as the daily pressures exerted upon primary stock promoters(analysts and traders) to find stories for their investment meetings.
From an analysis of a year’s data for 40 stocks within Intellisys’ stock coverage,the trading indicators appear to be, on average, about 77% accurate inidentifying good trading points as well as some 74% accurate for overall trend
correlation.
The following chart provides an indication the accuracy scores for each of the 40stocks analysed.
Individual Stock Recommendation & Trend Accuracy Scores
Source: Intellisys
20.0%
30.0%
40.0%
50.0%
60.0%
70.0%
80.0%
90.0%
100.0%
110.0%
120.0%
1 2 3 4 5 6 7 8 9 10 11 12 13 14 15 16 17 18 19 20 21 22 23 24 25 26 27 28 29 30 31 32 33 34 35 36 37 38 39 40
20.0%
30.0%
40.0%
50.0%
60.0%
70.0%
80.0%
90.0%
100.0%
110.0%
120.0%
Best Buy/Sell Trend

8/3/2019 uk trading & value indicator 20120217
http://slidepdf.com/reader/full/uk-trading-value-indicator-20120217 4/25
Intellisys www.intellisys.uk.com 17 February 2012
Page 4 of 25 ©Intellisys 17 February 2012
Value
A similar discipline has been applied to the process of establishing ‘Target Prices’.On a daily basis, Intellisys analyses as broad an array of historic data from notonly the Profit & Loss Account but also the Balance Sheet and Cash flow
Statement and then utilises this data within its proprietary valuation models.
Intellisys’ architect, Philip Morrish, has successfully applied these disciplines to his
investment research for the last 15+ years. Additionally, these investment
valuation techniques lend themselves to accurate cross-border analysis.
The resultant ‘Target’ is also discounted to a Net Present Value to make the
‘Target’ as realistically valid as possible.
Nevertheless, Intellisys recognises that ‘Target Price’ delivery is not only a
function of market levels but a management team’s ability to establish andmaintain a value generating operating environment set against a constantlychanging global background.
The typical investment analyst’s approach to determining ‘target prices’ is to startwith a modest range of some 6 – 10 valuation measures and remove those that
are not providing the ‘intuitive’ result. Intellysis’ approach is the opposite we useas many valuation methodologies as possible.
Further, Intellisys recognises that some target prices may appear strange orextreme. However, subscribers should not dismiss these outcomes but use them
as starting points to challenge their established or perceived valuation opinion of a stock.
In short, this disciplined approach provides an investment reality check to assist
investors from ‘falling in love’ with a stock or becoming mesmerised by ‘management cults’.
ConclusionNo investment methodology is 100% successful and like all trading andinvestment systems active position monitoring is critical for maximisedinvestment performance.
Therefore, Intellisys recommends that its products should be used in conjunctionwith, and not separate from subscriber’s existing investment systems as well asdiscussing investment options with their financial advisers.
Philip Morrish ([email protected])
RISK WARNING – Recommendations and Target Prices
Intellisys does not make personal recommendations. The information in thispublication is provided solely to enable you to make your own investmentdecisions.If you are unsure about dealing in shares and other equity investments, you
should contact your financial adviser as these types of investments may not besuitable for everyone.The value of stocks and shares, and the income from them, can fall as well as riseand you may not get back the full amount you originally invested. If denominatedin a foreign currency, fluctuations in the exchange rate will also affect the valueof stocks and shares and the income from them. Past performance is notnecessarily a guide to future performance.
8/3/2019 uk trading & value indicator 20120217
http://slidepdf.com/reader/full/uk-trading-value-indicator-20120217 5/25
Intellisys www.intellisys.uk.com 17 February 2012
Page 5 of 25 ©Intellisys 17 February 2012
Market Pictures - Indices
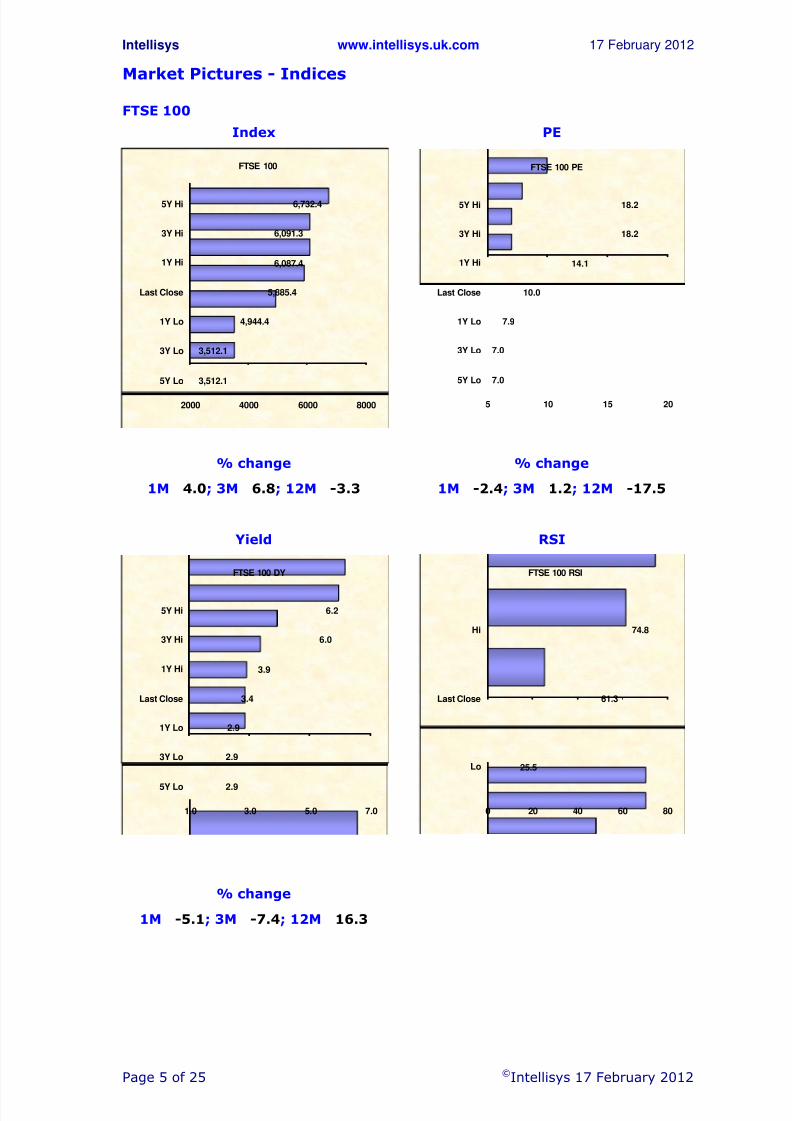
FTSE 100
Index PE
3,512.1
3,512.1
4,944.4
5,885.4
6,087.4
6,091.3
6,732.4
2000 4000 6000 8000
5Y Lo
3Y Lo
1Y Lo
Last Close
1Y Hi
3Y Hi
5Y Hi
FTSE 100
7.0
7.0
7.9
10.0
14.1
18.2
18.2
5 10 15 20
5Y Lo
3Y Lo
1Y Lo
Last Close
1Y Hi
3Y Hi
5Y Hi
FTSE 100 PE
% change % change
1M 4.0; 3M 6.8; 12M -3.3 1M -2.4; 3M 1.2; 12M -17.5
Yield RSI
2.9
2.9
2.9
3.4
3.9
6.0
6.2
1.0 3.0 5.0 7.0
5Y Lo
3Y Lo
1Y Lo
Last Close
1Y Hi
3Y Hi
5Y Hi
FTSE 100 DY
25.5
61.3
74.8
0 20 40 60 80
Lo
Last Close
Hi
FTSE 100 RSI
% change
1M -5.1; 3M -7.4; 12M 16.3

8/3/2019 uk trading & value indicator 20120217
http://slidepdf.com/reader/full/uk-trading-value-indicator-20120217 6/25
Intellisys www.intellisys.uk.com 17 February 2012
Page 6 of 25 ©Intellisys 17 February 2012
Market Pictures - Indices
FTSE 250
Index PE
5,491.5
5,769.8
9,425.9
11,203.4
12,167.8
12,167.8
12,220.2
500 5500 10500 15500
5Y Lo
3Y Lo
1Y Lo
Last Close
1Y Hi
3Y Hi
5Y Hi
FTSE 250
7.1
7.1
7.1
17.1
19.1
27.8
27.8
5 10 15 20 25 30
5Y Lo
3Y Lo
1Y Lo
Last Close
1Y Hi
3Y Hi
5Y Hi
FTSE 250 PE
% change % change
1M 6.9; 3M 9.0; 12M -5.1 1M 7.3; 3M 8.9; 12M -10.5
Yield RSI
1.9
2.2
2.2
2.8
3.3
5.0
5.7
1.0 2.0 3.0 4.0 5.0 6.0
5Y Lo
3Y Lo
1Y Lo
Last Close
1Y Hi
3Y Hi
5Y Hi
FTSE 250 DY
25.6
62.0
83.4
0 20 40 60 80 100
Lo
Last Close
Hi
FTSE 250 RSI
% change
1M -8.6; 3M -6.5; 12M 26.7
8/3/2019 uk trading & value indicator 20120217
http://slidepdf.com/reader/full/uk-trading-value-indicator-20120217 7/25
Intellisys www.intellisys.uk.com 17 February 2012
Page 7 of 25 ©Intellisys 17 February 2012
Market Pictures - Indices
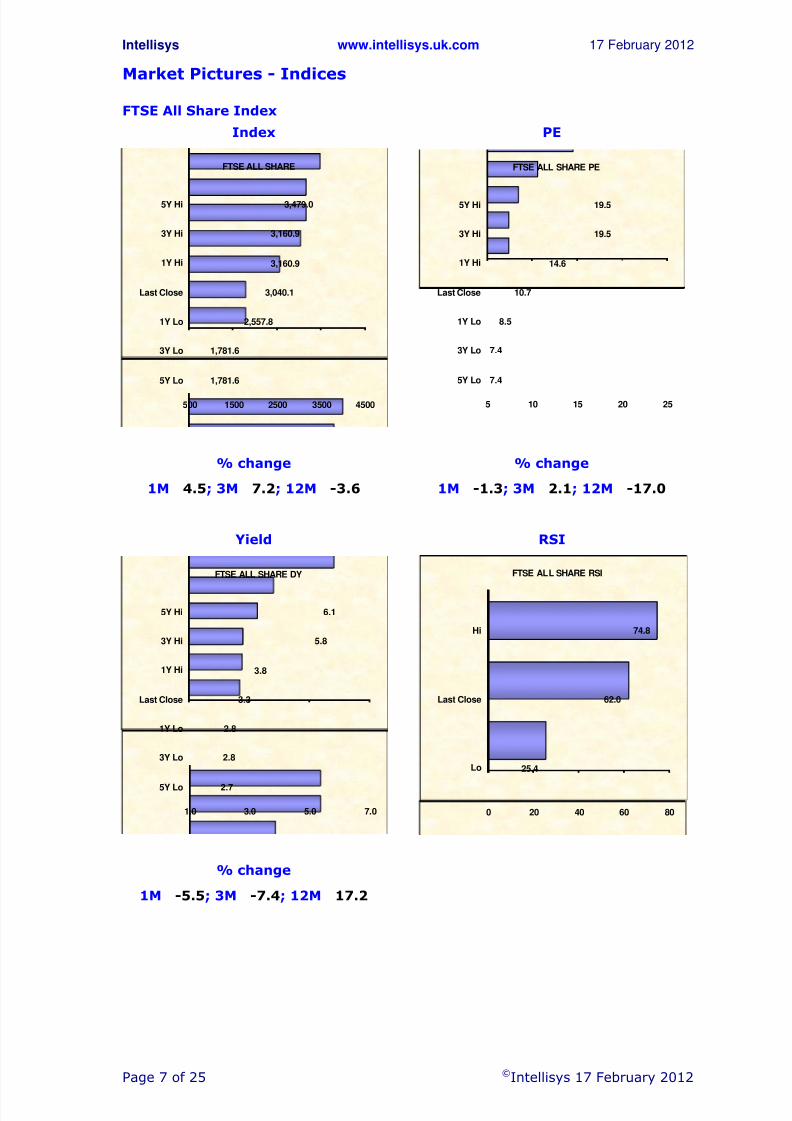
FTSE All Share Index
Index PE
1,781.6
1,781.6
2,557.8
3,040.1
3,160.9
3,160.9
3,479.0
500 1500 2500 3500 4500
5Y Lo
3Y Lo
1Y Lo
Last Close
1Y Hi
3Y Hi
5Y Hi
FTSE ALL SHARE
7.4
7.4
8.5
10.7
14.6
19.5
19.5
5 10 15 20 25
5Y Lo
3Y Lo
1Y Lo
Last Close
1Y Hi
3Y Hi
5Y Hi
FTSE ALL SHARE PE
% change % change
1M 4.5; 3M 7.2; 12M -3.6 1M -1.3; 3M 2.1; 12M -17.0
Yield RSI
2.7
2.8
2.8
3.3
3.8
5.8
6.1
1.0 3.0 5.0 7.0
5Y Lo
3Y Lo
1Y Lo
Last Close
1Y Hi
3Y Hi
5Y Hi
FTSE ALL SHARE DY
25.4
62.0
74.8
0 20 40 60 80
Lo
Last Close
Hi
FTSE ALL SHARE RSI
% change
1M -5.5; 3M -7.4; 12M 17.2

8/3/2019 uk trading & value indicator 20120217
http://slidepdf.com/reader/full/uk-trading-value-indicator-20120217 8/25
Intellisys www.intellisys.uk.com 17 February 2012
Page 8 of 25 ©Intellisys 17 February 2012
Market Pictures - Indices
FTSE AIM All Share
Index PE
373.8
373.8
657.8
800.7
955.0
968.3
1,236.6
200 700 1200 1700
5Y Lo
3Y Lo
1Y Lo
Last Close
1Y Hi
3Y Hi
5Y Hi
FTSE AIM ALL-SHARE
-203,906.0
-203,906.0
-203,906.0
99.8
211.5
1,240.8
1,439.5
-250000 -200000 -150000 -100000 -50000 0 50000
5Y Lo
3Y Lo
1Y Lo
Last Close
1Y Hi
3Y Hi
5Y Hi
FTSE AIM ALL-SHARE PE
% change % change
1M 9.0; 3M 10.8; 12M -16.4 1M 2.6; 3M 11.8; 12M -155.8
Yield RSI
0.4
0.5
0.5
0.6
0.8
2.1
2.1
0.2 0.7 1.2 1.7 2.2
5Y Lo
3Y Lo
1Y Lo
Last Close
1Y Hi
3Y Hi
5Y Hi
FTSE AIM ALL-SHARE DY
16.5
79.1
91.9
0 50 100
Lo
Last Close
Hi
FTSE AIM ALL-SHARE RSI
% change
1M -14.1; 3M -14.1; 12M 15.1

8/3/2019 uk trading & value indicator 20120217
http://slidepdf.com/reader/full/uk-trading-value-indicator-20120217 9/25
Intellisys www.intellisys.uk.com 17 February 2012
Page 9 of 25 ©Intellisys 17 February 2012
Market Pictures - Indices
S&P 500
Index PE
676.5
676.5
1,099.2
1,358.0
1,363.6
1,363.6
1,565.2
400 900 1400 1900
5Y Lo
3Y Lo
1Y Lo
Last Close
1Y Hi
3Y Hi
5Y Hi
S&P 500 COMPOSITE
13.4
13.4
13.4
15.3
17.5
146.3
146.3
10 60 110 160
5Y Lo
3Y Lo
1Y Lo
Last Close
1Y Hi
3Y Hi
5Y Hi
S&P 500 COMPOSITE PE
% change % change
1M 5.4; 3M 9.8; 12M 1.6 1M 3.0; 3M 6.1; 12M -11.7
Yield RSI
1.8
1.8
1.8
2.1
2.4
3.2
3.4
0.5 1.5 2.5 3.5 4.5
5Y Lo
3Y Lo
1Y Lo
Last Close
1Y Hi
3Y Hi
5Y Hi
S&P 500 COMPOSITE DY
30.0
70.5
81.6
0 20 40 60 80 100
Lo
Last Close
Hi
S&P 500 COMPOSITE RSI
% change
1M -2.8; 3M -3.2; 12M 17.2

8/3/2019 uk trading & value indicator 20120217
http://slidepdf.com/reader/full/uk-trading-value-indicator-20120217 10/25
Intellisys www.intellisys.uk.com 17 February 2012
Page 10 of 25 ©Intellisys 17 February 2012
Market Pictures – Interest Rates
UK Bank Lending Rates
UK
0.50
0.50
0.50
0.50
0.50
1.00
5.75
0.00 1.00 2.00 3.00 4.00 5.00 6.00 7.00
5Y Lo
3Y Lo
1Y Lo
Last Close
1Y Hi
3Y Hi
5Y Hi
UK CLEARING BANKS BASE RATE
% change
1M 0.0; 3M 0.0; 12M 0.0
UK Lending PE
200.0
200.0
200.0
200.0
200.0
100.0
17.4
10 60 110 160 210
5Y Hi
3Y Hi
1Y Hi
Last Close
1Y Lo
3Y Lo
5Y Lo
UK CLEARING BANKS BASE RATE PE
8/3/2019 uk trading & value indicator 20120217
http://slidepdf.com/reader/full/uk-trading-value-indicator-20120217 11/25
Intellisys www.intellisys.uk.com 17 February 2012
Page 11 of 25 ©Intellisys 17 February 2012
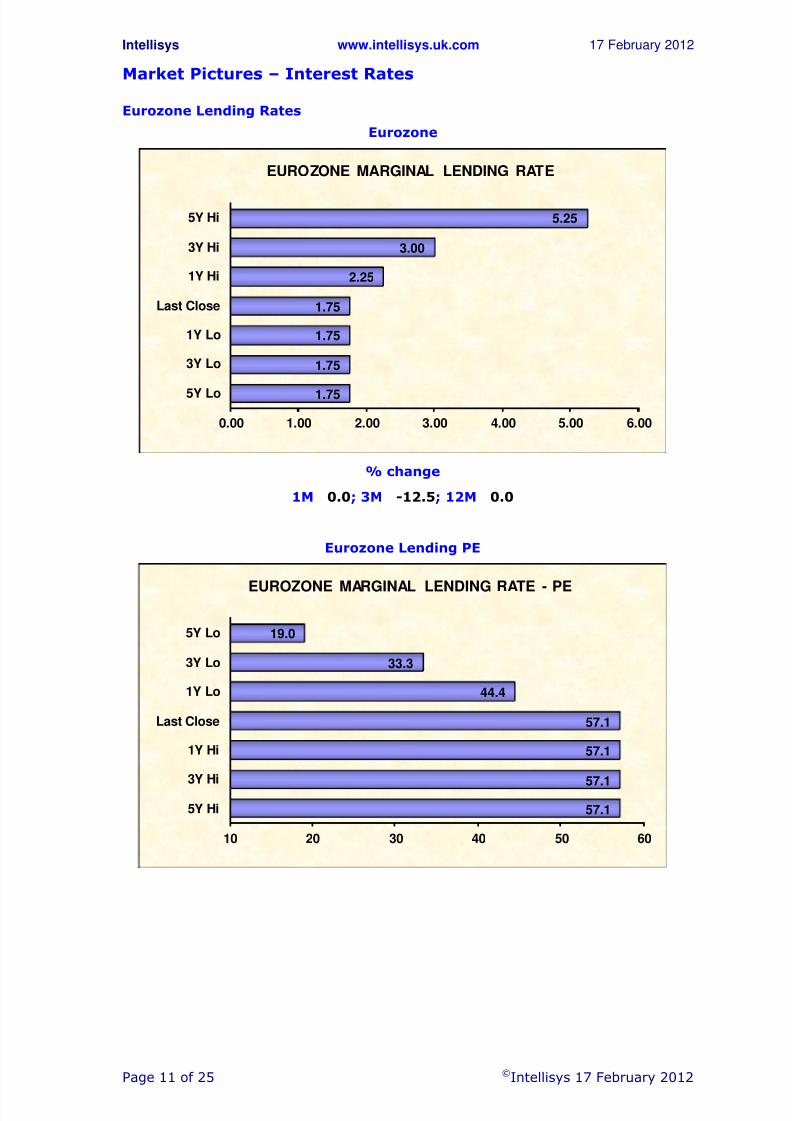
Market Pictures – Interest Rates
Eurozone Lending Rates
Eurozone
1.75
1.75
1.75
1.75
2.25
3.00
5.25
0.00 1.00 2.00 3.00 4.00 5.00 6.00
5Y Lo
3Y Lo
1Y Lo
Last Close
1Y Hi
3Y Hi
5Y Hi
EUROZONE MARGINAL LENDING RATE
% change
1M 0.0; 3M -12.5; 12M 0.0
Eurozone Lending PE
57.1
57.1
57.1
57.1
44.4
33.3
19.0
10 20 30 40 50 60
5Y Hi
3Y Hi
1Y Hi
Last Close
1Y Lo
3Y Lo
5Y Lo
EUROZONE MARGINAL LENDING RATE - PE

8/3/2019 uk trading & value indicator 20120217
http://slidepdf.com/reader/full/uk-trading-value-indicator-20120217 12/25
Intellisys www.intellisys.uk.com 17 February 2012
Page 12 of 25 ©Intellisys 17 February 2012
Market Pictures – Interest Rates
US Federal Funds Rate
US
0.04
0.04
0.04
0.12
0.17
0.25
5.41
0.00 1.00 2.00 3.00 4.00 5.00 6.00
5Y Lo
3Y Lo
1Y Lo
Last Close
1Y Hi
3Y Hi
5Y Hi
US FEDERAL FUNDS RATE
% change
1M 50.0; 3M 50.0; 12M -20.0
US Lending PE
2,500.0
2,500.0
2,500.0
833.3
588.2
400.0
18.5
10 510 1010 1510 2010 2510 3010
5Y Hi
3Y Hi
1Y Hi
Last Close
1Y Lo
3Y Lo
5Y Lo
US FEDERAL FUNDS RATE - PE

8/3/2019 uk trading & value indicator 20120217
http://slidepdf.com/reader/full/uk-trading-value-indicator-20120217 13/25
Intellisys www.intellisys.uk.com 17 February 2012
Page 13 of 25 ©Intellisys 17 February 2012
Market Pictures – Exchange Rates
US$/£
1.37
1.38
1.53
1.57
1.67
1.70
2.11
1.00 1.20 1.40 1.60 1.80 2.00 2.20
5Y Lo
3Y Lo
1Y Lo
Last Close
1Y Hi
3Y Hi
5Y Hi
US$/£
% change
1M 2.7; 3M -0.3; 12M -1.8
€/£
1.02
1.06
1.11
1.21
1.21
1.24
1.50
1.00 1.10 1.20 1.30 1.40 1.50 1.60
5Y Lo
3Y Lo
1Y Lo
Last Close
1Y Hi
3Y Hi
5Y Hi
EURO/£
% change
1M -0.2; 3M 3.5; 12M 1.8
8/3/2019 uk trading & value indicator 20120217
http://slidepdf.com/reader/full/uk-trading-value-indicator-20120217 14/25
Intellisys www.intellisys.uk.com 17 February 2012
Page 14 of 25 ©Intellisys 17 February 2012
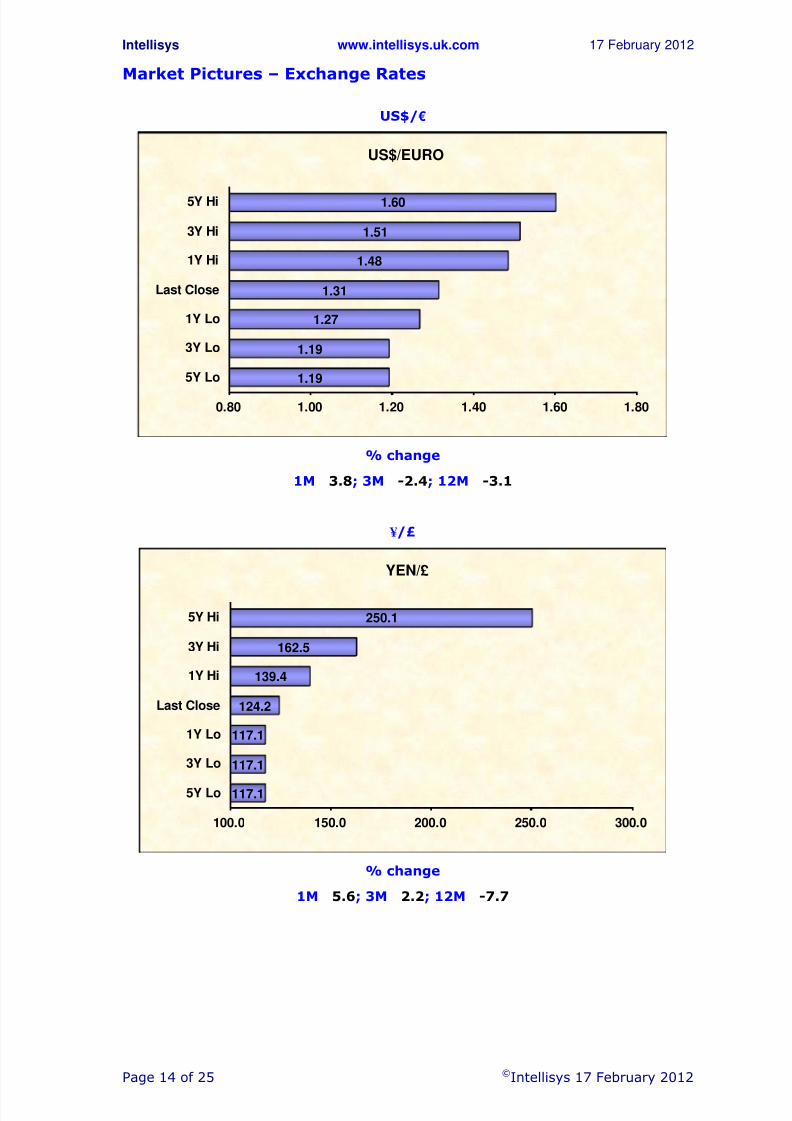
Market Pictures – Exchange Rates
US$/€
1.19
1.19
1.27
1.31
1.48
1.51
1.60
0.80 1.00 1.20 1.40 1.60 1.80
5Y Lo
3Y Lo
1Y Lo
Last Close
1Y Hi
3Y Hi
5Y Hi
US$/EURO
% change
1M 3.8; 3M -2.4; 12M -3.1
¥ /£
117.1
117.1
117.1
124.2
139.4
162.5
250.1
100.0 150.0 200.0 250.0 300.0
5Y Lo
3Y Lo
1Y Lo
Last Close
1Y Hi
3Y Hi
5Y Hi
YEN/£
% change
1M 5.6; 3M 2.2; 12M -7.7

8/3/2019 uk trading & value indicator 20120217
http://slidepdf.com/reader/full/uk-trading-value-indicator-20120217 15/25
Intellisys www.intellisys.uk.com 17 February 2012
Page 15 of 25 ©Intellisys 17 February 2012
Market Pictures - Oil
Brent – Monthly FOB US$/bbl
34.6
39.1
102.4
120.1
126.6
126.6
145.6
0 50 100 150 200
5Y Lo
3Y Lo
1Y Lo
Last Close
1Y Hi
3Y Hi
5Y Hi
Oil (Brent) Monthly FOB U$/bbl
% change
1M 7.63; 3M 6.95; 12M 16.86
RISK WARNING – Recommendations and Target Prices
Intellisys does not make personal recommendations. The information in thispublication is provided solely to enable you to make your own investmentdecisions.
If you are unsure about dealing in shares and other equity investments, you
should contact your financial adviser as these types of investments may not besuitable for everyone.
The value of stocks and shares, and the income from them, can fall as well as riseand you may not get back the full amount you originally invested. If denominatedin a foreign currency, fluctuations in the exchange rate will also affect the valueof stocks and shares and the income from them. Past performance is notnecessarily a guide to future performance.

8/3/2019 uk trading & value indicator 20120217
http://slidepdf.com/reader/full/uk-trading-value-indicator-20120217 16/25
Intellisys www.intellisys.uk.com 17 February 2012
Page 16 of 25 ©Intellisys 17 February 2012
Aerospace & Defence Over Valued
Stock Price 12M Lo 12M Hi ST Rec LT Rec Target Beta
BAE SYSTEMS 325.20 248.10 342.70 Neutral Strong Buy 614 0.65
CHEMRING GROUP 422.90 368.80 736.50 Neutral Buy 486 0.52
COBHAM 188.90 165.90 236.50 Neutral Buy 239 0.93
MEGGITT 374.00 305.00 397.60 Neutral Sell 335 1.33
ROLLS-ROYCE HOLDINGS 790.00 552.19 790.00 Neutral Sell 595 1.08
SMITHS GROUP 1056.00 869.50 1378.00 Neutral Neutral 1043 0.71
ULTRA ELECTRONICS HDG. 1638.00 1305.00 1808.00 Neutral Sell 1287 0.59
UMECO 343.00 243.50 506.50 Neutral Neutral 362 0.79
Automobiles & Parts Over Valued
Stock Price 12M Lo 12M Hi ST Rec LT Rec Target Beta
GKN 219.20 157.00 245.00 Neutral Sell 173 1.95
INCHCAPE 360.00 268.60 425.40 Neutral Sell 314 1.42
LOOKERS 57.00 47.00 72.75 Neutral Buy 71 1.34
PENDRAGON 11.75 6.80 19.71 Neutral Neutral 12 1.12
Banks Over Valued Stock Price 12M Lo 12M Hi ST Rec LT Rec Target Beta
BARCLAYS 244.90 138.85 333.55 Neutral Sell 154 1.84
HSBC HDG. (ORD $0.50) 573.60 463.50 730.90 Neutral Strong Buy 941 1.13
LLOYDS BANKING GROUP 34.38 21.84 69.30 Sell Strong Buy 162 1.75
ROYAL BANK OF SCTL.GP. 26.75 17.34 49.00 Sell Sell -20 1.28
STANDARD CHARTERED 1623.50 1169.50 1712.50 Neutral Sell 1143 1.70
Beverages Over Valued
Stock Price 12M Lo 12M Hi ST Rec LT Rec Target Beta
BARR (AG) 1200.00 1031.00 1395.00 Neutral Neutral 1247 0.41
DIAGEO 1500.00 1112.00 1509.50 Neutral Sell 1340 0.54
SABMILLER 2552.50 1979.00 2563.50 Neutral Buy 2930 0.98
Chemicals Over Valued
Stock Price 12M Lo 12M Hi ST Rec LT Rec Target Beta
CRODA INTERNATIONAL 2037.00 1483.00 2091.00 Neutral Sell 1603 1.06
ELEMENTIS 166.90 107.50 187.40 Neutral Neutral 163 1.08
JOHNSON MATTHEY 2315.00 1523.00 2327.00 Neutral Sell 2136 1.45
VICTREX 1330.00 1025.00 1590.00 Neutral Neutral 1336 1.23
YULE CATTO 207.80 148.00 253.00 Neutral Strong Buy 324 1.27
ZOTEFOAMS 149.00 109.00 158.00 Neutral Buy 217 1.03

8/3/2019 uk trading & value indicator 20120217
http://slidepdf.com/reader/full/uk-trading-value-indicator-20120217 17/25
Intellisys www.intellisys.uk.com 17 February 2012
Page 17 of 25 ©Intellisys 17 February 2012
Construction & Building Materials Over Valued Stock Price 12M Lo 12M Hi ST Rec LT Rec Target Beta
BALFOUR BEATTY 279.10 214.60 357.30 Neutral Buy 308 0.85
BARRATT DEVELOPMENTS 122.70 67.50 124.40 Neutral Sell 66 1.42
BELLWAY 782.50 540.50 798.00 Neutral Sell 698 1.01
BERKELEY GROUP HDG.(THE) 1316.00 960.00 1360.00 Neutral Neutral 1356 0.68
BOVIS HOMES GROUP 495.60 326.50 499.60 Neutral Sell 212 1.07
CARILLION 321.60 281.00 403.20 Neutral Strong Buy 487 1.10
CLARKE (T) 39.75 35.50 105.00 Neutral Strong Buy 201 0.82COSTAIN GROUP 195.25 180.00 265.00 Neutral Strong Buy 767 0.59
GALLIFORD TRY 499.50 332.75 530.00 Neutral Buy 573 1.02
KELLER 410.00 239.25 671.50 Neutral Neutral 428 1.31
KIER GROUP 1432.00 1097.00 1461.00 Neutral Strong Buy 3153 1.05
LOW & BONAR 62.50 38.00 76.75 Neutral Neutral 63 1.08
MARSHALLS 98.50 83.25 124.50 Neutral Sell 72 1.35
MORGAN SINDALL GROUP 700.00 510.00 725.00 Neutral Strong Buy 1453 0.90
PERSIMMON 565.00 374.00 567.50 Neutral Buy 655 1.07
REDROW 127.00 103.50 136.20 Neutral Sell 90 0.97
SIG 103.00 76.95 153.50 Neutral Sell 6 1.58
TAYLOR WIMPEY 45.27 28.71 45.27 Sell Sell 14 1.50
TRAVIS PERKINS 967.00 715.00 1090.00 Neutral Buy 1119 1.87
WOLSELEY 2355.00 1404.00 2355.00 Neutral Sell 1811 1.41
Electronics & Electrical Equipment Under Valued
Stock Price 12M Lo 12M Hi ST Rec LT Rec Target Beta
DIALIGHT 785.00 608.50 847.00 Neutral Sell 450 0.74
DOMINO PRINTING SCIENCES 615.50 434.30 705.00 Neutral Neutral 640 1.17
E2V TECHNOLOGIES 127.00 86.75 146.00 Neutral Buy 158 1.32
INVENSYS 215.00 180.90 357.80 Neutral Strong Buy 380 1.48
LAIRD 166.20 127.90 207.00 Neutral Neutral 170 2.20
OXFORD INSTRUMENTS 1087.00 600.50 1102.00 Neutral Sell 809 0.96
RENISHAW 1450.00 800.00 1886.00 Neutral Buy 1881 1.28
SPECTRIS 1660.00 1039.00 1679.00 Neutral Sell 1222 1.40
BIOME TECHNOLOGIES 0.14 0.14 0.28 Buy Strong Buy 0 0.62
TT ELECTRONICS 176.00 120.50 208.00 Neutral Buy 241 1.59
XAAR 260.00 207.50 295.00 Neutral Sell 127 1.12
Engineering & Machinery Over Valued
Stock Price 12M Lo 12M Hi ST Rec LT Rec Target Beta
AGA RANGEMASTER GROUP 78.25 62.50 138.00 Neutral Strong Buy 292 1.33
BODYCOTE 333.50 225.60 397.70 Neutral Neutral 350 1.59
CASTINGS 292.00 252.50 358.00 Neutral Strong Buy 505 0.95
COOKSON GROUP 622.00 395.80 724.50 Neutral Buy 757 2.28
FENNER 452.30 280.00 465.80 Neutral Neutral 453 1.41
HALMA 378.00 306.30 429.60 Neutral Neutral 360 0.76
HILL & SMITH 308.63 235.00 393.50 Neutral Strong Buy 576 1.39
IMI 926.50 636.50 1119.00 Neutral Buy 1334 1.42
METALRAX GROUP 7.75 7.25 12.00 Neutral Sell 6 0.85
MORGAN C RUCIBLE 344.40 224.00 357.10 Neutral Neutral 335 1.76
ROTORK 1975.00 1501.00 1979.00 Neutral Sell 1734 1.00
SENIOR 182.00 132.60 190.60 Neutral Neutral 182 1.76
SEVERFIELD-ROWEN 219.50 150.00 272.00 Sell Sell 169 1.06
SPIRAX-SARCO 2040.00 1649.00 2089.00 Neutral Neutral 2201 0.86
VITEC GROUP 566.25 488.00 661.75 Neutral Buy 723 1.50
WEIR GROUP 1969.00 1375.00 2218.00 Neutral Sell 788 1.40

8/3/2019 uk trading & value indicator 20120217
http://slidepdf.com/reader/full/uk-trading-value-indicator-20120217 18/25
Intellisys www.intellisys.uk.com 17 February 2012
Page 18 of 25 ©Intellisys 17 February 2012
Food & Drug Stores Under Valued
Stock Price 12M Lo 12M Hi ST Rec LT Rec Target Beta
GREGGS 535.00 445.00 550.50 Neutral Sell 346 0.53
MORRISON(WM)SPMKTS. 295.70 268.50 328.00 Neutral Buy 357 0.45
SAINSBURY (J) 296.00 263.50 385.00 Neutral Strong Buy 541 0.63
TESCO 320.30 312.35 420.05 Neutral Buy 415 0.74
THORNTONS 22.75 9.50 94.00 Sell Sell 21 0.72
Food Producers & Processors Over Valued
Stock Price 12M Lo 12M Hi ST Rec LT Rec Target Beta
ASSOCIATED BRIT.FOODS 1228.00 940.00 1228.00 Sell Sell 574 0.60
CRANSWICK 803.50 588.50 862.00 Neutral Sell 755 0.59
DAIRY CREST 332.60 311.00 409.70 Neutral Buy 371 0.94
DEVRO 284.20 232.00 296.90 Neutral Strong Buy 433 0.30
PREMIER FOODS 11.25 3.29 35.12 Neutral Sell -2 1.43
ROBERT WISEMAN DAIRIES 389.50 233.25 389.50 Neutral Buy 534 0.49
TATE & LYLE 708.50 520.00 720.50 Neutral Sell 415 0.64
UNILEVER (UK) 2070.00 1796.00 2189.00 Neutral Sell 1903 0.61
General Retail Over Valued
Stock Price 12M Lo 12M Hi ST Rec LT Rec Target Beta
ASHLEY(LAURA) HOLDINGS 21.50 16.00 25.25 Neutral Buy 25 0.71
BROWN (N) GROUP 252.60 227.00 304.50 Neutral Sell 217 0.49
BURBERRY GROUP 1432.00 1092.00 1600.00 Neutral Sell 476 1.37
CARPETRIGHT 613.00 375.00 770.50 Sell Sell 169 1.03
CLINTON CARDS 11.25 7.50 27.00 Sell Sell 8 0.64
DIXONS RETAIL 14.41 9.36 21.26 Neutral Strong Buy 24 1.44
FINDEL 3.50 2.20 9.69 Neutral Sell 2 0.95
FRENCH CONNECTN.GROUP 47.25 36.00 134.00 Neutral Strong Buy 90 0.95
GAME GROUP 6.53 3.26 67.75 Neutral Strong Buy 146 0.83
HALFORDS GROUP 318.20 269.50 408.60 Neutral Buy 352 0.64
JJB SPORTS 10.75 5.20 38.10 Sell Strong Buy 1149 0.86
JD SPORTS FASHION 860.00 570.00 1030.00 Neutral Buy 1086 0.47KESA ELECTRICALS 80.35 60.20 151.40 Neutral Strong Buy 251 1.27
KINGFISHER 278.00 217.00 287.10 Neutral Sell 253 0.98
MARKS & SPENCER GROUP 347.90 301.80 402.20 Neutral Neutral 334 0.74
MOSS BROTHERS GROUP 38.50 25.50 40.00 Sell Sell 19 1.02
MOTHERCARE 216.00 127.30 499.90 Neutral Buy 300 0.54
NEXT 2779.00 1868.00 2810.00 Neutral Sell 1918 0.79
TED BAKER 768.00 572.50 830.00 Neutral Sell 411 0.55
TOPPS TILES 31.25 21.50 79.00 Neutral Sell 18 1.32
Health Over Valued
Stock Price 12M Lo 12M Hi ST Rec LT Rec Target Beta
CONSORT MEDICAL 565.00 498.00 590.00 Neutral Sell 510 0.39CORIN GROUP 51.00 36.50 59.00 Neutral Sell 47 0.72
SMITH & NEPHEW 635.00 521.00 742.00 Neutral Neutral 647 0.37
Household Goods & Textiles Under Valued
Stock Price 12M Lo 12M Hi ST Rec LT Rec Target Beta
HARVARD INTL. 38.63 21.75 40.00 Neutral Sell 32 0.47
GAMES WORKSHOP 487.50 357.50 547.50 Neutral Sell 425 0.37
HEADLAM GROUP 295.13 233.25 313.50 Neutral Buy 336 0.93
HORNBY 102.00 99.00 145.00 Neutral Buy 138 0.64
8/3/2019 uk trading & value indicator 20120217
http://slidepdf.com/reader/full/uk-trading-value-indicator-20120217 19/25
Intellisys www.intellisys.uk.com 17 February 2012
Page 19 of 25 ©Intellisys 17 February 2012
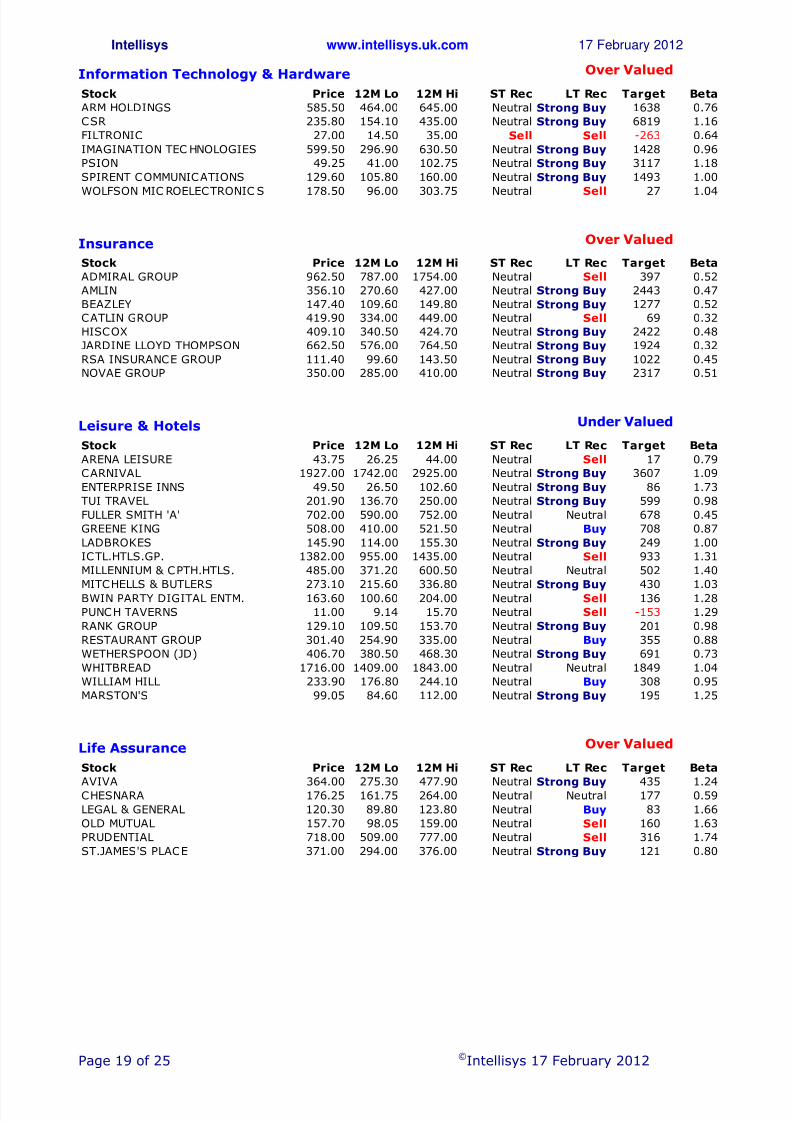
Information Technology & Hardware Over Valued
Stock Price 12M Lo 12M Hi ST Rec LT Rec Target Beta
ARM HOLDINGS 585.50 464.00 645.00 Neutral Strong Buy 1638 0.76
CSR 235.80 154.10 435.00 Neutral Strong Buy 6819 1.16
FILTRONIC 27.00 14.50 35.00 Sell Sell -263 0.64
IMAGINATION TEC HNOLOGIES 599.50 296.90 630.50 Neutral Strong Buy 1428 0.96
PSION 49.25 41.00 102.75 Neutral Strong Buy 3117 1.18
SPIRENT COMMUNICATIONS 129.60 105.80 160.00 Neutral Strong Buy 1493 1.00
WOLFSON MIC ROELECTRONIC S 178.50 96.00 303.75 Neutral Sell 27 1.04
Insurance Over Valued
Stock Price 12M Lo 12M Hi ST Rec LT Rec Target Beta
ADMIRAL GROUP 962.50 787.00 1754.00 Neutral Sell 397 0.52
AMLIN 356.10 270.60 427.00 Neutral Strong Buy 2443 0.47
BEAZLEY 147.40 109.60 149.80 Neutral Strong Buy 1277 0.52
CATLIN GROUP 419.90 334.00 449.00 Neutral Sell 69 0.32
HISCOX 409.10 340.50 424.70 Neutral Strong Buy 2422 0.48
JARDINE LLOYD THOMPSON 662.50 576.00 764.50 Neutral Strong Buy 1924 0.32
RSA INSURANCE GROUP 111.40 99.60 143.50 Neutral Strong Buy 1022 0.45
NOVAE GROUP 350.00 285.00 410.00 Neutral Strong Buy 2317 0.51
Leisure & Hotels Under Valued
Stock Price 12M Lo 12M Hi ST Rec LT Rec Target Beta
ARENA LEISURE 43.75 26.25 44.00 Neutral Sell 17 0.79
CARNIVAL 1927.00 1742.00 2925.00 Neutral Strong Buy 3607 1.09
ENTERPRISE INNS 49.50 26.50 102.60 Neutral Strong Buy 86 1.73
TUI TRAVEL 201.90 136.70 250.00 Neutral Strong Buy 599 0.98
FULLER SMITH 'A' 702.00 590.00 752.00 Neutral Neutral 678 0.45
GREENE KING 508.00 410.00 521.50 Neutral Buy 708 0.87
LADBROKES 145.90 114.00 155.30 Neutral Strong Buy 249 1.00
ICTL.HTLS.GP. 1382.00 955.00 1435.00 Neutral Sell 933 1.31
MILLENNIUM & CPTH.HTLS. 485.00 371.20 600.50 Neutral Neutral 502 1.40
MITCHELLS & BUTLERS 273.10 215.60 336.80 Neutral Strong Buy 430 1.03BWIN PARTY DIGITAL ENTM. 163.60 100.60 204.00 Neutral Sell 136 1.28
PUNCH TAVERNS 11.00 9.14 15.70 Neutral Sell -153 1.29
RANK GROUP 129.10 109.50 153.70 Neutral Strong Buy 201 0.98
RESTAURANT GROUP 301.40 254.90 335.00 Neutral Buy 355 0.88
WETHERSPOON (JD) 406.70 380.50 468.30 Neutral Strong Buy 691 0.73
WHITBREAD 1716.00 1409.00 1843.00 Neutral Neutral 1849 1.04
WILLIAM HILL 233.90 176.80 244.10 Neutral Buy 308 0.95
MARSTON'S 99.05 84.60 112.00 Neutral Strong Buy 195 1.25
Life Assurance Over Valued
Stock Price 12M Lo 12M Hi ST Rec LT Rec Target Beta
AVIVA 364.00 275.30 477.90 Neutral Strong Buy 435 1.24CHESNARA 176.25 161.75 264.00 Neutral Neutral 177 0.59
LEGAL & GENERAL 120.30 89.80 123.80 Neutral Buy 83 1.66
OLD MUTUAL 157.70 98.05 159.00 Neutral Sell 160 1.63
PRUDENTIAL 718.00 509.00 777.00 Neutral Sell 316 1.74
ST.JAMES'S PLACE 371.00 294.00 376.00 Neutral Strong Buy 121 0.80
8/3/2019 uk trading & value indicator 20120217
http://slidepdf.com/reader/full/uk-trading-value-indicator-20120217 20/25
Intellisys www.intellisys.uk.com 17 February 2012
Page 20 of 25 ©Intellisys 17 February 2012
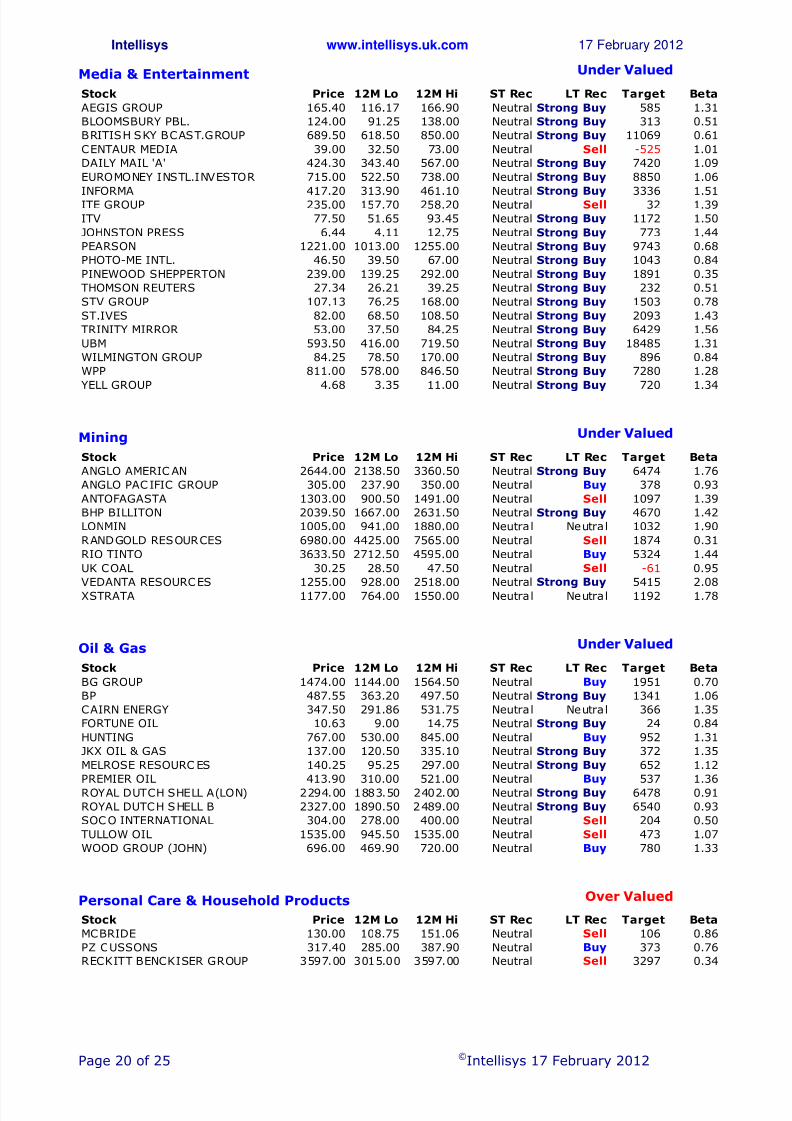
Media & Entertainment Under Valued
Stock Price 12M Lo 12M Hi ST Rec LT Rec Target Beta
AEGIS GROUP 165.40 116.17 166.90 Neutral Strong Buy 585 1.31
BLOOMSBURY PBL. 124.00 91.25 138.00 Neutral Strong Buy 313 0.51
BRITISH SKY BCAST.GROUP 689.50 618.50 850.00 Neutral Strong Buy 11069 0.61
CENTAUR MEDIA 39.00 32.50 73.00 Neutral Sell -525 1.01
DAILY MAIL 'A' 424.30 343.40 567.00 Neutral Strong Buy 7420 1.09
EUROMONEY INSTL.INVESTOR 715.00 522.50 738.00 Neutral Strong Buy 8850 1.06
INFORMA 417.20 313.90 461.10 Neutral Strong Buy 3336 1.51ITE GROUP 235.00 157.70 258.20 Neutral Sell 32 1.39
ITV 77.50 51.65 93.45 Neutral Strong Buy 1172 1.50
JOHNSTON PRESS 6.44 4.11 12.75 Neutral Strong Buy 773 1.44
PEARSON 1221.00 1013.00 1255.00 Neutral Strong Buy 9743 0.68
PHOTO-ME INTL. 46.50 39.50 67.00 Neutral Strong Buy 1043 0.84
PINEWOOD SHEPPERTON 239.00 139.25 292.00 Neutral Strong Buy 1891 0.35
THOMSON REUTERS 27.34 26.21 39.25 Neutral Strong Buy 232 0.51
STV GROUP 107.13 76.25 168.00 Neutral Strong Buy 1503 0.78
ST.IVES 82.00 68.50 108.50 Neutral Strong Buy 2093 1.43
TRINITY MIRROR 53.00 37.50 84.25 Neutral Strong Buy 6429 1.56
UBM 593.50 416.00 719.50 Neutral Strong Buy 18485 1.31
WILMINGTON GROUP 84.25 78.50 170.00 Neutral Strong Buy 896 0.84
WPP 811.00 578.00 846.50 Neutral Strong Buy 7280 1.28
YELL GROUP 4.68 3.35 11.00 Neutral Strong Buy 720 1.34
Mining Under Valued
Stock Price 12M Lo 12M Hi ST Rec LT Rec Target Beta
ANGLO AMERICAN 2644.00 2138.50 3360.50 Neutral Strong Buy 6474 1.76
ANGLO PACIFIC GROUP 305.00 237.90 350.00 Neutral Buy 378 0.93
ANTOFAGASTA 1303.00 900.50 1491.00 Neutral Sell 1097 1.39
BHP BILLITON 2039.50 1667.00 2631.50 Neutral Strong Buy 4670 1.42
LONMIN 1005.00 941.00 1880.00 Neutral Neutral 1032 1.90
RANDGOLD RESOURCES 6980.00 4425.00 7565.00 Neutral Sell 1874 0.31
RIO TINTO 3633.50 2712.50 4595.00 Neutral Buy 5324 1.44
UK COAL 30.25 28.50 47.50 Neutral Sell -61 0.95
VEDANTA RESOURCES 1255.00 928.00 2518.00 Neutral Strong Buy 5415 2.08
XSTRATA 1177.00 764.00 1550.00 Neutral Neutral 1192 1.78
Oil & Gas Under Valued
Stock Price 12M Lo 12M Hi ST Rec LT Rec Target Beta
BG GROUP 1474.00 1144.00 1564.50 Neutral Buy 1951 0.70
BP 487.55 363.20 497.50 Neutral Strong Buy 1341 1.06
CAIRN ENERGY 347.50 291.86 531.75 Neutral Neutral 366 1.35
FORTUNE OIL 10.63 9.00 14.75 Neutral Strong Buy 24 0.84
HUNTING 767.00 530.00 845.00 Neutral Buy 952 1.31
JKX OIL & GAS 137.00 120.50 335.10 Neutral Strong Buy 372 1.35
MELROSE RESOURC ES 140.25 95.25 297.00 Neutral Strong Buy 652 1.12
PREMIER OIL 413.90 310.00 521.00 Neutral Buy 537 1.36
ROYAL DUTCH SHELL A(LON) 2294.00 1883.50 2402.00 Neutral Strong Buy 6478 0.91
ROYAL DUTCH SHELL B 2327.00 1890.50 2489.00 Neutral Strong Buy 6540 0.93
SOCO INTERNATIONAL 304.00 278.00 400.00 Neutral Sell 204 0.50
TULLOW OIL 1535.00 945.50 1535.00 Neutral Sell 473 1.07
WOOD GROUP (JOHN) 696.00 469.90 720.00 Neutral Buy 780 1.33
Personal Care & Household Products Over Valued
Stock Price 12M Lo 12M Hi ST Rec LT Rec Target Beta
MCBRIDE 130.00 108.75 151.06 Neutral Sell 106 0.86
PZ CUSSONS 317.40 285.00 387.90 Neutral Buy 373 0.76
RECKITT BENCKISER GROUP 3597.00 3015.00 3597.00 Neutral Sell 3297 0.34

8/3/2019 uk trading & value indicator 20120217
http://slidepdf.com/reader/full/uk-trading-value-indicator-20120217 21/25

8/3/2019 uk trading & value indicator 20120217
http://slidepdf.com/reader/full/uk-trading-value-indicator-20120217 22/25
Intellisys www.intellisys.uk.com 17 February 2012
Page 22 of 25 ©Intellisys 17 February 2012
Support Services Under Valued
Stock Price 12M Lo 12M Hi ST Rec LT Rec Target Beta
ACAL 176.50 166.25 367.50 Neutral Strong Buy 344 0.92
AGGREKO 2172.00 1394.48 2190.00 Neutral Sell 1282 1.18
AMEC 1078.00 740.50 1207.00 Neutral Buy 1305 1.02
ASHTEAD GROUP 244.30 99.40 252.50 Neutral Sell 130 1.50
BABCOCK INTL. 746.50 542.00 758.00 Neutral Neutral 714 0.55
BRITISH POLYTHENE INDS. 355.75 230.00 364.88 Neutral Strong Buy 1092 0.71
BUNZL 915.00 676.50 915.00 Neutral Buy 1027 0.54UK MAIL GROUP 245.50 192.25 318.50 Neutral Strong Buy 551 0.30
CAPITA 652.50 611.50 786.50 Neutral Neutral 715 0.41
COMMUNISIS 36.00 23.75 37.00 Neutral Strong Buy 100 0.73
COMPASS GROUP 637.50 512.50 639.00 Neutral Buy 788 0.73
BERENDSEN 456.60 402.70 568.00 Neutral Strong Buy 717 1.03
DE LA RUE 990.00 699.00 1001.00 Neutral Neutral 1058 #NA
DIGNITY 755.50 666.50 854.50 Neutral Buy 972 0.21
DIPLOMA 392.30 263.50 425.50 Neutral Buy 491 1.02
ELECTROCOMP. 236.30 182.20 294.90 Neutral Strong Buy 380 1.03
FILTRONA 400.00 293.00 404.50 Neutral Neutral 439 1.12
G4S 284.20 219.90 291.00 Neutral Buy 395 0.59
HAYS 80.50 58.85 130.00 Neutral Strong Buy 145 0.98
HOMESERVE 245.30 218.50 532.00 Neutral Strong Buy 481 0.67
INTERSERVE 312.60 239.75 341.25 Neutral Strong Buy 805 1.36
INTERTEK GROUP 2237.00 1738.00 2237.00 Sell Sell 1659 0.86
JOHNSON SERVICE GROUP 26.50 25.25 36.00 Neutral Strong Buy 68 1.16
MANAGEMENT C NSL.GP. 33.75 27.75 45.50 Neutral Strong Buy 58 0.66
MENZIES (JOHN) 580.00 425.00 614.00 Neutral Strong Buy 1233 1.45
MICHAEL PAGE INTL. 415.60 323.00 567.00 Neutral Neutral 448 1.35
MITIE GROUP 266.30 195.90 271.00 Neutral Strong Buy 410 0.61
MOUCHEL GROUP 14.50 4.75 154.75 Sell Sell -300 0.89
OFFICE2OFFICE 146.00 114.00 166.50 Neutral Strong Buy 288 0.36
PAYPOINT 565.00 327.25 585.00 Neutral Buy 751 0.76
PREMIER FARNELL 214.70 144.50 308.80 Neutral Strong Buy 360 1.21
REGUS 112.00 64.00 119.00 Neutral Sell 71 1.41
RENTOKIL INITIAL 75.70 58.20 100.90 Neutral Sell 50 1.31
REXAM 376.40 299.80 400.00 Neutral Buy 540 0.88
RICARDO 363.00 325.00 410.00 Neutral Strong Buy 559 0.81
ROBERT WALTERS 224.00 158.25 336.00 Neutral Strong Buy 355 1.21
RPC GROUP 382.90 231.50 393.20 Neutral Buy 454 0.81
RPS GROUP 220.00 156.60 253.00 Neutral Buy 305 1.58
SERCO GROUP 532.50 458.00 618.50 Neutral Buy 683 0.57
SHANKS GROUP 105.20 90.80 130.90 Neutral Strong Buy 168 1.45
SPEEDY HIRE 28.00 18.50 34.00 Neutral Sell -8 1.30
TRIBAL GROUP 70.38 36.25 71.00 Neutral Sell -332 0.60
TRIFAST 41.00 36.25 52.88 Neutral Strong Buy 64 0.88
VP 249.25 191.00 256.00 Neutral Strong Buy 599 0.88
WYG 48.00 47.50 1125.00 Neutral Sell -8679 0.76
WSP GROUP 245.00 160.00 385.00 Neutral Strong Buy 582 0.96
Telecommunication Services Under Valued Stock Price 12M Lo 12M Hi ST Rec LT Rec Target Beta
BT GROUP 212.40 161.00 216.00 Neutral Buy 256 0.93
CABLE & WIRELESS COMMS. 35.50 31.25 51.20 Neutral Strong Buy 137 0.68
INMARSAT 468.90 389.30 692.00 Neutral Sell 376 0.51
KCOM GROUP 70.50 58.50 84.00 Neutral Buy 82 1.27
TELECOM PLUS 648.00 440.00 802.00 Neutral Sell 456 0.04
VODAFONE GROUP 173.85 155.05 182.70 Neutral Neutral 191 0.63
8/3/2019 uk trading & value indicator 20120217
http://slidepdf.com/reader/full/uk-trading-value-indicator-20120217 23/25
Intellisys www.intellisys.uk.com 17 February 2012
Page 23 of 25 ©Intellisys 17 February 2012
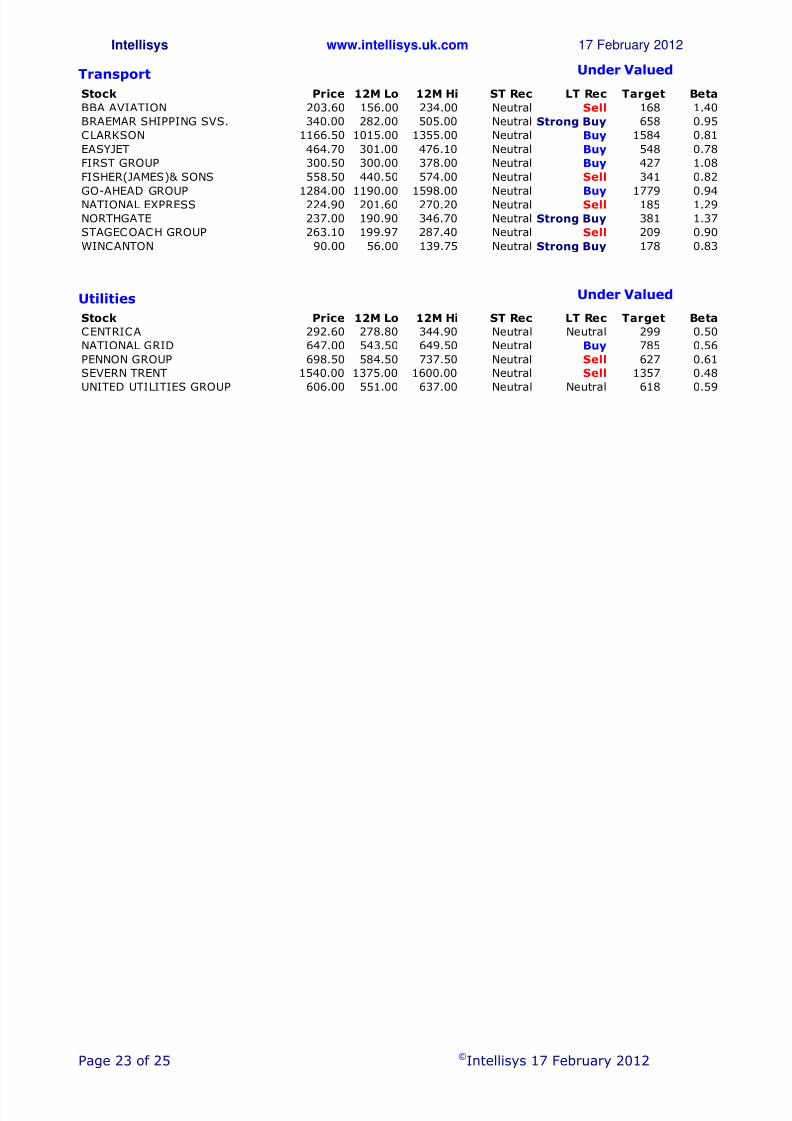
Transport Under Valued
Stock Price 12M Lo 12M Hi ST Rec LT Rec Target Beta
BBA AVIATION 203.60 156.00 234.00 Neutral Sell 168 1.40
BRAEMAR SHIPPING SVS. 340.00 282.00 505.00 Neutral Strong Buy 658 0.95
CLARKSON 1166.50 1015.00 1355.00 Neutral Buy 1584 0.81
EASYJET 464.70 301.00 476.10 Neutral Buy 548 0.78
FIRST GROUP 300.50 300.00 378.00 Neutral Buy 427 1.08
FISHER(JAMES)& SONS 558.50 440.50 574.00 Neutral Sell 341 0.82
GO-AHEAD GROUP 1284.00 1190.00 1598.00 Neutral Buy 1779 0.94NATIONAL EXPRESS 224.90 201.60 270.20 Neutral Sell 185 1.29
NORTHGATE 237.00 190.90 346.70 Neutral Strong Buy 381 1.37
STAGECOACH GROUP 263.10 199.97 287.40 Neutral Sell 209 0.90
WINCANTON 90.00 56.00 139.75 Neutral Strong Buy 178 0.83
Utilities Under Valued
Stock Price 12M Lo 12M Hi ST Rec LT Rec Target Beta
CENTRICA 292.60 278.80 344.90 Neutral Neutral 299 0.50
NATIONAL GRID 647.00 543.50 649.50 Neutral Buy 785 0.56
PENNON GROUP 698.50 584.50 737.50 Neutral Sell 627 0.61
SEVERN TRENT 1540.00 1375.00 1600.00 Neutral Sell 1357 0.48
UNITED UTILITIES GROUP 606.00 551.00 637.00 Neutral Neutral 618 0.59

8/3/2019 uk trading & value indicator 20120217
http://slidepdf.com/reader/full/uk-trading-value-indicator-20120217 24/25
Intellisys www.intellisys.uk.com 17 February 2012
Page 24 of 25 ©Intellisys 17 February 2012
DISCLAIMER
Intelligent Analysis Limited has prepared this report. Intellisys (“Intellisys”) is the tradingname of Intelligent Analysis Limited.
Intelligent Analysis Limited is a provider of financial research reports that indicate the possiblevalue of quoted company shares. The information contained within any and all of Intellisys’
reports are designed to present an objective assessment of the possible value or relative valueof a company and/or an actuarial sector or stock market index. Intellisys utilises as extensiveas possible range of valuation tools and proprietary systems to derive its outputs. The basedata for the models are derived from sources believed to be accurate but Intelligent AnalysisLimited does not warrant or guarantee the accuracy or reliability of the source data or itsmodels and proprietary systems. Subscribers, and casual readers, should not rely upon theIntellisys’ research outputs when forming specific investment decisions but should seek advice
specific to their situation and investment requirements from a person authorized under theFinancial Services and Markets Act 2000, before entering into any investment agreement.
Intelligent Analysis Limited has used reasonable care and skill in compiling the content of thisreport. No representation or warranty, expressed or implied, is given by any person as to theaccuracy or completeness or accuracy of the information and no responsibility or liability is
accepted to the accuracy or sufficiency of any of the information, for any errors, omissions ormisstatements, negligent or otherwise. In no event will Intelligent Analysis Limited, Intellisysor any of its officers, employees or agents be liable to any other party for any direct, indirect,special or other consequential damages arising from the use of this report.
The Intelligent Analysis Limited and/or Intellisys reports are not directed to any person in any jurisdiction where (by reason of that person’s nationality, residence or otherwise) thepublication or availability of the Intelligent Analysis Limited and/or Intellisys information maybe prohibited. Persons in respect of whom such prohibitions apply must not access the
Intelligent Analysis Limited and/or Intellisys reports. Neither this document, nor any copy inwhatever form of media, may be taken or transmitted into the United States, Canada,Australia, Ireland, South Africa or Japan or into any jurisdiction where it would be unlawful todo so. Any failure to comply with this restriction may constitute a violation of relevant local
securities laws. Recipients of Intelligent Analysis Limited and/or Intellisys reports outside theUK are not covered by the rules and regulations made for the protection of investors in the UK.
Any user distributing information taken from any Intelligent Analysis Limited or Intellisysreport and/or the Intellisys website, in whatever form, to any other person, agrees to attach a
copy of this Disclaimer and the Terms and Conditions of Use pages and obtain the agreementof such other person to comply with the terms set forth.
Intellisys' published reports are published for information purposes and only available tomarket counterparties, high net-worth and sophisticated individual investors.
No Intellisys report constitutes an offer or invitation to trade, sell, purchase or acquire anyshares or other financial instruments in any company or any interest therein, nor shall it form
the basis of any contract entered into for the sale of shares or any other financial instrument inany company.
Intelligent Analysis Limited believes that the information within each and any of its reports tobe correct, but its accuracy or completeness cannot be guaranteed. No representation orwarranty, expressed or implied, is given by any person as to the accuracy or completeness of
the information and no responsibility or liability is accepted for the accuracy or sufficiency of any of the information, for any errors, omissions or mis-statements, negligent or otherwise.

8/3/2019 uk trading & value indicator 20120217
http://slidepdf.com/reader/full/uk-trading-value-indicator-20120217 25/25
Intellisys www.intellisys.uk.com 17 February 2012
Intelligent Analysis Limited (including its Directors, employees and representatives) or aconnected person may have positions in or options or other financial instruments on any of thesecurities mentioned within a report, and may buy, sell or offer to purchase or sell suchsecurities from time to time, subject to restrictions imposed by internal rules.
Subscribers, and casual reader, are reminded that the value of shares in any company may goup or down and that past performance is not necessarily a guide to future performance.
Intelligent Analysis Limited is not registered with or regulated by any financial regulatoryauthority and does not offer, provide or purport to provide or offer investment advice.
RISK WARNING – Recommendations and Target Prices
Intellisys does not make personal recommendations. The information in this publication isprovided solely to enable you to make your own investment decisions.
If you are unsure about dealing in shares and other equity investments, you should contactyour financial adviser as these types of investments may not be suitable for everyone.
The value of stocks and shares, and the income from them, can fall as well as rise and you
may not get back the full amount you originally invested. If denominated in a foreign currency,fluctuations in the exchange rate will also affect the value of stocks and shares and the incomefrom them. Past performance is not necessarily a guide to future performance.