uhde, andré - uni-paderborn.de. 6 / january 2015 uhde, andré risk-taking incentives through excess...
TRANSCRIPT

No. 6 / January 2015
Uhde, André
Risk-taking incentives through excess variable
compensation
Evidence from European banks
forthcoming in Quarterly Review of Economics and Finance (2015)

1
Risk-taking incentives through excess variable compensation
Evidence from European banks
André Uhde*1
Abstract: Employing compensation data provided by 63 banks from 16 European countries for the period from 2000 to
2010 this paper empirically investigates the impact of excess variable compensation on bank risk. As a main finding, we
provide evidence for a risk-increasing impact of excess variable pay for both executive variable cash-based and variable
equity-based compensation. This baseline finding holds under various robustness checks, in particular when controlling
for likely reverse causality between bank risk and variable compensation by employing Granger-causality tests and
instrumental variable regressions. In addition, results from a large number of sensitivity analyses including board and
banking characteristics as well as the financial crisis period and the quality of a country’s regulatory framework provide
further important implications for banking regulators and politicians in Europe.
JEL classification: G21, G28, G32, J33
Keywords: Banking, Executive compensation, Risk-taking, Financial Stability
* Prof. Dr. André Uhde, University of Paderborn, Department of Taxation, Accounting & Finance, 33098 Paderborn,
Germany, email: [email protected].

2
1 Introduction
The global financial crisis from mid-2007 has sparked a new heated discussion among
politicians, regulators and academics concerning compensation practices in banking. In particular,
many critics demand a strict regulation of bank executives’ remuneration since it is suggested that
especially incentives from variable compensation packages in banks may have provoked a
significant increase in managerial risk-taking and hence, may have been an additional cause of the
financial crisis (Board of Governors, 2010; FSB, 2009; Bebchuk and Spamann, 2010).
The noisy debate on managerial compensation in banking is clearly fueled by theoretical
predictions suggesting that risk-taking incentives from variable pay packages are expected to be
much stronger at banks than at non-financial companies (e.g., Mehran et al., 2011). The reason is
that banks are highly leveraged and, under limited liability, bank managers can shift risk to
dispersed and unsophisticated debtholders. In the presence of deposit insurance schemes and
implicit governmental bail-out guarantees under the “too-big-to-fail” doctrine, this risk shifting-
mechanism becomes even more relevant and can additionally affect taxpayers.
Accordingly, in 2009 the Financial Stability Board (FSB) responded to the G20 Finance-
Ministers’ and Governors’ call for detailed global standards on pay structures, greater disclosure
and transparency in banking (FSB, 2009). In particular, FSB Principles for Sound Compensation
Practices focus on (1) a deferral of variable compensation payments in order to reward long-term
success rather than short-term risk-taking, (2) the implementation of claw-back provisions that
allow recouping variable payments if management decisions fail later on, (3) the payment of
bonuses by means of stock options rather than cash and (4) a cap of the proportion of total variable
compensation.
As regards the latter principle, in 2013 the European Parliament and Council have decided that
annual bonuses for European bank executives must not exceed their annual fixed salary in general.
In exceptional cases, the bonus may reach a maximum of twice the salary, provided that 65% of
shareholders owning half the shares represented, or 75% of votes if there is no quorum, agree to the

3
increase. In addition, if variable payments exceed annual fixed salaries, then 25% of the entire
bonus would be deferred for at least five years in order to encourage bank executives to take a long-
term view during their management decisions. Respective regulations are included in the new
European Capital Requirements Directive (CRD IV, 2013) transforming forthcoming Basel III-
regulations into European banking law. Regulations apply to all bank executives working within
the EU as well as employees of European bank subsidiaries abroad. As a consequence, several large
European banks have simply increased annual fixed salaries for CEOs in order to bypass the cap of
the current total amount of variable compensation. Moreover, it is feared that European banks will
lose a competitive edge and that talented bank managers will be forced to move to more attractive
financial centers outside Europe.
Against this background, the empirical study at hand sheds a brighter light on the relationship
between variable compensation and managerial risk-taking in European banking. Our study
complements and extends two previous studies for Europe (Vallascas and Hagendorff, 2013; Ayadi
et al., 2011) in several aspects. First of all, a unique hand-collected data set is employed which
includes compensation data provided by the largest 63 European banks from 16 European countries.
This is, to best of our knowledge, the largest sample of compensation data from European banks so
far. Second, stretching over the period from 2000 to 2010 the panel data set enables us to separately
invest the impact of variable compensation on bank risk before and during the financial crisis
period. Third, in contrast to previous related studies focusing on Europe (and the USA), the analysis
at hand is extended to non-stock listed banks as well as savings banks and cooperative banks and
hence, provides further important insights regarding the relationship between variable pay and
managerial risk-taking incentives at these banking institutions. Fourth, in contrast to previous
studies for Europe we employ a measure of excess variable compensation that is determined by
other factors beyond bank size, namely managerial talents and quality. And fifth, likely reverse
causality between managerial compensation and bank risk is addressed by Granger-causality tests
and instrumental variable regressions.

4
As a core result, we provide empirical evidence of a risk-increasing impact of executive
variable compensation with regard to both variable cash-based and variable equity-based payment
arrangements. This baseline finding holds under various robustness checks while results from
various sensitivity analyses offer further important insights into the compensation-risk nexus.
Overall, the analysis at hand provides important implications for banking regulators and politicians,
especially with regard to the FSB’s principles on sound compensation practices and the European
Parliament’s decision to establish a regulatory cap of executive variable compensation in European
banking.
The remainder of this paper is organized as follows. Section 2 provides a theoretical discussion
of risk-taking incentives through executive variable compensation. Subsequently, Section 3 reviews
previous related empirical studies for Europe. Section 4 presents the empirical methodology. While
data and sources are described in Section 4.1, the empirical model is introduced in Section 4.2.
Section 5 presents empirical results and finally, Section 6 summarizes and concludes.
2 Risk-taking incentives through executive variable compensation
Following the Merton framework (1973, 1974), bank shareholders hold an implicit contingent
claim on the residual value of a bank’s total assets. And much as in call options, shareholders’
returns increase with the riskiness of the underlying assets since downside risks are borne by the
bank’s debtholders, regulators and taxpayers. Bank executives, in contrast, have personal wealth
portfolios largely undiversified but concentrated in the bank they manage (Murphy, 1999).
Therefore, executives are assumed to behave risk averse, protecting their personal wealth probably
by passing up high-risk investments which, however, exhibit positive net present values. In order to
solve this trade-off and to minimize agency costs, agency-based theories suggest that bank
shareholders should design compensation contracts in ways that shareholders’ and executives’
interests are closely aligned (e.g., Smith and Watts, 1992). In particular, incentives through variable
compensation packages could be set that encourage bank executives to adopt more risky but

5
shareholder value-maximizing investment strategies.
Especially with regard to the banking industry the effectiveness of risk-taking incentives from
executive variable compensation is expected to be high (Mehran et al., 2011; Bolton et al., 2011;
Chesney at al., 2010). The reason is that banks are highly leveraged and, under limited liability,
executives can shift bank risk to dispersed and unsophisticated debtholders who are not able to
charge a sufficient risk premium and monitor the bank’s activities perfectly due to greater
opaqueness and complexity as compared to non-financial institutions (Bebchuk and Spamann,
2010; Caprio and Levine, 2002; John et al., 2000; Houston and James, 1995; Saunders et al., 1990).
In addition, in the presence of deposit insurance schemes (not fully based on risk-adjusted
premiums) and implicit governmental bail-out guarantees under the “too-big-to-fail” doctrine, the
risk shifting-mechanism becomes even more relevant since an increase in bank risk raises the value
of the put option granted to shareholders by the deposit insurance and government (Bolton et al.,
2011; John et al., 2010; Jeitschko and Jeung, 2005; John and Qian, 2003; Crawford et al., 1995).
Subsequently, as deposit insurance and bail-out guarantees may weaken market discipline, risk may
additionally be shifted to regulators and taxpayers (Chaigneau, 2013; Beltratti and Stulz, 2012).
Thus, provided that the agency conflict between shareholders and executives may effectively be
externalized to third parties, compensation contracts in banks may not only include risk-taking
incentives set by shareholders but may also reflect bank executives’ intrinsic risk preferences
resulting from variable payments (Bebchuk et al., 2010, Murphy, 1999, Houston and James, 1995).
Incentives for managerial risk-taking may generally be set by designing respective variable
cash-based or variable equity-based compensation contracts. Variable cash-based compensation in
banks is usually paid as a yearly cash bonus subject to reaching certain performance-based targets
derived from accounting data of the past (Murphy, 2000). After having exceeded a specific
threshold, bonus payments typically increase linear with bank performance but may be capped by a
maximum payout (Smith and Stulz, 1985).
Basically, it is suggested that cash bonuses should be positively related to managerial risk-

6
taking if executives indeed take high risks to meet short-term performance targets and hence, to
gain short-term bonuses at the expense of a long-term productive effort (Hakenes and Schnabel,
2014; FSB, 2009; Holthausen et al., 1995). This so-called “short-termism” should become even
more relevant for long-term investment projects when it is unclear if the anticipated performance
will be realized, and when it is difficult to claw back overpaid cash bonuses from executives.
Similarly, short termism may play an important role for financially distressed banks if it is assumed
that short-term bonus payments may set an incentive to gamble for resurrection and to maximize the
value of the financial safety net provided that risk-shifting opportunities exist and the bank’s charter
value is low (Freixas and Rochet, 2013; Hakenes and Schnabel, 2014; Houston and James, 1995;
Keeley, 1990).
Nevertheless, due the bonus plan’s specific payout structure, the incentive for greater risk-
taking may only be effective as long as the performance-based target is not met. In this case the
bonus plan may be described as a call option for bank executives on the performance-based
threshold (Vallascas and Hagendorff, 2013). However, once the threshold (and bonus cap) is
exceeded, further risk-taking will not be rewarded (Jenson and Murphy, 1990; Smith and Stulz,
1985). In addition, as cash bonuses are contingent on the financial solvency of the bank it is also
suggested that they may mitigate excessive risk-taking for larger bonuses beyond the threshold
(Acrey et al., 2011; John and John, 1993). Similarly, excessive risk-taking may be less likely under
cash-based bonuses as the focus is on accounting measures, which more directly link to investment
decisions taken by executives than stock price volatilities in the context of equity-based
compensation (Barclay et al., 2005). And finally, it is also proposed that deferred cash
compensation may distort greater risk-taking since deferred payments have debt-like characteristics,
i.e. they are unsecured future claims (Bolton et al, 2011; Bebchuk and Spamann, 2010; Edmans and
Liu, 2011). Against this background, we expect an ambiguous impact of cash-based pay on bank
risk.
Turning to equity-based pay, this compensation component is typically provided as stock
7
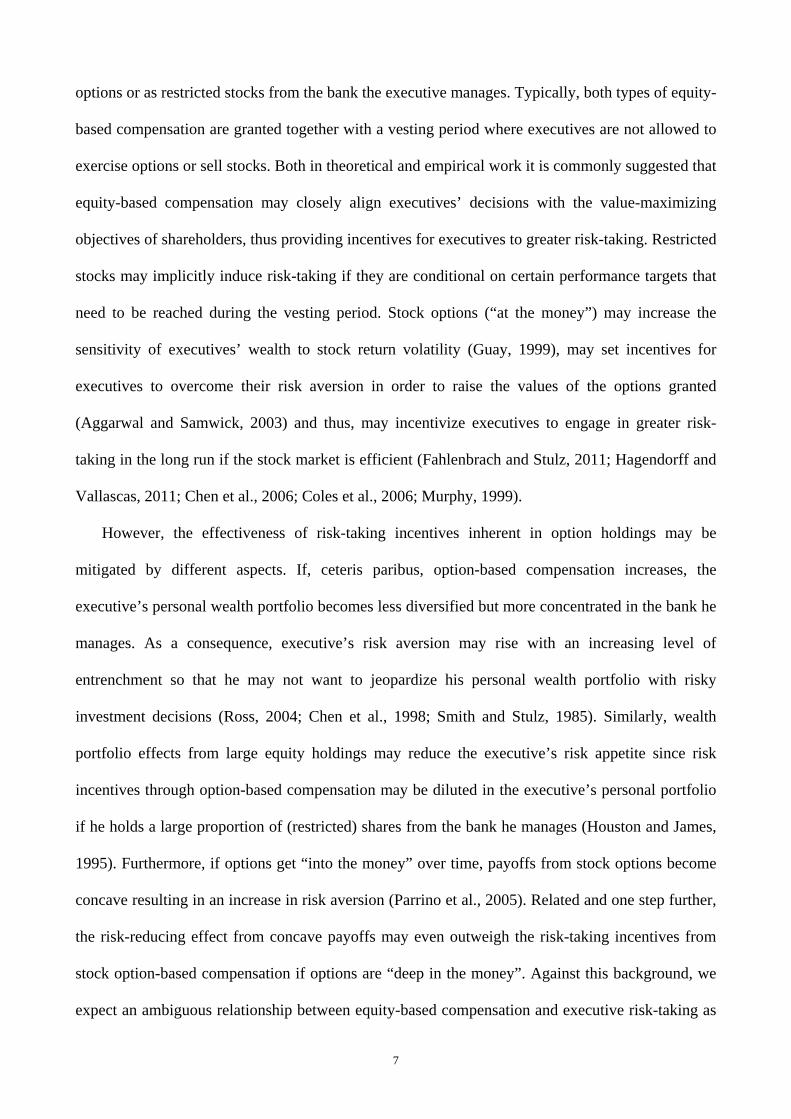
options or as restricted stocks from the bank the executive manages. Typically, both types of equity-
based compensation are granted together with a vesting period where executives are not allowed to
exercise options or sell stocks. Both in theoretical and empirical work it is commonly suggested that
equity-based compensation may closely align executives’ decisions with the value-maximizing
objectives of shareholders, thus providing incentives for executives to greater risk-taking. Restricted
stocks may implicitly induce risk-taking if they are conditional on certain performance targets that
need to be reached during the vesting period. Stock options (“at the money”) may increase the
sensitivity of executives’ wealth to stock return volatility (Guay, 1999), may set incentives for
executives to overcome their risk aversion in order to raise the values of the options granted
(Aggarwal and Samwick, 2003) and thus, may incentivize executives to engage in greater risk-
taking in the long run if the stock market is efficient (Fahlenbrach and Stulz, 2011; Hagendorff and
Vallascas, 2011; Chen et al., 2006; Coles et al., 2006; Murphy, 1999).
However, the effectiveness of risk-taking incentives inherent in option holdings may be
mitigated by different aspects. If, ceteris paribus, option-based compensation increases, the
executive’s personal wealth portfolio becomes less diversified but more concentrated in the bank he
manages. As a consequence, executive’s risk aversion may rise with an increasing level of
entrenchment so that he may not want to jeopardize his personal wealth portfolio with risky
investment decisions (Ross, 2004; Chen et al., 1998; Smith and Stulz, 1985). Similarly, wealth
portfolio effects from large equity holdings may reduce the executive’s risk appetite since risk
incentives through option-based compensation may be diluted in the executive’s personal portfolio
if he holds a large proportion of (restricted) shares from the bank he manages (Houston and James,
1995). Furthermore, if options get “into the money” over time, payoffs from stock options become
concave resulting in an increase in risk aversion (Parrino et al., 2005). Related and one step further,
the risk-reducing effect from concave payoffs may even outweigh the risk-taking incentives from
stock option-based compensation if options are “deep in the money”. Against this background, we
expect an ambiguous relationship between equity-based compensation and executive risk-taking as

8
well.
3 Previous related empirical studies for Europe
A large part of research so far has focused on the relationship between CEO compensation and
bank performance while the risk-taking effect has been implicitly analyzed (e.g., Gregg et al.,
2012). In contrast, a considerably smaller but fast-growing number of empirical studies investigate
the direct impact of CEO pay on bank risk-taking (Mehran et al., 2011 provide a comprehensive
survey) while a few analyses focus on the compensation-risk relationship with a special emphasis
on the recent financial crises (Srivastav et al., 2014; Bhagat and Bolton, 2014; Bosma and Koetter,
2013; Beltratti and Stulz, 2012; Fahlenbrach and Stulz, 2011; Balachandran et al., 2010). In this
context, however, the majority of studies investigate the compensation-risk linkage in the US
context while primarily focusing on stock-option based compensation and its impact on aligning
interests between bank shareholders and CEOs. In contrast, to the best of our knowledge, only two
cross-country related empirical studies analyze the impact of variable compensation on managerial
risk-taking using data from European banks.
To begin with, Vallascas and Hagendorff (2013) employ data on cash bonus compensation from
a mixed sample of 117 stock-listed banks (thereof 41 European banks) for the period from 2000 to
2008. Their measure of cash compensation includes basic salary, cash bonuses and other forms of
cash compensation while bank risk is proxied by the bank’s distance to default. The authors provide
empirical evidence that an increase in CEO cash bonus payments generally reduces the default risk
suggesting that bonus payments are contingent on the bank’s solvency and thus, mitigate
managerial (excessive) risk-taking. However, further sensitivity analyses reveal that bonus pay
induces managerial risk-taking if banks are financially distressed or operate under a weak
regulatory framework indicating that banks seek to maximize the value of the financial safety net by
shifting risk to weak regulators (and taxpayers).
Ayadi et al. (2011) use compensation data from 53 stock-listed and non-stock listed,

9
systemically important European banks over the period from 1999 to 2009. Bank risk is proxied by
the z-score and by different market-based risk measures (total, idiosyncratic, systematic and
interest-rate risk) during further robustness checks. The compensation measure includes option
plans and annual cash bonuses. The authors provide evidence that option plans and annual bonuses
do not increase bank risk in general whereas long-term performance bonus plans deteriorate
banking stability. Moreover, the analysis reveals a reverse relationship between bank risk and
executive compensation, i.e. (i) long-term performance bonus plans are more likely under
increasing systematic risk, and (ii) distressed banks substitute fixed basic salaries by annual bonus
payments.
4 Empirical methodology
Table 1 (Statistical Appendix) reports the geographical distribution of the entire 63 European
banks in our sample and indicates the time periods for which total variable compensation data is
available. While Table 2 includes notes on variables and data sources, Table 3 presents descriptive
statistics for the variables employed. The development of bank-averaged z-score values and
averaged variable compensation volumes over the entire sample period is illustrated in Figure 1.
4.1 Data and sources
Variable compensation measures
In contrast to their US counterparts, the majority of banks in the EU-27 are far away from
publishing compensation data on a large scale and in great detail. Furthermore, only the largest
banking institutions provide information on managerial compensation in their balance sheets.
Accordingly, we start our analysis by examining bank balance sheets from the 10 largest domestic
banks (either stock-listed or non-stock listed) operating in each of the 27 European countries. We
have to adjust the initial sample of 270 banks as follows. First of all, banks must provide data on
executive compensation and specific board characteristics for at least three consecutive years to be

10
included in our sample.2 In addition, we do not include banks that only disclose the amount of
executives’ total compensation. Instead, we only collect data from banks whose total compensation
can be at least sorted into fixed compensation and variable compensation regardless of other
compensation packages such as contributions to pension funds, non-cash pay or benefits in kind. As
a result, data on executive compensation and board characteristics is retrieved from 63 banking
institutions located in 16 European countries for the period from 2000 to 2010. To the best of our
knowledge, this is still the largest sample of compensation data from European banks. Banks in our
sample and respective periods of total variable compensation are presented in Table 1 in the
Appendix. The fraction of stock-listed (non-stock-listed) banks is at 63% (37%), while the sample
includes private commercial banks (71%) as well as the group of government-owned banks, savings
banks and cooperative banks (29%).
Executive compensation in European banking usually comprises of annual fixed salaries,
variable cash-based pay (bonuses), variable equity-based pay (restricted shares and stock options)
and other components. Our analysis focusses on total variable compensation (including cash- and
equity-based pay) and its likely risk-taking incentives for bank executives. In this context, while it
is an implicit standard in executive compensation literature to treat CEO compensation as
representative for the entire firm, concerns are raised and evidence is provided that rather incentives
from non-CEO compensation may induce greater managerial risk-taking (e.g., Kim et al., 2011).
Thus, as CEOs alone might not be responsible for accumulating higher bank risk, we employ
yearly-aggregated amounts of total variable compensation of the highest paid executives in
2 Due to a wave of mergers and acquisitions (M&A) within the European banking industry between 1997 and 2007
some banks in our sample no longer existed when compensation data were collected at the end of 2011. We have
considered this problem by including both the acquirer and target until the final closing of the legal M&A
transaction and keeping the acquirer or combined company in our sample from that point in time. Similarly, some
banks went insolvent during the sample period. These banks are kept in the sample until the year their business
was closed. We control for the viability of our baseline findings by excluding these banks from the sample as a
robustness check. Since results do not remarkably differ from baseline findings, we do not comment them
separately in this paper but provide results on request.

11
European banking, i.e. the members of the management board or the executive members of the
board of directors including CEOs and CFOs.
Depending on the disclosure level and bank type, total variable compensation from our sample
can further be separated into cash-based and equity-based compensation. Cash-based compensation
in European banks is usually denoted as bonus in annual reports and is seen as a short-term
incentive component based on accounting-based measures of performance. Unfortunately, however,
most European banks do not provide much information on underlying performance measures,
performance targets or caps concerning executive cash-based bonus pay. Equity-based
compensation is considered as a long-term incentive component of compensation in annual reports
while the largest fraction of equity-based compensation in our sample is made up of stock options
measured by the value of stock options granted. However, only a few stock-listed banks in our
sample provide further information, for example on grant dates, number of options granted, exercise
prices, vesting periods or delta and vega of stock options.
On average, total variable pay in our sample covers 59 percent of the total amount of executive
compensation. Cash-based pay accounts for 43 percent of total variable pay and consequently, the
fraction of equity-based compensation is at 57 percent. As shown more precisely in Table 3, the
mean value of total variable compensation is at €5,699,300 with a maximum value of
€156,010,000.3 A high standard deviation of €14,605,200 indicates a wide spread of total variable
compensation in European banks in our sample. As further shown, equity-based compensation
exceeds cash-based pay on average while the standard deviation of equity-based compensation is
remarkably higher than it is for cash-based payments. Among our sample banks UBS AG exhibits
the maximum value of aggregated total variable compensation of €156,010,000 in 2006 whereas
Länsförsäkringar AB paid €100,000 as the lowest (apart from zero-values) amount of total variable
compensation in 2010. The highest aggregated amount of variable cash-based compensation of
€66,750,000 is provided by UBS AG in 2006 whereas the lowest amount of €130,000 is paid by
3 Some banks in our sample suspended variable pay to managers, in particular during the financial crisis period
(2008-2010). As a consequence, variable compensation in our sample exhibits a minimum value of zero.

12
SNS Reaal NV in 2008. Finally, Credit Suisse Group AG exhibits the highest aggregated value of
variable equity-based compensation of €89,260,000 in 2009 while ABN Amro Holding NV paid
€30,000 as the lowest amount of equity-based compensation in 2009.
Figure 1 illustrates the development of the bank-averaged z-score and total variable
compensation (cash-based and equity-based) over the entire sample period from 2000 to 2010. As
shown, average total variable compensation decreases moderately during the dot-com crisis until
2003 and follows an increase in banking stability with a certain delay for the period between 2001
and 2003. Subsequently, a sharp increase in variable compensation is observed during the economic
boom-phase in Europe between 2003 and 2007 while banking stability does not vary remarkably
during this time period. With the beginning of the recent global financial crisis in mid-2007, z-score
and compensation values drop sharply under their absolute values from the year 2000 clearly
indicating that the recent financial crisis has induced a sharp decrease of both total variable
compensation and bank soundness.
Due to the fact that only the largest banks in Europe report compensation data in detail, we do
not employ absolute values of variable compensation but rather use measures of excess variable
pay. The measure of excess variable compensation per bank i at time t is defined as the residuals of
a regression of compensation on bank size proxied by the log of total assets while including country
dummies and time dummies. Accordingly, the excess measure describes the level of executive
variable pay that is determined by further factors beyond bank size, in particular by differences in
managerial talents and quality (see also Gabaix and Landier, 2008).4 The strategy to employ excess
compensation is rational for the following reasons. First, we observe a strong correlation between
“raw” compensation measures, bank size and size-related bank-specific control variables for our
sample of banks. Thus, including bank size as a further control variable would lead to collinearity
problems and would provoke biased estimation results. Second, a strong relationship between firm
4 Banks exhibiting high excess variable compensation in our sample include UBS AG, Credit Suisse Group AG and
Deutsche Bank AG whereas the lowest excess variable compensation is observed for BNP Paribas, Royal Bank of
Scotland Group Plc. and Credit Agricole S.A.

13
(bank) size and compensation levels is commonly proposed by related research (e.g., Jensen and
Murphy, 1990). However, as the study at hand does not focus on explaining different levels of
executive compensation in banks but rather investigates risk-taking incentives through variable
compensation, we propose a “size-corrected” compensation measure to be more expedient. Third,
hand-collected data on executive compensation is primarily retrieved from the largest European
banks since smaller European banks hardly disclose any information on their compensation
structures. Hence, a self-selection bias could arise which, however, may be partly mitigated when
employing a measure of excess compensation and hence, correcting for bank size.5
Z-score
Taking into account that our sample includes both stock-listed and non-stock listed banks, bank
risk is proxied by the z-score as our main dependent variable.6 Derived from the original measure as
proposed by Altman (1968), the z-score is widely used to analyze the determinants of bank risk-
taking (e.g., Schaeck and Čihák, 2012; Altunbas et al., 2011; Demirgüc-Kunt and Huizinga, 2010;
Uhde and Heimeshoff, 2009; Foos et al., 2009; Boyd and De Nicoló, 2006; Beck et. al., 2006) and
is also employed in recent CEO compensation literature (e.g., Bhagat and Bolton, 2014;
Chemmanur et al., 2013; Laeven and Levine, 2009).
Using annual consolidated bank balance sheet data from Fitch’s BankScope database the
z-score per bank i in year t is defined as:
, ,,
,
- ,SD( )
i t i t
i ti t
ROAA CARz score
ROAA
5 As discussed in Section 4.2, a fixed-effects OLS model on panel data is employed during the empirical analysis.
As regards baseline estimations, we additionally perform a standard two-step Heckman (1979) procedure to control
for a potential selectivity bias. However, since estimations results do not remarkably differ from OLS results, we
do not provide them in this paper but provide results on request. 6 Note, that the z-score measure is substituted by different market-based measures for a subsample of stock-listed
banks during further sensitivity analyses in Section 5.3.2.
(1)

14
where ROAA is the bank’s return on average assets, CAR is the bank’s capital ratio defined as
equity capital to total assets and SD(ROAA) is calculated as a three-year rolling window standard
deviation of ROAA. Building the z-score this way, it is a measure of bank stability and indicates the
distance from insolvency, combining accounting measures of profitability, leverage and volatility.
Defining bank insolvency as a state where 0 ROAA CAR , the z-score is designed to indicate the
number of standard deviations a bank’s asset return has to drop below its expected value before the
bank’s equity is depleted and it becomes insolvent. Accordingly, as the z-score is the inverse of the
probability of bank insolvency a higher (lower) z-score indicates that a bank incurs fewer (more)
risks and is more (less) stable.
Following Strobel (2014) the z-score measure may suffer from being upwardly biased, i.e. the
probability of bank insolvency may be overestimated for lower z-score ratios, which becomes even
more important for our sample of banks during the financial crisis period. Although the z-score may
be described as a conservative measure from the regulators’ point of view in this context, we correct
for this potential bias by including the natural log of the z-score following Houston et al. (2010) and
Laeven and Levine (2009). Since the distribution of the log of the z-score is heavily skewed for our
sample of banks whereas the distribution of the traditional z-score is not, the log of the z-score may
be more ideally interpreted as a risk measure that is negatively proportional to a bank’s log odds of
insolvency, which is a more meaningful interpretation when using the z-score as a dependent
variable in standard regression analyses.
Further control variables
When investigating the impact of executive variable compensation on bank risk it is imperative
to control for further macroeconomic, bank-specific and institutional factors that are likely to affect
banking stability and hence, help mitigate omitted variable biases. While we employ a variety of
further variables to control for different board and banking characteristics, the recent financial crisis

15
as well as the regulatory framework during respective sensitivity analyses in Section 5.3, our
baseline model includes “fixed” control variables as follows.
Macroeconomic control variables are retrieved from the World Development Indicators (WDI)
provided by the World Bank and from Thomson Reuter’s Datastream. We include the log of real
GDP per country (GDP) to control for country differences as regards the state of the economy and
the slope of the yield curve (Slope) as a leading indicator for future prospects of the economy.
Consolidated bank-specific accounting data are obtained from Fitch’s BankScope database.
Variables are included to control for the banks’ leverage (Leverage), the ratio of regulatory Tier1
capital to risk-weighted assets (Tier1) and the bank’s liquidity ratio (Liquidity).7
4.2 Empirical model
The impact of executive variable compensation on bank risk is estimated by employing a linear
model on panel data:
1 1 it it it k it ,k ity c x ,
where ity represents the z-score of bank i in a respective year t and 1itc is the one-period
lagged excess variable compensation paid to executives at bank i in a respective year t. The vector
,it kx includes macroeconomic and bank-specific control variables as described above. it is an error
term and and the β’s denote the parameters to be estimated. Excess variable compensation
measures are lagged for one period in order to (i) basically address possible reverse causality
between bank risk and compensation (see also Section 5.2.1) and (ii) appropriately allow time for
potential risk-taking incentives inherent in variable compensation structures. Moreover, lagging for
7 As shown in Table 9a, the correlation between both Leverage and Tier1 and the z-score measure is low which
justifies the inclusion of these control variables on the right hand side of the regression specification. In addition,
baseline results from these control measures are reiterated even when substituting the z-score by market-based risk
measures in further sensitivity analyses.
(2)

16
one period additionally mitigates simultaneity and collinearity as regards further employed
unlagged (bank-specific) control variables.
We utilize a bank-specific fixed effects model and set time dummies to control for time-
specific effects (e.g., a change of supply or demand for managerial talents; trends in banking
regulation; common shocks to the European banking market).8 In addition, since the level and
frequency of variable compensation remarkably differs between banks in our sample, we address
heterogeneity in executive pay by clustering standard errors at the bank-level. We use the
generalized Lagrange multiplier test based on White (1980) to determine whether controlling for
bank-level heterogeneity improves the fit of our model. The null hypothesis of homoscedasticity is
rejected at ρ<0.000, suggesting that the use of robust standard errors is appropriate.
Estimating the model with fixed effects is a consequent strategy for two reasons. First, as
regards the panel data at hand, a high within-bank variation of the compensation measure is
observed for European banks in our sample. Second, it is assumed that unobserved bank-specific
and especially executive-specific characteristics (Graham et al., 2011) may affect the compensation
measure so that employing a fixed effects model is more adequate than a random effects model
(Wooldridge, 2002). Since we include cluster-robust standard errors at the bank-level and the
Hausman test (1978) is inappropriate under heteroscedasticity we employ a generalization of the
Hausman approach by Arellano (1993) to statistically test for the appropriateness of our model
specification. Adopting this approach, the null hypothesis that the individual specific effect is
uncorrelated with the independent variables is rejected at ρ<0.004, suggesting that employing the
fixed effects model is rational.
8 As Table 2 reports, the number of observations in our panel varies. Thus, in addition to the fixed effects model, we
employ the consistent estimator for the variance components by Baltagi and Chang (1994) as a robustness check to
avoid possible biases resulting from our unbalanced panel. However, as results do not differ significantly from the
ordinary random effects estimations, we do not comment them in this paper but provide them on request.

17
5 Empirical results
Table 4 presents results from baseline regressions assessing the impact of executive excess
variable compensation structures on bank risk as measured by the z-score technique. Table 5 and
Table 6 report empirical results from Granger-causality tests and 2SLS instrument variable
regressions. Further robustness checks are presented in Table 7 while Tables 8a-8c show results
from a variety of sensitivity analyses. Finally, respective correlation matrices are presented in
Tables 9a and 9b. If signs and significances of control variables do not remarkably differ from
baseline regressions during robustness checks (Section 5.2) and sensitivity analyses (Section 5.3),
we do not comment them separately in this paper.
5.1 Baseline regressions
As shown in Table 4, excess variable compensation enters regression specification (1)
significantly negative at the one-percent level indicating that higher executive excess total variable
pay in European banks may have a risk-increasing effect. In addition, coefficients of both excess
cash-based and excess equity-based pay turn out to be significantly negative at the one-percent
level respectively in regressions (2) and (3) while a higher economic effect is observed for excess
cash-based compensation.9 Against this background, baseline findings at hand support theoretical
arguments that cash bonuses may set incentives to greater managerial risk-taking (Freixas and
Rochet, 2013; Hakenes and Schnabel, 2014; Houston and James, 1995). They additionally
correspond to theoretical predictions that equity-based compensation may closely align executives’
decisions with the value-maximizing objectives of shareholders, thus incentivizing executives to
greater risk-taking (Mehran et al., 2011; Bolton et al., 2011; Chesney at al., 2010). As regards
previous related empirical studies for Europe baseline findings at hand do not support main findings
provided by Vallascas and Hagendorff (2013) for a mixed sample of European and US banks
9 Note that this result has to be considered with caution since only 19 out of 63 banks in our sample provide data on
equity-based compensation at all. Moreover, as shown in Table 3 excess cash-based compensation is much less
volatile than excess equity-based compensation so that the marginal impact of excess equity-based pay is higher.

18
suggesting that CEO cash bonuses are not associated with greater risk-taking in general. In contrast,
they correspond to results provided by Ayadi et al. (2011) indicating a risk-increasing impact of
performance bonus plans for European banks.
Among the control variables, the slope of the yield curve measure enters regressions (1)-(3)
significantly positive at the ten- and five-percent level respectively suggesting that economic
growth may coincide with greater banking stability (Schaeck and Čihák, 2012). An increase in
financial stability during economic upturns may be explained by the fact that (i) the bank’s
investment opportunities may be correlated with an economic upturn (Beck et al., 2006), (ii)
borrowers’ solvency should be higher under increasing economic performance which in turn raises
the banks’ asset quality (Demirgüç-Kunt and Detragiache, 2002) and (iii) banks may pro-cyclically
widen their capital under economic booms to take precautionary measures in anticipation of
forthcoming economic downturns (Borio et al., 2001). In addition, since banks typically transform
short-term loanable funds (e.g., deposits) into longer-term loans, a steeper yield curve will increase
interest rate spreads and thus the value of bank assets and future profits, which in turn will lessen
moral hazard and reduce bank risk-taking (Altunbas et al., 2014; Albertazzi and Gambacorta, 2009).
Financial leverage enters regressions (1)-(3) significantly negative at the one- and five-percent
level indicating a negative impact of a rise in the debt-to-equity ratio on banking stability. If the
increase of the leverage ratio is the result of a rising proportion of debt, the risk-increasing effect
may originate from the bank’s larger exposure to interest rate risk and hence, more volatile
earnings. In contrast, if the increase is due to a decline of the proportion of equity, the negative
effect on bank stability may be explained by the fact that risk-taking incentives become stronger
under decreasing opportunity costs (Keeley, 1990).
Finally, Tier1 exhibits significantly positive coefficients throughout regressions (1)-(3)
indicating a positive impact of an increase in risk-weighted regulatory capital on financial stability.
Results at hand support the “capital at risk effect”, i.e. higher regulatory equity capital implies
higher downside risk and higher losses for bank shareholders in case of bank default, which may

19
counter shareholders’ intention to set risk-taking incentives through variable compensation (Boot
and Thakor, 2008; Repullo, 2004; Hellmann et al., 2000).
5.2 Robustness checks
Baseline findings of a positive impact of excess variable compensation on bank risk may be
biased by (i) reverse causality between risk and compensation, (ii) multicollinearity between
compensation measures and (bank-specific) control measures and (iii) different aspects as regards
the compensation measure employed (aggregation level, outlier bias). We control for these potential
problems in the following.
5.2.1 Reverse causality
The causality between executive compensation and bank risk is not clear if the design of
variable compensation packages depends on the bank’s overall risk exposure. Hence, reverse
causality may arise, if it is assumed that financially stronger banks may pay higher variable
compensation and set stronger risk-taking incentives as compared to distressed banks. In contrast,
however, one may also argue that even financially distressed banks may pay higher variable
bonuses to executives if they opt to follow “gambling for resurrection” strategies. Despite this, bank
risk is likely to affect managerial behavior in general due to its implications for the reputation and
career paths of bank managers (Mehran and Rosenberg, 2007).
Although we employ one-period lagged compensation measures in our baseline regression
model to generally address possible endogeneity problems, we control for reverse causality in a
more sophisticated way by performing Granger-causality tests and instrumental variable regressions
in the following (Tables 5 and 6). To begin with, a simple Granger test (Granger, 1969) is used as a
standard econometric procedure to explore causal directions between bank risk and compensation.
As a first step, testing for Granger causality requires that time series of the z-score and excess
variable compensation measures are covariance stationary. We perform a Fisher-type test for unit

20
roots that is suitable for finite panel datasets when individual series have gaps (Choi 2001). Hence,
based on an Augmented-Dickey-Fuller (ADF; Dickey and Fuller, 1979; 1981) and Phillips-Perron
test (Phillips and Perron, 1988) due to yearly data in our sample, unit-root tests are conducted for
each panel individually, and p-values from these tests are combined to produce an overall test. As
shown in Table 5, the null hypothesis that all the panels contain a unit root is rejected for both time
series.
In a second step, both the Akaike (AIC) and Schwarz Information Criteria (SIC) are employed
to find an appropriate number of lags for the z-score and compensation measure to be included in
the autoregressive analysis. Both criteria suggest an optimal lag order of 1 for each of the series.
However, since the Granger-causality test is very sensitive to the number of lags included in the
regression, we additionally perform the analyses with three lags and then drop the third and then the
second if they are not significant and if the significance level of the F-test does not decline. This
procedure again suggests an optimal lag order of 1 for both time series.
As a final third step, Granger-causality tests are performed. The Granger test involves two
separate autoregressive analyses. In a first regression, excess variable compensation is regressed on
lags of itself and on lags of the z-score measure. In turn, the z-score is regressed on lags of itself and
on lagged excess variable compensation in the second regression. As shown in Table 5, while
control variables exhibit expected signs in both regressions, one-period lagged z-score enters
regression (1) insignificantly positive whereas the coefficient of one-period lagged excess variable
compensation is observed to be significantly negative at the five-percent level in regression (2). In
addition, taking respective F-tests into account, results from Granger tests reveal that bank risk does
not Granger-cause excess variable compensation whereas compensation Granger-causes a change in
bank risk as already indicated by baseline findings from Table 4.
Next to Granger-causality tests possible reverse causality is further analyzed by employing a
two-stage least squares (2SLS) instrumental variable (IV) estimator with fixed effects, time
dummies and a robust-clustering at the bank-level. We propose the executive’s consecutive years on

21
board (tenure) standardized by the executive’s respective age as an adequate instrumental variable
for excess compensation and refer to this ratio as executive’s quality. We initially hypothesize that
the amount of excess pay is positively related to the length of tenure. The reason is that a long
tenure may indicate entrenchment, provoke higher firm-specific human capital and a better
reputation, which in turn should induce an increase in executive compensation (Harjato and
Mullineaux, 2003). We additionally assume that risk-taking incentives from excess compensation
may become less important for more experienced executives since these executives might already
show an extensive track record of their value added to the firm. In this context, several empirical
studies indeed provide evidence that intrinsic motivation for managerial risk-taking decreases with
the tenure due to career and reputational considerations (e.g., Berger et al., 2014).
As shown in Table 6 and in line with findings from Granger-causality test, results from IV
regressions indicate that baseline findings from Table 4 may not be biased by reverse causality. The
instrumental variable enters the first stage regression (1) significantly positive at the one-percent
level while control variables exhibit expected signs. Our baseline findings of a negative relationship
between excess variable compensation and bank soundness are reiterated during the second stage
regression (2). Moreover, control variables retain significances and signs while a significantly
positive impact of the bank’s liquidity position on financial stability is additionally observed.
Concerning the quality and strength of the instrumental variable employed, Table 9a illustrates
that executive’s quality is uncorrelated with the z-score but sufficiently high correlated with the
excess variable compensation measure. Furthermore, Table 6 reports that the coefficient of the
instrumented compensation measure only slightly increases during the IV estimation indicating that
excluding the instrument from the second stage regression may not generate further endogeneity
problems. Moreover, results from respective tests of underidentification and weak identification
reveal that IV regression results are robust to issues of instrument-validity. We use the rank statistic
proposed by Kleibergen and Paap (KP, 2006), which is robust under heteroscedasticity and robust-
clustering in the case of one single endogenous regressor and one single instrument. Table 6 reveals

22
that the KP rank LM statistic (underidentification test) is at 16.242 with p = 0.002 rejecting the null
hypothesis that the equation is underidentified. The KP rank Wald F statistic (weak identification
test) is at 14.921 and hence very close to the Stock and Yogo (2005) 10% critical value of 16.387.
In addition, since the KP rk Wald F statistic satisfies the Staiger and Stock (1997) rule of thumb that
the F-statistic should be at least at 10, we reject the null hypothesis of a weak correlation between
our instrument and the endogenous regressor.
5.2.2 Compensation measure
We proceed and investigate the robustness of the compensation measure employed (Table 7).
In this context it is initially controlled if baseline findings may be biased due to multicollinearity,
i.e. included control variables may not only affect bank risk but may also have an impact on the
compensation measure on the right hand side of the regression equation. Although (i) the
compensation measure is lagged by one period while (bank-specific) control variables are not, (ii)
bidirectional correlation between compensation and control measures is moderate (Table 9a) and
(iii) variance inflation factors consistently exhibit values smaller than 10 as a rule of thumb,
multicollinearity problems may not be generally ruled out. Thus, to control for a possible estimation
bias we initially omit bank-specific measures and further exclude macroeconomic control variables
from the regression model. As shown in Table 7, even though control variables are excluded from
respective regressions (1a) and (1b), baseline findings from Table 4 are reconfirmed. As
coefficients of the excess variable compensation measure exhibit slightly higher values compared to
baseline regressions, we suggest that the risk-increasing effect might be slightly overestimated but
rule out that main results are seriously biased due to multicollinearity.
Furthermore, taking into account that we employ the aggregate amount of excess variable
compensation received by the entire number of executives on the management board per bank and
year, one may argue that the risk-increasing effect may be driven by single executives (especially
the CEO or CFO) receiving a comparably higher amount of variable compensation than other

23
executives and thus, facing stronger incentives for greater risk-taking. To shed a brighter light on
this aspect, we initially calculate excess average variable compensation defined as the residuals of a
regression of average compensation (i.e. the ratio of the sum of total variable compensation divided
by the number of executives in charge per bank and year) on bank size while including country
dummies and time dummies. Table 7 reports that excess average variable compensation enters
regression (2a) significantly negative while the coefficient value subsides as compared to baseline
regressions. Hence, results suggest that the risk-increasing effect through variable compensation
may be driven by “above-average” excess variable pay. Accordingly, we control for a potential
outlier-bias due to extraordinarily high variable payments in our sample in a second step. On
account of the small sample size Winsorizing rather than Trimming is employed. We use 1 percent
Winsorizations converting the top one-percent values of variable compensation to the 99th
percentile and subsequently compute excess variable compensation measures. Regression (2b) in
Table 7 reports that baseline findings are reiterated even when employing winsorized excess
variable compensation while the estimated coefficient becomes only slightly lower in value.
Finally, variable compensation is substituted by the ratio of variable to fixed compensation.
Like excess variable compensation, excess fixed pay is computed as the residuals from regressions
of executives’ fixed salaries on bank size while including country dummies and time dummies.
Subsequently, the ratio of excess variable to fixed compensation is built. As reported by Table 7, the
ratio enters regression (3a) significantly negative. Taking into account that fixed compensation in
our sample hardly varies over time, results additionally suggest that an increase in the gap between
excess variable and fixed compensation negatively affects bank soundness. Referring to the
European Parliament’s decision to limit an executive’s variable compensation to the maximum of
his annual fixed salaries, we employ a further measure that exceptionally includes ratios of variable
to fixed compensation being larger than 1, which is observed for 49 banks in our sample. As shown,
this excess ratio enters regression (3b) significantly negative while the coefficient remarkably
increases in value as compared to baseline regressions from Table 4. Accordingly, as results suggest

24
that the negative impact of excess variable compensation may become stronger if executive variable
pay exceeds fixed salaries, the European Parliament’s decision to set a regulatory cap of variable
pay seems to be appropriate.
5.3 Sensitivity analyses
One may argue that especially larger banks may also have some characteristics regarding their
business model, e.g. are more strongly engaged in fee-based business, are internationally operating
banks and are also often stock-listed. In addition, larger banks with good governance may also
report more detailed on their compensation structure. Taking this into account we perform various
sensitivity analyses controlling for different board structure and bank characteristics in the
following.
5.3.1 Board characteristics
Among sensitivity analyses focusing on board characteristics we initially control for differences
in board structures by building two subsamples. One subsample includes 42 European banks, which
have adopted a one-tier board system whereas the other subsample includes 21 banks with a two-
tier board structure. While monitoring executives’ activities is delegated to a separate supervisory
board in a two-tier system, it is an additional task of the board itself within a one-tier system.
Accordingly, one may argue that the disciplinary power of two-tier boards may be greater due to the
separation of execution and control and hence, due to the limited scope for CEOs or CFOs to
capture the rest of the board. However, one may also hypothesize that information asymmetry and
moral hazard problems may be stronger under a dual board structure, making monitoring more
difficult for single members of the supervisory board. As reported in Table 8a, the compensation
measures enter both regressions (1a) and (1b) significantly negative while the negative impact is
remarkably weaker for the subsample of banks having adopted a two-tier board structure. Results
suggest that risk-taking incentives may be less effective under a two-tier board structure supporting

25
previous findings provided by Gillette et al. (2008) that two-tiered boards are more conservative in
their investment decisions.
We control for the board size (total number of executives) and board independence (proxied by
the ratio of non-executives to board size) in a next step. While the impact of board size and board
independence on firm (bank) performance is well documented in literature, only a few studies
explicitly focus on the effect on managerial risk-taking in this context. Most of these studies argue
that smaller boards may act more consistently with the shareholders’ interests and hence, provide
evidence for a negative relationship between board size and managerial risk-taking (e.g., Pathan,
2009; Hermalin and Weisbach, 2003). Similarly, it is generally suggested that greater board
independence tends to decrease bank risk since non-executives may have stronger monitoring
incentives than bank insiders and may take a more determined stand in the interests of the bank’s
stakeholders (e.g., Mehran et al., 2011). As shown by regression (2) and (3), Table 8a, we do not
find a significant effect of board size and board independence on bank risk. While the risk-
increasing impact of excess variable compensation is retained in each regression, coefficients of
board size and board independence exhibit expected signs but turn out to be statistically
insignificant.
Related, it is further analyzed if the risk-increasing impact of excess variable compensation
changes with an increasing fraction of female executives on board. Although gender studies
generally suggest that women may exhibit a stronger risk aversion during financial decisions than
men (e.g., Schubert et al., 1999), empirical evidence on the risk-taking behavior of female
executives is ambiguous. Kahn and Vieito (2013), for example, find a stronger risk aversion of
female CEOs in US firms compared to male CEOs. They additionally provide evidence that
shareholders may not consider this difference in risk aversion when designing equity-based
compensation packages. In contrast, Berger et al. (2014) provide evidence that female executives
may self-select into stable and well-capitalized banks. However, after three years of female board
representation managerial risk-taking tends to increase which may be due to the fact that female

26
executives have less experience than their male counterparts. As reported by regression (4a) in
Table 8a, greater managerial risk-taking is observed for those banks with male-only executive
boards. In contrast, regression (4b) reveals a distinctly weaker negative impact of variable
compensation on bank risk if the fraction of female executives on boards becomes larger. Results,
however, have to be taken with caution since the number of female executives on bank boards in
our sample is generally low (the maximum is at 4). Moreover, we do not observe any female
executive on board for more than 60 percent of the entire number of banks.
Finally, it is analyzed if executive risk-taking through excess variable compensation is affected
by the strength of bank shareholder rights. Accordingly, based on the shareholder rights index from
La Porta et al. (1997) we employ the updated and corrected Anti-Director Rights Index (ADRI)
provided by Spamann (2010) to measure the level of investor protection. It is suggested that under
poor investor protection bank executives may invest in a more risk averse manner than outside
shareholders would desire (Kose et al., 2008). In contrast, if shareholder rights are strong, bank
shareholders should be able to more effectively monitor executives and thus, may stronger press for
greater risk-taking to increase their returns on investment. As shown in regression (5), Table 8a, we
find a negative impact of the ADRI measure on bank stability and, more important, a stronger
negative impact of the interaction variable as compared to our baseline findings from Table 4. Thus,
results correspond to previous findings provided by Pathan (2009) suggesting that stronger
shareholder rights may spur managerial risk-taking in banking.
5.3.2 Bank characteristics
Taking into account that our sample comprises of 40 stock-listed financial institutions, we build
two subsamples of stock-listed and non-stock-listed banks and analyze if the risk-increasing effect
from excess variable compensation differs depending on the bank type. Moreover, only stock-listed
banks report data on both variable cash-based and equity-based compensation. Regressions (1a) and
(1b) in Table 8b indicate a significantly negative impact of compensation measures on bank

27
soundness for both subsamples while coefficient values are remarkably lower in value for the
subsample of non-stock-listed banks. On the one side, results at hand support theoretical predictions
that managerial risk-taking may evolve due to the alignment of shareholders’ and executives’
interests by setting risk-taking incentives in compensation contracts. On the other side, however,
results may further indicate that managerial risk-taking may also stem from intrinsic risk-taking
preferences of executives (at non-stock-listed banks) beyond shareholder pressure.
Although we are convinced that the z-score is an adequate measure of bank risk, we substitute
this ratio by market-based risk measures (distance-to-default, systematic risk and idiosyncratic risk)
for the subsample of stock-listed banks in order to reach a higher comparability with previous
related studies.10 As correlations between market-based risk measures and control variables from
the baseline model are moderate (Table 9b), we do not re-specify the regression model but simply
change single risk measures. Table 8b reports that excess variable compensation enters regression
(2a) significantly negative at the five-percent level indicating a decrease in the banks’ distance-to-
default due to executive variable pay. Similarly, coefficients of the compensation measure turn out
to be significantly positive at the five- and ten-percent level respectively in regressions (2b) and
(2c) suggesting an increase in the banks’ systematic and idiosyncratic risk due to higher variable
compensation. Thus, as macroeconomic and bank-specific control variables exhibit expected signs
and retain significances for the most part, baseline findings of a risk-increasing effect of excess
variable compensation are reconfirmed even when employing market-based risk measures instead
of the book-based z-score ratio.
The recent trend towards non-traditional, non-interest rate based banking activities due to the
wave of banking market deregulation and liberalization around the globe has provoked a strong
heterogeneity in European banks’ revenue structures (e.g., Lepetit et al., 2008; Goddard et al.,
2007). Accordingly, in a next step it is investigated if baseline findings differ depending on the
banks’ business model proxied by the ratio of a bank’s non-interest income to total operating
income. As shown in Table 8b, the business model measure enters regression (3) significantly 10 The calculation of the market-based risk measures is described in detail in the Technical Appendix.

28
negative suggesting a decrease in financial soundness for those European banks which stronger
engage in fee-based business activities (e.g., Brunnermeier et al., 2011). In contrast, results at hand
do not support theoretical predictions that a higher degree of revenue diversification may benefit
financial stability. In addition, it is also shown that the interaction term turns out to be significantly
negative while its coefficient turns out to be distinctly larger in value as compared to baseline
findings from Table 4. This result was expected since variable compensation might be primarily
based on the financial success of proprietary trading from the fee-based investment banking
business.
Furthermore, it is controlled if the risk-increasing effect of excess variable compensation is
driven by the degree of a bank’s overall risk exposure. Therefore, dividing the entire series of the
z-score ratio into four quartiles we build two subsamples of high-risk and low-risk banks. A bank is
defined as a high-risk institution if respective z-score values are located in the first quartile of the
distribution. This subsample includes 19 banks. In contrast, a bank is characterized as low-risk
institution if respective z-score values fall into the fourth quartile, which is the case for 21 banks in
the second subsample. Regressions (4a) and (4b) in Table 8b report a significantly negative impact
of excess variable compensation on bank soundness for the subsample of high-risk banks whereas
we do not provide any statistical evidence for this effect as regards low-risk banks. Results for high-
risk banks correspond to findings provided by Vallascas and Hagendorff (2013) for a mixed sample
of US and European financial institutions. Moreover, as the coefficient from regression (3b)
increases in value as compared to baseline findings from Table 4, we suggest that banks moving
closer towards insolvency may opt to follow a “gambling for resurrection strategy”, i.e. executives
may more strongly carry out high-risk but high-return investments and seek to maximize the value
of the safety net.

29
5.3.3 Financial crisis and regulatory framework
As illustrated by Figure 1, bank-average variable compensation in European banks has sharply
decreased from the beginning of the financial crisis in mid-2007 until the end of our sample period
while the same is true for averaged z-score values. Accordingly, risk-taking incentives through
excess variable compensation are further analyzed with a special emphasis on the financial crisis
period in the following.
To begin with, based on results from a CUSUM test (Brown et al., 1975) for structural breaks in
our time series of z-score and compensation data we build two subsamples with the pre-crisis
subsample covering the time period between 2000 and 2006 and the crisis subsample stretching
from 2007 to 2010. As shown by regressions (1a) in Table 8c, baseline findings are reconfirmed for
the pre-crisis period. Hence, results indicate that the risk-increasing effect through variable
compensation over the whole sample period is not driven by the sharp decrease of z-score values
during the crisis period. On the contrary, as we do not observe any statistical impact of excess
variable pay on bank risk during the crisis period, results indirectly correspond to findings provided
by Fahlenbrach and Stulz (2011) for US banks suggesting that neither cash bonuses nor stock
options had an adverse impact on bank performance during the crisis. Results from our analysis
may initially be explained by the fact that the financial crisis itself has prevented bank executives
from greater risk-taking even at financially sounder banks during this period (Raviv and Sisli-
Ciamarra, 2013). In addition, it may also be true that risk-taking incentives may have become less
effective considering the sharp decrease in the amount of variable compensation being paid to
executives during the crisis period. In particular, the risk-taking effect may have faded with an
increase in fixed compensation and rising long-term variable payments as being observed in the
aftermath of the crisis in Europe.
We proceed and analyze the short- and long-term effect of risk-taking incentives through excess
variable compensation with a special emphasis on the financial crisis period. However, since most
European banks are silent on term structures of cash-based and equity-based compensation

30
packages, we propose the following procedure to approximately measure a short-term and long-
term effect. In a first step, we exclude compensation data observed during the crisis period (2007-
2010) from the sample. In a second step, z-score data from the crisis period (2007-2010) is panel-
regressed on compensation data from the pre-crisis period (2000-2006) in specification (2a)
whereas z-score data from the crisis-period is pooled-regressed on compensation data from the last
year before the crisis started (2006) in specification (2b). Table 8c reports that baseline findings are
reiterated for both specifications. In addition, results from regression (2a) may indicate a long-term
impact on bank risk through variable compensation supporting the widely believe that
compensation practices in the banking industry may have played an important role in causing the
recent financial crisis (e.g., Bebchuk and Spamann, 2010). Moreover, results indirectly correspond
to findings provided by Beltratti and Stulz (2012) suggesting that (European) banks with more
shareholder-friendly boards before the crisis performed worse during the crisis. As regards
regression specification (2b), findings at hand may further reveal a stronger short-term impact of
excess variable pay on bank risk as indicated by a significantly higher coefficient value of the
compensation measure as compared to regression (2b). Taking this into account, one may argue that
bank executives may have anticipated the crisis and sharply decreased their personal wealth
portfolios at the banks they manage shortly before the crisis, so that they did not bear the losses
from their risky investments ex post. In contrast, however, one may also hypothesize that the crisis
came fully unexpected for bank executives. If this is true, findings at hand underline the “short
termism” effect of variable compensation schemes.
We proceed and control for the effect of governmental capital assistance towards distressed
banks since it is assumed that risk-incentives through variable compensation may be different for
this subset of banks. As a focus on the crisis period only would result in an insufficient number of
observations, two subsamples are built over the entire sample period. The first subsample includes
18 banks from our sample, which explicitly retrieved governmental guarantees or capital assistance
during the financial crisis period whereas the second subsample comprises of 45 banks without

31
governmental help. The mean values of variable compensation do not remarkably differ between
both subsamples so that we can rule out that capital assistance was first and foremost provided due
to higher risk-taking induced by higher amounts of variable compensation paid at supported banks.
Regressions (3a) and (3b) in Table 8c reveal that excess variable compensation turns out to be
significantly negative for both subsamples. However, as compared to our baseline findings from
Table 4, the negative impact of excess variable compensation on bank risk is weaker for the
subsample of supported banks. Our findings correspond to empirical evidence provided by
Fahlenbrach and Stulz (2011) for a sample of TARP-supported US banks. Moreover, results at hand
do not support theoretical arguments that (anticipated) governmental guarantees or bail-outs may
have led to steeper bonus schemes and hence, induced even more managerial risk-taking at
European banks (Hakenes and Schnabel, 2014). They also contradict assumptions that bank profits
may have been boosted by favorable refinancing conditions due to public capital aid, thus further
increasing the source for higher variable pay and stronger risk-taking incentives. In contrast, taking
into account that governmental capital assistance typically comes along with specific constraints
(such as replacing executives or the suspension of executives’ fees and bonuses) results at hand
rather suggest that these interventions may be effective instruments to mitigate managerial risk-
taking incentives.
Turning to the regulatory framework it is initially investigated if baseline findings differ due to
a country’s deposit insurance system. Following the methodology provided by Demirgüç-Kunt and
Detragiache (2002) we employ data from chronological World Bank surveys (2001, 2003, 2007 and
2012) provided by Barth et al. (2012) to construct an index that measures the generosity of the
deposit insurance system. In this context, higher index values indicate greater generosity and hence,
a higher probability of managerial moral hazard and risk-taking. Table 8c reports that the deposit
insurance measure enters regression (4) insignificantly negative. In contrast, the coefficient of the
interaction term turns out to be significantly negative while coefficient values slightly increase as
compared to baseline findings from Table 4. Accordingly, results at hand reveal an increase in

32
managerial risk-taking through variable compensation under the financial safety net, which might
be due to the fact that risks may be additionally shifted to regulators (and taxpayers) as discussed in
detail in Section 2.
Finally, it is analyzed if the risk-increasing effect of excess variable compensation is mitigated
by strong supervisory oversight. We include the supervisory power index, which is computed from
the first principal component of answers to queries focusing on official supervisory power, the
strength of external audits and private monitoring as employed in different World Bank surveys
(2001, 2003, 2007 and 2012) provided by Barth et al. (2012). Higher values of this index indicate
greater supervisory power. Regression (5) in Table 8c reports that the supervisory index turns out to
be a significant determinant of bank soundness in general. Referring to the interaction term, results
additionally reveal that greater supervisory power substantially mitigates the negative impact of
excess variable pay on bank soundness. These findings are in line with previous empirical results
provided by Vallascas and Hagendorff (2013) suggesting a risk-reducing effect of cash bonus plans
if banks operate under a strong regulatory framework.
6 Summary and conclusion
Employing compensation data provided by 63 banks from 16 European countries for the period
from 2000 to 2010 this paper provides empirical evidence that excess variable compensation (either
cash-based or equity based) is positively related to bank risk. Our baseline finding is retained during
a variety of robustness checks, especially when employing Granger-causality tests and instrumental
variable regressions to address likely reverse causality. Most important results from a large number
of sensitivity analyses reveal that (i) risk-taking incentives may not only be set by bank
shareholders by committing respective compensation contracts but may also evolve from bank
executives’ intrinsic risk-preferences, (ii) the compensation-risk linkage may be stronger in
financially distressed banks suggesting “gambling for resurrection strategies”, (iii) the risk-
increasing impact of excess variable pay describes a long term effect indicating that pre-crisis

33
executive compensation may have contributed to an increase in bank risk during the crisis, (iv)
more generous deposit insurance schemes may spur managerial-risk taking whereas governmental
capital assistance during the crisis may mitigate it and (v) greater supervisory power may
substantially diminish the negative impact of compensation on bank soundness in Europe.
Taking empirical findings from this study into account, we suggest that the FSB’s principles on
sound compensation practices as discussed in Section 1 are indispensable. As we provide evidence
for a long-term risk-increasing effect of variable compensation at European banks, a deferral of
executive variable pay and an implementation of claw-back provisions, that allow recouping
variable payments if management decisions fail later on, should be suitable for maintaining
financial stability. In addition, as we find that negative impact of excess variable compensation on
bank soundness turns out to be stronger if variable pay exceeds fixed salaries, the European
Parliament’s decision to establish a regulatory cap of executive variable payments is appropriate.

34
References
Acrey, J.C., McCumber, W.R., Nguyen, T.H.T., 2011. CEO incentives and bank risk. Journal of Banking and Finance
63, 465-471.
Aggarwal, N.K., Samwick, A.A., 2003. Performance incentives within firms: the effect of managerial responsibility.
Journal of Finance 58(4), 1630-1650.
Albertazzi U., Gambacorta L., 2009. Bank profitability and the business cycle. Journal of Financial Stability 5, 393-
409.
Altman, E.I., 1968. Financial ratios, discriminant analysis and the prediction of corporate bankruptcy. Journal of
Finance 23:4, 589-610.
Altunbas, Y., Manganelli, S., Marques-Ibanez, D., 2011. Bank risk during the financial crisis – Do business models
matter? ECB Working Paper Series, No. 1394, European Central Bank, Frankfurt.
Altunbas, Y., Gambacorta, L., Marques-Ibanez, D., 2014. Does monetary policy affect bank risk-taking? International
Journal of Central Banking 10(1), 95-135.
Arellano, M., 1993. On the testing of correlated effects with panel data. Journal of Econometrics 59, 87-97.
Ayadi, R., Arbak, E., DeGroen, W.P., 2011. Executive Compensation and Risk Taking in European Banking, in: Barth,
J. R., Lin, C., Wihlborg, C. (eds.): Research Handbook on International Banking and Governance, 23-45, Edward
Elgar Publishing.
Bhagat, S., Bolton, B., 2012. Bank executive compensation and capital requirements reform. Unpublished working
paper, University of Colorado at Boulder and Portland State University.
Balachandran, S., Kogut, B., Harnal, H., 2010. The probability of default, excessive risk, and executive compensation:
A study of financial services firms from 1995-2008. Unpublished working paper, Columbia Business School.
Baltagi, B.H., Chang, Y.J., 1994. Incomplete panels: a comparative study of alternative estimators for the unbalanced
one-way error component regression model. Journal of Econometrics 62, 67-89.
Barclay, M., Gode, D., Kothari, S.P., 2005. Matching delivered performance. Journal of Contemporary Accounting
Research 1, 1‐25.
Barth, J.R., Caprio, G., Levine, L., 2012. The Evolution and Impact of Bank Regulations, World Bank Policy Research
Working Paper 6288.
Bebchuk, L.A., Cohen, A., Spamann, H., 2010. The wages of failure: Executive compensation at Bear Stearns and
Lehman 2000-2008. Yale Journal on Regulation 27, 257-282.
Bebchuk, L.A., Spamann, H., 2010. Regulating bankers’ pay. Georgetown Law Journal 98, 247-287.
Beck, T., Demirgüç-Kunt, A., Levine, R., 2006. Bank concentration, competition, and crises: First results. Journal of
Banking and Finance 30, 1581-1603.

35
Beltratti, A., Stulz, R., 2012. The credit crisis around the globe: Why did some banks perform better? Journal of
Financial Economics 105(1), 1-17.
Berger, A.N., Kick, T., Schaeck, K., 2014. Executive board composition and bank risk taking. 2014: Journal of
Corporate Finance 28, 48-65.
Bhagat, S., Bolton, B., 2014. Financial crisis and bank executive incentive compensation. Journal of Corporate Finance
25, 313-341.
Black, F., Scholes, M., 1973. The pricing of options and corporate liabilities. Journal of Political Economy 81, 637-654.
Board of Governors of the Federal Reserve System, Federal Deposit Insurance Corporation, Office of the Comptroller
of the Currency, Treasury,and Office of Thrift Supervision, 2010. Guidance on Sound Incentive Compensation
Policies. June 25 2010 .
Bolton, P., Mehran, H., Shapiro, J., 2011. Executive compensation and risk taking. Federal Reserve Bank of New York,
Staff Report No. 456.
Boot, A., Thakor, A., 2008. Handbook of financial intermediation and banking, Elsevier.
Borio, C., Furfine, C., Lowe, P., 2001. Procyclicality of the financial system and financial stability: Issues and policy
options, Bank for International Settlement Working Paper No. 1, Basel.
Bosma, J.J., Koetter, M., 2013. Bank executive compensation and systemic risk. Unpublished working paper,
University of Groningen, and Frankfurt School of Finance and Management.
Boyd, J.H., De Nicoló, G., 2006. The theory of bank risk-taking and competition revisited. Journal of Finance 60, 1329-
1343.
Brown, R.L., Durbin, J., Evans, J.M., 1975. Techniques for testing the constancy of regression relationships over time.
Journal of the Royal Statistical Society B 37, 149-163.
Brunnermeier, M.K., Dong, G., Palia, D., 2011. Banks’ non-interest income and systemic risk. Working Paper,
Princeton University.
Caprio, G., Levine, R., 2002. Corporate governance of banks: Concepts and international observations, in: Litan, R.E.,
Pomerleano, M., Sundararajan, V., (eds): Financial Sector Governance: The Roles of Private and Public Sectors,
17-50, Washington D.C.
Chaigneau, P., 2013. Risk-shifting and the regulation of bank CEOs’ compensation. Journal of Financial Stability 9,
778-789.
Chemmanur, T.J., Cheng, Y., Zhang, T., 2013. Human Capital, Capital Structure, and Employee Pay: An Empirical
Analysis. Journal of Financial Economics 110 (2), 478-502.
Chen, C.R., Steiner, T.L., Whyte, A.M., 1998. Risk-taking behavior and management ownership in depository
institutions. Journal of Financial Research 21(1), 1-16.

36
Chen, C.R., Steiner, T.L., Whyte, A.M., 2006. Does stock option-based executive compensation induce risk-taking? An
analysis of the banking industry. Journal of Banking and Finance 30, 915-945.
Chesney, M., Stromberg, J., Wagner, A., 2010. Risk-taking incentives, governance, and losses in the financial crisis.
Research Paper 10-18, Swiss Finance Institute.
Choi, I., 2001. Unit root tests for panel data. Journal of International Money and Finance 20, 249-272.
Coles, J.L., Daniel, N.D., Naveen, L., 2006. Executive incentives and risk-taking. Journal of Financial Economics 79,
431-468.
Crawford, A.J., Ezzell, J.R., Miles, J.A., 1995. Bank CEO pay-performance relations and the effects of deregulation.
Journal of Business 68, 231-256.
Demirgüç-Kunt, A., Detragiache, E., 2002. Does deposit insurance increase banking system stability? An empirical
investigation. Journal of Monetary Economics 49, 1373-1406.
Demirgüc-Kunt, A., Huizinga, H., 2010. Bank activity and funding strategies: The impact on risk and returns. Journal of
Financial Economics 98, 626-650.
Edmans, A., Liu, Q., 2011. Inside debt. Review of Finance 15, 75-102.
Dickey, D.A., Fuller, W.A., 1979. Distribution of the estimators for autoregressive time series with a unit root. Journal
of the American Statistical Association 74, 427-431.
Dickey, D.A., Fuller, W.A., 1981. Likelihood ratio statistics for autoregressive time series with a unit root.
Econometrica 49, 1057-1072.
European Commission, 2010a. State aid scoreboard (spring 2010). Brussels.
European Commission, 2010b. Competition’s review of guarantee and recapitalization schemes in the financial sector
in the current crisis. Brussels.
Fahlenbrach, R., 2009. Shareholder rights, boards, and executive compensation. Review of Finance 13, 81-113.
Fahlenbrach, R., Stulz, R. M., 2011. Bank CEO incentives and the credit crisis, Journal of Financial Economics 99, 11-
26.
Financial Stability Board, 2009. FSB Principles for Sound Compensation Practices – Implementation Standards (25
September 2009). Basel.
Foos, D., Norden L., Weber, M., 2010. Loan growth and riskiness of banks. Journal of Banking and Finance 34(12),
2929-2940.
Freixas, X., Rochet, J.C., 2013. Taming Systemically Important Financial Institutions. Journal of Money, Credit and
Banking 45 (SUPPL 1), 37-58.
Gabaix, X., Landier, A., 2008. Why has CEO pay increased so much? Quarterly Journal of Economics 123(1), 49-100.

37
Gillette, A.B., Noe, T.H., Rebello, M.J., 2008. Board structures around the world: An experimental investigation.
Review of Finance 12(1), 93-140.
Goddard, J., Molyneux, P., Wilson, J.O.S., Tavakoli, M., 2007. European Banking: An overview. Journal of Banking
and Finance 31, 1911-1935.
Graham, J.R., Li, S., Qiu, J., 2011. Managerial attributes and executive compensation. Review of Financial Studies 24,
1944-1979.
Granger, C.W.J., 1969. Investigating causal relations by econometric models and cross-spectral methods. Econometrica
37, 424-436.
Gregg, P., Jewell, S., Tonks, I., 2011. Executive pay and performance: Did bankers’ bonuses cause the crisis?
International Review of Finance 12(1), 89-122.
Guay, W., 1999. Compensation, convexity, and the incentives to manage risk: An empirical analysis. Journal of
Financial Economics 53, 43-71.
Hagendorff, J., Vallascas, F., 2011. CEO pay incentives and risk-taking: Evidence from bank acquisitions. Journal of
Corporate Finance 17(4), 1078-1095.
Hakenes, H., Schnabel, I., 2014. Bank bonuses and bail-outs. Journal of Money, Credit and Banking 46(1), 259-288.
Heckman. J.J., 1979. Sample selection bias as a specification error. Econometrica 47(1), 153-162.
Hellmann, T.F., Murdock, K.C., Stiglitz, J.E., 2000. Liberalization, moral hazard in banking, and prudential regulation:
Are capital requirements enough? American Economic Review 90(1), 147-165.
Hermalin, B.E., Weisbach, M.S., 2003. Boards of directors as an endogenously determined institution: A survey of the
economic literature. Economic Policy Review, 7-26.
Holthausen, R.W., Larcker, D.F., Sloan, R.G., 1995. Annual bonus schemes and the manipulation of earnings. Journal
of Accounting and Economics 19, 29-74.
Houston, J.F., James, C., 1995. CEO compensation and bank risk: Is compensation in banking structured to promote
risk taking? Journal of Monetary Economics 36(2), 405-431.
Houston, J., Lin, C., Lin, P., Ma, Y., 2010. Creditor rights, information sharing, and bank risk taking. Journal of
Financial Economics 96, 485-512.
Jeitschko, T.D., Jeung, S.D., 2005. Incentives for risk-taking in banking - A unified approach. Journal of Banking and
Finance 29(3), 759-777.
Jensen, M.C., Murphy, K.J., 1990. Performance pay and top-management incentives. Journal of Political Economy
98(2), 225-264.
John, T.A., John, K., 1993. Top-management compensation and capital structure. Journal of Finance 48(3), 949-74.

38
John, K., Saunders, A., Senbet, L.W., 2000. A theory of bank regulation and management compensation. Review of
Financial Studies 13(1), 95-125.
John, K., Qian, Y., 2003. Incentive features in CEO compensation in the banking industry. Federal Reserve Bank of
New York Economic Policy Review 9, 109-121.
Khan, W.A., Vieito, J.P., 2013. CEO gender and firm performance. Journal of Economics and Business 67, 55-66.
Keeley, M., 1990. Deposit insurance, risk and market power in banking. American Economic Review 80, 1183-1200.
Kim, J.-B., Li, Y., Zhang, L., 2011. CFOs versus CEOs: Equity incentives and crashes. Journal of Financial Economics
101, 713-730.
Kose, J., Litov, L., Yeung, B., 2008. Corporate governance and risk‐taking. The Journal of Finance 63(4), 1679-1728.
Kleibergen, F., Paap, R., 2006. Generalized reduced rank tests using the singular value decomposition. Journal of
Econometrics 127, 97-126.
Laeven, L., Levine, R., 2009. Bank governance, regulation and risk taking. Journal of Financial Economics 93, 259-
275.
La Porta, R., Lopez-de Silanes, F., Shleifer, A., Vishny, R.W., 1997. Legal determinants of external finance. Journal of
Finance 52(3), 1131-1150.
Lepetit, L., Nys, E., Rous, P., Tarazi, A., 2008. Bank income structure and risk: An empirical analysis for European
banks. Journal of Banking and Finance 32, 1452-1467.
Mehran, H., Rosenberg, J.V., 2007. The effect of employee stock options on bank investment choice, borrowing, and
capital. Staff Report No. 305, Federal Reserve Bank of New York.
Mehran, H., Morrison, A., Shapiro, J., 2011. Corporate Governance and Banks: What Have We Learned From the
Financial Crisis? mimeo, Federal Reserve Bank of New York.
Merton, R.C., 1973. Theory of rational option pricing. Bell Journal of Economics and Management Science 4, 141-183.
Merton, R.C., 1974. On the pricing of corporate debt: The risk structure of interest rates. Journal of Finance 29, 449-
470.
Murphy, K., 1999. Executive Compensation, in: Ashenfelter, O., Card, D. (eds.): Handbook of Labor Economics, Vol.
3b. New York and Oxford, 2485-2563.
Murphy, K., 2000. Performance standards in incentive contracts. Journal of Accounting and Economics 30, 245‐278.
Parrino, R., Poteshman, A.M., Weisbach, M.S., 2005. Measuring investment distortions when risk-averse managers
decide whether to undertake risky projects. Financial Management 12, 21-60.
Pathan, S., 2009. Strong boards, CEO power and bank risk-taking. Journal of Banking and Finance 33(7), 1340-1350.
Phillips, P.C.B., Perron, P., 1988. Testing for an unit root in time series regression. Biometrika 75, 335-346.

39
Raviv, A., Sisli-Ciamarra, E., 2013. Executive compensation, risk taking and the state of the economy. Journal of
Financial Stability 9(1), 55-68.
Repullo, R., 2004. Capital requirements, market power and risk-taking in banking. Journal of Financial Intermediation
13(2), 156-182.
Ross, S.A., 2004. Compensation, incentives, and the duality of risk aversion and riskiness. Journal of Finance 59, 207-
225.
Saunders, A., Strock, E., Travlos, N.G., 1990. Ownership structure, deregulation, and bank risk taking. Journal of
Finance 45(2), 643-654.
Schaeck, K., Čihák, M. 2012. Banking Competition and Capital Ratios. European Financial Management 18(5), 836-
866.
Schubert, R., Brown, M., Gysler, M., Brachinger, H.W., 1999. Financial decision-making: Are women really more risk-
averse? The American Economic Review 89(2), 381-385.
Smith, C.W., Stulz, R.M., 1985. The determinants of firms' hedging policies. Journal of Financial and Quantitative
Analysis 20(4), 391-405.
Smith, C.W., Watts, R.L., 1992. The investment opportunity set and corporate financing, dividend, and compensation
policies. Journal of Financial Economics 32, 263-292.
Spamann, H., 2010. The “Antidirector Rights Index” revisited. Review of Financial Studies 23, 467-486.
Srivastav, A., Armitage, S., Hagendorff, J., 2014. CEO inside debt holdings and risk-shifting: Evidence from bank
payout policies. Journal of Banking and Finance 47, 41-53.
Staiger, D., Stock, J.H., 1997. Instrumental variables regression with weak instruments. Econometrica 65, 557-86.
Stock, J. H., Yogo, M., 2005. Testing for weak instruments in linear IV regression. In: Andrews, D.W., Stock, J.H.
(Eds.), Identification and Inference for Econometric Models: Essays in Honor of Thomas Rothenberg. Cambridge
University Press, 80-108.
Strobel, F., 2014. Bank insolvency risk and z-score measures: A refinement. Working Paper, University of
Birmingham.
Uhde, A., Heimeshoff, U., 2009. Consolidation in banking and financial stability in Europe: Empirical evidence.
Journal of Banking and Finance 33, 1299-1311.
Vallascas, F., Hagendorff, J., 2013. CEO bonus remuneration and bank default risk: Evidence from the U.S. and
Europe. Financial Markets, Institutions & Instruments, 47-89.
White, H., 1980. A heteroskedasticity-consistent covariance matrix estimator and a direct test for heteroskedasticity.
Econometrica 48, 817-830.
Wooldridge, J.M., 2002. Econometric analysis of cross section and panel data. MIT Press, Cambridge.

40
Statistical Appendix Table 1 Geographical distribution of banks and availability of total variable compensation data
Country Bank name Total variable
compensation
Austria Erste Group Bank 2000-2010 Hypo Alpe Adria 2003-2008
Kommunalkredit Austria 2003-2007
Raiffeisen Zentralbank Oesterreich 2005-2010 Belgium Dexia 2004-2007
Fortis (state-owned in 2008) 2001-2008 Czech Republic Česká spořitelna 2004-2010
Komercni Banka 2004-2010 Denmark Danske Bank 2001-2010 France Banque Populaire Group 2003-2008
BNP Paribas 2000-2010
Crédit Agricole 2005-2010
Dexia Crédit Local 2005-2010
Natexis / Natixis (since 2006) 2003-2010
Société Générale 2000-2010 Germany Bayerische Hypo- und Vereinsbank 2001-2003
Bayerische Landesbank 2001-2007
Commerzbank 2000-2010
Deutsche Bank 2000-2010 Deutsche Postbank 2004-2010
Hypo Real Estate Holding 2003-2008
KFW Bankengruppe 2004-2010
Landwirtschaftliche Rentenbank 2004-2010
West LB 2004-2008 Ireland Allied Irish Banks 2000-2008
Anglo Irish Bank 2000-2008
Bank of Ireland 2000-2010
Irish Life & Permanent 2000-2010 Italy UniCredit Group 2002-2010 Netherlands ABN Amro Holding 2000-2010
Delta Lloyd Group 2001-2010
Friesland Bank 2003-2010
ING Groep 2000-2010
NIBC Bank (NIBC Holding since 2003) 2002-2010
Rabobank Nederland-Rabobank Group 2004-2010
SNS Reaal 2002-2010
Van Lanschot 2002-2010

41
Table 1 (continued)
Country Bank name Total variable
compensation
Norway SpareBank 1 SR-Bank 2004-2010
Poland BRE Bank 2004-2010
Kredyt Bank 2004-2009
Portugal Banco BPI 2000-2010
Banco Comercial Português 2002-2009
Banco Espirito Santo 2003-2010
Spain Banco Bilbao Vizcaya Argentaria 2000-2010
Banco Espanol de Crédito 2004-2010
Banco Popular Espanol 2005-2010
Banco Santander 2002-2010
Sweden AB Svensk Exportkredit 2003-2007
Kommuninvest i Sverige 2004-2010
Länsförsäkringar 2004-2009
Nordea Bank 2000-2010
Skandinaviska Enskilda Banken 2002-2010
Svenska Handelsbanken 2002-2010
Switzerland Banque Cantonale Vaudoise 2003-2010
Credit Suisse Group 2002-2010
UBS 2002-2010
United Kingdom Barclays 2000-2010
HBOS 2000-2007
HSBC Holdings 2000-2010
Lloyds Banking Group 2000-2010
Northern Rock 2000-2008
Royal Bank of Scotland Group 2000-2010
Standard Chartered 2000-2010

42
Table 2 Description of variables and data sources
Variable Description Data sources
z-score
Natural log of the ratio of the sum of equity capital to total assets and the return on average assets before taxes (ROAA) to the standard deviation of ROAA. The standard deviation of ROAA is calculated employing a five-year rolling window.
BankScope, own calc.
Variable compensation
Sum of executive total variablecompensation in million EUR per bank and year. If indicated by bank, sum of cash-based and equity-based (non-cash) performance-related compensation.
Banks’ annual reports, SEC Form 20-F filings
Excess variable compensation The residuals of a regression of variable compensation on bank size, country- and time-dummies.
Own calc.
Variable cash-based compensation Sum of executive variable cash-basedcompensation in million EUR per bank and year.
Banks’ annual reports, SEC Form 20-F filings
Excess variable cash-based compensation
The residuals of a regression of variablecash-based compensation on bank size, country- and time-dummies.
Own calc.
Variable equity-based compensation Sum of executive variable equity-basedcompensation in million EUR per bank and year.
Banks’ annual reports, SEC Form 20-F filings
Excess variable equity-based compensation
The residuals of a regression of variable equity-based compensation on bank size, country- and time-dummies.
Own calc.
Years An executive’s consecutive number of years on a bank board.
Banks’ annual reports
Age An executive’s age in consecutive years on a bank board.
Banks’ annual reports
Executive’s quality The ratio of an executive’s consecutive years on board to an executive’s age.
Own calc.
Average variable compensation The sum of total variable compensation divided by the number of executives in charge per bank and year in million EUR.
Own calc.
Excess average variable compensation The residuals of a regression of average variable compensation on bank size, country- and time-dummies.
Own calc.
Variable to fixed compensation
The ratio of the sum of executive total variable compensation to the sum of executive fixed compensation per bank and year.
Own calc.
Excess variable to fixed compensation The residuals of a regression of the ratio of variable to fixed compensation on bank size, country- and time-dummies.
Own calc.
One-tier system Dummy that takes on the value of 1 if a one-tier board structure is installed, and zero otherwise.
Banks’ annual reports

43
Table 2 (continued)
Variable Description Data sources
Two-tier system Dummy that takes on the value of 1 if a bank exhibits a two-tier board structure, and zero otherwise.
Banks’ annual reports
Board size The total number of executives on a bank board per bank and year.
Banks’ annual reports
Non-executives to board size The ratio of the number of non-executives to board size per bank and year serving as a proxy for board independence.
Banks’ annual reports
Male executives The total number of male executives on a bank board per bank and year.
Banks’ annual reports
Female executives The total number of female executives on a bank board per bank and year.
Banks’ annual reports
ADRI
The corrected Anti-Director Rights Index(ADRI) per country and year. Originally from La Porta et al., 1998) and updated by Spamann (2010). The index ranges from 0 to 5 with higher index values indicating stronger shareholder rights.
Spamann (2010)
Stock-listed bank Dummy that takes on the value of 1 if a bank is stock-listed, and zero otherwise.
Non-stock-listed bank Dummy that takes on the value of 1 if a bank is not stock-listed, and zero otherwise.
Distance to default
A stock-listed bank’s distance to defaultper year. The distance to default is calculated following the Merton framework (1973, 1974).
Datastream, own calc.
Systematic risk
A stock-listed bank’s systematic risk (beta factor) per year. The beta factor is estimated from the standard CAPM (market model).
Datastream, own calc.
Idiosyncratic risk
A stock-listed bank’s idiosyncratic risk per year. The idiosyncratic risk is estimated following the methodology proposed by Altunbas et al. (2014).
Datastream, Altunbas et al. (2014), own calc.
Business model A bank’s ratio of non-interest income to total operating income per year.
BankScope
High-risk bank Dummy that takes on the value of 1 if a z-score-value is located in the first quartile of the distribution, and zero otherwise.
Own calc.
Low-risk bank
Dummy that takes on the value of 1 if a z-score-value is located in the fourth quartile of the distribution, and zero otherwise.
Own calc.
Pre-crisis Dummy that takes on the value of 1 for the years 2000-2006, and zero otherwise.
Own calc.
Crisis Dummy that takes on the value of 1 for the years 2007-2010, and zero otherwise.
Own calc.

44
Table 2 (continued)
Variable Description Data sources
Aid
Dummy that takes on the value of 1 in years when a bank has retrieved governmental guarantees of capital assistance, and zero otherwise.
European Commission (2010a, 2010b)
No aid Dummy that takes on the value of 1 in years when a bank has not been supported by government, and zero otherwise.
European Commission (2010a, 2010b)
Deposit insurance
Index that measures the generosity of the deposit insurance regime. The index is built from the following deposit insurance design features: coinsurance, coverage of foreign currency and interbank deposits, type of funding, source of funding, management, membership, and the level of explicit coverage. Higher index values indicate greater generosity.
Demirgüç-Kunt and Detragiache (2002), World Bank surveys, own calc.
Supervisory power
The principal component of the following queries as employed in World Bank surveys (2001, 2003, 2007 and 2012) provided by Barth et al. (2012): (a) Can supervisors take legal action against bank directors and officers?, (b) Can supervisors suspend CEO’s fees and bonuses?, (c) Can supervisors supersede shareholder rights and remove/replace CEOs?, (d) Are at least 100 percent of the largest 10 banks be rated by international rating agencies?, (e) Are bank directors and officials legally liable for the accuracy of information disclosed to the public?, (f) Are external auditors licensed or certified?, (g) Do supervisors receive a copy of the auditor’s report?, (h) Are auditors legally required to report bank misconduct to supervisors?, and (i) Can supervisors take legal action against external auditors? Higher index values indicate greater supervisory power.
World Bank surveys
GDP The natural log of a country’s GDP in constant EUR per year.
World Bank’s WDI
Slope Slope of the yield curve. Calculated as 10-year minus 2-year government bond yields per country and year.
Datastream
Leverage A bank’s leverage ratio calculated as debt to equity per year.
BankScope
Tier1 A bank’s ratio of Tier 1 capital to risk-weighted assets per year.
BankScope
Liquidity A bank’s liquidity ratio. Calculated as 1 minus the ratio of net loans to total assetsper year.
BankScope

45
Table 3 Descriptive statistics (absolute values in million EUR)
Variable N Mean SD Min Max
z-score 693 1.1729 0.423 ‒1.4861 2.2558
Variable compensation 489 5.6993 14.6052 0 156.01
Excess variable compensation 489 0.0015 0.137 ‒0.2354 1.2288
Variable cash-based compensation 335 4.3122 8.2344 0 66.75
Excess variable cash-based compensation 335 0.0017 0.0737 ‒0.1155 0.5246
Variable equity-based compensation 154 7.9444 16.8493 0 89.26
Excess variable equity-based compensation 154 0.0055 0.1576 ‒0.2114 0.7924
Years 585 12.9362 5.9925 2 18
Age 585 49.5704 7.0139 32 72
Executive’s quality 585 0.2571 0.1028 0.0417 0.6667
Average variable compensation 489 0.8727 1.5063 0 11.0525
Excess average variable compensation 489 0.0032 0.0133 ‒0.0322 0.092
Variable to fixed compensation 489 1.4554 2.3938 0 17.8913
Excess variable to fixed compensation 489 0.0052 0.0224 ‒0.0394 0.1650
One-tier system 585 0.3333 0.4718 0 1
Two-tier system 585 0.6667 0.4718 0 1
Board size 585 8.1145 3.4016 4 25
Non-executives to board size 585 0.6806 0.1281 0.2857 0.6565
Male executives 585 5.7778 3.1675 4 21
Female executives 585 0.3368 0.7006 0 4
ADRI 638 3.1505 1.0991 0 5
Stock-listed bank 693 0.6349 0.4814 0 1
Non-stock-listed bank 693 0.3651 0.4814 0 1
Distance to default 440 4.47 2.4333 0.0016 16.9722
Systematic risk 440 0.8429 0.4525 1.0106 2.3248
Idiosyncratic risk 440 0.0503 0.0901 0.0028 0.9399
Business model 652 0.4109 1.1339 ‒17.2857 17.7039
High-risk bank 693 0.2294 0.4208 0 1
Low-risk bank 693 0.3117 0.4635 0 1
Pre-crisis 693 0.6364 0.4814 0 1
Crisis 693 0.3636 0.4814 0 1
Aid 693 0.2857 0.4521 0 1
No aid 693 0.7143 0.4521 0 1
Deposit insurance 638 2.8950 1.4186 0 6
Supervisory power 636 0.2111 1.0032 ‒5.8359 2.3498
GDP 693 27.0972 1.0071 24.8601 28.5078
Slope 693 0.9925 0.6532 ‒0.0014 2.781
Leverage 635 0.3124 0.6181 0.0745 12.49
Tier1 634 0.0772 0.0399 0.004 0.347
Liquidity 652 0.4996 0.1815 0.0856 0.9921

46
Figure 1 Development of z-score and variable compensation averaged by the number of banks per year

47
Table 4 Baseline regressions
(1) (2) (3)
Excess variable compensation (t‒1) ‒0.2542*** (0.0000)
Excess variable cash-based compensation (t‒1) ‒0.3565*** (0.0043)
Excess variable equity-based compensation (t‒1) ‒0.2271*** (0.0077)
GDP 0.0550 0.0524 0.0472 (0.5882) (0.3755) (0.4340)
Slope 0.0420* 0.0316** 0.0371** (0.0757) (0.0253) (0.0391)
Leverage ‒0.0635** ‒0.0517*** ‒0.0518*** (0.0131) (0.0000) (0.0008)
Tier1 1.0982** 0.9550* 0.9058** (0.0236) (0.0766) (0.0117)
Liquidity 0.2207 0.1669 0.1319 (0.1084) (0.5113) (0.4204) Cluster at bank-level Yes Yes Yes Time dummies Yes Yes Yes No. of obs. 459 325 134 No. of groups 63 44 19 Adj. R² 0.32 0.24 0.22
The fixed-effects panel model estimated is z-score (i=bank, j=time) = α + β1 Compensationi,t-1 + β2 GDPi,t + β3 Slopei,t
+ β4 Leveragei,t + β5 Tier1i,t + β6 Liquidityi,t + μt + εi,t. Constant term included but not reported. Heteroscedasticity
consistent p-values are reported in parentheses. *, **, and *** indicate statistical significance at the 10%, 5%, and 1%
level respectively. Excess variable compensation is substituted by excess variable cash-based and excess variable
equity-based compensation in regressions (2) and (3).

48
Table 5 Granger-causality tests
(1)
z-score → compensation
(2)
Compensation → z-score
Excess variable compensation (t‒1) 0.4032*** ‒0.1999** (0.0000) (0.0360)
z-score (t‒1) 0.0209 0.3353*** (0.4980) (0.0001)
GDP 0.0237 0.0650 (0.8057) (0.4083)
Slope 0.0172 0.0200* (0.1251) (0.0912)
Leverage 0.0013* ‒0.0451***
(0.0643) (0.0005)
Tier1 0.3528 0.7004*** (0.1227) (0.0076)
Liquidity 0.0877*** 0.1224 (0.0063) (0.4172) Cluster at bank-level Yes Yes Time dummies Yes Yes No. of obs. 459 459 No. of groups 63 63 Adj. R² 0.18 0.46 Fisher-type unit root test (z-score)
ADF (inverse χ2, p-value) 114.01 (0.0045) Phillips-Perron (inverse χ2, p-value) 225.91 (0.0089)
Fisher-type unit root test (compensation)
ADF (inverse χ2, p-value) 260.96 (0.0000) Phillips-Perron (inverse χ2, p-value) 252.96 (0.0000) Granger-causality ( lag order of 1, based on AIC & SIC)
H0: z-score does not GC compensation (F-test, p-value) 0.46 (0.4980) H0: compensation does not GC z-score (F-test, p-value) 4.59 (0.0360)
The empirical model and estimation parameters are defined in Table 4. In regression (1) excess variable compensation is regressed on a one-
period lag of itself and on the one-period lagged z-score. In regression (2) z-score is regressed on a one-period lag of itself and on the one-period
lagged excess variable compensation.

49
Table 6 2SLS IV regression
(1)
1st stage regression (2)
Excess variable compensation (t‒1) ‒0.2616*** (0.0043)
Executive’s quality (t‒1) 3.4144*** (0.0000)
GDP 0.0793 0.0553 (0.2134) (0.5771)
Slope 0.0023** 0.0221* (0.0415) (0.0611)
Leverage 0.0084* ‒0.0415*** (0.0633) (0.0093)
Tier1 0.0573 1.0621** (0.3814) (0.0172)
Liquidity 0.4344** 0.2147*
(0.0113) (0.0954)
Cluster at bank-level Yes Yes Time dummies Yes Yes No. of obs. 459 459 No. of groups 63 63 Adj. R² 0.34
Centered R2 0.48 F-test 13.26
Stock-Yogo critical value (10 %) 16.38 KP rK LM Statistic 16.242*** KP rK Wald F Statistic 14.921 Hansen J statistic (p-value) 0.000
Regressions are estimated by means of a 2SLS instrumental variable regression. Excess variable compensation is
instrumented by the one-period lagged ratio of an executive’s years on board to an executive’s age serving as a
proxy for an executive’s quality. Results from the 1st stage regression are shown in specification (1).
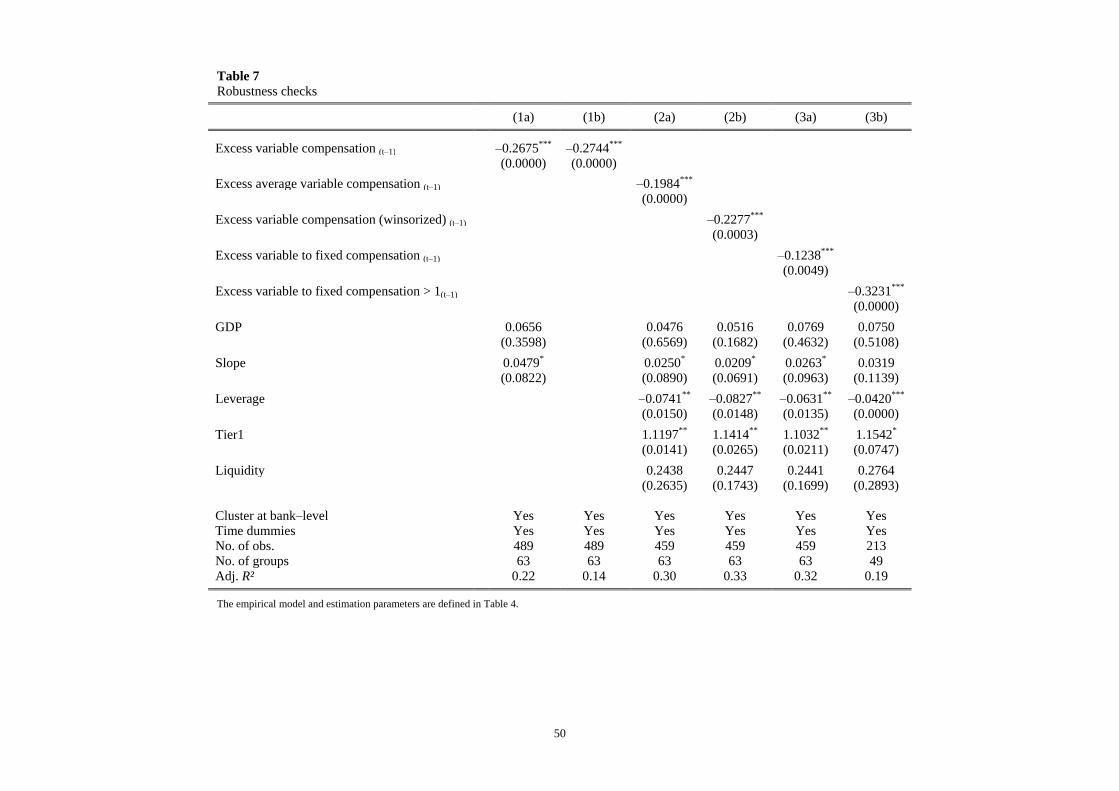
50
Table 7 Robustness checks
(1a) (1b) (2a) (2b) (3a) (3b)
Excess variable compensation (t‒1) ‒0.2675*** ‒0.2744*** (0.0000) (0.0000)
Excess average variable compensation (t‒1) ‒0.1984***
(0.0000)
Excess variable compensation (winsorized) (t‒1) ‒0.2277***
(0.0003)
Excess variable to fixed compensation (t‒1) ‒0.1238***
(0.0049)
Excess variable to fixed compensation > 1(t‒1) ‒0.3231***
(0.0000)
GDP 0.0656 0.0476 0.0516 0.0769 0.0750(0.3598) (0.6569) (0.1682) (0.4632) (0.5108)
Slope 0.0479* 0.0250* 0.0209* 0.0263* 0.0319(0.0822) (0.0890) (0.0691) (0.0963) (0.1139)
Leverage ‒0.0741** ‒0.0827** ‒0.0631** ‒0.0420***
(0.0150) (0.0148) (0.0135) (0.0000)
Tier1 1.1197** 1.1414** 1.1032** 1.1542*
(0.0141) (0.0265) (0.0211) (0.0747)
Liquidity 0.2438 0.2447 0.2441 0.2764(0.2635) (0.1743) (0.1699) (0.2893)
Cluster at bank‒level Yes Yes Yes Yes Yes YesTime dummies Yes Yes Yes Yes Yes YesNo. of obs. 489 489 459 459 459 213No. of groups 63 63 63 63 63 49Adj. R² 0.22 0.14 0.30 0.33 0.32 0.19
The empirical model and estimation parameters are defined in Table 4.

51
Table 8a Sensitivity analyses: Board characteristics
(1a) (1b) (2) (3) (4a) (4b) (5)
Excess variable compensation (t‒1) ‒0.2628*** ‒0.0986* ‒0.2402*** ‒0.2474*** ‒0.3416*** ‒0.1659* ‒0.2179***
(0.0000) (0.0773) (0.0002) (0.0000) (0.0000) (0.0862) (0.0000)
Board size 0.0673 (0.3703)
Non-executives to board size 0.0564 (0.6932)
ADRI ‒0.1295**
(0.0251)
Excess variable compensation * ADRI (t‒1) ‒0.4550***
(0.0094)
GDP 0.0913 0.0768 0.0368 0.0646 0.0870 0.0538 0.0336(0.5451) (0.4213) (0.7856) (0.5667) (0.5766) (0.2419) (0.7910)
Slope 0.0514** 0.0702 0.0292** 0.0255** 0.0470** 0.0852 0.0484*
(0.0388) (0.1437) (0.0461) (0.0222) (0.0461) (0.1262) (0.0779)
Leverage ‒0.0579*** ‒0.0974*** ‒0.0629** ‒0.0649** ‒0.0645** ‒0.0725* ‒0.0551***
(0.0081) (0.0000) (0.0122) (0.0140) (0.0112) (0.0950) (0.0007)
Tier1 1.0125* 0.9467* 1.2827** 0.9327** 0.9738** 1.0383* 1.0598**
(0.0810) (0.0589) (0.0156) (0.0145) (0.0429) (0.0792) (0.0375)
Liquidity 0.2939 0.2197 0.1836 0.2822 0.2868 0.2522 0.2135(0.1977) (0.4867) (0.2331) (0.4868) (0.5555) (0.1731) (0.1532)
Cluster at bank‒level Yes Yes Yes Yes Yes Yes YesTime dummies Yes Yes Yes Yes Yes Yes YesNo. of obs. 278 181 459 459 343 116 459No. of groups 42 21 63 63 39 24 63Adj. R² 0.21 0.22 0.34 0.30 0.30 0.10 0.35
The empirical model and estimation parameters are defined in Table 4. Regression (1a) includes banks with a one-tier board structure whereas regression (1b)
comprises of banks with a two-tier system. Regression (2) controls for a bank’s board size while regression (3) further controls for board independence. Regression
(4a) includes banks with exceptionally male executives on board whereas regression (4b) comprises of banks with at least one female executive among the board’s
executives. The effect of anti-directors rights is investigated in regression (5).

52
Table 8b Sensitivity analyses: Bank characteristics
(1a) (1b) (2a) (2b) (2c) (3) (4a) (4b)
Excess variable compensation (t‒1) ‒0.3273*** ‒0.1618** ‒0.7402** 0.3355** 0.3531* ‒0.2112*** ‒0.3642* ‒0.1401 (0.0001) (0.0124) (0.0483) (0.0174) (0.0821) (0.0000) (0.0759) (0.3780)
Business model ‒0.0158**
(0.0149)
Excess variable compensation * Business model (t‒1) ‒0.3564***
(0.0065)
GDP 0.0624* 0.0825 0.0467** ‒0.0561 ‒0.0260 0.0651 0.0697 0.0893 (0.0702) (0.2943) (0.0298) (0.2345) (0.8052) (0.5811) (0.3897) (0.2075)
Slope 0.0800 0.0278** 0.0436* ‒0.0508 ‒0.0342* 0.0134* 0.0977* 0.0144 (0.4024) (0.0266) (0.0826) (0.1091) (0.0875) (0.0636) (0.0987) (0.1722)
Leverage ‒0.0466** ‒0.0895*** ‒0.1855 0.1660** 0.1362 ‒0.0591*** ‒0.1583** ‒0.0974**
(0.0134) (0.0001) (0.7991) (0.0341) (0.6348) (0.0004) (0.0294) (0.0106)
Tier1 1.1049** 0.9574 1.2863 ‒1.1694* ‒1.4576 1.0368** 1.7552* 1.0749 (0.0302) (0.5394) (0.4063) (0.0981) (0.7990) (0.0199) (0.0512) (0.1914)
Liquidity 0.2495*** 0.1652 0.2516 ‒0.2910 ‒0.3522 0.1981 0.4223*** 0.2433 (0.0003) (0.6961) (0.7272) (0.7820) (0.6874) (0.1320) (0.0030) (0.3038) Cluster at bank‒level Yes Yes Yes Yes Yes Yes Yes Yes Time dummies Yes Yes Yes Yes Yes Yes Yes Yes No. of obs. 324 135 324 324 324 459 109 119No. of groups 40 23 40 40 40 63 19 21Adj. R² 0.51 0.38 0.16 0.15 0.17 0.36 0.48 0.47
The empirical model and estimation parameters are defined in Table 4. Regression (1a) includes stock-listed banks whereas regression (1b) comprises of non-stock-listed banks from the
sample. The z-score measure is substituted by a bank’s distance-to-default, systematic risk and idiosyncratic risk in regressions (2a)-(2c) respectively. The effect of a bank’s business model is
investigated by regression (3). Regression (4a) includes high-risk banks (z-score values located in the first quartile of distribution) whereas regression (4b) comprises of low-risk banks (z-score
values located in the fourth quartile).

53
Table 8c Sensitivity analyses: Financial crisis and regulatory framework
(1a) (1b) (2a) (2b) (3a) (3b) (4) (5)
Excess variable compensation (t‒1) ‒0.2979*** ‒0.0436 ‒0.1858*** ‒0.2420** ‒0.1832** ‒0.1716*** (0.0004) (0.6294) (0.0051) (0.0483) (0.0374) (0.0023)
Excess variable compensation (2000-2006)…. ‒0.2625*** (0.0000)
Excess variable compensation (2006) ‒0.4159***
(0.0006)
Deposit insurance ‒0.0150 (0.3341)
Excess variable compensation * Deposit insurance (t‒1) ‒0.2830**
(0.0462)
Supervisory power 0.3825*** (0.0000)
Excess variable compensation * Supervisory power (t‒1)…. ‒0.0386** (0.0356)
GDP 0.1114 0.1318* 0.0175 0.0435 0.0327 0.0949 0.1046 0.0606 (0.4222) (0.0939) (0.8964) (0.1491) (0.8584) (0.3419) (0.4432) (0.2457)
Slope 0.0176 0.0799** 0.0173 0.0374 0.0452 0.0472** 0.0456 0.0284*** (0.1628) (0.0351) (0.7116) (0.8044) (0.9615) (0.0293) (0.1081) (0.0034)
Leverage ‒0.1118*** ‒0.0594** ‒0.0487** ‒0.0646*** ‒0.1691** ‒0.1571* ‒0.0428*** ‒0.0137*** (0.0000) (0.0257) (0.0412) (0.0000) (0.0125) (0.0805) (0.0000) (0.0043)
Tier1 0.3663* 1.8253*** 0.9485 0.9711*** 1.3707*** 0.7319*** 0.9947** 0.9965 (0.0660) (0.0005) (0.1322) (0.0099) (0.0054) (0.0067) (0.0264) (0.1076)
Liquidity 0.0531 0.3287** 0.2055 0.2252 0.4243* 0.2597* 0.2296 0.2451* (0.6498) (0.0453) (0.6313) (0.6195) (0.0538) (0.0562) (0.1928) (0.0530) Cluster at bank‒level Yes Yes Yes Yes Yes Yes Yes Yes Time dummies No No No No Yes Yes Yes Yes No. of obs. 241 218 459 459 129 330 454 452No. of groups 63 63 63 63 18 45 63 63Adj. R² 0.28 0.31 0.28 0.32 0.13 0.21 0.37 0.32
The empirical model and estimation parameters are defined in Table 4. Regression (1a) refers to the pre-crisis period (2000-2006) whereas regression (1b) is based on the crisis period (2007-2010). In
specification (2a) z-score values from 2007 to 2010 are panel-regressed on excess variable compensation values from 2000 to 2006. Similarly, z-score values from 2007 to 2010 are pooled- regressed on
excess variable compensation values from 2006 in specification (2b). Regression (3a) includes banks which retrieved governmental capital aid and guarantees during the crisis whereas regression (3b)
comprises of banks which were not supported during the crisis period. The effect of the deposit insurance system is analyzed in regression (4) while the impact of supervisory power is investigated in
regression (5).

54
Table 9a Correlation matrix: Baseline regression and robustness checks
z-sc
ore
Exc
ess
vari
able
co
mpe
nsat
ion
Exc
ess
vari
able
cas
h-ba
sed
com
pens
atio
n
Exc
ess
vari
able
eq
uity
-bas
ed
com
pens
atio
n
Exe
cuti
ve’s
qua
lity
Exc
ess
aver
age
vari
able
com
pens
atio
n
Exc
ess
vari
able
to
fixe
d co
mpe
nsat
ion
GD
P
Slo
pe
Lev
erag
e
Tie
r1
Liq
uidi
ty
z-score 1.00
Excess variable compensation ‒0.05* 1.00
Excess variable cash-based compensation ‒0.14* 0.88*** 1.00
Excess variable equity-based compensation ‒0.07* 0.94*** 0.72*** 1.00
Executive’s quality ‒0.06 0.57*** 0.61*** 0.58*** 1.00
Excess average variable compensation ‒0.04* 0.86*** 0.82*** 0.82*** 0.84*** 1.00
Excess variable to fixed compensation ‒0.04* 0.74*** 0.76*** 0.88*** 0.70*** 0.90*** 1.00
GDP 0.22*** 0.19*** 0.18** 0.17** 0.02* 0.11* 0.09* 1.00
Slope 0.02 0.01 0.02 0.04 0.01** 0.05 0.03 0.09** 1.00
Leverage ‒0.11*** 0.01* ‒0.03 ‒0.01 ‒0.01 ‒0.04* ‒0.03* 0.07 0.05 1.00
Tier1 0.10* 0.19*** 0.23*** 0.26*** 0.08** 0.14** 0.18*** 0.06* 0.07 ‒0.04** 1.00
Liquidity 0.13** 0.13** 0.23*** 0.11* 0.14* 0.08* 0.10* 0.28*** 0.02** ‒0.03 0.10* 1.00
*, **, and *** indicate statistical significance at the 10%, 5%, and 1% level, respectively
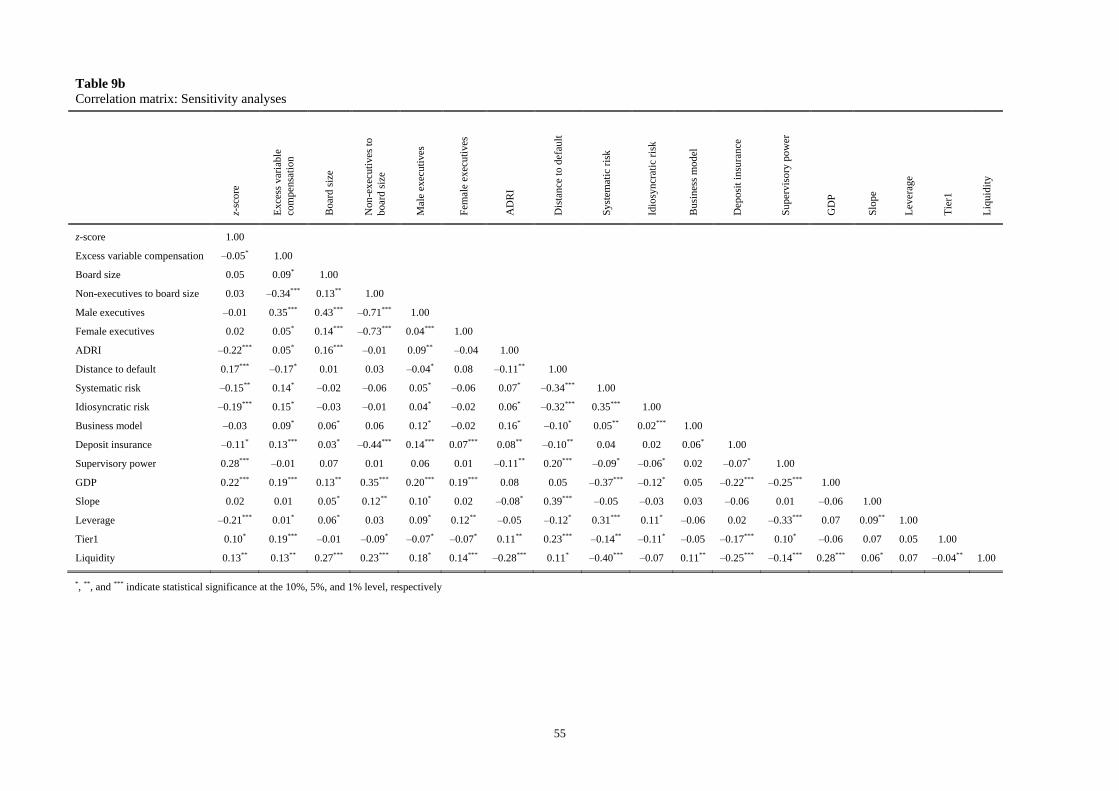
55
Table 9b Correlation matrix: Sensitivity analyses
z-sc
ore
Exc
ess
vari
able
co
mpe
nsat
ion
Boa
rd s
ize
Non
-exe
cuti
ves
to
boar
d si
ze
Mal
e ex
ecut
ives
Fem
ale
exec
utiv
es
AD
RI
Dis
tanc
e to
def
ault
Sys
tem
atic
ris
k
Idio
sync
rati
c ri
sk
Bus
ines
s m
odel
Dep
osit
insu
ranc
e
Sup
ervi
sory
pow
er
GD
P
Slo
pe
Lev
erag
e
Tie
r1
Liq
uidi
ty
z-score 1.00
Excess variable compensation ‒0.05* 1.00
Board size 0.05 0.09* 1.00
Non-executives to board size 0.03 ‒0.34*** 0.13** 1.00
Male executives ‒0.01 0.35*** 0.43*** ‒0.71*** 1.00
Female executives 0.02 0.05* 0.14*** ‒0.73*** 0.04*** 1.00
ADRI ‒0.22*** 0.05* 0.16*** ‒0.01 0.09** ‒0.04 1.00
Distance to default 0.17*** ‒0.17* 0.01 0.03 ‒0.04* 0.08 ‒0.11** 1.00
Systematic risk ‒0.15** 0.14* ‒0.02 ‒0.06 0.05* ‒0.06 0.07* ‒0.34*** 1.00
Idiosyncratic risk ‒0.19*** 0.15* ‒0.03 ‒0.01 0.04* ‒0.02 0.06* ‒0.32*** 0.35*** 1.00
Business model ‒0.03 0.09* 0.06* 0.06 0.12* ‒0.02 0.16* ‒0.10* 0.05** 0.02*** 1.00
Deposit insurance ‒0.11* 0.13*** 0.03* ‒0.44*** 0.14*** 0.07*** 0.08** ‒0.10** 0.04 0.02 0.06* 1.00
Supervisory power 0.28*** ‒0.01 0.07 0.01 0.06 0.01 ‒0.11** 0.20*** ‒0.09* ‒0.06* 0.02 ‒0.07* 1.00
GDP 0.22*** 0.19*** 0.13** 0.35*** 0.20*** 0.19*** 0.08 0.05 ‒0.37*** ‒0.12* 0.05 ‒0.22*** ‒0.25*** 1.00
Slope 0.02 0.01 0.05* 0.12** 0.10* 0.02 ‒0.08* 0.39*** ‒0.05 ‒0.03 0.03 ‒0.06 0.01 ‒0.06 1.00
Leverage ‒0.21*** 0.01* 0.06* 0.03 0.09* 0.12** ‒0.05 ‒0.12* 0.31*** 0.11* ‒0.06 0.02 ‒0.33*** 0.07 0.09** 1.00
Tier1 0.10* 0.19*** ‒0.01 ‒0.09* ‒0.07* ‒0.07* 0.11** 0.23*** ‒0.14** ‒0.11* ‒0.05 ‒0.17*** 0.10* ‒0.06 0.07 0.05 1.00
Liquidity 0.13** 0.13** 0.27*** 0.23*** 0.18* 0.14*** ‒0.28*** 0.11* ‒0.40*** ‒0.07 0.11** ‒0.25*** ‒0.14*** 0.28*** 0.06* 0.07 ‒0.04** 1.00
*, **, and *** indicate statistical significance at the 10%, 5%, and 1% level, respectively

56
Technical Appendix
1. Calculation of the distance-to-default
According to the Merton framework (1973, 1974) and standard option-pricing models provided
by Black and Scholes (1973) the bank’s distance-to-default (DtD) is calculated as
212
AA
A
Vln T
DBDtD ,
T
where AV denotes the bank’s asset value (share price), μ is the drift rate of assets, A is the standard
deviation of assets, DB represents the distress barrier defined as the face value of short term
liabilities (maturity ≤ 1 year) plus half of the amount of long term liabilities (maturity > 1 year) and
T is the maturity of bank debt. Designed in this way, the DtD is associated with the probability that
the market value of a bank’s assets falls below the value of its debt within a given time horizon (one
year). Accordingly, a higher (lower) DtD implies lower (higher) bank risk. Data to calculate the
DtD for each stock-listed bank are retrieved from Thomson Reuter’s Datastream database. We
include the change in the DtD per bank and year.
2. Calculation of systematic and idiosyncratic risk
As regards the bank’s systematic risk, beta coefficients are estimated from the standard CAPM
(market model) as follows:
, , , i t i i m t itR R
(1)
(2)

57
where ,i tR is the stock return on bank i in year t, ,m tR is the market return (national blue chip
indices) in year t, i is the intercept, i is the beta factor for bank i and , i t is the error term.
Following Altunbas et. al. (2014) the idiosyncratic component is then simply given by the
unexplained regression for bank i over each year t. We calculate the systematic and idiosyncratic
risk for each stock-listed bank in our sample and for each specific year, using daily data on bank
stock returns and national index returns retrieved from Thomson Reuter’s Datastream database.