ubp emerging markets fixed income - private … bancaire privée, ubp sa | bahnhofstrasse 1| 8022...
TRANSCRIPT
Union Bancaire Privée, UBP SA | Bahnhofstrasse 1| 8022 Zurich, Switzerland
COMMITTED TO YOU
UBP Emerging Markets Fixed IncomeEmerging vs. Developed Markets Corporate Bonds
Denis Girault, Head of UBP EM Fixed Income
For Qualified Investors only
Hamburg, 20. SEPTEMBER 2013
UBP INVESTMENT MANAGEMENT 1EMERGING MARKETS FIXED INCOME
Executive summary
Fundamental investment case for EM fixed income:
– Emerging Markets already account for 50% of World GDP and continue to grow significantly faster than developed markets
– Diversified asset class across countries & currencies, sectors, issuers and credit quality
Emerging corporate bonds offer exposure to EM growth story:
– Market volume in excess of USD 1000bn, already bigger than EM sovereign bond market
– More than 70% of tradable universe rated investment grade
– Dynamic new issues market enabling broad diversification across countries & sectors
– Exposure to EM corporate growth story with much less volatility than EM equity
Higher return with same risk as developed corporates:
– Low default rates and stable ratings
– Higher long-term return potential than developed market bonds
– Higher yield: 70-350bp for emerging over developed market corporate bonds.
UBP INVESTMENT MANAGEMENT 2EMERGING MARKETS FIXED INCOME
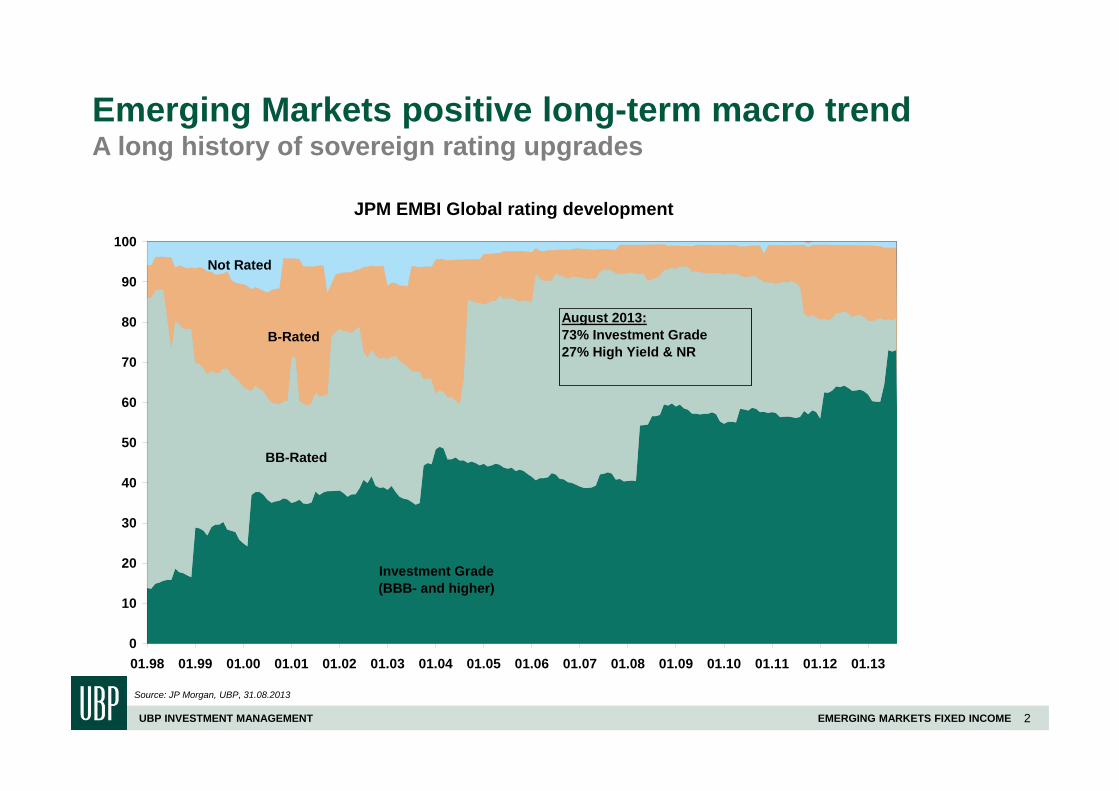
Emerging Markets positive long-term macro trendA long history of sovereign rating upgrades
Source: JP Morgan, UBP, 31.08.2013
JPM EMBI Global rating development
0
10
20
30
40
50
60
70
80
90
100
01.98 01.99 01.00 01.01 01.02 01.03 01.04 01.05 01.06 01.07 01.08 01.09 01.10 01.11 01.12 01.13
Investment Grade(BBB- and higher)
BB-Rated
B-Rated
Not Rated
August 2013:73% Investment Grade27% High Yield & NR
UBP INVESTMENT MANAGEMENT 3EMERGING MARKETS FIXED INCOME
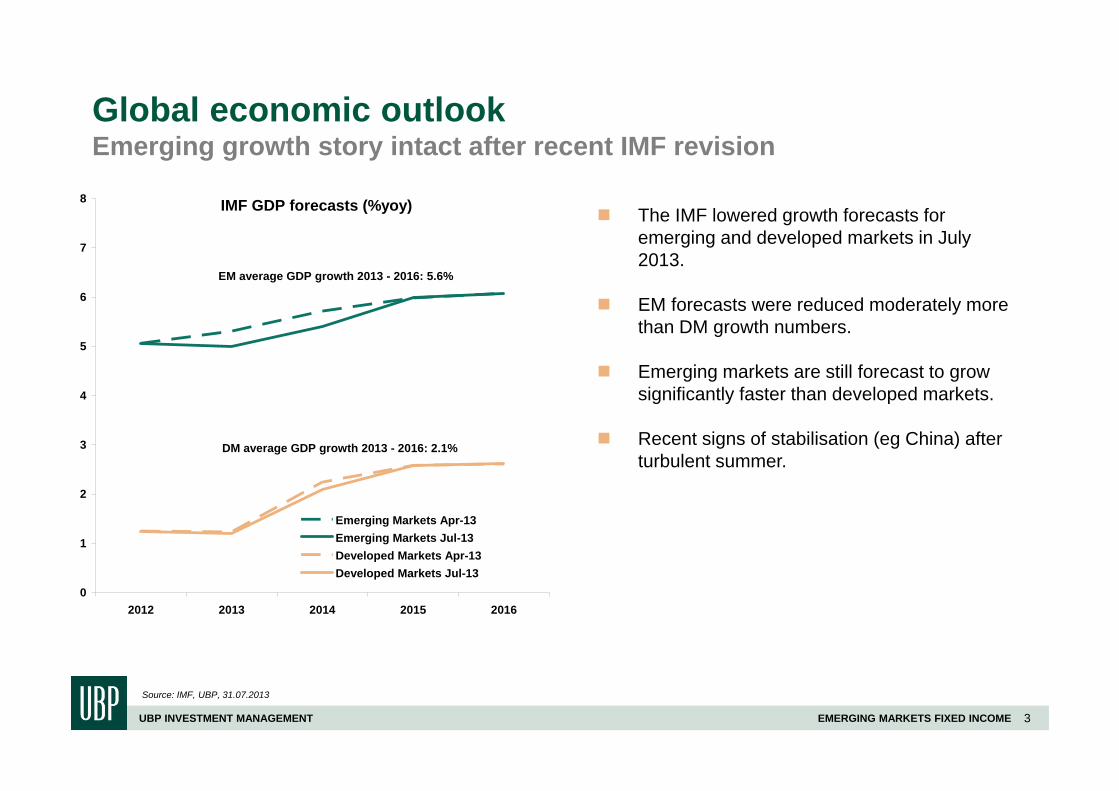
Global economic outlookEmerging growth story intact after recent IMF revision
Source: IMF, UBP, 31.07.2013
The IMF lowered growth forecasts for emerging and developed markets in July 2013.
EM forecasts were reduced moderately more than DM growth numbers.
Emerging markets are still forecast to grow significantly faster than developed markets.
Recent signs of stabilisation (eg China) after turbulent summer.
IMF GDP forecasts (%yoy)
0
1
2
3
4
5
6
7
8
2012 2013 2014 2015 2016
Emerging Markets Apr-13Emerging Markets Jul-13Developed Markets Apr-13Developed Markets Jul-13
EM average GDP growth 2013 - 2016: 5.6%
DM average GDP growth 2013 - 2016: 2.1%
UBP INVESTMENT MANAGEMENT 4EMERGING MARKETS FIXED INCOME
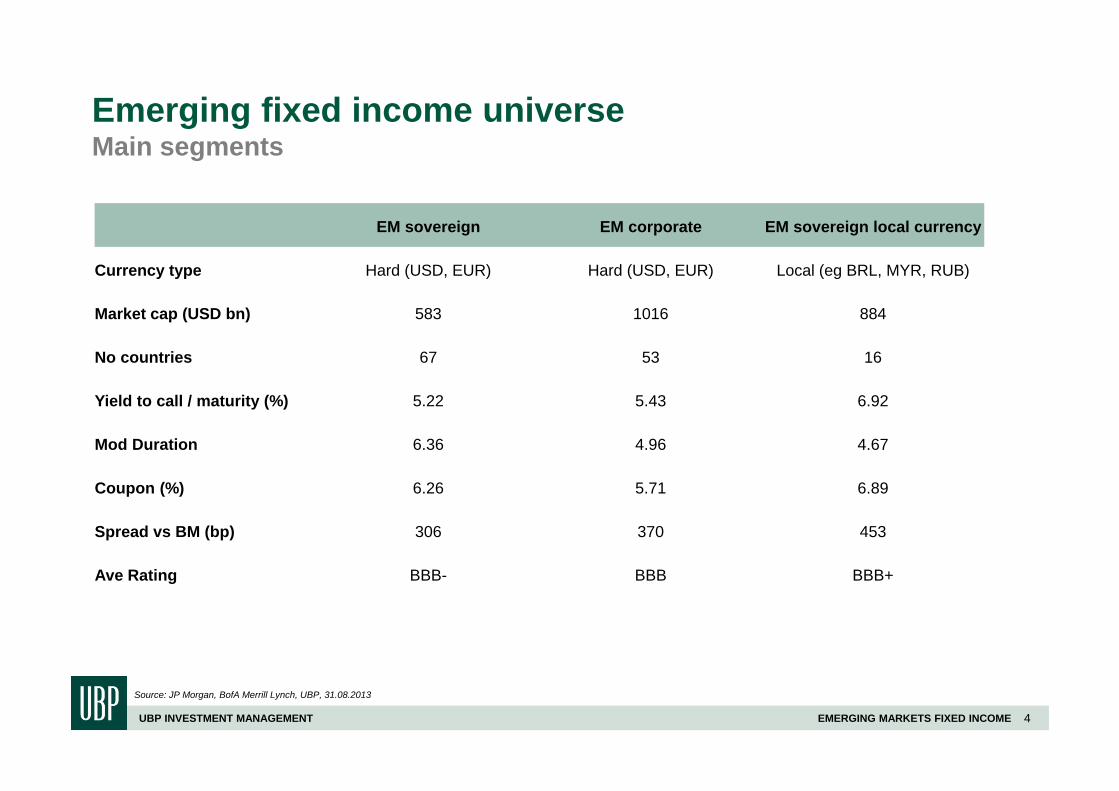
Emerging fixed income universeMain segments
EM sovereign EM corporate EM sovereign local currency
Currency type Hard (USD, EUR) Hard (USD, EUR) Local (eg BRL, MYR, RUB)
Market cap (USD bn) 583 1016 884
No countries 67 53 16
Yield to call / maturity (%) 5.22 5.43 6.92
Mod Duration 6.36 4.96 4.67
Coupon (%) 6.26 5.71 6.89
Spread vs BM (bp) 306 370 453
Ave Rating BBB- BBB BBB+
Source: JP Morgan, BofA Merrill Lynch, UBP, 31.08.2013
UBP INVESTMENT MANAGEMENT 5EMERGING MARKETS FIXED INCOME
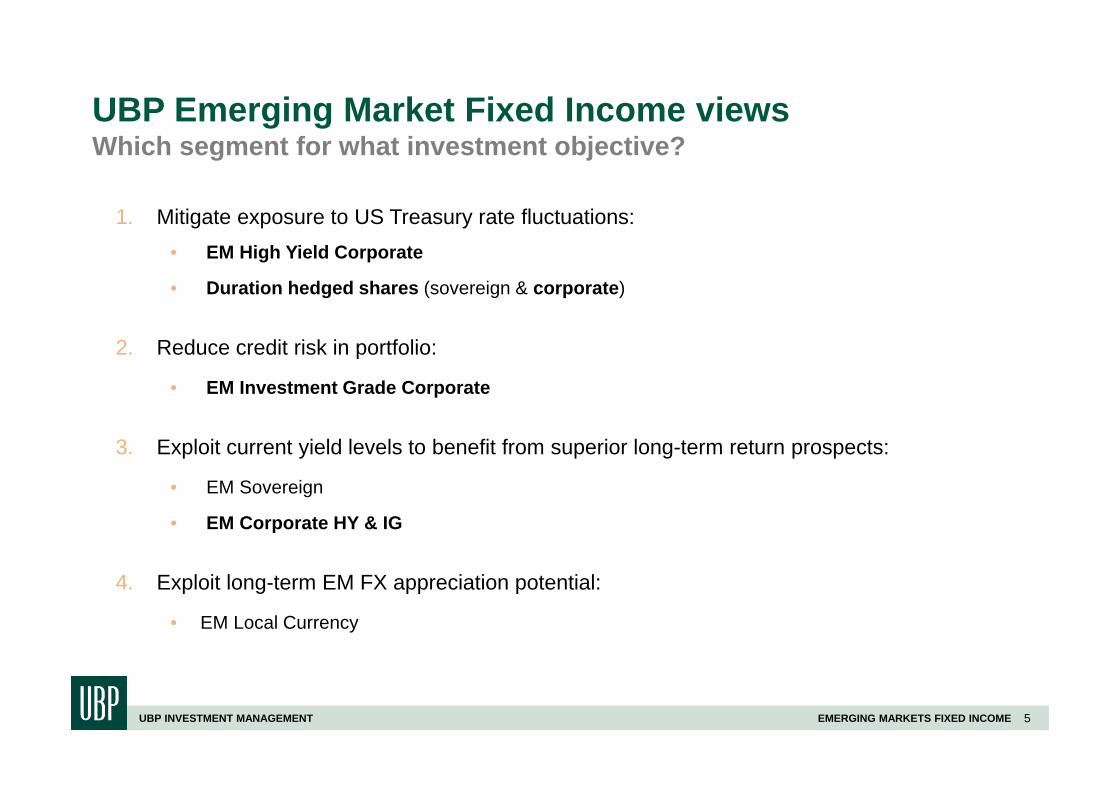
UBP Emerging Market Fixed Income viewsWhich segment for what investment objective?
1. Mitigate exposure to US Treasury rate fluctuations:• EM High Yield Corporate
• Duration hedged shares (sovereign & corporate)
2. Reduce credit risk in portfolio:
• EM Investment Grade Corporate
3. Exploit current yield levels to benefit from superior long-term return prospects:
• EM Sovereign
• EM Corporate HY & IG
4. Exploit long-term EM FX appreciation potential:
• EM Local Currency
UBP INVESTMENT MANAGEMENT 6EMERGING MARKETS FIXED INCOME
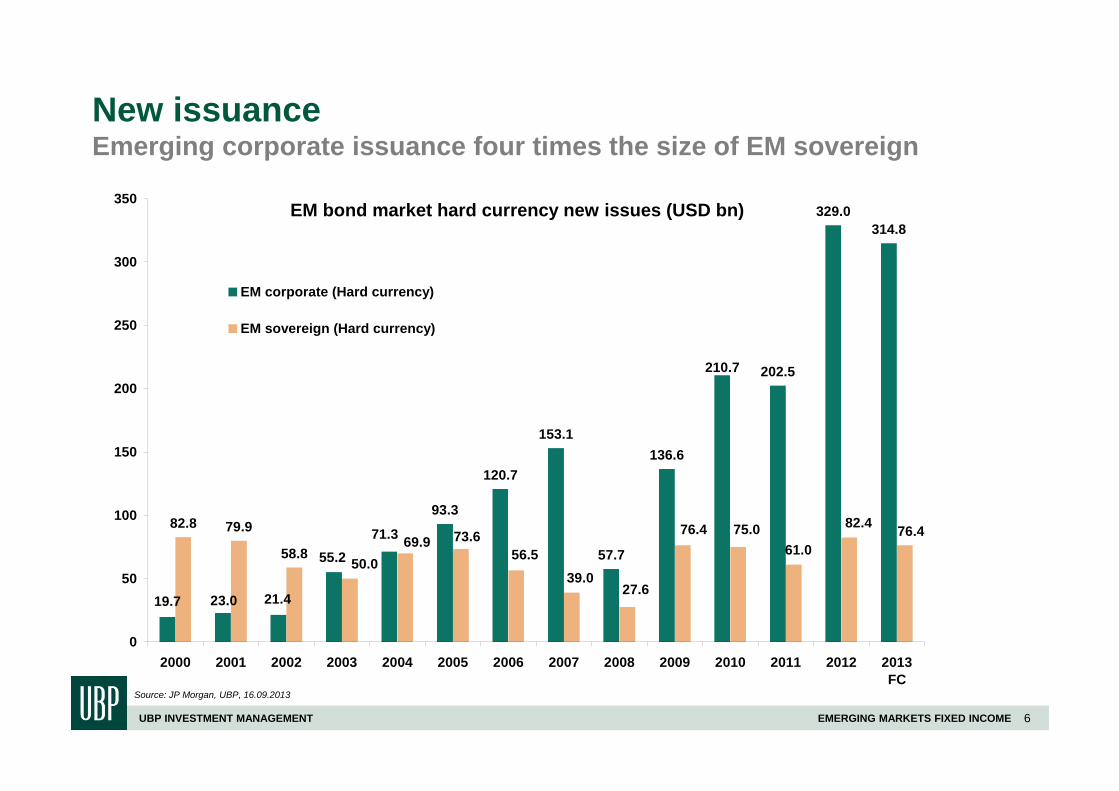
New issuanceEmerging corporate issuance four times the size of EM sovereign
Source: JP Morgan, UBP, 16.09.2013
EM bond market hard currency new issues (USD bn)
93.3
120.7
153.1
57.7
136.6
202.5
329.0314.8
82.8 79.9
58.8
19.7 23.0 21.4
55.2
210.7
71.3 76.469.9
82.4
61.076.4 75.0
27.639.0
56.573.6
50.0
0
50
100
150
200
250
300
350
2000 2001 2002 2003 2004 2005 2006 2007 2008 2009 2010 2011 2012 2013FC
EM corporate (Hard currency)
EM sovereign (Hard currency)
UBP INVESTMENT MANAGEMENT 7EMERGING MARKETS FIXED INCOME
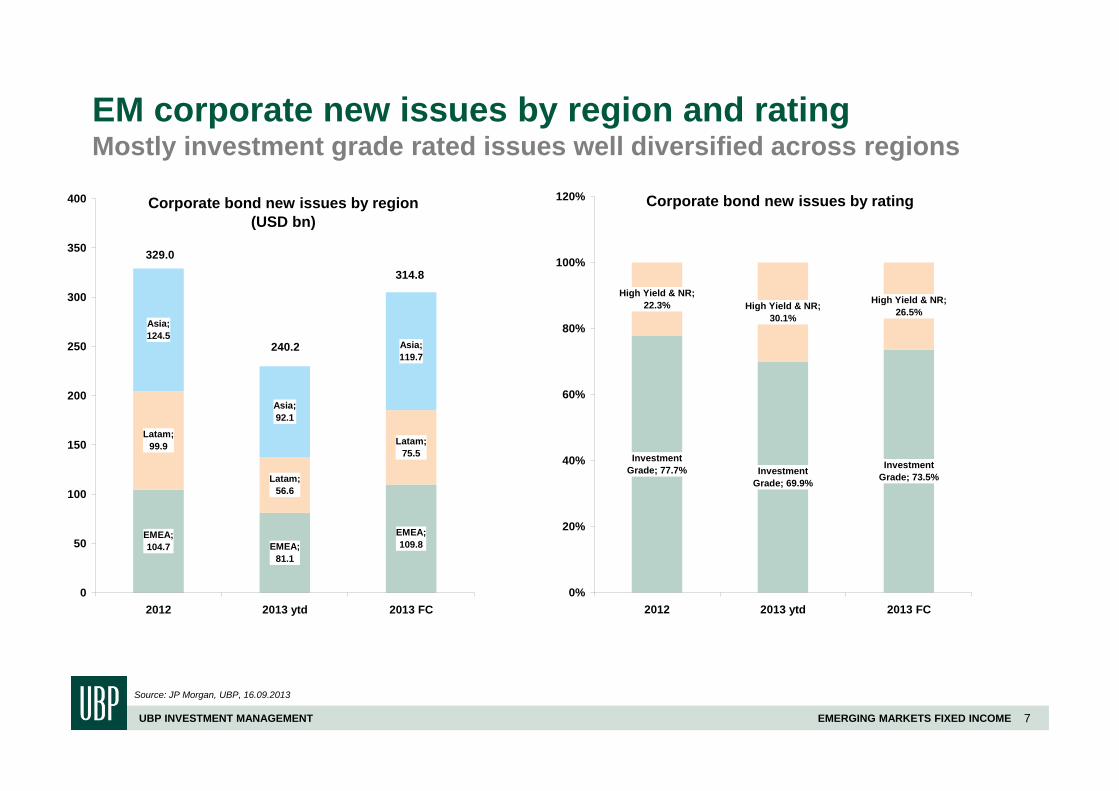
EM corporate new issues by region and ratingMostly investment grade rated issues well diversified across regions
Source: JP Morgan, UBP, 16.09.2013
Corporate bond new issues by rating
Investment Grade; 77.7% Investment
Grade; 69.9%
Investment Grade; 73.5%
High Yield & NR; 22.3% High Yield & NR;
30.1%
High Yield & NR; 26.5%
0%
20%
40%
60%
80%
100%
120%
2012 2013 ytd 2013 FC
Corporate bond new issues by region (USD bn)
EMEA; 109.8
EMEA; 104.7 EMEA;
81.1
Latam; 75.5
Latam; 99.9
Latam; 56.6
Asia; 119.7
Asia; 124.5
Asia; 92.1
0
50
100
150
200
250
300
350
400
2012 2013 ytd 2013 FC
329.0
240.2
314.8
UBP INVESTMENT MANAGEMENT 8EMERGING MARKETS FIXED INCOME
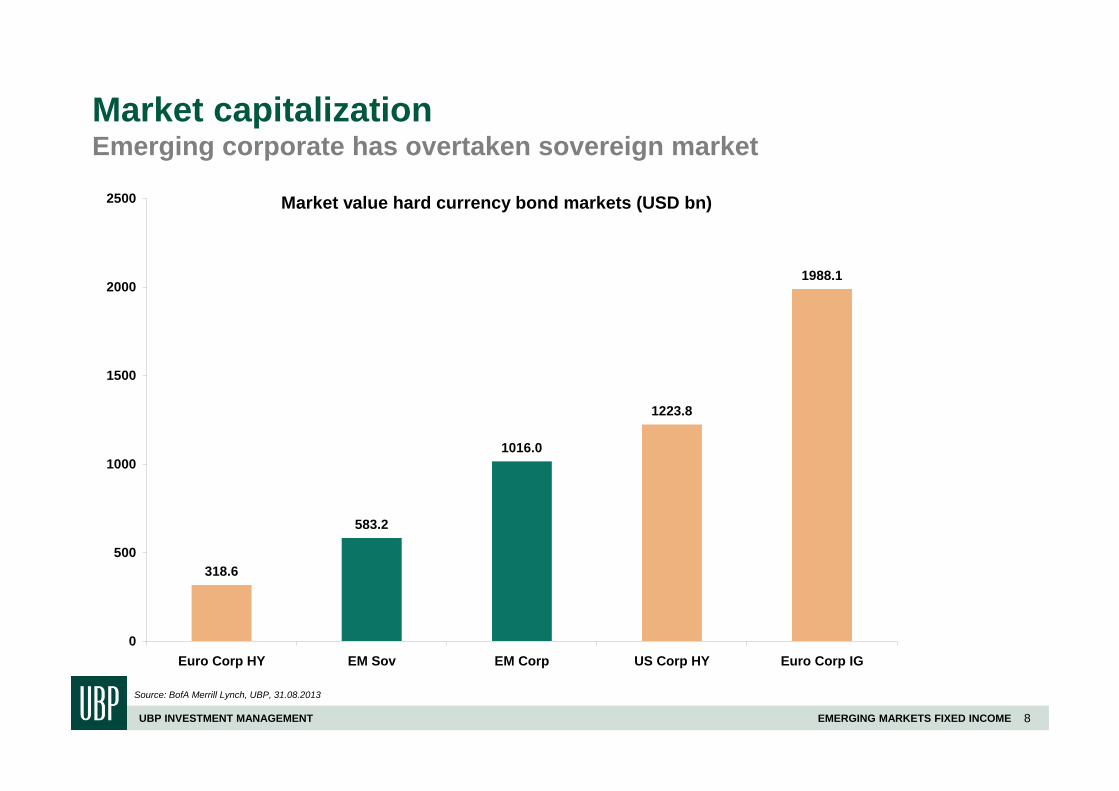
Market capitalizationEmerging corporate has overtaken sovereign market
Source: BofA Merrill Lynch, UBP, 31.08.2013
Market value hard currency bond markets (USD bn)
318.6
583.2
1016.0
1223.8
1988.1
0
500
1000
1500
2000
2500
Euro Corp HY EM Sov EM Corp US Corp HY Euro Corp IG
UBP INVESTMENT MANAGEMENT 9EMERGING MARKETS FIXED INCOME
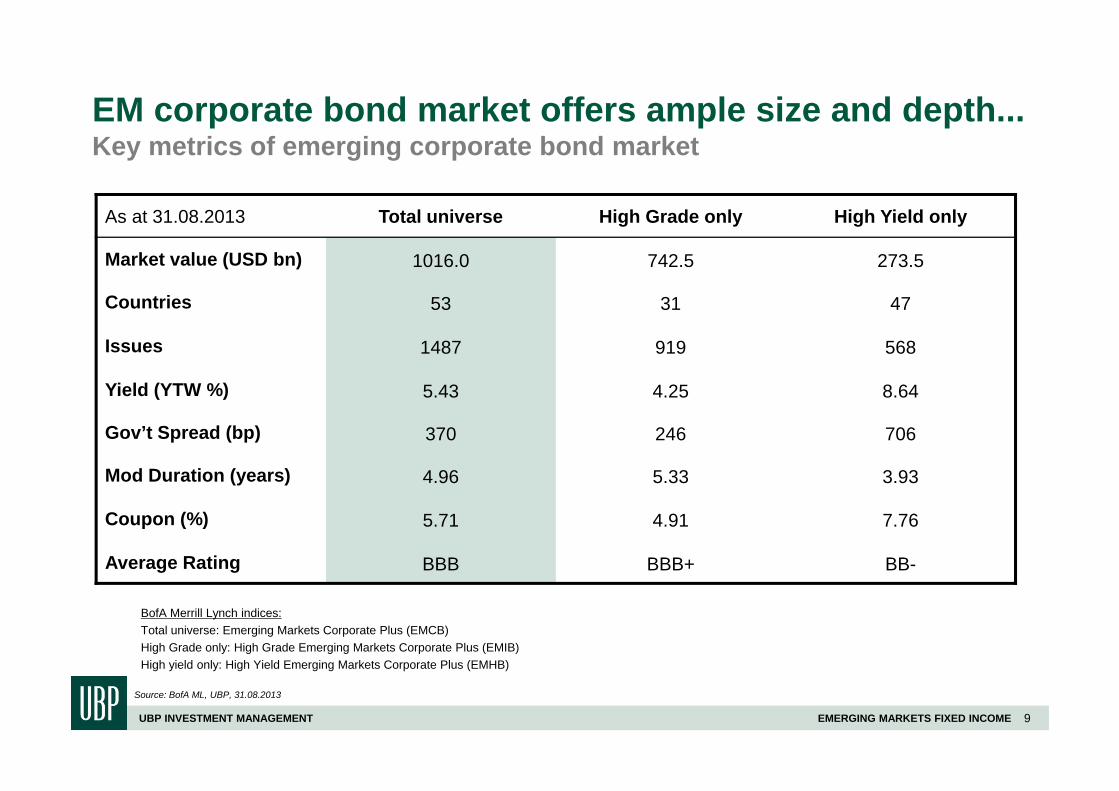
As at 31.08.2013 Total universe High Grade only High Yield only
Market value (USD bn) 1016.0 742.5 273.5
Countries 53 31 47
Issues 1487 919 568
Yield (YTW %) 5.43 4.25 8.64
Gov’t Spread (bp) 370 246 706
Mod Duration (years) 4.96 5.33 3.93
Coupon (%) 5.71 4.91 7.76
Average Rating BBB BBB+ BB-
BofA Merrill Lynch indices:Total universe: Emerging Markets Corporate Plus (EMCB)High Grade only: High Grade Emerging Markets Corporate Plus (EMIB)High yield only: High Yield Emerging Markets Corporate Plus (EMHB)
EM corporate bond market offers ample size and depth... Key metrics of emerging corporate bond market
Source: BofA ML, UBP, 31.08.2013
UBP INVESTMENT MANAGEMENT 10EMERGING MARKETS FIXED INCOME
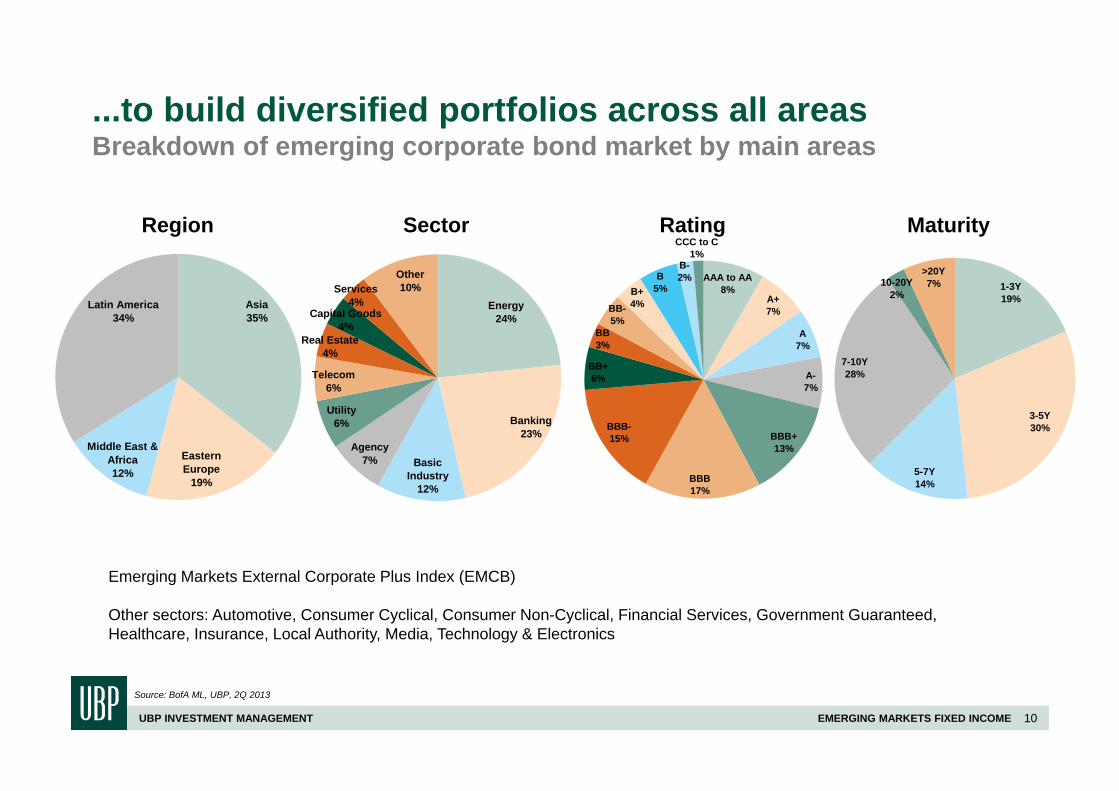
SectorRegion Rating Maturity
Emerging Markets External Corporate Plus Index (EMCB)
Other sectors: Automotive, Consumer Cyclical, Consumer Non-Cyclical, Financial Services, Government Guaranteed, Healthcare, Insurance, Local Authority, Media, Technology & Electronics
...to build diversified portfolios across all areasBreakdown of emerging corporate bond market by main areas
Source: BofA ML, UBP, 2Q 2013
Eastern Europe
19%
Middle East & Africa12%
Latin America34%
Asia35%
Other10%Services
4%Capital Goods
4%Real Estate
4%
Telecom6%
Utility6%
Agency7% Basic
Industry12%
Banking23%
Energy24%
B-2%
CCC to C1%
B5%B+
4%BB-5%
BB3%
BB+6%
BBB-15%
BBB17%
BBB+13%
A-7%
A7%
A+7%
AAA to AA8%
3-5Y30%
5-7Y14%
7-10Y28%
10-20Y2%
>20Y7% 1-3Y
19%
UBP INVESTMENT MANAGEMENT 11EMERGING MARKETS FIXED INCOME
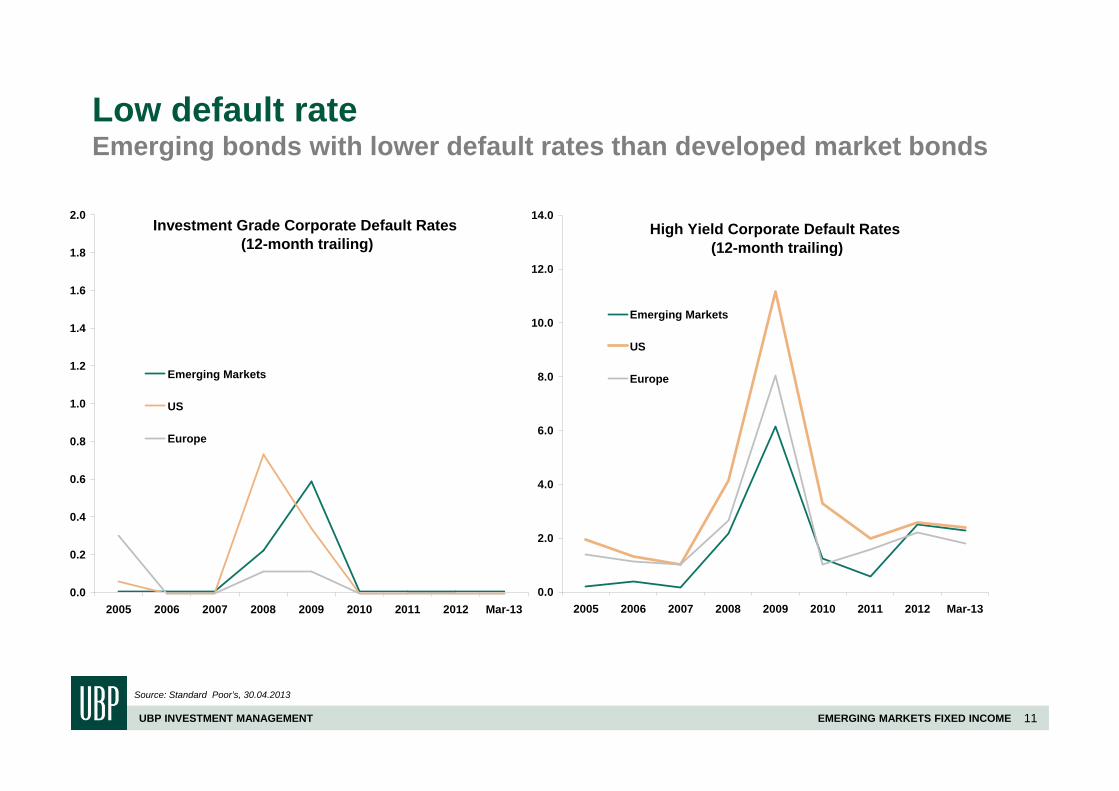
Low default rateEmerging bonds with lower default rates than developed market bonds
Source: Standard Poor’s, 30.04.2013
High Yield Corporate Default Rates (12-month trailing)
0.0
2.0
4.0
6.0
8.0
10.0
12.0
14.0
2005 2006 2007 2008 2009 2010 2011 2012 Mar-13
Emerging Markets
US
Europe
Investment Grade Corporate Default Rates (12-month trailing)
0.0
0.2
0.4
0.6
0.8
1.0
1.2
1.4
1.6
1.8
2.0
2005 2006 2007 2008 2009 2010 2011 2012 Mar-13
Emerging Markets
US
Europe
UBP INVESTMENT MANAGEMENT 12EMERGING MARKETS FIXED INCOME
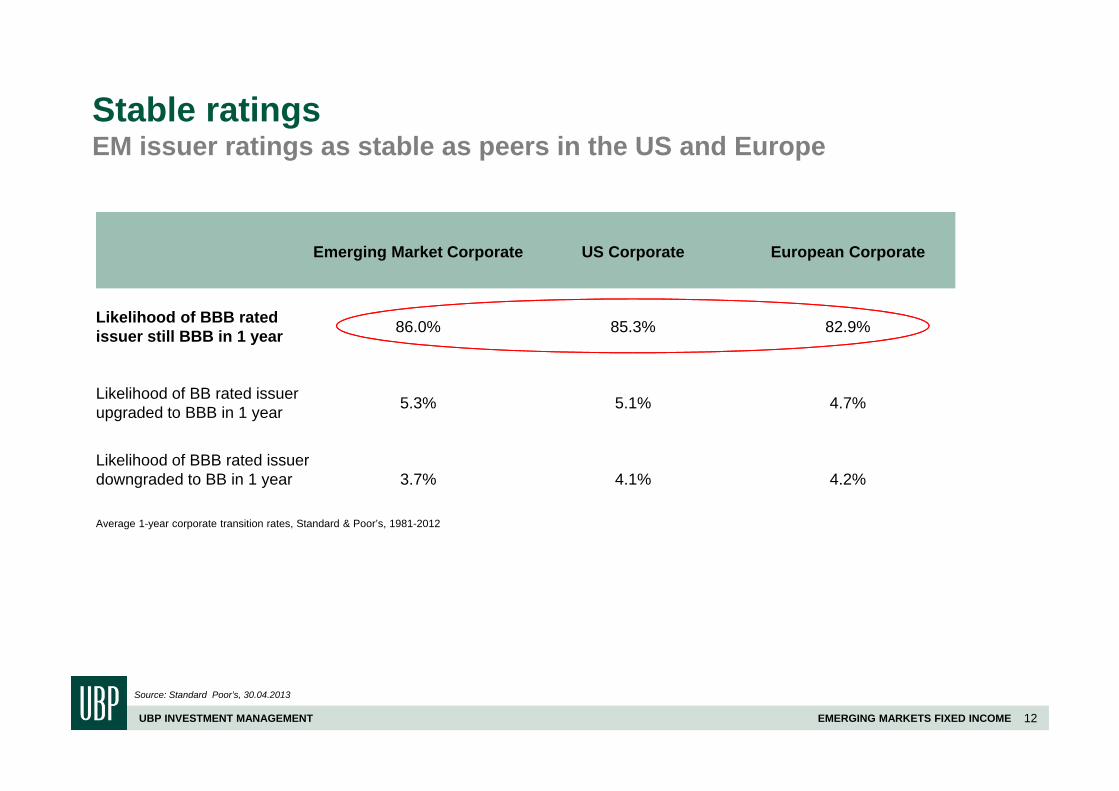
Stable ratingsEM issuer ratings as stable as peers in the US and Europe
Source: Standard Poor’s, 30.04.2013
Emerging Market Corporate US Corporate European Corporate
Likelihood of BBB rated issuer still BBB in 1 year 86.0% 85.3% 82.9%
Likelihood of BB rated issuer upgraded to BBB in 1 year 5.3% 5.1% 4.7%
Likelihood of BBB rated issuer downgraded to BB in 1 year 3.7% 4.1% 4.2%
Average 1-year corporate transition rates, Standard & Poor’s, 1981-2012
UBP INVESTMENT MANAGEMENT 13EMERGING MARKETS FIXED INCOME
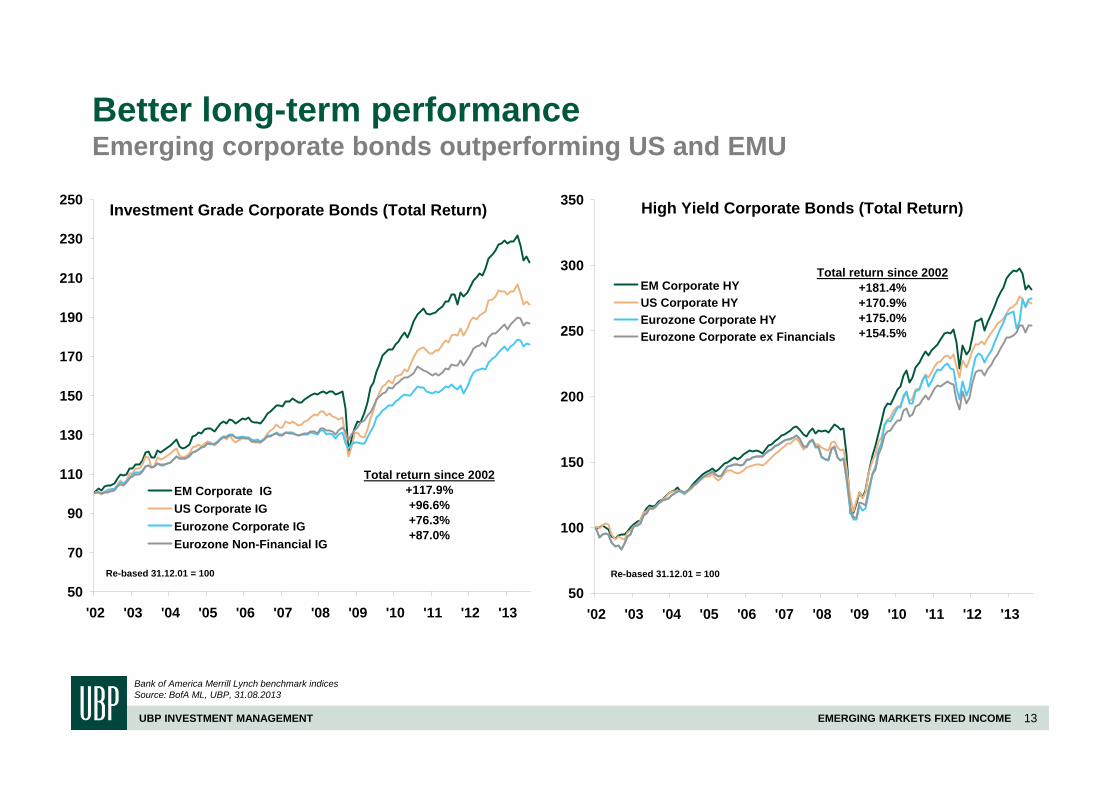
Better long-term performance Emerging corporate bonds outperforming US and EMU
Bank of America Merrill Lynch benchmark indicesSource: BofA ML, UBP, 31.08.2013
Investment Grade Corporate Bonds (Total Return)
50
70
90
110
130
150
170
190
210
230
250
'02 '03 '04 '05 '06 '07 '08 '09 '10 '11 '12 '13
EM Corporate IGUS Corporate IGEurozone Corporate IGEurozone Non-Financial IG
Re-based 31.12.01 = 100
Total return since 2002+117.9%+96.6%+76.3%+87.0%
High Yield Corporate Bonds (Total Return)
50
100
150
200
250
300
350
'02 '03 '04 '05 '06 '07 '08 '09 '10 '11 '12 '13
EM Corporate HYUS Corporate HYEurozone Corporate HYEurozone Corporate ex Financials
Re-based 31.12.01 = 100
Total return since 2002+181.4%+170.9%+175.0%+154.5%
UBP INVESTMENT MANAGEMENT 14EMERGING MARKETS FIXED INCOME
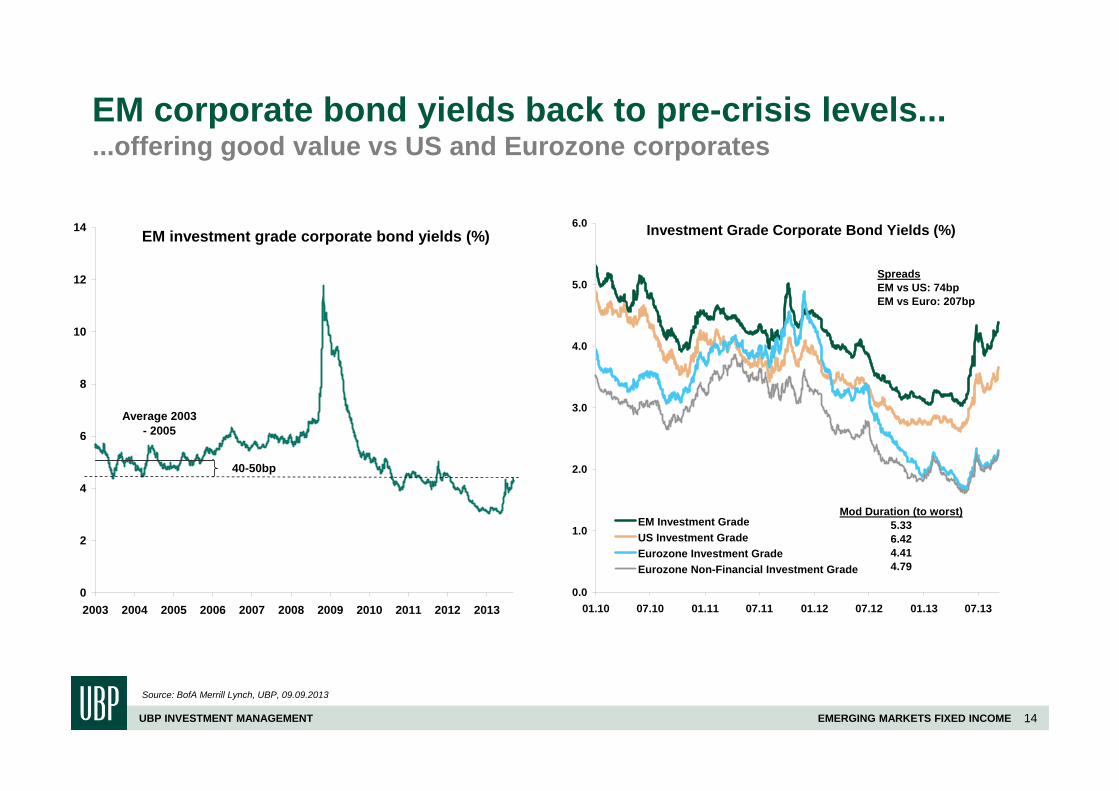
EM corporate bond yields back to pre-crisis levels......offering good value vs US and Eurozone corporates
Source: BofA Merrill Lynch, UBP, 09.09.2013
EM investment grade corporate bond yields (%)
0
2
4
6
8
10
12
14
2003 2004 2005 2006 2007 2008 2009 2010 2011 2012 2013
Average 2003 - 2005
40-50bp
Investment Grade Corporate Bond Yields (%)
0.0
1.0
2.0
3.0
4.0
5.0
6.0
01.10 07.10 01.11 07.11 01.12 07.12 01.13 07.13
EM Investment GradeUS Investment GradeEurozone Investment GradeEurozone Non-Financial Investment Grade
SpreadsEM vs US: 74bpEM vs Euro: 207bp
Mod Duration (to worst)5.336.424.414.79
UBP INVESTMENT MANAGEMENT 15EMERGING MARKETS FIXED INCOME
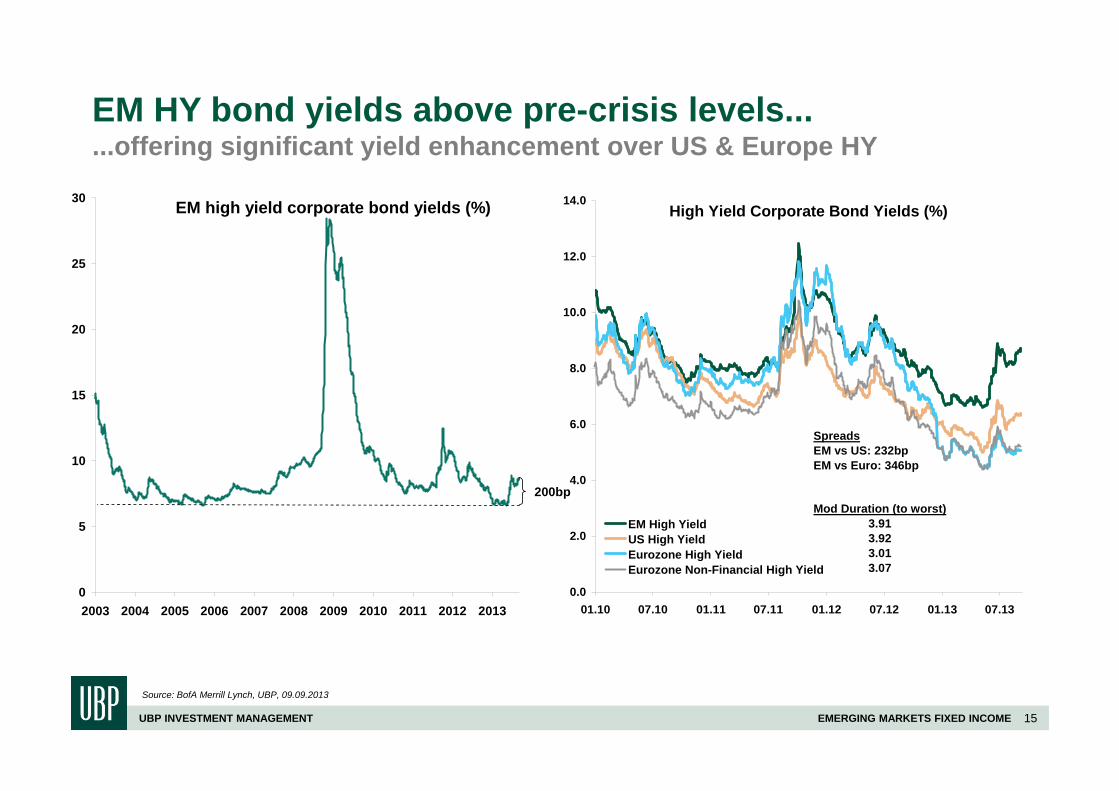
EM HY bond yields above pre-crisis levels......offering significant yield enhancement over US & Europe HY
Source: BofA Merrill Lynch, UBP, 09.09.2013
EM high yield corporate bond yields (%)
0
5
10
15
20
25
30
2003 2004 2005 2006 2007 2008 2009 2010 2011 2012 2013
200bp
High Yield Corporate Bond Yields (%)
0.0
2.0
4.0
6.0
8.0
10.0
12.0
14.0
01.10 07.10 01.11 07.11 01.12 07.12 01.13 07.13
EM High YieldUS High YieldEurozone High YieldEurozone Non-Financial High Yield
SpreadsEM vs US: 232bpEM vs Euro: 346bp
Mod Duration (to worst)3.913.923.013.07
UBP INVESTMENT MANAGEMENT 16EMERGING MARKETS FIXED INCOME
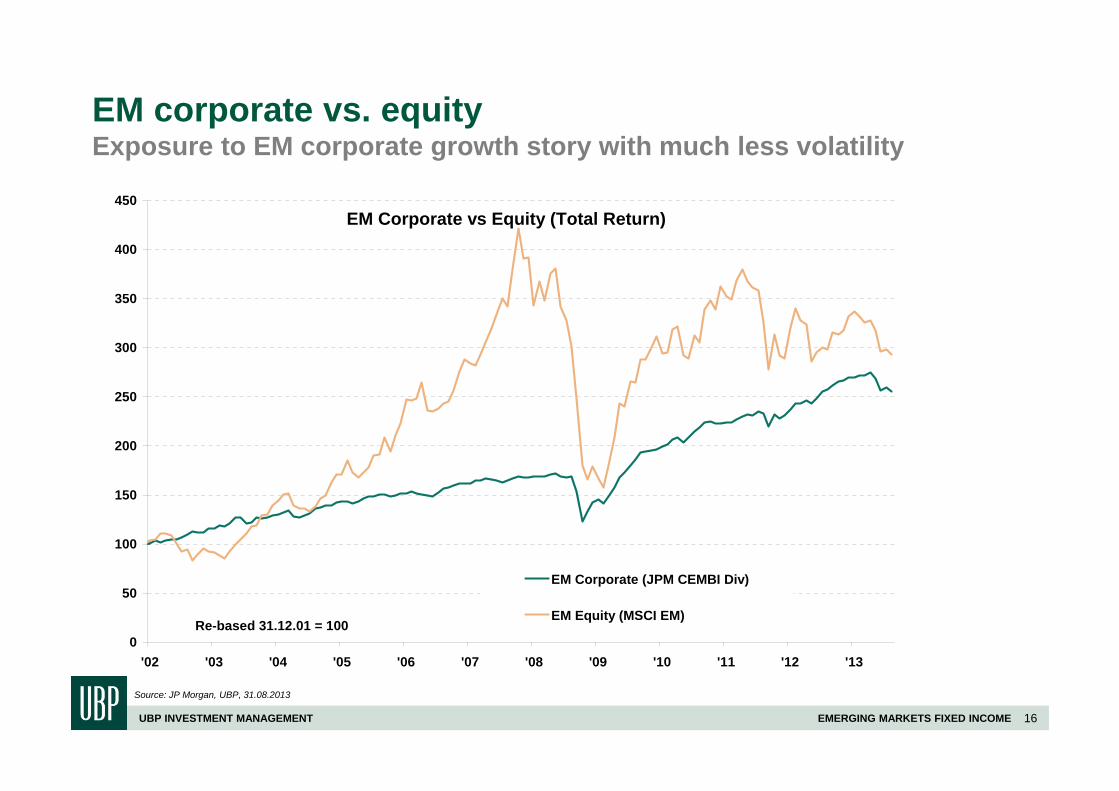
EM corporate vs. equityExposure to EM corporate growth story with much less volatility
Source: JP Morgan, UBP, 31.08.2013
EM Corporate vs Equity (Total Return)
0
50
100
150
200
250
300
350
400
450
'02 '03 '04 '05 '06 '07 '08 '09 '10 '11 '12 '13
EM Corporate (JPM CEMBI Div)
EM Equity (MSCI EM)Re-based 31.12.01 = 100
UBP INVESTMENT MANAGEMENT 17EMERGING MARKETS FIXED INCOME
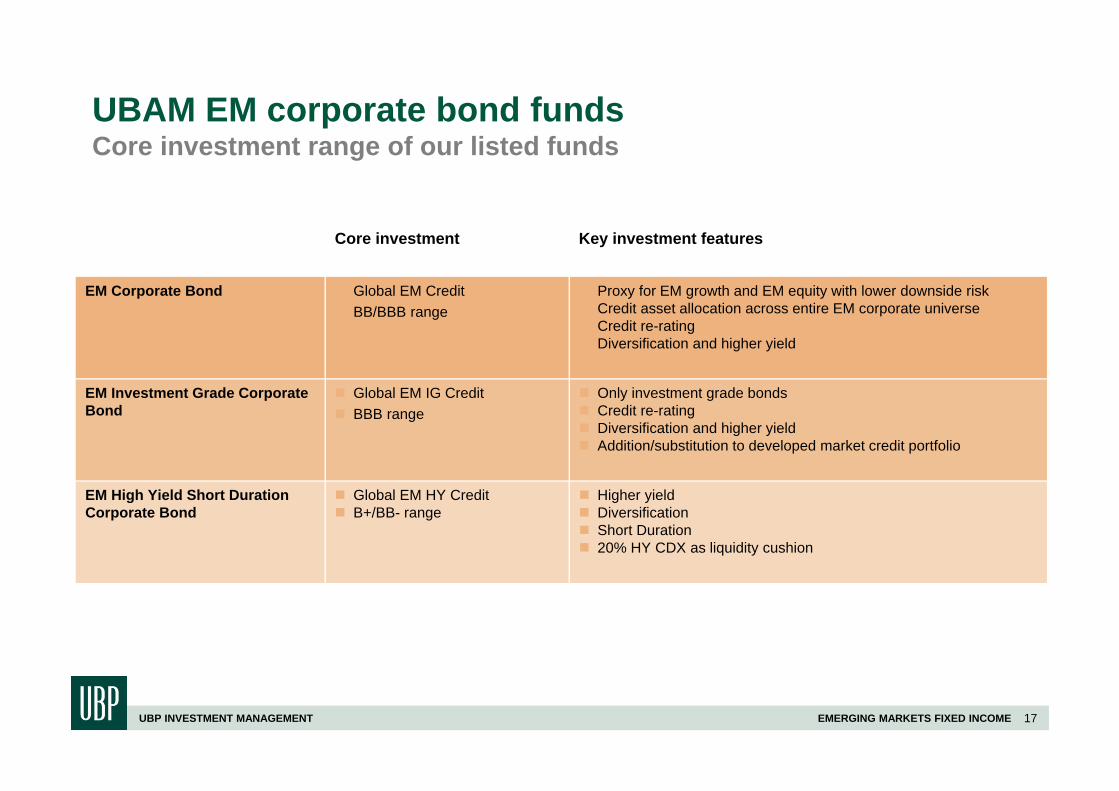
UBAM EM corporate bond fundsCore investment range of our listed funds
Core investment Key investment features
EM Corporate Bond Global EM Credit BB/BBB range
Proxy for EM growth and EM equity with lower downside risk Credit asset allocation across entire EM corporate universe Credit re-rating Diversification and higher yield
EM Investment Grade Corporate Bond
Global EM IG Credit BBB range
Only investment grade bonds Credit re-rating Diversification and higher yield Addition/substitution to developed market credit portfolio
EM High Yield Short Duration Corporate Bond
Global EM HY Credit B+/BB- range
Higher yield Diversification Short Duration 20% HY CDX as liquidity cushion
UBP INVESTMENT MANAGEMENT 18EMERGING MARKETS FIXED INCOME
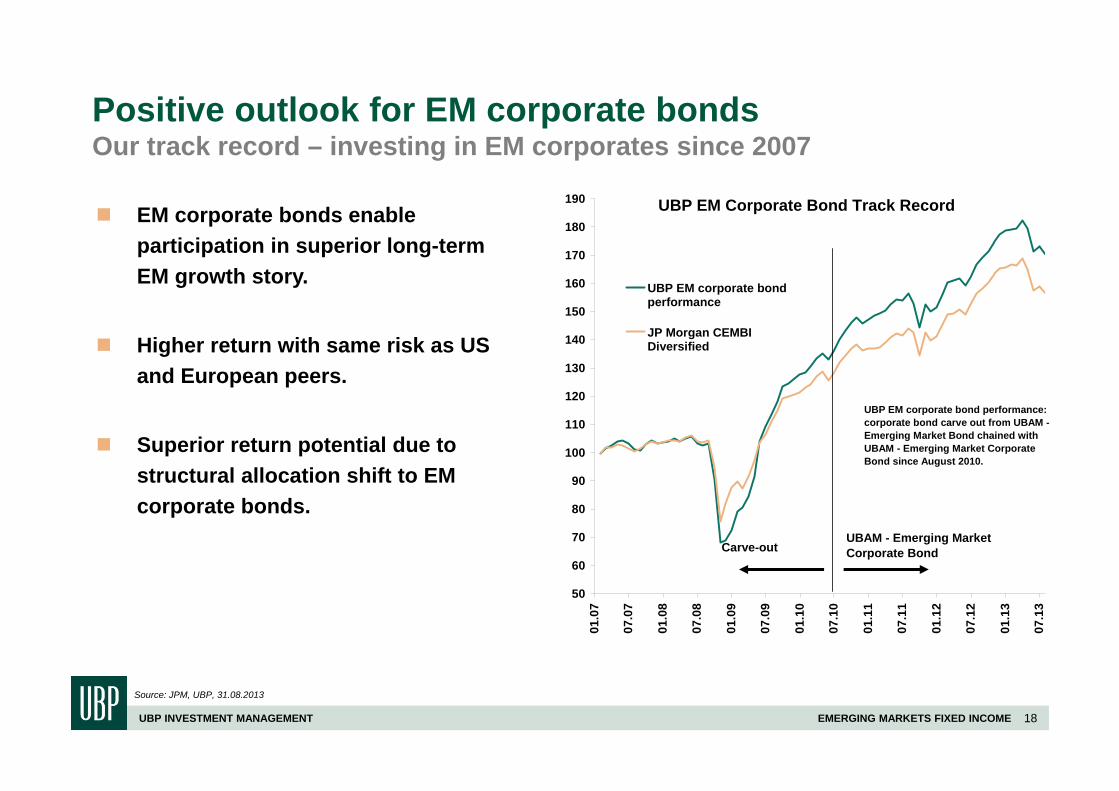
Positive outlook for EM corporate bondsOur track record – investing in EM corporates since 2007
Source: JPM, UBP, 31.08.2013
EM corporate bonds enable participation in superior long-term EM growth story.
Higher return with same risk as US and European peers.
Superior return potential due to structural allocation shift to EM corporate bonds.
UBP EM Corporate Bond Track Record
50
60
70
80
90
100
110
120
130
140
150
160
170
180
190
01.0
7
07.0
7
01.0
8
07.0
8
01.0
9
07.0
9
01.1
0
07.1
0
01.1
1
07.1
1
01.1
2
07.1
2
01.1
3
07.1
3
UBP EM corporate bondperformance
JP Morgan CEMBIDiversified
UBP EM corporate bond performance: corporate bond carve out from UBAM - Emerging Market Bond chained with UBAM - Emerging Market Corporate Bond since August 2010.
Carve-outUBAM - Emerging Market Corporate Bond
UBP INVESTMENT MANAGEMENT 19EMERGING MARKETS FIXED INCOME
Appendix
UBP INVESTMENT MANAGEMENT 20EMERGING MARKETS FIXED INCOME
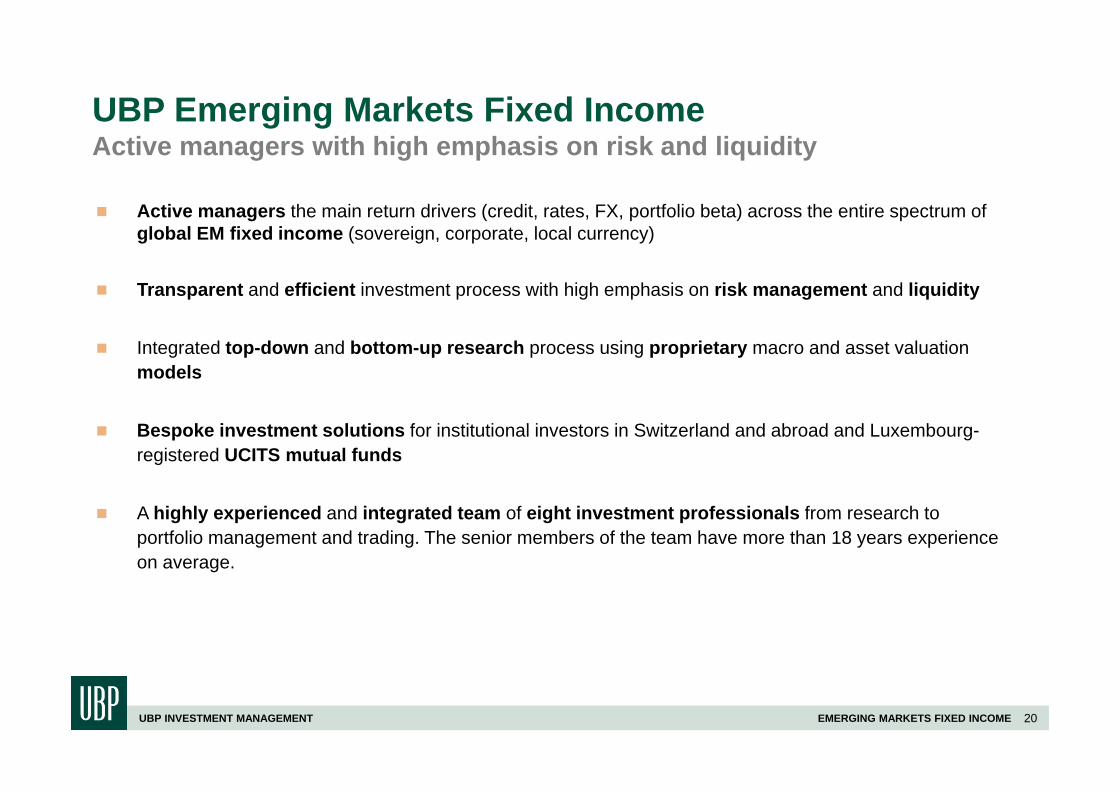
UBP Emerging Markets Fixed IncomeActive managers with high emphasis on risk and liquidity
Active managers the main return drivers (credit, rates, FX, portfolio beta) across the entire spectrum of global EM fixed income (sovereign, corporate, local currency)
Transparent and efficient investment process with high emphasis on risk management and liquidity
Integrated top-down and bottom-up research process using proprietary macro and asset valuationmodels
Bespoke investment solutions for institutional investors in Switzerland and abroad and Luxembourg-registered UCITS mutual funds
A highly experienced and integrated team of eight investment professionals from research to portfolio management and trading. The senior members of the team have more than 18 years experience on average.
UBP INVESTMENT MANAGEMENT 21EMERGING MARKETS FIXED INCOME
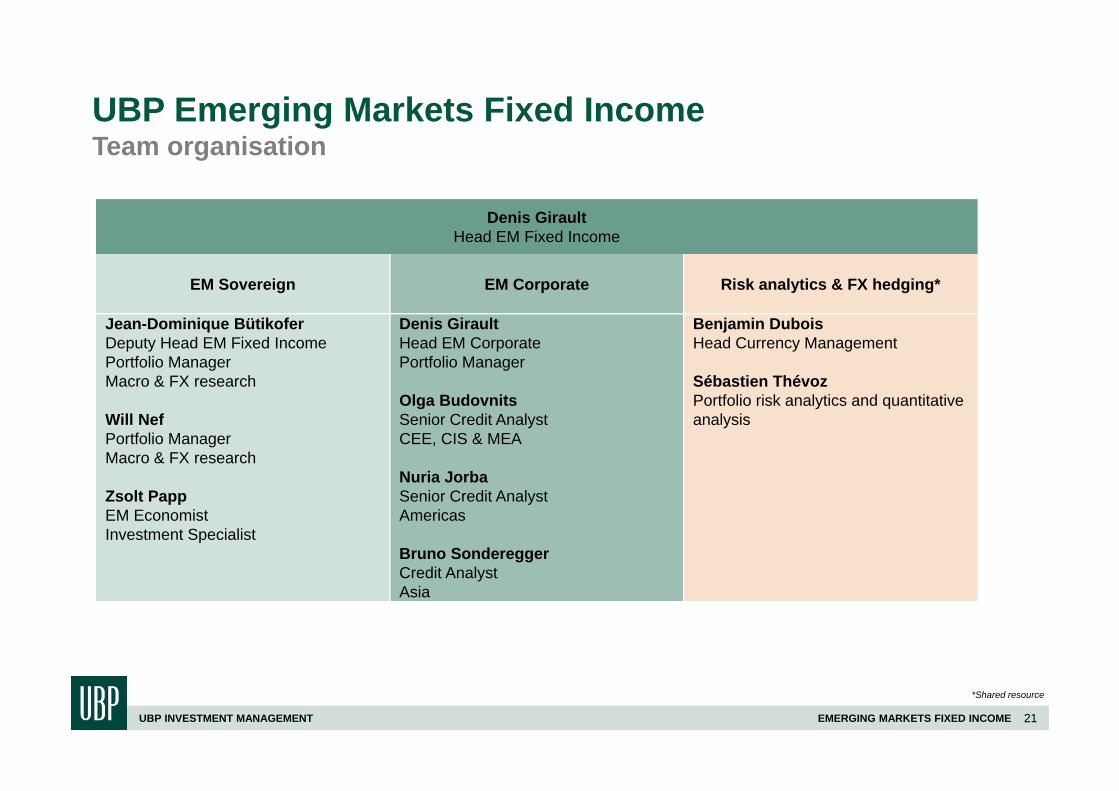
UBP Emerging Markets Fixed IncomeTeam organisation
*Shared resource
Denis GiraultHead EM Fixed Income
EM Sovereign EM Corporate Risk analytics & FX hedging*
Jean-Dominique BütikoferDeputy Head EM Fixed IncomePortfolio ManagerMacro & FX research
Will NefPortfolio ManagerMacro & FX research
Zsolt PappEM EconomistInvestment Specialist
Denis GiraultHead EM CorporatePortfolio Manager
Olga BudovnitsSenior Credit AnalystCEE, CIS & MEA
Nuria JorbaSenior Credit AnalystAmericas
Bruno SondereggerCredit AnalystAsia
Benjamin DuboisHead Currency Management
Sébastien ThévozPortfolio risk analytics and quantitative analysis
UBP INVESTMENT MANAGEMENT 22EMERGING MARKETS FIXED INCOME
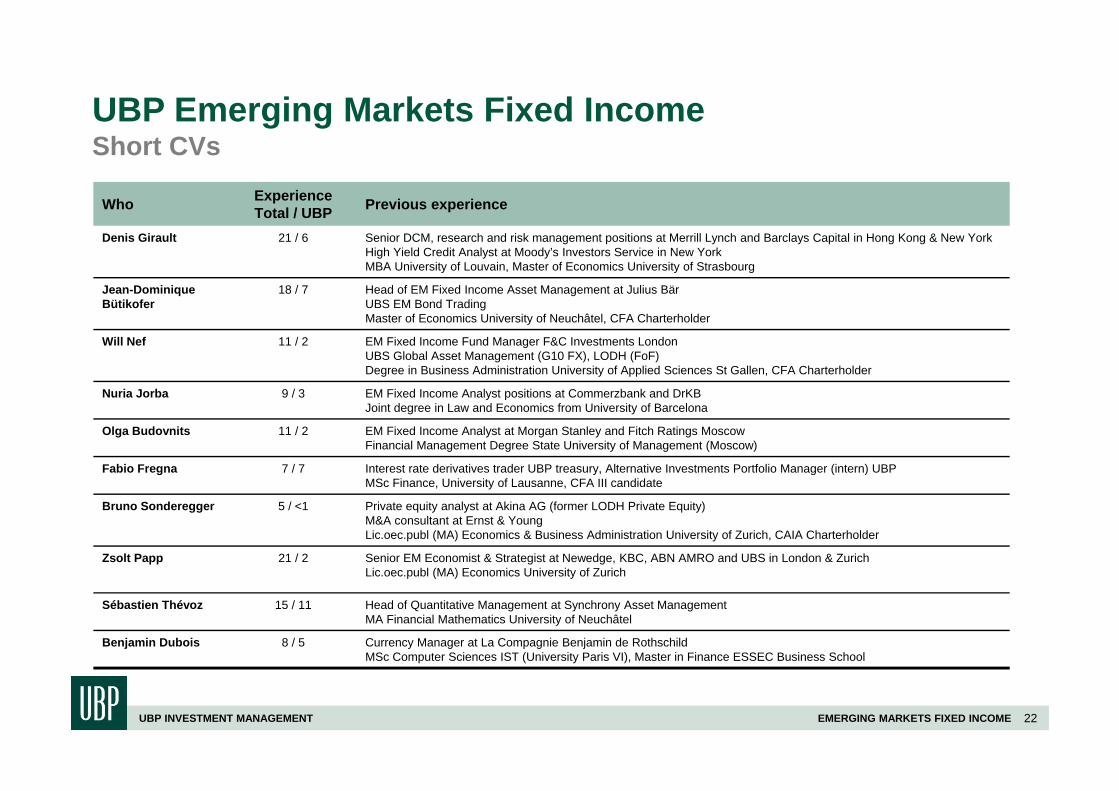
UBP Emerging Markets Fixed IncomeShort CVs
Who ExperienceTotal / UBP Previous experience
Denis Girault 21 / 6 Senior DCM, research and risk management positions at Merrill Lynch and Barclays Capital in Hong Kong & New YorkHigh Yield Credit Analyst at Moody’s Investors Service in New YorkMBA University of Louvain, Master of Economics University of Strasbourg
Jean-Dominique Bütikofer
18 / 7 Head of EM Fixed Income Asset Management at Julius BärUBS EM Bond TradingMaster of Economics University of Neuchâtel, CFA Charterholder
Will Nef 11 / 2 EM Fixed Income Fund Manager F&C Investments LondonUBS Global Asset Management (G10 FX), LODH (FoF)Degree in Business Administration University of Applied Sciences St Gallen, CFA Charterholder
Nuria Jorba 9 / 3 EM Fixed Income Analyst positions at Commerzbank and DrKBJoint degree in Law and Economics from University of Barcelona
Olga Budovnits 11 / 2 EM Fixed Income Analyst at Morgan Stanley and Fitch Ratings MoscowFinancial Management Degree State University of Management (Moscow)
Fabio Fregna 7 / 7 Interest rate derivatives trader UBP treasury, Alternative Investments Portfolio Manager (intern) UBPMSc Finance, University of Lausanne, CFA III candidate
Bruno Sonderegger 5 / <1 Private equity analyst at Akina AG (former LODH Private Equity)M&A consultant at Ernst & YoungLic.oec.publ (MA) Economics & Business Administration University of Zurich, CAIA Charterholder
Zsolt Papp 21 / 2 Senior EM Economist & Strategist at Newedge, KBC, ABN AMRO and UBS in London & ZurichLic.oec.publ (MA) Economics University of Zurich
Sébastien Thévoz 15 / 11 Head of Quantitative Management at Synchrony Asset ManagementMA Financial Mathematics University of Neuchâtel
Benjamin Dubois 8 / 5 Currency Manager at La Compagnie Benjamin de RothschildMSc Computer Sciences IST (University Paris VI), Master in Finance ESSEC Business School
UBP INVESTMENT MANAGEMENT 23EMERGING MARKETS FIXED INCOME
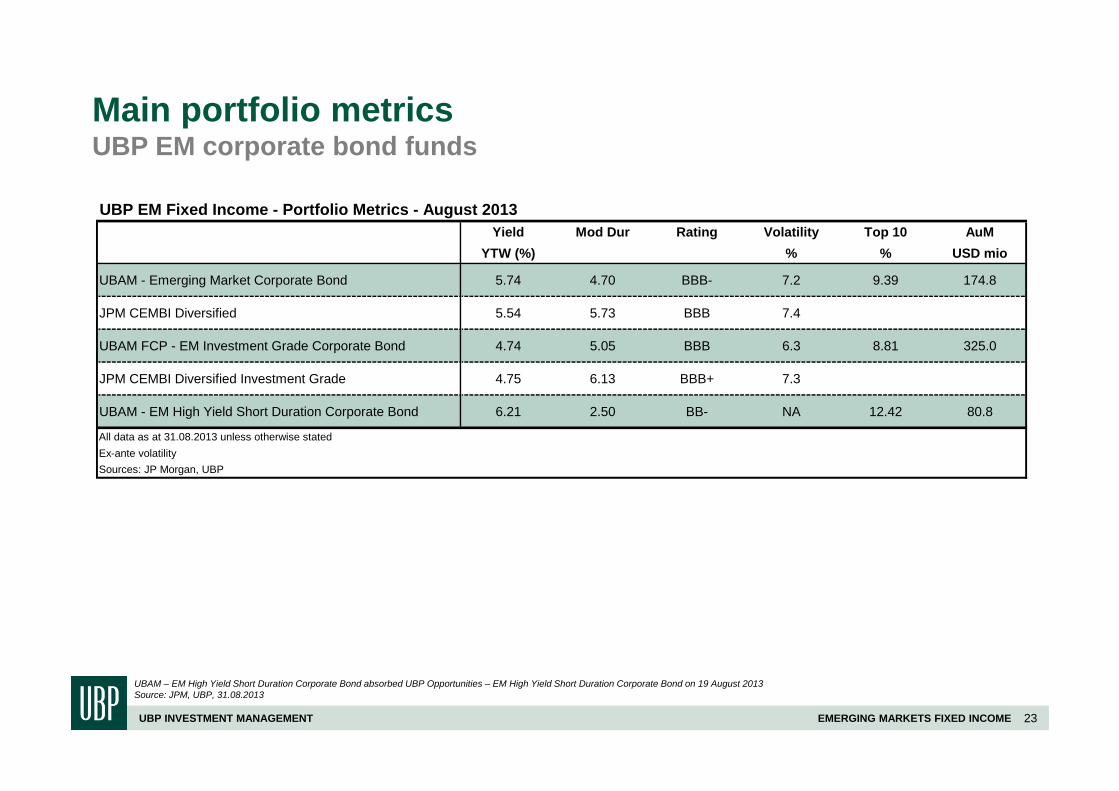
Main portfolio metricsUBP EM corporate bond funds
UBAM – EM High Yield Short Duration Corporate Bond absorbed UBP Opportunities – EM High Yield Short Duration Corporate Bond on 19 August 2013Source: JPM, UBP, 31.08.2013
UBP EM Fixed Income - Portfolio Metrics - August 2013Yield Mod Dur Rating Volatility Top 10 AuM
YTW (%) % % USD mio
UBAM - Emerging Market Corporate Bond 5.74 4.70 BBB- 7.2 9.39 174.8
JPM CEMBI Diversified 5.54 5.73 BBB 7.4
UBAM FCP - EM Investment Grade Corporate Bond 4.74 5.05 BBB 6.3 8.81 325.0
JPM CEMBI Diversified Investment Grade 4.75 6.13 BBB+ 7.3
UBAM - EM High Yield Short Duration Corporate Bond 6.21 2.50 BB- NA 12.42 80.8
All data as at 31.08.2013 unless otherwise stated Ex-ante volatilitySources: JP Morgan, UBP
UBP INVESTMENT MANAGEMENT 24EMERGING MARKETS FIXED INCOME
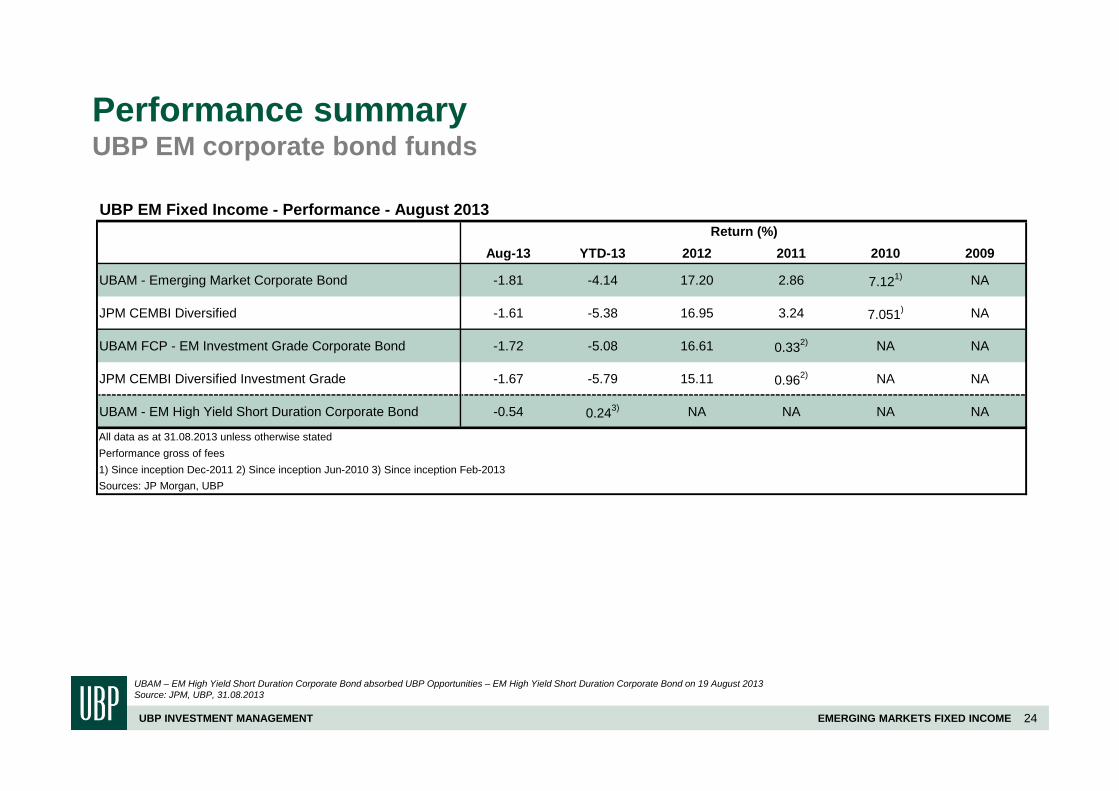
Performance summaryUBP EM corporate bond funds
UBAM – EM High Yield Short Duration Corporate Bond absorbed UBP Opportunities – EM High Yield Short Duration Corporate Bond on 19 August 2013Source: JPM, UBP, 31.08.2013
UBP EM Fixed Income - Performance - August 2013
Aug-13 YTD-13 2012 2011 2010 2009
UBAM - Emerging Market Corporate Bond -1.81 -4.14 17.20 2.86 7.121) NA
JPM CEMBI Diversified -1.61 -5.38 16.95 3.24 7.051) NA
UBAM FCP - EM Investment Grade Corporate Bond -1.72 -5.08 16.61 0.332) NA NA
JPM CEMBI Diversified Investment Grade -1.67 -5.79 15.11 0.962) NA NA
UBAM - EM High Yield Short Duration Corporate Bond -0.54 0.243) NA NA NA NA
All data as at 31.08.2013 unless otherwise stated Performance gross of fees1) Since inception Dec-2011 2) Since inception Jun-2010 3) Since inception Feb-2013Sources: JP Morgan, UBP
Return (%)
UBP INVESTMENT MANAGEMENT 25EMERGING MARKETS FIXED INCOME
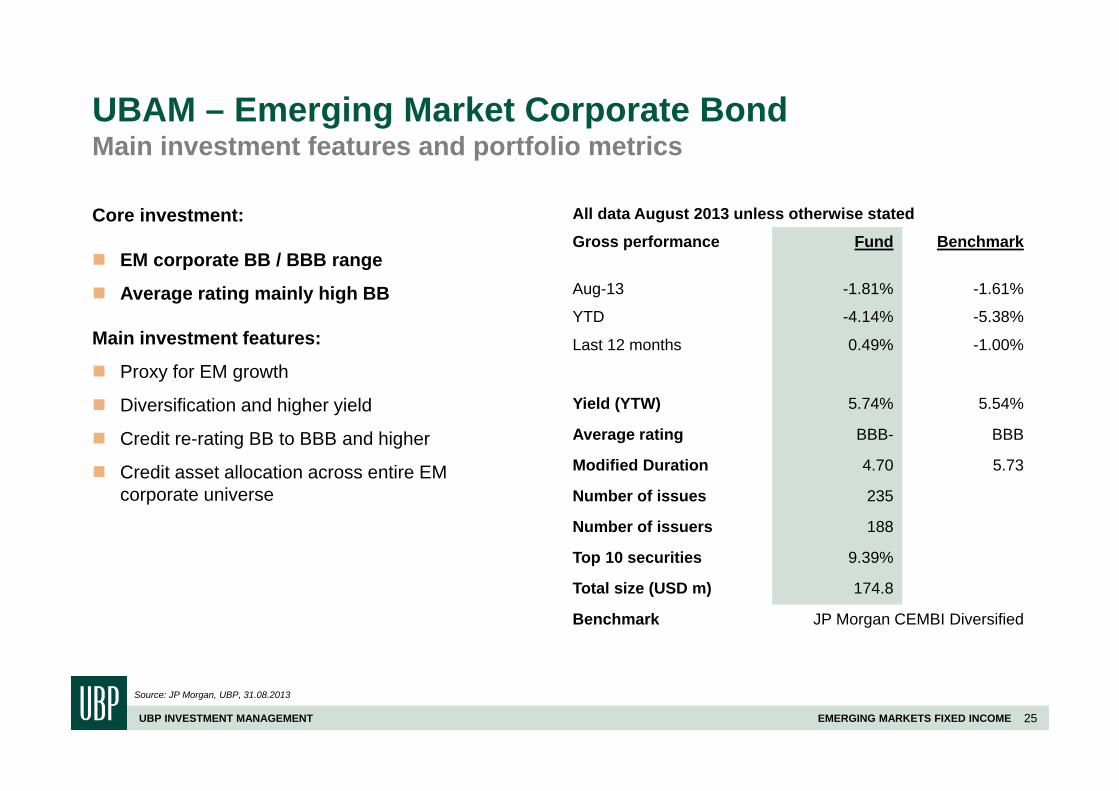
UBAM – Emerging Market Corporate BondMain investment features and portfolio metrics
Core investment:
EM corporate BB / BBB range
Average rating mainly high BB
Main investment features:
Proxy for EM growth
Diversification and higher yield
Credit re-rating BB to BBB and higher
Credit asset allocation across entire EM corporate universe
Source: JP Morgan, UBP, 31.08.2013
All data August 2013 unless otherwise stated
Gross performance Fund Benchmark
Aug-13 -1.81% -1.61%
YTD -4.14% -5.38%
Last 12 months 0.49% -1.00%
Yield (YTW) 5.74% 5.54%
Average rating BBB- BBB
Modified Duration 4.70 5.73
Number of issues 235
Number of issuers 188
Top 10 securities 9.39%
Total size (USD m) 174.8
Benchmark JP Morgan CEMBI Diversified
UBP INVESTMENT MANAGEMENT 26EMERGING MARKETS FIXED INCOME
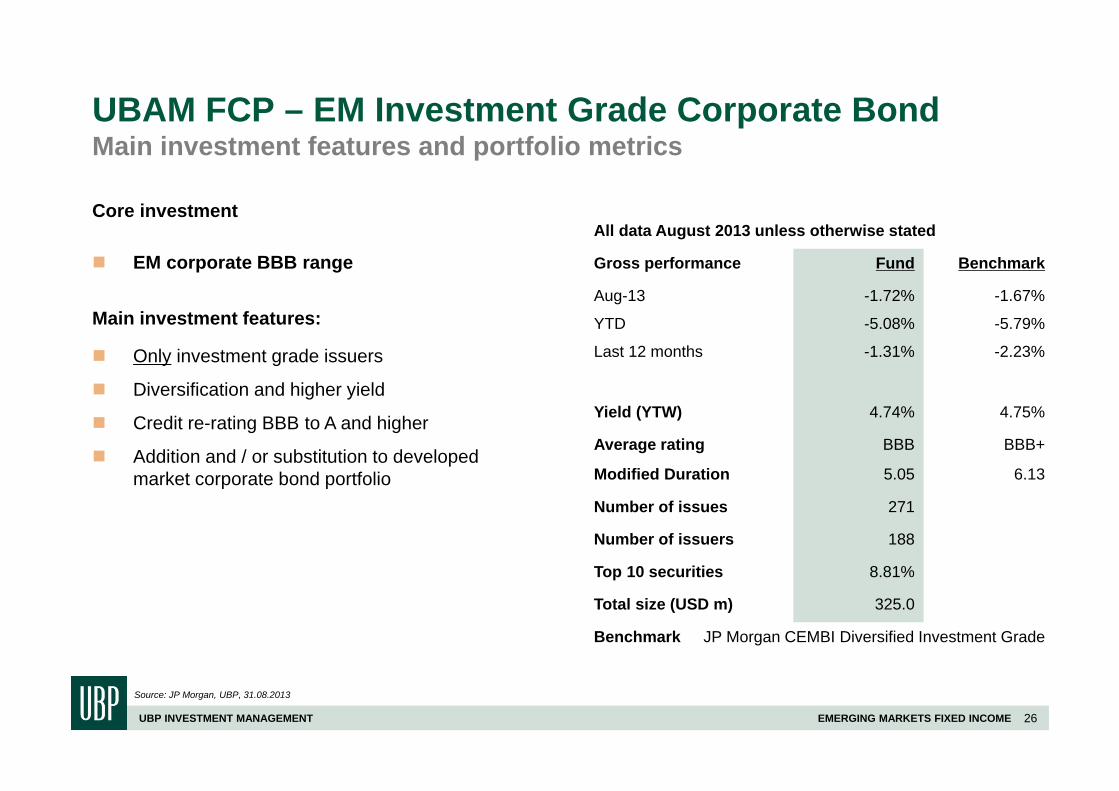
UBAM FCP – EM Investment Grade Corporate BondMain investment features and portfolio metrics
Core investment
EM corporate BBB range
Main investment features:
Only investment grade issuers
Diversification and higher yield
Credit re-rating BBB to A and higher
Addition and / or substitution to developed market corporate bond portfolio
Source: JP Morgan, UBP, 31.08.2013
All data August 2013 unless otherwise stated
Gross performance Fund Benchmark
Aug-13 -1.72% -1.67%
YTD -5.08% -5.79%
Last 12 months -1.31% -2.23%
Yield (YTW) 4.74% 4.75%
Average rating BBB BBB+
Modified Duration 5.05 6.13
Number of issues 271
Number of issuers 188
Top 10 securities 8.81%
Total size (USD m) 325.0
Benchmark JP Morgan CEMBI Diversified Investment Grade
UBP INVESTMENT MANAGEMENT 27EMERGING MARKETS FIXED INCOME
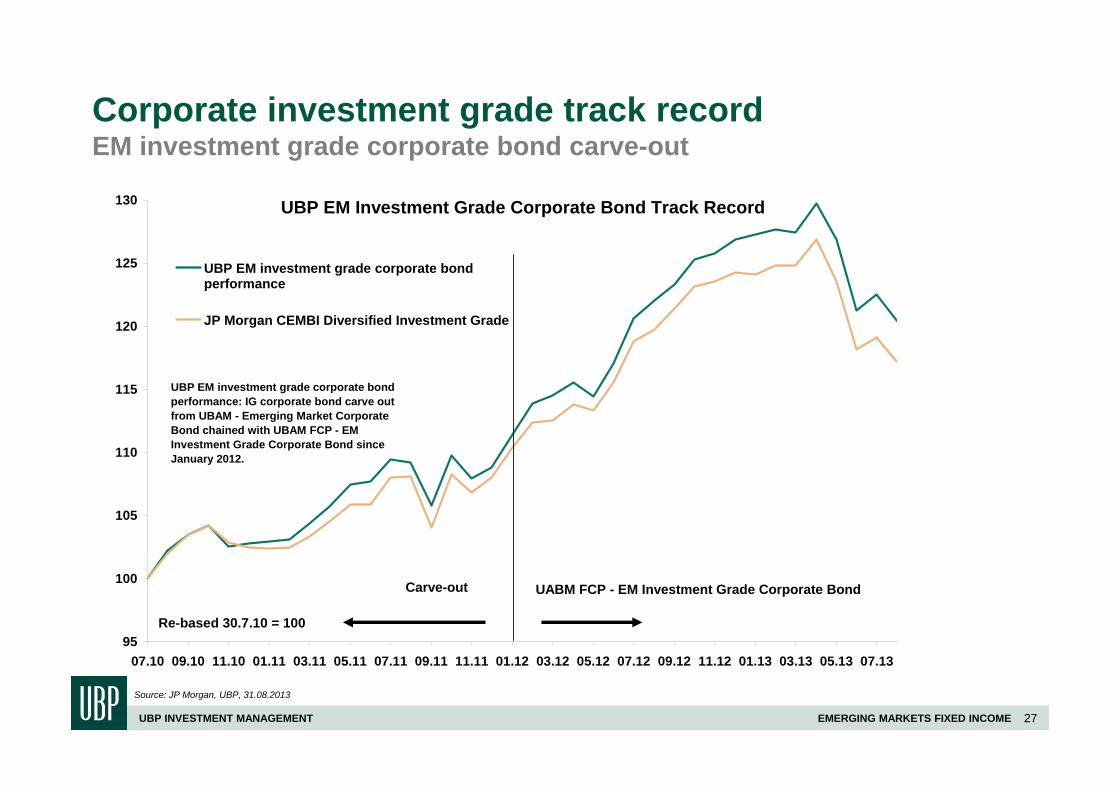
Corporate investment grade track recordEM investment grade corporate bond carve-out
Source: JP Morgan, UBP, 31.08.2013
UBP EM Investment Grade Corporate Bond Track Record
95
100
105
110
115
120
125
130
07.10 09.10 11.10 01.11 03.11 05.11 07.11 09.11 11.11 01.12 03.12 05.12 07.12 09.12 11.12 01.13 03.13 05.13 07.13
UBP EM investment grade corporate bondperformance
JP Morgan CEMBI Diversified Investment Grade
Re-based 30.7.10 = 100
UBP EM investment grade corporate bond performance: IG corporate bond carve out from UBAM - Emerging Market Corporate Bond chained with UBAM FCP - EM Investment Grade Corporate Bond since January 2012.
Carve-out UABM FCP - EM Investment Grade Corporate Bond
UBP INVESTMENT MANAGEMENT 28EMERGING MARKETS FIXED INCOME
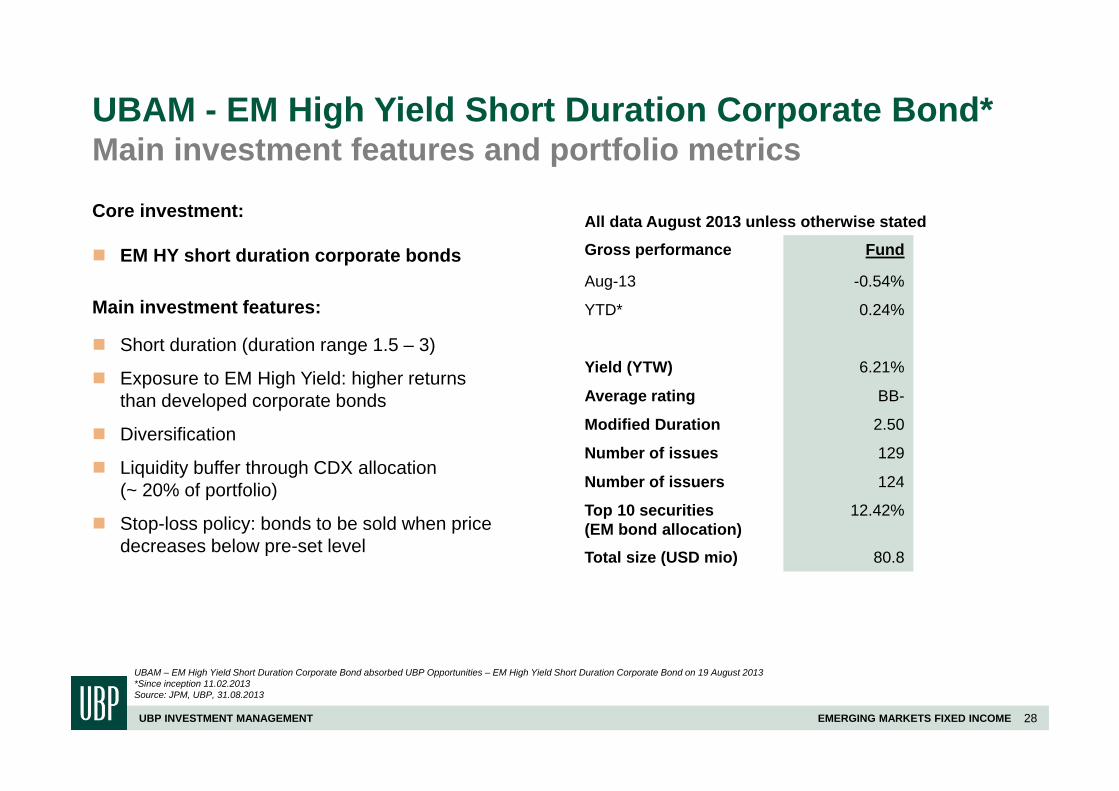
UBAM - EM High Yield Short Duration Corporate Bond*Main investment features and portfolio metrics
Core investment:
EM HY short duration corporate bonds
Main investment features:
Short duration (duration range 1.5 – 3)
Exposure to EM High Yield: higher returns than developed corporate bonds
Diversification
Liquidity buffer through CDX allocation (~ 20% of portfolio)
Stop-loss policy: bonds to be sold when price decreases below pre-set level
All data August 2013 unless otherwise stated
Gross performance Fund
Aug-13 -0.54%
YTD* 0.24%
Yield (YTW) 6.21%
Average rating BB-
Modified Duration 2.50
Number of issues 129
Number of issuers 124
Top 10 securities (EM bond allocation)
12.42%
Total size (USD mio) 80.8
UBAM – EM High Yield Short Duration Corporate Bond absorbed UBP Opportunities – EM High Yield Short Duration Corporate Bond on 19 August 2013*Since inception 11.02.2013Source: JPM, UBP, 31.08.2013
UBP INVESTMENT MANAGEMENT 29EMERGING MARKETS FIXED INCOME
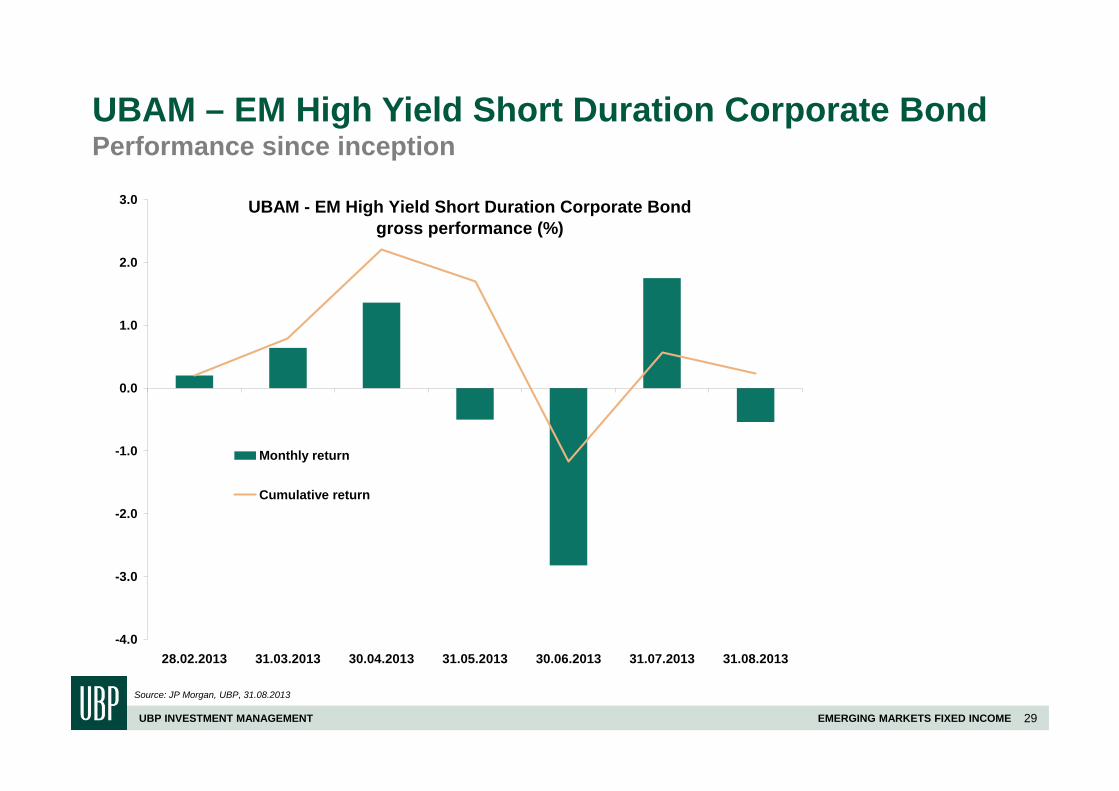
UBAM – EM High Yield Short Duration Corporate BondPerformance since inception
Source: JP Morgan, UBP, 31.08.2013
UBAM - EM High Yield Short Duration Corporate Bond gross performance (%)
-4.0
-3.0
-2.0
-1.0
0.0
1.0
2.0
3.0
28.02.2013 31.03.2013 30.04.2013 31.05.2013 30.06.2013 31.07.2013 31.08.2013
Monthly return
Cumulative return
UBP INVESTMENT MANAGEMENT 30EMERGING MARKETS FIXED INCOME
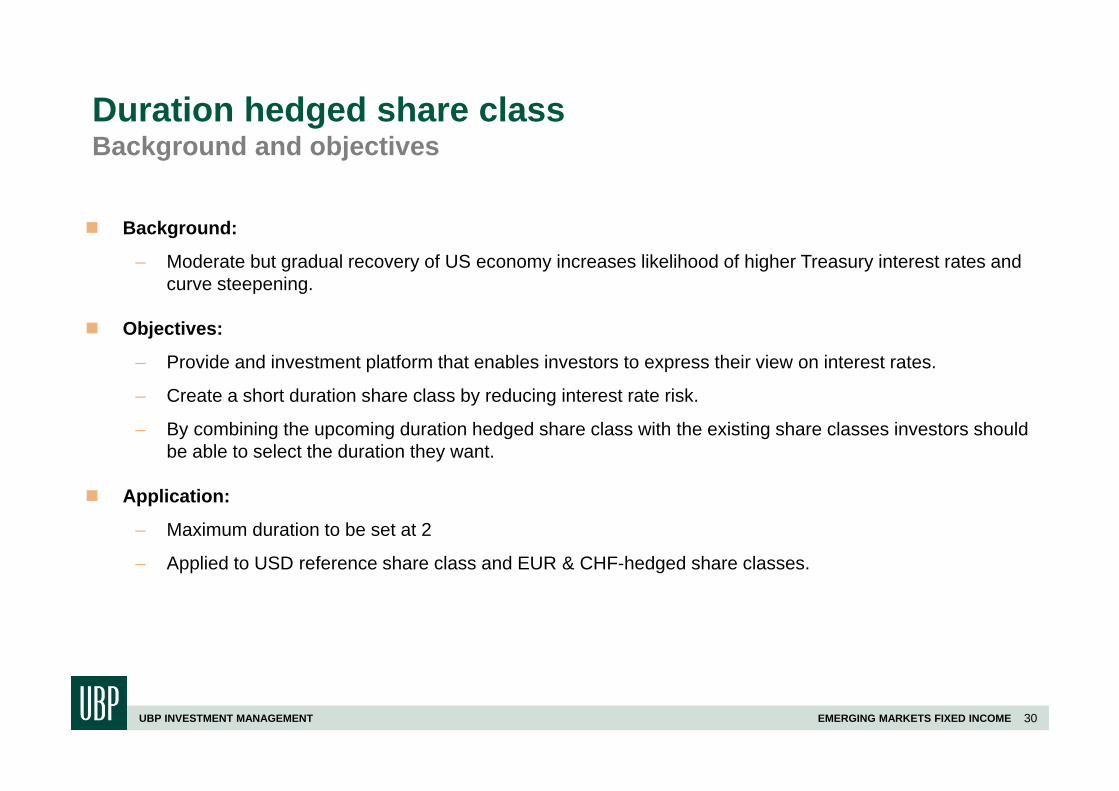
Duration hedged share class Background and objectives
Background:
– Moderate but gradual recovery of US economy increases likelihood of higher Treasury interest rates and curve steepening.
Objectives:
– Provide and investment platform that enables investors to express their view on interest rates.
– Create a short duration share class by reducing interest rate risk.
– By combining the upcoming duration hedged share class with the existing share classes investors should be able to select the duration they want.
Application:
– Maximum duration to be set at 2
– Applied to USD reference share class and EUR & CHF-hedged share classes.

UBP INVESTMENT MANAGEMENT 31EMERGING MARKETS FIXED INCOME
Duration hedged share classImpact on yield and return
UBAM – Emerging Market Corporate Bond
Mod Duration Yield %
Unhedged 5.00 5.49
Hedged 2.0 4.51
Hedged 0.0 3.85
UBAM FCP – EM investment Grade Corporate Bond
Mod Duration Yield %
Unhedged 5.25 4.41
Hedged 2.0 3.30
Hedged 0.0 2.62
Yield and return estimates for hedged share class based on performance attributionSource: UBP, BofAML, 31.07.2013
UBAM – Emerging Market Corporate Bond
Mod Duration Jan-Jul return (%)
Unhedged 5.00 -2.37
Hedged 2.0 -1.08
Hedged 0.0 +0.20
UBAM FCP – EM investment Grade Corporate Bond
Mod Duration Jan-Jul return (%)
Unhedged 5.25 -3.42
Hedged 2.0 -2.15
Hedged 0.0 -1.07
UBP INVESTMENT MANAGEMENT 32EMERGING MARKETS FIXED INCOME
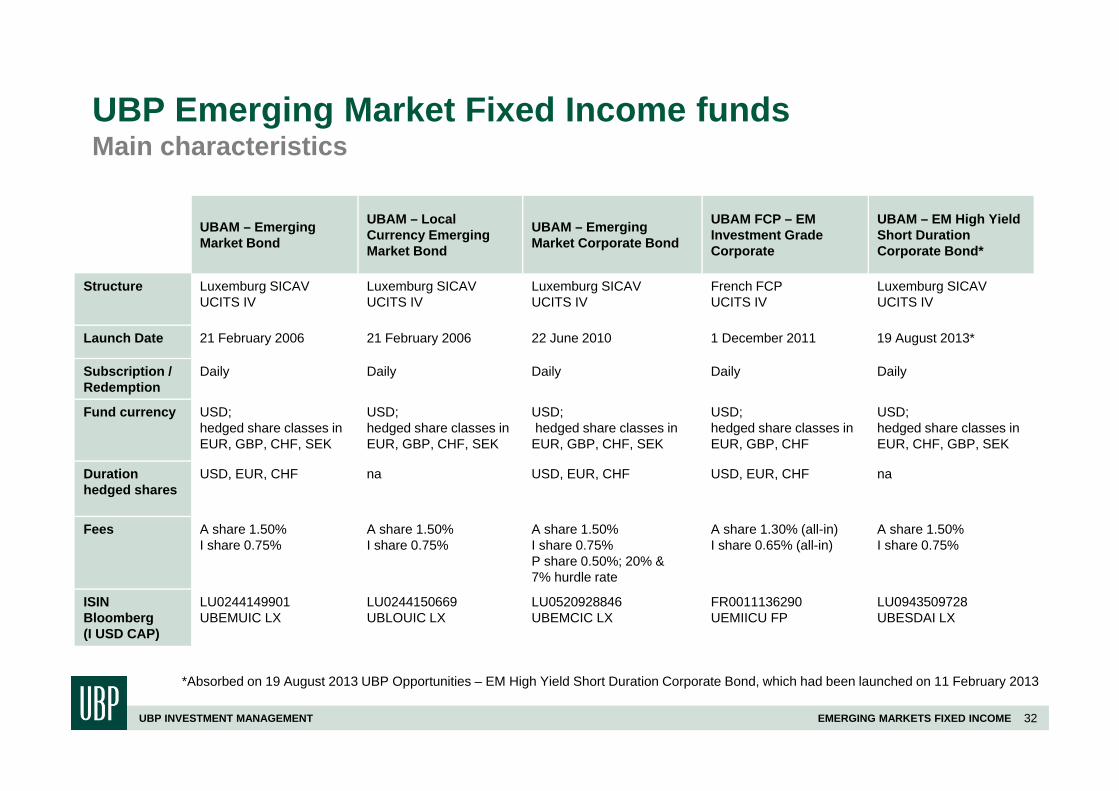
UBP Emerging Market Fixed Income fundsMain characteristics
UBAM – Emerging Market Bond
UBAM – Local Currency Emerging Market Bond
UBAM – Emerging Market Corporate Bond
UBAM FCP – EM Investment Grade Corporate
UBAM – EM High Yield Short Duration Corporate Bond*
Structure Luxemburg SICAVUCITS IV
Luxemburg SICAVUCITS IV
Luxemburg SICAV UCITS IV
French FCPUCITS IV
Luxemburg SICAV UCITS IV
Launch Date 21 February 2006 21 February 2006 22 June 2010 1 December 2011 19 August 2013*
Subscription / Redemption
Daily Daily Daily Daily Daily
Fund currency USD; hedged share classes in EUR, GBP, CHF, SEK
USD; hedged share classes in EUR, GBP, CHF, SEK
USD;hedged share classes in EUR, GBP, CHF, SEK
USD; hedged share classes in EUR, GBP, CHF
USD; hedged share classes in EUR, CHF, GBP, SEK
Duration hedged shares
USD, EUR, CHF na USD, EUR, CHF USD, EUR, CHF na
Fees A share 1.50%I share 0.75%
A share 1.50%I share 0.75%
A share 1.50%I share 0.75%P share 0.50%; 20% & 7% hurdle rate
A share 1.30% (all-in)I share 0.65% (all-in)
A share 1.50%I share 0.75%
ISINBloomberg(I USD CAP)
LU0244149901UBEMUIC LX
LU0244150669UBLOUIC LX
LU0520928846UBEMCIC LX
FR0011136290UEMIICU FP
LU0943509728UBESDAI LX
*Absorbed on 19 August 2013 UBP Opportunities – EM High Yield Short Duration Corporate Bond, which had been launched on 11 February 2013

UBP INVESTMENT MANAGEMENT 33EMERGING MARKETS FIXED INCOME
Stefan Becker
Head of Wholesale Business Germany
Tel. +41 58 819 [email protected]
Peter Richters
Head of Institutional BusinessCentral Europe and Nordics
Tel. +41 58 819 [email protected]
Union Bancaire Privée, UBP SABahnhofstrasse 1
8022 ZürichSwitzerland
Contacts
UBP INVESTMENT MANAGEMENT 34EMERGING MARKETS FIXED INCOME
This document is a marketing document and reflects the opinion of Union Bancaire Privée, UBP SA or any entity of the UBP Group (hereinafter"UBP") as of the date of issue. It is not intended for distribution, publication, or use in any jurisdiction where such distribution, publication, or usewould be unlawful, nor is it directed to any person or entity to which it would be unlawful to direct such a document.
This document has been made on a best efforts basis and is furnished for information purposes only and does not constitute an offer or arecommendation to purchase or sell any security, unless otherwise provided for in the present disclaimer. The opinions herein do not take intoaccount individual clients’ circumstances, objectives, or needs. Each client must make his own independent decisions regarding any securities orfinancial instruments mentioned herein. Before entering into any transaction, each client is urged to consider the suitability of the transaction inrelation to his particular circumstances and to independently review, with professional advisors as necessary, the specific risks incurred, inparticular at the financial, regulatory and tax levels.
The information and analysis contained herein have been based on sources believed to be reliable. However, UBP does not guarantee theirtimeliness, accuracy, or completeness, nor does it accept any liability for any loss or damage resulting from their use. All information andopinions are subject to change without notice. Past performance is no guarantee for current or future returns. This document has not beenproduced by UBP’s financial analysts and is not to be considered as financial research.
The investments mentioned herein may be subject to risks that are difficult to quantify and to integrate into the valuation of investments. Uponrequest, UBP is available to provide more information to clients on risks associated with specific investments.
The present document constitutes neither an offer nor a solicitation to subscribe for shares in the sub-funds in any jurisdiction where such anoffer or solicitation would not be authorised, or to any person to whom it would be unlawful to make such an offer or invitation. It does not replacethe prospectus and any other legal documents that can be obtained free of charge from the registered office of the funds. Any subscriptions notbased on the latest prospectus and the latest annual or semi-annual reports of the fund shall not be acceptable.
This document is confidential and is intended only for the use of the person to whom it was delivered. This document may not be reproduced (inwhole or in part) or delivered to any other person without the prior written approval of UBP.
Union Bancaire Privée, UBP SA is authorised and regulated in Switzerland by the Swiss Financial Market Supervisory Authority (FINMA) and inthe United Kingdom by the Financial Services Authority (FSA).
Disclaimer