two test methods for determining the relative background emission from a hollow cathode lamp
TRANSCRIPT
Two Test Methods for Determining the Relative Background Emission from a Hollow Cathode Lamp
P A D D Y F L E M I N G Sligo Regional Technical College, Ballinode, Sligo, Ireland
This paper describes two test methods, based respectively on direct trans- mittance spectrometry and transmittance ratio spectrometry, to deter- mine the relative background emission from the hollow cathode lamps used in atomic absorption spectrophotometry. Index Headings: Hollow cathode lamp; Atomic absorption spectropho- tometer; Concentration ratio; Transmittance ratio; Relative background emission.
I N T R O D U C T I O N
The absorbance in atomic absorption spectrophotom- etry (AAS) is, under ideal conditions, directly propor- tional to the atomic concentration in the flame. The con- ditions are ideal when the spectral light source is purely monochromatic, i.e., the source emits a single resonance spectral line of half-intensity width which is much less than the natural bandwidth of the corresponding atomic absorption (resonance) line and all the light rays have a constant pathlength through the flame. The nonlinearity of absorbance vs. atomic concentration, which is ob- served when hollow cathode lamps are employed in AAS and which becomes more manifest as the aspirated sam- ple concentration increases, has been attributed to di- verse phenomena. Menzies, 1 Rubeska and Svoboda, 2 van Gelder, 3 and Whiteside e t a[. 4 have all suggested that the curvature is due principally to the presence of nonab- sorbed light emanating from the source. Russell e t a l . 5 suggest that the curvature is probably due to the in- creased pressure broadening of the resonance atomic ab- sorption peak caused by increased concentration and that the broadening is accompanied by shallowing at the peak's maximum. The deviation from linearity may also be due to the profile of the emission line 3 and to hyperfine struc- ture in emission and absorption lines. 2,3
The working hypothesis of this paper is similar to that advocated by Whiteside e t a[. , 4 i.e., that the curvature arises mainly from the presence of "stray light" [herein called background emission (BGE)] emanating from the hollow cathode lamp. According to Alkemade and Herrmann, s the background emission may have various origins within the lamp. For example, the spectral band- pass of the monochromator may allow nonresonance spectral lines of the analyte element which are emitted by the source to pass; spectral lines from the noble filler gas used to sustain the discharge and from metallic im- purities in the lamp may also pass the monochromator; and the lamp may emit a continuum in the spectral band- pass of the monochromator. The part of this latter con- t inuum which falls within the spectral interval of the
Received 1 May 1992.
absorption line will be absorbed, but the remainder will not be absorbed. If lamp emission is modulated and ac detection is employed, then the continuum background and line emissions from this flame are not detected.
The BGE from the lamp, which is isolated by the spec- tral slit width of the monochromator, is not absorbed by the atomic analyte element in the flame, although res- onance line emission from the lamp is absorbed. How- ever, other nonatomic species from the sample which are aspirated into the flame may at tenuate--via various mechanisms--the BGE. The concentration of the non- atomic species is assumed herein to be directly propor- tional to the analyte atom concentration. The BGE causes increased deviation from Beer-Lambert law be- havior as the analyte concentration and/or flame path- length increases. It is recommended that an absorbance reading of 0.5 in quantitative AAS measurements not be exceeded; this factor suggests that background emission from a hollow cathode lamp comprises about 4 % of the monochromatic emission. If a tuneable laser is employed as the monochromatic source in AAS, then BGE would not be present and the pressure broadening of the ab- sorption line with increasing atomic concentration in the flame could be investigated. However, that latter capa- bility is still unavailable in the UV spectral region.
This paper applies two spectrophotometric methods, developed to determine the relative stray radiant energy (SRE) levels in molecular spectrophotometers, in order to determine the relative background emission in AAS: the direct transmittance method of Fleming and O'Dea 7 and the transmittance ratio method of Fleming. s How- ever, BGE originates in the spectral source of an atomic absorption spectrophotometer, whereas SRE originates in the monochromator of a molecular spectrophotometer. SRE appears to be independent of spectral slit width in molecular spectrophotometry, but the relative back- ground emission (RBGE) is probably dependent on spec- tral slit width in AAS. RBGE may also depend on the lamp current, on the age of the lamp, on the filler gas, and on the wavelength setting, but those dependencies are not investigated in this paper.
F O R M U L A T I O N OF E XPE R IME NT AL QUANTITIES
Direct transmittance spectrometry in AAS involves determining the absorbances A'~ with reference to a transparent blank of a set of aspirated samples of ever increasing concentration and hence of ever increasing monochromatic absorbance A~. If the light intensity transmitted by the flame when the b l a n k is aspirated is given by Io + Ib, and if the light intensity transmitted by the flame when a sample containing the analyte ele-
1400 Volume 46, Number 9, 1992 0003-7028/92/4609-140052.00/0 APPLIED SPECTROSCOPY © 1992 Society for Applied Spectroscopy

ment is aspirated is given by Ix + Ib, then the observed transmittance reading T'x is given by:
T'x = (Ix + Ib) / ( Io + Ib) = (Tx + B)/(1 + B) (1)
where Tx (=Ix / Io) is the true monochromatic transmit- tance, B ( = I J I o) is the relative background emission, Ix is the monochromatic emission intensity, and Ib is the background emission intensity. Equation 1 is similar to the expressions by Menzies ~ and by Whiteside e t al., 4 but it must be amended to accommodate the attenuation of background emission by the analyte element in the flame as follows:
T'x = (Tx + tAxB) / (1 + B ) (2)
where t is BGE transmittance of the analyte sample in the flame of unity atomic absorbance, Ax = -log~oTx = 1 or Tx =0.1.
The t Ax multiplier arises as follows: The term t (<1) is the transmittance of the components in the aspirated sample to the BGE from the hollow cathode lamp when the atomic absorbance of the analyte element in the same sample is unity. If the nonatomic species in the aspirated sample are transparent to BGE, then t = 1. If t = 0.9 when the aspirated sample has an atomic absorbance = 2 and if the concentration of the nonatomic species in the flame keeps pace with the atomic absorbance then t Ax - ~ 0.92 = 0.81, etc.
It can be seen by inspection of Eq. 2 that if Tx >> B, then T'x = Tx and if Tx << B then T'x = tAxB/(1 + B ) = tA~B '. The measurement mode in AAS is absorbance, i.e., A'x = -log~oT'x. Therefore, at very low monochromatic absorbances A'x = Ax and at very high monochromatic absorbances A'x = (-log~ot)Ax - log~oB'. If the observed absorbance A'x is plotted against the monochromatic ab- sorbance Ax, then at very low monochromatic absorb- ances a plot of slope unity through the origin is achieved, while at very high monochromatic absorbances a plot of slope -loglot and intercept -log~oB' is achieved. A non- linear "knee" region in the plot separates the above- mentioned linear parts at intermediate monochromatic absorbances where monochromatic emission and back- ground emission are of the same order of magnitude.
Equation 1 mirrors the effect of stray radiant energy on absorptiometric determinations in molecular spectro- photometry. This possibility suggests that the SRE test method based on transmittance ratio spectrometry s may be adapted to quantify the RBGE in AAS. The trans- mittance ratio (R,) of a sequential pair of a set of N solutions, whose concentration (ci) increases geometri- cally, is expected to oberve the following relationship based on the Beer-Lambert laws and on ideal instrument behavior:
R~ = T~+~/T~ = T~ ~-~ (3)
where 1 < i < N , a = Ci+l/C~, and T~ is the monochromatic transmittance of the ith solution, etc.
However, Eq. 3 ignores the inevitable presence of BGE. The observed transmittance ratio (R'~) is given in terms of the actual transmittances of the sequential pair of solutions, T'~ and T'~+~, as follows:
R'~ = T~+I/T' i = (T~ + t~AxB)/(Ti + tAxB). (4)
The transmittance ratio function defined in Eq. 4 will
TABLE I. Monochromatic absorbances of the concentration series of Cu samples at various resonance wavelengths for copper. ~
Nominal Monochromatic absorbances ( × 1000) of Cu Cu sample s tandards at copper resonance wavelengths
concen- trat ion X(nm) X(nm) X(nm) X(nm) (ppm) 324.7 327.4 216.5 222.6
0 0 0 0 0 1 58_+5 V ~ 82-+ 11 2 115 _+ 11 2X/2 163 _+ 10 4 224 _+ 18 4k/~ 313 _+ 21 8 426 _+ 26 8~/2 606*
16 842* 16k/2 1177" 32 1578" 32V~ 2195" 40 1952" 40V~ 2804* 64 3110" 64V~ 4322* 80 3857* 80V~ 5240*
128 5938*
8 6 + 8 116 -+ 14 160 _+ 10 223 _+ 19 315 _ 22 438 + 30
82_+ 8 115 _+ 17 158 -+ 24 223 _+ 33 299 _+ 30 416 + 40 370 -+ 34
9 3 + 7 127 _ 15 183 _+ 15 164 _ 18 229 _ 25 254 _+ 22 353 + 20 315 -+ 26 428 _+ 25 485 + 30
° The asterisk (*) refers to calculated values.
have a minimum value, R'~(min) = r, at a particular ref- erence transmittance value, r, determined by the RBGE, by the a value selected, and by the value of t. According to Fleming, s the RBGE may be given in terms of a and the observables r and r (= arc-l), and for t = 1, as follows:
(a - - 1)~ "a (a - 1 ) ( r / a ) a/<a-1) B = 1 - ar a - l = 1 - r (5)
Equation 5 underestimates the RBGE because t < 1. However, by gradually increasing the value of B given by Eq. 5 while simultaneously gradually decreasing the value of t from unity, one facilitates the numerical mod- eling of Eq. 4 to give a best fit between the numerical values so generated and the observed transmittance ratio measurements.
EXPERIMENTAL METHODS AND MATERIALS
Transmittance ratio spectrometry in AAS involves preparing a geometric concentration series of standard solutions in such a way that the concentration ratio of a sequential pair of solutions (i.e., a = ci+l/ci > 1) is held constant. Such a concentration series of fifteen Cu so- lutions, with a concentration ratio of a = V~ and con- centrations in the range 1 -< ci(ppm) _< 128, was thus prepared by dilution in 1 M HNO3 from a 1000 _+ 5 ppm Cu primary stock solution prepared in 1 M HNO~. The most sensitive resonance atomic absorption line in Cu is at 324.7 nm. 6 We determined the monochromatic absor- bance of each solution in the geometric series on a Per- kin-Elmer 2380 with reference to 1 M HNO3 blank using each Cu resonance absorbance line in turn and beginning with the most sensitive Cu line followed by the next most sensitive Cu line once the absorbance reading of a mem- ber of the geometric series exceeded 0.5, etc. The absor- bance readings are recorded in Table I. A slit width of 0.2 nm was used throughout this part of the experiment.
A P P L I E D S P E C T R O S C O P Y 1401

"0 • r- r- t~
~p
o_~
¢-
,_2--
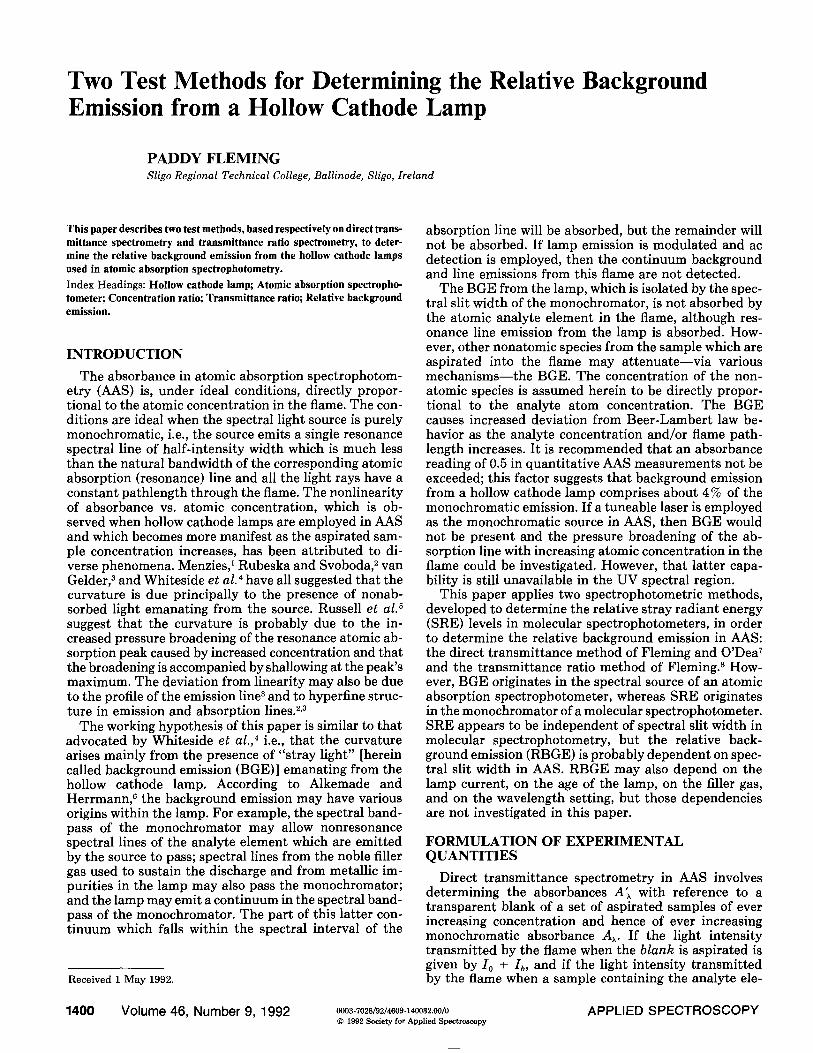
FIG. 1.
0.6
0.4
0.2
0.0 t i i !
0.0 0.1 0 .2 0 .3 0 .4 0.5 Monochromatic Absorbance of i-th Sample
Monochromat i c absorbance of the (i + n ) t h sample p lo t ted aga ins t the monoch roma t i c absorbance of the i th samples , where n = 1(+) , 2(x), and 3(,) .
Figure 1 shows absorbances of the (i + n)th samples in the series plotted against the absorbances of the ith sam- ples. The slopes of the plots give average concentration ratios of 1.388 + 0.003 for n = 1; 1.925 _ 0.007 for n = 2; and 2.68 _+ 0.02 for n = 3.
The above geometric concentration series was also used in the direct transmittance test method together with four more Cu standards of ppm concentrations of 40, 40V~, 80, and 80V~. Table I also records the mono- chromatic absorbances of the extra samples. The direct transmittance RBGE test method in a modern AAS was carried out as follows: The spectrophotometer, a Perkin- Elmer Model No. 2380 fitted with a 100-mm slot burner and an air/acetylene flame, was set up and optimized for normal operation. The wavelength of the monochroma- tor was set to the appropriate resonance atomic absorp- tion line of the analyte element (Cu at 324.7 nm), and its spectral slit width (0.2 nm) was such that only the corresponding emission line from the hollow cathode lamp was isolated and detected. The hollow cathode lamp was operated at 80% of the maximum recommended lamp current. The 324.7-nm Cu emission line has a doublet hyperfine structure with an intensity ratio of 5:3. Ac- cording to Thorne, 9 the doublet structure arises from the hyperfine splitting of the ground state; therefore both lines are resonance emission lines. These hyperfine emis- sion lines are not resolved in conventional AAS, and hence the absorptivity of this doublet in AAS is equal to the sum of the absorptivities of the individual emission lines. If the hollow cathode lamp current is excessive, then each component of the doublet will be split further due to self-absorption2 This hyperfine structure is not observed at the spectral slit widths normally used in AAS, and the self-absorption split was avoided in this experiment because a current lower than the maximum recommended lamp current was employed2 The absor- bance A' of eighteen of the nineteen Cu standards men- tioned above was determined relative to a 1 M HNO3 blank and is recorded in Table I. Figure 2 is a plot of
3.0
v
O O ,- 2.0
J~
O u)
J~
~: / , - 0.098A + 1.73 "o 1.0 O > A ' = A 0 o3
,.0 o
0.0 . . . . . 0.0 1.0 2 . 0 3 . 0 4 . 0 5 . 0 6 . 0
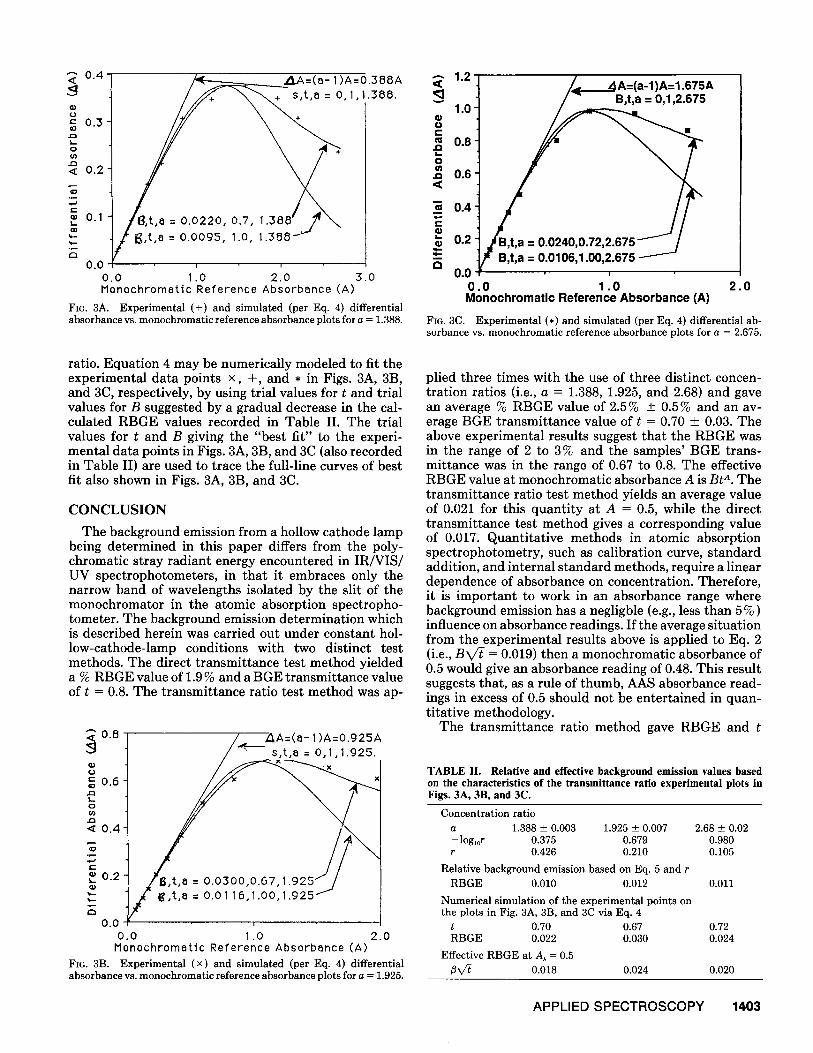
Monochromatic Absorbance (A) FIG. 2. P lo t of the observed absorbances (A') vs. the cor responding monoch roma t i c absorbances (A).
A'x, the observed absorbance, against A~, the monochro- matic absorbance. The computing facility on the Perkin- Elmer 2380 allowed the average and standard deviation of 20 absorbance readings, read at 0.5-second intervals, to be taken each time a sample was aspirated.
The transmittance ratio RBGE test method was ap- plied to the above-mentioned Perkin-Elmer 2380 spec- trophotometer with the use of the prepared geometric series of Cu standards as follows: The least concentrated solution (Cl) of true transmittance T'~ was aspirated into the flame, and the 100% T (zero absorbance) was set. The second least concentrated solution (c2) of true trans- mittance T'2 was then aspirated, and its transmittance ratio, R'~ = T ' J T ' , was read. The latter solution was next used to set 100% T, and the transmittance ratio of the third least concentrated solution, R'2 = T ' z /T '2 , was read. This sequence of measurements (i.e., R'i = T ' i+l / T'~) was repeated for ever more concentrated reference solutions until it was no longer possible to set 100% T by instrumental means. The transmittance ratio term R 'i is synonymous with the differential absorbance term AA'~, and so the latter term will be used henceforth. The above experiment, which had an experimental concentration ratio of 1.388 _ 0.003, was repeated with the same set of solutions for experimental concentration ratios of 1.925 _+ 0.007 and 2.68 _+ 0.02. The three sets of differential absorbances resulting from the above experiments were plotted against the corresponding monochromatic ref- erence absorbances at 324.7 nm and are shown in Figs. 3A, 3B, and 3C, respectively.
EXPERIMENTAL RESULTS AND ANALYSIS
The slope and intercept of the linear graph in Fig. 2 for monochromatic absorbances > 2.5 are -lOglot = 0.098 and -logloB' = 1.73, respectively. Therefore, the BGE transmittance of the sample was t = 0.80 and the RBGE was B = 0.019 (1.9%).
The ordinates of the characteristic maxima of each plot in Figs. 3A, 3B, and 3C (i.e., - log r) are tabulated in Table II together with the corresponding underesti- mates for the RBGE calculated via Eq. 5 and the ap- propriate slopes of the plots in Fig. 1 as the concentration
1402 Volume 46, Number 9, 1992
"" 0.4 .<
~- 0.3
C o
. o
< 0.2
c o
¢ -
¢D 0.1
0.0
~ ~ A = ( a - 1)A=0.388A = ,1,1.388.
J i
0.0 I .0 2.0 3.0 Monochromatic Reference Absorbance (A)
FIO. 3A. Exper imen ta l (+) and s imula ted (per Eq. 4) differential absorbance vs. monochromat i c reference absorbance plots for a = 1.388.
• " - 1.2 <¢
1 . 0 '
o i-
~= 0 . 8 J~ L .
o u) ,-, 0 . 6 <
m 0 . 4
P 0 . 2
a 0.0
/ 4 _ 4A=(a-1)A=1.675A
J B,t,a = 0,0106,1,00,2.675
0 . 0 1 . 0 2 . 0 Monochromatic Reference Absorbance (A)
FIG. 3C. Expe r imen ta l (*) and s imula ted (per Eq. 4) differential ab- sorbance vs. monochroma t i c reference absorbance plots for a = 2.675.
ratio. Equat ion 4 may be numerical ly modeled to fit the exper imental da ta points ×, + , and • in Figs. 3A, 3B, and 3C, respectively, by using trial values for t and trial values for B suggested by a gradual decrease in the cal- culated R B G E values recorded in Table II. The trial values for t and B giving the "bes t fit" to the experi- menta l da ta points in Figs. 3A, 3B, and 3C (also recorded in Table II) are used to trace the full-line curves of best fit also shown in Figs. 3A, 3B, and 3C.
C O N C L U S I O N
The background emission from a hollow cathode lamp being de te rmined in this paper differs f rom the poly- chromatic s t ray radiant energy encountered in IR/VIS/ UV spect rophotometers , in tha t it embraces only the narrow band of wavelengths isolated by the slit of the monochromator in the atomic absorpt ion spectropho- tometer . The background emission de te rmina t ion which is described herein was carried out under constant hol- low-cathode-lamp conditions with two dist inct tes t methods. The direct t ransmi t tance tes t me thod yielded a % R B G E value of 1.9 % and a BGE t ransmi t tance value of t = 0.8. The t ransmi t tance ratio tes t me thod was ap-
~0.8 /..,~_ AA=(a-1)A=0.925A / " sEt,a = 0 ,1 ,1 .925 .
( . )
~= 0.6
o e}
< 0.4
e -
~ 0.2
0.0 ,
0 .0 1.0 2 .0 Monochromatic Reference Absorbance (A)
FIa. 3B. Experimental (x) and simulated (per Eq. 4) differential absorbance vs. monochromatic reference absorbance plots for a = 1.925.
plied three t imes with the use of three dist inct concen- t ra t ion ratios (i.e., a = 1.388, 1.925, and 2.68) and gave an average % R B G E value of 2.5% _ 0.5% and an av- erage BG E t ransmi t tance value of t = 0.70 _ 0.03. The above exper imenta l results suggest tha t the R B G E was in the range of 2 to 3% and the samples ' B GE trans- mi t tance was in the range of 0.67 to 0.8. The effective R B G E value at monochromat ic absorbance A is Bt A. The t ransmi t tance ratio tes t me thod yields an average value of 0.021 for this quant i ty at A = 0.5, while the direct t ransmi t tance tes t me thod gives a corresponding value of 0.017. Quant i ta t ive methods in atomic absorpt ion spec t rophotomet ry , such as calibration curve, s tandard addit ion, and internal s tandard methods, require a linear dependence of absorbance on concentrat ion. Therefore , it is impor tan t to work in an absorbance range where background emission has a negligble (e.g., less than 5% ) influence on absorbance readings. If the average si tuat ion from the exper imenta l results above is applied to Eq. 2 (i.e., B V 7 = 0.019) then a monochromat ic absorbance of 0.5 would give an absorbance reading of 0.48. This resul t suggests that , as a rule of thumb, AAS absorbance read- ings in excess of 0.5 should not be en te r ta ined in quan- t i ta t ive methodology.
Th e t ransmi t tance ratio me thod gave R B G E and t
T A B L E II. Relative and effective background emission values based on the characteristics of the transmittance ratio experimental plots in Figs. 3A, 3B, and 3C.
Concen t ra t ion ratio
a 1.388 + 0.003 1.925 + 0.007 2.68 _+ 0.02 -log~0r 0.375 0.679 0.980 r 0.426 0.210 0.105
Relat ive background emiss ion based on Eq. 5 and r
R B G E 0.010 0.012 0.011
Numer ica l s imula t ion of the exper imenta l po in t s on the plots in Fig. 3A, 3B, and 3C via Eq. 4
t 0.70 0.67 0.72 R B G E 0.022 0.030 0.024
Effective R B G E at A~ = 0.5
~3xft 0.018 0.024 0.020
A P P L I E D S P E C T R O S C O P Y 1403
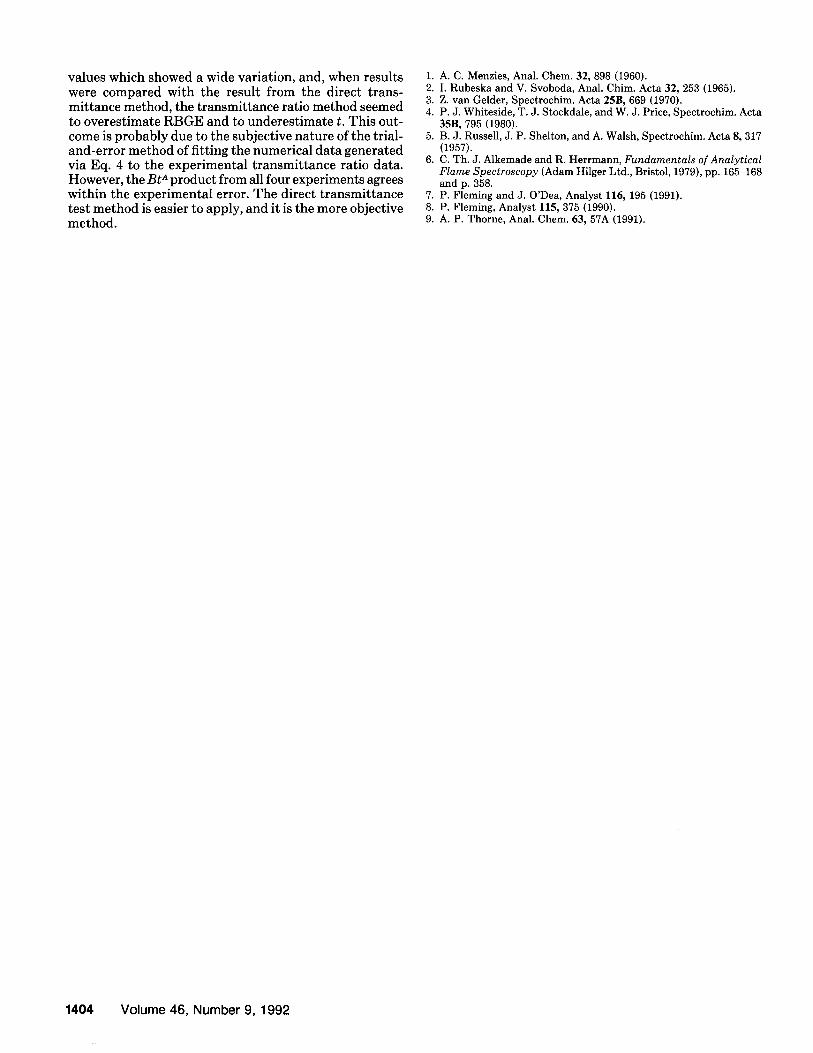
values which showed a wide variation, and, when results were compared with the result from the direct trans- mittance method, the t ransmit tance ratio method seemed to overest imate R B G E and to underes t imate t. This out- come is probably due to the subjective nature of the trial- and-error method of fitting the numerical da ta generated via Eq. 4 to the experimental t ransmit tance ratio data. However, the B t A product from all four experiments agrees within the experimental error. The direct t ransmit tance test me thod is easier to apply, and it is the more objective method.
1. A. C. Menzies, Anat. Chem. 32, 898 (1960). 2. I. Rubeska and V. Svoboda, Anal. Chim. Acta 32, 253 (1965). 3. Z. van Gelder, Spectrochim. Acta 25B, 669 (1970). 4. P. J. Whiteside, T. J. Stockdale, and W. J. Price, Spectrochim. Acta
35B, 795 (1980). 5. B. J. Russell, J. P. Shelton, and A. Walsh, Spectrochim. Acta 8, 317
(1957). 6. C. Th. J. Alkemade and R. Herrmann, Fundamentals of Analytical
Flame Spectroscopy (Adam Hilger Ltd., Bristol, 1979), pp. 165-168 and p. 358.
7. P. Fleming and J. O'Dea, Analyst ll6, 195 (1991). 8. P. Fleming, Analyst ll5, 375 (1990). 9. A. P. Thorne, Anal. Chem. 63, 57A (1991).
1404 Volume 46, Number 9, 1992