turning risk into sustainable value - … track record of solid ... since 2007 via dividends and...
TRANSCRIPT

TURNING RISK INTO
SUSTAINABLE VALUE Analysts' Conference 2011
London, 11 March 2011

Munich Re
Agenda
Turning risk into sustainable value Nikolaus von Bomhard 2
Fi i l hi hli ht 2010 Jö S h id 12Financial highlights 2010 Jörg Schneider 12
Risk management Joachim Oechslin 28
Non-life reinsurance Torsten Jeworrek 45
Life reinsurance Joachim Wenning 57
2Analysts' Conference 2011
Primary insurance Torsten Oletzky 75
Backup 97
Sound financial development allows increased dividend and continuation of share buy-back
Financial highlights 2010
Munich Re (Group)Munich Re (Group)
Net result of €2.43bn beats original target for 2010Net result of €2.43bn beats original target for 2010
Shareholders' equity further strengthened toShareholders' equity further strengthened to
High investment result
RoI of 4 5% in 2010 based
High investment result
RoI of 4 5% in 2010 based
ReinsuranceReinsurance Primary insurancePrimary insurance Munich HealthMunich Health
Consolidation processConsolidation processDespite significant claimsDespite significant claims
original target for 2010
RoRaC of 13.5%
Proposed dividend of €6.25 per share for 2010, an increase of almost 9% (prev. €5.75)
original target for 2010
RoRaC of 13.5%
Proposed dividend of €6.25 per share for 2010, an increase of almost 9% (prev. €5.75)
further strengthened to €23.0bn
Current share buy-back programme almost completed1 – will be continued with €500m
further strengthened to €23.0bn
Current share buy-back programme almost completed1 – will be continued with €500m
Positive trend confirmedPositive trend confirmed
RoI of 4.5% in 2010 based on high disposal gains –portfolio and duration management proved beneficial
RoI of 4.5% in 2010 based on high disposal gains –portfolio and duration management proved beneficial
3Analysts' Conference 2011
Consolidation process well on track
Strong premium growth and resilient operating result
Consolidation process well on track
Strong premium growth and resilient operating result
Despite significant claims, remains the foundation of earnings power
High claims burden in p-c leading to combined ratio of 100.5%
Despite significant claims, remains the foundation of earnings power
High claims burden in p-c leading to combined ratio of 100.5%
Positive trend confirmed
ERGO net income at €355m more than doubled (prev. €173m)
Positive trend confirmed
ERGO net income at €355m more than doubled (prev. €173m)
1 As at 28 February 2011; €849m completed since AGM in April 2010.
Munich Re
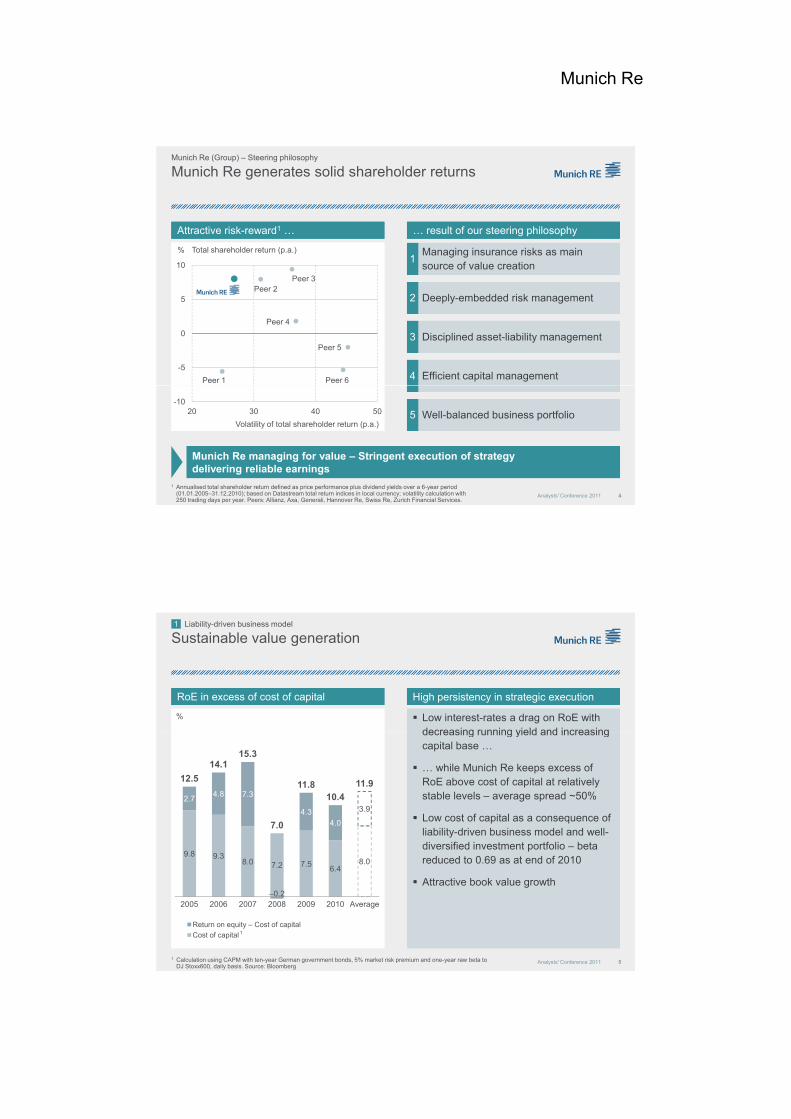
Munich Re generates solid shareholder returns Munich Re (Group) – Steering philosophy
10
Attractive risk-reward1 …Attractive risk-reward1 …
Total shareholder return (p.a.)
… result of our steering philosophy… result of our steering philosophy
Managing insurance risks as main source of value creationManaging insurance risks as main source of value creation
%1
Peer 6
Peer 3
Peer 1
Peer 4
Peer 5
Peer 2
-5
0
5
10 source of value creationsource of value creation
Efficient capital managementEfficient capital management
Deeply-embedded risk managementDeeply-embedded risk management
Disciplined asset-liability managementDisciplined asset-liability management
2
3
4
4Analysts' Conference 2011
1 Annualised total shareholder return defined as price performance plus dividend yields over a 6-year period (01.01.2005–31.12.2010); based on Datastream total return indices in local currency; volatility calculation with 250 trading days per year. Peers: Allianz, Axa, Generali, Hannover Re, Swiss Re, Zurich Financial Services.
Munich Re managing for value – Stringent execution of strategy delivering reliable earnings
-1020 30 40 50
Volatility of total shareholder return (p.a.)Well-balanced business portfolioWell-balanced business portfolio5
Sustainable value generation
RoE in excess of cost of capitalRoE in excess of cost of capital
Liability-driven business model
High persistency in strategic executionHigh persistency in strategic execution
Low interest-rates a drag on RoE with decreasing running yield and increasing
Low interest-rates a drag on RoE with decreasing running yield and increasing
1
%
9 8
2.74.8 7.3
4.34.0
3.9
12.5
14.115.3
7.0
11.810.4
11.9
decreasing running yield and increasing capital base …
… while Munich Re keeps excess of RoE above cost of capital at relatively stable levels – average spread ~50%
Low cost of capital as a consequence of liability-driven business model and well-diversified investment portfolio – beta
decreasing running yield and increasing capital base …
… while Munich Re keeps excess of RoE above cost of capital at relatively stable levels – average spread ~50%
Low cost of capital as a consequence of liability-driven business model and well-diversified investment portfolio – beta
5Analysts' Conference 2011
9.8 9.38.0 7.2 7.5
6.48.0
–0.22005 2006 2007 2008 2009 2010 Average
Return on equity – Cost of capital
Cost of capital
1 Calculation using CAPM with ten-year German government bonds, 5% market risk premium and one-year raw beta to DJ Stoxx600, daily basis. Source: Bloomberg
reduced to 0.69 as at end of 2010
Attractive book value growth
reduced to 0.69 as at end of 2010
Attractive book value growth
1

Munich Re
Sovereign debt crisis – Increased volatilitySovereign debt crisis – Increased volatility
Capturing major events in Munich Re's risk management framework
Risk management topics in 2010Risk management topics in 2010 Impact on Munich Re’s risk managementImpact on Munich Re’s risk management
Spread Risk-free FX volatility
Duration lengthening to reduce asset-liability mismatch risk in primary life
Duration lengthening to reduce asset-liability mismatch risk in primary life
Risk management2
Natural catastrophes – Severe events in 2010Natural catastrophes – Severe events in 2010
Spread peripheral countries
Risk-free interest-rates
FX volatility, especially USD
Earthquake Chile
Earthquake New Zealand
Flood Australia
p y
Focus on German and US government bonds with digestible exposure in peripheral countries
p y
Focus on German and US government bonds with digestible exposure in peripheral countries
Chile represents about 1-in-250-year loss event
Events well-captured in Munich Re risk model
Chile represents about 1-in-250-year loss event
Events well-captured in Munich Re risk model
Enhancement of well-established credit risk framework by introducing sovereign risk limits
Case by case evaluation if new insights from major events could further refine our models
6Analysts' Conference 2011
Risk-bearing capacity remains strong and controlled
Solvency II – Current statusSolvency II – Current status
Conduct of QIS5
Implementing measures drafted
Pre-application process
Further progress in the pre-application process
First Solvency II triggered business already part of 2011 renewals
Further progress in the pre-application process
First Solvency II triggered business already part of 2011 renewals
Munich Re well positioned
Strategic decision to maintain a moderate risk profile for the investment portfolio
Investment topics 2011Investment topics 2011 Risk management impulsesRisk management impulses
Assessing sensitivity of global macro-economic
Assessing sensitivity of global macro-economic
Investment decisionsInvestment decisions
Slight duration decrease in reinsurance while keeping
Slight duration decrease in reinsurance while keeping
Disciplined asset-liability management3
global macro economic drivers simultaneously on the asset and liability side
Market risk: Low interest-rates remaining the main challenge for primary life business with policyholder guarantees
Credit risk: Setting counterparty and
global macro economic drivers simultaneously on the asset and liability side
Market risk: Low interest-rates remaining the main challenge for primary life business with policyholder guarantees
Credit risk: Setting counterparty and
Sovereign risk
Interest-rates
Currency Inflation
reinsurance while keeping the asset-liability-mismatch tight
Continuation of swaptionprogramme in primary life
Moderate re-risking also seen as a mitigating factor in an inflation scenario
Further diversification of sovereign exposure
reinsurance while keeping the asset-liability-mismatch tight
Continuation of swaptionprogramme in primary life
Moderate re-risking also seen as a mitigating factor in an inflation scenario
Further diversification of sovereign exposure
7Analysts' Conference 2011
counterparty and sovereign risk limitscounterparty and sovereign risk limits
Considering a variety of possible capital market scenarios
Considering a variety of possible capital market scenarios
Holistic risk assessment with strict setting of risk limitsHolistic risk assessment with strict setting of risk limits
Good track record of solid returns within tight risk framework
Good track record of solid returns within tight risk framework
Broad diversification remains key as Munich Re is well-prepared for different capital market scenarios
g pg p

Munich Re
Capital repatriation: We have delivered on our promise
Active capital management1 …Active capital management1 … … integral part of our financial strategy… integral part of our financial strategy
Capital repatriation of more than €10bn3
since 2007 via dividends and share buy- Capital repatriation of more than €10bn3
since 2007 via dividends and share buy-
Efficient capital management4
3.3 4.7 11.8 10.4 7.3 11.5
Cash yield2 (%)
since 2007 via dividends and share buybacks, delivering on our promise of the Changing Gear programme
Safeguarding an efficient use of capital, still allowing for growth and risk appetite
Sustaining high underwriting discipline –capital management and cycle management go hand in hand
Dividend is our strong commitment, whereas share buy-backs are considered
€m
250
2,303
1,387
406
1,300
1,238
3,427
2,460
1,478
2,418
Share buy-backDividend
3.3 4.7 11.8 10.4 7.3 11.5
8Analysts' Conference 2011
Changing Gear programme 2007 – 2010
ya flexible tool
Proposed dividend of €6.25 per share for 2010, an increase of almost 9%. Share buy-back to be continued with €500m
ya flexible tool
Proposed dividend of €6.25 per share for 2010, an increase of almost 9%. Share buy-back to be continued with €500m
1 Dividend refers to calendar year, actual cash flow is in the subsequent year. In 2010, dividend payout estimate based on €6.25 dividend per share and assuming completed share-buy-back until AGM 2011. 2 Total payout (dividend and buy-back) divided by average market capitalisation. 3 Incl. assumed €350m outstanding share buy-back until AGM 2011.
High cash payout to remain a cornerstone of Munich Re’s active capital management
707988 1,124 1,073 1,072 1,118
250707
2005 2006 2007 2008 2009 2010
Portfolio of complementary profiles providing strategic flexibilityPortfolio of complementary profiles providing strategic flexibility
Well-balanced business portfolio5
Striking the balance between capital generation and redeployment
B i d l t
… enabling profitable growth… enabling profitable growthStrong bottom-line focus …Strong bottom-line focus …
Hi h i t bilit Business developmentHigh earnings stability
Performance improvement
P-C reinsurance business –diversification and innovation at workP-C reinsurance business –diversification and innovation at work
Primary p-c business – strong contributor to ERGO’s overall performancePrimary p-c business – strong contributor to ERGO’s overall performance
Re-positioning of primary life business in GermanyRe-positioning of primary life business in Germany
Life reinsurance – leveraging our know-how in attractive target marketsLife reinsurance – leveraging our know-how in attractive target markets
Munich Health – seizing opportunities as integrated health risk managerMunich Health – seizing opportunities as integrated health risk manager
ERGO International – cautious expansion in CEE and AsiaERGO International – cautious expansion in CEE and Asia
9Analysts' Conference 2011
Munich Re running a well-balanced business portfolio allowing development of long-term growth opportunities
Focus on organic growth while considering bolt-on acquisitionsFocus on organic growth while considering bolt-on acquisitions
Generating sustainable returns remains the foundation of capital repatriationGenerating sustainable returns remains the foundation of capital repatriation

Munich Re
Risk capacityand know-how
Distribution power and process efficiency
Providing the best solution for each risk categoryProviding the best solution for each risk category
Well-balanced business portfolio5
Liability-driven strategy facilitating diversification and predictable results
Shaping diverging market trends with sharpened value proposition
Strict cycle and portfolio management in commodity business …
… while leveraging underwriting expertise and customer proximity in know-how intensive business
Shaping diverging market trends with sharpened value proposition
Strict cycle and portfolio management in commodity business …
… while leveraging underwriting expertise and customer proximity in know-how intensive business
Global health markets growing above GDP providing ample opportunities for a specialised risk manager
MH making good progress on consolidation path in 2010 …
… pursuing a transition towards managed care in the US by
i i Wi d H l h
Global health markets growing above GDP providing ample opportunities for a specialised risk manager
MH making good progress on consolidation path in 2010 …
… pursuing a transition towards managed care in the US by
i i Wi d H l h
Introduction of new ERGO brand creating momentum
While the profitability of the domestic p-c business keeps outperforming competitors …
… life performs below ambitions but ERGO is consistently addressing the challenges of the business
Introduction of new ERGO brand creating momentum
While the profitability of the domestic p-c business keeps outperforming competitors …
… life performs below ambitions but ERGO is consistently addressing the challenges of the business
ReinsuranceReinsurance Munich HealthMunich Health Primary insurancePrimary insurance
10Analysts' Conference 2011
Munich Re offering a value-adding integrated business model
Continued growth in life based on biometric expertise and structuring competence
Continued growth in life based on biometric expertise and structuring competence
acquiring Windsor Health
Flexible use of primary and reinsurance facilitates growth
acquiring Windsor Health
Flexible use of primary and reinsurance facilitates growth
International expansion with strong focus on improving profitability
International expansion with strong focus on improving profitability
Well-set to perform in any market conditions
Flexible business model covering health risk value chain
Emphasis on accelerating ERGO’s positive earnings trend
Turning risk into sustainable value
Munich Re (Group)Munich Re (Group)
Outlook
CAPITAL REPATRIATION
Proposed dividend of €6 25 per share
CAPITAL REPATRIATION
Proposed dividend of €6 25 per share
RORAC
Target of 15% after tax over-the-cycle to
RORAC
Target of 15% after tax over-the-cycle to
ReinsuranceReinsurance Primary insurancePrimary insurance Munich HealthMunich Health
RETURN ON INVESTMENT
< 4.0%
RETURN ON INVESTMENT
< 4.0%
GROSS PREMIUMS WRITTEN
€46–48bn2
GROSS PREMIUMS WRITTEN
€46–48bn2
NET INCOME
~€2.4bn
NET INCOME
~€2.4bn
Proposed dividend of €6.25 per share (prev. €5.75)
Continuation of share buy-back programme of up to €500m1
Proposed dividend of €6.25 per share (prev. €5.75)
Continuation of share buy-back programme of up to €500m1
Target of 15% after tax over the cycle to stand – remains a real challenge given the low-yield environment, while well-balanced business and investment portfolio stabilises profitability
Target of 15% after tax over the cycle to stand – remains a real challenge given the low-yield environment, while well-balanced business and investment portfolio stabilises profitability
1
11Analysts' Conference 2011
COMBINED RATIO P-C
~97% over-the-cycle
COMBINED RATIO P-C
~97% over-the-cycle
COMBINED RATIO P-C
< 95%
COMBINED RATIO P-C
< 95%Positive earnings contribution while concluding consolidation phase
Positive earnings contribution while concluding consolidation phase
1 Full execution remains subject to developments in the capital markets and the general economic environment. 2 Thereof €24–25bn in reinsurance, €17–18bn in primary insurance and ~€6bn in Munich Health (all on basis of segmental figures).
11
1
Against the backdrop of major claims burdens in the first two months of 2011 only achievable, if random large losses remain below our expectation over the rest of the year. Against the backdrop of major claims burdens in the first two months of 2011 only achievable, if random large losses remain below our expectation over the rest of the year.

Munich Re
Agenda
Turning risk into sustainable value Nikolaus von Bomhard
Fi i l hi hli ht 2010 Jö S h idFinancial highlights 2010 Jörg Schneider
Risk management Joachim Oechslin
Non-life reinsurance Torsten Jeworrek
Life reinsurance Joachim Wenning
12Analysts' Conference 2011
Primary insurance Torsten Oletzky
Backup
€m
GROUP
Gross premiums writtenGROUP
Gross premiums written
Resilient earnings based on prudent business and financial management
Overview – Financial highlights 2010
GROUP
Consolidated resultGROUP
Consolidated resultGROUP
Operating resultGROUP
Operating result
€m€m
MUNICH HEALTH
Consolidated resultMUNICH HEALTH
Consolidated resultPRIMARY INSURANCE
Consolidated resultPRIMARY INSURANCE
Consolidated resultREINSURANCE
Consolidated resultREINSURANCE
Consolidated result
Q1–42009
41,423
Q1–42010
45,541
Q1–42009
2,564
Q1–42010
2,430
Q1–42009
4,721
Q1–42010
3,978
Organic growth in addition to positive FX effects
High investment result mitigates impact of claims activity
Almost emulating the strong prior year result
13Analysts' Conference 2011
€m
Q1–42009
27
Q1–42010
63
€m
Q1–42009
2,576
Q1–42010
2,099
€m
Q1–42009
367
Q1–42010
656
Above-average nat cat claims, reserve strengthening in life re
Good progress – 2009 burdened by Sterling goodwill impairment
All segments with increased net income – ERGO result €355m

Munich Re
Increase in shareholders' equity despite more than€2.3bn capital repatriation
Munich Re (Group) – Capitalisation
€m Q1–4 Change Q4
Equity 31.12.2009 22,278 –
Consolidated result 2 430 475Consolidated result 2,430 475
Changes
Dividend –1,072 –
Unrealised gains/losses1 130 –1,497
Exchange rates 645 240
Share buy-backs –1,268 –258
14Analysts' Conference 2011
Unrealised gains/losses High unrealised gains in Q1–3 2010 absorbed by sharp yield increase in Q4
Unrealised gains/losses High unrealised gains in Q1–3 2010 absorbed by sharp yield increase in Q4
Exchange ratesPositive FX development (mainly US$, Can$, A$)
Exchange ratesPositive FX development (mainly US$, Can$, A$)
Share buy-backsUntil 28 February 2011, shares for further €200m were repurchased
Share buy-backsUntil 28 February 2011, shares for further €200m were repurchased
Other –115 –68
Equity 31.12.2010 23,028 –1,108
1 On other securities: Q1–4 2010, thereof –€206m from afs fixed-interest securities, €326m from afs non-fixed-interest securities; Q4 2010, thereof –€1,725m from afs fixed-interest securities, €216m from afs non-fixed-interest securities.
Munich Re (Group)Munich Re (Group)
Strong capital base maintained Munich Re (Group) – Capitalisation
Sound capitalisation according to all capital measures (regulatory, rating, internal model)Sound capitalisation according to all capital measures (regulatory, rating, internal model)
120
140
160CAGR1: 9.0%
Book value per share –Substantial growthBook value per share –Substantial growth
Financial solidity –External evidenceFinancial solidity –External evidence
Financial strength –High securityFinancial strength –High security
150
200
250
300 1.2
1.0
0.8
0.610x
15x
20x
25x 25%
20%
15%
10%
147.9
126.3
CDS spread Beta€
15Analysts' Conference 2011
1 31.12.2004 – 31.12.2010.2 Raw beta to DJ Stoxx 600, total return, daily basis, 1-year.3 Earnings before interest expenses, tax and depreciation divided by finance costs. 4 Strategic debt divided by total capital (= sum of strategic debt + shareholders' equity).
All subordinated bonds treated as strategic debt.
80
100
BV/share (plus dividend/share buy-back)BV/share
2005 2006 2007 2008 2009 20100
50
100
2007 2008 2009 2010
0.4
0.2
0
(31.12.2010: 0.69)(31.12.2010: 58)
0x
5x
10x
Interest coverageDebt leverage
10%
5%
0%2009 2010
CAGR: 6.2%
Beta2
CDS spread4
3 (31.12.2010: 12.8x)(31.12.2010: 19.0%)

Munich Re
Strong organic growth in life reinsurance and Munich Health in addition to positive FX contribution
Munich Re (Group) – Premium development
€m
Gross premiums written Q1–4 2009
41,423
Foreign exchange
Positive FX development (mainly US$, Can$, A$)
HSB acquisition: Fi t ti lid ti
Positive FX development (mainly US$, Can$, A$)
HSB acquisition: Fi t ti lid ti
Breakdown by segment
ReinsuranceProperty-casualty15 377 (34%)
Primary insuranceProperty-casualty
5 459 (12%)
Foreign-exchange effects
1,998
Divestment/ Investment
149
Organic change 1,971
Gross premiums written Q1–4 2010
45,541
First-time consolidation as from Q2 2009
Large-volume deals predominately included as from Q2 2009
ERGO: Organic growth in all segments
First-time consolidation as from Q2 2009
Large-volume deals predominately included as from Q2 2009
ERGO: Organic growth in all segments
16Analysts' Conference 2011
(consolidated) 15,377 (34%) (▲ 4.8%)
5,459 (12%)(▲ 7.4%)
ReinsuranceLife: 7,766 (17%) (▲ 20.8%)
Munich Health4,962 (11%) (▲ 31.4%)
Primary insuranceLife: 6,484 (14%)
(▲ 3.0%)
Primary insurance Health Germany: 5,493 (12%)
(▲ 6.4%)
Large-volume deals in addition to favourable FX driving significant premium increase
Munich Re (Group) – Munich Health – Premium development
€m
Gross premiums written Q1–4 2009 3,974
Foreign exchange
Positive currency contribution, especially Can$
Positive currency contribution, especially Can$
Breakdown by segment
Foreign-exchange effects 362
Divestment/ Investment 0
Organic change 804
Gross premiums written Q1–4 2010 5,140
Primary insurance1,925 (37%)
Reinsurance3,215 (63%)
North America53% (52%)
Middle East/Africa4% (5%)
Organic growth owing to large-volume deals in North America and Asia
Organic growth owing to large-volume deals in North America and Asia
17Analysts' Conference 2011
(segmental, not consolidated)
( )(▲ 9.1%)
( )(▲45.5%)
( )
Southern Europe/ Latin America13% (16%)
( )
Northern Europe/
Central Europe23% (24%)
Asia/Pacific7% (3%)

Munich Re
Resilient result based on improved business development
Large-volume deals with overall positive bottom-line effect
Increase of technical result due to better
Large-volume deals with overall positive bottom-line effect
Increase of technical result due to better
€m Q1–4 2010
Q1–42009
Gross premiums written 5,140 3,974
Munich Health – Financial overview
Increase of technical result due to better combined ratio of the entire US business and overall result improvement of European primary insurers
Investment result still on a high level due to disposal gains; previous year influenced by one-off effect (sale of equities mainly in the second half of 2009)
Income from technicalinterest
88 83
Net expenses for claimsand benefits
3,998 3,129
Net operating expenses 1,068 726
Technical result 69 54
Investment result 142 151
18Analysts' Conference 2011
half of 2009)
Previous year’s consolidated result strained by Sterling goodwill impairment
half of 2009)
Previous year’s consolidated result strained by Sterling goodwill impairment
Non-technical result 62 79
Operating result 131 133
Consolidated result 63 27
Reinsurance, see separate presentationReinsurance, see separate presentation Primary insurance, see separate presentationPrimary insurance, see separate presentation
Active asset management on the basis of a well-diversified investment portfolio
Investment portfolio1Investment portfolio1 Active portfolio management in 2010Active portfolio management in 2010
Munich Re (Group) – Investments – Total portfolio
Slight duration lengthening
R d i t d b k b d
Slight duration lengthening
R d i t d b k b d
Miscellaneous2
9.7% (8 3%)Land and buildings
2.9% (3 0%) Reducing corporate and bank bonds
Further improving geographic diversification
Increase of economic equity exposure to 4.4%
Increase in "Miscellaneous" mainly resulting from higher cash deposits
Reducing corporate and bank bonds
Further improving geographic diversification
Increase of economic equity exposure to 4.4%
Increase in "Miscellaneous" mainly resulting from higher cash deposits
9.7% (8.3%) 2.9% (3.0%)
Shares, equity funds and participating interests3
4.0% (2.8%)
TOTAL
€196bn
Loans25.7% (25.9%)
19Analysts' Conference 2011
1 Fair values as at 31.12.2010 (31.12.2009). 2 Deposits retained on assumed reinsurance, investments for unit-linked life, deposits with banks, investment funds (bond, property) and derivatives held for trading with non-fixed-interest underlying. 3 Exposure including derivatives: 4.4% (2.8%). 4 Categories "available for sale", "held to maturity" and "at fair value".
Fixed-interest securities4
57.7% (60.0%)

Munich Re
Emphasis on highly rated securities
Fixed-income portfolio1Fixed-income portfolio1 Governments per country2Governments per country2
Loans to policyholders/Mortgage loans3% (4%)
%Without P/H4
participationWith P/H4
participationTotal
Munich Re (Group) – Investments – Fixed-income portfolio
Structured products 4% (3%)
Corporates9% (10%)
Banks 9% (11%)Thereof 39% cash positions TOTAL
€169bn
Government/Semi-government2
47% (44%)
% Without P/H4 With P/H4 Total
Germany 7 24 31
USA 16 0 16
Canada 7 0 7
UK 5 1 6
France 4 2 6
Austria 1 2 3
Other 11 6 17
Total3 51% 35% 86%
20Analysts' Conference 2011
Pfandbriefe/Covered bonds28% (28%)
participation participation
Italy 5 2 7
Greece 0 1 1
Spain 1 2 3
Ireland 1 1 2
Portugal 0 1 1
Total3 7% 7% 14%
1 Incl. loans, parts of other securities, other investments and cash positions. Fair values as at 31.12.2010 (31.12.2009). 2 Thereof 9% inflation-linked bonds. 3 Differences between totals possible due to rounding.
4 P/H = policyholder. Economic view – not fully comparable with IFRS figures. As at 31 December 2010.
Substantially increased investment result driven by beneficial investment decisions
Munich Re (Group) – Investment result
€m Q1–4 2010 Return1 €m Q1–4 2009 Return1
Regular income 7 749 4.0% 7,629 4.2%
Investment resultInvestment result
Regular income 7,749 4.0% 7,629 4.2%
Write-ups/write-downs of investments –403 –0.2% –1,122 –0.6%
Gains/losses on the disposal of investments 1,649 0.9% 1,612 0.9%
Other income/expenses –353 –0.2% –236 –0.2%
Investment result 8,642 4.5% 7,883 4.3%
Regular incomeHigher asset base as well as cautious investment in credit-exposed fixed-interest securities and better Regular incomeHigher asset base as well as cautious investment in credit-exposed fixed-interest securities and better
21Analysts' Conference 2011
result from associated companies
Write-ups/write-downs Strongly improved result from derivatives, mainly due to swaptions and lower impairments of non-fixed-interest securities – previous year impacted by high write-downs of fixed-interest securities
Gains on disposalHigh level sustained as a result of the sale of corporate and government bonds, gains from equities
1 Return on quarterly weighted investments (market values) in % p.a.

Munich Re
Reserves – Reinsurance property-casualty
Our set-up for reserving responsibility has proved successful
Global Underwriting and Risk CommitteeGlobal Underwriting and Risk Committee
Chief Financial Officer(Reinsurance)Chief Financial Officer(Reinsurance)
Reinsurance CommitteeReinsurance Committee
Group CommitteeGroup Committee Chief Financial Officer(Group)Chief Financial Officer(Group)
Central ReservingMunich Re Munich
Local reserving actuaries
reinsurance and primary
Head of Central ReservingHead of Central Reserving
Feedback and review Analysis
Actuarial
Actuarialprocess
Peer reviews, feedback of evaluations
22Analysts' Conference 2011
Actuarial assessment
Group reserving approach
Immediate response to adverse developments Immediate response to adverse developments
Actual versus expected analysis, reserve review results
Signs of positive developments are viewed prudentlySigns of positive developments are viewed prudently
In-depth communication of analysis to avoid false feedback into pricingIn-depth communication of analysis to avoid false feedback into pricing
Actual versus expected comparison –An important input to the actuarial analysis
Reserves – Reinsurance property-casualty
Comparison of incremental expected losses with actual losses reported by clients in CY 2010Comparison of incremental expected losses with actual losses reported by clients in CY 2010
Reinsurance per exposure year1Reinsurance per exposure year1 Reinsurance per line of business1Reinsurance per line of business1
20012002
20032004
2005
20062007
2008
2009
100
1,000
10,000
2000 and prior
Actual reported loss, €m
Motor
Third-party liability
Personal accident
Property
Marine
Credit
1,000
10,000Actual reported loss, €m
23Analysts' Conference 2011
Green Actual below expectation Solid line Actual equal expectation Red Actual above expectation Dotted line Actual are 50% above/below expectations
1 Munich Re reinsurance Group losses as per Q4 2010, not including parts of Munich Re Risk Solutions, special liabilities and major losses (i.e. events over €10m or $15m for Munich Re share). The statistics cover more than 80% of total calendar-year reported losses.
Actual loss development in CY 2010 was consistently below actuarial expectations across all years and lines of business
1010 100 1,000 10,000
Expected reported loss, €m
100100 1,000 10,000
Expected reported loss, €m

Munich Re
Prudent reserving approach protects solid balance sheet
Consistently better than expected claims emergence in all main classes of business
Continuation of elevated claims reporting activity in US asbestos and environmental claims
Consistently better than expected claims emergence in all main classes of business
Continuation of elevated claims reporting activity in US asbestos and environmental claims
Reserves – Reinsurance property-casualty
Indications of reserve reviewIndications of reserve review
Continuation of elevated claims reporting activity in US asbestos and environmental claims Continuation of elevated claims reporting activity in US asbestos and environmental claims
Response to the claims emergence in asbestos and environmental:
Response to the claims emergence in asbestos and environmental:
Cautious response to the favourableindications from accident years
Cautious response to the favourableindications from accident years
Release of reserves for the shorter-tail lines in accident years 2004–2006
Release of reserves for the shorter-tail lines in accident years 2004–2006
Due to the immaturity of accident years 2007–2009,
Due to the immaturity of accident years 2007–2009,
Response to these indications in line with our prudent reserving approach Response to these indications in line with our prudent reserving approach
24Analysts' Conference 2011
Reserve strengthening for accident years 2000 and prior
Reserve strengthening for accident years 2000 and prior
y2001–2003, as these mostly relate to long-tail lines of business
y2001–2003, as these mostly relate to long-tail lines of business
ydue to strong positive indications
ydue to strong positive indications
,reserving levels were broadly maintained despite favourablerun-off indications
,reserving levels were broadly maintained despite favourablerun-off indications
Further strengthening of confidence level to absorb potential future volatility –Reserve review leads to moderately positive run-off result
All figures in €m (adjusted to exchange rates as at 31.12.2010)
Accident year
Date ≤2000 2001 2002 2003 2004 2005 2006 2007 2008 2009 2010 Total
Ultimate reduction of €610m in calendar year 2010 (including €81m
Ultimate reduction of €610m in calendar year 2010 (including €81m
Prior-year ultimate losses developed favourably in 2010Reserves – Property-casualty – Group
31.12.2000 29,167
31.12.2001 30,386 11,377
31.12.2002 32,301 12,556 13,340
31.12.2003 33,034 13,120 12,746 12,293
31.12.2004 33,645 13,040 13,006 11,891 11,514
31.12.2005 35,753 13,253 11,772 11,140 11,561 12,504
31.12.2006 36,161 13,329 11,688 11,024 11,548 12,491 10,811
31.12.2007 36,986 13,246 11,678 10,703 11,402 12,533 10,663 11,900
(including –€81m workers compen-sation accretion) corresponds to 1.6% of prior year's p-c reserves (Munich Re Group)
Split of €610m
(including –€81m workers compen-sation accretion) corresponds to 1.6% of prior year's p-c reserves (Munich Re Group)
Split of €610m
25Analysts' Conference 2011
31.12.2008 37,316 13,307 11,680 10,544 11,012 12,250 10,542 12,162 12,903
31.12.2009 37,478 13,124 11,682 10,476 10,700 12,230 10,404 12,038 13,172 12,874
31.12.2010 37,967 13,098 11,660 10,462 10,431 11,800 10,147 12,018 13,148 12,836 13,375
CY 2010 run-off € change
–489 26 22 13 268 429 257 20 24 38 n/a 610 1
CY 2010 run-off % change2 –1.3 0.2 0.2 0.1 2.5 3.5 2.5 0.2 0.2 0.3 n/a 0.4
prun-off result: reinsurance€389m andprimary insurance €221m
prun-off result: reinsurance€389m andprimary insurance €221m
1 Incl. –€81m of workers' compensation accretion.2 Compared to estimated ultimate losses at 31.12.2009.
Munich Re
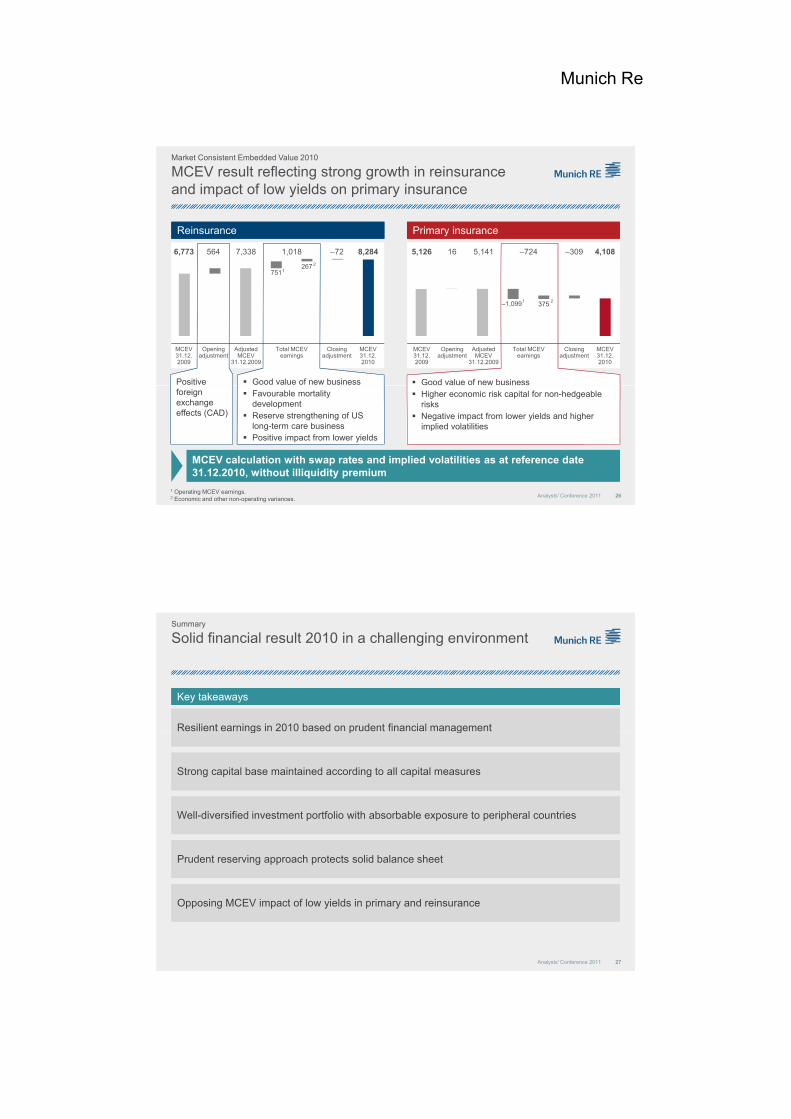
6,773 564 7,338 1,018 –72 8,284
Market Consistent Embedded Value 2010
MCEV result reflecting strong growth in reinsurance and impact of low yields on primary insurance
5,126 16 5,141 –724 –309 4,108
267
ReinsuranceReinsurance Primary insurancePrimary insurance
2
MCEV 31.12.2009
Opening adjustment
Adjusted MCEV
31.12.2009
Total MCEV earnings
Closing adjustment
MCEV 31.12.2010
MCEV 31.12.2009
Opening adjustment
Adjusted MCEV
31.12.2009
Total MCEV earnings
Closing adjustment
MCEV 31.12.2010
267751
375–1,099
Good value of new business Good value of new business
1
Positive Positive Good value of new business Good value of new business
1 2
26Analysts' Conference 2011
MCEV calculation with swap rates and implied volatilities as at reference date 31.12.2010, without illiquidity premium
Favourable mortality development
Reserve strengthening of US long-term care business
Positive impact from lower yields
Favourable mortality development
Reserve strengthening of US long-term care business
Positive impact from lower yields
1 Operating MCEV earnings.2 Economic and other non-operating variances.
foreign exchange effects (CAD)
foreign exchange effects (CAD)
Higher economic risk capital for non-hedgeablerisks
Negative impact from lower yields and higher implied volatilities
Higher economic risk capital for non-hedgeablerisks
Negative impact from lower yields and higher implied volatilities
Resilient earnings in 2010 based on prudent financial managementResilient earnings in 2010 based on prudent financial management
Solid financial result 2010 in a challenging environmentSummary
Key takeawaysKey takeaways
g p gg p g
Well-diversified investment portfolio with absorbable exposure to peripheral countriesWell-diversified investment portfolio with absorbable exposure to peripheral countries
Strong capital base maintained according to all capital measures Strong capital base maintained according to all capital measures
27Analysts' Conference 2011
Prudent reserving approach protects solid balance sheetPrudent reserving approach protects solid balance sheet
Opposing MCEV impact of low yields in primary and reinsuranceOpposing MCEV impact of low yields in primary and reinsurance
Munich Re
Agenda
Turning risk into sustainable value Nikolaus von Bomhard
Fi i l hi hli ht 2010 Jö S h idFinancial highlights 2010 Jörg Schneider
Risk management Joachim Oechslin
Non-life reinsurance Torsten Jeworrek
Life reinsurance Joachim Wenning
28Analysts' Conference 2011
Primary insurance Torsten Oletzky
Backup
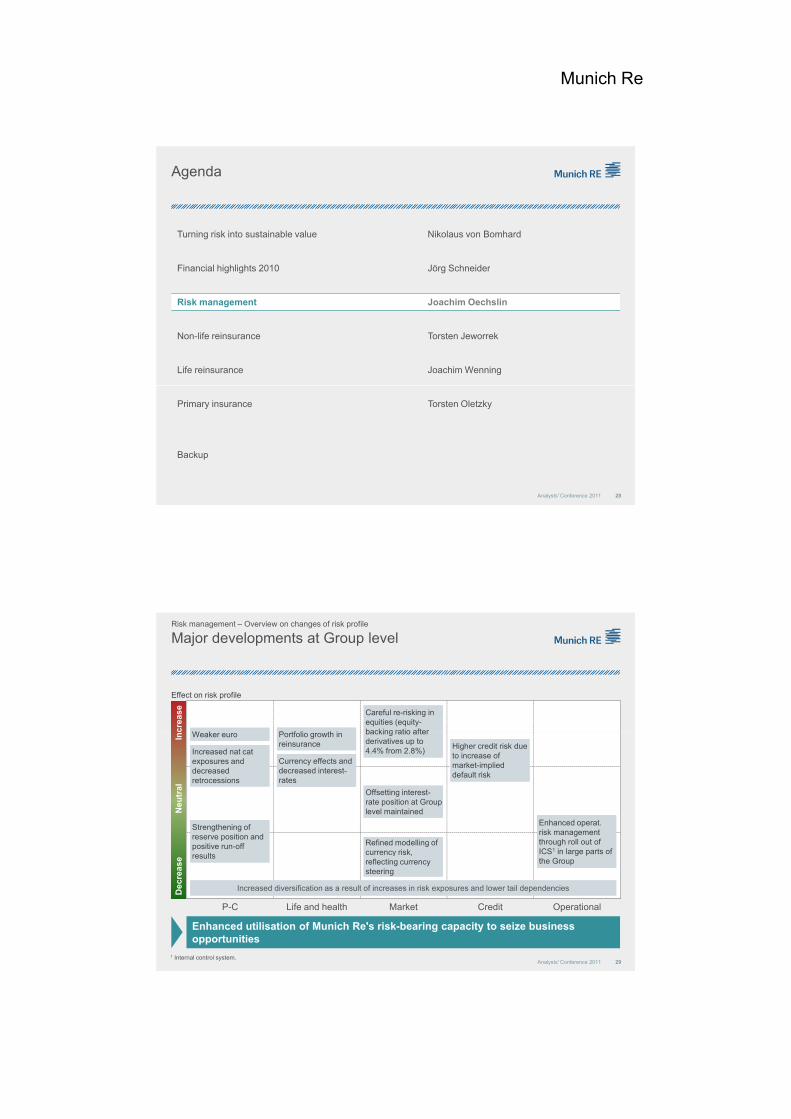
Effect on risk profile
crea
se
Major developments at Group levelRisk management – Overview on changes of risk profile
P tf li th iP tf li th i
Careful re-risking in equities (equity-backing ratio after
Careful re-risking in equities (equity-backing ratio afterW kW k
Neu
tral
In
Increased nat cat exposures and decreased retrocessions
Increased nat cat exposures and decreased retrocessions
Portfolio growth in reinsurance Portfolio growth in reinsurance
backing ratio after derivatives up to 4.4% from 2.8%)
backing ratio after derivatives up to 4.4% from 2.8%)
Offsetting interest-rate position at Group level maintained
Offsetting interest-rate position at Group level maintained
Higher credit risk due to increase of market-implied default risk
Higher credit risk due to increase of market-implied default risk
Enhanced operat. risk management through roll out of ICS1 in large parts of
Enhanced operat. risk management through roll out of ICS1 in large parts of
Strengthening of reserve position and positive run-off
Strengthening of reserve position and positive run-off Refined modelling of
currency riskRefined modelling of currency risk
Currency effects and decreased interest-rates
Currency effects and decreased interest-rates
Weaker euroWeaker euro
29Analysts' Conference 2011
P-C Life and health Market Credit Operational
Dec
reas
e ICS in large parts of
the GroupICS in large parts of the Group
Increased diversification as a result of increases in risk exposures and lower tail dependenciesIncreased diversification as a result of increases in risk exposures and lower tail dependencies
Enhanced utilisation of Munich Re's risk-bearing capacity to seize business opportunities
resultsresults currency risk, reflecting currency steering
currency risk, reflecting currency steering
1 Internal control system.

Munich Re
Major achievements in Munich Re's ERM
Organisational upgradeOrganisational upgrade
New ERGO CFO with proven track record in risk New ERGO CFO with proven
track record in risk Process for pre-application
of internal model was started Process for pre-application
of internal model was started
Solvency II pre-applicationSolvency II pre-application
Risk management – Major achievements in Munich Re's ERM
Internal control systemInternal control system
Comprehensive internal control framework for Munich Comprehensive internal
control framework for Munich management along with an enhanced organisational set-up
Further strengthening of local risk management hubs notably for North American p-c and life business and London-based entities
Strengthening of risk controls
management along with an enhanced organisational set-up
Further strengthening of local risk management hubs notably for North American p-c and life business and London-based entities
Strengthening of risk controls
early in 2009
Thorough on-site visits from BaFin ("Örtliche Prüfung") have been made by experienced teams in 2009 and 2010 and will continue in 2011
Supervisory college involved in pre-application process
early in 2009
Thorough on-site visits from BaFin ("Örtliche Prüfung") have been made by experienced teams in 2009 and 2010 and will continue in 2011
Supervisory college involved in pre-application process
Re Group adopted in 2008
Framework implemented and operationalised in ~80% of our business at year-end 2010
Considerable improvement of Munich Re’s internal risk control landscape and further strengthening of our risk culture
Re Group adopted in 2008
Framework implemented and operationalised in ~80% of our business at year-end 2010
Considerable improvement of Munich Re’s internal risk control landscape and further strengthening of our risk culture
30Analysts' Conference 2011
g gfor credit and variable annuity business
g gfor credit and variable annuity business
p pp pp pp p
Progress complements Munich Re's Enterprise Risk Management at a high level
Business-enabling and improving the risk/return profile
New oil spill cover
Deepwater Horizon case expected to lead to
New oil spill cover
Deepwater Horizon case expected to lead to
Business opportunitiesBusiness opportunities Risk management involvementRisk management involvement
Risk management – Risk management at work
Comprehensive risk assessment by Corporate Underwriting
Comprehensive risk assessment by Corporate UnderwritingDeepwater Horizon case expected to lead to
demand for additional liability cover with attractive margin
Deepwater Horizon case expected to lead to demand for additional liability cover with attractive margin
2011 l i l d S l II t i d2011 l i l d S l II t i d
Munich Re able to use competitive advantage to offer complex structured reinsurance solutions, especially in life reinsurance
Munich Re able to use competitive advantage to offer complex structured reinsurance solutions, especially in life reinsurance
g
In-depth cooperation with business units
Complementing risk strategy with an explicit risk appetite for oil spill liability risks
g
In-depth cooperation with business units
Complementing risk strategy with an explicit risk appetite for oil spill liability risks
Comprehensive risk assessment
In-depth assessment at Board level
Structuring of transactions reflective of original risk concerns
Comprehensive risk assessment
In-depth assessment at Board level
Structuring of transactions reflective of original risk concerns
Cl ti ith li t tCl ti ith li t t
31Analysts' Conference 2011
2011 renewals include Solvency II-triggered business for the first time (more than €50m premium volume)
2011 renewals include Solvency II-triggered business for the first time (more than €50m premium volume)
Business-enabling using expertise from deeply embedded risk management
Close cooperation with client management and underwriting
Identification of solutions optimising clients’ risk capital relief under Solvency II
External and internal training and seminars
Close cooperation with client management and underwriting
Identification of solutions optimising clients’ risk capital relief under Solvency II
External and internal training and seminars
Munich Re
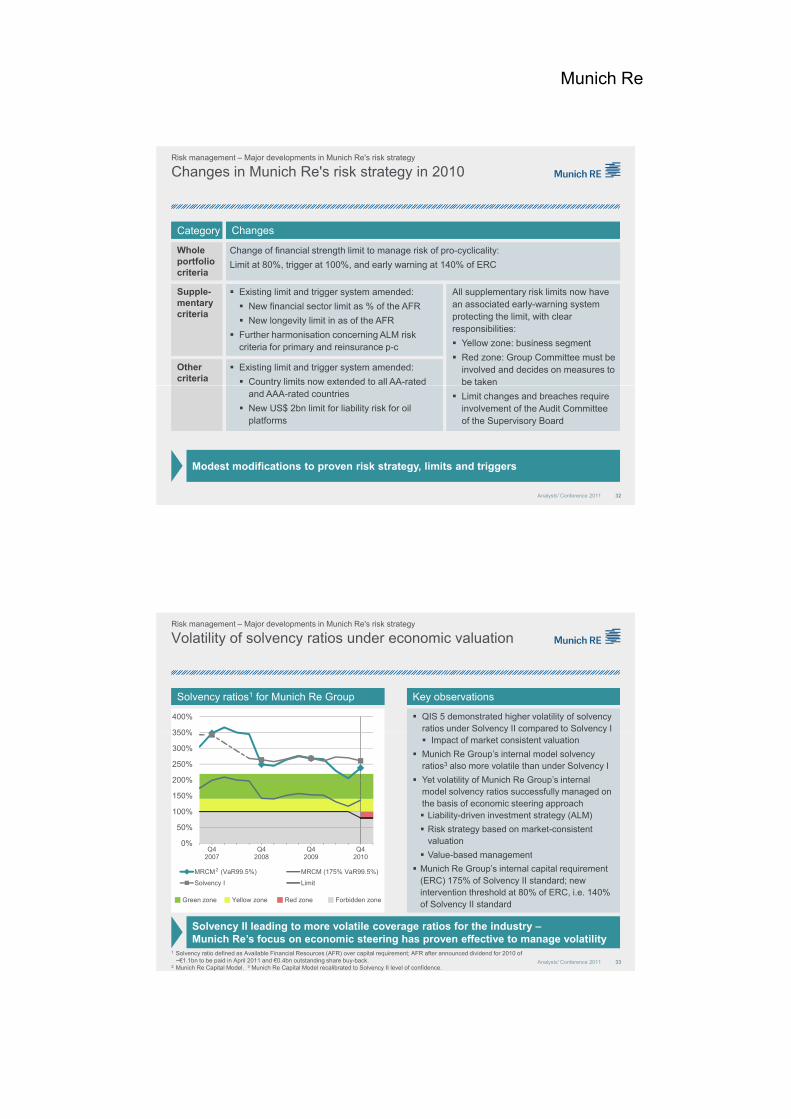
Changes in Munich Re's risk strategy in 2010
WholeportfolioWholeportfolio
Change of financial strength limit to manage risk of pro-cyclicality:
Limit at 80% trigger at 100% and early warning at 140% of ERC
Change of financial strength limit to manage risk of pro-cyclicality:
Limit at 80% trigger at 100% and early warning at 140% of ERC
CategoryCategory ChangesChanges
Risk management – Major developments in Munich Re's risk strategy
pcriteriapcriteria
Limit at 80%, trigger at 100%, and early warning at 140% of ERCLimit at 80%, trigger at 100%, and early warning at 140% of ERC
OthercriteriaOthercriteria
Existing limit and trigger system amended:
Country limits now extended to all AA-rated
Existing limit and trigger system amended:
Country limits now extended to all AA-rated
Supple-mentarycriteria
Supple-mentarycriteria
Existing limit and trigger system amended:
New financial sector limit as % of the AFR
New longevity limit in as of the AFR
Further harmonisation concerning ALM risk criteria for primary and reinsurance p-c
Existing limit and trigger system amended:
New financial sector limit as % of the AFR
New longevity limit in as of the AFR
Further harmonisation concerning ALM risk criteria for primary and reinsurance p-c
All supplementary risk limits now have an associated early-warning system protecting the limit, with clear responsibilities:
Yellow zone: business segment
Red zone: Group Committee must be involved and decides on measures to be taken
All supplementary risk limits now have an associated early-warning system protecting the limit, with clear responsibilities:
Yellow zone: business segment
Red zone: Group Committee must be involved and decides on measures to be taken
32Analysts' Conference 2011
yand AAA-rated countries
New US$ 2bn limit for liability risk for oil platforms
yand AAA-rated countries
New US$ 2bn limit for liability risk for oil platforms
Limit changes and breaches require involvement of the Audit Committee of the Supervisory Board
Limit changes and breaches require involvement of the Audit Committee of the Supervisory Board
Modest modifications to proven risk strategy, limits and triggers
Volatility of solvency ratios under economic valuation
Key observationsKey observationsSolvency ratios1 for Munich Re GroupSolvency ratios1 for Munich Re Group
Risk management – Major developments in Munich Re's risk strategy
350%
400% QIS 5 demonstrated higher volatility of solvency ratios under Solvency II compared to Solvency I
QIS 5 demonstrated higher volatility of solvency ratios under Solvency II compared to Solvency I
0%
50%
100%
150%
200%
250%
300%
350%
Q4 Q4 Q4 Q4
y p y Impact of market consistent valuation
Munich Re Group’s internal model solvency ratios3 also more volatile than under Solvency I
Yet volatility of Munich Re Group’s internal model solvency ratios successfully managed on the basis of economic steering approach Liability-driven investment strategy (ALM)
Risk strategy based on market-consistent valuation
V l b d t
33Analysts' Conference 2011
Solvency II leading to more volatile coverage ratios for the industry –Munich Re’s focus on economic steering has proven effective to manage volatility
1 Solvency ratio defined as Available Financial Resources (AFR) over capital requirement; AFR after announced dividend for 2010 of ~€1.1bn to be paid in April 2011 and €0.4bn outstanding share buy-back.
2 Munich Re Capital Model. 3 Munich Re Capital Model recalibrated to Solvency II level of confidence.
Green zone Yellow zone Red zone Forbidden zone
2007 2008 2009 2010
MRCM (VaR99.5%) MRCM (175% VaR99.5%)
Solvency I Limit
Value-based management
Munich Re Group’s internal capital requirement (ERC) 175% of Solvency II standard; new intervention threshold at 80% of ERC, i.e. 140% of Solvency II standard
Value-based management
Munich Re Group’s internal capital requirement (ERC) 175% of Solvency II standard; new intervention threshold at 80% of ERC, i.e. 140% of Solvency II standard
2
Munich Re
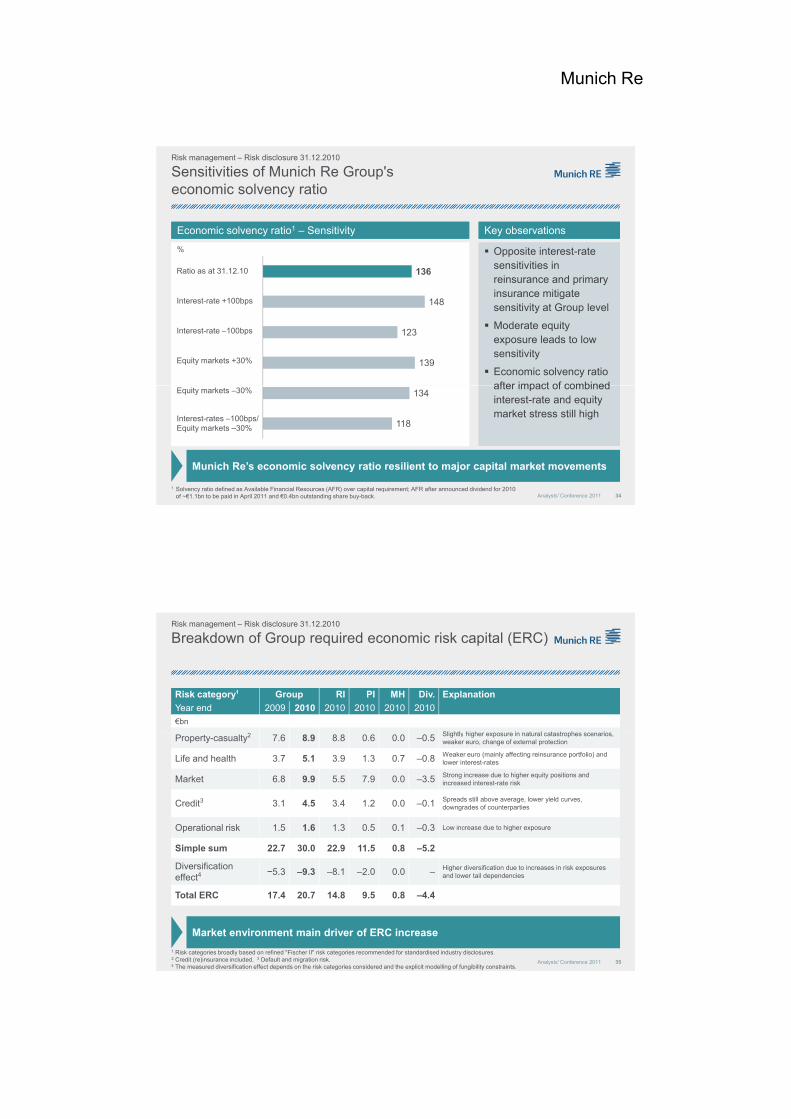
Sensitivities of Munich Re Group's economic solvency ratio
Risk management – Risk disclosure 31.12.2010
Economic solvency ratio1 – SensitivityEconomic solvency ratio1 – Sensitivity Key observationsKey observations
Opposite interest-rate sensitivities in Opposite interest-rate
sensitivities in
%
sensitivities in reinsurance and primary insurance mitigate sensitivity at Group level
Moderate equity exposure leads to low sensitivity
Economic solvency ratio after impact of combined
sensitivities in reinsurance and primary insurance mitigate sensitivity at Group level
Moderate equity exposure leads to low sensitivity
Economic solvency ratio after impact of combined
136
148
123
139
Ratio as at 31.12.10
Interest-rate +100bps
Interest-rate –100bps
Equity markets +30%
34Analysts' Conference 2011
Munich Re’s economic solvency ratio resilient to major capital market movements
after impact of combined interest-rate and equity market stress still high
after impact of combined interest-rate and equity market stress still high
134
118
Equity markets –30%
Interest-rates –100bps/Equity markets –30%
1 Solvency ratio defined as Available Financial Resources (AFR) over capital requirement; AFR after announced dividend for 2010 of ~€1.1bn to be paid in April 2011 and €0.4bn outstanding share buy-back.
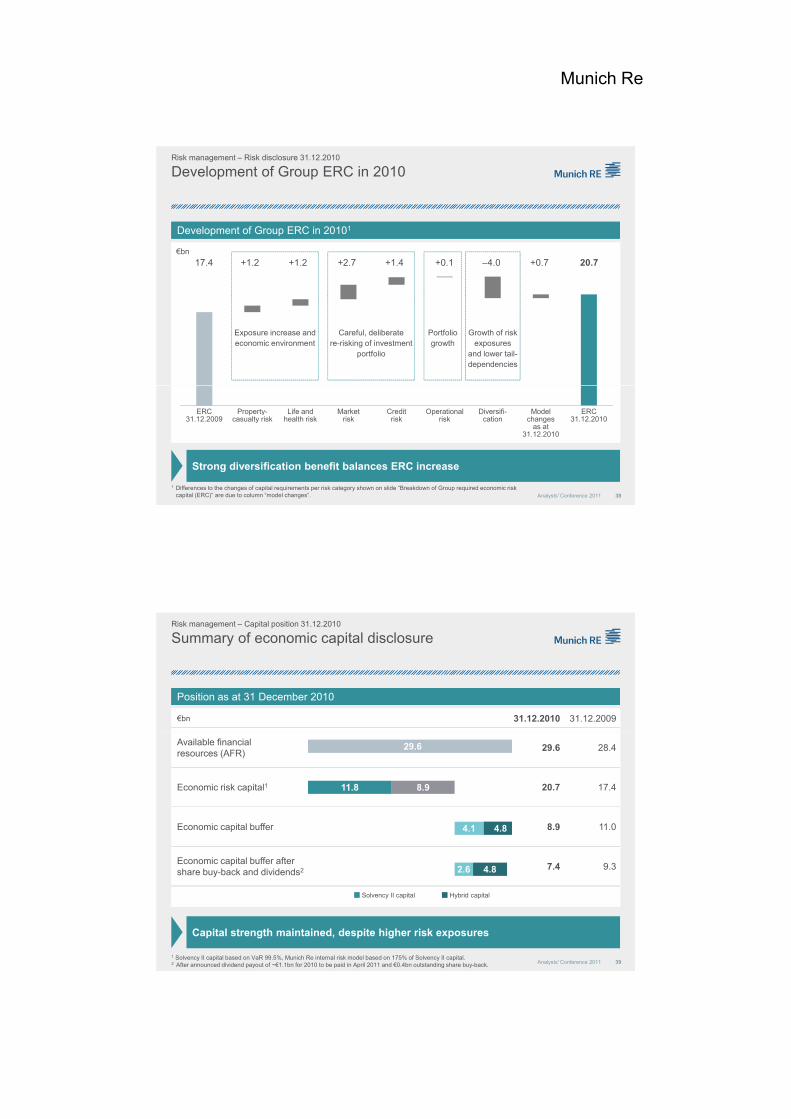
Breakdown of Group required economic risk capital (ERC)Risk management – Risk disclosure 31.12.2010
Risk category1 Group RI PI MH Div. Explanation
Year end 2009 2010 2010 2010 2010 2010
€bn
Sli htl hi h i t l t t h iProperty-casualty2 7.6 8.9 8.8 0.6 0.0 –0.5 Slightly higher exposure in natural catastrophes scenarios, weaker euro, change of external protection
Life and health 3.7 5.1 3.9 1.3 0.7 –0.8 Weaker euro (mainly affecting reinsurance portfolio) and lower interest-rates
Market 6.8 9.9 5.5 7.9 0.0 –3.5 Strong increase due to higher equity positions and increased interest-rate risk
Credit3 3.1 4.5 3.4 1.2 0.0 –0.1 Spreads still above average, lower yield curves, downgrades of counterparties
Operational risk 1.5 1.6 1.3 0.5 0.1 –0.3 Low increase due to higher exposure
Simple sum 22.7 30.0 22.9 11.5 0.8 –5.2
35Analysts' Conference 2011
1 Risk categories broadly based on refined "Fischer II" risk categories recommended for standardised industry disclosures.2 Credit (re)insurance included. 3 Default and migration risk.4 The measured diversification effect depends on the risk categories considered and the explicit modelling of fungibility constraints.
p
Diversification effect4
−5.3 –9.3 –8.1 –2.0 0.0 – Higher diversification due to increases in risk exposures and lower tail dependencies
Total ERC 17.4 20.7 14.8 9.5 0.8 –4.4
Market environment main driver of ERC increase

Munich Re
Natural catastrophe exposure
Superior diversification within Superior diversification within
HighlightsHighlights
Risk management – Overview on changes of risk profile
AggVaR (return period 200 years)€m (pre-tax)
Munich Re Group's nat cat exposuresMunich Re Group's nat cat exposures
AggVaR (return period 200 years)€m (pre-tax, gross)
1,000
2,000
3,000
4,000 CededRetained
nat cat due to
global geographical diversification of nat cat-business,
strong diversification between perils (storm, earth-
nat cat due to
global geographical diversification of nat cat-business,
strong diversification between perils (storm, earth-1.000
2.000
3.000
4.000Atlantic Hurricane
Storm Europe
36Analysts' Conference 2011
0
1,000
2010 2011 2010 2011
( ,quake, flood)
peak risk management
( ,quake, flood)
peak risk management
Atlantic Hurricane
Munich Re benefits from major diversification of natural catastrophe risks
Storm Europe
1 Exposures relate to the full year, e.g. 2011 relates to the period from 1.1.2011 to 31.12.2011
0
1.000
Top 35 nat cat exposures
Breakdown of Group required ERC for market riskRisk management – Risk disclosure 31.12.2010
Risk category Group RI PI Div. Explanation
Year end 2009 2010 2010 2010 2010€bn
E it 3 8 5 5 3 8 1 8 0 1Equity 3.8 5.5 3.8 1.8 –0.1 Increase due to higher equity-backing ratio
General interest-rate 4.0 5.6 4.0 6.3 –4.7 Lower interest-rates leading to increased duration-mismatch
Credit spread 2.2 3.6 1.8 2.6 –0.8 Refined spread risk modelling in the MCEV
Real estate 1.8 2.0 1.1 1.0 –0.1 No material change
Currency 2.3 0.6 0.6 0.2 –0.2 Refined modelling of currency risk regarding free surplus
Simple sum 14.1 17.3 11.3 11.9 –5.9
Diversification –7.3 –7.4 –5.8 –4.0 –
Sum ERC 6.8 9.9 5.5 7.9 –3.5
37Analysts' Conference 2011
–12.9
6.1
–6.8
–17.6
18.8
1.2
RI
PI
Group
20092010
Interest-rateInterest-rateEquityEquity
Assets 2010 Liabilities2
Credit spreadCredit spread
Rating classification1 %
0%
20%
40%
60%
80%
100%
2009 2010
<BBB & NR
BBB
A
AA
AAA
2.8
4.4
2009 2010
Equity-backing ratio incl. derivatives %
Net DV01 in €m Duration
1 Fixed-Income portfolio.2 Based on replicating portfolio of liabilities.
Note: Asset and liability durations apply to different underlying volumes
6.3
6.6
5.9
7.3
8.3
5.1
Group
PI
RI
Munich Re
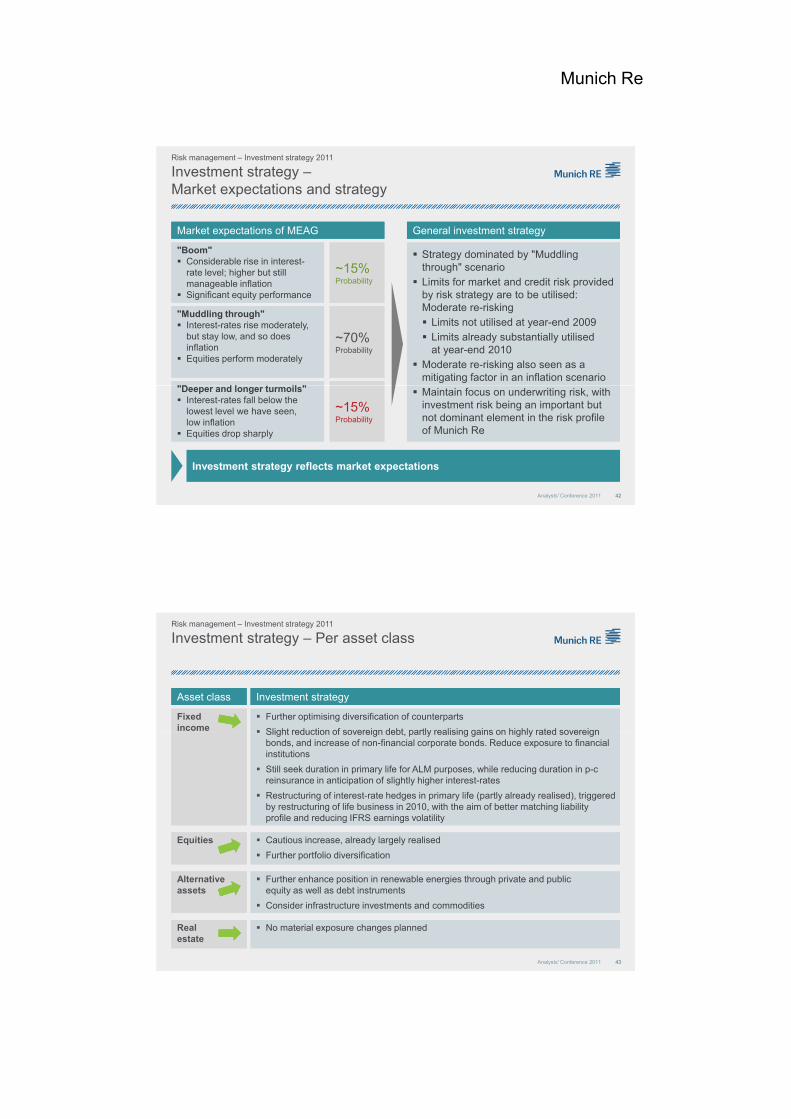
Development of Group ERC in 20101Development of Group ERC in 20101
Development of Group ERC in 2010Risk management – Risk disclosure 31.12.2010
€bn
17.4 +1.2 +1.2 +2.7 +1.4 +0.1 –4.0 +0.7 20.7
Exposure increase and economic environment
Portfolio growth
Growth of risk exposures
and lower tail-dependencies
Careful, deliberate re-risking of investment
portfolio
38Analysts' Conference 2011
Strong diversification benefit balances ERC increase
1 Differences to the changes of capital requirements per risk category shown on slide “Breakdown of Group required economic risk capital (ERC)” are due to column “model changes”.
ERC31.12.2009
Property-casualty risk
Life and health risk
Market risk
Credit risk
Operational risk
Diversifi-cation
Modelchanges
as at31.12.2010
ERC31.12.2010
Position as at 31 December 2010Position as at 31 December 2010
Summary of economic capital disclosureRisk management – Capital position 31.12.2010
€bn 31.12.2010 31.12.2009
Available financial resources (AFR)
29.6 28.4
Economic risk capital1 20.7 17.4
Economic capital buffer 8.9 11.0
11.8
4.1
29.6
8.9
4.8
39Analysts' Conference 2011
Economic capital buffer aftershare buy-back and dividends2 7.4 9.3
Hybrid capitalSolvency II capital
2.6 4.8
Capital strength maintained, despite higher risk exposures
1 Solvency II capital based on VaR 99.5%, Munich Re internal risk model based on 175% of Solvency II capital.2 After announced dividend payout of ~€1.1bn for 2010 to be paid in April 2011 and €0.4bn outstanding share buy-back.

Munich Re
10
Available financial resources – Change and relation to economic earnings
28 4 2 41 3 6 29 6
AFR development in 2010AFR development in 2010 Relation to probability distribution of MRCM2Relation to probability distribution of MRCM2
€bn
Risk management – Capital position 31.12.2010
€bn
Economic
1 10 100 1,000 10,000
Return period (years)
5
0
–5
–10
28.4 –2.41 3.6 29.6
Previous year(–2.2) (6.0)
Munich Re ERC 31.12.10 (€20.7bn)
Economic earnings 2010 (€3.6bn)
Expected economic earnings 2010
40Analysts' Conference 2011
–15
–20
Higher than expected economic earnings lead to AFR increase despite considerable capital repatriation
AFR31.12.2009
Capital mgmt. and M&A
Economic earnings
AFR 31.12.2010
1 Dividends (–€1.1bn) and share buy-back (–€1.3bn).2 Munich Re Capital Model.
Market and credit riskSolid performance of Munich Re'sMarket and credit riskSolid performance of Munich Re's
Available financial resources – Components of changeRisk management – Capital position 31.12.2010
RemarksRemarksRisk category
ERC 1.1.
ERC31.12.
∆AFR1
2010 Explanation€bn
pinvestment portfolio
Gains on equity holdings
Gains in bond portfolio from declining general risk free interest-rates, but more than offset by impact on MCEV of primary insurance
Specific interest-rate (credit spread) performance positive in reinsurance (mostly USA) but losses in primary
pinvestment portfolio
Gains on equity holdings
Gains in bond portfolio from declining general risk free interest-rates, but more than offset by impact on MCEV of primary insurance
Specific interest-rate (credit spread) performance positive in reinsurance (mostly USA) but losses in primary
Equity 3.8 5.5 +0.6 Equity investments
Credit 3.1 4.5 –0.1 No material defaults
Interest-rate 4.4 6.9 –0.9In particular, losses in primary insurance MCEV
Currency 2.3 0.6 +0.4 Profits in CAN$ and US$
Technical result and new business
+1.1
AFR roll forward2, other
+2.5
41Analysts' Conference 2011
(mostly USA), but losses in primary insurance (mostly Europe)
Insurance riskSatisfactory technical results although p-c affected by high nat cat losses
(mostly USA), but losses in primary insurance (mostly Europe)
Insurance riskSatisfactory technical results although p-c affected by high nat cat losses
Satisfactory technical results and favourable capital market experience
1 Rough estimates, after tax and policyholder participation.2 Investment return on AFR.
other
Economicearnings
+3.6
Note: This table illustrates the impact of various risk factors on AFR (column ∆AFR), and compares this to the respective ERC, which gives an indication of what an extreme impact could have been.
Munich Re
Risk management – Investment strategy 2011
Investment strategy –Market expectations and strategy
Market expectations of MEAGMarket expectations of MEAG
"Boom" Considerable rise in interest-"Boom" Considerable rise in interest-
15%15%
General investment strategyGeneral investment strategy
Strategy dominated by "Muddling through" scenario Strategy dominated by "Muddling
through" scenariorate level; higher but still manageable inflation
Significant equity performance
rate level; higher but still manageable inflation
Significant equity performance
"Muddling through" Interest-rates rise moderately,
but stay low, and so does inflation
Equities perform moderately
"Muddling through" Interest-rates rise moderately,
but stay low, and so does inflation
Equities perform moderately
"D d l t il ""D d l t il "
~15%Probability~15%Probability
~70%Probability~70%Probability
through scenario Limits for market and credit risk provided
by risk strategy are to be utilised: Moderate re-risking Limits not utilised at year-end 2009 Limits already substantially utilised
at year-end 2010 Moderate re-risking also seen as a
mitigating factor in an inflation scenario
through scenario Limits for market and credit risk provided
by risk strategy are to be utilised: Moderate re-risking Limits not utilised at year-end 2009 Limits already substantially utilised
at year-end 2010 Moderate re-risking also seen as a
mitigating factor in an inflation scenario
42Analysts' Conference 2011
"Deeper and longer turmoils" Interest-rates fall below the
lowest level we have seen, low inflation
Equities drop sharply
"Deeper and longer turmoils" Interest-rates fall below the
lowest level we have seen, low inflation
Equities drop sharply
~15%Probability~15%Probability
Maintain focus on underwriting risk, with investment risk being an important but not dominant element in the risk profile of Munich Re
Maintain focus on underwriting risk, with investment risk being an important but not dominant element in the risk profile of Munich Re
Investment strategy reflects market expectations
Investment strategyInvestment strategyAsset classAsset class
Risk management – Investment strategy 2011
Investment strategy – Per asset class
Further optimising diversification of counterparts
Slight reduction of sovereign debt partly realising gains on highly rated sovereign
Further optimising diversification of counterparts
Slight reduction of sovereign debt partly realising gains on highly rated sovereign
Fixed incomeFixed income
Cautious increase, already largely realised
F th tf li di ifi ti
Cautious increase, already largely realised
F th tf li di ifi ti
EquitiesEquities
Slight reduction of sovereign debt, partly realising gains on highly rated sovereign bonds, and increase of non-financial corporate bonds. Reduce exposure to financial institutions
Still seek duration in primary life for ALM purposes, while reducing duration in p-c reinsurance in anticipation of slightly higher interest-rates
Restructuring of interest-rate hedges in primary life (partly already realised), triggered by restructuring of life business in 2010, with the aim of better matching liability profile and reducing IFRS earnings volatility
43Analysts' Conference 2011
Further portfolio diversification Further portfolio diversification
Further enhance position in renewable energies through private and public equity as well as debt instruments
Consider infrastructure investments and commodities
Further enhance position in renewable energies through private and public equity as well as debt instruments
Consider infrastructure investments and commodities
Alternative assetsAlternative assets
No material exposure changes planned No material exposure changes plannedReal estateReal estate

Munich Re
Continuity in terms of risk profile – Cycle management at workContinuity in terms of risk profile – Cycle management at work
Key takeawaysRisk management – Summary
Higher than expected economic earnings lead to AFR increase despite considerable capital repatriationHigher than expected economic earnings lead to AFR increase despite considerable capital repatriation
Strong capital position maintained despite challenging market environmentStrong capital position maintained despite challenging market environment
44Analysts' Conference 2011
Disciplined liability-driven business approach to be maintainedDisciplined liability-driven business approach to be maintained
Gearing up for Solvency II – In the midst of the pre-application process; first business opportunities already realisedGearing up for Solvency II – In the midst of the pre-application process; first business opportunities already realised
Agenda
Turning risk into sustainable value Nikolaus von Bomhard
Fi i l hi hli ht 2010 Jö S h idFinancial highlights 2010 Jörg Schneider
Risk management Joachim Oechslin
Non-life reinsurance Torsten Jeworrek
Life reinsurance Joachim Wenning
45Analysts' Conference 2011
Primary insurance Torsten Oletzky
Backup

Munich Re
Result burdened by higher losses in property-casualty and reserve strengthening in life reinsurance
Reinsurance – Highlights
Technical resultTechnical resultGross premiums writtenGross premiums written
€m €m
Operating resultOperating resultInvestment resultInvestment result
Q1–42009
21,783
Q1–42010
23,602
Q1–42009
1,940
Q1–42010
1,302
Favourable FX contribution as main driver for premium growth
High claims activity in property-casualty and reserve strengthening of long-term care business
46Analysts' Conference 2011
€m
Q1–42009
3,796
Q1–42010
3,436
€m
Q1–42009
4,099
Q1–42010
2,943
Good investment result partly mitigating lower technical result
Investment result again at a high level due to disposal gains
Favourable FX contribution as main driver of premium growth
Reinsurance – Premium development
€m
Gross premiums written Q1–4 2009 21,783
Foreign exchange
Substantial FX contribution (mainly Can$, US$, A$)
Substantial FX contribution (mainly Can$, US$, A$)
Breakdown by segment
Foreign-exchange effects 1,493
Divestment/ Investment 149
Organic change 177
Gross premiums written Q1–4 2010 23,602
Property-casualty15 701 (67%)
Life7 901 (33%)
Premium growth through acquisition of HSB
Organic growth mainly from large-volume deals in life reinsurance
Premium growth through acquisition of HSB
Organic growth mainly from large-volume deals in life reinsurance
47Analysts' Conference 2011
segment(segmental, not consolidated)
15,701 (67%) (▲ 4.8%)
7,901 (33%)(▲ 16.3%)

Munich Re
Result strongly impacted by high nat cat losses
Strict cycle management and recession-related premium decrease in original business; countervailing increase from currency development and first-time consolidation of
Strict cycle management and recession-related premium decrease in original business; countervailing increase from currency development and first-time consolidation of
Non-life reinsurance – Financial results
€m Q1–4 2010
Q1–42009
Gross premiums written 15,701 14,987 development and first time consolidation of HSB (€149m)
Technical result burdened by exceptionally high nat cat losses (earthquakes in Chile and Christchurch, flood in Australia as main events); lower man-made losses despite Deepwater Horizon (high recession-related losses in 2009)
Moderate reserve releases while further strengthening confidence level
Sound underlying combined ratio (after
development and first time consolidation of HSB (€149m)
Technical result burdened by exceptionally high nat cat losses (earthquakes in Chile and Christchurch, flood in Australia as main events); lower man-made losses despite Deepwater Horizon (high recession-related losses in 2009)
Moderate reserve releases while further strengthening confidence level
Sound underlying combined ratio (after
p
Income from technical interest
1,371 1,058
Net expenses for claims and benefits
9,904 9,243
Net operating expenses 4,437 4,125
Technical result 1,223 1,658
I t t lt 2 563 2 714
48Analysts' Conference 2011
y g (adjusting for major losses)
Growing share of Munich Re Risk Solutions with structurally higher cost but lower loss ratios
Investment result again at a high level due to sale of fixed-interest securities; previous year positively influenced by sale of hedged equities
y g (adjusting for major losses)
Growing share of Munich Re Risk Solutions with structurally higher cost but lower loss ratios
Investment result again at a high level due to sale of fixed-interest securities; previous year positively influenced by sale of hedged equities
Investment result 2,563 2,714
Non-technical result 1,286 1,723
Operating result 2,509 3,381
Consolidated result 1,806 2,111
Combined ratio reflects exceptionally high nat cat losses Q1–4 2010
Non-life reinsurance – Combined ratio
%
2008 99.4
Expense ratioLoss ratio (Thereof nat cat/Thereof man–made)
69.6 (6.2/5.0) 29.8
2009 95.3
2010 100.5
65.8 (1.4/6.9)
69.3 (11.0/4.7)
29.5
31.2
Major losses in Q1–4 2010 (€2,228m) well above 5–year average (€1,355m)
Nat cat losses in Q1–4 2010 (€1,564m) clearly exceed 5–year average (€677m)
Major losses in Q1–4 2010 (€2,228m) well above 5–year average (€1,355m)
Nat cat losses in Q1–4 2010 (€1,564m) clearly exceed 5–year average (€677m)
105
100
%1
103.7101.2
97.3 98.4
109.2103.8
96 0
49Analysts' Conference 20111 Incl. credit and overhead costs
clearly exceed 5 year average (€677m)
Man–made losses of €664m in Q1–4 2010 equals 5–year average (€678m)
Expense Ratio: Increased commissions and business acquisition costs (mainly from Munich Re Risk Solutions)
clearly exceed 5 year average (€677m)
Man–made losses of €664m in Q1–4 2010 equals 5–year average (€678m)
Expense Ratio: Increased commissions and business acquisition costs (mainly from Munich Re Risk Solutions)
95
90
85
Q1 Q2 Q3 Q4 Q1 Q2 Q3 Q4 Q1 Q2 Q3 Q4
2008 2009 2010
95.297.6
97.3
93.1 92.393.8
96.0

Munich Re
Overall challenging market environment due to record levels of capital of primary and reinsurance industry
Non-life reinsurance – January renewals 2011
Competitive environmentCompetitive environment
Market conditionsMarket conditions
CycleCycle
L iL i
Increased capitalisation of the insurance industry: recovery from the financial crisis (higher retained earnings and IFRS capital) strengthens (re)insurers balance sheets
Increased capitalisation of the insurance industry: recovery from the financial crisis (higher retained earnings and IFRS capital) strengthens (re)insurers balance sheets
+
–
Rate change2011 January renewal
P-CXL NA1
P-CXL NA1
MarineMarine
Propor-tional
Propor-tional
AustraliaCat XL
AustraliaCat XL
Offshore energy
Offshore energy
Illustrative
Cycle
50Analysts' Conference 2011
Lower prices, on average, as softening trend of recent years continues in spite of low interest-rate environment.However, profitability levels differ across regions and market segments
Lower prices, on average, as softening trend of recent years continues in spite of low interest-rate environment.However, profitability levels differ across regions and market segments
Overall, cycle is a global phenomenon
However, price trends diverge across regions and segments especially after major loss events, e.g. Offshore energy post Deepwater
Horizon Chile and Australia post nat cat events
Overall, cycle is a global phenomenon
However, price trends diverge across regions and segments especially after major loss events, e.g. Offshore energy post Deepwater
Horizon Chile and Australia post nat cat events
1 P-C XL NA: Property and Casualty XL business North America.
Munich Re's strategy allowed profitable growth inJanuary renewals – Despite challenging market conditions
January renewals – Munich Re's strategyJanuary renewals – Munich Re's strategy
Munich Re's portfolioMunich Re's portfolio Active portfolio managementActive portfolio management1
Non-life reinsurance – January renewals 2011
++Growth and know-how partnerPremium service provider supporting clients along their entire value chain
Growth and know-how partnerPremium service provider supporting clients along their entire value chain
Premium positioningPremium positioning2
Commodity segment requires active management to ensure profitabilityCommodity segment requires active management to ensure profitability
% 100 –16.1 83.9 4.6 15.6 104.1€m 7,869 1,265 6,604 362 1,229 8,195
11 22
Change in premium: +4.1% Thereof price movement: +0.1% Thereof change in exposure for our share: +4.0%
51Analysts' Conference 2011
Emphasis on sound profitability inp-c core businessEmphasis on sound profitability inp-c core business
clients along their entire value chainclients along their entire value chain
Value optimiserKnow-how to structure tailor-made (capital management) solutions
Value optimiserKnow-how to structure tailor-made (capital management) solutions
Complex risk takerExpertise to model and appetite to cover complex risks
Complex risk takerExpertise to model and appetite to cover complex risks
Total renewable from 1.1.10
Cancelled Renewed Increase on renewable
New business
Estimated outcome

Munich Re
We keep our promise not to compromise bottom-line for the sake of top-line growth
Emphasis on risk-adequate prices drives cancellationsEmphasis on risk-adequate prices drives cancellations
Cancellations in selected (commodity) segments1Cancellations in selected (commodity) segments1
January renewals – Active portfolio managementJanuary renewals – Active portfolio management11
Non-life reinsurance – January Renewal 2011
(–21%)
(–15%)
(–14%)
(–5%)
0 20 40 60 80 100
Property XLNorth America
Casualty XLNorth America
Fire prop. Europe
TPL prop.
cancellationscancellationssegmentssegments
Property XL North America: Mainly driven by reductions of US nat cat business as prices declined
Casualty XL North America: Due to difficult market environment cancellation of treaties below profitability threshold, mainly in third-party liability but also in workers’ comp
Fire prop. Europe: Overall, soft market environment
TPL prop.: Still pressure on prices and restructuring of reinsurance programmes
Premiums €m
2
52Analysts' Conference 2011
( )
(–25%)
(–20%)
Motor-TPL prop.
Cargo&hull prop.
of reinsurance programmes
Motor TPL prop: Considerable quality improvement due to cancellation of unprofitable treaties
Cargo & hull prop.: Selected client relationships terminated due to insufficient profitability
of reinsurance programmes
Motor TPL prop: Considerable quality improvement due to cancellation of unprofitable treaties
Cargo & hull prop.: Selected client relationships terminated due to insufficient profitability
Execution of strict cycle management facilitating maintenance of the reinsurance portfolio’s technical profitability in a soft market environment
1 Excluding bulk deals.2 Third-party liability.
We support our clients in expanding and optimising their operations globally – with capacity and risk expertise
Greater China / SEAGreater China / SEA
Premium positioning – Growth and know-how partner (examples)Premium positioning – Growth and know-how partner (examples)22
AgroAgro Selected partnershipsSelected partnerships
Non-life reinsurance – Strategic outlook
Unique support of ambitious growth path of key clients in emerging markets that only a leading reinsurer can provide
Risk transfer through tailor-made solutions
Transfer of underwriting concepts from mature to developing markets
Unique support of ambitious growth path of key clients in emerging markets that only a leading reinsurer can provide
Risk transfer through tailor-made solutions
Transfer of underwriting concepts from mature to developing markets
Fostering insurability of agricultural production risks through public-private partnerships (PPPs)
Providing cover for yield and market risk, mainly USA
Rapid Eye technology partnership
Fostering insurability of agricultural production risks through public-private partnerships (PPPs)
Providing cover for yield and market risk, mainly USA
Rapid Eye technology partnership
Prominent market position enables us to see (all) new opportunities and business models at a very early stage
Expertise and appetite for comprehensive relationships with strategic partners
Capacity to underwrite multi-year global reinsurance treaties
Prominent market position enables us to see (all) new opportunities and business models at a very early stage
Expertise and appetite for comprehensive relationships with strategic partners
Capacity to underwrite multi-year global reinsurance treaties
53Analysts' Conference 2011
608 740
2010 2011e
348773
2010 2011e
9201,298
2010 2011e
Renewal – Expected premium incomeRenewal – Expected premium income
+22%
+41%
+122%
€m €m €m
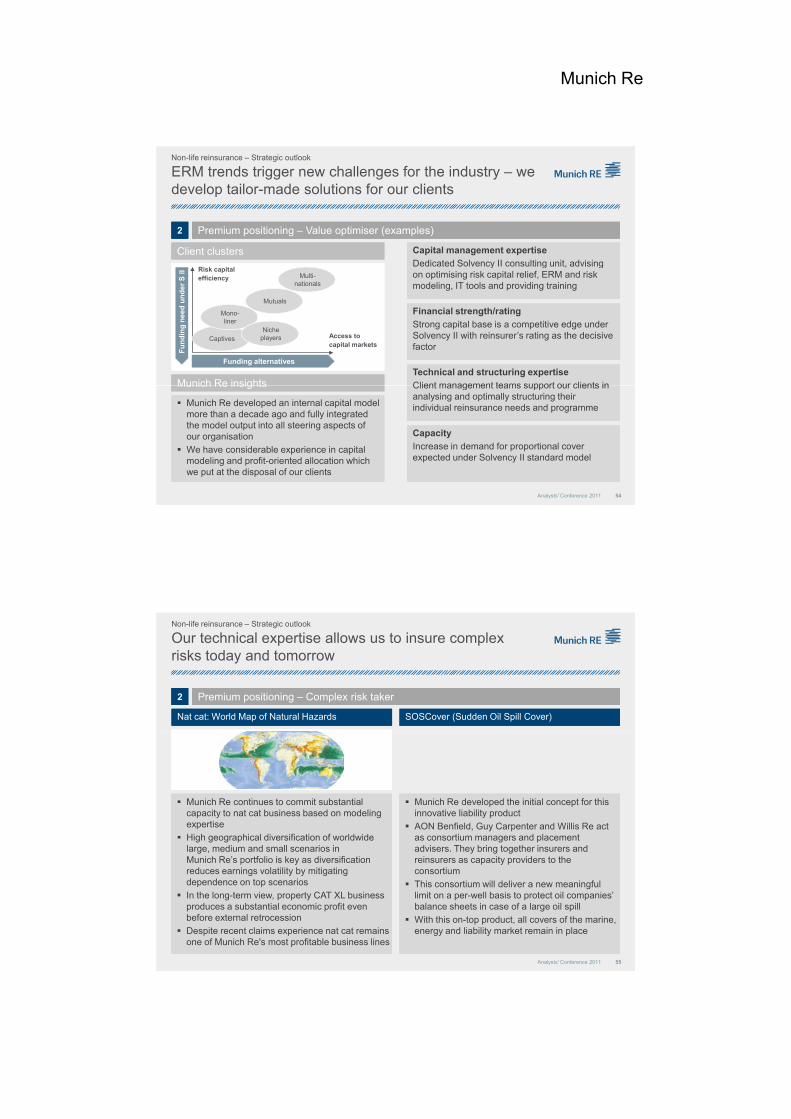
Munich Re
Client clustersClient clusters
ERM trends trigger new challenges for the industry – we develop tailor-made solutions for our clients
Capital management expertise
Dedicated Solvency II consulting unit, advising
Capital management expertise
Dedicated Solvency II consulting unit, advising
Non-life reinsurance – Strategic outlook
Premium positioning – Value optimiser (examples)Premium positioning – Value optimiser (examples)22
Technical and structuring expertise
Client management teams support our clients in
Technical and structuring expertise
Client management teams support our clients inMunich Re insightsMunich Re insights
Financial strength/rating
Strong capital base is a competitive edge under Solvency II with reinsurer’s rating as the decisive factor
Financial strength/rating
Strong capital base is a competitive edge under Solvency II with reinsurer’s rating as the decisive factor
Dedicated Solvency II consulting unit, advising on optimising risk capital relief, ERM and risk modeling, IT tools and providing training
Dedicated Solvency II consulting unit, advising on optimising risk capital relief, ERM and risk modeling, IT tools and providing training
Captives
Risk capital efficiency
Access to capital markets
Multi-nationals
Mono-liner
Nicheplayers
Mutuals
Fu
nd
ing
nee
d u
nd
er S
II
Funding alternatives
54Analysts' Conference 2011
Client management teams support our clients in analysing and optimally structuring their individual reinsurance needs and programme
Client management teams support our clients in analysing and optimally structuring their individual reinsurance needs and programme
Munich Re insightsMunich Re insights
Munich Re developed an internal capital model more than a decade ago and fully integrated the model output into all steering aspects of our organisation
We have considerable experience in capital modeling and profit-oriented allocation which we put at the disposal of our clients
Munich Re developed an internal capital model more than a decade ago and fully integrated the model output into all steering aspects of our organisation
We have considerable experience in capital modeling and profit-oriented allocation which we put at the disposal of our clients
Capacity
Increase in demand for proportional cover expected under Solvency II standard model
Capacity
Increase in demand for proportional cover expected under Solvency II standard model
Our technical expertise allows us to insure complex risks today and tomorrow
Non-life reinsurance – Strategic outlook
Nat cat: World Map of Natural HazardsNat cat: World Map of Natural Hazards SOSCover (Sudden Oil Spill Cover)SOSCover (Sudden Oil Spill Cover)
Premium positioning – Complex risk taker Premium positioning – Complex risk taker 22
Munich Re continues to commit substantial capacity to nat cat business based on modeling expertise
High geographical diversification of worldwide large, medium and small scenarios in
Munich Re continues to commit substantial capacity to nat cat business based on modeling expertise
High geographical diversification of worldwide large, medium and small scenarios in
Munich Re developed the initial concept for this innovative liability product
AON Benfield, Guy Carpenter and Willis Re act as consortium managers and placement advisers. They bring together insurers and
Munich Re developed the initial concept for this innovative liability product
AON Benfield, Guy Carpenter and Willis Re act as consortium managers and placement advisers. They bring together insurers and
55Analysts' Conference 2011
g ,Munich Re’s portfolio is key as diversification reduces earnings volatility by mitigating dependence on top scenarios
In the long-term view, property CAT XL business produces a substantial economic profit even before external retrocession
Despite recent claims experience nat cat remains one of Munich Re's most profitable business lines
y g greinsurers as capacity providers to the consortium
This consortium will deliver a new meaningful limit on a per-well basis to protect oil companies’ balance sheets in case of a large oil spill
With this on-top product, all covers of the marine, energy and liability market remain in place
y g greinsurers as capacity providers to the consortium
This consortium will deliver a new meaningful limit on a per-well basis to protect oil companies’ balance sheets in case of a large oil spill
With this on-top product, all covers of the marine, energy and liability market remain in place

Munich Re
Key takeaways
Reinsurance segmentReinsurance segment
After normalisation of major losses, 2010 showed satisfactory business development in After normalisation of major losses, 2010 showed satisfactory business development in
Non-life reinsurance – Summary
Leveraging Munich Re's competitive advantage as technically sophisticated solution provider, price-driven premium reduction could be more than compensated for strategic business Leveraging Munich Re's competitive advantage as technically sophisticated solution provider, price-driven premium reduction could be more than compensated for strategic business
Positive January renewal results achieved in a challenging environment due to strict cycle management of commodity business with deliberate top-line reduction in case of inadequate price levels
Positive January renewal results achieved in a challenging environment due to strict cycle management of commodity business with deliberate top-line reduction in case of inadequate price levels
p-c reinsurance segmentp-c reinsurance segment
56Analysts' Conference 2011
p p p gexpansion in premium segmentp p p gexpansion in premium segment
Munich Re's sharpened value proposition of partnering our clients according to their needs has proved its worth
Agenda
Turning risk into sustainable value Nikolaus von Bomhard
Fi i l hi hli ht 2010 Jö S h idFinancial highlights 2010 Jörg Schneider
Risk management Joachim Oechslin
Non-life reinsurance Torsten Jeworrek
Life reinsurance Joachim Wenning
57Analysts' Conference 2011
Primary insurance Torsten Oletzky
Backup

Munich Re
Primaryinsuranced d
Primaryinsuranced d
Need for support in underwriting and product development
Need for support in underwriting and product development
Importance of asset-liability mismatch risk has strongly
i d
Importance of asset-liability mismatch risk has strongly
i d
Demand for cash and capital relief as well as
b tt li t bilit
Demand for cash and capital relief as well as
b tt li t bilit
Life reinsurance – Strategic positioningLife reinsurance – Strategic positioning
Life reinsurance – Strategic positioning
Munich Re's global key strategic focus in life
Customisedsolution space
Customisedsolution space
demand patterndemand pattern
Transfer of know-how/Traditional solutions
Transfer of know-how/Traditional solutions
Holistic asset-liability solutions
Holistic asset-liability solutions
increased increased
Financing and capital relief transactions
Financing and capital relief transactions
bottom-line stabilitybottom-line stability
Biometric expertiseBiometric expertiseMunich Re'scompetitive advantage
Munich Re'scompetitive advantage
Capital strengthCapital strength
Balance sheet and capital management know-howBalance sheet and capital management know-howGlobal product expertiseGlobal product expertise
58Analysts' Conference 2011
Market development strategy Asia
Market development strategy Asia
Asset protectionAsset protection
LongevityLongevityFinancially motivated reinsurance
Financially motivated reinsurance
Fully productiveFully productive Experimental stageExperimental stage
Strong organic growth driven by large capital relief deals;result suffers from reserve strengthening in the US
Premium growth owing to large-volume deals (majority of deals included as from Q2 2009) and positive development of foreign-exchange (mainly Can$)
Premium growth owing to large-volume deals (majority of deals included as from Q2 2009) and positive development of foreign-exchange (mainly Can$)
€m Q1–4 2010
Q1–42009
Gross premiums written 7,901 6,796
Life reinsurance – Financial results
(mainly Can$)
Corresponding positive effect of large-volume deals on technical and operating result
Decreasing technical result reflects reserve strengthening and DAC write-down for US long term care business in 2010 (€315m); apart from that, pleasing business development; 2009 influenced by de-risking of investment portfolio
D f i l d d d
p
Income from technicalinterest
556 656
Net expenses for claimsand benefits
5,803 4,817
Net operating expenses 2,233 2,048
Technical result 79 282
I t t lt 873 1 082
59Analysts' Conference 2011
Decrease of investment result due to reduced interest on deposits (clean-cut of Group-internal quota share agreement), but still good result on disposals; previous year positively influenced by sale of ERV1 to ERGO
Decrease of investment result due to reduced interest on deposits (clean-cut of Group-internal quota share agreement), but still good result on disposals; previous year positively influenced by sale of ERV1 to ERGO
Investment result 873 1,082
Non-technical result 355 436
Operating result 434 718
Consolidated result 293 465
1 Europäische Reiseversicherung.
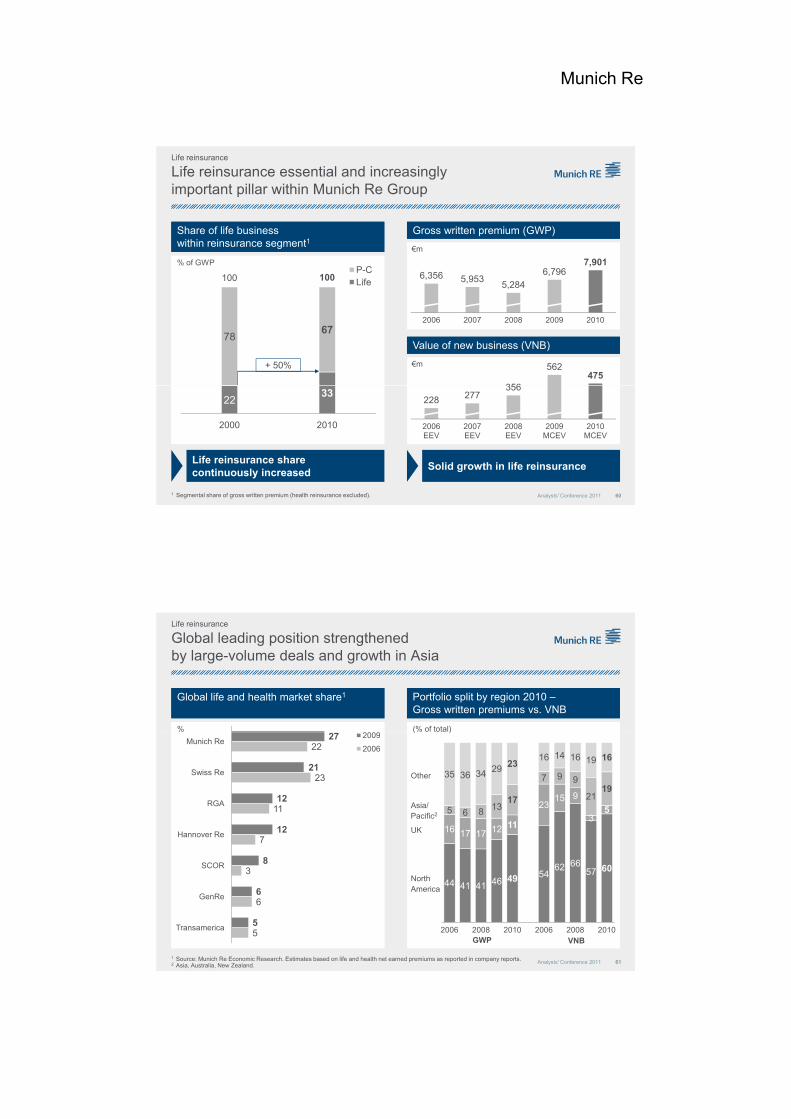
Munich Re
Life reinsurance essential and increasingly important pillar within Munich Re Group
Share of life business within reinsurance segment1Share of life business within reinsurance segment1
% of GWP
Gross written premium (GWP)Gross written premium (GWP)
€m
Life reinsurance
7,901
7867
P-CLife100 100
Value of new business (VNB)Value of new business (VNB)
€m+ 50%
6,356 5,9535,284
6,796,
2006 2007 2008 2009 2010
356
562475
60Analysts' Conference 2011
2233
2000 2010
1 Segmental share of gross written premium (health reinsurance excluded).
Life reinsurance sharecontinuously increased
Solid growth in life reinsurance
228 277356
2006EEV
2007 EEV
2008EEV
2009MCEV
2010MCEV
Global leading position strengthened by large-volume deals and growth in Asia
Portfolio split by region 2010 –Gross written premiums vs. VNB Portfolio split by region 2010 –Gross written premiums vs. VNB
(% of total)
Global life and health market share1Global life and health market share1
2009
Life reinsurance
%
16 17 17 12 11
2315 9
355 6 8 13
17
7 9 9
2119
35 36 34 29 2316 14 16 19 16
( )
Other
Asia/Pacific2
UK
27
21
12
12
22
23
11
7
Munich Re
Swiss Re
RGA
Hannover Re
2009
2006
61Analysts' Conference 2011
44 41 41 46 49 5462 66
57 60
2006 2008 2010 2006 2008 2010
North America
1 Source: Munich Re Economic Research. Estimates based on life and health net earned premiums as reported in company reports.2 Asia, Australia, New Zealand.
8
6
5
3
6
5
SCOR
GenRe
Transamerica
GWP VNB

Munich Re
MCEV result 2010
Positive FX effects (Can$)
Again very ti f i l f
Positive FX effects (Can$)
Again very ti f i l f
€m
MCEV 31.12.2009 6,773
Opening adjustments 564
11
22
Life reinsurance
11satisfying value of new business €475m (€562m)
Mainly reserve strengthening for US LTC1 business
LTC effects were more than offset by better-than-expected future
satisfying value of new business €475m (€562m)
Mainly reserve strengthening for US LTC1 business
LTC effects were more than offset by better-than-expected future
p g j
Adjusted MCEV 31.12.2009 7,338
Value of new business 475
Expected return 189
Experience variances –157
Assumption changes 252
Other operating variance –8
Operating MCEV earnings 2010 751
33
44
33
22
44
62Analysts' Conference 2011
expected future mortality and portfolio optimisation
Positive contribution of lower interest rates
expected future mortality and portfolio optimisation
Positive contribution of lower interest rates
Operating MCEV earnings 2010 751
Economic variances 245
Other non-operating variance 22
Total MCEV earnings 2010 1,018
Closing adjustments –72
MCEV 31.12.2010 8,284
1 Long-term care.
55
55
Premiums and value generation by product 2009/2010Premiums and value generation by product 2009/2010
Life reinsurance
Mortality core pillar of life reinsurance business complemented by living benefits covers
GWP€m
2010 4,776 2,359 228 537 7,901 1,9982009 4,625 1,768 187 216 6,796 1,289
Mortality and morbidity reliably contribute to result and value creation
LTC2 is small niche product; one-off
Mortality and morbidity reliably contribute to result and value creation
LTC2 is small niche product; one-off
Technical result1€m
2010 329 57 –333 27 79 35
2009 211 88 –25 8 282 17
VNB€m
2010 316 111 14 34 475 452009 328 171 14 49 562 153
effect in 2010 in US portfolio
Category "Other" includes small amounts of longevity business as well as asset protection products; we approach these risks very cautiously
Large-volume deals show moderate premium margin of ~2%, but above-average IRR3 and RoRaC spreads
Overall, very satisfactory portfolio
63Analysts' Conference 2011
Mortality risk continues to be dominating source of value creation
Mortality Morbidityexcl. LTC
LTC Thereof:large deals
Other Total
€m 2009 328 171 14 49 562 153
1 Product-specific cost allocation.2 Long-term care.3 Internal rate of return.
y y pprofitability in 2010 in terms of new business relative to total funds invested and economic risk capital employed
y y pprofitability in 2010 in terms of new business relative to total funds invested and economic risk capital employed

Munich Re
400
Best-estimate mortality Statutory result
IFRS result
Life reinsurance business under different accounting regimes
10-year level-premium term insurance110-year level-premium term insurance1
Illustrative
Life reinsurance
600
75% extra mortality from year 5 to year 8
50
100
150
200
250
300
350 MCEV earnings
–200
0
200
400
64Analysts' Conference 2011
–100
–50
0
1 2 3 4 5 6 7 8 9 10
MCEV provides for most comprehensive earnings disclosure
1 Mortality business; annual level premium payments over 10-years of policy duration.
–600
–400
1 2 3 4 5 6 7 8 9 10
Life reinsurance
Different impacts on IFRS and MCEV basis
€m
LTC reserve strengthening US 2010LTC reserve strengthening US 2010
€m
IFRS technical result incl
Favourable mortality experience (illustrative)Favourable mortality experience (illustrative)
IFRS result ( ft
IFRS result ( ft Accelerated amortisation of
future margins (DAC write down)
Unlocking of assumptions for future experience (reserve strengthening)
Total after-tax result impact(pre-tax: –€315m)
€m
Current year difference from expected statutory result (Experience variance)
IFRS technical result incl. current year positive actual-to-expected deviation
No reserve change(locked-in assumptions)
Total pre-tax result impact
€m
Current year difference from expected statutory result (Experience variance)
(after-tax)(after-tax)
MCEV earnings (after-tax)
MCEV earnings (after-tax)
20
0
20
5
–26
–189
–215
–86
65Analysts' Conference 2011
MCEV: Full and immediate recognition of positive or negative impacts
( p )
Expected impact on future years‘ statutory results (Operating assumption change)
Total after-tax earnings impact
( p )
Expected impact on future years‘ statutory results (Operating assumption change)
Total after-tax earnings impact
))
100
105
–248
–334
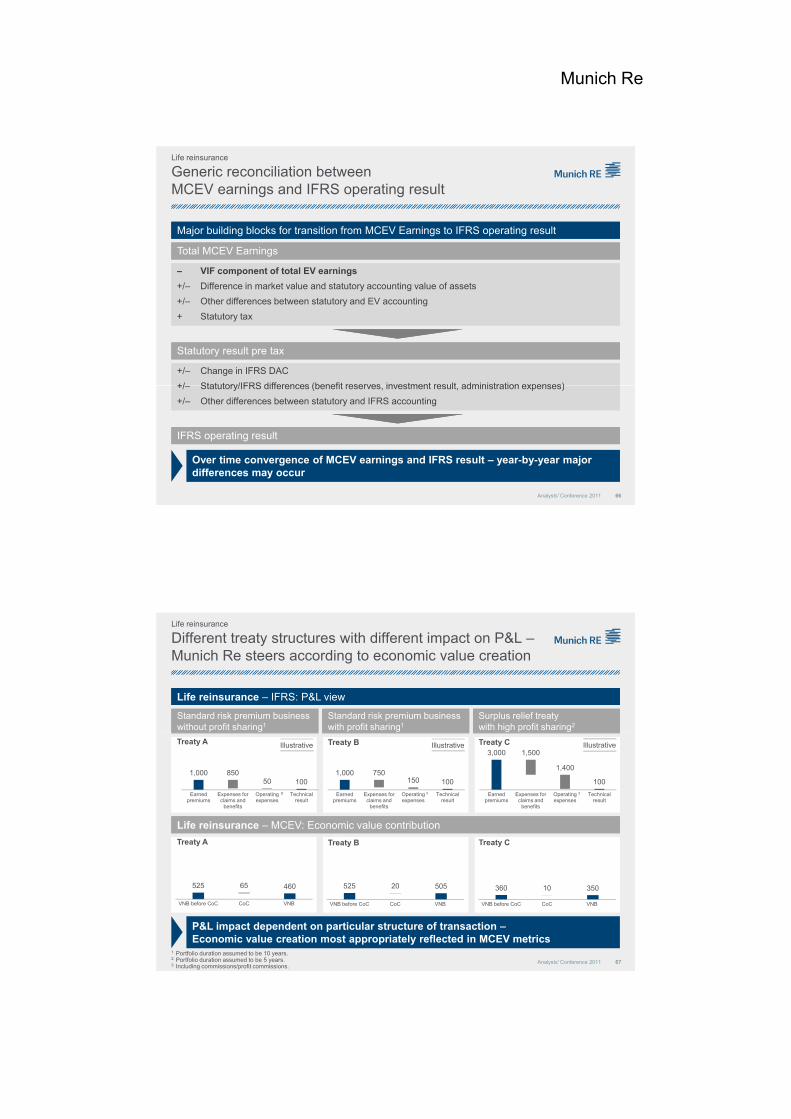
Munich Re
Major building blocks for transition from MCEV Earnings to IFRS operating resultMajor building blocks for transition from MCEV Earnings to IFRS operating result
Total MCEV EarningsTotal MCEV Earnings
Life reinsurance
Generic reconciliation between MCEV earnings and IFRS operating result
Statutory result pre taxStatutory result pre tax
– VIF component of total EV earnings
+/– Difference in market value and statutory accounting value of assets
+/– Other differences between statutory and EV accounting
+ Statutory tax
– VIF component of total EV earnings
+/– Difference in market value and statutory accounting value of assets
+/– Other differences between statutory and EV accounting
+ Statutory tax
+/– Change in IFRS DAC
+/ Statutory/IFRS differences (benefit reserves investment result administration expenses)
+/– Change in IFRS DAC
+/ Statutory/IFRS differences (benefit reserves investment result administration expenses)
66Analysts' Conference 2011
Over time convergence of MCEV earnings and IFRS result – year-by-year major differences may occur
IFRS operating resultIFRS operating result
+/– Statutory/IFRS differences (benefit reserves, investment result, administration expenses)
+/– Other differences between statutory and IFRS accounting
+/– Statutory/IFRS differences (benefit reserves, investment result, administration expenses)
+/– Other differences between statutory and IFRS accounting
Different treaty structures with different impact on P&L –Munich Re steers according to economic value creation
Standard risk premium business without profit sharing1Standard risk premium business without profit sharing1
Standard risk premium business with profit sharing1Standard risk premium business with profit sharing1
Surplus relief treaty with high profit sharing2 Surplus relief treaty with high profit sharing2
Life reinsurance – IFRS: P&L viewLife reinsurance – IFRS: P&L view
Life reinsurance
1,000 85050 100
Earned premiums
Expenses for claims and
benefits
Operating expenses
Technical result
3
Life reinsurance – MCEV: Economic value contributionLife reinsurance – MCEV: Economic value contribution
1,000 750150 100
Earned premiums
Expenses for claims and
benefits
Operating expenses
Technical result
3,000 1,500
1,400
100
Earned premiums
Expenses for claims and
benefits
Operating expenses
Technical result
IllustrativeIllustrativeTreaty A Treaty B Treaty C Illustrative
Treaty A Treaty B Treaty C
3 3
67Analysts' Conference 2011
1 Portfolio duration assumed to be 10 years.2 Portfolio duration assumed to be 5 years.3 Including commissions/profit commissions.
525 65 460
VNB before CoC CoC VNB
P&L impact dependent on particular structure of transaction –Economic value creation most appropriately reflected in MCEV metrics
525 20 505
VNB before CoC CoC VNB
360 10 350
VNB before CoC CoC VNB

Munich Re
Typical large-volume deal structure (solvency relief)
Simplified structure of a solvency relief block deal in life reinsuranceSimplified structure of a solvency relief block deal in life reinsurance
Sample balance sheet before reinsuranceSample balance sheet before reinsurance Sample balance sheet after reinsuranceSample balance sheet after reinsuranceReinsurance contractReinsurance contract
Life reinsurance
300
600
Assets Equity and liabilities
Required solvency capital
Assets
Liab.
Capital
-150
650
350150
300
Assets Equity and liabilities
Required solvency capital
Liab.
Capital
1
2
6 5
Assets
3
4
7
Illustrative
300
200
100850
250
-150
1,000
68Analysts' Conference 2011
Loss in asset values reduces capital base
Loss in asset values reduces capital base
1 Capital falls below acceptable level
Capital falls below acceptable level
2 Strengthening of solvency ratioStrengthening of solvency ratio
6Solvency capital credit from reinsurance
Solvency capital credit from reinsurance
5Commission strengthens capital base
Commission strengthens capital base
4Reserve transferReserve transfer
3
Net cash flow to reinsurer
7 Commission determined in such a way that net cash flow covers policyholder benefits, cost of capital and profit margin for the reinsurer
Commission determined in such a way that net cash flow covers policyholder benefits, cost of capital and profit margin for the reinsurer
Effective balance sheet management tool for our clients utilising in-force portfolios with limited experience volatility
New businessNew business In-force businessIn-force business
Value f
Value f
Measures value creation fromMeasures value creation fromMeasures deviation between actual and expectedMeasures deviation between actual and expected
Life reinsurance
Life reinsurance steering parameters
of new businessof new business
Measures value creation from new businessMeasures value creation from new business
RoRaC-spreadRoRaC-spread
Measures return on economic risk capitalMeasures return on economic risk capital
Experience variances (past period)
Experience variances (past period)
actual and expected performance during year just ended
actual and expected performance during year just ended
To oscillate around zero on average over timeTo oscillate around zero on average over time
Operating assumption Operating assumption
Measures value adjustment for future yearsMeasures value adjustment for future years
Side conditionsSide conditions
69Analysts' Conference 2011
IRR spreadIRR spread
Measures return on total capital invested in new businessMeasures return on total capital invested in new business
changes(future periods)
changes(future periods)
To oscillate around zero on average over time (unless portfolio enhancement action is taken)
To oscillate around zero on average over time (unless portfolio enhancement action is taken)
MCEV allows for reflection of cash and free capital generation

Munich Re
RoRaC-/IRR-spread1 and payback period2 in new businessRoRaC-/IRR-spread1 and payback period2 in new business
IRR-Spread
Life reinsurance
Relative profitability of new business in linewith corporate requirements under all relevant metrics
20% Very satisfactory profitability levels,
both relative to economic risk Very satisfactory profitability levels,
both relative to economic risk
Cash
RoRaC-Spread
Payback period (in years)
0%
5%
10%
15%
0% 5% 10% 15% 20% 25%
10
20092008
2010
Payback period of 2009 reflects h t d ti f t f th
Payback period of 2009 reflects h t d ti f t f th
both relative to economic risk capital employed (RoRaC) and total investment (IRR) in new business
2009 new business heavily influenced by highly profitable large-volume deals; effect in 2010 slightly less pronounced
both relative to economic risk capital employed (RoRaC) and total investment (IRR) in new business
2009 new business heavily influenced by highly profitable large-volume deals; effect in 2010 slightly less pronounced
70Analysts' Conference 2011
1 Spread in addition to reference rate (weighted-average swap yield curves).2 Number of years it takes to amortise the total investment in new business through future shareholder cash flows
(discounted with risk free reference rates).
0
2
4
6
8
2008 2009 2010
shorter duration of most of the large-volume deals
Large-volume deals impact reduced in 2010
shorter duration of most of the large-volume deals
Large-volume deals impact reduced in 2010
Adjusted net worth (ANW) developmentAdjusted net worth (ANW) development
€mIn-forceIn-force
New businessNew business
Life reinsurance
In-force portfolio generates ample free surplus for funding attractive new business
In-force generated €624m in cash, representing (extraordinarily high)
In-force generated €624m in cash, representing (extraordinarily high)
2 471 2 227 2 816
584 1,452
766–686+868
–244+589
+182
+345
+527–97
+624
Change in RC
Change in ANW
Change in FS
"Cash generation"
"Free capital generation"
p g ( y g )15% of value of in-force at beginning of the year
Roughly 10% of initial required capital released through run-off
79% of free capital generated from in-force (€686m) invested in new business at attractive terms
Thereof only 11% (€97m) cash invested in new business
p g ( y g )15% of value of in-force at beginning of the year
Roughly 10% of initial required capital released through run-off
79% of free capital generated from in-force (€686m) invested in new business at attractive terms
Thereof only 11% (€97m) cash invested in new business
71Analysts' Conference 2011
2,471 2,227 2,816
1.1.2010 31.12.2010
Free surplus (FS)
Required capital (RC)
21
Despite large new business volumes – Strong capital and margin release from in-force makes life reinsurance an important source of capital and cash generation
invested in new business
Beyond this investment in new business, free capital of €182 has been generated
invested in new business
Beyond this investment in new business, free capital of €182 has been generated
1 After opening adjustments (FX adjustments).2 Before closing adjustments (FX adjustments and capital movements).For details please refer to Slide 107.
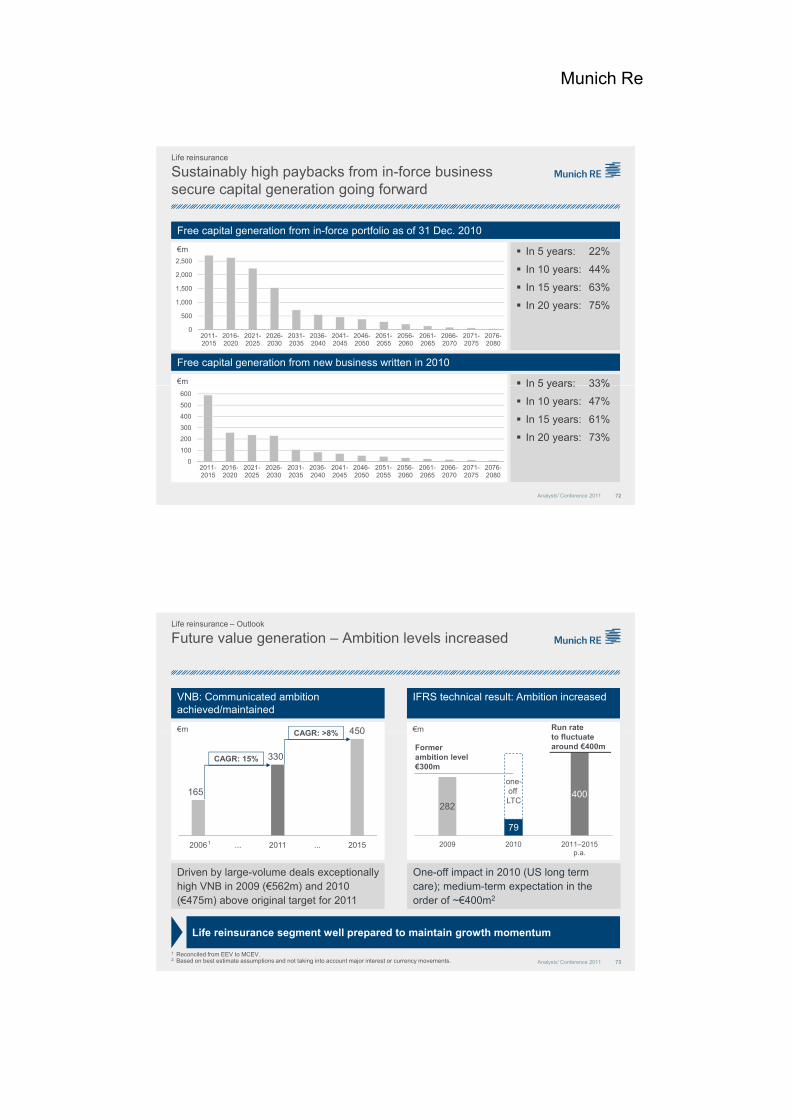
Munich Re
In 5 years: 22%
I 10 44%
In 5 years: 22%
I 10 44%
In-force portfolioFree capital generation from in-force portfolio as of 31 Dec. 2010Free capital generation from in-force portfolio as of 31 Dec. 2010
Life reinsurance
Sustainably high paybacks from in-force business secure capital generation going forward
€m
2,500
In 10 years: 44%
In 15 years: 63%
In 20 years: 75%
In 10 years: 44%
In 15 years: 63%
In 20 years: 75%
Free capital generation from new business written in 2010Free capital generation from new business written in 2010
In 5 years: 33% In 5 years: 33%€m
0
500
1,000
1,500
2,000
2011-2015
2016-2020
2021-2025
2026-2030
2031-2035
2036-2040
2041-2045
2046-2050
2051-2055
2056-2060
2061-2065
2066-2070
2071-2075
2076-2080
72Analysts' Conference 2011
In 5 years: 33%
In 10 years: 47%
In 15 years: 61%
In 20 years: 73%
In 5 years: 33%
In 10 years: 47%
In 15 years: 61%
In 20 years: 73%
0
100
200
300
400
500
600
2011-2015
2016-2020
2021-2025
2026-2030
2031-2035
2036-2040
2041-2045
2046-2050
2051-2055
2056-2060
2061-2065
2066-2070
2071-2075
2076-2080
B E = ZeroB E = Zero 450 B E = ZeroB E = Zero Run rate €m €m
Life reinsurance – Outlook
Future value generation – Ambition levels increased
VNB: Communicated ambition achieved/maintainedVNB: Communicated ambition achieved/maintained
IFRS technical result: Ambition increasedIFRS technical result: Ambition increased
CAGR: >8%B. E. = ZeroB. E. = Zero
165
330
450
2006 ... 2011 ... 2015
B. E. = ZeroB. E. = Zero
282
79
400
2009 2010 2011–2015 p a
to fluctuate around €400m
CAGR: 15%
1
Former ambition level €300m
CAGR: >8%
one-off LTC
73Analysts' Conference 2011
1 Reconciled from EEV to MCEV.2 Based on best estimate assumptions and not taking into account major interest or currency movements.
One-off impact in 2010 (US long term care); medium-term expectation in the order of ~€400m2
One-off impact in 2010 (US long term care); medium-term expectation in the order of ~€400m2
Driven by large-volume deals exceptionally high VNB in 2009 (€562m) and 2010 (€475m) above original target for 2011
Driven by large-volume deals exceptionally high VNB in 2009 (€562m) and 2010 (€475m) above original target for 2011
Life reinsurance segment well prepared to maintain growth momentum
p.a.

Munich Re
Growth fostered by business initiatives
Financially motivated reinsuranceFinancially motivated reinsurance
Expertise and capital strength
Outstanding product development and
Market development AsiaMarket development Asia
Life reinsurance – Strategic initiatives
Large-volume deals
Customised reinsurance solutions
STRATEGICINITIATIVESInnovation
Coverage of financial guarantees and embedded options
St i k t i l t d
Outstanding product development and consulting services
Tailor-made reinsurance offerings
Selective approach
In-depth actuarial research
Start offering solutions
Customised reinsurance solutions
Capacity with high security
Continued demand
74Analysts' Conference 2011
Strong risk management implemented
State-of-the-art modelling capabilities
Asset protectionAsset protection LongevityLongevity
Sustainable growth through consistent execution of business initiatives
Agenda
Turning risk into sustainable value Nikolaus von Bomhard
Fi i l hi hli ht 2010 Jö S h idFinancial highlights 2010 Jörg Schneider
Risk management Joachim Oechslin
Non-life reinsurance Torsten Jeworrek
Life reinsurance Joachim Wenning
75Analysts' Conference 2011
Primary insurance Torsten Oletzky
Backup
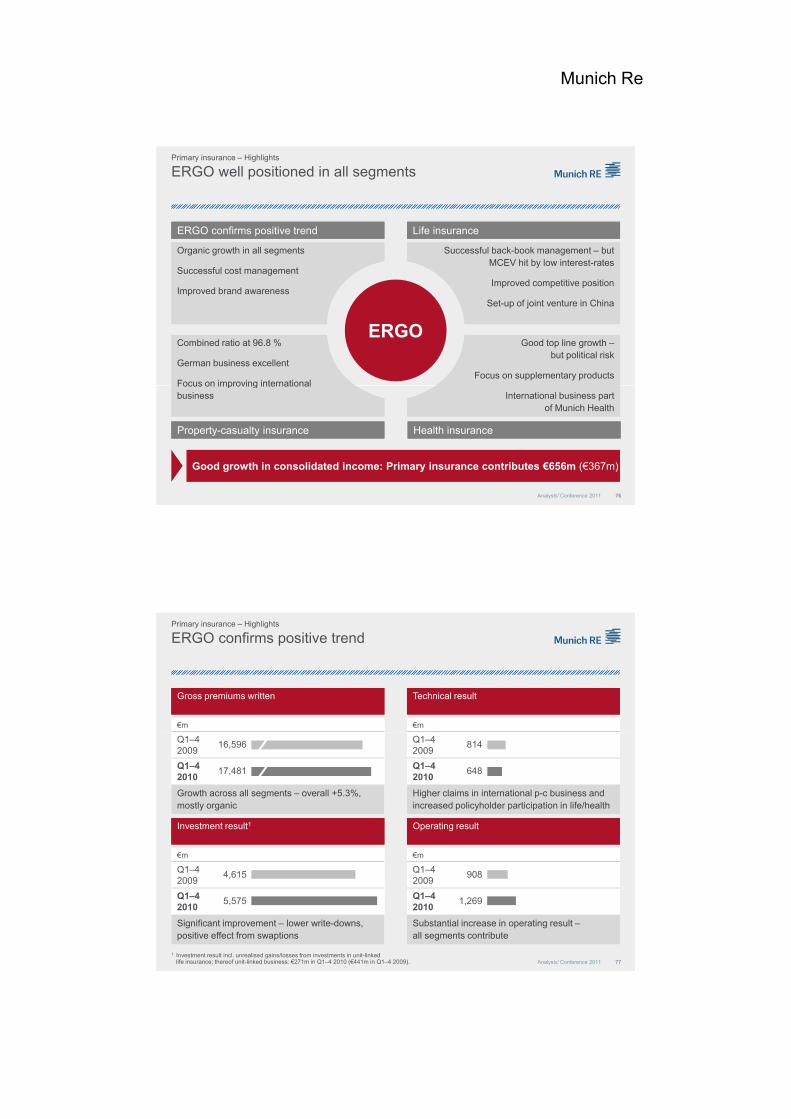
Munich Re
ERGO well positioned in all segments
ERGO confirms positive trend ERGO confirms positive trend
Successful back-book management – but MCEV hit by low interest-rates
Life insuranceLife insurance
Primary insurance – Highlights
Organic growth in all segments
ERGOCombined ratio at 96.8 %
German business excellent
Focus on improving international
y
Improved competitive position
Set-up of joint venture in China
Good top line growth –but political risk
Focus on supplementary products
Successful cost management
Improved brand awareness
76Analysts' Conference 2011
Focus on improving international business
Property-casualty insuranceProperty-casualty insurance
International business part of Munich Health
Health insurance Health insurance
Good growth in consolidated income: Primary insurance contributes €656m (€367m)
ERGO confirms positive trendPrimary insurance – Highlights
Technical resultTechnical resultGross premiums writtenGross premiums written
€m €m
Growth across all segments – overall +5.3%, mostly organic
Higher claims in international p-c business and increased policyholder participation in life/health
Q1–42009
16,596
Q1–42010
17,481
Q1–42009
814
Q1–42010
648
Operating resultOperating resultInvestment result1Investment result1
77Analysts' Conference 2011
1 Investment result incl. unrealised gains/losses from investments in unit-linked life insurance; thereof unit-linked business: €271m in Q1–4 2010 (€441m in Q1–4 2009).
Significant improvement – lower write-downs, positive effect from swaptions
Substantial increase in operating result –all segments contribute
€m
Q1–42009
4,615
Q1–42010
5,575
€m
Q1–42009
908
Q1–42010
1,269

Munich Re
Value of new business increased to €141m (€132m)
Value of new business increased to €141m (€132m)
€m
MCEV 31.12.2009 5,126
Opening adjustments 16
Primary insurance – Market Consistent Embedded Value 2010
MCEV result
11
€141m (€132m). VNB up in life, but down in health
Change in MCEV stems mostly from interest-rate and credit spread development:
Effect is largest f G lif
€141m (€132m). VNB up in life, but down in health
Change in MCEV stems mostly from interest-rate and credit spread development:
Effect is largest f G lif
Adjusted MCEV 31.12.2009 5,141
Value of new business 141
Expected return 160
Experience variances 27
Assumption changes –198
Other operating variance 244
Operating MCEV earnings 2010 375
22
11
78Analysts' Conference 2011
for German life (guarantees) …
… while only small decrease for international life (less guarantees) and health business
for German life (guarantees) …
… while only small decrease for international life (less guarantees) and health business
Operating MCEV earnings 2010 375
Economic variances –1,099
Other non-operating variance 0
Total MCEV earnings 2010 –724
Closing adjustments –309
MCEV 31.12.2010 4,108
22
Growth from all business segmentsPrimary insurance – Premium development
€m
Gross premiums written Q1–4 2009 16,596
Foreign exchange
Life statutory premiums:
IFRS premiums
Life statutory premiums:
IFRS premiums
Foreign-exchange effects 143
Divestment/ Investment –
Organic change 742
Gross premiums written Q1–4 2010 17,481
Breakdown by segment
Property-casualty5 498 (31%)
Life6 484 (37%)
79Analysts' Conference 2011
IFRS premiums € 6,484 m (▲ 3.0%)
Savings component of unit-linked and capitalisation products €1,674m (▲ 5.9%)
Total premiums €8,158m (▲ 3.6%)
IFRS premiums € 6,484 m (▲ 3.0%)
Savings component of unit-linked and capitalisation products €1,674m (▲ 5.9%)
Total premiums €8,158m (▲ 3.6%)
by segment(segmental, not consolidated)
5,498 (31%) (▲ 7.2%)
6,484 (37%)(▲ 3.0%)
HealthGermany
5,499 (32%) (▲ 6.3%)

Munich Re
Administrative expense ratio – Life1Administrative expense ratio – Life1 Administrative expense ratio – Health1Administrative expense ratio – Health1
Cost targets mostly achievedPrimary insurance – Expenses
ERGOMarket
%
4 3
ERGOMarket
%Target2010
Target2010
Reduction of 1,800 in FTEs accomplished
Cost target in life insurance achieved –despite premium growth 2007 vs. 2010 lower than expected
Reduction of 1,800 in FTEs accomplished
Cost target in life insurance achieved –despite premium growth 2007 vs. 2010 lower than expected
Operating expense ratio – Non-life1Operating expense ratio – Non-life1
3.73.3
3.93.5 3.4 3.3 3.1 2.9
2.73.5 3.4
3.3 3.2 3.1 3.0 2.8 2.7
2002 2003 2004 2005 2006 2007 2008 2009 2010
Market 4.33.7
3.5 3.4 3.33.0 2.9 2.7
2.63.2 3.1 2.9 2.9 2.8 2.7 2.6 2.5
2002 2003 2004 2005 2006 2007 2008 2009 2010
Market
ERGOMarket
%
2.9%
Target2010
30 5%
2.8%
80Analysts' Conference 2011
than expected
Health target clearly overachieved
Non-life target not fully met: portfolio mix change, costs of new brand strategy. However, strong combined ratio in Germany (89.8%)
than expected
Health target clearly overachieved
Non-life target not fully met: portfolio mix change, costs of new brand strategy. However, strong combined ratio in Germany (89.8%)
1 Germany, gross figures German GAAP (HGB).
Reduction of expense ratios very successful overall
34.8 33.5 32.6 32.5 31.8 32.2 31.2 31.2 31.9
26.9 26.1 25.6 25.8 25.9 25.9 26.0 26.0
2002 2003 2004 2005 2006 2007 2008 2009 2010
30.5%
Better consolidated result – Small positive effect from swaptions
Rise in premiums mainly driven by higher volume of new business with single premiums
Increased income from technical interest esp.
Rise in premiums mainly driven by higher volume of new business with single premiums
Increased income from technical interest esp.
Primary insurance – Life
€m Q1–4 2010
Q1–4 2009
Gross premiums written 6,484 6,294due to higher policyholder participation on account of higher investment result
Higher net expenses for claims and benefits owing to higher allocation to provision for premium refunds (RfB) and higher allocation to provision for future policy benefits in line with premium growth
Improved investment result driven by swaptionresult, allowing for higher policyholder
i i i
due to higher policyholder participation on account of higher investment result
Higher net expenses for claims and benefits owing to higher allocation to provision for premium refunds (RfB) and higher allocation to provision for future policy benefits in line with premium growth
Improved investment result driven by swaptionresult, allowing for higher policyholder
i i i
p
Income from technical interest
3,052 2,874
Net expenses for claims and benefits
8,170 7,461
Net operating expenses 1,090 1,065
Technical result –6 93
I t t lt 3 485 3 086
81Analysts' Conference 2011
participation
Previous year impacted by goodwill impairments of €47m (mainly BACAV)
Swaption impact on consolidated result amounts to €19m in Q1–4 2010 (Q1–4 2009: –€70m)
participation
Previous year impacted by goodwill impairments of €47m (mainly BACAV)
Swaption impact on consolidated result amounts to €19m in Q1–4 2010 (Q1–4 2009: –€70m)
Investment result 3,485 3,086
Non-technical result 361 125
Operating result 355 218
Consolidated result 172 27

Munich Re
New business life insurance (statutory premiums) –International business: healthy growth
Primary insurance – Life – New business
CommentsCommentsTotalTotal
€mTotal APE1
Single premiums
Regular premiums
Germany
Strong growth in traditional single premium annuity
Germany
Strong growth in traditional single premium annuity
€m1
GermanyGermany InternationalInternational
Q1–4 2009
2,503 705
Q1–42010
2,920 752
∆ 16.7% 1.2% 20.6% 6.7%
€m1
Single i
Regular i
Regular i
Single i
business
Only small decrease in regular premium business –Mostly in line with market
International
Strong growth in Poland (especially bancassurance)
Austrian new business (APE) 15.1% below excellent previous year’s figures, as expected
business
Only small decrease in regular premium business –Mostly in line with market
International
Strong growth in Poland (especially bancassurance)
Austrian new business (APE) 15.1% below excellent previous year’s figures, as expected
505
511
1,998
2,409
82Analysts' Conference 2011
Total APE1
Q1–4 2009
903 239
Q1–42010
980 260
∆ 8.5% 9.1% 8.4% 8.8%
1 Annual premium equivalent (APE = regular premiums + 10% single premiums).
Total APE1
Q1–4 2009
1,600 466
Q1–42010
1,940 492
∆ 21.3% –2.6% 27.7% 5.6%
premiumspremiumspremiums premiums
165
180
738
800
340
331
1,260
1,609
German business facing well-known challenges with an improved competitive position
Primary insurance – Life
Policyholder bonuses: ERGO vs. MarketPolicyholder bonuses: ERGO vs. Market
Make use of improved competitive position
Market has followed ERGO in lowering
Make use of improved competitive position
Market has followed ERGO in lowering
Challenges in 2011Challenges in 2011
4.4%
Corporate pension business transferred to Corporate pension business transferred to
Victoria life closed for new businessVictoria life closed for new business
Market has followed ERGO in lowering bonus rates to more reasonable levels
Former Victoria salesforce now with competitive products
Continued focus on back-book management: hedging and duration management
Introduction of “Zinszusatzreserve” a positive factor
Strengthening of reserves in reaction to lower interest-rates
2004 2005 2006 2007 2008 2009 2010 2011
ERGO Life
Victoria Life
Market
4.2
4.0
3.8
3.6
3.4
3.2
83Analysts' Conference 2011
Corporate pension business transferred to ERGO life: >€400m in premiums and >€6bn in provisions/assets
Adjustment of asset allocation to the aspects of a closed book
Joint administration with ERGO Life – No deterioration of cost result
Corporate pension business transferred to ERGO life: >€400m in premiums and >€6bn in provisions/assets
Adjustment of asset allocation to the aspects of a closed book
Joint administration with ERGO Life – No deterioration of cost result
lower interest rates
Should result in more market discipline with regard to policyholders’ bonus participation
Reduction of technical interest-rate to 1.75% as of 1 January 2012 – Lowered guarantee increases manoeuvring room for life insurers, but decreases relative product attractiveness
Increase share of new product types

Munich Re
Successful expansion of bancassurance activitiesPrimary insurance – Life
AustriaAustria PolandPoland
Strong premium growth (+116%)2
in 2010; market growth of 4.3%3 Strong premium growth (+116%)2
in 2010; market growth of 4.3%3 As expected, lower premiums in 2010 (–9.6%); 2009 was extra-
ordinary year with high single-premium business As expected, lower premiums in 2010 (–9.6%); 2009 was extra-
ordinary year with high single-premium business
Total premiums lifeTotal premiums life Total premiums lifeTotal premiums lifeStrategic
g
#11 in Polish life market; significant increase in market share
Successful expansion of bancassurance activities with UniCredit Group in Poland
Focus on index-linked and unit-linked products
g
#11 in Polish life market; significant increase in market share
Successful expansion of bancassurance activities with UniCredit Group in Poland
Focus on index-linked and unit-linked products
y y g g p
#3 in Austrian life market
PMI of Bank Austria Creditanstalt Insurance (BACAV) completed
Sophisticated product development know-how (innovator in unit-linked and index-linked products)
ERGO’s International Bancassurance Centre of Competence located in Vienna; co-operation with UniCredit in Romania and with DnB Nord in Latvia and Lithuania started in 2010
Hub approach (Vienna) to leverage synergies in CEE
84Analysts' Conference 2011
pp pp
€m
742914
826
2008 2009 2010
1 2008 as-if figure; acquisition of majority in BACAV in 2009.2 ERGO growth in local currency IFRS.3 Market growth Q3 2010 in local GAAP.
€m
77 93
215
2008 2009 2010
bankpartner-ships in Europe with:
1
RUSEST
LAT
LTU
PL
CZSK
HURO
SLO
AUT
HR
GR
GER
Market entry in China: Joint venture signed in January 2011
Primary insurance – Life
ERGO Beijing Representative Office
ERGO sets up a greenfield joint venture for life insurance together with Shandong State-owned
ERGO sets up a greenfield joint venture for life insurance together with Shandong State-owned
HighlightsHighlights
ERGO Jinan Representative Office - Future headquarters of ERGO China life joint venture
g gAssets Investment Holding Company (SSAIH)
JV agreement signed in January 2011
ERGO and SSAIH each hold a 50% share
The financial investor SSAIH is an investment vehicle for the provincial government of Shandong
Founded in 2005
Managed capital funds equivalent to approx. €2bn in 2010
Employs more than 8 000 people
g gAssets Investment Holding Company (SSAIH)
JV agreement signed in January 2011
ERGO and SSAIH each hold a 50% share
The financial investor SSAIH is an investment vehicle for the provincial government of Shandong
Founded in 2005
Managed capital funds equivalent to approx. €2bn in 2010
Employs more than 8 000 peopleShandong facts & figuresShandong facts & figures
85Analysts' Conference 2011
Employs more than 8,000 people
Steered and managed by Shandong SASAC
Operations will commence when regulatory approval has been obtained – Licensing process expected to take about two years
Primary target group: private customers, leveraging government-related business
Employs more than 8,000 people
Steered and managed by Shandong SASAC
Operations will commence when regulatory approval has been obtained – Licensing process expected to take about two years
Primary target group: private customers, leveraging government-related business
Population of 94 million
GDP: €380bn in 2009 – Second-largest province in China
Insurance market: €9.9bn in 2009 – Third-largest insurance market in China
Premium income has risen by an average of 24% over the past five years
Population of 94 million
GDP: €380bn in 2009 – Second-largest province in China
Insurance market: €9.9bn in 2009 – Third-largest insurance market in China
Premium income has risen by an average of 24% over the past five years

Munich Re
Very satisfactory consolidated result
Premium increase mainly owing to premium adjustments in Germany
Higher income from technical interest
Premium increase mainly owing to premium adjustments in Germany
Higher income from technical interest
€m Q1–4 2010
Q1–42009
Gross premiums written 5,499 5,171
Primary insurance – Health
mainly driven by higher policyholder participation on account of higher investment result
Rise in net expenses for claims and benefits attributable to increased policyholder participation and higher claims payments
Reduced net operating expenses due to lower DAC amortisation and higher reinsurance commissions received
p ,
Income from technicalinterest 1,431 1,172
Net expenses for claimsand benefits 5,674 5,085
Net operating expenses 600 654
Technical result 418 361
86Analysts' Conference 2011
reinsurance commissions received
Investment result increased due to higher regular income, improved result from write-ups/write-downs and higher result from disposals
Positive effect from tax refunds
reinsurance commissions received
Investment result increased due to higher regular income, improved result from write-ups/write-downs and higher result from disposals
Positive effect from tax refunds
Investment result 1,317 1,058
Non-technical result –182 –145
Operating result 236 216
Consolidated result 165 83
Growth initiatives for supplementary businessPrimary insurance – Health
€mTotal
Compre-hensive
Supple-mentary
Spur growth in supplementary health insurance with optimised new product portfolio
Spur growth in supplementary health insurance with optimised new product portfolio
Supplementary health insuranceSupplementary health insuranceNew business total1New business total1
Q1–4 2009
247 158 89
Q1–42010
299 205 94
∆ 21.1% 29.7% 5.6%
Good growth in 2010 also due to large Group insurance contract acquired in 2009
Good growth in 2010 also due to large Group insurance contract acquired in 2009
p p p
Introduction of innovative after-the-event-product "instant dental cover" in April 2011 at ERGO Direct; limited budget for 2011 (50,000 policies)
ERGO Direct with focus on internet as sales channel – long-term target to increase share of new business from 10% (2010) to 50% (2015)
p p p
Introduction of innovative after-the-event-product "instant dental cover" in April 2011 at ERGO Direct; limited budget for 2011 (50,000 policies)
ERGO Direct with focus on internet as sales channel – long-term target to increase share of new business from 10% (2010) to 50% (2015)Comprehensive health insuranceComprehensive health insurance
Travel insuranceTravel insurance
87Analysts' Conference 2011
insurance contract acquired in 2009
Short-term: favourable political climate, e.g. abolition of 3-year waiting period
Mid-term: possibility of less favourable political climate requires preparation. Stabilisation of comprehensive health insurance and enhancement of underwriting
insurance contract acquired in 2009
Short-term: favourable political climate, e.g. abolition of 3-year waiting period
Mid-term: possibility of less favourable political climate requires preparation. Stabilisation of comprehensive health insurance and enhancement of underwriting
Acquire more cooperation partners and reduce dependency on small number of larger partners
Focus on increasing share of all-year cover (in contrast to single-holiday cover)
Improve operations, implement best practices and exchange knowledge internationally
Acquire more cooperation partners and reduce dependency on small number of larger partners
Focus on increasing share of all-year cover (in contrast to single-holiday cover)
Improve operations, implement best practices and exchange knowledge internationally
1 Without travel business which is short-term business only.

Munich Re
Improved consolidated result despite higher claims and goodwill impairment losses
Premium increase in all lines of business esp. driven by strengthening of distribution channels in international business as well
i i f i h
Premium increase in all lines of business esp. driven by strengthening of distribution channels in international business as well
i i f i h
€m Q1–4 2010
Q1–42009
Gross premiums written 5,498 5,131
Primary insurance – Property-casualty
as positive foreign currency exchange effects (esp. Poland)
Increased claims expenses driven by major claims in Germany and international business (storms, floods and strong winter) as well as competitive motor markets
Increase in net operating expenses owing to higher acquisition costs from bank distribution
p , ,
Income from technicalinterest 174 150
Net expenses for claimsand benefits 3,130 2,856
Net operating expenses 1,621 1,502
Technical result 236 360
88Analysts' Conference 2011
distribution
Improved investment result attributable to higher regular income and improved result from disposals
Goodwill impairment losses in Q2 2010: ERGO Isvicre Sigorta €109m
distribution
Improved investment result attributable to higher regular income and improved result from disposals
Goodwill impairment losses in Q2 2010: ERGO Isvicre Sigorta €109m
Investment result 773 471
Non-technical result 442 114
Operating result 678 474
Consolidated result 319 257
High claims activity in Germany and international business
Primary insurance – Property-casualty – Combined ratio
%
2008 90.9
Expense ratioLoss ratio
58.4 32.5
Germany: Continued low combined ratio (89.8%) despite Xynthia, floods and tornados
ERGO I t ti l C bi d
Germany: Continued low combined ratio (89.8%) despite Xynthia, floods and tornados
ERGO I t ti l C bi d
100
95
%
2009 93.2
2010 96.8
60.3
63.1
32.9
33.7
93.4 93.896.3
93.3
98.7100.4
89Analysts' Conference 2011
ERGO International: Combined ratio (107.8%) affected by floods and hard winter in Poland; intense competition in Turkey and Korea
Expense ratio higher – Strong business growth in international business
ERGO International: Combined ratio (107.8%) affected by floods and hard winter in Poland; intense competition in Turkey and Korea
Expense ratio higher – Strong business growth in international business
90
85
80
Q1 Q2 Q3 Q4 Q1 Q2 Q3 Q4 Q1 Q2 Q3 Q4
2008 2009 2010
87.8 88.6
93.390.3
94.5 93.6

Munich Re
Different situation for German and international business
€m
2010 2009
Primary insurance – Property-casualty
Germany Germany
€m
2010 2009
InternationalInternational
Gross premiums written 3,173 3,160
Technical result 347 396
Non-technical result 270 124
Operating result 617 520
Consolidated result 414 308
Gross premiums written 2,325 1,971
Technical result –111 –36
Non-technical result 172 –10
Operating result 61 –46
Consolidated result –95 –51
90Analysts' Conference 2011
German business grows only slightly (+0.4%) Good combined ratio at 89.8% (87.9%) Rise in expenses mainly due to new
brand strategy P&L includes ERGO corporate centre
German business grows only slightly (+0.4%) Good combined ratio at 89.8% (87.9%) Rise in expenses mainly due to new
brand strategy P&L includes ERGO corporate centre
International business with strong growth (+18.0%), mainly in Poland, Turkey, Greece Deterioration of combined ratio, 107.8%
(102.5%) Goodwill impairment of €109m in Turkey
International business with strong growth (+18.0%), mainly in Poland, Turkey, Greece Deterioration of combined ratio, 107.8%
(102.5%) Goodwill impairment of €109m in Turkey
Polish activities hurt by floods, winter and soft motor market
Primary insurance – Property-casualty
HighlightsHighlights
No. 2 in Polish p-c market; market share of 12.7% (Q3 2010)
No. 2 in Polish p-c market; market share of 12.7% (Q3 2010)
Gross written premiums P-CGross written premiums P-C
€m
711~780( )
Above market average premium growth1
Two-brand strategy: ERGO Hestia and MTU Diversified distribution approach
( ) Above market average premium growth1
Two-brand strategy: ERGO Hestia and MTU Diversified distribution approach
Increased combined ratio in 2010: Floods and harsh winter Challenges in Polish motor market
Measures taken in order to return to combined ratio below 100%: Revised tariffs in MTPL and own damage cover
Increased combined ratio in 2010: Floods and harsh winter Challenges in Polish motor market
Measures taken in order to return to combined ratio below 100%: Revised tariffs in MTPL and own damage cover
Combined ratio developmentCombined ratio development
602 595
2008 2009 2010 2011e
Combined ratio (net)Combined ratio (net)
%
91Analysts' Conference 2011
Revised tariffs in MTPL and own damage cover (price increase of 10%–20%)
Higher efficiency in claims management Active portfolio steering: share of motor reduced
from 63% (2008) to 55% (2010) New structure of nat cat products Ongoing improvement of underwriting practice
(esp. motor and property after winter/flood events 2010)
92.298.0
107.8~100.0
2008 2009 2010 2011e
1 P-C market growth 5.5% as at Q3 2010, ERGO 10.6% (local currency IFRS).

Munich Re
Measures taken for turnaround of Turkish activities Primary insurance – Property-casualty
Gross written premiums P-CGross written premiums P-C
€m367
313348 ~350
HighlightsHighlights
No. 6 in Turkish p-c market; 6.5% market share Premium growth of 11% in 2010 No. 6 in Turkish p-c market; 6.5% market share Premium growth of 11% in 2010 313
2008 2009 2010 2011e
Combined ratio (net)Combined ratio (net)
%132 0
g %g %
Increased combined ratio in 2010: Financial crisis in 2009 intensified competition
especially in motor (market combined ratio above 100% in almost all business lines)
Reserve strengthening due to new regulation Investments especially in staff, rebranding and in
IT in order to improve operational efficiency Measures taken in order to return to combined ratio
Combined ratio developmentCombined ratio development
92Analysts' Conference 2011
99.9118.2
132.0~115.0
2008 2009 2010 2011e
Measures taken in order to return to combined ratio below 100%: Increase in rates in MTPL by more than 15% in
2010 and decrease in number of policies Improvement of claims management and
operational efficiency Active portfolio steering: share of motor reduced
from 66% (2009) to 59% (2010)
Measures taken in order to return to combined ratio below 100%: Increase in rates in MTPL by more than 15% in
2010 and decrease in number of policies Improvement of claims management and
operational efficiency Active portfolio steering: share of motor reduced
from 66% (2009) to 59% (2010)
German business – Excellent performance overall; Focus on improving unprofitable lines ...
Primary insurance – Property-casualty
Portfolio split and combined ratios 20101Portfolio split and combined ratios 20101 Motor business to be improvedMotor business to be improved
Personal accident€774m
Other€221m (84.8%)
105 9108.1
Combined ratio %
Whole German market experiences negative trend
ERGO' f b dl i li ith
Whole German market experiences negative trend
ERGO' f b dl i li ith
(73.6%)Legal protection€419m (95.7%)
Total€3,107m
94.6
101.6
96.599.4
102.7105.9
94.8 95.6 95.798.4
101.9
103.7
2004 2005 2006 2007 2008 2009 2010
ERGO
Market
93Analysts' Conference 2011
ERGO's performance broadly in line with market, but ERGO’s share in motor business lower than market average
To return to positive results, ERGO
increased new business rates by ~5% (new TPL tariff introduced January 2011)
increases portfolio rates where possible
increases rates also for fleet business
Motor €617m
(108.1%)
Fire-property€604m (100.6%)
Liability€472m (90.7%)
1 German GAAP figures. (In Brackets: Combined ratio).

Munich Re
... and growing in profitable linesPrimary insurance – Property-casualty
Personal accident business Personal accident business
Leading position in pure-risk accident insurance (nearly 90% of portfolio)
Leading position in pure-risk accident insurance (nearly 90% of portfolio) Combined ratio % Premiums €m
Commercial / industrial business driver for profitable growthCommercial / industrial business driver for profitable growth
622 626 651 682 718 751 772
87.7 93.8 90.8 92.9 92.0 92.4 94.0
2004 2005 2006 2007 2008 2009 2010
Growth above market average for years
Two thirds of top 100 German companies are
Growth above market average for years
Two thirds of top 100 German companies are Homeowners’ difficult business regarding
profitability after deregulation Homeowners’ difficult business regarding
profitability after deregulation
Private fire and property Private fire and property
( y % p )
Focus on target-group-oriented assistance packages together with well-known partners, e.g. Rehab packages in cooperation with "Fitness
First" and Professional Associations' Hospitals More than 450,000 assistance packages sold
( y % p )
Focus on target-group-oriented assistance packages together with well-known partners, e.g. Rehab packages in cooperation with "Fitness
First" and Professional Associations' Hospitals More than 450,000 assistance packages sold
94Analysts' Conference 2011
ERGO customers
Growth initiative for 2011/12:
ERGO one of the leading insurers for renewable energy
Becoming leading insurer in marine hull
Expand out of Germany with activities in Netherlands, Austria and UK
ERGO customers
Growth initiative for 2011/12:
ERGO one of the leading insurers for renewable energy
Becoming leading insurer in marine hull
Expand out of Germany with activities in Netherlands, Austria and UK
Growth activities for commercial customers
New product "affordable justice for all" (legal advice, mediation)
Growth activities for commercial customers
New product "affordable justice for all" (legal advice, mediation)
Legal protection businessLegal protection business
ERGO with rate increases of 9.2% in 2011
Sales initiative to improve portfolio
ERGO with rate increases of 9.2% in 2011
Sales initiative to improve portfolio
Successful groundwork in 2010 provides good starting point for activities 2011
Primary insurance – New brand strategy
Renamings: ERGO Direkt ERGO Life Renamings:
ERGO Direkt ERGO Life
Legal milestones in 2010Legal milestones in 2010 Pleasing increase in brand awareness in 2010Pleasing increase in brand awareness in 2010
60 2 59 570.0
ERGO campaignPhase 1
%
ERGO Direkt, ERGO Life, ERGO P-C
Mergers:ERGO P-C, DKV, D.A.S.
Portfolio transfer:Corporate pensions from Victoria Life to ERGO Life
ERGO Direkt, ERGO Life, ERGO P-C
Mergers:ERGO P-C, DKV, D.A.S.
Portfolio transfer:Corporate pensions from Victoria Life to ERGO Life
1.63.9 6.4
9.9 11.6 12.7 15.612.2 12.7 13.1
21.3
33.440.0
50.7 51.056.6
60.2 59.554.9 54.9
0.0
10.0
20.0
30.0
40.0
50.0
60.0
Q1 2010
Q2 2010
Jul. 10 Aug. 10 Sep. 10 Oct. 10 Nov. 10 Dec. 10 January February
Spontaneous brandawareness
Promptedbrand awareness
95Analysts' Conference 2011
Clarity of communication Complete rebrush of all letters
to customers Revision of terms of contracts
for private customer products
Clarity of communication Complete rebrush of all letters
to customers Revision of terms of contracts
for private customer products
Customer participation Implementation of customer
advocate Implementation of customer
panel
Customer participation Implementation of customer
advocate Implementation of customer
panel
Products and services Expanding claims
management services Develop easy-to-understand
products
Products and services Expanding claims
management services Develop easy-to-understand
products
Strategic activities in 2011 focused onStrategic activities in 2011 focused on

Munich Re
TakeawaysPrimary insurance – Conclusion
2010 was a good year for ERGO – Pleasing growth of premiums and results2010 was a good year for ERGO – Pleasing growth of premiums and results
In Germany, delivery on brand promises is top priority for 2011In Germany, delivery on brand promises is top priority for 2011
International business: Focus on improvement of bottom-line result in non-life International business: Focus on improvement of bottom-line result in non-life
96Analysts' Conference 2011
Agenda
Turning risk into sustainable value Nikolaus von Bomhard
Fi i l hi hli ht 2010 Jö S h idFinancial highlights 2010 Jörg Schneider
Risk management Joachim Oechslin
Non-life reinsurance Torsten Jeworrek
Life reinsurance Joachim Wenning
97Analysts' Conference 2011
Primary insurance Torsten Oletzky
Backup
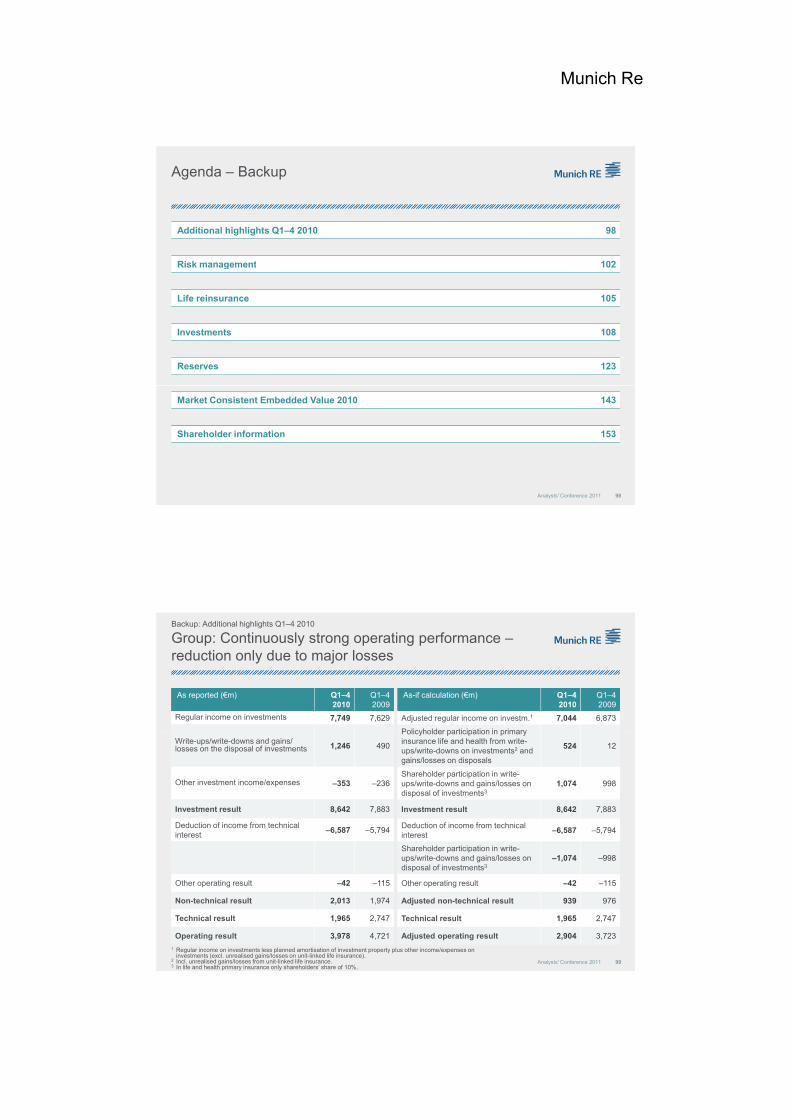
Munich Re
Agenda – Backup
Additional highlights Q1–4 2010 98
Risk management 102Risk management 102
Life reinsurance 105
Investments 108
Reserves 123
98Analysts' Conference 2011
Market Consistent Embedded Value 2010 143
Shareholder information 153
Group: Continuously strong operating performance –reduction only due to major losses
As reported (€m) Q1–4 2010
Q1–4 2009
Regular income on investments 7,749 7,629
As-if calculation (€m) Q1–4 2010
Q1–4 2009
Adjusted regular income on investm.1 7,044 6,873
Policyholder participation in primary
Backup: Additional highlights Q1–4 2010
Write-ups/write-downs and gains/ losses on the disposal of investments 1,246 490
Other investment income/expenses –353 –236
Investment result 8,642 7,883
Deduction of income from technical interest
–6,587 –5,794
Policyholder participation in primary insurance life and health from write-ups/write-downs on investments2 and gains/losses on disposals
524 12
Shareholder participation in write-ups/write-downs and gains/losses on disposal of investments3
1,074 998
Investment result 8,642 7,883
Deduction of income from technical interest
–6,587 –5,794
Shareholder participation in write-
99Analysts' Conference 2011
Other operating result –42 –115
Non-technical result 2,013 1,974
Technical result 1,965 2,747
Operating result 3,978 4,721
p pups/write-downs and gains/losses on disposal of investments3
–1,074 –998
Other operating result –42 –115
Adjusted non-technical result 939 976
Technical result 1,965 2,747
Adjusted operating result 2,904 3,723
1 Regular income on investments less planned amortisation of investment property plus other income/expenses on investments (excl. unrealised gains/losses on unit-linked life insurance).
2 Incl. unrealised gains/losses from unit-linked life insurance.3 In life and health primary insurance only shareholders’ share of 10%.
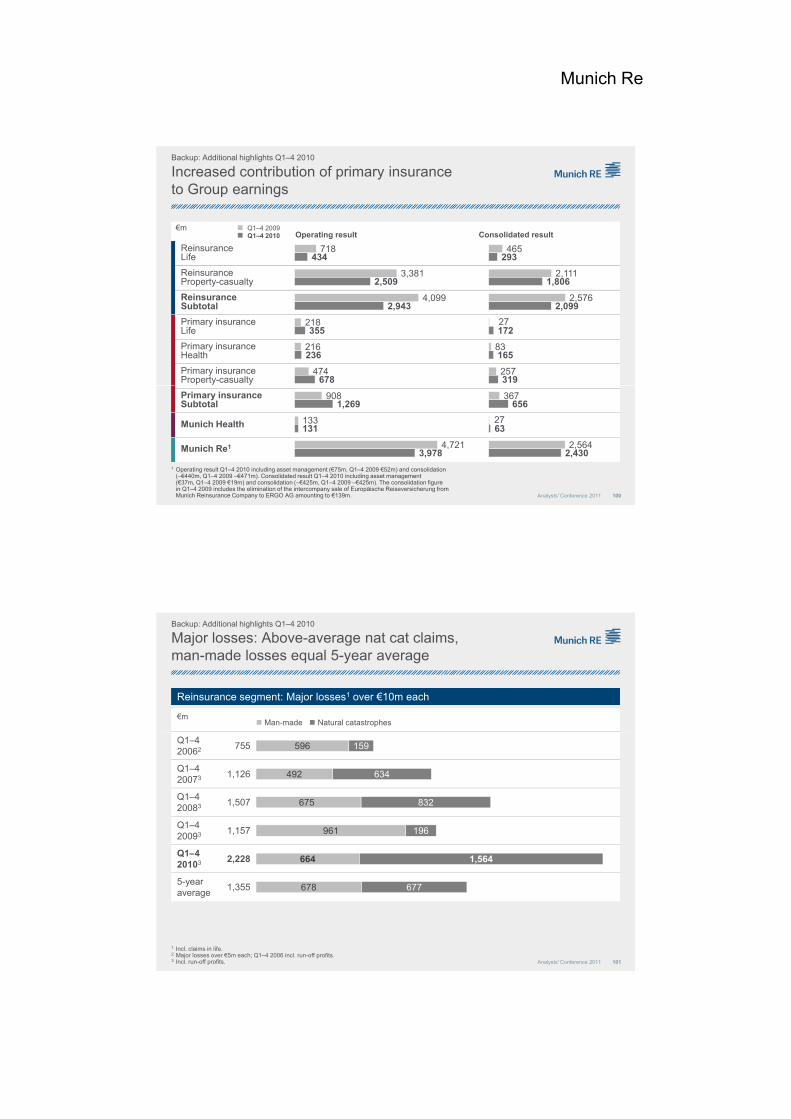
Munich Re
Increased contribution of primary insurance to Group earnings
€mOperating result Consolidated result
Reinsurance Life
Q1–4 2009Q1–4 2010
Backup: Additional highlights Q1–4 2010
718434
465293
Reinsurance Property-casualty
Reinsurance Subtotal
Primary insurance Life
Primary insurance Health
Primary insurance Property-casualty
3,381
4,099
218
216
474
2,509
2,943
355
236
678
2,111
2,576
27
83
257
1,806
2,099
172
165
319
100Analysts' Conference 2011
1 Operating result Q1–4 2010 including asset management (€75m, Q1–4 2009 €52m) and consolidation (–€440m, Q1–4 2009 –€471m). Consolidated result Q1–4 2010 including asset management (€37m, Q1–4 2009 €19m) and consolidation (–€425m, Q1–4 2009 –€425m). The consolidation figure in Q1–4 2009 includes the elimination of the intercompany sale of Europäische Reiseversicherung from Munich Reinsurance Company to ERGO AG amounting to €139m.
Primary insuranceSubtotal
Munich Health
Munich Re1
908
133
4,721
1,269
131
3,978
367
27
2,564
656
63
2,430
€m
Major losses: Above-average nat cat claims, man-made losses equal 5-year average
Reinsurance segment: Major losses1 over €10m each Reinsurance segment: Major losses1 over €10m each
Man-made Natural catastrophes
Backup: Additional highlights Q1–4 2010
Q1–4 20062 755
Q1–4 20073 1,126
Q1–4 20083 1,507
Q1–4 20093 1,157
Q1 4
596
492
675
961
159
634
832
196
101Analysts' Conference 2011
Q1–4 20103 2,228
5-year average
1,355
1 Incl. claims in life.2 Major losses over €5m each; Q1–4 2006 incl. run-off profits.3 Incl. run-off profits.
664
678
1,564
677

Munich Re
Agenda – Backup
Additional highlights Q1–4 2010
Risk managementRisk management
Life reinsurance
Investments
Reserves
102Analysts' Conference 2011
Market Consistent Embedded Value 2010
Shareholder information
Set-up of Munich Re's risk strategy
WholeWhole Financial strengthFinancial strength
CategoryCategory Risk criteriaRisk criteria Criteria's objectiveCriteria's objectiveMeasureMeasure ERM objective addressedERM objective addressed
Safeguarding sufficient Safeguarding sufficient ERC ERC
Backup: Risk management – Major developments in Munich Re's risk strategy
Wholeportfoliocriteria
Wholeportfoliocriteria
gg g gexcess capital and limiting frequency of negative economic results of Munich Re's entire risk portfolio.
g gexcess capital and limiting frequency of negative economic results of Munich Re's entire risk portfolio.
Rating Solvency Rating Solvency
Negative economic earnings tolerated every 10 years
Negative economic earnings tolerated every 10 years
Maintaining Munich Re's financial strength, thereby ensuring that all liabilities to our clients can be met
Protecting and increasing the value of our shareholders'
Maintaining Munich Re's financial strength, thereby ensuring that all liabilities to our clients can be met
Protecting and increasing the value of our shareholders'
Avoiding financial distressAvoiding financial distress
Supple-mentarycriteria
Supple-mentarycriteria
Limiting losses from individual risks or accumulation exposure and liquidity risks that could endanger Munich Re's survival capability
Limiting losses from individual risks or accumulation exposure and liquidity risks that could endanger Munich Re's survival capability
VaR limits as % of AFR or limit for maximum exposure
VaR limits as % of AFR or limit for maximum exposure
Peak risk management Peak risk management
Longevity Financial
sector limit
Individual nat cat perils
Terrorism Pandemic
103Analysts' Conference 2011
E.g.:E.g.:OthercriteriaOthercriteria
Counterparty-credit risk Single risks Alternative investments Non-investment-grade
investments
Counterparty-credit risk Single risks Alternative investments Non-investment-grade
investments
Limiting risks that could sustainably damage the trust of stakeholders in Munich Re
Limiting risks that could sustainably damage the trust of stakeholders in Munich Re
Individual risk limits in absolute value
Individual risk limits in absolute value
s a e o de sinvestments a e o de sinvestment
Safeguarding Munich Re'sreputation, thus perpetuating future business potential
Safeguarding Munich Re'sreputation, thus perpetuating future business potential
Re s survival capability.Re s survival capability. ALM limits Liquidity ALM limits Liquidity

Munich Re
€bn
23.0 0.9 5.1 –4.1 –0.1 24.8 4.8 29.6
Reconciliation of AFR with IFRS equity –Economic equity now at €24.8bn
Backup: Risk management – Capital position 31.12.2010
104Analysts' Conference 2011
IFRSequity
Valuation reserves
Valuation adjustments
P-C and L&H1
Goodwill and other
intangibles²
Loss carry-forward
component of deferred tax assets³
Economic equity
Hybrid capital
Available financial
resources
1 Includes discount of reserves and embedded value not recognised in IFRS equity.² Deduction net of tax effects.³ Deduction only of the amount not covered by excess of deferred tax liabilities on solo-entity level.
Agenda – Backup
Additional highlights Q1–4 2010
Risk managementRisk management
Life reinsurance
Investments
Reserves
105Analysts' Conference 2011
Market Consistent Embedded Value 2010
Shareholder information

Munich Re
MCEV IFRS
Profit recognition Immediate (present value) Deferred – in annual tranches
Experience recognition(past period)
Yes – Variances between last year‘s assumptionand actual experience
Yes – Difference in assumption included in reserve and actual experience
Backup: Life reinsurance
IFRS and MCEV methodologycomparison of key characteristics
(past period) and actual experience and actual experience
Assumption changes (future periods)
Yes – Immediate recognition of full impact of gains/losses (present value)
Recognised only if PV of profit margins and PADs1
insufficient to buffer loss („Lock-in“)
Asset valuation Marked to market Fair value and amortized costs
Cost of capital Reflected with respect to entire capital consumption Not reflected
Options and guarantees Stochastically valued Only partially valued (fair value of VA guarantees)
Reserving Statutory rules (relevant for shareholder cash flows)
IFRS/US GAAP rules
Annual earnings VNB (value of new business) plus variances and assumption changes (value changes on in-force) plus expected return (unwind of discount)
Sum of current year annual result contributions of all still relevant new business generations
106Analysts' Conference 2011
p p ( )
1 Provision for adverse deviation.
Present value of future profits available to shareholderPresent value of future profits available to shareholder
Adjustments for risks of cash flowsAdjustments for risks of cash flows
Adjusted net worthAdjusted net worth
--
++
Present value of future after-tax regulatory profits Time value of financial options and guarantees Present value of future after-tax regulatory profits Time value of financial options and guarantees
Required capital Free surplus Required capital Free surplus
Cost of non-hedgeable risks Cost of double taxation and cost of asset management
related to assets backing required capital
Cost of non-hedgeable risks Cost of double taxation and cost of asset management
related to assets backing required capitalMCEVMCEV
TotalTotal
Free surplus 1.1.10
Opening
Free capital and cash generationBackup: Life reinsurance
564
20
Change in ANW1
Change in RC
p gadjustments3
Adjusted free surplus
Cash generation
Expected investment income on ANW
Transfer from VIF to ANWVariances and assumption changes with impact on ANW
Release (+)/Strain (–) from required capital
Expected investment income on RC
20
584
527
–345
624
35
331
258
244
–18
–97
–589
In-forceIn-force New businessNew business
107Analysts' Conference 2011
Change in FS2
Release of RC from in-forceVariances and assumption changes with impact on RC
Free capital generation
Free surplus 31.12.10
Closing adjustments4
(incl. capital movements)
Closing free surplus 31.12.10
182
766
–240
526
182
80
868 –686
1 ANW impact of total MCEV earnings.2 FS impact of total MCEV earnings.3 FX rate adjustment beginning of year to average of year.4 FX rate adjustment average of year to end of year.

Munich Re
Agenda – Backup
Additional highlights Q1–4 2010
Risk managementRisk management
Life reinsurance
Investments
Reserves
108Analysts' Conference 2011
Market Consistent Embedded Value 2010
Shareholder information
Increased asset base and shift into loans as main driver for increasing regular income
Investment result – Regular income (€m) Q1–4 2010 Q1–4 2009 Change
Afs fixed-interest 4,415 4,448 –33
Afs non-fixed-interest 271 278 –7
Backup: Investments and investment result – Investment result – Regular income
Main effects in Q1–4 2010Main effects in Q1–4 2010
Derivatives 244 258 –14
Loans 2,123 1,952 171
Real estate 340 340 –
Deposits retained on assumed reinsurance and other investments 273 353 –80
Other 83 – 83
Total regular income 7,749 7,629 120
109Analysts' Conference 2011
Increased asset base as well as cautious investment in credit-exposed fixed-interest investments
Afs fixed-interest investments are influenced by new investments at lower interest-rates and currency volatility
Shift into loans and increased asset base more than compensating for lower interest-rates
"Other" mainly affected by higher income from affiliated and associated companies, whereas income from deposits decreased

Munich Re
Higher write-ups of interest derivatives and significantly lower write-downs of equities
Investment result – write-ups/write-downs (€m) Q1–4 2010 Q1–4 2009 Change
Afs fixed-interest 17 –112 129
Afs non-fixed-interest –270 –314 44
Backup: Investments and investment result – Investment result – Write-ups/write-downs
Previous year impacted by high write-downs of afs fixed-interest securities (structured Previous year impacted by high write-downs of afs fixed-interest securities (structured
Derivatives –39 –414 375
Loans –4 –74 70
Real estate –101 –122 21
Other –6 –86 80
Total net write-ups/write-downs –403 –1,122 719
Main effects in Q1–4 2010Main effects in Q1–4 2010
110Analysts' Conference 2011
products, loss-bearing bonds)
Lower impairments of afs non-fixed-interest securities as stock markets were at their lowest point at the end of March 2009 and, in general, at a lower level in 2009 compared to 2010
Strongly improved result from derivatives mainly due to swaptions as a result of decreasing interest-rate environment; by contrast, higher write-downs on bond futures
Gains on fixed-interest securities and equities more than compensate for impact from derivatives
Investment result – Net result from disposal of investments (€m) Q1–4 2010 Q1–4 2009 Change
Afs fixed-interest 1,067 782 285
Afs non-fixed-interest 634 943 –309
Backup: Investments and investment result – Investment result – Net result from disposal of investments
Derivatives –198 –270 72
Loans 31 106 –75
Real estate 100 35 65
Other 15 16 –1
Total net realised gains 1,649 1,612 37
Main effects in Q1–4 2010Main effects in Q1–4 2010
Afs fixed-interest: Disposal of corporate and government bonds at low interest-rate levels Afs fixed-interest: Disposal of corporate and government bonds at low interest-rate levels
111Analysts' Conference 2011
and reduced credit spreads realising investment gains; in 2009 we profited from our cautious shift from government bonds and structured products into corporate bonds
Afs non-fixed-interest: Lower disposal gains from equities in second half of 2010 as previous year profited from high realised gains
Derivatives: Gains on our bond futures (low interest-rate environment), whereas losses on our hedging products occurred

Munich Re
%1
Regular income
Write-ups/write-downs
Gains/ losses on disposal
Other income/
expensesTotal
RoI
Average market value
in €m
Afs fixed-interest 3.9 0.0 1.0 0.0 4.9 112,036
Afs non fi ed interest
Return on investment by asset classBackup: Investments and investment result – Investment result
Afs non-fixed-interest 3.3 –3.3 7.7 0.0 7.7 8,234
Derivatives 23.3 –3.7 –18.9 0.0 0.7 1,049
Loans 4.2 0.0 0.1 0.0 4.3 50,551
Real estate 6.1 –1.8 1.8 0.0 6.0 5,617
Other22.1 0.0 0.1 –2.1 0.1 16,714
Total 4.0 –0.2 0.8 –0.2 4.5 194,2013
Reinsurance 3.8 –0.4 1.6 –0.4 4.6 72,734
Primary insurance 4.1 –0.1 0.4 0.0 4.4 118,085
Munich Health 3.7 0.0 0.3 –0.1 3.8 2,656
Main effects in Q1 4 2010Main effects in Q1 4 2010
112Analysts' Conference 2011
Reinsurance: High RoI driven by gains on disposals of fixed-interest securities; in addition, sale of Helvetia shares leading to a net gain of approx. €90m
Primary insurance: As compared to reinsurance, higher running yield (longer investment duration) but lower disposal gains; write-downs on swaptions in Q4
Total return decreases to 4.2% (2009: 5.7%); negative impact on total return resulting from decreased valuation reserves ( ∆ –€531m) mainly driven by afs fixed-interest securities as a result of increasing yields in peripheral sovereign debt
Main effects in Q1–4 2010Main effects in Q1–4 2010
1 Annualised. 2 Incl. management expenses. 3 Reinsurance, primary insurance and Munich Health do not add up to total amount; difference relates to the segment “asset management”.
Maintenance of moderate investment risk profileBackup: Investments and investment result – Total investment portfolio
Land andbuildings
Loans
Investment structure by asset class (market values)Investment structure by asset class (market values)
Fixed-interestsecurities1
Shares, equity funds and participating interests
Miscellaneous2
€bn %
31.12.2006 179
31.12.2007 177
31.12.2008 177
31.12.2009 185
31.3.2010 192
30 6 2010 197
3.6
3.1
3.0
3.0
2.9
2 9
16.4
19.4
23.2
25.9
25.9
26 1
54.9
54.0
61.7
60.0
58.1
58 2
14.6
13.7
3.5
2.8
3.9
3 8
10.5
9.8
8.6
8.3
9.2
9 0
113Analysts' Conference 2011
30.6.2010 197
30.9.2010 200
31.12.2010 196
31.12.2010 (€bn) 196
1 Categories "available for sale", "held to maturity" and "at fair value".2 Deposits retained on assumed reinsurance, investments for unit-linked life, deposits with banks,
investment funds (bond, property) and derivatives held for trading with non-fixed interest underlying.3 After taking equity derivatives into account: 4.4%.
2.9
2.8
2.9
26.1
26.5
25.7
58.2
57.7
57.7
3.8
3.9
4.0
9.0
9.1
9.73
5.7 50.5 113.4 7.9 18.9

Munich Re
Rating classification of fixed-income portfolio1Rating classification of fixed-income portfolio1
%
AAA AA A BBB BBB and worse NR Total
Continued emphasis on highly rated credit risksBackup: Investments and investment result – Fixed-income portfolio
Government/Semi-government
53 35 7 3 2 – 0 100
Pfandbriefe/Covered bonds 85 14 1 0 – – 0 100
Banks 5 18 37 5 1 1 332 100
Corporates 2 12 38 44 3 0 1 100
114Analysts' Conference 2011
Structured products 79 11 7 2 0 0 1 100
Loans to policyholders/ Mortgage loans
– – – – – – 100 100
Total 52 23 11 6 1 0 7 100
1 Economic view – not fully comparable with IFRS figures.2 Including cash positions and shares in funds which are not rated. As at 31 December 2010.
Geographic classification of fixed-income portfolio1Geographic classification of fixed-income portfolio1
%
Germany France UK "PIIGS" CEERest ofEurope USA Canada
Rest ofworld Total
Approx. 76% invested in eurozone, digestible exposure to peripheral sovereigns
Backup: Investments and investment result – Fixed-income portfolio
Germany France UK PIIGS CEE Europe USA Canada world Total
Government/Semi-government
31 6 6 14 3 11 16 7 6 100
Pfandbriefe/ Covered bonds
43 16 6 13 0 22 0 0 – 100
Banks 43 2 7 4 1 9 26 2 6 100
Corporates 3 7 7 5 0 16 50 5 6 100
115Analysts' Conference 2011
Structured products
3 1 9 16 0 10 59 1 1 100
Loans to policyholders/ Mortgage loans
98 – – 1 0 0 0 0 1 100
Total 34 8 6 12 2 14 16 4 4 100
1 Economic view – not fully comparable with IFRS figures. As at 31 December 2010.

Munich Re
% Remaining time to maturity
0–1 1–3 3–5 5–7 7–10 >10
Backup: Investments and investment result – Fixed-income portfolio
Maturity structure
Maturity structure of fixed-income portfolio1Maturity structure of fixed-income portfolio1
year years years years years years n.a. Total
Government/Semi-government
10 13 18 12 17 30 0 100
Pfandbriefe/Covered bonds 3 11 10 15 19 42 – 100
Banks 12 9 9 12 18 6 34 100
Corporates 7 23 24 14 20 12 0 100
116Analysts' Conference 2011
Structured products 20 42 24 6 7 1 0 100
Loans to policyholders/ Mortgage loans 6 15 21 16 23 17 2 100
Total 8 14 16 13 18 28 3 100
1 Economic view – not fully comparable with IFRS figures.As at 31 December 2010.
Fixed-incomei t t
Fixed-income
Banks: Decrease of subordinated and loss-bearing exposure
BANKS
Split by investment categoryBANKS
Split by investment categoryBANKS
Subordinated and loss-bearing exposure by countryBANKS
Subordinated and loss-bearing exposure by country
Backup: Investments and investment result – Fixed-income portfolio
Subordinatedbonds1
6%
investmentfunds3% Cash
39%
derivatives2% Country Market values €m (as at 31.12.2010)
TotalSubordinated
bondsLoss-bearing
bonds
Germany 685 415 270
USA 399 351 48
Italy 49 49 0
UK 47 39 8
Loss-bearingbonds2
3%
TOTAL
€15.2bn
117Analysts' Conference 2011
Senior bank bonds45%
47 39 8
Austria 64 46 18
Other 131 80 51
Total market values 1,375 980 395
Refinancing loans2%
1 Classified as lower Tier 2 and Tier 3 capital for solvency purposes. 2 Classified as Tier 1 and upper Tier 2 capital for solvency purposes. Economic view – not fully comparable with IFRS figures.
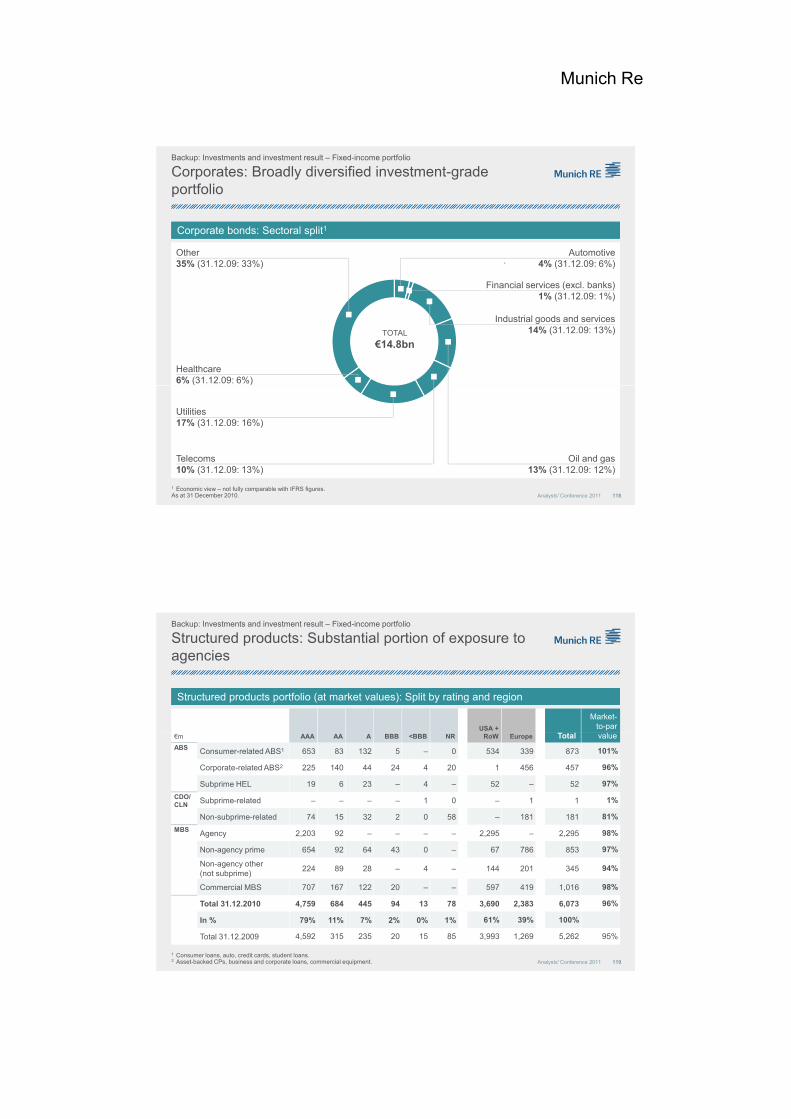
Munich Re
Corporate bonds: Sectoral split1Corporate bonds: Sectoral split1
Corporates: Broadly diversified investment-grade portfolio
Automotive4% (31.12.09: 6%)
Other35% (31.12.09: 33%)
Backup: Investments and investment result – Fixed-income portfolio
4% (31.12.09: 6%)35% (31.12.09: 33%)
Industrial goods and services14% (31.12.09: 13%)
Financial services (excl. banks)1% (31.12.09: 1%)
Healthcare6% (31.12.09: 6%)
TOTAL
€14.8bn
118Analysts' Conference 2011
Telecoms10% (31.12.09: 13%)
Oil and gas13% (31.12.09: 12%)
Utilities17% (31.12.09: 16%)
1 Economic view – not fully comparable with IFRS figures. As at 31 December 2010.
Structured products: Substantial portion of exposure to agencies
Backup: Investments and investment result – Fixed-income portfolio
Structured products portfolio (at market values): Split by rating and regionStructured products portfolio (at market values): Split by rating and region
USA +
Market-to-par
€m AAA AA A BBB <BBB NR RoW Europe Total value
ABS Consumer-related ABS1 653 83 132 5 – 0 534 339 873 101%
Corporate-related ABS2 225 140 44 24 4 20 1 456 457 96%
Subprime HEL 19 6 23 – 4 – 52 – 52 97%
CDO/ CLN
Subprime-related – – – – 1 0 – 1 1 1%
Non-subprime-related 74 15 32 2 0 58 – 181 181 81%
MBS Agency 2,203 92 – – – – 2,295 – 2,295 98%
Non-agency prime 654 92 64 43 0 – 67 786 853 97%
119Analysts' Conference 2011
1 Consumer loans, auto, credit cards, student loans. 2 Asset-backed CPs, business and corporate loans, commercial equipment.
Non agency prime 654 92 64 43 0 67 786 853 97%
Non-agency other(not subprime)
224 89 28 – 4 – 144 201 345 94%
Commercial MBS 707 167 122 20 – – 597 419 1,016 98%
Total 31.12.2010 4,759 684 445 94 13 78 3,690 2,383 6,073 96%
In % 79% 11% 7% 2% 0% 1% 61% 39% 100%
Total 31.12.2009 4,592 315 235 20 15 85 3,993 1,269 5,262 95%

Munich Re
Sensitivities to interest-rates, spreads and equity markets
Sensitivity to risk-free interest-rates – Basis points –100 –50 +100 +200
Change in gross market value (€bn) +11.5 +5.6 –10.1 –18.9
Change in on-balance-sheet reserves, net (€bn)1 +3.0 +1.5 –2.7 –5.1
Backup: Investments and investment result – Sensitivities to interest-rates, spreads and equity markets
Change in off-balance-sheet reserves, net (€bn)1 +0.6 +0.3 –0.6 –1.0
P&L impact (€bn)1 +0.3 +0.2 –0.3 –0.6
Sensitivity to spreads2 (change of bps) +100 +200
Change in gross market value (€bn) –7.0 –12.9
Change in on-balance-sheet reserves, net (€bn)1 –1.4 –2.7
Change in off-balance-sheet reserves, net (€bn)1 –0.4 –0.8
P&L impact (€bn)1 –0.0 –0.0
Sensitivity to equity markets3 –30% –10% +10% +30%
120Analysts' Conference 2011
EURO STOXX 50 (2,793 as at 31.12.2010) 1,955 2,514 3,072 3,631
Change in gross market value (€bn) –3.0 –1.0 +1.0 +3.1
Change in on-balance-sheet reserves, net (€bn)1 –0.9 –0.4 +0.7 +2.0
Change in off-balance-sheet reserves, net (€bn)1 –0.3 –0.1 +0.1 +0.3
P&L impact (€bn)1 –1.5 –0.4 +0.1 +0.5
1 Rough calculation with limited reliability assuming unchanged portfolio as at 31.12.2010. After rough estimation of policyholder participation and deferred tax; linearity of relations cannot be assumed. Economic view – not fully comparable with IFRS figures.
2 Sensitivities to changes of spreads are calculated for every category of fixed-interest securities, except governments with ratings AAA.
3 Worst-case scenario assumed: impairment as soon as market value is below acquisition cost.
Unrealised gains/losses on securities (afs) and off-balance-sheet reserves
On-balance-sheet reserves on afs securitiesOn-balance-sheet reserves on afs securities
Backup: Investments and investment result – Investment result – On- and off-balance-sheet reserves
€m
Gross unrealised gains and losses 3,835
Off-balance-sheet reserves1Off-balance-sheet reserves1
€m
g ,
Provision for deferred premium refunds –587
Deferred taxes –604
Minority interests –11
Effects from consolidation and currency 3
Shareholders' stake 31.12.2010 2,636
121Analysts' Conference 2011
€m
Off-balance-sheet reserves 31.12.2010 3,290
Provision for deferred premium refunds –1,778
Deferred taxes –436
Minority interests –
Shareholders' stake 31.12.2010 1,076
1 Excluding reserves on owner-occupied properties.

Munich Re
31.12.200931.12.2009
€m
31.12.201031.12.2010
Other investments (fixed-interest)
Other investments (non-fixed-interest)
Land and buildings1
Miscellaneous Loans
On- and off-balance-sheet reserves by asset classBackup: Investments and investment result – Investment result – On- and off-balance-sheet reserves
Total €7,905m
3,342
1,408233
1881,287
1,447
On-balance-sheet Off-balance-sheet
2,201
1,634249
312
1,553
1,425
On-balance-sheet Off-balance-sheet
Total €7,374m
122Analysts' Conference 2011
Unrealised gains and losses – gross 7,9052
./. Provision for deferred premium refunds 3,172
./. Deferred taxes 1,035
./. Effects from consolidation and currency –22
./. Minority interests 14
Unrealised gains and losses – net 3,706
Unrealised gains and losses – gross 7,3743
./. Provision for deferred premium refunds 2,399
./. Deferred taxes 1,040
./. Effects from consolidation and currency –
./. Minority interests 11
Unrealised gains and losses – net 3,9241 Excluding reserves for owner-occupied properties.2 Incl. unrealised gains/losses from valuation at equity, unconsolidated affiliated enterprises and cash flow
hedging of €233m and off-balance-sheet valuation reserves of €186m for affiliated companies.3 Incl. unrealised gains/losses from valuation at equity, unconsolidated affiliated enterprises and cash flow
hedging of €249m and off-balance-sheet valuation reserves of €311m for affiliated companies.
Agenda – Backup
Additional highlights Q1–4 2010
Risk managementRisk management
Life reinsurance
Investments
Reserves
123Analysts' Conference 2011
Market Consistent Embedded Value 2010
Shareholder information
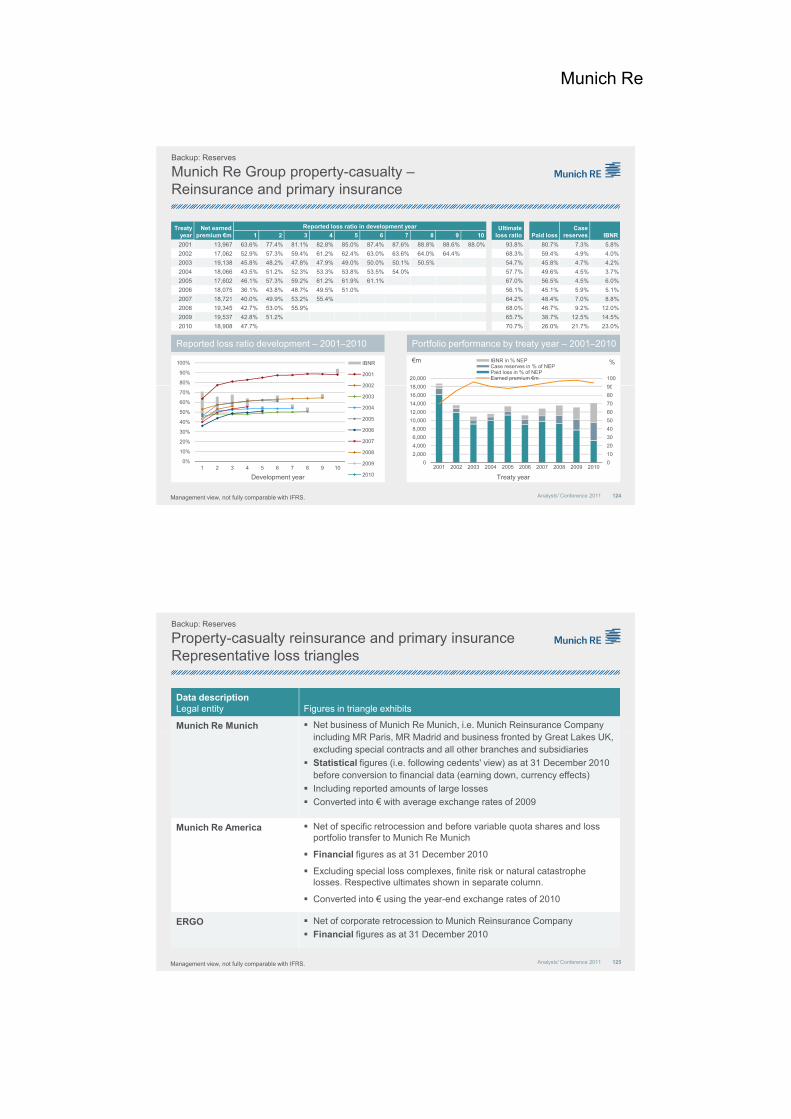
Munich Re
Treaty year
Net earnedpremium €m
Reported loss ratio in development year Ultimate loss ratio Paid loss
Case reserves IBNR1 2 3 4 5 6 7 8 9 10
2001 13,967 63.6% 77.4% 81.1% 82.8% 85.0% 87.4% 87.6% 88.8% 88.6% 88.0% 93.8% 80.7% 7.3% 5.8%
2002 17,062 52.9% 57.3% 59.4% 61.2% 62.4% 63.0% 63.6% 64.0% 64.4% 68.3% 59.4% 4.9% 4.0%
2003 19,138 45.8% 48.2% 47.8% 47.9% 49.0% 50.0% 50.1% 50.5% 54.7% 45.8% 4.7% 4.2%
Munich Re Group property-casualty –Reinsurance and primary insurance
Backup: Reserves
80%
90%
100% IBNR
2001
2002
Reported loss ratio development – 2001–2010Reported loss ratio development – 2001–2010 Portfolio performance by treaty year – 2001–2010Portfolio performance by treaty year – 2001–2010
2004 18,066 43.5% 51.2% 52.3% 53.3% 53.8% 53.5% 54.0% 57.7% 49.6% 4.5% 3.7%
2005 17,602 46.1% 57.3% 59.2% 61.2% 61.9% 61.1% 67.0% 56.5% 4.5% 6.0%
2006 18,075 36.1% 43.8% 48.7% 49.5% 51.0% 56.1% 45.1% 5.9% 5.1%
2007 18,721 40.0% 49.9% 53.2% 55.4% 64.2% 48.4% 7.0% 8.8%
2008 19,345 42.7% 53.0% 55.9% 68.0% 46.7% 9.2% 12.0%
2009 19,537 42.8% 51.2% 65.7% 38.7% 12.5% 14.5%
2010 18,908 47.7% 70.7% 26.0% 21.7% 23.0%
90
100
18 000
20,000
IBNR in % NEPCase reserves in % of NEPPaid loss in % of NEPEarned premium €m
€m %
124Analysts' Conference 2011
Development year
0%
10%
20%
30%
40%
50%
60%
70%
1 2 3 4 5 6 7 8 9 10
2002
2003
2004
2005
2006
2007
2008
2009
2010
0
10
20
30
40
50
60
70
80
90
0
2,000
4,000
6,000
8,000
10,000
12,000
14,000
16,000
18,000
2001 2002 2003 2004 2005 2006 2007 2008 2009 2010
Treaty year
Management view, not fully comparable with IFRS.
Property-casualty reinsurance and primary insurance Representative loss triangles
Data descriptionLegal entity Figures in triangle exhibits
Munich Re Munich Net business of Munich Re Munich, i.e. Munich Reinsurance Company
Backup: Reserves
including MR Paris, MR Madrid and business fronted by Great Lakes UK, excluding special contracts and all other branches and subsidiaries
Statistical figures (i.e. following cedents' view) as at 31 December 2010 before conversion to financial data (earning down, currency effects)
Including reported amounts of large losses
Converted into € with average exchange rates of 2009
Munich Re America Net of specific retrocession and before variable quota shares and loss portfolio transfer to Munich Re Munich
Fi i l fi t 31 D b 2010
125Analysts' Conference 2011
Financial figures as at 31 December 2010
Excluding special loss complexes, finite risk or natural catastrophe losses. Respective ultimates shown in separate column.
Converted into € using the year-end exchange rates of 2010
ERGO Net of corporate retrocession to Munich Reinsurance Company
Financial figures as at 31 December 2010
Management view, not fully comparable with IFRS.

Munich Re
Property-casualty reinsurance and primary insurance Representative loss triangles
Backup: Reserves
Legal entity €m Line of businessCase and IBNR
reserves
Munich Re Munich Property 5,458
Li bilit 5 785Liability 5,785
Motor 3,609
Personal accident / workers' comp. 504
Marine 1,324
Subtotal 16.679
Munich Re America Property 555
Liability 2,865
Motor 506
Workers' compensation 2,361
126Analysts' Conference 2011
Disclosure addresses more than 70% of carried net property-casualty reserves
Management view, not fully comparable with IFRS.
p ,
Subtotal 6,287
ERGO Property-casualty 3,854
Munich Re Group Asbestos and environmental 1,917
Total reserves disclosed 28,737
Munich Re Munich Property
Treaty year
Ultimate premium €m
Development year: Loss ratio as reported Ultimate loss ratio
Paidloss
Case reserves IBNR1 2 3 4 5 6 7 8 9 10 11 12
1999 2,111 85.6% 106.2% 109.4% 111.3% 110.5% 111.6% 112.1% 112.7% 113.0% 112.6% 112.4% 112.0% 112.5% 110.9% 1.4% 0.2%2000 2,237 60.9% 76.4% 79.3% 79.2% 79.9% 79.1% 80.5% 82.4% 82.2% 82.2% 82.1% 82.1% 80.0% 2.1% 0.0%2001 2,550 75.8% 89.4% 93.0% 93.6% 91.6% 91.9% 92.5% 92.2% 92.6% 92.5% 92.7% 90.5% 2.0% 0.2%2002 2 874 50 9% 56 8% 57 5% 59 7% 59 9% 59 9% 59 8% 59 6% 59 6% 60 3% 58 7% 0 9% 0 7%
Backup: Reserves
Reported loss ratio development – 1999–2010Reported loss ratio development – 1999–2010 Portfolio performance by treaty year – 1999–2010Portfolio performance by treaty year – 1999–2010
2002 2,874 50.9% 56.8% 57.5% 59.7% 59.9% 59.9% 59.8% 59.6% 59.6% 60.3% 58.7% 0.9% 0.7%2003 3,015 39.0% 46.2% 45.6% 45.1% 45.7% 45.8% 46.7% 46.7% 47.6% 44.6% 2.1% 1.0%2004 2,914 42.4% 54.8% 58.0% 58.2% 59.1% 58.8% 58.7% 60.4% 56.4% 2.3% 1.7%2005 2,985 59.1% 79.0% 82.8% 83.1% 83.2% 83.4% 86.8% 79.2% 4.2% 3.5%2006 3,328 29.4% 38.2% 41.3% 42.6% 43.0% 46.4% 38.5% 4.5% 3.4%2007 3,536 33.6% 50.8% 51.9% 52.9% 58.6% 45.4% 7.5% 5.8%2008 3,536 37.8% 49.2% 51.1% 63.4% 39.9% 11.3% 12.3%2009 3,373 32.7% 46.9% 63.5% 25.8% 21.2% 16.6%2010 2,958 7.9% 69.7% 2.0% 5.9% 61.8%
1204,000
IBNR in % NEPCase reserves in % of NEPPaid loss in % of NEPUltimate premium €m
€m %
100%
120% IBNR
1999
2000
127Analysts' Conference 2011
0
30
60
90
0
1,000
2,000
3,000
1999 2000 2001 2002 2003 2004 2005 2006 2007 2008 2009 2010
0%
20%
40%
60%
80%
1 2 3 4 5 6 7 8 9 10 11 12
2001
2002
2003
2004
2005
2006
2007
2008
2009
2010
Management view, not fully comparable with IFRS.
Development year Treaty year
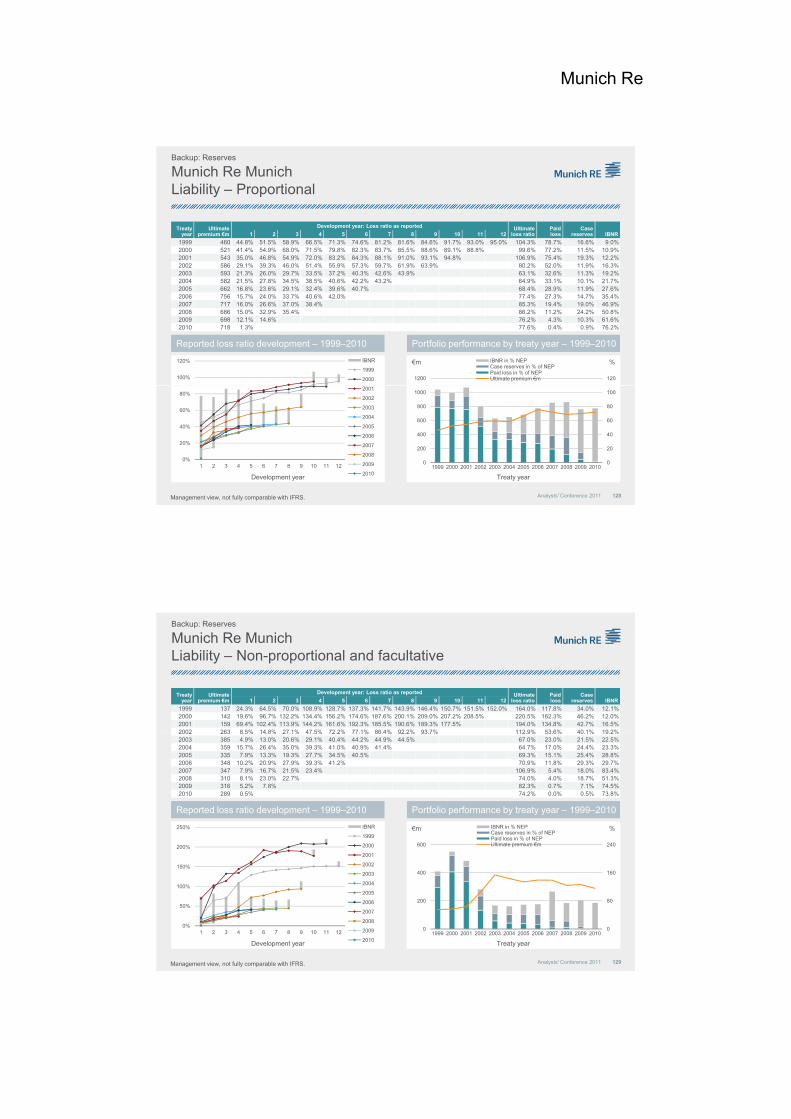
Munich Re
Munich Re Munich Liability – Proportional
Treaty year
Ultimate premium €m
Development year: Loss ratio as reported Ultimate loss ratio
Paidloss
Case reserves IBNR1 2 3 4 5 6 7 8 9 10 11 12
1999 460 44.8% 51.5% 58.9% 66.5% 71.3% 74.6% 81.2% 81.6% 84.6% 91.7% 93.0% 95.0% 104.3% 78.7% 16.6% 9.0%2000 521 41.4% 54.9% 68.0% 71.5% 79.8% 82.3% 83.7% 85.5% 88.6% 89.1% 88.8% 99.6% 77.2% 11.5% 10.9%2001 543 35.0% 46.8% 54.9% 72.0% 83.2% 84.3% 88.1% 91.0% 93.1% 94.8% 106.9% 75.4% 19.3% 12.2%2002 586 29 1% 39 3% 46 0% 51 4% 55 9% 57 3% 59 7% 61 9% 63 9% 80 2% 52 0% 11 9% 16 3%
Backup: Reserves
Reported loss ratio development – 1999–2010Reported loss ratio development – 1999–2010 Portfolio performance by treaty year – 1999–2010Portfolio performance by treaty year – 1999–2010
2002 586 29.1% 39.3% 46.0% 51.4% 55.9% 57.3% 59.7% 61.9% 63.9% 80.2% 52.0% 11.9% 16.3%2003 593 21.3% 26.0% 29.7% 33.5% 37.2% 40.3% 42.6% 43.9% 63.1% 32.6% 11.3% 19.2%2004 582 21.5% 27.8% 34.5% 38.5% 40.6% 42.2% 43.2% 64.9% 33.1% 10.1% 21.7%2005 662 16.8% 23.6% 29.1% 32.4% 39.6% 40.7% 68.4% 28.9% 11.9% 27.6%2006 756 15.7% 24.0% 33.7% 40.6% 42.0% 77.4% 27.3% 14.7% 35.4%2007 717 16.0% 26.6% 37.0% 38.4% 85.3% 19.4% 19.0% 46.9%2008 686 15.0% 32.9% 35.4% 86.2% 11.2% 24.2% 50.8%2009 698 12.1% 14.6% 76.2% 4.3% 10.3% 61.6%2010 718 1.3% 77.6% 0.4% 0.9% 76.2%
1201200
IBNR in % NEPCase reserves in % of NEPPaid loss in % of NEPUltimate premium €m
€m %
100%
120% IBNR
1999
2000
128Analysts' Conference 2011
Development year Treaty year
0
20
40
60
80
100
0
200
400
600
800
1000
1999 2000 2001 2002 2003 2004 2005 2006 2007 2008 2009 2010
0%
20%
40%
60%
80%
1 2 3 4 5 6 7 8 9 10 11 12
2001
2002
2003
2004
2005
2006
2007
2008
2009
2010
Management view, not fully comparable with IFRS.
Munich Re Munich Liability – Non-proportional and facultative
Treaty year
Ultimate premium €m
Development year: Loss ratio as reported Ultimate loss ratio
Paidloss
Case reserves IBNR1 2 3 4 5 6 7 8 9 10 11 12
1999 137 24.3% 64.5% 70.0% 108.9% 128.7% 137.3% 141.7% 143.9% 146.4% 150.7% 151.5% 152.0% 164.0% 117.8% 34.0% 12.1%2000 142 19.6% 96.7% 132.2% 134.4% 156.2% 174.6% 187.6% 200.1% 209.0% 207.2% 208.5% 220.5% 162.3% 46.2% 12.0%2001 159 69.4% 102.4% 113.9% 144.2% 161.6% 192.3% 185.5% 190.6% 189.3% 177.5% 194.0% 134.8% 42.7% 16.5%2002 263 8 5% 14 8% 27 1% 47 5% 72 2% 77 1% 86 4% 92 2% 93 7% 112 9% 53 6% 40 1% 19 2%
Backup: Reserves
Reported loss ratio development – 1999–2010Reported loss ratio development – 1999–2010 Portfolio performance by treaty year – 1999–2010Portfolio performance by treaty year – 1999–2010
2002 263 8.5% 14.8% 27.1% 47.5% 72.2% 77.1% 86.4% 92.2% 93.7% 112.9% 53.6% 40.1% 19.2%2003 385 4.9% 13.0% 20.6% 29.1% 40.4% 44.2% 44.9% 44.5% 67.0% 23.0% 21.5% 22.5%2004 359 15.7% 26.4% 35.0% 39.3% 41.0% 40.9% 41.4% 64.7% 17.0% 24.4% 23.3%2005 335 7.9% 13.3% 19.3% 27.7% 34.5% 40.5% 69.3% 15.1% 25.4% 28.8%2006 348 10.2% 20.9% 27.9% 39.3% 41.2% 70.9% 11.8% 29.3% 29.7%2007 347 7.9% 16.7% 21.5% 23.4% 106.9% 5.4% 18.0% 83.4%2008 310 8.1% 23.0% 22.7% 74.0% 4.0% 18.7% 51.3%2009 316 5.2% 7.8% 82.3% 0.7% 7.1% 74.5%2010 289 0.5% 74.2% 0.0% 0.5% 73.8%
240600
IBNR in % NEPCase reserves in % of NEPPaid loss in % of NEPUltimate premium €m
€m %
200%
250% IBNR
1999
2000
129Analysts' Conference 2011
Development year Treaty year
0
80
160
0
200
400
1999 2000 2001 2002 2003 2004 2005 2006 2007 2008 2009 2010
0%
50%
100%
150%
1 2 3 4 5 6 7 8 9 10 11 12
2001
2002
2003
2004
2005
2006
2007
2008
2009
2010
Management view, not fully comparable with IFRS.

Munich Re
Munich Re MunichMotor – Proportional
Treaty year
Ultimate premium €m
Development year: Loss ratio as reported Ultimate loss ratio
Paidloss
Case reserves IBNR1 2 3 4 5 6 7 8 9 10 11 12
1999 1,333 72.8% 85.5% 87.8% 86.6% 86.2% 85.9% 85.6% 85.4% 85.0% 84.7% 84.5% 84.0% 85.1% 81.5% 3.0% 0.6%2000 1,287 79.9% 88.0% 86.6% 84.9% 83.8% 83.2% 83.0% 82.6% 82.1% 81.5% 81.4% 81.4% 78.3% 3.0% 0.0%2001 1,524 71.6% 82.8% 81.2% 80.2% 79.7% 79.8% 79.5% 78.9% 78.3% 78.2% 78.3% 74.8% 3.3% 0.1%2002 1 613 65 6% 77 9% 76 4% 75 6% 74 9% 74 5% 73 6% 73 3% 73 3% 73 3% 70 3% 2 9% 0 0%
Backup: Reserves
Reported loss ratio development – 1999–2010Reported loss ratio development – 1999–2010 Portfolio performance by treaty year – 1999–2010Portfolio performance by treaty year – 1999–2010
2002 1,613 65.6% 77.9% 76.4% 75.6% 74.9% 74.5% 73.6% 73.3% 73.3% 73.3% 70.3% 2.9% 0.0%2003 1,383 61.2% 76.9% 74.6% 73.2% 72.5% 71.1% 70.6% 70.6% 70.9% 67.1% 3.4% 0.3%2004 1,329 62.3% 74.9% 71.6% 69.1% 67.6% 66.8% 66.6% 67.0% 62.6% 4.1% 0.3%2005 1,299 60.9% 78.5% 74.7% 72.3% 71.0% 70.7% 71.2% 64.7% 6.1% 0.4%2006 1,305 60.0% 80.7% 77.3% 75.1% 74.8% 75.6% 65.5% 9.3% 0.8%2007 1,226 61.4% 81.4% 79.1% 78.5% 80.0% 66.2% 12.2% 1.5%2008 1,074 61.7% 87.2% 86.6% 85.5% 65.2% 21.4% –1.2%2009 989 58.6% 77.4% 83.8% 48.0% 29.4% 6.4%2010 975 11.5% 77.6% 7.1% 4.4% 66.0%
1002,000
IBNR in % NEPCase reserves in % of NEPPaid loss in % of NEPUltimate premium €m
€m %
80%
90%
100% IBNR
1999
2000
130Analysts' Conference 2011
Development year Treaty year
0
25
50
75
0
500
1,000
1,500
1999 2000 2001 2002 2003 2004 2005 2006 2007 2008 2009 2010
0%
10%
20%
30%
40%
50%
60%
70%
1 2 3 4 5 6 7 8 9 10 11 12
2001
2002
2003
2004
2005
2006
2007
2008
2009
2010
Management view, not fully comparable with IFRS.
Munich Re MunichMotor – Non-proportional and facultative
Treaty year
Ultimate premium €m
Development year: Loss ratio as reported Ultimate loss ratio
Paidloss
Case reserves IBNR1 2 3 4 5 6 7 8 9 10 11 12
1999 73 66.2% 108.3% 126.4% 138.9% 148.2% 152.9% 169.1% 170.1% 174.4% 180.0% 180.4% 184.0% 267.9% 92.2% 91.9% 83.8%2000 89 46.5% 83.4% 96.3% 108.7% 113.1% 119.4% 123.5% 125.0% 125.3% 126.4% 128.9% 191.8% 56.2% 72.7% 62.9%2001 104 79.8% 116.2% 130.5% 142.6% 158.1% 169.1% 173.1% 173.6% 178.2% 177.9% 261.4% 89.2% 88.7% 83.5%2002 127 39 8% 62 3% 75 8% 87 5% 93 3% 95 0% 97 8% 100 8% 102 7% 179 2% 32 7% 70 1% 76 4%
Backup: Reserves
Reported loss ratio development – 1999–2010Reported loss ratio development – 1999–2010 Portfolio performance by treaty year – 1999–2010Portfolio performance by treaty year – 1999–2010
2002 127 39.8% 62.3% 75.8% 87.5% 93.3% 95.0% 97.8% 100.8% 102.7% 179.2% 32.7% 70.1% 76.4%2003 163 36.1% 56.6% 67.9% 72.1% 78.4% 79.8% 82.2% 82.5% 167.9% 23.7% 58.8% 85.5%2004 146 43.5% 54.1% 56.2% 61.4% 59.6% 62.2% 62.3% 128.0% 14.7% 47.6% 65.7%2005 136 21.7% 34.8% 37.3% 42.5% 44.1% 44.1% 106.4% 7.5% 36.6% 62.3%2006 133 25.6% 46.5% 47.4% 51.3% 50.0% 126.9% 10.5% 39.5% 76.9%2007 107 20.9% 39.7% 44.1% 44.7% 121.1% 7.9% 36.7% 76.4%2008 98 20.4% 30.1% 30.4% 110.6% 3.9% 26.5% 80.2%2009 79 14.6% 18.8% 99.2% 1.9% 16.9% 80.4%2010 60 3.4% 101.5% 0.0% 3.4% 98.1%
300300
IBNR in % NEPCase reserves in % of NEPPaid loss in % of NEPUltimate premium €m
€m %
250%
300% IBNR
1999
2000
131Analysts' Conference 2011
Development year Treaty year
0
100
200
0
100
200
1999 2000 2001 2002 2003 2004 2005 2006 2007 2008 2009 2010
0%
50%
100%
150%
200%
1 2 3 4 5 6 7 8 9 10 11 12
2001
2002
2003
2004
2005
2006
2007
2008
2009
2010
Management view, not fully comparable with IFRS.

Munich Re
Munich Re MunichPersonal accident and workers' compensation
Treaty year
Ultimate premium €m
Development year: Loss ratio as reported Ultimate loss ratio
Paidloss
Case reserves IBNR1 2 3 4 5 6 7 8 9 10 11 12
1999 291 53.7% 60.8% 63.6% 66.8% 71.7% 73.6% 73.2% 73.7% 74.0% 74.0% 74.2% 74.0% 80.0% 71.8% 2.3% 5.9%2000 304 53.7% 63.6% 62.0% 64.7% 67.9% 67.1% 67.6% 67.4% 67.8% 68.2% 68.1% 72.4% 64.5% 3.6% 4.3%2001 333 52.9% 60.4% 62.0% 65.2% 65.0% 65.3% 66.1% 66.8% 66.5% 67.1% 71.8% 62.3% 4.8% 4.7%2002 354 44 1% 49 0% 51 7% 51 9% 53 6% 54 5% 55 4% 55 5% 55 8% 62 0% 51 4% 4 3% 6 3%
Backup: Reserves
Reported loss ratio development – 1999–2010Reported loss ratio development – 1999–2010 Portfolio performance by treaty year – 1999–2010Portfolio performance by treaty year – 1999–2010
2002 354 44.1% 49.0% 51.7% 51.9% 53.6% 54.5% 55.4% 55.5% 55.8% 62.0% 51.4% 4.3% 6.3%2003 369 41.6% 50.5% 51.8% 52.7% 53.0% 53.6% 53.8% 53.6% 60.3% 49.2% 4.4% 6.6%2004 360 44.2% 49.0% 51.6% 51.3% 51.6% 52.5% 52.6% 60.3% 46.3% 6.3% 7.7%2005 356 46.0% 51.0% 52.0% 52.8% 53.1% 53.2% 57.9% 48.7% 4.5% 4.7%2006 310 44.5% 47.7% 47.5% 48.0% 48.3% 54.4% 42.1% 6.2% 6.0%2007 265 44.7% 51.5% 50.6% 51.1% 57.3% 43.8% 7.3% 6.2%2008 189 36.8% 47.7% 48.6% 57.8% 32.6% 16.1% 9.2%2009 190 36.6% 41.1% 57.7% 25.1% 16.0% 16.5%2010 179 14.2% 55.4% 10.7% 3.6% 41.2%
100500
IBNR in % NEPCase reserves in % of NEPPaid loss in % of NEPUltimate premium €m
€m %
70%
80%
90% IBNR
1999
2000
132Analysts' Conference 2011
Development year Treaty year
0
20
40
60
80
0
100
200
300
400
1999 2000 2001 2002 2003 2004 2005 2006 2007 2008 2009 2010
0%
10%
20%
30%
40%
50%
60%
1 2 3 4 5 6 7 8 9 10 11 12
2001
2002
2003
2004
2005
2006
2007
2008
2009
2010
Management view, not fully comparable with IFRS.
Munich Re Munich Marine
Treaty year
Ultimate premium €m
Development year: Loss ratio as reported Ultimate loss ratio
Paidloss
Case reserves IBNR1 2 3 4 5 6 7 8 9 10 11 12
1999 231 47.3% 81.9% 100.4% 97.7% 97.0% 96.8% 95.0% 100.4% 98.4% 98.4% 98.1% 98.0% 98.5% 94.0% 4.0% 0.5%2000 270 52.0% 97.5% 96.7% 99.3% 101.1% 98.7% 102.3% 100.1% 101.4% 101.1% 100.9% 101.1% 95.7% 5.3% 0.1%2001 308 50.9% 91.3% 88.6% 89.0% 85.4% 89.8% 90.2% 89.2% 91.6% 91.5% 92.8% 86.0% 5.4% 1.4%2002 320 39 4% 58 6% 70 3% 67 0% 69 5% 70 7% 70 1% 69 7% 69 3% 70 5% 66 2% 3 2% 1 1%
Backup: Reserves
Reported loss ratio development – 1999–2010Reported loss ratio development – 1999–2010 Portfolio performance by treaty year – 1999–2010Portfolio performance by treaty year – 1999–2010
2002 320 39.4% 58.6% 70.3% 67.0% 69.5% 70.7% 70.1% 69.7% 69.3% 70.5% 66.2% 3.2% 1.1%2003 333 30.8% 52.1% 53.1% 55.6% 54.4% 54.8% 55.0% 54.9% 55.2% 52.0% 2.9% 0.3%2004 341 35.0% 60.0% 70.2% 69.3% 68.6% 69.2% 68.9% 71.9% 65.0% 3.9% 3.0%2005 400 42.4% 81.8% 86.2% 87.9% 87.5% 87.1% 90.6% 77.3% 9.8% 3.6%2006 455 30.7% 58.2% 67.0% 67.6% 67.9% 78.2% 52.2% 15.8% 10.3%2007 517 29.3% 63.9% 72.2% 73.7% 91.1% 52.7% 21.0% 17.4%2008 475 34.3% 56.6% 58.0% 82.6% 37.0% 21.0% 24.6%2009 486 24.4% 37.9% 74.8% 15.9% 22.0% 36.9%2010 416 15.7% 94.0% 8.3% 7.3% 78.3%
120600
IBNR in % NEPCase reserves in % of NEPPaid loss in % of NEPUltimate premium €m
€m %
100%
120% IBNR
1999
2000
133Analysts' Conference 2011
Development year Treaty year
0
40
80
0
200
400
1999 2000 2001 2002 2003 2004 2005 2006 2007 2008 2009 2010
0%
20%
40%
60%
80%
1 2 3 4 5 6 7 8 9 10 11 12
2001
2002
2003
2004
2005
2006
2007
2008
2009
2010
Management view, not fully comparable with IFRS.

Munich Re
Treaty year
Earnedpremium €m
Development year: Loss ratio as reported Ultimate loss ratio
Paidloss
Case reserves IBNR
Special liabilities1 2 3 4 5 6 7 8 9 10 11 12
1999 485 52.2% 76.1% 76.5% 78.5% 79.4% 79.6% 76.5% 72.9% 72.6% 73.1% 73.0% 73.4% 82.7% 71.8% 1.5% -0.5% 9.9%2000 482 47.8% 68.4% 73.0% 71.2% 74.7% 74.7% 75.9% 75.4% 75.6% 76.7% 76.3% 79.0% 74.8% 1.5% 0.0% 2.7%2001 527 34.4% 51.7% 63.3% 61.7% 59.9% 62.4% 61.9% 61.7% 62.4% 62.2% 187.2% 61.4% 0.8% 0.0% 125.0%2002 728 18 5% 32 4% 33 4% 34 1% 34 7% 34 5% 34 3% 34 1% 33 9% 35 3% 33 4% 0 5% 0 1% 1 4%
Munich Re America Property
Backup: Reserves
2002 728 18.5% 32.4% 33.4% 34.1% 34.7% 34.5% 34.3% 34.1% 33.9% 35.3% 33.4% 0.5% 0.1% 1.4%2003 694 17.2% 25.9% 25.7% 26.8% 26.7% 26.6% 26.6% 27.1% 32.7% 26.8% 0.3% 0.1% 5.6%2004 564 16.9% 29.3% 27.8% 27.9% 28.1% 28.4% 28.0% 58.1% 26.9% 1.1% 0.0% 30.1%2005 559 18.3% 29.8% 29.5% 29.3% 25.7% 26.5% 102.4% 25.9% 0.6% -0.2% 76.1%2006 536 21.7% 28.0% 28.6% 27.8% 26.9% 30.6% 26.5% 0.5% 0.7% 3.0%2007 585 21.8% 30.9% 29.8% 26.9% 30.4% 24.7% 2.2% 0.6% 2.8%2008 603 19.9% 32.6% 31.5% 59.4% 28.0% 3.5% 1.8% 26.2%2009 792 18.1% 28.5% 40.1% 22.0% 6.5% 4.3% 7.3%2010 856 19.7% 43.3% 12.9% 6.7% 19.4% 4.2%
Reported loss ratio development1– 1999–2010Reported loss ratio development1– 1999–2010 Portfolio performance by treaty year – 1999–2010Portfolio performance by treaty year – 1999–2010
€m
210900
Special liabilities in % of NEPIBNR in % NEPCase reserves in % of NEPPaid loss in % of NEPEarned premium €m
%
70%
80%
90% IBNR
1999
2000
134Analysts' Conference 2011
Development year Treaty year
0
70
140
0
300
600
1999 2000 2001 2002 2003 2004 2005 2006 2007 2008 2009 2010
Earned premium €m
0%
10%
20%
30%
40%
50%
60%
1 2 3 4 5 6 7 8 9 10 11 12
2001
2002
2003
2004
2005
2006
2007
2008
2009
2010
1 Excl. special liabilities. Management view, not fully comparable with IFRS.
Treaty year
Earnedpremium €m
Development year: Loss ratio as reported Ultimate loss ratio
Paidloss
Case reserves IBNR
Special liabilities1 2 3 4 5 6 7 8 9 10 11 12
1999 158 7.4% 27.5% 56.3% 73.5% 88.7% 100.6% 106.5% 112.1% 111.0% 115.7% 111.3% 110.0% 115.8% 107.4% 2.7% 3.4% 2.3%2000 207 10.4% 25.1% 48.3% 65.8% 83.7% 93.8% 99.8% 100.5% 103.5% 109.3% 111.0% 120.7% 105.9% 5.2% 7.6% 2.0%2001 249 12.1% 36.0% 62.2% 91.2% 100.3% 114.6% 115.9% 112.0% 115.1% 116.1% 126.2% 107.7% 8.4% 8.4% 1.7%2002 343 5 1% 24 0% 47 4% 60 3% 70 0% 81 2% 81 3% 81 9% 80 1% 96 7% 77 5% 2 6% 10 3% 6 2%
Munich Re America Liability – Proportional
Backup: Reserves
2002 343 5.1% 24.0% 47.4% 60.3% 70.0% 81.2% 81.3% 81.9% 80.1% 96.7% 77.5% 2.6% 10.3% 6.2%2003 366 3.7% 14.6% 24.4% 33.9% 42.6% 47.5% 47.6% 50.8% 59.4% 45.3% 5.5% 6.3% 2.2%2004 307 3.9% 10.1% 7.1% 27.2% 31.0% 33.6% 34.1% 47.2% 31.2% 3.0% 7.4% 5.6%2005 284 3.6% 11.9% 20.0% 26.7% 30.9% 38.5% 69.7% 32.0% 6.5% 30.1% 1.1%2006 234 6.7% 13.5% 22.1% 30.2% 33.2% 64.4% 27.1% 6.1% 29.0% 2.3%2007 185 5.4% 15.3% 26.3% 34.9% 74.7% 25.4% 9.5% 38.2% 1.6%2008 199 4.3% 11.8% 22.1% 64.8% 12.7% 9.3% 41.2% 1.5%2009 193 5.5% 17.1% 78.2% 7.1% 10.0% 59.4% 1.7%2010 242 4.2% 81.9% 1.7% 2.4% 76.7% 1.1%
€m
Reported loss ratio development1– 1999–2010Reported loss ratio development1– 1999–2010 Portfolio performance by treaty year – 1999–2010Portfolio performance by treaty year – 1999–2010
%
120%
140% IBNR
1999
2000140400
Special liabilities in % of NEPIBNR in % NEPCase reserves in % of NEPPaid loss in % of NEPEarned premium €m
135Analysts' Conference 2011
Development year Treaty year
0%
20%
40%
60%
80%
100%
1 2 3 4 5 6 7 8 9 10 11 12
2001
2002
2003
2004
2005
2006
2007
2008
2009
2010
0
70
140
0
200
400
1999 2000 2001 2002 2003 2004 2005 2006 2007 2008 2009 2010
Earned premium €m
1 Excl. special liabilities. Management view, not fully comparable with IFRS.
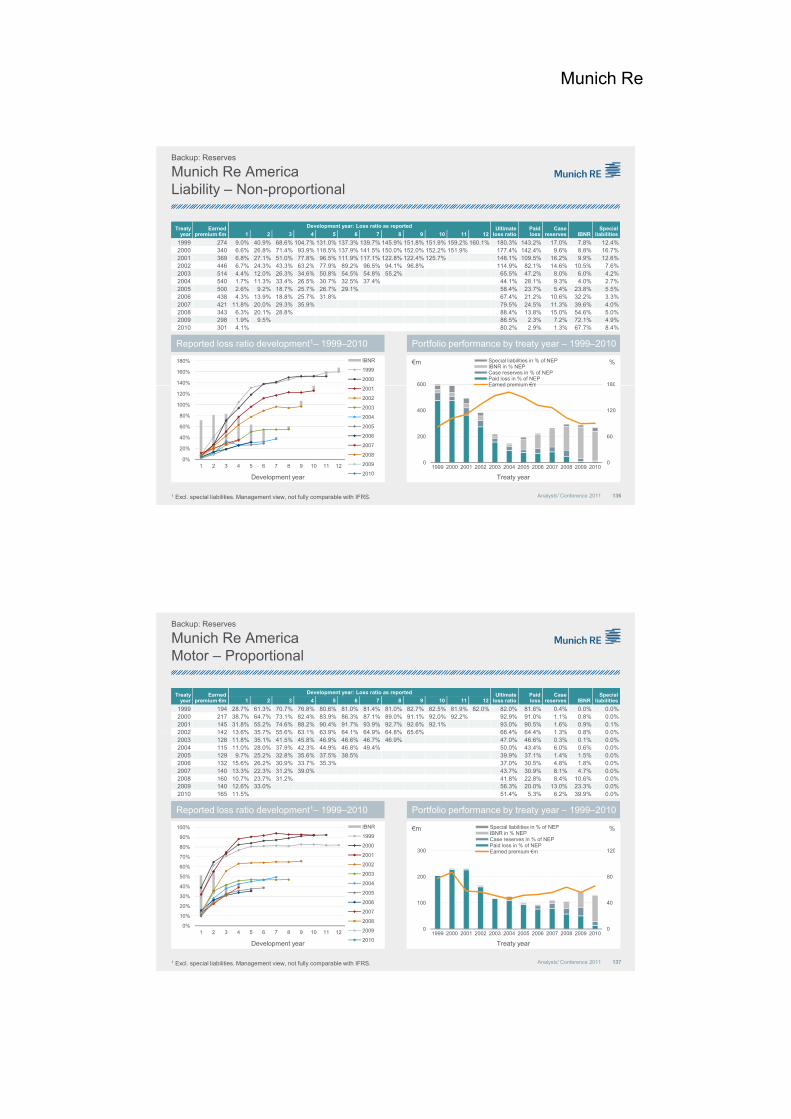
Munich Re
Treaty year
Earnedpremium €m
Development year: Loss ratio as reported Ultimate loss ratio
Paidloss
Case reserves IBNR
Special liabilities1 2 3 4 5 6 7 8 9 10 11 12
1999 274 9.0% 40.9% 68.6% 104.7% 131.0% 137.3% 139.7% 145.9% 151.8% 151.9% 159.2% 160.1% 180.3% 143.2% 17.0% 7.8% 12.4%2000 340 6.6% 26.8% 71.4% 93.9% 118.5% 137.9% 141.5% 150.0% 152.0% 152.2% 151.9% 177.4% 142.4% 9.6% 8.8% 16.7%2001 369 6.8% 27.1% 51.0% 77.8% 96.5% 111.9% 117.1% 122.8% 122.4% 125.7% 148.1% 109.5% 16.2% 9.9% 12.6%2002 446 6 7% 24 3% 43 3% 63 2% 77 9% 89 2% 96 5% 94 1% 96 8% 114 9% 82 1% 14 6% 10 5% 7 6%
Munich Re America Liability – Non-proportional
Backup: Reserves
2002 446 6.7% 24.3% 43.3% 63.2% 77.9% 89.2% 96.5% 94.1% 96.8% 114.9% 82.1% 14.6% 10.5% 7.6%2003 514 4.4% 12.0% 26.3% 34.6% 50.8% 54.5% 54.8% 55.2% 65.5% 47.2% 8.0% 6.0% 4.2%2004 540 1.7% 11.3% 33.4% 26.5% 30.7% 32.5% 37.4% 44.1% 28.1% 9.3% 4.0% 2.7%2005 500 2.6% 9.2% 18.7% 25.7% 26.7% 29.1% 58.4% 23.7% 5.4% 23.8% 5.5%2006 438 4.3% 13.9% 18.8% 25.7% 31.8% 67.4% 21.2% 10.6% 32.2% 3.3%2007 421 11.8% 20.0% 29.3% 35.9% 79.5% 24.5% 11.3% 39.6% 4.0%2008 343 6.3% 20.1% 28.8% 88.4% 13.8% 15.0% 54.6% 5.0%2009 298 1.9% 9.5% 86.5% 2.3% 7.2% 72.1% 4.9%2010 301 4.1% 80.2% 2.9% 1.3% 67.7% 8.4%
€m
Reported loss ratio development1– 1999–2010Reported loss ratio development1– 1999–2010 Portfolio performance by treaty year – 1999–2010Portfolio performance by treaty year – 1999–2010
%
140%
160%
180% IBNR
1999
2000180600
Special liabilities in % of NEPIBNR in % NEPCase reserves in % of NEPPaid loss in % of NEPEarned premium €m
136Analysts' Conference 2011
Development year Treaty year
0%
20%
40%
60%
80%
100%
120%
1 2 3 4 5 6 7 8 9 10 11 12
2001
2002
2003
2004
2005
2006
2007
2008
2009
2010
0
60
120
180
0
200
400
600
1999 2000 2001 2002 2003 2004 2005 2006 2007 2008 2009 2010
Earned premium €m
1 Excl. special liabilities. Management view, not fully comparable with IFRS.
Treaty year
Earnedpremium €m
Development year: Loss ratio as reported Ultimate loss ratio
Paidloss
Case reserves IBNR
Special liabilities1 2 3 4 5 6 7 8 9 10 11 12
1999 194 28.7% 61.3% 70.7% 76.8% 80.6% 81.0% 81.4% 81.0% 82.7% 82.5% 81.9% 82.0% 82.0% 81.6% 0.4% 0.0% 0.0%2000 217 38.7% 64.7% 73.1% 82.4% 83.9% 86.3% 87.1% 89.0% 91.1% 92.0% 92.2% 92.9% 91.0% 1.1% 0.8% 0.0%2001 145 31.8% 55.2% 74.6% 88.2% 90.4% 91.7% 93.9% 92.7% 92.6% 92.1% 93.0% 90.5% 1.6% 0.9% 0.1%2002 142 13 6% 35 7% 55 6% 63 1% 63 9% 64 1% 64 9% 64 8% 65 6% 66 4% 64 4% 1 3% 0 8% 0 0%
Munich Re America Motor – Proportional
Backup: Reserves
2002 142 13.6% 35.7% 55.6% 63.1% 63.9% 64.1% 64.9% 64.8% 65.6% 66.4% 64.4% 1.3% 0.8% 0.0%2003 128 11.8% 35.1% 41.5% 45.8% 46.9% 46.6% 46.7% 46.9% 47.0% 46.6% 0.3% 0.1% 0.0%2004 115 11.0% 28.0% 37.9% 42.3% 44.9% 46.8% 49.4% 50.0% 43.4% 6.0% 0.6% 0.0%2005 129 9.7% 25.2% 32.8% 35.6% 37.5% 38.5% 39.9% 37.1% 1.4% 1.5% 0.0%2006 132 15.6% 26.2% 30.9% 33.7% 35.3% 37.0% 30.5% 4.8% 1.8% 0.0%2007 140 13.3% 22.3% 31.2% 39.0% 43.7% 30.9% 8.1% 4.7% 0.0%2008 160 10.7% 23.7% 31.2% 41.8% 22.8% 8.4% 10.6% 0.0%2009 140 12.6% 33.0% 56.3% 20.0% 13.0% 23.3% 0.0%2010 165 11.5% 51.4% 5.3% 6.2% 39.9% 0.0%
€m
Reported loss ratio development1– 1999–2010Reported loss ratio development1– 1999–2010 Portfolio performance by treaty year – 1999–2010Portfolio performance by treaty year – 1999–2010
%
80%
90%
100% IBNR
1999
2000120300
Special liabilities in % of NEPIBNR in % NEPCase reserves in % of NEPPaid loss in % of NEPEarned premium €m
137Analysts' Conference 2011
Development year Treaty year
0%
10%
20%
30%
40%
50%
60%
70%
1 2 3 4 5 6 7 8 9 10 11 12
2001
2002
2003
2004
2005
2006
2007
2008
2009
2010
0
40
80
120
0
100
200
300
1999 2000 2001 2002 2003 2004 2005 2006 2007 2008 2009 2010
Earned premium €m
1 Excl. special liabilities. Management view, not fully comparable with IFRS.
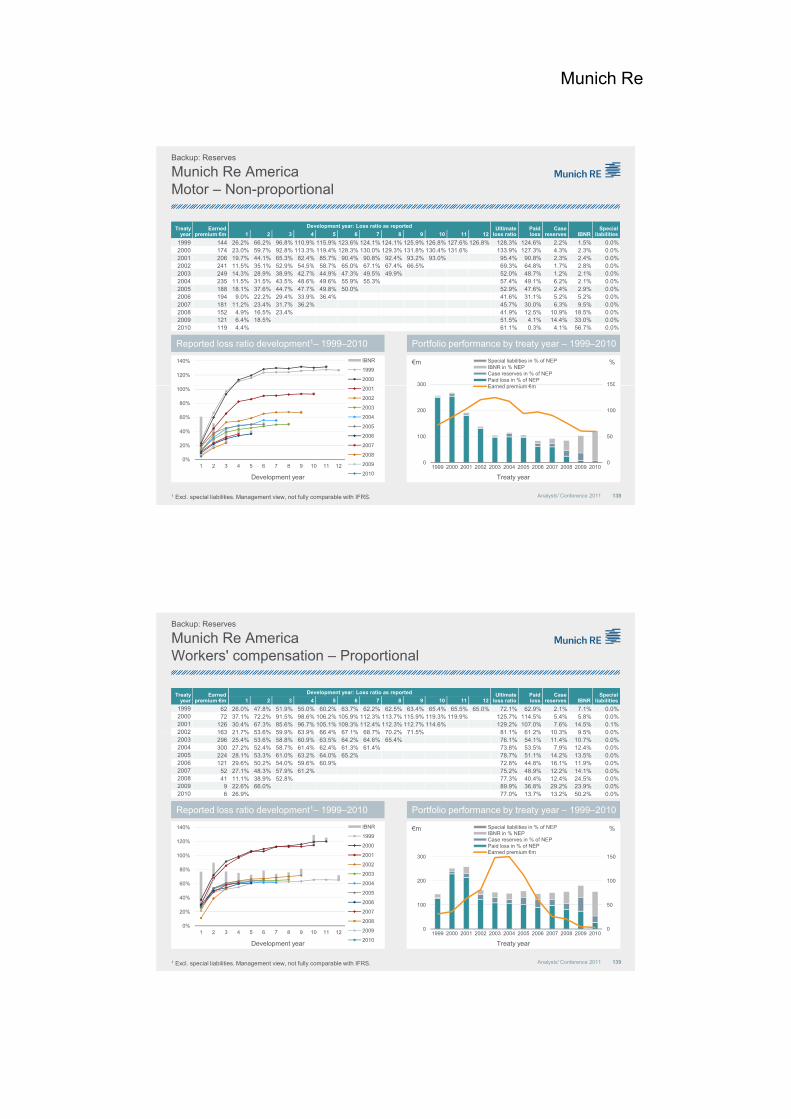
Munich Re
Treaty year
Earnedpremium €m
Development year: Loss ratio as reported Ultimate loss ratio
Paidloss
Case reserves IBNR
Special liabilities1 2 3 4 5 6 7 8 9 10 11 12
1999 144 26.2% 66.2% 96.8% 110.9% 115.9% 123.6% 124.1% 124.1% 125.9% 126.8% 127.6% 126.8% 128.3% 124.6% 2.2% 1.5% 0.0%2000 174 23.0% 59.7% 92.8% 113.3% 119.4% 128.3% 130.0% 129.3% 131.8% 130.4% 131.6% 133.9% 127.3% 4.3% 2.3% 0.0%2001 206 19.7% 44.1% 65.3% 82.4% 85.7% 90.4% 90.8% 92.4% 93.2% 93.0% 95.4% 90.8% 2.3% 2.4% 0.0%2002 241 11 5% 35 1% 52 9% 54 5% 58 7% 65 0% 67 1% 67 4% 66 5% 69 3% 64 8% 1 7% 2 8% 0 0%
Munich Re America Motor – Non-proportional
Backup: Reserves
2002 241 11.5% 35.1% 52.9% 54.5% 58.7% 65.0% 67.1% 67.4% 66.5% 69.3% 64.8% 1.7% 2.8% 0.0%2003 249 14.3% 28.9% 38.9% 42.7% 44.9% 47.3% 49.5% 49.9% 52.0% 48.7% 1.2% 2.1% 0.0%2004 235 11.5% 31.5% 43.5% 48.6% 49.6% 55.9% 55.3% 57.4% 49.1% 6.2% 2.1% 0.0%2005 188 18.1% 37.6% 44.7% 47.7% 49.8% 50.0% 52.9% 47.6% 2.4% 2.9% 0.0%2006 194 9.0% 22.2% 29.4% 33.9% 36.4% 41.6% 31.1% 5.2% 5.2% 0.0%2007 181 11.2% 23.4% 31.7% 36.2% 45.7% 30.0% 6.3% 9.5% 0.0%2008 152 4.9% 16.5% 23.4% 41.9% 12.5% 10.9% 18.5% 0.0%2009 121 6.4% 18.5% 51.5% 4.1% 14.4% 33.0% 0.0%2010 119 4.4% 61.1% 0.3% 4.1% 56.7% 0.0%
€m %
120%
140% IBNR
1999
2000150300
Special liabilities in % of NEPIBNR in % NEPCase reserves in % of NEPPaid loss in % of NEPEarned premium €m
Reported loss ratio development1– 1999–2010Reported loss ratio development1– 1999–2010 Portfolio performance by treaty year – 1999–2010Portfolio performance by treaty year – 1999–2010
138Analysts' Conference 2011
Development year Treaty year
0%
20%
40%
60%
80%
100%
1 2 3 4 5 6 7 8 9 10 11 12
2001
2002
2003
2004
2005
2006
2007
2008
2009
2010
0
50
100
150
0
100
200
300
1999 2000 2001 2002 2003 2004 2005 2006 2007 2008 2009 2010
Earned premium €m
1 Excl. special liabilities. Management view, not fully comparable with IFRS.
Treaty year
Earnedpremium €m
Development year: Loss ratio as reported Ultimate loss ratio
Paidloss
Case reserves IBNR
Special liabilities1 2 3 4 5 6 7 8 9 10 11 12
1999 62 26.0% 47.8% 51.9% 55.0% 60.2% 63.7% 62.2% 62.5% 63.4% 65.4% 65.5% 65.0% 72.1% 62.9% 2.1% 7.1% 0.0%2000 72 37.1% 72.2% 91.5% 98.6% 106.2% 105.9% 112.3% 113.7% 115.9% 119.3% 119.9% 125.7% 114.5% 5.4% 5.8% 0.0%2001 126 30.4% 67.3% 85.6% 96.7% 105.1% 109.3% 112.4% 112.3% 112.7% 114.6% 129.2% 107.0% 7.6% 14.5% 0.1%2002 163 21 7% 53 6% 59 9% 63 9% 66 4% 67 1% 68 7% 70 2% 71 5% 81 1% 61 2% 10 3% 9 5% 0 0%
Munich Re America Workers' compensation – Proportional
Backup: Reserves
2002 163 21.7% 53.6% 59.9% 63.9% 66.4% 67.1% 68.7% 70.2% 71.5% 81.1% 61.2% 10.3% 9.5% 0.0%2003 296 25.4% 53.6% 58.8% 60.9% 63.5% 64.2% 64.6% 65.4% 76.1% 54.1% 11.4% 10.7% 0.0%2004 300 27.2% 52.4% 58.7% 61.4% 62.4% 61.3% 61.4% 73.8% 53.5% 7.9% 12.4% 0.0%2005 224 28.1% 53.3% 61.0% 63.2% 64.0% 65.2% 78.7% 51.1% 14.2% 13.5% 0.0%2006 121 29.6% 50.2% 54.0% 59.6% 60.9% 72.8% 44.8% 16.1% 11.9% 0.0%2007 52 27.1% 48.3% 57.9% 61.2% 75.2% 48.9% 12.2% 14.1% 0.0%2008 41 11.1% 38.9% 52.8% 77.3% 40.4% 12.4% 24.5% 0.0%2009 9 22.6% 66.0% 89.9% 36.8% 29.2% 23.9% 0.0%2010 6 26.9% 77.0% 13.7% 13.2% 50.2% 0.0%
€m %
120%
140% IBNR
1999
2000
Special liabilities in % of NEPIBNR in % NEPCase reserves in % of NEPPaid loss in % of NEPEarned premium €m
Reported loss ratio development1– 1999–2010Reported loss ratio development1– 1999–2010 Portfolio performance by treaty year – 1999–2010Portfolio performance by treaty year – 1999–2010
139Analysts' Conference 2011
Development year Treaty year
0%
20%
40%
60%
80%
100%
1 2 3 4 5 6 7 8 9 10 11 12
2001
2002
2003
2004
2005
2006
2007
2008
2009
2010
0
50
100
150
0
100
200
300
1999 2000 2001 2002 2003 2004 2005 2006 2007 2008 2009 2010
Earned premium €m
1 Excl. special liabilities. Management view, not fully comparable with IFRS.
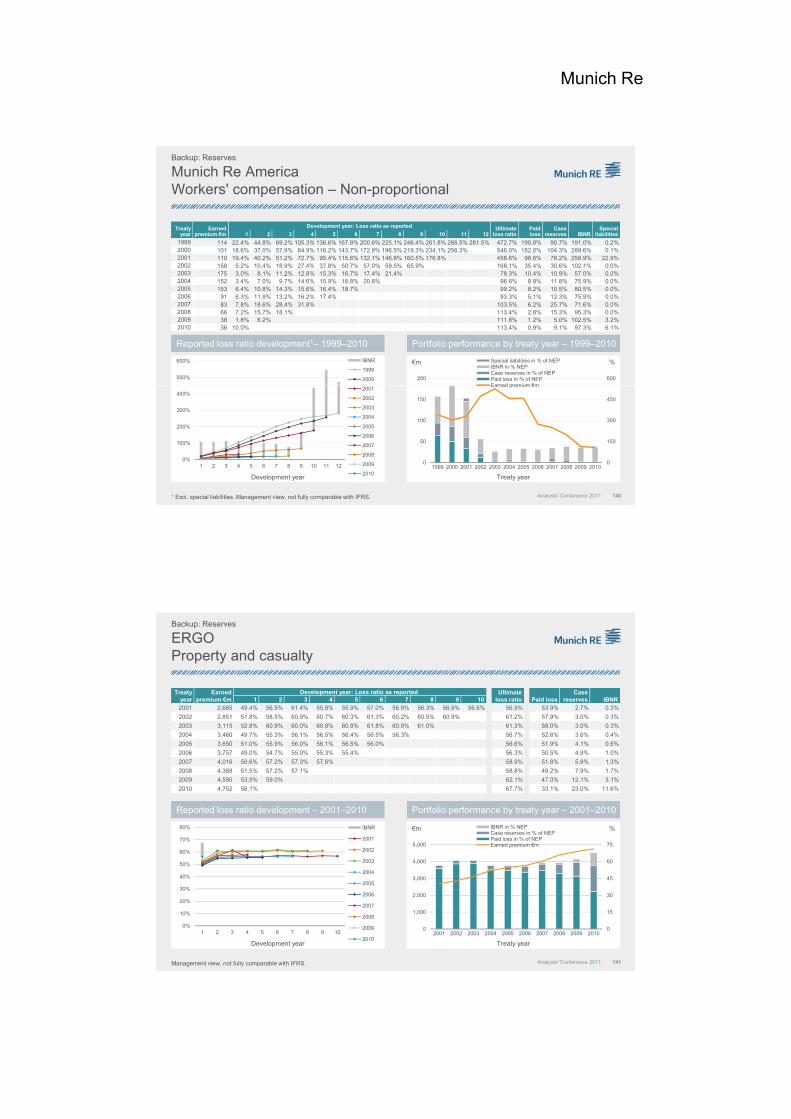
Munich Re
Munich Re America Workers' compensation – Non-proportional
Treaty year
Earnedpremium €m
Development year: Loss ratio as reported Ultimate loss ratio
Paidloss
Case reserves IBNR
Special liabilities1 2 3 4 5 6 7 8 9 10 11 12
1999 114 22.4% 44.8% 69.2% 105.3% 136.6% 167.8% 200.6% 225.1% 246.4% 261.8% 266.5% 281.5% 472.7% 190.8% 90.7% 191.0% 0.2%2000 101 18.6% 37.0% 57.9% 84.9% 116.2% 143.7% 172.8% 196.5% 219.3% 234.1% 256.3% 546.0% 152.0% 104.3% 289.6% 0.1%2001 110 19.4% 40.2% 51.2% 72.7% 95.4% 115.6% 132.1% 146.8% 160.5% 176.8% 458.6% 98.6% 78.2% 258.9% 22.9%2002 158 5 2% 10 4% 18 9% 27 4% 37 8% 50 7% 57 0% 59 5% 65 9% 168 1% 35 4% 30 6% 102 1% 0 0%
Backup: Reserves
€m
2002 158 5.2% 10.4% 18.9% 27.4% 37.8% 50.7% 57.0% 59.5% 65.9% 168.1% 35.4% 30.6% 102.1% 0.0%2003 175 3.0% 8.1% 11.2% 12.8% 15.3% 16.7% 17.4% 21.4% 78.3% 10.4% 10.9% 57.0% 0.0%2004 152 3.4% 7.0% 9.7% 14.6% 15.9% 18.8% 20.6% 96.6% 8.8% 11.8% 75.9% 0.0%2005 153 6.4% 10.8% 14.3% 15.6% 16.4% 18.7% 99.2% 8.2% 10.5% 80.5% 0.0%2006 91 6.3% 11.9% 13.2% 16.2% 17.4% 93.3% 5.1% 12.3% 75.9% 0.0%2007 83 7.8% 18.6% 28.4% 31.8% 103.5% 6.2% 25.7% 71.6% 0.0%2008 66 7.2% 15.7% 18.1% 113.4% 2.8% 15.3% 95.3% 0.0%2009 38 1.8% 6.2% 111.8% 1.2% 5.0% 102.5% 3.2%2010 36 10.0% 113.4% 0.9% 9.1% 97.3% 6.1%
%
500%
600% IBNR
1999
2000 600200
Special liabilities in % of NEPIBNR in % NEPCase reserves in % of NEPPaid loss in % of NEPEarned premium €m
Reported loss ratio development1– 1999–2010Reported loss ratio development1– 1999–2010 Portfolio performance by treaty year – 1999–2010Portfolio performance by treaty year – 1999–2010
140Analysts' Conference 2011
Development year Treaty year
0%
100%
200%
300%
400%
1 2 3 4 5 6 7 8 9 10 11 12
2001
2002
2003
2004
2005
2006
2007
2008
2009
2010
0
150
300
450
0
50
100
150
1999 2000 2001 2002 2003 2004 2005 2006 2007 2008 2009 2010
Earned premium €m
1 Excl. special liabilities. Management view, not fully comparable with IFRS.
ERGO Property and casualty
Treaty year
Earnedpremium €m
Development year: Loss ratio as reported Ultimate loss ratio Paid loss
Case reserves IBNR1 2 3 4 5 6 7 8 9 10
2001 2,685 49.4% 56.5% 61.4% 55.8% 55.9% 57.0% 56.9% 56.3% 56.9% 56.6% 56.9% 53.9% 2.7% 0.3%
2002 2,851 51.8% 58.5% 60.9% 60.7% 60.3% 61.3% 60.2% 60.5% 60.9% 61.2% 57.9% 3.0% 0.3%
2003 3,115 52.8% 60.9% 60.0% 60.8% 60.8% 61.8% 60.9% 61.0% 61.3% 58.0% 3.0% 0.3%
Backup: Reserves
Reported loss ratio development – 2001–2010Reported loss ratio development – 2001–2010 Portfolio performance by treaty year – 2001–2010Portfolio performance by treaty year – 2001–2010
2004 3,460 49.7% 55.3% 56.1% 56.5% 56.4% 56.5% 56.3% 56.7% 52.6% 3.6% 0.4%
2005 3,650 51.0% 55.9% 56.0% 56.1% 56.5% 56.0% 56.6% 51.9% 4.1% 0.6%
2006 3,757 49.0% 54.7% 55.0% 55.3% 55.4% 56.3% 50.5% 4.9% 1.0%
2007 4,016 50.6% 57.2% 57.3% 57.6% 58.9% 51.8% 5.9% 1.3%
2008 4,388 51.5% 57.2% 57.1% 58.8% 49.2% 7.9% 1.7%
2009 4,590 53.9% 59.0% 62.1% 47.0% 12.1% 3.1%
2010 4,752 56.1% 67.7% 33.1% 23.0% 11.6%
60%
70%
80% IBNR
2001
2002755,000
IBNR in % NEPCase reserves in % of NEPPaid loss in % of NEPEarned premium €m
€m %
141Analysts' Conference 2011
Development year Treaty year
0%
10%
20%
30%
40%
50%
60%
1 2 3 4 5 6 7 8 9 10
2003
2004
2005
2006
2007
2008
2009
2010
0
15
30
45
60
0
1,000
2,000
3,000
4,000
2001 2002 2003 2004 2005 2006 2007 2008 2009 2010
Management view, not fully comparable with IFRS.

Munich Re
Asbestos and environmental
€m Asbestos Environmental Total
Munich Re-Group – Net definitive as at 31 December 2010Munich Re-Group – Net definitive as at 31 December 2010
Backup: Reserves
Paid 1,695 669 2,364
Case reserves 643 107 750
IBNR 906 261 1,167
Total reserves 1,549 368 1,917
142Analysts' Conference 2011
3-year average annual paid losses
122 26 148
Survival ratio 3-year average 12.7 14.0 12.9
Non-€ currencies converted at rate of exchange year-end 2010.
Management view, not fully comparable with IFRS.
Agenda – Backup
Additional highlights Q1–4 2010
Risk managementRisk management
Life reinsurance
Investments
Reserves
143Analysts' Conference 2011
Market Consistent Embedded Value 2010
Shareholder information

Munich Re
Since 2009, the valuation of the embedded value of Munich Re is based on Market Consistent Embedded Value Principles©.
The Market Consistent Embedded Value (MCEV) is a measure of the consolidated value of
Since 2009, the valuation of the embedded value of Munich Re is based on Market Consistent Embedded Value Principles©.
The Market Consistent Embedded Value (MCEV) is a measure of the consolidated value of
Methods Backup: Market Consistent Embedded Value 2010
The Market Consistent Embedded Value (MCEV) is a measure of the consolidated value of shareholders' interests in covered business. The covered business encompasses business written in life reinsurance entities, excluding medical reinsurance business and business written in all major primary life and German health entities.
The required capital reflects the level of solvency capital at which the supervisor is empowered to take action as well as internal objectives (e.g. rating, internal capital model).
The approach for CRNHR in the MCEV framework is based on a cost-of-capital method. The underlying risk capital for non-hedgeable risks is determined using our internal economic capital model at a 99 5% confidence level The cost of residual non hedgeable
144Analysts' Conference 2011
economic capital model at a 99.5% confidence level. The cost of residual non-hedgeablerisks is calculated as the present value of a 7% margin over the risk-free rate on the projected risk capital.
economic capital model at a 99.5% confidence level. The cost of residual non-hedgeablerisks is calculated as the present value of a 7% margin over the risk-free rate on the projected risk capital.
€m Reinsurance Primary insurance
MCEVChange
in €mChange
in % MCEVChange
in €mChange
in %
B 8 284 4 108
Sensitivities of MCEVBackup: Market Consistent Embedded Value 2010
UpdateUpdate
Base case 8,284 4,108
Interest-rates –100bp 8,545 260 3.1 2,477 –1,632 –39.7
Interest-rates +100bp 7,990 –294 –3.6 5,207 1,099 26.7
Equity/property values –10% 8,284 0 0.0 3,965 –143 –3.5
Equity/property implied volatilities +25% 8,267 –17 –0.2 3,923 –186 –4.5
Swaption implied volatilities +25% 8,280 –4 –0.1 4,001 –107 –2.6
Liquidity premium 10bp 8,327 43 0.5 4,445 336 8.2
Maintenance expenses –10% 8,370 86 1.0 4,176 67 1.6
145Analysts' Conference 2011
Lapse rates –10% 8,134 –150 –1.8 4,095 –13 –0.3
Lapse rates +10% 8,274 –10 –0.1 4,122 14 0.3
Mortality/morbidity (life business) –5% 10,026 1,742 21.0 4,181 73 1.8
Mortality (annuity business) –5% 8,250 –34 –0.4 4,050 –58 –1.4
No mortality improvements (life business) 4,829 –3,455 –41.7 4,108 0 0.0
Peer comparison sensitivity1 8,382 98 1.2 5,061 953 23.2
1 Comparable assumptions regarding the amount and the term structure of illiquidity premium with major European peers.

Munich Re
Sensitivities of new business valueBackup: Market Consistent Embedded Value 2010
€m Reinsurance Primary insurance
VNBChange
in €mChange
in % VNBChange
in €mChange
in %
B 475 141Base case 475 141
interest-rates –100bp 519 44 9.3 –9 –150 –106.3
interest-rates +100bp 440 –35 –7.4 178 37 26.2
Equity/property values –10% 477 3 0.6 137 –4 –3.0
Equity/property implied volatilities +25% 474 –1 –0.3 133 –8 –5.7
Swaption implied volatilities +25% 475 0 –0.1 110 –31 –21.9
Liquidity premium 10bp 475 0 0.0 158 17 12.2
Maintenance expenses –10% 485 10 2.2 146 5 3.4
146Analysts' Conference 2011
Lapse rates –10% 477 2 0.4 146 5 3.5
Lapse rates +10% 453 –21 –4.5 133 –8 –6.0
Mortality/morbidity (life business) –5% 594 120 25.2 147 6 4.1
Mortality (annuity business) –5% 474 0 –0.1 136 –5 –3.8
No mortality improvements (life business) 223 –252 –53.1 141 0 0.0
Peer comparison sensitivity1 468 –7 –1.5 189 48 34.1
1 Comparable assumptions regarding the amount and the term structure of illiquidity premium with major European peers.
31.12.200931.12.2009 31.12.200931.12.2009
ReinsuranceReinsurance Primary insurancePrimary insurance
IFRS upliftBackup: Market Consistent Embedded Value 2010
€m
IFRS equity
4,202
EEV 6,773
IFRS equity
Value not recognised in IFRS equity (IFRS uplift)€m
IFRS equity
3,660
EEV 5,126
31.12.201031.12.201031.12.201031.12.2010
2,571 1,466
IFRS equity
Value not recognised in IFRS equity (IFRS uplift)
147Analysts' Conference 2011
€m
IFRS equity
4,772
MCEV 8,284
€m
IFRS equity
3,773
MCEV 4,1083,512 336

Munich Re
Backup: Market Consistent Embedded Value 2010
Primary insurance – German primary life
€m
MCEV 31.12.2009 1,717
Opening adjustments 4p g j
Adjusted MCEV 31.12.2009 1,720
New business value 56
Expected return 85
Experience variances –14
Assumption changes –109
Other operating variance 88
Operating MCEV earnings 2010 104
148Analysts' Conference 2011
Operating MCEV earnings 2010 104
Economic variances –746
Other non-operating variance 0
Total MCEV earnings 2010 –642
Closing adjustments –69
MCEV 31.12.2010 1,010
Backup: Market Consistent Embedded Value 2010
Primary insurance – International primary life
€m
MCEV 31.12.2009 1,438
Opening adjustments 7p g j
Adjusted MCEV 31.12.2009 1,444
New business value 58
Expected return 29
Experience variances 6
Assumption changes 89
Other operating variance 31
Operating MCEV earnings 2010 212
149Analysts' Conference 2011
Operating MCEV earnings 2010 212
Economic variances –173
Other non-operating variance 0
Total MCEV earnings 2010 39
Closing adjustments –118
MCEV 31.12.2010 1,365

Munich Re
Backup: Market Consistent Embedded Value 2010
Primary insurance – German primary health
€m
MCEV 31.12.2009 1,971
Opening adjustments 5p g j
Adjusted MCEV 31.12.2009 1,977
New business value 28
Expected return 47
Experience variances 35
Assumption changes –178
Other operating variance 126
Operating MCEV earnings 2010 58
150Analysts' Conference 2011
Operating MCEV earnings 2010 58
Economic variances –180
Other non-operating variance 0
Total MCEV earnings 2010 –122
Closing adjustments –122
MCEV 31.12.2010 1,733
Development of swap rates Backup: Market Consistent Embedded Value 2010
EuroEuro US$US$
4%
5%
4%
5%
CADCAD GBPGBP
0%
1%
2%
3%
1 6 11 16 21 26 31 36
Target swaption implied volatilities (10y x 20y)31.12.2008 31.12.2009 31.12.2010
24.0% 15.6% 18.2%
Target swaption implied volatilities (10y x 20y)31.12.2008 31.12.2009 31.12.2010
25.5% 16.3% 16.3%
0%
1%
2%
3%
1 6 11 16 21 26 31 36
5% 5%
151Analysts' Conference 2011
Target swaption implied volatilities (10y x 20y)31.12.2008 31.12.2009 31.12.2010
14.6% 14.5% 16.1%
0%
1%
2%
3%
4%
1 6 11 16 21 26 31 36
Target swaption implied volatilities (10y x 20y)31.12.2008 31.12.2009 31.12.2010
14.6% 14.1% 13.2%
0%
1%
2%
3%
4%
1 6 11 16 21 26 31 36

Munich Re
Euro swap rates (used by Munich Re) vs. peer comparison sensitivity
5%Peer comparison sensitivity
Backup: Market Consistent Embedded Value 2010
Euro swap rates vs. peer comparison sensitivity (at year end 2010)Euro swap rates vs. peer comparison sensitivity (at year end 2010)
2%
3%
4%
Swap rates
€ MCEV 31 12 2010 MCEV b d
152Analysts' Conference 2011
0%
1%
1 79
€m MCEV 31.12.2010 (as reported)
MCEV based on peer swap rate
Primary insurance 4,108 5,061
Reinsurance 8,284 8,382
Term
Agenda – Backup
Additional highlights Q1–4 2010
Risk managementRisk management
Life reinsurance
Investments
Reserves
153Analysts' Conference 2011
Market Consistent Embedded Value 2010
Shareholder information

Munich Re
Development of shares in circulation Development of shares in circulation
8.9 million own shares were retired in 2010
Shares million 31.12.2009Acquisition of own
shares in Q1–4 2010Retirement of own
shares in Q1–4 2010 31.12.2010
Backup: Shareholder information
Shares in circulation 191.9 –11.5 0 180.4
Own shares held 5.5 11.5 –8.9 8.1
Total 197.4 0 –8.9 188.5
Weighted average number of shares in circulation Weighted average number of shares in circulation
200.9 194.7 185.4 196.0 193.3 181.5
154Analysts' Conference 2011
2008 2009 2010 Q4 2008 Q4 2009 Q4 2010
Between 1 January until 28 February 2011 additional 1.7 million shares were repurchased for an amount of €200m
Financial calendar
FINANCIAL CALENDARFINANCIAL CALENDAR
Appendix
17 March 2011 Commerzbank, "Growth & Responsibility Conference", Frankfurt
31 March 2011 Morgan Stanley "European Financials Conference", London
20 April 2011 Annual General Meeting, Munich
21 April 2011 Dividend payment
9 May 2011 Interim report as at 31 March 2011
20 May 2011 Deutsche Bank "German & Austrian Corporate Conference", Frankfurt
155Analysts' Conference 2011
26 May 2011 Autonomous "Rendez-Vous 2011", London
20 July 2011 Munich Re Capital Markets Day 2011, New York
4 August 2011Interim report as at 30 June 2011Half-year press conference
8 November 2011 Interim report as at 30 September 2011

Munich Re
For information, please contact
Christian Becker-Hussong
Head of Investor & Rating Agency Relations
Ralf Kleinschroth
Tel : +49 (89) 3891-4559
Thorsten Dzuba
Tel : +49 (89) 3891-8030
INVESTOR RELATIONS TEAMINVESTOR RELATIONS TEAM
Appendix
Head of Investor & Rating Agency RelationsTel.: +49 (89) 3891-3910E-mail: [email protected]
Tel.: +49 (89) 3891-4559E-mail: [email protected]
Tel.: +49 (89) 3891-8030E-mail: [email protected]
Christine Franziszi
Tel.: +49 (89) 3891-3875E-mail: [email protected]
Britta Hamberger
Tel.: +49 (89) 3891-3504E-mail: [email protected]
Andreas Silberhorn
Tel.: +49 (89) 3891-3366E-mail: [email protected]
Dr. Alexander Becker
Head of External Communication ERGOTel : +49 (211) 4937 1510
Mareike Berkling
Tel.: +49 (211) 4937-5077E mail: mareike berkling@ergo de
Andreas Hoffmann
Tel.: +49 (211) 4937-1573E mail: andreas hoffmann@ergo de
156Analysts' Conference 2011
Tel.: +49 (211) 4937-1510E-mail: [email protected]
E-mail: [email protected] E-mail: [email protected]
Münchener Rückversicherungs-Gesellschaft | Investor & Rating Agency Relations | Königinstraße 107 | 80802 München, GermanyFax: +49 (89) 3891-9888 | E-mail: [email protected] | Internet: www.munichre.com
Disclaimer
This presentation contains forward-looking statements that are based on current
assumptions and forecasts of the management of Munich Re. Known and unknown risks,
uncertainties and other factors could lead to material differences between the forward-looking
This presentation contains forward-looking statements that are based on current
assumptions and forecasts of the management of Munich Re. Known and unknown risks,
uncertainties and other factors could lead to material differences between the forward-looking
Backup: Shareholder information
uncertainties and other factors could lead to material differences between the forward-looking
statements given here and the actual development, in particular the results, financial situation
and performance of our Company. The Company assumes no liability to update these
forward-looking statements or to conform them to future events or developments.
157Analysts' Conference 2011