tsunami and earthquake activity in indonesia
TRANSCRIPT

LOCAL TSUNAMI WARNING AND MITIGATION ________________________________________________________________________________________________________________________________________
PETROPAVLOVSK-KAMCHATSKY TSUNAMI WORKSHOP, SEPTEMBER 10-15, 2002
TSUNAMI AND EARTHQUAKE ACTIVITY IN INDONESIA* Nanang T. Puspito
Department of Geophysics and Meteorology, Institute of Technology Bandung (ITB) Address: Jalan Ganeca 10, Bandung 40132, Indonesia
E-mail: [email protected]
ABSTRACT
Tsunami and earthquake activity in Indonesia during the period from 1901 to 2000 have been analyzed. A total of 108 tsunamis caused by earthquakes and 298 shallow earthquakes with magnitude Ms ≥ 6.5 occurred in the region. The tsunamigenic earthquakes occurred along subduction zones (Sunda, Banda, Pacific, and Philippine) and in the Sunda back-arc thrusting and Molucca Sea collision zones. Approximately 81% of tsunamis and 80% of shallow earthquakes occurred in Eastern Indonesia – i.e. the region east of 118o E – where tectonics show a more complicated pattern than the region in the west. The ratio between the number of tsunamis and shallow earthquake occurrence in the east part is slightly higher than in the west part. The tsunami and earthquake time occurrences show no systematic pattern although it can be noted that the most silent period was from 1941 to 1960. The earthquake magnitude of tsunamigenic earthquakes varies from 5.0 to 8.6 where about 86% of them have magnitude Ms > 6.0. The tsunami magnitude-earthquake magnitude relationship can be written as: m = 0.29 Ms – 0.93 for Ms < 6.5, and m = 1.17 Ms – 7.46 for Ms ≥ 6.5. While the tsunami intensity–earthquake magnitude relationship can be written as I = 0.23 Ms – 0.22. Most of the tsunamigenic earthquakes (about 93%) are shallow earthquakes that have focal depth less than 100 km.
1. INTRODUCTION
The Indonesian region is prone to earthquake and tsunami disasters. The region has been frequently affected by earthquake and tsunami, which killed approximately 22,000 people during the 20th century [ADRC, 2000]. Among the destructive earthquakes were the 1976 Jayapura (6,000 killed), 1994 Liwa (210 killed), and the 2000 Bengkulu (90 killed) earthquakes. The 1992 Flores (2,100 killed), 1994 Banyuwangi (240 killed), and the 1996 Biak (160 killed) tsunamis were classified as major destructive tsunamis in recent years.
Although the region is prone to tsunami disaster, tsunami activity is not well understood. This is partly because of very limited available information on historical tsunami activity. Fortunately, in recent years there were two tsunami catalogues [Latief et al., 2000; Gusiakov, 2001] developed. Latief et al. [2000] developed a tsunami catalog for the Indonesian region, while Gusiakov [2001] developed the catalog for the entire Pacific region.
By utilizing the two catalogues, this paper attempts to analyze tsunami – as well as earthquake – activity in the Indonesian region for a period from 1901 to 2000. The data was mainly taken from the work of Gusiakov, while tsunami data from Latief et al. were used in case when the data of Gusiakov were absent. Only tsunamis caused by earthquakes were considered in the analysis.
2. TECTONIC SETTING
The Indonesian region is one of the most tectonically complicated regions. The region is the place of plate convergence of the Eurasian, Indian-Australian, Pacific, and the Philippine Sea plates (Figure 1). The plates move relative to each other in a rather complicated manner. Plate boundaries are located along Java trench, Timor trough, New Guinea trench, Philippines trench, and Yap trench.
* Edited by A. B. Rabinovich and W. Rapatz.

Puspito N. T. _____________________________________________________________________
PETROPAVLOVSK-KAMCHATSKY TSUNAMI WORKSHOP, SEPTEMBER 10-15, 2002 139

LOCAL TSUNAMI WARNING AND MITIGATION ___________________________________________________________________
PETROPAVLOVSK-KAMCHATSKY TSUNAMI WORKSHOP, SEPTEMBER 10-15, 2002 140
The region includes several arcs such as Sunda, Banda, Sangihe, and Halmahera arcs that have their own special seismological features [Puspito and Shimazaki, 1995]. Sunda arc is a product of Indian Ocean and Eurasian plate convergence. The arc extends westward from Sumba passing through Java, Sumatra and Andaman islands. Banda arc extends eastward from Sumba passing through Tanimbar and Aru Islands and thence curves sharply counterclockwise to a westward through Seram and Buru. In the northeastern part of the region, Sangihe and Halmahera arcs move in opposite directions, i.e. Sangihe moves to the east while Halmahera moves to the west. The movement has made Molucca Sea region known as the place of an active arc-arc collision zone. This type of collision zone is unique in the world.
3. DATA COMPILATION
Gusiakov [2001] has developed a tsunami catalog for the entire Pacific region from 47 BC to 2000 AD. The catalog contains – among others – date, location of the source, earthquake magnitude, tsunami magnitude and intensity, run-up, the cause of tsunami, validity, fatalities, and the affected region. The validities were classified into 5 categories, i.e. 4 for definite tsunami, 3 for probable tsunami (probability about 75%), 2 for questionable tsunami (probability 50%), 1 for very doubtful tsunami (probability 25%), and 0 for unknown tsunami.
Based on the catalog we found 181 tsunamis caused by earthquake occurred in the Indonesian region for all of the validities. Among them a total of 103 tsunamis occurred during the period from 1901 to 2000. In this study we selected 90 tsunamis caused by earthquakes whose validities vary from categories 2 to 4 (probability ≥ 50%).
Latief et al. [2000] have compiled data for the Indonesian region from 1600 to 1999. They found that 105 tsunamis have occurred in the region. Among them 95 events were caused by earthquake, 9 events were caused by volcanic eruption, while one tsunami was caused by a landslide. Based on those data there were 46 tsunamis caused by earthquakes in this region during a period from 1901 to 1999. Among them 18 events were not listed in Gusiakov [2001]. Table 1 below listed the 18 tsunamis.
In this study we combine those 18 events from Latief et al. [2000] and the 90 previous selected events from Gusiakov [2001]. We have a total of 108 tsunamis generated by earthquake during the period from 1901 to 2000. Meanwhile all the earthquake data used in this study were compiled from the work of Gusiakov [2001]. We selected 298 shallow earthquakes that have focal depth < 100 km and magnitude (Ms) ≥ 6.5.
4. TSUNAMI AND EARTHQUAKE ACTIVITY
The selected tsunamis and shallow earthquakes were plotted in Figure 2. We can say that the tsunamis occurred along seismic active zones. Most of the tsunamis occurred in Sunda subduction, Sunda back-arc thrusting, Banda subduction, Molucca Sea collision, Pacific subduction, and the Philippine subduction zones.
The longitude distribution (Figures 2 and 3) shows that the region east of 118o E (namely Eastern Indonesia) has higher activities than the region in the west (namely Western Indonesia). About 81% (87 events) of the tsunamis and 80% (237 events) of shallow earthquakes occurred in Eastern Indonesia. This is in good agreement with the tectonic pattern that shows that the east part has a more complicated pattern than the west part (Figure 1). The tsunami occurrence efficiency (ratio between the number of tsunami and the number of

Puspito N. T. _____________________________________________________________________
PETROPAVLOVSK-KAMCHATSKY TSUNAMI WORKSHOP, SEPTEMBER 10-15, 2002 141
shallow earthquakes) in the east part is slightly higher than in the west part, i.e. 37% compare with 34%.
Table 1
List of selected tsunami data from Latief et al. [2000]
Date(Y-M-D) Lat. Lon. D Ms m Hmax F Affected Region
1908-03-24 -8.7 124.7 33 6.6 1.0 25 – Timor Island 1913-03-14 4.8 126.6 25 7.9 – – – North Sulawesi 1938-05-19 -1.0 120.0 60 7.6 1.5 3 – Central Sulawesi 1961-03-16 -8.2 122.0 75 6.3 – – 6 Flores 1975-01-15 -5.0 130.0 33 6.9 – – – Bandanaira
1975-03-05 -2.4 126.1 33 6.5 1.0 2 – Sanana, Sula Island
1975-07-30 -10.1 123.8 16 6.1 – – – Timor Island 1977-08-27 -8.0 125.3 25 6.8 – – 2 Flores
1979-12-17 -8.4 115.9 33 6.6 – – 27 Sumbawa, Lombok
1982-03-12 -4.4 128.1 – 5.8 – – – Molucca 1982-08-19 -0.1 121.6 44 5.2 – – – North Sulawesi 1982-12-25 -8.4 123.0 33 5.9 1.0 – 13 Larantuka 1984-01-08 -2.9 118.7 95 5.9 – – – South Sulawesi
1987-11-26 -8.4 124.3 33 6.5 1.0 – 83 Flores, Pantar Is.
1989-07-14 -8.1 125.1 52 6.2 0.0 – 7 Alor Island 1989-07-31 -8.1 121.4 13 6.3 0.0 – 3 Flores 1991-07-04 -8.1 124.7 29 6.2 – – 13 Alor Island 1992-06-20 2.0 122.8 – 6.2 0.0 – – North Sulawesi
Note: 1) Date(Y-M-D) is year, month, and day; 2) Lat. is latitude of earthquake epicentre; 3) Lon. is longitude of earthquake epicentre; 4) D is earthquake focal depth; 5) Ms is earthquake magnitude of surface wave; 6) m is tsunami magnitude; 7) Hmax is maximum vertical run-up; 8) F is number of fatalities.
Figure 4 shows the number of tsunami and earthquake occurrences in every 5 year interval. Almost no systematic pattern can be derived from the figure. However, it is shown that the most silent period was from 1941 to 1960 when only 7 tsunamis and 21 shallow earthquakes occurred in the region.
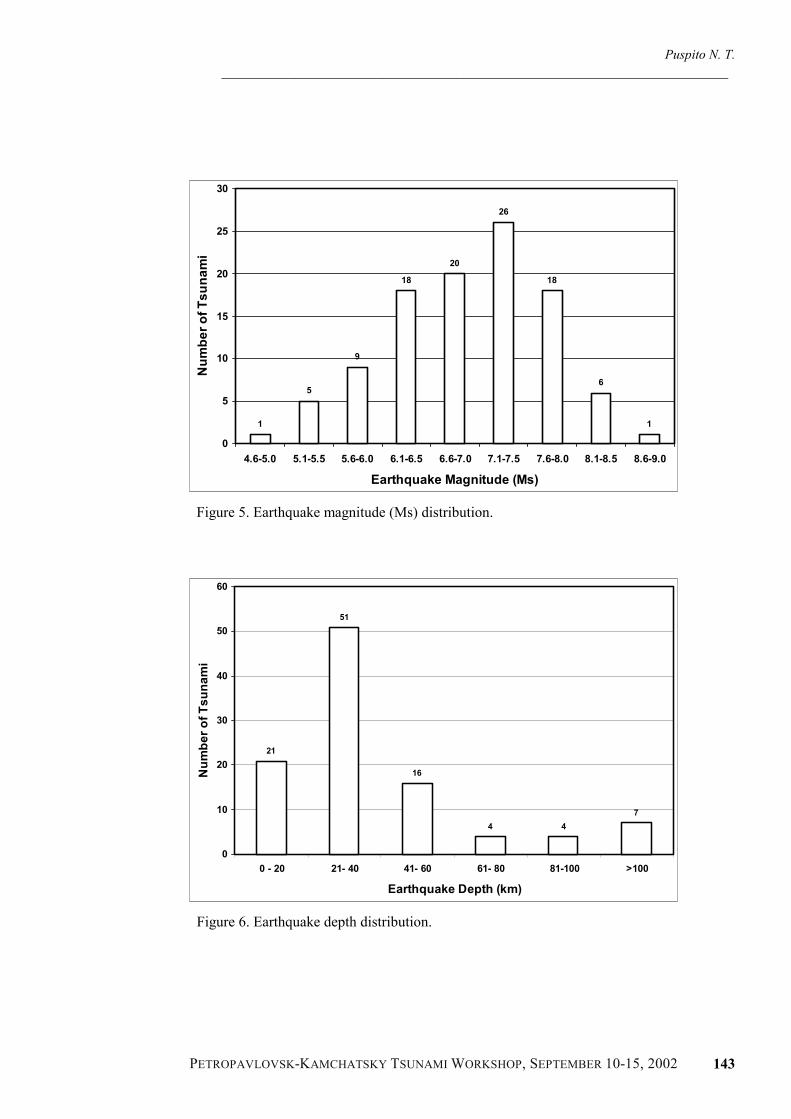
Figure 5 shows earthquake magnitude (Ms) distribution of tsunamis. Four tsunamis were caused by earthquakes of unknown magnitude. The earthquakes magnitude varies from 5.0 to 8.6, where about 86% (89 events) of them have magnitude greater than 6.0. This suggests that moderate to large earthquakes mainly generated the tsunamis in the region. Earthquake depth distribution (Figure 6) shows that most of the tsunamis (about 93%) have earthquake focal depth less than 100 km.

LOCAL TSUNAMI WARNING AND MITIGATION ___________________________________________________________________
PETROPAVLOVSK-KAMCHATSKY TSUNAMI WORKSHOP, SEPTEMBER 10-15, 2002 142
4 5 5 3 4
12
33 32
37
10
17 16
711
15
63
110
18
31
0
20
40
60
80
100
120
95 100 105 110 115 120 125 130 135 140Longitude (East)
Num
ber o
f Eve
nts
TsunamiEarthquake
Figure 3. Longitude distribution of tsunamis and shallow earthquakes.
2
54
3
13
6
3
7
0
31
46 6
57
8
4
15
6
1312
10
5
9
5 54
8
53
4
13
32
24
27
22
30
35
32
0
5
10
15
20
25
30
35
40
1905
1910
1915
1920
1925
1930
1935
1940
1945
1950
1955
1960
1965
1970
1975
1980
1985
1990
1995
2000
5 Years Interval
Num
ber o
f Eve
nts
TsunamiEarthquake
Figure 4. Time occurrences of tsunami and shallow earthquake.
Puspito N. T. _____________________________________________________________________
PETROPAVLOVSK-KAMCHATSKY TSUNAMI WORKSHOP, SEPTEMBER 10-15, 2002 143
1
5
9
18
20
26
18
6
1
0
5
10
15
20
25
30
4.6-5.0 5.1-5.5 5.6-6.0 6.1-6.5 6.6-7.0 7.1-7.5 7.6-8.0 8.1-8.5 8.6-9.0
Earthquake Magnitude (Ms)
Num
ber o
f Tsu
nam
i
Figure 5. Earthquake magnitude (Ms) distribution.
21
51
16
4 47
0
10
20
30
40
50
60
0 - 20 21- 40 41- 60 61- 80 81-100 >100
Earthquake Depth (km)
Num
ber o
f Tsu
nam
i
Figure 6. Earthquake depth distribution.

LOCAL TSUNAMI WARNING AND MITIGATION ___________________________________________________________________
PETROPAVLOVSK-KAMCHATSKY TSUNAMI WORKSHOP, SEPTEMBER 10-15, 2002 144
m = 0,29Ms - 0,93
m = 1,17Ms - 7,46
-6
-4
-2
0
2
4
6
4,0 4,5 5,0 5,5 6,0 6,5 7,0 7,5 8,0 8,5 9,0
Earthquake Magnitude (Ms)
Tsun
ami M
agni
tude
(m)
Figure 7. Tsunami magnitude – earthquake magnitude relationship.
I = 0,23Ms - 0,22
-6
-4
-2
0
2
4
6
4,0 4,5 5,0 5,5 6,0 6,5 7,0 7,5 8,0 8,5 9,0
Earthquake Magnitude (Ms)
Tsun
ami I
nten
sity
(I)
Figure 8. Tsunami intensity – earthquake magnitude relationship.

Puspito N. T. _____________________________________________________________________
PETROPAVLOVSK-KAMCHATSKY TSUNAMI WORKSHOP, SEPTEMBER 10-15, 2002 145
Iida [1958] proposed an empirical relationship between earthquake magnitude (Ms) and the tsunami magnitude (m). Based on the data of tsunamis occurring near Japan, he proposed an empirical relationship: m = 2.61 Ms – 18.44. Based on the present data (Figure 7) we derived two relationships for the Indonesian tsunami:
m = 0.29 Ms – 0.93 for Ms < 6.5, and m = 1.17 Ms – 7.46 for Ms ≥ 6.5.
The tsunami intensity (I) and earthquake magnitude (Ms) relationship can be seen in Figure 8. Although the data is scattered the tsunami intensity and earthquake magnitude relationship can be derived as I = 0.23 Ms – 0.22.
5. CONCLUSIONS
Based on the compiled data we can conclude the following:
1. A total of 108 tsunamis caused by earthquake and 298 shallow earthquakes (depth < 100 km; Ms ≥ 6.5) occurred in the Indonesian region during the period from 1901 to 2000. The tsunamigenic earthquakes occurred along Sunda subduction, Sunda back-arc thrusting, Banda subduction, Molucca Sea collision, Pacific subduction, and the Philippine subduction zones.
2. About 81% (87 events) of the tsunamis and about 80% (237 events) of shallow earthquakes occurred east of longitude 118o East where the tectonics show a more complicated pattern than the region in the west. The tsunami occurrence efficiency in the east part is slightly higher than in the west part, i.e. 37% compare with 34%.
3. Time occurrences show no systematic pattern although it can be noted that the most silent period was from 1941 to 1960 when only 7 tsunamis and 21 shallow earthquakes occurred in the region.
4. The earthquake magnitude of tsunamis varies from 5.0 to 8.6, where about 86% (89 events) of them have magnitude greater than 6.0. The tsunami magnitude – earthquake magnitude relationship can be written as: m = 0.29 Ms – 0.93 for Ms < 6.5, and m = 1.17 Ms – 7.46 for Ms ≥ 6.5. While the tsunami intensity – earthquake magnitude relationship can be written as I = 0.23 Ms – 0.22.
5. Most of the tsunamis (about 93%) were generated by shallow earthquake of focal depth less than 100 km.
REFERENCES
Asian Disaster Reduction Center (ADRC), 2000: Data Book on Asian Natural Disasters in the 20th Century. ADRC, Kobe, Japan.
Gusiakov V. K. 2001: Historical Tsunami Database for the Pacific, 47 B.C – 2000 A.D. Tsunami Laboratory, ICMMG SD RAS, Novosibirsk, Russia.
Iida K. 1958: Magnitude and energy of earthquakes accompanied by tsunami, and tsunami energy. J. Earth Science, Nagoya University, 6, 101-112.
Latief H., Puspito N. T. and Imamura F. 2000. Tsunami Catalog and Zones in Indonesia. J. Natural Disaster Science, 22 (1), 25-43
Puspito N. T. and Shimazaki K. 1995: Mantle structure and seismotectonics of the Sunda and Banda arcs. Tectonophysics, 251, 215-228.
Puspito N. T. 1996: General Seismological Features on Tsunamis in Indonesia. Proceeding of Workshop on Tsunami Modeling and its Application for Coastal Zone Development, BPPT Jakarta, 109-129.