tric on c apital gr oup inc. consolidated financial · pdf file2. tricon capital group annual...
TRANSCRIPT

ConsolidatedFinancial
Statementsfor the Year Ended December 31, 2016
TRICON CAPITAL GROUP INC.
Tricon Capital Group Annual Report 2016 1
PricewaterhouseCoopers LLP PwC Tower, 18 York Street, Suite 2600, Toronto, Ontario, Canada M5J 0B2 T: +1 416 863 1133, F: +1 416 365 8215 “PwC” refers to PricewaterhouseCoopers LLP, an Ontario limited liability partnership.
February 22, 2017 Independent Auditor’s Report To the Shareholders of Tricon Capital Group Inc. We have audited the accompanying consolidated financial statements of Tricon Capital Group Inc. and its subsidiaries, which comprise the consolidated balance sheets as at December 31, 2016 and December 31, 2015 and the consolidated statements of comprehensive income, changes in equity and cash flows for the years ended December 31, 2016 and December 31, 2015 and the related notes, which comprise a summary of significant accounting policies and other explanatory information. Management’s responsibility for the consolidated financial statements Management is responsible for the preparation and fair presentation of these consolidated financial statements in accordance with International Financial Reporting Standards, and for such internal control as management determines is necessary to enable the preparation of consolidated financial statements that are free from material misstatement, whether due to fraud or error. Auditor’s responsibility Our responsibility is to express an opinion on these consolidated financial statements based on our audits. We conducted our audits in accordance with Canadian generally accepted auditing standards. Those standards require that we comply with ethical requirements and plan and perform the audits to obtain reasonable assurance about whether the consolidated financial statements are free from material misstatement. An audit involves performing procedures to obtain audit evidence about the amounts and disclosures in the consolidated financial statements. The procedures selected depend on the auditor’s judgment, including the assessment of the risks of material misstatement of the consolidated financial statements, whether due to fraud or error. In making those risk assessments, the auditor considers internal control relevant to the entity’s preparation and fair presentation of the consolidated financial statements in order to design audit procedures that are appropriate in the circumstances, but not for the purpose of expressing an opinion on the effectiveness of the entity’s internal control. An audit also includes evaluating the appropriateness of accounting policies used and the reasonableness of accounting estimates made by management, as well as evaluating the overall presentation of the consolidated financial statements. We believe that the audit evidence we have obtained in our audits is sufficient and appropriate to provide a basis for our audit opinion.

2 Tricon Capital Group Annual Report 2016
Opinion In our opinion, the consolidated financial statements present fairly, in all material respects, the financial position of Tricon Capital Group Inc. and its subsidiaries as at December 31, 2016 and December 31, 2015 and its financial performance and its cash flows for the years then ended in accordance with International Financial Reporting Standards. Chartered Professional Accountants, Licensed Public Accountants

Tricon Capital Group Annual Report 2016 3
Consolidated Balance Sheets(in thousands of U.S. dollars)
Notes December 31, 2016 December 31, 2015
ASSETSCash $ 17,780 $ 4,493
Amounts receivable 16,892 8,088
Prepaid expenses and deposits 4 2,599 2,542
Investments – Tricon Housing Partners 5,6 301,787 303,782
Investments – Tricon American Homes 5,6 479,938 426,030
Investments – Tricon Lifestyle Communities 5,6 52,591 19,153
Investments – Tricon Luxury Residences 5,6 62,410 19,582
Intangible assets 11 24,967 30,527
Deferred income tax assets 10 12,404 11,282
Other assets 12 1,376 1,047
Total assets $ 972,744 $ 826,526
LIABILITIESAmounts payable and accrued liabilities 8 $ 10,892 $ 7,621
Dividends payable 13 5,459 4,857
Long-term incentive plan 17 13,359 15,717
Debt 7 168,857 71,353
Deferred income tax liabilities 10 30,488 20,600
Derivative financial instruments 9 28 8,376
Total liabilities 229,083 128,524
EquityShare capital 14 567,677 561,347
Contributed surplus 15,835 9,812
Cumulative translation adjustment 18,711 20,098
Retained earnings 127,691 90,813
Total shareholders' equity 729,914 682,070
Non-controlling interest 13,747 15,932
Total equity 743,661 698,002
Total liabilities and equity $ 972,744 $ 826,526
The accompanying notes are an integral part of these consolidated financial statements.
Approved by the Board of Directors
David Berman Michael Knowlton Duff Scott
4 Tricon Capital Group Annual Report 2016
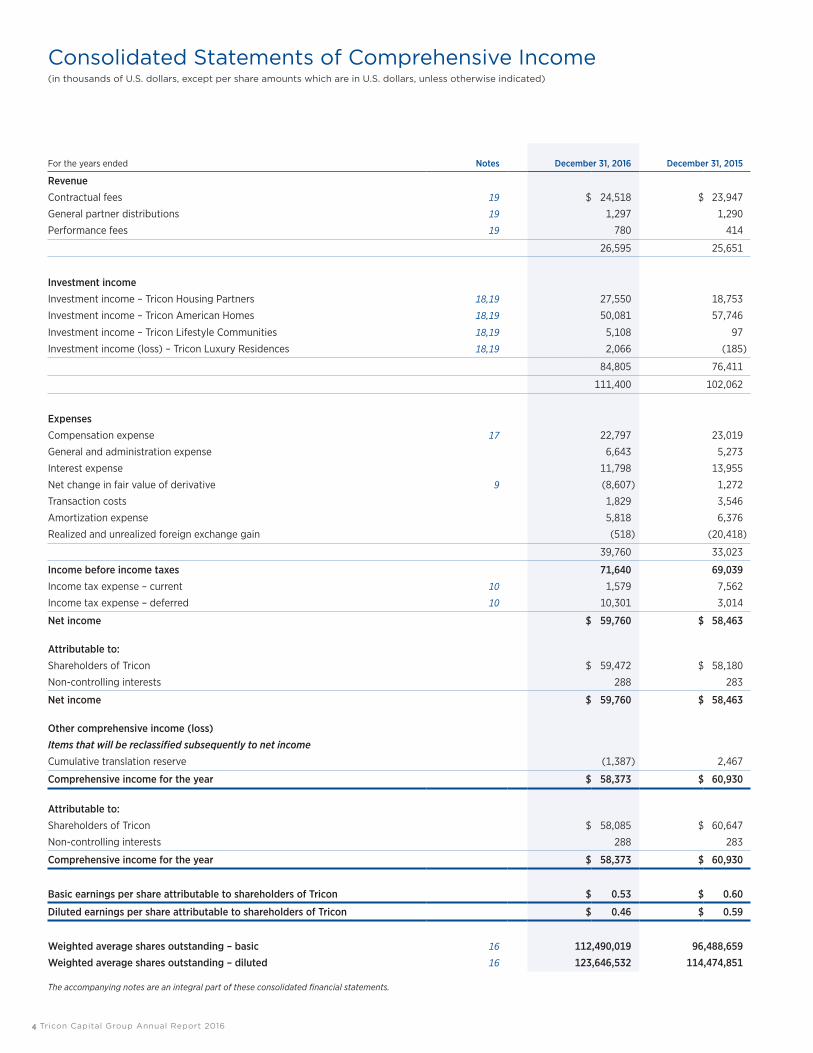
Consolidated Statements of Comprehensive Income(in thousands of U.S. dollars, except per share amounts which are in U.S. dollars, unless otherwise indicated)
For the years ended Notes December 31, 2016 December 31, 2015
Revenue
Contractual fees 19 $ 24,518 $ 23,947
General partner distributions 19 1,297 1,290
Performance fees 19 780 414
26,595 25,651
Investment income
Investment income – Tricon Housing Partners 18,19 27,550 18,753
Investment income – Tricon American Homes 18,19 50,081 57,746
Investment income – Tricon Lifestyle Communities 18,19 5,108 97
Investment income (loss) – Tricon Luxury Residences 18,19 2,066 (185)
84,805 76,411
111,400 102,062
ExpensesCompensation expense 17 22,797 23,019
General and administration expense 6,643 5,273
Interest expense 11,798 13,955
Net change in fair value of derivative 9 (8,607) 1,272
Transaction costs 1,829 3,546
Amortization expense 5,818 6,376
Realized and unrealized foreign exchange gain (518) (20,418)
39,760 33,023
Income before income taxes 71,640 69,039 Income tax expense – current 10 1,579 7,562
Income tax expense – deferred 10 10,301 3,014
Net income $ 59,760 $ 58,463
Attributable to:Shareholders of Tricon $ 59,472 $ 58,180
Non-controlling interests 288 283
Net income $ 59,760 $ 58,463
Other comprehensive income (loss)Items that will be reclassified subsequently to net incomeCumulative translation reserve (1,387) 2,467
Comprehensive income for the year $ 58,373 $ 60,930
Attributable to:Shareholders of Tricon $ 58,085 $ 60,647
Non-controlling interests 288 283
Comprehensive income for the year $ 58,373 $ 60,930
Basic earnings per share attributable to shareholders of Tricon $ 0.53 $ 0.60
Diluted earnings per share attributable to shareholders of Tricon $ 0.46 $ 0.59
Weighted average shares outstanding – basic 16 112,490,019 96,488,659
Weighted average shares outstanding – diluted 16 123,646,532 114,474,851
The accompanying notes are an integral part of these consolidated financial statements.

Tricon Capital Group Annual Report 2016 5
Consolidated Statements of Changes in Equity(in thousands of U.S. dollars)
Notes Share capitalContributed
surplus
Cumulative translation
adjustmentRetained earnings
Total shareholders’
equity
Non- controlling
interest Total
Balance at January 1, 2016 $ 561,347 $ 9,812 $ 20,098 $ 90,813 $ 682,070 $ 15,932 $ 698,002
Net income – – – 59,472 59,472 288 59,760
Cumulative translation reserve – – (1,387) – (1,387) – (1,387)
Distribution to non-controlling interest – – – – – (2,473) (2,473)
Dividends/Dividend reinvestment plan 13 4,560 – – (22,257) (17,697) – (17,697)
Repurchase of common shares 14 (1,113) – – (337) (1,450) – (1,450)
Bought deal offering 14 1,362 – – – 1,362 – 1,362
Stock options 17 77 926 – – 1,003 – 1,003
Phantom units 17 617 (805) – – (188) – (188)
Deferred share units 17 827 5,902 – – 6,729 – 6,729
Balance at December 31, 2016 $ 567,677 $ 15,835 $ 18,711 $ 127,691 $ 729,914 $ 13,747 $ 743,661
Balance at January 1, 2015 $ 393,200 $ 7,833 $ 17,631 $ 52,954 $ 471,618 $ 18,360 $ 489,978 Net income – – – 58,180 58,180 283 58,463
Cumulative translation reserve – – 2,467 – 2,467 – 2,467
Distribution to non-controlling interest – – – – – (2,711) (2,711)
Dividends/Dividend reinvestment plan 13 2,558 – – (18,157) (15,599) – (15,599)
Debentures conversion 14 (2,921) – – (2,164) (5,085) – (5,085)
Repurchase of common shares 14 56,499 – – – 56,499 – 56,499
Issuance of common shares, net of issuance costs of $5,300 14 109,436 – – – 109,436 – 109,436
Stock options 17 1,075 431 – – 1,506 – 1,506
Phantom units 17 528 (641) – – (113) – (113)
Deferred share units 17 972 2,189 – – 3,161 – 3,161
Balance at December 31, 2015 $ 561,347 $ 9,812 $ 20,098 $ 90,813 $ 682,070 $ 15,932 $ 698,002
The accompanying notes are an integral part of these consolidated financial statements.
6 Tricon Capital Group Annual Report 2016
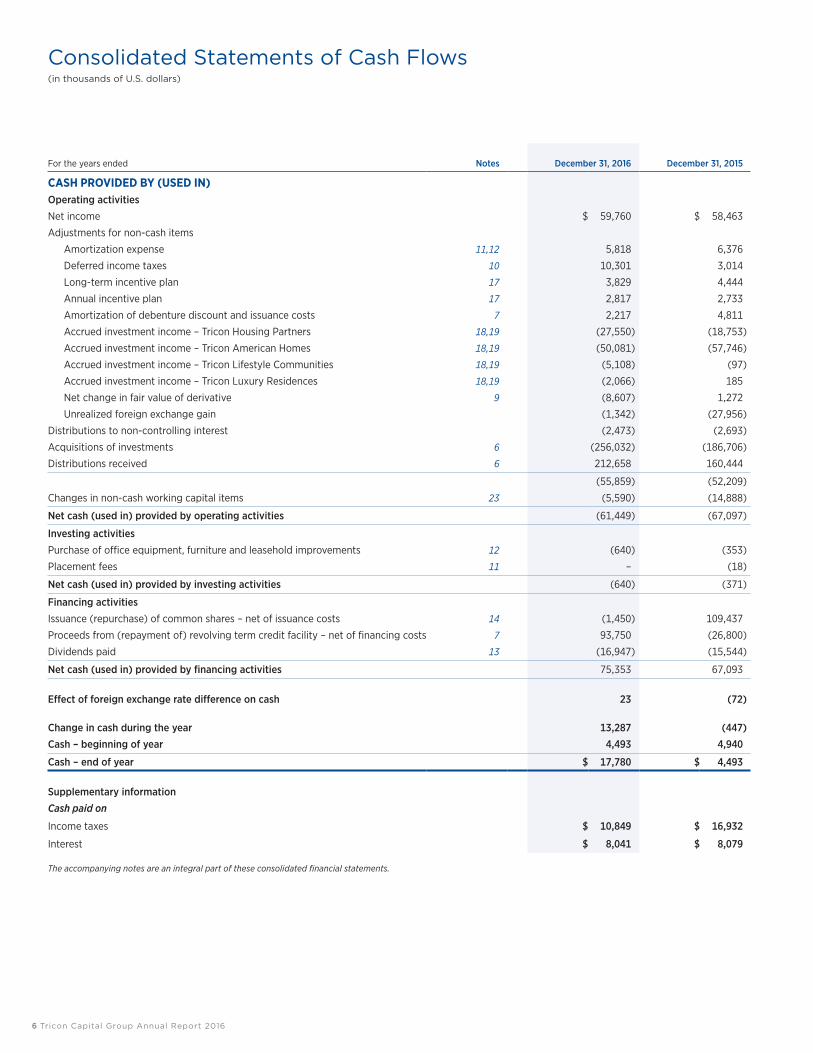
Consolidated Statements of Cash Flows(in thousands of U.S. dollars)
For the years ended Notes December 31, 2016 December 31, 2015
CASH PROVIDED BY (USED IN)Operating activities
Net income $ 59,760 $ 58,463
Adjustments for non-cash items
Amortization expense 11,12 5,818 6,376
Deferred income taxes 10 10,301 3,014
Long-term incentive plan 17 3,829 4,444
Annual incentive plan 17 2,817 2,733
Amortization of debenture discount and issuance costs 7 2,217 4,811
Accrued investment income – Tricon Housing Partners 18,19 (27,550) (18,753)
Accrued investment income – Tricon American Homes 18,19 (50,081) (57,746)
Accrued investment income – Tricon Lifestyle Communities 18,19 (5,108) (97)
Accrued investment income – Tricon Luxury Residences 18,19 (2,066) 185
Net change in fair value of derivative 9 (8,607) 1,272
Unrealized foreign exchange gain (1,342) (27,956)
Distributions to non-controlling interest (2,473) (2,693)
Acquisitions of investments 6 (256,032) (186,706)
Distributions received 6 212,658 160,444
(55,859) (52,209)
Changes in non-cash working capital items 23 (5,590) (14,888)
Net cash (used in) provided by operating activities (61,449) (67,097)
Investing activitiesPurchase of office equipment, furniture and leasehold improvements 12 (640) (353)
Placement fees 11 – (18)
Net cash (used in) provided by investing activities (640) (371)
Financing activitiesIssuance (repurchase) of common shares – net of issuance costs 14 (1,450) 109,437
Proceeds from (repayment of) revolving term credit facility – net of financing costs 7 93,750 (26,800)
Dividends paid 13 (16,947) (15,544)
Net cash (used in) provided by financing activities 75,353 67,093
Effect of foreign exchange rate difference on cash 23 (72)
Change in cash during the year 13,287 (447)
Cash – beginning of year 4,493 4,940
Cash – end of year $ 17,780 $ 4,493
Supplementary information
Cash paid on
Income taxes $ 10,849 $ 16,932
Interest $ 8,041 $ 8,079
The accompanying notes are an integral part of these consolidated financial statements.
Tricon Capital Group Annual Report 2016 7
1. Nature of businessTricon Capital Group Inc. (“Tricon” or the “Company”) is a principal investor and asset manager focused on the residential real estate industry in North America. In the principal investment portfolios, the Company primarily invests through Tricon Housing Partners, Tricon American Homes, Tricon Lifestyle Communities and Tricon Luxury Residences. In Private Funds and Advisory, the Company manages, on behalf of private investors, commingled funds, side-cars and separate investment accounts that invest in the development of real estate in North America and generate contractual fee income for the Company.
Tricon was incorporated on June 16, 1997 under the Business Corporations Act (Ontario) and its head office is located at 1067 Yonge Street, Toronto, Ontario, M4W 2L2. The Company is domiciled in Canada. Tricon became a public company on May 20, 2010, and its common shares are listed on the TSX (symbol: TCN).
These consolidated financial statements were approved for issue on February 21, 2017 by the Board of Directors of Tricon.
2. Summary of significant accounting policiesThe following is a summary of the significant accounting policies applied in the preparation of these consolidated financial statements.
Basis of preparation and measurementThe consolidated financial statements are prepared on a going-concern basis and have been presented in U.S. dollars, which is also the Company’s func-tional currency. All financial information is presented in thousands of U.S. dollars except where otherwise indicated.
These consolidated financial statements have been prepared in accordance with International Financial Reporting Standards (“IFRS”) as set out in the CPA Canada Handbook – Accounting. The preparation of consolidated financial statements in accordance with IFRS requires the use of certain critical account-ing estimates. It also requires management to exercise judgement in applying Tricon’s accounting policies. The areas involving a higher degree of judgement or complexity, or areas where assumptions are significant to the consolidated financial statements, are disclosed in Note 3.
These consolidated financial statements have been prepared under the historical cost convention, except for (i) investments in Tricon Housing Partners, Tricon American Homes, Tricon Lifestyle Communities and Tricon Luxury Residences; and (ii) derivative financial instruments, which are recorded at fair value through profit or loss (“FVTPL”).
The Company presents its consolidated balance sheet with its assets and liabilities in decreasing order of liquidity. The notes to the consolidated financial statements provide information on the Company’s current assets and current liabilities (Note 20). The Company believes this presentation is more relevant given the nature of the Company’s operations, which do not have specifically identifiable operating cycles.
Foreign currency translation
Functional and presentation currencyEffective January 1, 2015, Tricon changed the functional and presentation currency to U.S. dollars given the increasing prevalence of U.S. dollar-denominated activities of the Company over time. The change in functional currency from Canadian dollars to U.S. dollars is accounted for prospectively from January 1, 2015. The exchange rate used to translate the balance sheet to reflect the change in functional currency on adoption is $1.16. Items included in the financial statements of each of the Company’s subsidiaries are measured using the currency of the primary economic environment of the subsidiary (the functional currency). The consolidated financial statements are presented in U.S. dollars.
Foreign currency transactions (Canadian dollar) are translated into U.S. dollars using exchange rates in effect at the date of the transaction. Monetary assets and liabilities denominated in foreign currencies are translated into U.S. dollars using the exchange rate in effect at the measurement date. Non-monetary assets and liabilities denominated in foreign currencies are translated into U.S. dollars using the historical exchange rate or the exchange rate in effect at the measurement date for items recognized at FVTPL. Gains and losses arising from foreign exchange are included in the statement of comprehensive income.
SubsidiariesFor subsidiaries that are required to be consolidated, the results and financial position of those subsidiaries with a functional currency different from the presentation currency are translated into the presentation currency as follows:
i) assets and liabilities are translated at the closing rate at the date of the balance sheet;
ii) income and expenses are translated at average exchange rates. The Company uses monthly average exchange rates due to the volume of transactions each month; and
iii) all resulting exchange differences are recognized in other comprehensive income.
Notes to the Consolidated Financial Statementsfor the year ended December 31, 2016
(in thousands of U.S. dollars, except per share amounts and percentage amounts)
8 Tricon Capital Group Annual Report 2016
NOTES TO THE CONSOLIDATED FINANCIAL STATEMENTSfor the year ended December 31, 2016 (in thousands of U.S. dollars, except per share amounts and percentage amounts)
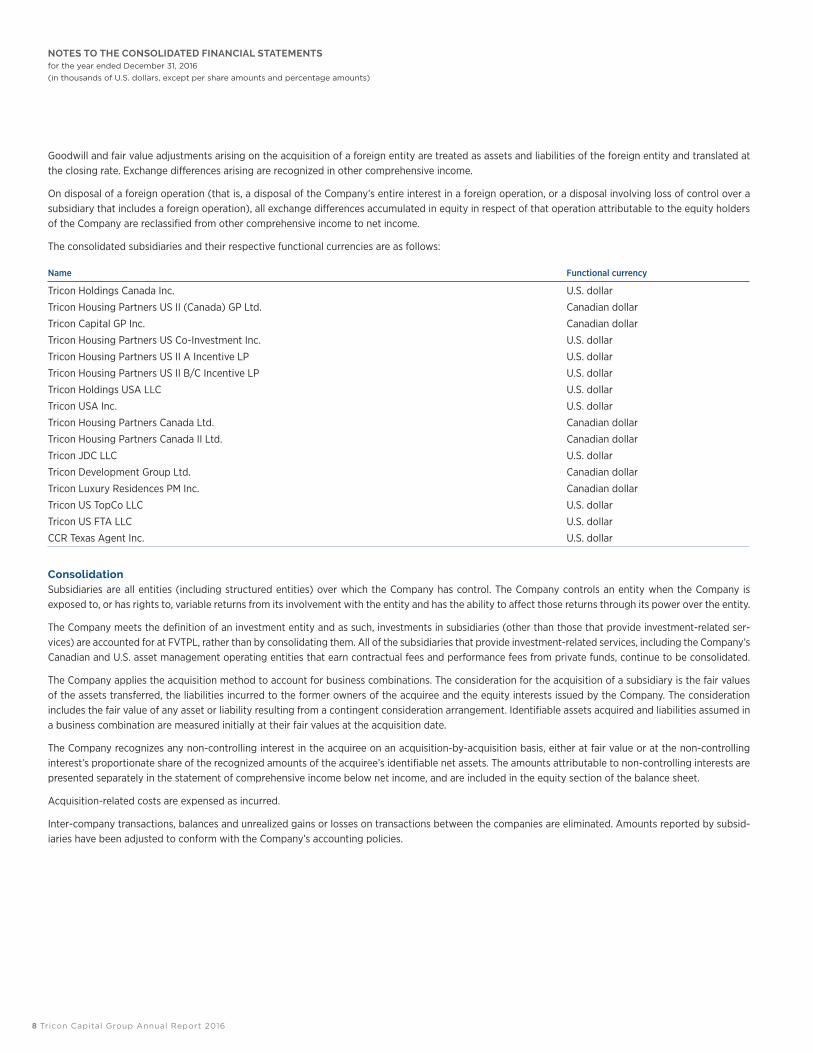
Goodwill and fair value adjustments arising on the acquisition of a foreign entity are treated as assets and liabilities of the foreign entity and translated at the closing rate. Exchange differences arising are recognized in other comprehensive income.
On disposal of a foreign operation (that is, a disposal of the Company’s entire interest in a foreign operation, or a disposal involving loss of control over a subsidiary that includes a foreign operation), all exchange differences accumulated in equity in respect of that operation attributable to the equity holders of the Company are reclassified from other comprehensive income to net income.
The consolidated subsidiaries and their respective functional currencies are as follows:
Name Functional currency
Tricon Holdings Canada Inc. U.S. dollar
Tricon Housing Partners US II (Canada) GP Ltd. Canadian dollar
Tricon Capital GP Inc. Canadian dollar
Tricon Housing Partners US Co-Investment Inc. U.S. dollar
Tricon Housing Partners US II A Incentive LP U.S. dollar
Tricon Housing Partners US II B/C Incentive LP U.S. dollar
Tricon Holdings USA LLC U.S. dollar
Tricon USA Inc. U.S. dollar
Tricon Housing Partners Canada Ltd. Canadian dollar
Tricon Housing Partners Canada II Ltd. Canadian dollar
Tricon JDC LLC U.S. dollar
Tricon Development Group Ltd. Canadian dollar
Tricon Luxury Residences PM Inc. Canadian dollar
Tricon US TopCo LLC U.S. dollar
Tricon US FTA LLC U.S. dollar
CCR Texas Agent Inc. U.S. dollar
ConsolidationSubsidiaries are all entities (including structured entities) over which the Company has control. The Company controls an entity when the Company is exposed to, or has rights to, variable returns from its involvement with the entity and has the ability to affect those returns through its power over the entity.
The Company meets the definition of an investment entity and as such, investments in subsidiaries (other than those that provide investment-related ser-vices) are accounted for at FVTPL, rather than by consolidating them. All of the subsidiaries that provide investment-related services, including the Company’s Canadian and U.S. asset management operating entities that earn contractual fees and performance fees from private funds, continue to be consolidated.
The Company applies the acquisition method to account for business combinations. The consideration for the acquisition of a subsidiary is the fair values of the assets transferred, the liabilities incurred to the former owners of the acquiree and the equity interests issued by the Company. The consideration includes the fair value of any asset or liability resulting from a contingent consideration arrangement. Identifiable assets acquired and liabilities assumed in a business combination are measured initially at their fair values at the acquisition date.
The Company recognizes any non-controlling interest in the acquiree on an acquisition-by-acquisition basis, either at fair value or at the non-controlling interest’s proportionate share of the recognized amounts of the acquiree’s identifiable net assets. The amounts attributable to non-controlling interests are presented separately in the statement of comprehensive income below net income, and are included in the equity section of the balance sheet.
Acquisition-related costs are expensed as incurred.
Inter-company transactions, balances and unrealized gains or losses on transactions between the companies are eliminated. Amounts reported by subsid-iaries have been adjusted to conform with the Company’s accounting policies.
Tricon Capital Group Annual Report 2016 9
NOTES TO THE CONSOLIDATED FINANCIAL STATEMENTSfor the year ended December 31, 2016 (in thousands of U.S. dollars, except per share amounts and percentage amounts)
Investments in associatesAssociates are all entities over which the Company has significant influence but not control, generally accompanying a shareholding of between 20% and 50% of the voting rights. Associates that are held as part of the Company’s investment portfolio are carried on the balance sheet at fair value even though the Company may have significant influence over those companies. This treatment is permitted by IAS 28, “Investment in Associates”, which allows invest-ments that are held by the Company to be recognized and measured at FVTPL and accounted for in accordance with IAS 39 and IFRS 13, with changes in fair value recognized in the statement of comprehensive income.
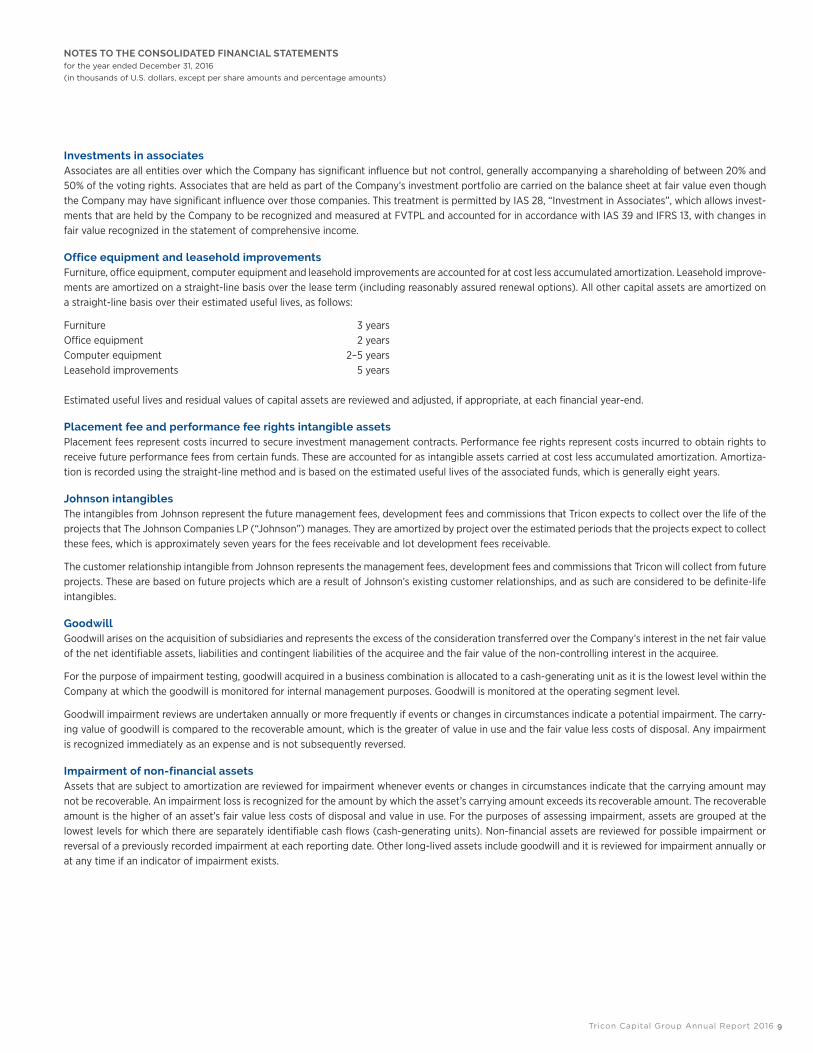
Office equipment and leasehold improvementsFurniture, office equipment, computer equipment and leasehold improvements are accounted for at cost less accumulated amortization. Leasehold improve-ments are amortized on a straight-line basis over the lease term (including reasonably assured renewal options). All other capital assets are amortized on a straight-line basis over their estimated useful lives, as follows:
Furniture 3 yearsOffice equipment 2 yearsComputer equipment 2–5 yearsLeasehold improvements 5 years
Estimated useful lives and residual values of capital assets are reviewed and adjusted, if appropriate, at each financial year-end.
Placement fee and performance fee rights intangible assetsPlacement fees represent costs incurred to secure investment management contracts. Performance fee rights represent costs incurred to obtain rights to receive future performance fees from certain funds. These are accounted for as intangible assets carried at cost less accumulated amortization. Amortiza-tion is recorded using the straight-line method and is based on the estimated useful lives of the associated funds, which is generally eight years.
Johnson intangiblesThe intangibles from Johnson represent the future management fees, development fees and commissions that Tricon expects to collect over the life of the projects that The Johnson Companies LP (“Johnson”) manages. They are amortized by project over the estimated periods that the projects expect to collect these fees, which is approximately seven years for the fees receivable and lot development fees receivable.
The customer relationship intangible from Johnson represents the management fees, development fees and commissions that Tricon will collect from future projects. These are based on future projects which are a result of Johnson’s existing customer relationships, and as such are considered to be definite-life intangibles.
GoodwillGoodwill arises on the acquisition of subsidiaries and represents the excess of the consideration transferred over the Company’s interest in the net fair value of the net identifiable assets, liabilities and contingent liabilities of the acquiree and the fair value of the non-controlling interest in the acquiree.
For the purpose of impairment testing, goodwill acquired in a business combination is allocated to a cash-generating unit as it is the lowest level within the Company at which the goodwill is monitored for internal management purposes. Goodwill is monitored at the operating segment level.
Goodwill impairment reviews are undertaken annually or more frequently if events or changes in circumstances indicate a potential impairment. The carry-ing value of goodwill is compared to the recoverable amount, which is the greater of value in use and the fair value less costs of disposal. Any impairment is recognized immediately as an expense and is not subsequently reversed.
Impairment of non-financial assetsAssets that are subject to amortization are reviewed for impairment whenever events or changes in circumstances indicate that the carrying amount may not be recoverable. An impairment loss is recognized for the amount by which the asset’s carrying amount exceeds its recoverable amount. The recoverable amount is the higher of an asset’s fair value less costs of disposal and value in use. For the purposes of assessing impairment, assets are grouped at the lowest levels for which there are separately identifiable cash flows (cash-generating units). Non-financial assets are reviewed for possible impairment or reversal of a previously recorded impairment at each reporting date. Other long-lived assets include goodwill and it is reviewed for impairment annually or at any time if an indicator of impairment exists.

10 Tricon Capital Group Annual Report 2016
NOTES TO THE CONSOLIDATED FINANCIAL STATEMENTSfor the year ended December 31, 2016 (in thousands of U.S. dollars, except per share amounts and percentage amounts)
Financial instruments
Financial assetsFinancial assets are classified as financial assets at FVTPL, loans and receivables, held-to-maturity financial assets and available-for-sale financial assets, as appropriate. The Company determines the classification of its financial assets at initial recognition. When financial assets are recognized initially, they are measured at fair value, plus, in the case of financial assets not carried at FVTPL, directly attributable transaction costs.
Transaction costs related to financial assets at FVTPL are expensed as incurred in the statement of comprehensive income. Subsequent to initial recognition, financial assets at FVTPL are measured at fair value.
Gains and losses arising from changes in the fair value of the financial assets at FVTPL category are presented in the statement of comprehensive income within investment income. Financial assets and liabilities at FVTPL are presented within changes in operating assets and liabilities in the consolidated state-ments of cash flows.
Financial assets are derecognized only when the contractual rights to the cash flows from the financial assets expire or the Company transfers substantially all of the risks and rewards of ownership.
The Company’s other financial assets carried at amortized cost consist of cash and cash equivalents and amounts receivable.
Cash includes cash on hand and deposits held at call with banks.
Cash and amounts receivable are initially recognized at fair value and subsequently accounted for at amortized cost. Interest income is accounted for using the effective interest rate method, less a provision for impairment.
The Company assesses, at each financial position date, whether there is objective evidence that receivables are impaired. If there is objective evidence of impairment (such as significant financial difficulty of the obligor, breach of contract, or it becomes probable that the debtor will enter bankruptcy), the receivable is tested for impairment. The amount of the loss is measured as the difference between the account’s carrying amount and the present value of estimated future cash flows (excluding future expected credit losses that have not been incurred), discounted at the original effective interest rate (that is, the effective interest rate computed at initial recognition).
The carrying amount is reduced through the use of an allowance account. The amount of the loss is recognized in net income.
If in a subsequent period the amount of the impairment loss decreases and the decrease can be related objectively to an event occurring after the impair-ment was recognized, the previously recognized impairment loss is reversed, to the extent that the carrying value of the receivable does not exceed its amortized cost at the reversal date. Any subsequent reversal of an impairment loss is recognized in net income.
Financial liabilitiesLiabilities within the scope of IAS 39 are classified as financial liabilities at FVTPL or other liabilities, as appropriate.
A financial liability is derecognized when the obligation under the liability is discharged or cancelled, or expires.
The Company’s financial liabilities consist of amounts payable and accruals, dividends payable, debentures interest payable, bank debt and debentures payable and derivative financial instruments. The Company’s financial liabilities are classified as other liabilities.
Bank debt and debentures payable are initially recognized at fair value and subsequently accounted for at amortized cost. Interest expense is accounted for using the effective interest rate method.
The effective interest rate method is a method of calculating the amortized cost of a financial asset or financial liability and of allocating the interest income or interest expense over the relevant period. The effective interest rate is the rate that discounts estimated future cash payments or receipts throughout the expected life of the financial instrument, or a shorter period where appropriate, to the net carrying amount of the financial asset or financial liability. When calculating the effective interest rate, the Company estimates cash flows considering all contractual terms of the financial instrument but does not consider future credit losses. The calculation includes all fees paid or received between parties to the contract that are an integral part of the effective interest rate, transaction costs and all other premiums or discounts.
Derivative financial instrumentsDerivative financial instruments, which are comprised of the conversion and redemption options related to the convertible debentures, are initially recog-nized at fair value on the date a derivative contract is entered into and are subsequently remeasured at fair value with the resulting gain or loss reflected in net income. Derivatives are valued using model calibration. Inputs to the valuation model are determined from observable market data wherever possible, including prices available from exchanges, over-the-counter markets and consensus pricing. Certain inputs may not be observable in the market directly, but can be determined from observable prices via model calibration procedures or estimated from historical data or other sources.

Tricon Capital Group Annual Report 2016 11
NOTES TO THE CONSOLIDATED FINANCIAL STATEMENTSfor the year ended December 31, 2016 (in thousands of U.S. dollars, except per share amounts and percentage amounts)
Compound financial instrumentsCompound financial instruments issued by the Company comprise convertible unsecured subordinate debentures that can be converted to share capital at the option of the holder. The Company may settle the conversion right in cash in lieu of common shares unless the holder has explicitly indicated that they do not wish to receive cash. The cash settlement amount depends on the weighted average trading price of the common shares of the Company. This settlement option requires the Company to record the conversion option as a derivative financial instrument measured at fair value at each reporting period, with changes in fair value recorded in net income.
In addition, the debentures contain a redemption option, subject to several conditions, which allows the Company to redeem the debentures, in whole or in part, and the Company may settle the redemption option either in cash at par plus accrued and unpaid interest or in common shares, with the number of common shares to be issued depending on the weighted average trading price of the common shares of the Company. The redemption option is recorded as a derivate financial instrument measured at fair value at each reporting period, with changes in fair value recorded in net income (loss).
The host liability component of a compound financial instrument is recognized initially at the fair value of a similar liability that does not have an equity conversion option. The conversion and redemption options are considered to be interrelated and therefore are treated as a single compound embedded derivative which is recognized at fair value.
Any directly attributable transaction costs are allocated entirely to the host liability component.
Offsetting financial instrumentsFinancial assets and liabilities are offset and the net amount reported on the balance sheet when there is a legally enforceable right to offset the recognized amounts and there is an intention to settle on a net basis or realize the asset and settle the liability simultaneously. As of December 31, 2016, the Company does not have any assets or liabilities that are subject to an offsetting agreement.
LeasesLeases in which a significant portion of the risks and rewards of ownership are retained by the lessor are classified as operating leases. Payments made under operating leases, net of any incentives received from the lessor, are recorded as an expense in net income on a straight-line basis over the term of the lease. Leases of assets where the Company has retained substantially all of the risks and rewards of ownership are classified as finance leases. Finance leases are capitalized at the commencement of the lease at the lower of the fair value of the leased property and the present value of the minimum lease payments.
Share capitalCommon shares are classified as equity. Incremental costs directly attributable to the issue of new shares are shown as a deduction, net of tax, from the proceeds.
Where the Company purchases its equity share capital for cancellation, the consideration paid, including any directly attributable incremental costs, is deducted from equity attributable to the Company’s equity holders.
Earnings per share
BasicBasic earnings per share is determined using the weighted average number of shares outstanding including vested phantom units and deferred share units issued during the reporting period, taking into account on a retrospective basis any increases or decreases caused by share splits or reverse share splits occurring after the reporting period, but prior to the financial statements being authorized for issue.
DilutedThe Company considers the effects of stock compensation and convertible debentures in calculating diluted earnings per share. Diluted earnings per share is calculated by adjusting net income attributable to shareholders of the Company and the weighted average number of shares outstanding based on the assumption of the conversion of all potentially dilutive shares on a weighted average basis from the date the potential share compensation vests and from the conversion date of the debentures to the balance sheet date. The conversion date of the debenture units is assumed to be the later of the beginning of the reporting period and the closing date, in accordance with IAS 33.
DividendsDividends on common shares are recognized in the consolidated financial statements in the year in which the dividends are approved by Tricon’s Board of Directors.

12 Tricon Capital Group Annual Report 2016
NOTES TO THE CONSOLIDATED FINANCIAL STATEMENTSfor the year ended December 31, 2016 (in thousands of U.S. dollars, except per share amounts and percentage amounts)
Current and deferred income taxesIncome tax expense includes current and deferred income taxes. Income tax expense is recognized in the statement of comprehensive income, except to the extent that it relates to items recognized directly in equity, in which case the tax is also recognized directly in equity.
Current income taxes are the expected taxes payable on the taxable income for the year, using income tax rates enacted, or substantively enacted, at the end of the reporting period, and any adjustment to income taxes payable in respect of previous years. The Company uses the liability method to recognize deferred income taxes on temporary differences arising between the tax bases of assets and liabilities and their carrying amounts. Deferred income tax assets are only recorded if it is probable that they will be realized. Enacted or substantively enacted rates in effect at the consolidated balance sheet date that are expected to apply when the deferred income tax asset is realized or the deferred tax liability is settled are used to calculate deferred income taxes.
Deferred income tax assets and liabilities are offset when there is a legally enforceable right to offset current tax assets against current tax liabilities and when the deferred income tax assets and liabilities relate to income taxes levied by the same taxation authority on either the same taxable entity or differ-ent taxable entities where there is an intention to settle the balances on a net basis.
Investment incomeInvestment income includes gains and losses arising on the remeasurement of investments at FVTPL, including foreign exchange gains and losses.
Revenue recognitionRevenue comprises the fair value of the consideration received or receivable from the provision of services in the ordinary course of the Company’s activi-ties. The Company recognizes revenue when the amount of revenue can be reliably measured, it is probable that future economic benefits will be received and when specific criteria have been met, as described below.
Revenues comprise contractual fees and general partner distributions which are not contingent on the performance of the underlying funds as well as performance fees earned in respect of investment management services provided to investment funds managed by the Company. Contractual fees are recognized as services are performed and are based on a fixed percentage of each fund’s committed capital prior to the expiration of the fund’s investment period and based on invested capital following the expiration of the relevant investment period. The contractual fees also include the management and development fees earned by Johnson from its underlying projects.
General partner distributions are recognized as services are performed.
Performance fees are earned based on fixed percentages of the distributions of each fund in excess of predetermined thresholds as outlined by each limited partnership agreement. Performance fees are recognized when the amount of revenue can be reliably measured and it is probable that future economic benefits will flow to the Company, which is generally subsequent to the return of all the original capital provided by investors plus a preferred rate of return as specified in the limited partnership agreement. Contractual fees and performance fees are earned through the Company’s fiduciary activities as an invest-ment manager.
Compensation arrangements
Stock option planThe Company accounts for its stock option plan by calculating the fair value of the options as of the grant date using a Black-Scholes option pricing model and observable market inputs. This fair value is recognized as compensation cost using the graded vesting method over the vesting period of the options.
Annual Incentive Plan (“AIP”)The Board of Directors approved an Annual Incentive Plan (“AIP”) and a Performance Fee-Related Bonus Plan known as the long-term incentive plan (“LTIP”). The plans were approved as of January 2014 and the AIP was updated by the Board as of March 2015.
Aggregate AIP awards are calculated on an annual basis as a percentage (the “AIP Percentage”) of “EBITDA for Bonus Purposes” as defined under the AIP, with the actual percentage, not to exceed 20%, determined annually at the Board’s discretion. The aggregate AIP awards are allocated among employees at the Board’s discretion. Under the current plan, at least 60% of AIP compensation will be distributed as cash, and up to 40% in Deferred Share Units granted pursuant to the Company’s Deferred Share Unit Plan (“DSUs”) with a one-year vesting and expense period. Expenses incurred under the AIP are recognized in the period when services are provided.
Tricon Capital Group Annual Report 2016 13
NOTES TO THE CONSOLIDATED FINANCIAL STATEMENTSfor the year ended December 31, 2016 (in thousands of U.S. dollars, except per share amounts and percentage amounts)
Long-term incentive plan (“LTIP”)LTIP expense is generated from two sources: (i) 50% of the Company’s share of performance fees or carried interest from Tricon Housing Partners and Tricon Luxury Residences Canada, and (ii) the AIP Percentage of THP1 US investment income, payable in DSUs which vest over a five-year period. Amounts under the LTIP are allocated among employees pursuant to the LTIP.
For the LTIP generated from the Company’s share of performance fees or carried interest from Tricon Housing Partners and Tricon Luxury Residences Canada, the Company estimates the LTIP liability by determining the performance fees at each reporting date based on the estimated fair value of the underlying investments. Changes in the LTIP liability are recognized in the statement of comprehensive income.
For the LTIP generated from the Company’s investment income in THP1 US, as the deferred shares vest equally on the anniversary dates following the grant date over a five-year period, the compensation expenses are recognized over a six-year period on a graded vesting basis.
Directors’ feesOne-half of each independent Director’s base annual retainer is paid in DSUs which vest on the third anniversary of the grant date. In addition, an indepen-dent Director may elect each year to receive a portion of the balance of his or her fees (including his or her base annual retainer, any additional retainer, and meeting attendance fees) in DSUs, which DSUs vest immediately upon grant. Any remaining balance of such fees not payable in DSUs is paid in cash. The DSUs granted to Directors are governed by the Deferred Share Unit Plan.
Prior to 2014, independent Directors had the option of receiving a portion of their annual retainer and other fees in “notional units”. The terms of such notional units, which were issuable only to independent Directors, are equivalent to the DSUs except that: (i) the notional units vest only when a holder ceases to act as a Director of, or otherwise be employed by, the Company, and (ii) the notional units may only be redeemed for cash.
Reportable segmentsTricon is comprised of five reportable segments, Private Funds and Advisory (“PF&A”), and Principal Investing in Tricon Housing Partners (“THP”), Tricon American Homes (“TAH”), Tricon Lifestyle Communities (“TLC”), and Tricon Luxury Residences (“TLR”). The reportable segments are business units offering different products and services, and are managed separately due to their distinct investment natures. These five reportable segments have been determined by the Company’s chief operating decision makers (Note 18).
Accounting standards adopted in the current yearIAS 1, Presentation of Financial Statements, was amended in December 2014 to clarify guidance on materiality and aggregation, the presentation of subto-tals, the structure of financial statements and the disclosure of accounting policies. The amendment was adopted on January 1, 2016, without a significant impact on Tricon’s balance sheets or statements of comprehensive income.
Accounting standards and interpretations issued but not yet adoptedIFRS 9, Financial Instruments (“IFRS 9”), was issued in November 2009 and addresses classification and measurement of financial assets. It replaces the multiple category and measurement models in International Accounting Standard (“IAS”) 39 for debt instruments with a new mixed measurement model having only two categories: amortized cost and fair value through profit or loss. IFRS 9 also replaces the models for measuring equity instruments. Such instruments are either recognized at fair value through profit or loss or at fair value through other comprehensive income (“OCI”). Where equity instruments are measured at fair value through OCI, dividends are recognized in profit or loss to the extent that they do not clearly represent a return of investment; however, other gains and losses (including impairments) associated with such instruments remain in accumulated OCI indefinitely.
Requirements for financial liabilities were added to IFRS 9 in October 2010 and they largely carried forward existing requirements in IAS 39, Financial Instru-ment: Recognition and Measurement (“IAS 39”), except that fair value changes due to credit risk for liabilities designated at fair value through profit or loss are generally recorded in OCI.
IFRS 9 was amended in November 2013 to (i) include guidance on hedge accounting, and (ii) allow entities to early adopt the requirement to recognize changes in fair value attributable to changes in an entity’s own credit risk, from financial liabilities designated under the fair value option, in OCI (without having to adopt the remainder of IFRS 9). IFRS 9 will be effective January 1, 2018.
On May 28, 2014, the IASB issued the final revenue standard, IFRS 15 Revenue from Contracts with Customers, which will replace IAS 11 Construction Contracts, IAS 18 Revenue, IFRIC 13 Customer Loyalty Programmes, IFRIC 15 Agreements for the Construction of Real Estate, IFRIC 18 Transfer of Assets from Customers, and SIC 31 Revenue – Barter Transactions Involving Advertising Services. Amendments to IFRS 15 were issued in April 2016 to clarify the guidance on identifying performance obligations, licenses of intellectual property and principal versus agent, and to provide additional practical expedients on transition. These amendments are effective for fiscal years beginning on or after January 1, 2018, and interim periods within that year.
14 Tricon Capital Group Annual Report 2016
NOTES TO THE CONSOLIDATED FINANCIAL STATEMENTSfor the year ended December 31, 2016 (in thousands of U.S. dollars, except per share amounts and percentage amounts)
On January 13, 2016, the IASB issued IFRS 16, Leases, which will replace IAS 17, Leases. IFRS 16, “Leases” (“IFRS 16”), sets out the principles for the recogni-tion, measurement and disclosure of leases. IFRS 16 provides revised guidance on identifying a lease and for separating lease and non-lease components of a contract. IFRS 16 introduces a single accounting model for all lessees and requires a lessee to recognize right-of-use assets and lease liabilities for leases with terms of more than 12 months, unless the underlying asset is of low value. Under IFRS 16 lessor accounting for operating and finance leases will remain substantially unchanged. IFRS 16 is effective for annual periods beginning on or after January 1, 2019, with earlier application permitted for entities that apply IFRS 15.
IAS 12 was amended to clarify the requirements for recognizing deferred income tax assets on unrealized losses, deferred income taxes where an asset is measured at fair value below the asset’s tax base, and certain other aspects of accounting for deferred income tax assets. The amendments are effective on or after January 1, 2017.
In January 2016, the IASB issued an amendment to IAS 7 introducing an additional disclosure that will enable users of financial statements to evaluate changes in liabilities arising from financing activities. The amendment is part of the IASB’s Disclosure Initiative, which continues to explore how financial statement disclosure can be improved. The amendment is effective from January 1, 2017 and earlier application is permitted.
In June 2016, the IASB issued an amendment to IFRS 2, Share-based payments, addressing (i) certain issues to the accounting for cash settled awards, and (ii) the accounting for equity settled awards that include a “net settlement” feature in respect of employee withholding taxes. This amendment is effective for annual periods beginning on or after January 1, 2019.
There are no other standards, interpretations or amendments to existing standards that are not yet effective that are expected to have a material impact on the Company. The Company is currently reviewing new standards to assess the impact they may have upon adoption.
3. Critical accounting estimates and judgmentsThe Company makes estimates and assumptions concerning the future. The resulting accounting estimates will, by definition, seldom equal the related actual results. The estimates and judgments applied that have a significant risk of causing material adjustments to the carrying amounts of assets and lia-bilities within the next financial year are outlined below. Actual results could differ from these estimates and the differences may be material.
Income taxes The determination of the Company’s income and other tax liabilities requires interpretation of complex laws and regulations often involving multiple juris-dictions. Significant estimates are required in determining the Company’s consolidated income tax provision. There are many transactions and calculations for which the ultimate tax determination is uncertain. The Company recognizes liabilities for anticipated tax audit issues based on estimates of whether additional taxes will be due. Where the final tax outcome of these matters is different from the amounts that were initially recorded, such differences will impact the current tax and deferred tax provisions. Furthermore, deferred income tax balances are recorded using enacted or substantively enacted future income tax rates. Changes in enacted income tax rates are not within the control of management. However, any such changes in income tax rates may result in actual income tax amounts that may differ significantly from estimates recorded in deferred tax balances.
Judgment is also required in determining whether deferred income tax assets should be recognized on the consolidated balance sheets. Deferred income tax assets are recognized to the extent that the Company believes it is probable that the assets can be recovered when future taxable profit will be available against which the temporary differences can be utilized. The Company assesses deferred income tax liabilities on its investments in TAH, TLC and TLR based on a reduction of its investment as opposed to a sale of underlying assets held by the investment.
Fair value and impairment of financial instrumentsCertain financial instruments are recorded in the Company’s consolidated balance sheet at values that are representative of or approximate fair value. The fair value of a financial instrument that is traded in active markets is determined at each reporting date by reference to its quoted market price or dealer price quotations.
The fair values of the Company’s investments in Tricon Housing Partners, Tricon American Homes, Tricon Lifestyle Communities and Tricon Luxury Resi-dences are determined using the valuation methodologies described in Note 6. By their nature, these valuation techniques require the use of assumptions that are mainly based on market conditions existing at the end of each reporting period. Changes in the underlying assumptions could materially impact the determination of the fair value of a financial instrument. Imprecision in determining fair value using valuation techniques may affect the investment income recognized in a particular period.
Fair value of incentive plansManagement is required to make certain assumptions and to estimate future financial performance to estimate the fair value of incentive plans at each consolidated balance sheet date. Significant estimates and assumptions relating to such incentive plans are disclosed in notes 2 and 17. The long-term incentive plan (LTIP) requires management to estimate future non-IFRS earnings measures, namely future performance fees relative to each fund or sepa-rate account. Future non-IFRS measures are estimated based on current projections, updated at least annually, taking into account actual performance since the inception.

Tricon Capital Group Annual Report 2016 15
NOTES TO THE CONSOLIDATED FINANCIAL STATEMENTSfor the year ended December 31, 2016 (in thousands of U.S. dollars, except per share amounts and percentage amounts)
Determination of investment entity In accordance with IFRS 10, an investment entity is an entity that “obtains funds from one or more investors for the purpose of providing them with invest-ment management services, commits to its investors that its business purpose is to invest funds solely for returns from capital appreciation, investment income (including rental income), or both, and measures and evaluates the performance of substantially all of its investments on a fair value basis.” In addi-tion, IFRS 10 clarifies that an investment entity may earn fee income from the provision of investment-related services to external parties.
4. Prepaid expenses and deposits
(in thousands of U.S. dollars) December 31, 2016 December 31, 2015
Deposits for office building $ 2,155 $ 1,626
Deposits for investments – 436
Other prepaid expenses and deposits 444 480
Total prepaid expenses and deposits $ 2,599 $ 2,542
5. Investments Investments – Tricon Housing Partners (“THP”) are land and homebuilding investments or co-investments in funds, separate accounts and side-car invest-ments managed by the Company.
Investments – Tricon American Homes (“TAH”) are investments in operating entities which invest in U.S. single-family rental homes. The investments are managed through an integrated business platform managed by the operating entity, which is responsible for the acquisition, renovation and leasing of the homes.
Investments – Tricon Lifestyle Communities (“TLC”) are investments in U.S. manufactured housing communities that lease land to owners of prefabri-cated homes.
Investments – Tricon Luxury Residences (“TLR”) are investments in Canadian and U.S. Class A multi-family rental developments.
The Company makes these investments via equity investments and loan advances. Advances to investments are added to the carrying value when paid; distributions from investments are deducted from the carrying value when received. The following is a summary of the composition of the Company’s investments:
December 31, 2016 December 31, 2015
(in thousands of U.S. dollars)Internal debt instruments Equity
Total investment
Internal debt instruments Equity
Total investment
Investments – THP
U.S. commingled funds $ – $ 137,004 $ 137,004 $ – $ 233,547 $ 233,547
Canadian commingled funds – 9,537 9,537 – 8,340 8,340
Separate accounts and side-cars 21,101 134,145 155,246 18,000 43,895 61,895
21,101 280,686 301,787 18,000 285,782 303,782
Investments – TAH – 479,938 479,938 – 426,030 426,030
Investments – TLC – 52,591 52,591 – 19,153 19,153
Investments – TLR – 62,410 62,410 – 19,582 19,582
Total $ 21,101 $ 875,625 $ 896,726 $ 18,000 $ 750,547 $ 768,547
The underlying loan instruments within the Company’s Tricon Housing Partners investments, if utilized, are denominated in U.S. dollars and bear interest at rates between 9.95% and 11.95%, compounded monthly.
Each investment vertical may utilize debt in order to finance normal business operations, with the debt secured by the underlying assets of the related investment. The Company has provided specific guarantees to the lenders of the TAH warehouse facility, the TLC mortgages and the TLR land and construc-tion loans, on a non-recourse basis subject only to specific carved-out events in the case of the TAH and TLC guarantees. During the year the Company entered into a financial guarantee contract in the amount of $25,900 (C$34,800) with Canadian Imperial Bank of Commerce for the provision of a financial guarantee in respect of a construction loan held by 592 Sherbourne GP Inc. The construction loan matures on January 7, 2019 with two one-year extensions. This guarantee contract is initially measured at fair value and subsequently recorded as a contingent liability until such time as it becomes probable that the guarantor will be required to make payments under the guarantee provision.
16 Tricon Capital Group Annual Report 2016
NOTES TO THE CONSOLIDATED FINANCIAL STATEMENTSfor the year ended December 31, 2016 (in thousands of U.S. dollars, except per share amounts and percentage amounts)
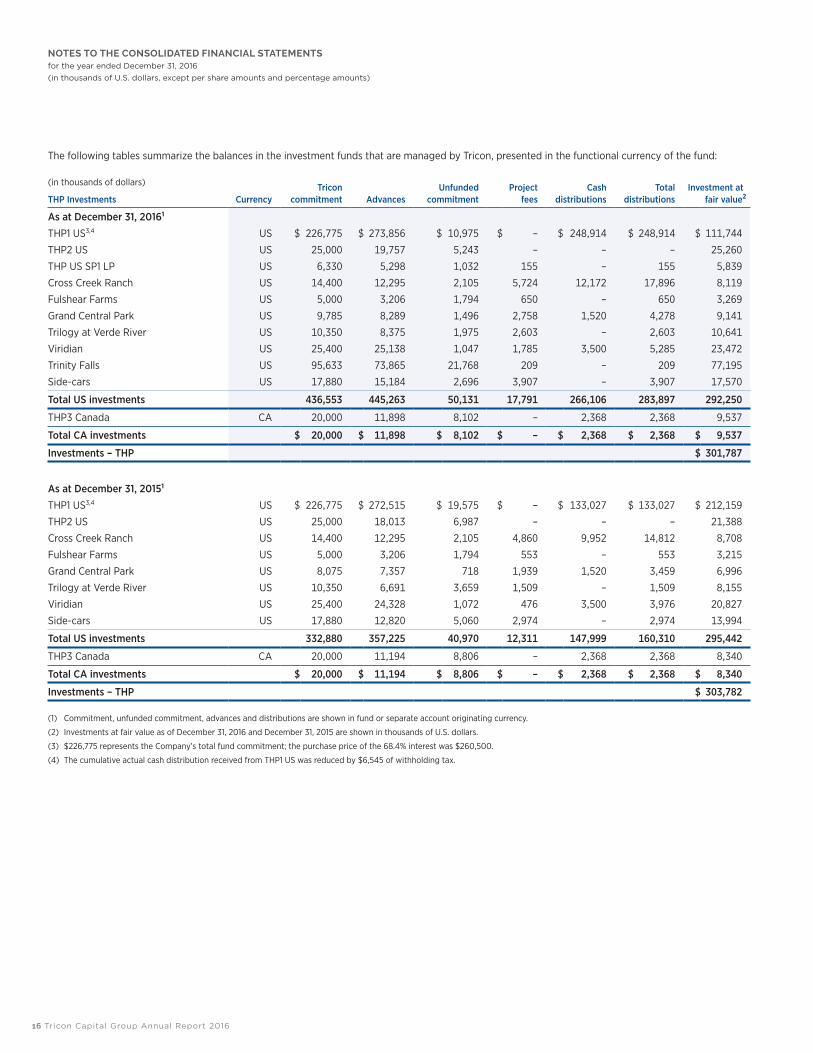
The following tables summarize the balances in the investment funds that are managed by Tricon, presented in the functional currency of the fund:
(in thousands of dollars)
THP Investments CurrencyTricon
commitment AdvancesUnfunded
commitmentProject
feesCash
distributionsTotal
distributionsInvestment at
fair value2
As at December 31, 20161
THP1 US3,4 US $ 226,775 $ 273,856 $ 10,975 $ – $ 248,914 $ 248,914 $ 111,744
THP2 US US 25,000 19,757 5,243 – – – 25,260
THP US SP1 LP US 6,330 5,298 1,032 155 – 155 5,839
Cross Creek Ranch US 14,400 12,295 2,105 5,724 12,172 17,896 8,119
Fulshear Farms US 5,000 3,206 1,794 650 – 650 3,269
Grand Central Park US 9,785 8,289 1,496 2,758 1,520 4,278 9,141
Trilogy at Verde River US 10,350 8,375 1,975 2,603 – 2,603 10,641
Viridian US 25,400 25,138 1,047 1,785 3,500 5,285 23,472
Trinity Falls US 95,633 73,865 21,768 209 – 209 77,195
Side-cars US 17,880 15,184 2,696 3,907 – 3,907 17,570
Total US investments 436,553 445,263 50,131 17,791 266,106 283,897 292,250
THP3 Canada CA 20,000 11,898 8,102 – 2,368 2,368 9,537
Total CA investments $ 20,000 $ 11,898 $ 8,102 $ – $ 2,368 $ 2,368 $ 9,537
Investments – THP $ 301,787
As at December 31, 20151
THP1 US3,4 US $ 226,775 $ 272,515 $ 19,575 $ – $ 133,027 $ 133,027 $ 212,159
THP2 US US 25,000 18,013 6,987 – – – 21,388
Cross Creek Ranch US 14,400 12,295 2,105 4,860 9,952 14,812 8,708
Fulshear Farms US 5,000 3,206 1,794 553 – 553 3,215
Grand Central Park US 8,075 7,357 718 1,939 1,520 3,459 6,996
Trilogy at Verde River US 10,350 6,691 3,659 1,509 – 1,509 8,155
Viridian US 25,400 24,328 1,072 476 3,500 3,976 20,827
Side-cars US 17,880 12,820 5,060 2,974 – 2,974 13,994
Total US investments 332,880 357,225 40,970 12,311 147,999 160,310 295,442
THP3 Canada CA 20,000 11,194 8,806 – 2,368 2,368 8,340
Total CA investments $ 20,000 $ 11,194 $ 8,806 $ – $ 2,368 $ 2,368 $ 8,340
Investments – THP $ 303,782
(1) Commitment, unfunded commitment, advances and distributions are shown in fund or separate account originating currency.
(2) Investments at fair value as of December 31, 2016 and December 31, 2015 are shown in thousands of U.S. dollars.
(3) $226,775 represents the Company’s total fund commitment; the purchase price of the 68.4% interest was $260,500.
(4) The cumulative actual cash distribution received from THP1 US was reduced by $6,545 of withholding tax.

Tricon Capital Group Annual Report 2016 17
NOTES TO THE CONSOLIDATED FINANCIAL STATEMENTSfor the year ended December 31, 2016 (in thousands of U.S. dollars, except per share amounts and percentage amounts)
The controlled subsidiaries which are not consolidated by the Company include:
Name TypePrincipal place of business
Country of incorporation
Ownership interest %
Voting rights %1
Tricon SF Home Rental Inc. Holding Company USA Canada 100% 100%
Tricon American Homes LLC Holding Company USA USA 100% 100%
Turnstone LA LP Limited Partnership USA USA 100% 100%
Greater Phoenix SF Home Rental LP Limited Partnership USA USA 97% 100%
Greater Sacramento SF Home Rental LP Limited Partnership USA USA 100% 100%
McKinley SF Home Rental LP Limited Partnership USA USA 100% 100%
Southeast Florida Rental Housing LP Limited Partnership USA USA 100% 100%
29 McKinley SF Home Rental LP Limited Partnership USA USA 100% 100%
Castle Atlanta LP Limited Partnership USA USA 100% 100%
SFRH Tampa LP Limited Partnership USA USA 100% 100%
TAH Property Holdings LP Limited Partnership USA USA 100% 100%
TAH Securitized RSP LLC Holding Company USA USA 100% 100%
TAH Operations LLC Limited Partnership USA USA 96% 100%
Tricon Housing Partners US LP Limited Partnership USA USA 68% 68%
Tricon Housing Partners US II B LP Limited Partnership USA USA 16% 16%
Tricon Housing Partners Canada III Co-Investment Ltd. Holding Company Canada Canada 100% 100%
Tricon Housing Partners Canada III LP Limited Partnership Canada Canada 10% 10%
Tricon Housing Partners US Syndicated Pool 1 LP Limited Partnership USA USA 20% 50%
Tricon USA Lender Inc. Holding Company USA Canada 100% 100%
Tricon Lender II Inc. Holding Company USA Canada 100% 100%
Castle Atlanta Holding LP Limited Partnership USA USA 100% 100%
CCR Texas Equity LP Limited Partnership USA USA 10% 50%
CCR Texas Holdings LP Limited Partnership USA USA 9% 50%
Vistancia West Equity LP Limited Partnership USA USA 7% 50%
Vistancia West Holdings LP Limited Partnership USA USA 6% 50%
FF Texas Equity LP Limited Partnership USA USA 10% 50%
FF Texas Holdings LP Limited Partnership USA USA 10% 50%
Conroe CS Texas Equity LP Limited Partnership USA USA 10% 50%
Conroe CS Texas Holdings LP Limited Partnership USA USA 10% 50%
Tegavah Equity LP Limited Partnership USA USA 10% 50%
Tegavah Holdings LP Limited Partnership USA USA 9% 50%
Lake Norman Equity LP Limited Partnership USA USA 7% 50%
Lake Norman Holdings LP Limited Partnership USA USA 7% 50%
Arantine Hills Equity LP Limited Partnership USA USA 7% 50%
Arantine Hills Holdings LP Limited Partnership USA USA 7% 50%
Viridian Equity LP Limited Partnership USA USA 18% 50%
Viridian Holdings LP Limited Partnership USA USA 17% 50%
Tricon Manufactured Housing Communities Inc. Holding Company USA Canada 100% 100%
Tricon Manufactured Housing Communities LLC Holding Company USA USA 100% 100%
Tricon/COB MHC LP Limited Partnership USA USA 98% 67%
Tricon Luxury Residences Co-Investment Inc. Holding Company Canada Canada 100% 100%
592 Sherbourne LP Limited Partnership Canada Canada 15% 50%
57 Spadina LP Limited Partnership Canada Canada 20% 50%
Scrivener Square Co-ownership Canada Canada 50% 50%
Summerhill Shops Co-ownership Canada Canada 25% 50%
Tricon SLR US Multifamily LLC Holding Company USA USA 100% 100%
Tricon SLR US Multifamily I LP Limited Partnership USA USA 100% 50%
SLR-TCN McKenzie Project, LP Limited Partnership USA USA 90% 50%
SLR-TCN Canals at Grand Park II Project, LP Limited Partnership USA USA 90% 50%
(1) In respect of major decisions only.
(2) 50% voting rights with respect to certain major decisions and 100% for the balance of the major decisions, as outlined in the limited partnership agreement.
18 Tricon Capital Group Annual Report 2016
NOTES TO THE CONSOLIDATED FINANCIAL STATEMENTSfor the year ended December 31, 2016 (in thousands of U.S. dollars, except per share amounts and percentage amounts)
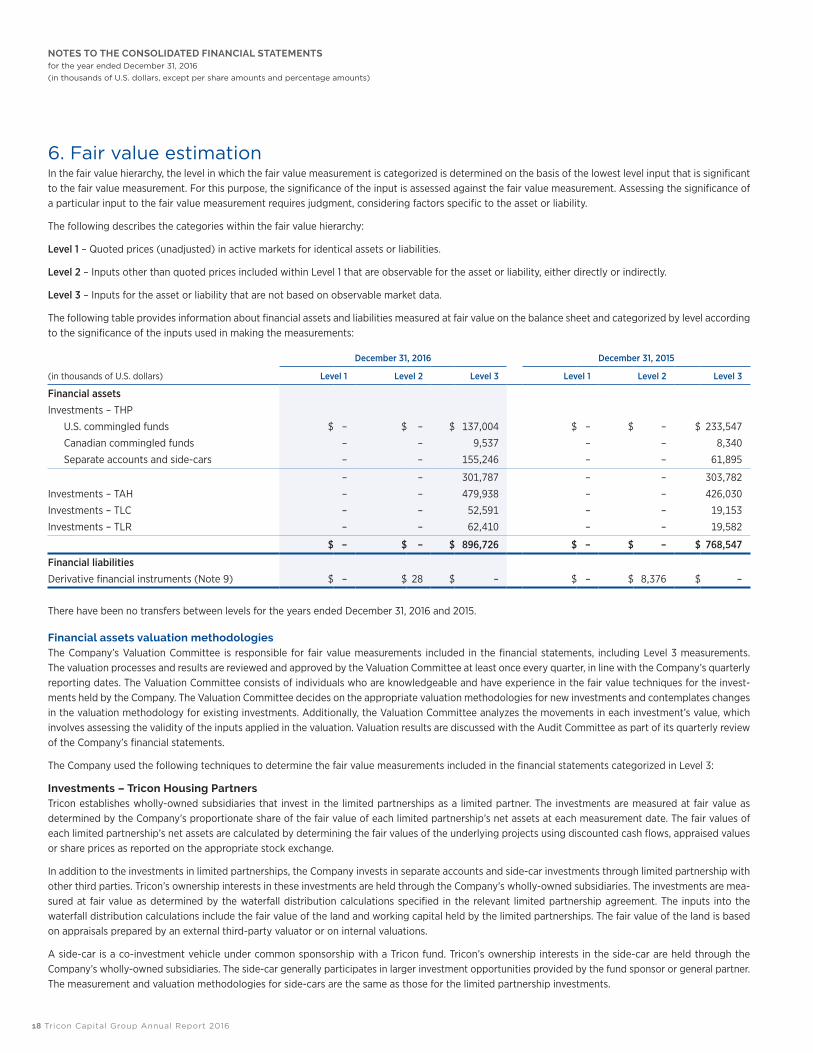
6. Fair value estimationIn the fair value hierarchy, the level in which the fair value measurement is categorized is determined on the basis of the lowest level input that is significant to the fair value measurement. For this purpose, the significance of the input is assessed against the fair value measurement. Assessing the significance of a particular input to the fair value measurement requires judgment, considering factors specific to the asset or liability.
The following describes the categories within the fair value hierarchy:
Level 1 – Quoted prices (unadjusted) in active markets for identical assets or liabilities.
Level 2 – Inputs other than quoted prices included within Level 1 that are observable for the asset or liability, either directly or indirectly.
Level 3 – Inputs for the asset or liability that are not based on observable market data.
The following table provides information about financial assets and liabilities measured at fair value on the balance sheet and categorized by level according to the significance of the inputs used in making the measurements:
December 31, 2016 December 31, 2015
(in thousands of U.S. dollars) Level 1 Level 2 Level 3 Level 1 Level 2 Level 3
Financial assetsInvestments – THP
U.S. commingled funds $ – $ – $ 137,004 $ – $ – $ 233,547
Canadian commingled funds – – 9,537 – – 8,340
Separate accounts and side-cars – – 155,246 – – 61,895
– – 301,787 – – 303,782
Investments – TAH – – 479,938 – – 426,030
Investments – TLC – – 52,591 – – 19,153
Investments – TLR – – 62,410 – – 19,582
$ – $ – $ 896,726 $ – $ – $ 768,547
Financial liabilitiesDerivative financial instruments (Note 9) $ – $ 28 $ – $ – $ 8,376 $ –
There have been no transfers between levels for the years ended December 31, 2016 and 2015.
Financial assets valuation methodologiesThe Company’s Valuation Committee is responsible for fair value measurements included in the financial statements, including Level 3 measurements. The valuation processes and results are reviewed and approved by the Valuation Committee at least once every quarter, in line with the Company’s quarterly reporting dates. The Valuation Committee consists of individuals who are knowledgeable and have experience in the fair value techniques for the invest-ments held by the Company. The Valuation Committee decides on the appropriate valuation methodologies for new investments and contemplates changes in the valuation methodology for existing investments. Additionally, the Valuation Committee analyzes the movements in each investment’s value, which involves assessing the validity of the inputs applied in the valuation. Valuation results are discussed with the Audit Committee as part of its quarterly review of the Company’s financial statements.
The Company used the following techniques to determine the fair value measurements included in the financial statements categorized in Level 3:
Investments – Tricon Housing PartnersTricon establishes wholly-owned subsidiaries that invest in the limited partnerships as a limited partner. The investments are measured at fair value as determined by the Company’s proportionate share of the fair value of each limited partnership’s net assets at each measurement date. The fair values of each limited partnership’s net assets are calculated by determining the fair values of the underlying projects using discounted cash flows, appraised values or share prices as reported on the appropriate stock exchange.
In addition to the investments in limited partnerships, the Company invests in separate accounts and side-car investments through limited partnership with other third parties. Tricon’s ownership interests in these investments are held through the Company’s wholly-owned subsidiaries. The investments are mea-sured at fair value as determined by the waterfall distribution calculations specified in the relevant limited partnership agreement. The inputs into the waterfall distribution calculations include the fair value of the land and working capital held by the limited partnerships. The fair value of the land is based on appraisals prepared by an external third-party valuator or on internal valuations.
A side-car is a co-investment vehicle under common sponsorship with a Tricon fund. Tricon’s ownership interests in the side-car are held through the Company’s wholly-owned subsidiaries. The side-car generally participates in larger investment opportunities provided by the fund sponsor or general partner. The measurement and valuation methodologies for side-cars are the same as those for the limited partnership investments.

Tricon Capital Group Annual Report 2016 19
NOTES TO THE CONSOLIDATED FINANCIAL STATEMENTSfor the year ended December 31, 2016 (in thousands of U.S. dollars, except per share amounts and percentage amounts)
Quantitative information about fair value measurements of the investments uses the following significant unobservable inputs (Level 3):
Description Valuation technique(s)Significant unobservable input
Range of inputs
Weighted average of inputs Other inputs and key information
Debt investments Net asset value, determined using discounted cash flow
a) Discount rate1
b) Future cash flow2
10.0% – 12.0%4 – 5 years
10.70%4.1 years
Estimated probability of default
Equity investments Net asset value, determined using discounted cash flow
a) Discount rate1
b) Future cash flow2
Entitlement risk, sales risk and construction risk are taken into account in determining the discount rate.
U.S. funds: Lower of 20% and the expected return for the project, subsequently adjusted downward as development risk is mitigated over project life.
Canadian funds: Discounted at contractual interest rate; may include contingent inter-est cash flows (received when developers’ project returns exceed the underlying contractual interest) which is discounted using the same method as U.S. funds.
Commingled funds
THP1 US 12.5% – 20.0%1 – 4 years
14.60% 2.8 years
THP2 US 12.5% – 20.0%1 – 7 years
16.10% 2.0 years
THP3 Canada 8.0% – 18.0%3 – 8 years
10.80% 3.5 years
Separate accounts and side-cars
Waterfall distribution model
a) Discount rate1
b) Future cash flow2
c) Appraised value3
17.0% – 25.0%2 – 21 years
N/A3
13.5 yearsEntitlement risk, sales risk and construction risk are taken into account in determining the discount rate.
Price per acre of land, timing of project funding requirements and distributions.
(1) Generally, an increase in future cash flow will result in an increase in the fair value of debt instruments and fund equity investments. An increase in the discount rate will result in a decrease in the fair value of debt instruments and fund equity investments. The same percentage change in the discount rate will result in a greater change in fair value than the same absolute percentage change in future cash flow.
(2) Estimating future cash flows involves modelling developers’ cash flows to determine the quantum and timing of project funding requirements and cash distributions to the investment vehicle. Estimates of developers’ cash flows are based on detailed quarterly and annual budgets and include estimates of construction and development costs, anticipated selling prices and absorption ratios for each project.
(3) The Company obtained external valuations for eight separate account equity and side-car investments at December 31, 2016, totaling $51,112. The Company’s investment team and finance team verify all major inputs to the valuation and review the results with the independent appraiser. The significant input within the appraised value is the value of land per acre.
SensitivityThe effects on the fair value of Investments – Tricon Housing Partners of a 1% change in the discount rates are as follows:
December 31, 2016 december 31, 2015
(in thousands of dollars) Currency 1% increase 1% decrease 1% increase 1% decrease
U.S. commingled funds US $ (1,342) $ 1,377 $ (1,437) $ 1,470
Canadian commingled funds CA (258) 269 (264) 274
Separate accounts and side-cars US (1,673) 1,724 (424) 435
Investments – Tricon American HomesAll of the Company’s investments in TAH limited partnerships are held through a wholly-owned subsidiary, Tricon SF Home Rental Inc., and are recorded at fair value. The fair value of the Company’s investment in Tricon SF Home Rental Inc. is calculated based on Tricon’s proportionate share of each entity’s fair value of the net assets. The fair value of the net assets of the various entities is based on a sum-of-the-parts approach, where assets and liabilities are measured at fair value individually.
Home values typically do not change materially in the short term, and capital expenditures generally do not significantly impact values in the first three months after purchase. As a result, homes acquired in the fourth quarter are recorded at their purchase price plus the cost of capital expenditures, if appli-cable. Homes acquired prior to October 1, 2016 were valued at November 30, 2016. Management has assessed the impact of any market changes that have occurred subsequent to the date of valuation and has determined that values were valid at December 31, 2016.
20 Tricon Capital Group Annual Report 2016
NOTES TO THE CONSOLIDATED FINANCIAL STATEMENTSfor the year ended December 31, 2016 (in thousands of U.S. dollars, except per share amounts and percentage amounts)
During the year, the Broker Price Opinion (“BPO”) valuation methodology was used to determine the fair value of 4,634 (or 60%) of TAH’s rental properties. The homes were valued by independent brokers who hold active real estate licences and have market experience in the locations and segments of the homes valued. The brokers value each home based on recent comparable sales and active comparable listings in the area, assuming the homes were all renovated to an average standard in their respective areas. The BPO retrieves information on the comparable properties from the Multiple Listing Service (“MLS”) public database.
The remainder of the rental properties, including those previously valued by BPO, had their values updated using the Home Price Indexes (“HPI”) method-ology. The HPI is calculated based on a repeat-sales model using large real estate information databases compiled from public records. Twelve-month trailing HPI was used where the quarterly HPI change was determined by averaging the index movement over the past twelve months. The quarterly HPI change is then applied to the previously recorded fair value of the investment properties. The data used to fair value the rental properties is specific to the zip code in which the property is located.
In addition to the investment properties generating rental income, a small percentage of the investment properties are held for resale. These inventory properties were originally purchased as rental properties but subsequently selected for sale through the investee’s active asset management process. All inventory homes are valued at the lower of carrying amount and fair value less cost to sell.
The Company also takes into account the carried interest payable to local operating partners as general partners of some of the underlying limited partner-ships in determining the fair value of its investment. The fair value of external debt is based on a discounted cash flow model at a market rate of interest that the limited partnerships would have obtained for similar financing. Deferred income taxes are based on the enacted tax rates for future years, with fair values determined by discounting to the reporting period. Working capital of the limited partnerships approximates fair value.
Securitization transactions TAH is indebted in the amount of $351,000 under its first securitization loan, TAH 2015-1. The securitization transaction involved the issuance and sale of single-family rental pass-through certificates that represent beneficial ownership interests in a loan secured by a portion of the Company’s portfolio of single-family properties. Monthly payments of interest commenced on June 9, 2015. All outstanding principal and interest shall be paid in full prior to matu-rity on May 9, 2017, with three one-year extensions available at the Company’s option.
On October 25, 2016, TAH closed its second securitization transaction, TAH 2016-1, which involved the issuance and sale of six classes of fixed-rate pass-through certificates, with a weighted average interest rate of 3.59% and a five-year term to maturity, which represents beneficial ownership interests in a loan secured by 3,439 of TAH’s single-family rental properties. TAH received gross transaction proceeds of approximately $363,000, which represents approximately 72% of the value of the securitized portfolio and approximately 80% of its all-in cost. Proceeds were used to repay TAH’s warehouse credit facility (which, following the transaction had an outstanding balance of approximately $59,000) and approximately $60,000 of equity was repatriated to Tricon from the net transaction proceeds.
Acquisition of minority interestsWhen TAH was launched in 2012, it entered into a series of five-year limited partnerships with local operating partners in each of its target markets. Upon internalization of TAH’s property management operations in early 2015, the real estate limited partnerships were left in place and the operating partners obtained a minority interest in the internalized TAH property management entity (“TAH OpCo”). Since then, the local operating partners have owned an approximate 10% interest in TAH’s consolidated real estate holdings and a 45% interest in TAH OpCo.
In the fourth quarter, TAH completed the acquisition of approximately 95% of the minority interests in its real estate holdings and property management entity. The purchase price for 100% of the minority interest is $71.5 million, including a $9.3 million premium attributable to the buyout of the property management interests, and is payable in cash over the twelve months following closing. As of December 31, 2016 the Company contributed $8,800 to TAH in relation to the buyout.
SensitivityThe TAH debt facility is subject to variable rates based on the one-month LIBOR plus 300 basis points, subject to a 25 basis point LIBOR floor (prior to the amendment in 2015, the rate was three-month LIBOR plus 360 basis points, subject to a 50 basis point LIBOR floor). As of December 31, 2016, the rental partnerships and the Company as its sponsor are in compliance with the financial covenants and other undertakings outlined in the loan agreement. The one-month LIBOR during 2016 ranged from 0.43% to 0.63%. If interest rates had been 50 basis points lower, with all other variables held constant, investment income in TAH for 2016 would have been $353 (2015 – $0) higher. At December 31, 2016, if interest rates had been 50 basis points higher, with all other variables held constant, investment income in TAH for 2016 would have been $760 (2015 – $483) lower. Investment income is more sensitive to interest rate increases than decreases because of the interest rate floor on borrowings. The calculated impact of a 50 basis point increase is higher in 2016 than in 2015 because of the decrease in the interest rate floor from 0.50% on the three-month LIBOR to 0.25% on the one-month LIBOR effective with the June 12, 2015 amendment.
Tricon Capital Group Annual Report 2016 21
NOTES TO THE CONSOLIDATED FINANCIAL STATEMENTSfor the year ended December 31, 2016 (in thousands of U.S. dollars, except per share amounts and percentage amounts)
As of December 31, 2016, the securitization borrower, TAH 2015-1 Borrower LLC, is in compliance with the covenants and other undertakings outlined in the loan agreement. Interest-only payments are required on the securitization loan at a weighted average interest rate of one-month LIBOR plus 1.96% per annum, subject to a 3.955% cap on the LIBOR rate. The one-month LIBOR during 2016 ranged from 0.43% to 0.63%. If interest rates had been 50 basis points higher or lower, with all other variables held constant, investment income in TAH for 2016 would have been $1,780 lower or higher (2015 – $1,053). As of December 31, 2016, the securitization borrower, TAH 2016-1 Borrower LLC, is also in compliance with the covenants and other undertakings outlined in the loan agreement. The interest payments are not sensitive to changes in interest rate because the interest rate on the loan is fixed.
If the prices of single-family rental homes held by the TAH limited partnerships were to increase or decrease by 1% (December 31, 2015 – 1%), the impact on investments in TAH fair value at December 31, 2016 would be $12,099 and ($12,099), respectively (December 31, 2015 – $9,705 and ($9,705)).
The weighted average of the quarterly HPI change was 2.23%. If the change in the quarterly HPI increased or decreased by 0.5%, the impact on investments in TAH fair value at December 31, 2016 would be $5,614 and ($5,614), respectively (December 31, 2015 – $3,800 and ($3,800)).
Investments – Tricon Lifestyle CommunitiesThe Company’s investment in Tricon Lifestyle Communities (“TLC”) is held through a wholly-owned subsidiary, Tricon Manufactured Housing Communities LLC, which carries the investment at fair value. The fair value of the Company’s investment is estimated based on the Company’s proportionate share of the net assets of the TLC limited partnership. The fair value of the net assets is based on a sum-of-the-parts approach, where assets and liabilities are measured at fair value individually.
Since all variables impacting fair value of the investment property, such as rental growth, expense inflation and the impact of future capital expenditures, generally do not change significantly in the first 12 months after acquisition, investments are recorded at cost for the first 12 months after acquisition. As a result, these properties are recorded at their purchase price plus the cost of capital expenditures. Key variables are monitored on a quarterly basis to deter-mine if there may be a material change in fair value.
The Company fair values the TLC properties using a discounted cash flow methodology. The fair value is determined based on rental income from the current leases and assumptions about rental income from future leases, such as increases in rental rates and occupancy, less future cash outflows in respect of such leases and capital expenditures. Other factors included in the future cash flow estimate are the terminal value of the underlying property based on reliable estimates of the terminal year net operating income (“NOI”), supported by the terms of existing leases and assumptions of future leases, and market capital-ization rates of comparable precedent transactions within each market.
The Company also takes into account the carried interest payable to the general partner of the underlying limited partnership in determining the fair value of its investment. The carried interest amounts are based on waterfall distribution calculations specified in the limited partnership agreement and may result in the payment of a performance fee to the general partner once limited partners receive their capital and preferred return. The fair value of external debt is based on a discounted cash flow model at a market rate that the limited partnership would have obtained for similar financing. Deferred income taxes are based on the enacted tax rates for future years. Working capital of the limited partnership approximates fair value.
SensitivitySince the rate of interest on borrowings incurred by Tricon Lifestyle Communities is fixed, Investment income – Tricon Lifestyle Communities for the period would not change due to interest rate fluctuations.
TLC’s fair value measurements of its investments are based on significant unobservable inputs including discount rates and future cash flows. At Decem- ber 31, 2016, an increase of 1% in the discount rate results in a decrease in fair value of ($3,557), and a decrease of 1% in the discount rate results in an increase in fair value of $2,475.
Investments – Tricon Luxury ResidencesThe Company’s investment in TLR Canada is held through a wholly-owned subsidiary, Tricon Luxury Residences Co-Investment Inc. Its investment in TLR U.S. is held through a wholly-owned subsidiary, Tricon SLR US Multifamily LLC. Both subsidiaries carry their investments at fair value. The fair values of the investments in TLR are estimated based on the subsidiaries’ proportionate share of the net assets of TLR limited partnerships. The fair value of the net assets is based on a sum-of-the-parts approach, where assets and liabilities are measured at fair value individually.
TLR Canada fair values its properties based on an external appraisal performed annually as of November 30 of each year. The fair value is determined based on active market prices (including, but not limited to, dollar value per square foot), adjusted (if necessary) for differences in the nature, location or condition of the asset, as well as assumptions about the recoverability of development costs. Management has assessed whether any significant market changes have occurred subsequent to the date of prior valuation and has determined that the value remained unchanged at December 31, 2016.
TLR U.S. fair values its properties using a discounted cash flow methodology. The fair value is determined based on assumptions about rental income from future leases, such as increases in rental rates and occupancy, less future cash outflows in respect of such leases and capital expenditures. Other factors included in the future cash flow estimate are the terminal value of the underlying property based on reliable estimates of the terminal year net operating income (“NOI”), supported by the assumptions of future leases, and market capitalization rates of comparable precedent transactions within each market.
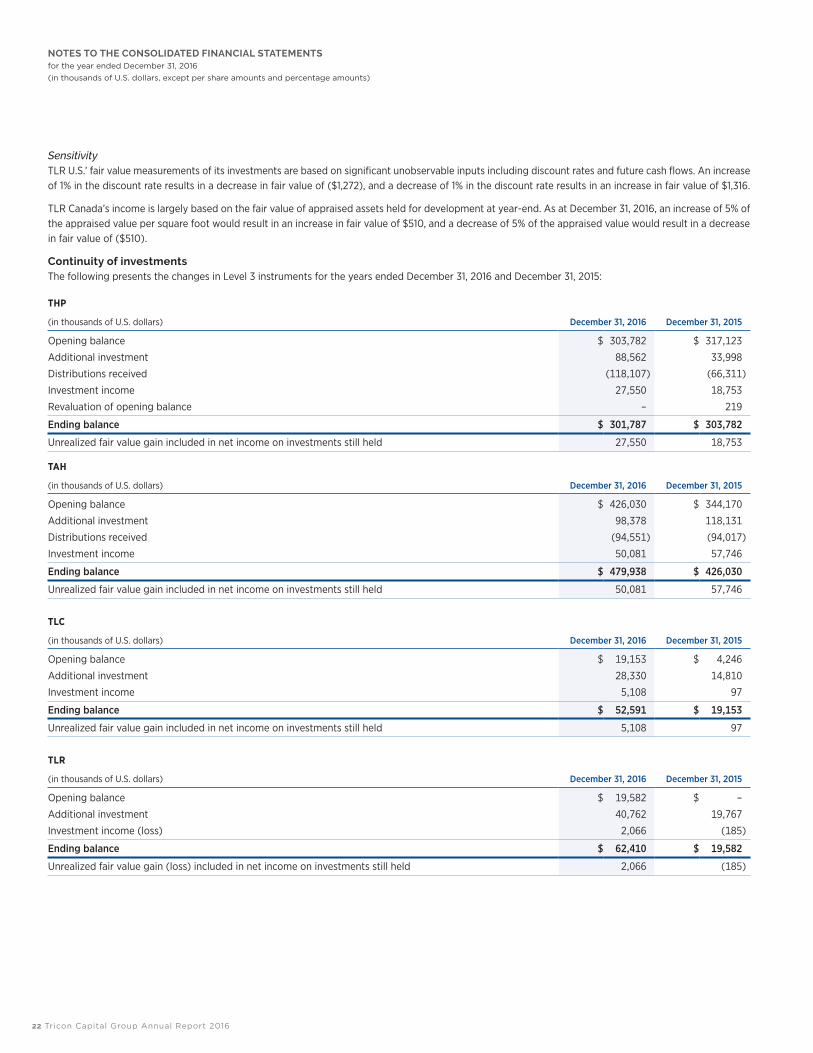
22 Tricon Capital Group Annual Report 2016
NOTES TO THE CONSOLIDATED FINANCIAL STATEMENTSfor the year ended December 31, 2016 (in thousands of U.S. dollars, except per share amounts and percentage amounts)
SensitivityTLR U.S.’ fair value measurements of its investments are based on significant unobservable inputs including discount rates and future cash flows. An increase of 1% in the discount rate results in a decrease in fair value of ($1,272), and a decrease of 1% in the discount rate results in an increase in fair value of $1,316.
TLR Canada’s income is largely based on the fair value of appraised assets held for development at year-end. As at December 31, 2016, an increase of 5% of the appraised value per square foot would result in an increase in fair value of $510, and a decrease of 5% of the appraised value would result in a decrease in fair value of ($510).
Continuity of investmentsThe following presents the changes in Level 3 instruments for the years ended December 31, 2016 and December 31, 2015:
THP
(in thousands of U.S. dollars) December 31, 2016 December 31, 2015
Opening balance $ 303,782 $ 317,123
Additional investment 88,562 33,998
Distributions received (118,107) (66,311)
Investment income 27,550 18,753
Revaluation of opening balance – 219
Ending balance $ 301,787 $ 303,782
Unrealized fair value gain included in net income on investments still held 27,550 18,753
TAH
(in thousands of U.S. dollars) December 31, 2016 December 31, 2015
Opening balance $ 426,030 $ 344,170
Additional investment 98,378 118,131
Distributions received (94,551) (94,017)
Investment income 50,081 57,746
Ending balance $ 479,938 $ 426,030
Unrealized fair value gain included in net income on investments still held 50,081 57,746
TLC
(in thousands of U.S. dollars) December 31, 2016 December 31, 2015
Opening balance $ 19,153 $ 4,246
Additional investment 28,330 14,810
Investment income 5,108 97
Ending balance $ 52,591 $ 19,153
Unrealized fair value gain included in net income on investments still held 5,108 97
TLR
(in thousands of U.S. dollars) December 31, 2016 December 31, 2015
Opening balance $ 19,582 $ –
Additional investment 40,762 19,767
Investment income (loss) 2,066 (185)
Ending balance $ 62,410 $ 19,582
Unrealized fair value gain (loss) included in net income on investments still held 2,066 (185)
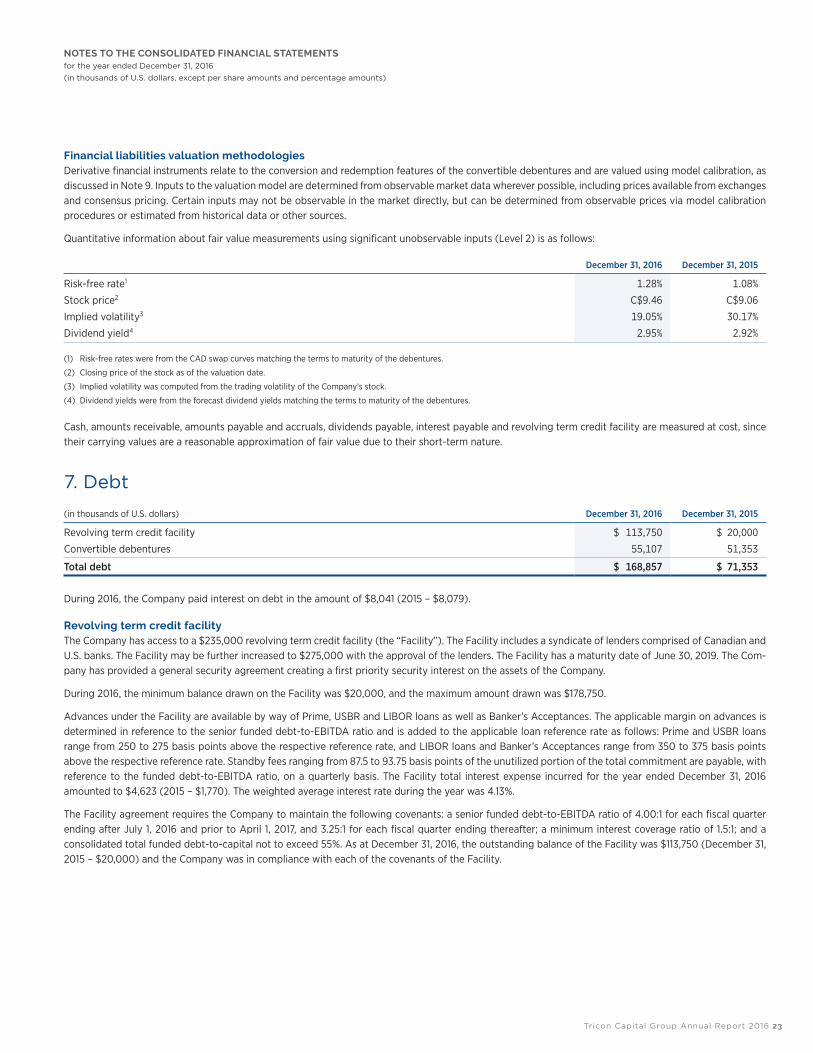
Tricon Capital Group Annual Report 2016 23
NOTES TO THE CONSOLIDATED FINANCIAL STATEMENTSfor the year ended December 31, 2016 (in thousands of U.S. dollars, except per share amounts and percentage amounts)
Financial liabilities valuation methodologiesDerivative financial instruments relate to the conversion and redemption features of the convertible debentures and are valued using model calibration, as discussed in Note 9. Inputs to the valuation model are determined from observable market data wherever possible, including prices available from exchanges and consensus pricing. Certain inputs may not be observable in the market directly, but can be determined from observable prices via model calibration procedures or estimated from historical data or other sources.
Quantitative information about fair value measurements using significant unobservable inputs (Level 2) is as follows:
December 31, 2016 December 31, 2015
Risk-free rate1 1.28% 1.08%
Stock price2 C$9.46 C$9.06
Implied volatility3 19.05% 30.17%
Dividend yield4 2.95% 2.92%
(1) Risk-free rates were from the CAD swap curves matching the terms to maturity of the debentures.
(2) Closing price of the stock as of the valuation date.
(3) Implied volatility was computed from the trading volatility of the Company’s stock.
(4) Dividend yields were from the forecast dividend yields matching the terms to maturity of the debentures.
Cash, amounts receivable, amounts payable and accruals, dividends payable, interest payable and revolving term credit facility are measured at cost, since their carrying values are a reasonable approximation of fair value due to their short-term nature.
7. Debt(in thousands of U.S. dollars) December 31, 2016 December 31, 2015
Revolving term credit facility $ 113,750 $ 20,000
Convertible debentures 55,107 51,353
Total debt $ 168,857 $ 71,353
During 2016, the Company paid interest on debt in the amount of $8,041 (2015 – $8,079).
Revolving term credit facilityThe Company has access to a $235,000 revolving term credit facility (the “Facility”). The Facility includes a syndicate of lenders comprised of Canadian and U.S. banks. The Facility may be further increased to $275,000 with the approval of the lenders. The Facility has a maturity date of June 30, 2019. The Com-pany has provided a general security agreement creating a first priority security interest on the assets of the Company.
During 2016, the minimum balance drawn on the Facility was $20,000, and the maximum amount drawn was $178,750.
Advances under the Facility are available by way of Prime, USBR and LIBOR loans as well as Banker’s Acceptances. The applicable margin on advances is determined in reference to the senior funded debt-to-EBITDA ratio and is added to the applicable loan reference rate as follows: Prime and USBR loans range from 250 to 275 basis points above the respective reference rate, and LIBOR loans and Banker’s Acceptances range from 350 to 375 basis points above the respective reference rate. Standby fees ranging from 87.5 to 93.75 basis points of the unutilized portion of the total commitment are payable, with reference to the funded debt-to-EBITDA ratio, on a quarterly basis. The Facility total interest expense incurred for the year ended December 31, 2016 amounted to $4,623 (2015 – $1,770). The weighted average interest rate during the year was 4.13%.
The Facility agreement requires the Company to maintain the following covenants: a senior funded debt-to-EBITDA ratio of 4.00:1 for each fiscal quarter ending after July 1, 2016 and prior to April 1, 2017, and 3.25:1 for each fiscal quarter ending thereafter; a minimum interest coverage ratio of 1.5:1; and a consolidated total funded debt-to-capital not to exceed 55%. As at December 31, 2016, the outstanding balance of the Facility was $113,750 (December 31, 2015 – $20,000) and the Company was in compliance with each of the covenants of the Facility.
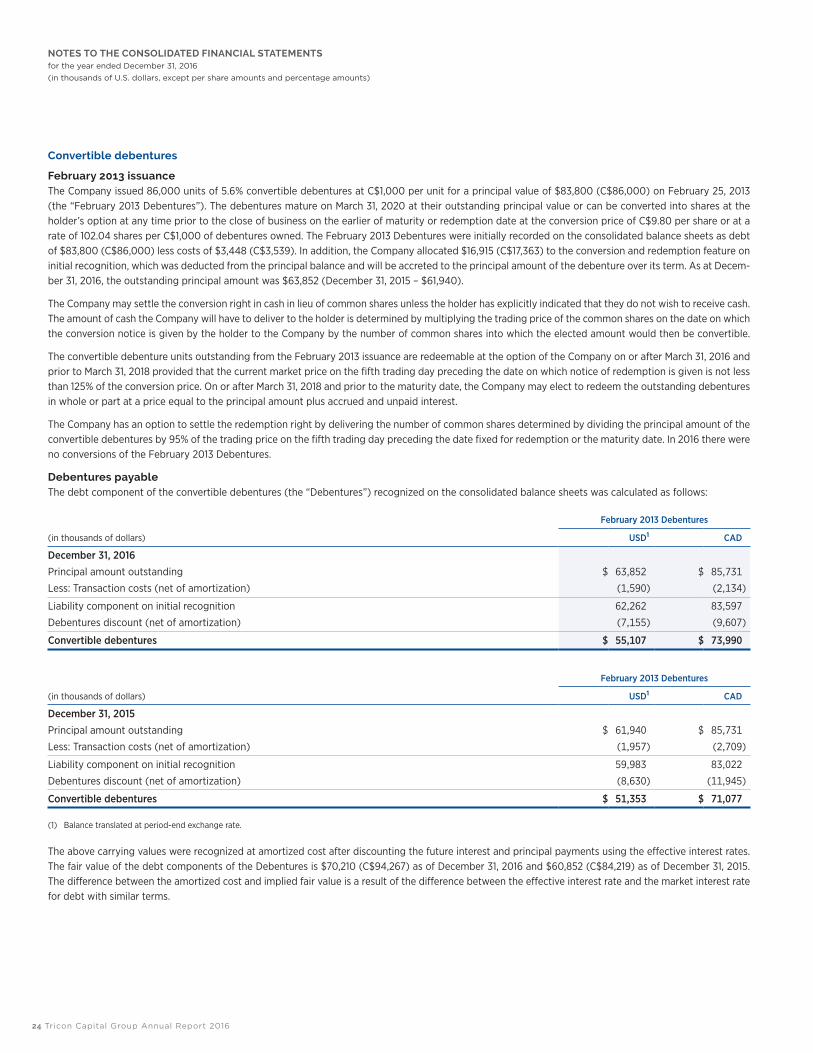
24 Tricon Capital Group Annual Report 2016
NOTES TO THE CONSOLIDATED FINANCIAL STATEMENTSfor the year ended December 31, 2016 (in thousands of U.S. dollars, except per share amounts and percentage amounts)
Convertible debentures
February 2013 issuanceThe Company issued 86,000 units of 5.6% convertible debentures at C$1,000 per unit for a principal value of $83,800 (C$86,000) on February 25, 2013 (the “February 2013 Debentures”). The debentures mature on March 31, 2020 at their outstanding principal value or can be converted into shares at the holder’s option at any time prior to the close of business on the earlier of maturity or redemption date at the conversion price of C$9.80 per share or at a rate of 102.04 shares per C$1,000 of debentures owned. The February 2013 Debentures were initially recorded on the consolidated balance sheets as debt of $83,800 (C$86,000) less costs of $3,448 (C$3,539). In addition, the Company allocated $16,915 (C$17,363) to the conversion and redemption feature on initial recognition, which was deducted from the principal balance and will be accreted to the principal amount of the debenture over its term. As at Decem-ber 31, 2016, the outstanding principal amount was $63,852 (December 31, 2015 – $61,940).
The Company may settle the conversion right in cash in lieu of common shares unless the holder has explicitly indicated that they do not wish to receive cash. The amount of cash the Company will have to deliver to the holder is determined by multiplying the trading price of the common shares on the date on which the conversion notice is given by the holder to the Company by the number of common shares into which the elected amount would then be convertible.
The convertible debenture units outstanding from the February 2013 issuance are redeemable at the option of the Company on or after March 31, 2016 and prior to March 31, 2018 provided that the current market price on the fifth trading day preceding the date on which notice of redemption is given is not less than 125% of the conversion price. On or after March 31, 2018 and prior to the maturity date, the Company may elect to redeem the outstanding debentures in whole or part at a price equal to the principal amount plus accrued and unpaid interest.
The Company has an option to settle the redemption right by delivering the number of common shares determined by dividing the principal amount of the convertible debentures by 95% of the trading price on the fifth trading day preceding the date fixed for redemption or the maturity date. In 2016 there were no conversions of the February 2013 Debentures.
Debentures payable The debt component of the convertible debentures (the “Debentures”) recognized on the consolidated balance sheets was calculated as follows:
February 2013 Debentures
(in thousands of dollars) USD1 CAD
December 31, 2016Principal amount outstanding $ 63,852 $ 85,731
Less: Transaction costs (net of amortization) (1,590) (2,134)
Liability component on initial recognition 62,262 83,597
Debentures discount (net of amortization) (7,155) (9,607)
Convertible debentures $ 55,107 $ 73,990
February 2013 Debentures
(in thousands of dollars) USD1 CAD
December 31, 2015Principal amount outstanding $ 61,940 $ 85,731
Less: Transaction costs (net of amortization) (1,957) (2,709)
Liability component on initial recognition 59,983 83,022
Debentures discount (net of amortization) (8,630) (11,945)
Convertible debentures $ 51,353 $ 71,077
(1) Balance translated at period-end exchange rate.
The above carrying values were recognized at amortized cost after discounting the future interest and principal payments using the effective interest rates. The fair value of the debt components of the Debentures is $70,210 (C$94,267) as of December 31, 2016 and $60,852 (C$84,219) as of December 31, 2015. The difference between the amortized cost and implied fair value is a result of the difference between the effective interest rate and the market interest rate for debt with similar terms.
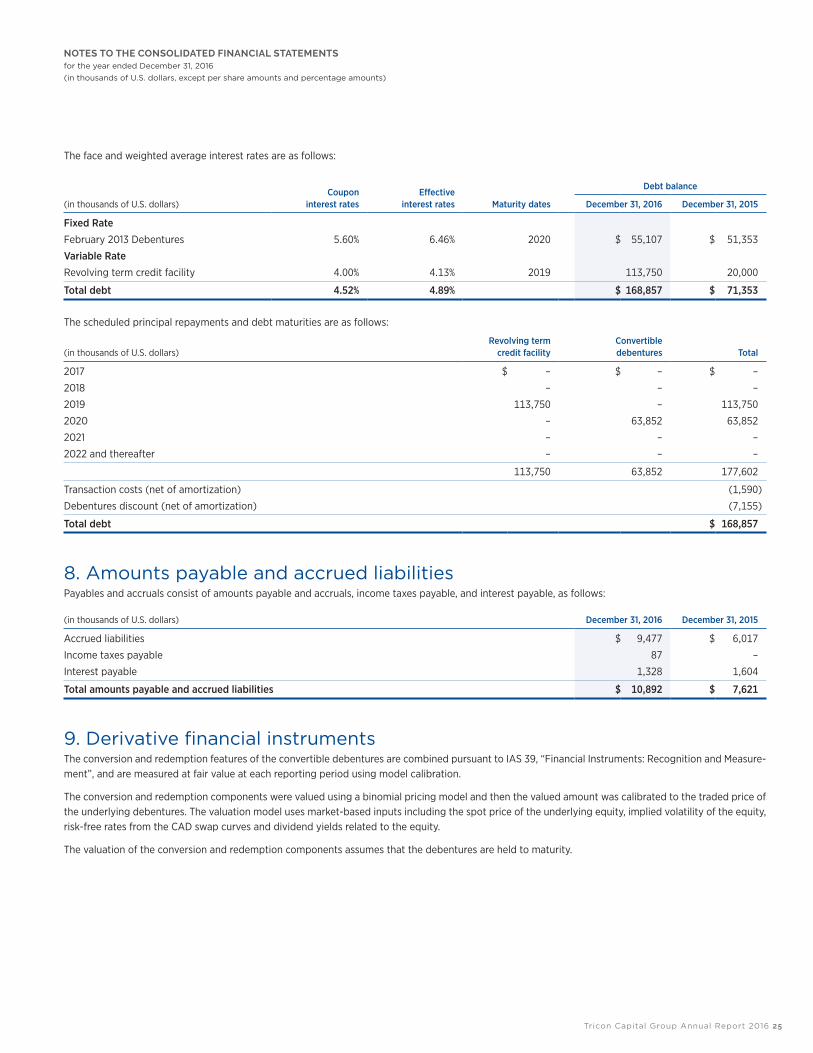
Tricon Capital Group Annual Report 2016 25
NOTES TO THE CONSOLIDATED FINANCIAL STATEMENTSfor the year ended December 31, 2016 (in thousands of U.S. dollars, except per share amounts and percentage amounts)
The face and weighted average interest rates are as follows:
Coupon interest rates
Effective interest rates Maturity dates
Debt balance
(in thousands of U.S. dollars) December 31, 2016 December 31, 2015
Fixed Rate
February 2013 Debentures 5.60% 6.46% 2020 $ 55,107 $ 51,353
Variable Rate
Revolving term credit facility 4.00% 4.13% 2019 113,750 20,000
Total debt 4.52% 4.89% $ 168,857 $ 71,353
The scheduled principal repayments and debt maturities are as follows:
(in thousands of U.S. dollars)Revolving term
credit facilityConvertible debentures Total
2017 $ – $ – $ –
2018 – – –
2019 113,750 – 113,750
2020 – 63,852 63,852
2021 – – –
2022 and thereafter – – –
113,750 63,852 177,602
Transaction costs (net of amortization) (1,590)
Debentures discount (net of amortization) (7,155)
Total debt $ 168,857
8. Amounts payable and accrued liabilitiesPayables and accruals consist of amounts payable and accruals, income taxes payable, and interest payable, as follows:
(in thousands of U.S. dollars) December 31, 2016 December 31, 2015
Accrued liabilities $ 9,477 $ 6,017
Income taxes payable 87 –
Interest payable 1,328 1,604
Total amounts payable and accrued liabilities $ 10,892 $ 7,621
9. Derivative financial instruments The conversion and redemption features of the convertible debentures are combined pursuant to IAS 39, “Financial Instruments: Recognition and Measure-ment”, and are measured at fair value at each reporting period using model calibration.
The conversion and redemption components were valued using a binomial pricing model and then the valued amount was calibrated to the traded price of the underlying debentures. The valuation model uses market-based inputs including the spot price of the underlying equity, implied volatility of the equity, risk-free rates from the CAD swap curves and dividend yields related to the equity.
The valuation of the conversion and redemption components assumes that the debentures are held to maturity.
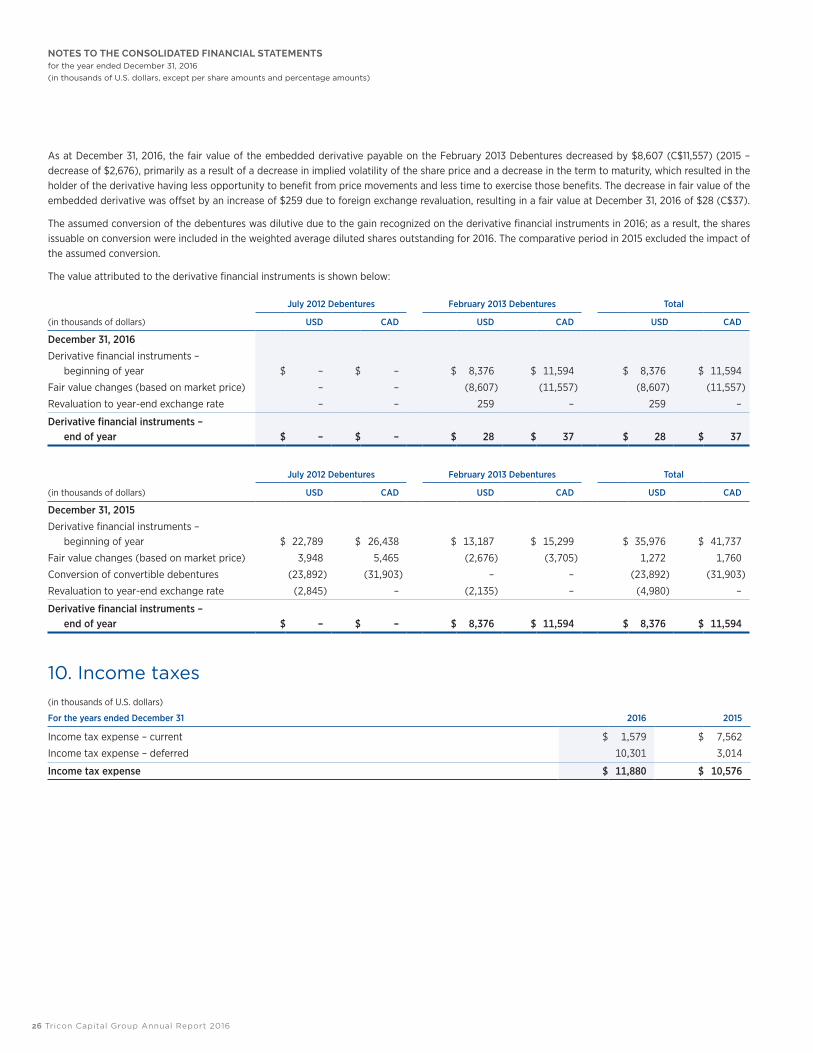
26 Tricon Capital Group Annual Report 2016
NOTES TO THE CONSOLIDATED FINANCIAL STATEMENTSfor the year ended December 31, 2016 (in thousands of U.S. dollars, except per share amounts and percentage amounts)
As at December 31, 2016, the fair value of the embedded derivative payable on the February 2013 Debentures decreased by $8,607 (C$11,557) (2015 – decrease of $2,676), primarily as a result of a decrease in implied volatility of the share price and a decrease in the term to maturity, which resulted in the holder of the derivative having less opportunity to benefit from price movements and less time to exercise those benefits. The decrease in fair value of the embedded derivative was offset by an increase of $259 due to foreign exchange revaluation, resulting in a fair value at December 31, 2016 of $28 (C$37).
The assumed conversion of the debentures was dilutive due to the gain recognized on the derivative financial instruments in 2016; as a result, the shares issuable on conversion were included in the weighted average diluted shares outstanding for 2016. The comparative period in 2015 excluded the impact of the assumed conversion.
The value attributed to the derivative financial instruments is shown below:
July 2012 Debentures February 2013 Debentures Total
(in thousands of dollars) USD CAD USD CAD USD CAD
December 31, 2016
Derivative financial instruments – beginning of year $ – $ – $ 8,376 $ 11,594 $ 8,376 $ 11,594
Fair value changes (based on market price) – – (8,607) (11,557) (8,607) (11,557)
Revaluation to year-end exchange rate – – 259 – 259 –
Derivative financial instruments – end of year $ – $ – $ 28 $ 37 $ 28 $ 37
July 2012 Debentures February 2013 Debentures Total
(in thousands of dollars) USD CAD USD CAD USD CAD
December 31, 2015Derivative financial instruments –
beginning of year $ 22,789 $ 26,438 $ 13,187 $ 15,299 $ 35,976 $ 41,737
Fair value changes (based on market price) 3,948 5,465 (2,676) (3,705) 1,272 1,760
Conversion of convertible debentures (23,892) (31,903) – – (23,892) (31,903)
Revaluation to year-end exchange rate (2,845) – (2,135) – (4,980) –
Derivative financial instruments – end of year $ – $ – $ 8,376 $ 11,594 $ 8,376 $ 11,594
10. Income taxes (in thousands of U.S. dollars)
For the years ended December 31 2016 2015
Income tax expense – current $ 1,579 $ 7,562
Income tax expense – deferred 10,301 3,014
Income tax expense $ 11,880 $ 10,576

Tricon Capital Group Annual Report 2016 27
NOTES TO THE CONSOLIDATED FINANCIAL STATEMENTSfor the year ended December 31, 2016 (in thousands of U.S. dollars, except per share amounts and percentage amounts)
The tax on the Company’s income before income taxes differs from the theoretical amount that would arise using the weighted average tax rate applicable to income of the consolidated entities as follows:
(in thousands of U.S. dollars)
For the years ended December 31 2016 2015
Income before income taxes $ 71,640 $ 69,039
Combined statutory federal and provincial income tax rate 26.50% 26.50%
Expected income tax expense 18,985 18,295
Tax rate differential (foreign tax rates) 613 475
Tax effects of
Permanent differences1 (8,195) (2,075)
Prior year adjustments associated with exit strategy changes2 – (3,634)
Prior year adjustments 30 (2,643)
Other3 447 158
Income tax expense $ 11,880 $ 10,576
(1) Permanent differences for 2016 are comprised of the following: (a) the non-taxable portion of unrealized foreign exchange gains/losses on the convertible debentures; (b) the non-taxable portion of the unrealized gain recognized on the investment in Tricon American Homes; and (c) the fair value change on the derivative, and obligations related to investments held under repurchase agreement.
(2) As a result of a change in the exit strategy for TAH and TLC, portfolio gains will be taxed at capital gains rates instead of ordinary income rates.
(3) Other adjustments includes revaluation due to change of presentation currency and tax interest/penalties.
The expected realization of deferred tax assets and deferred tax liabilities is as follows:
(in thousands of U.S. dollars) December 31, 2016 December 31, 2015
Deferred tax assets:
Deferred tax assets to be recovered after more than 12 months $ 11,152 $ 11,282
Deferred tax assets to be recovered within 12 months 1,252 –
Total deferred tax assets $ 12,404 $ 11,282
Deferred tax liabilities:
Deferred tax liabilities reversing after more than 12 months $ 30,256 $ 20,600
Deferred tax liabilities reversing within 12 months 232 –
Total deferred tax liabilities $ 30,488 $ 20,600
The movement of the deferred tax accounts was as follows:
(in thousands of U.S. dollars) December 31, 2016 December 31, 2015
Change in net deferred tax liabilities:
Net deferred tax liabilities – beginning of year $ 9,318 $ 7,554
Charge to the statement of comprehensive income 10,301 3,014
Credit directly to equity (1,362) –
Other (173) (1,250)
Net deferred tax liabilities – end of year $ 18,084 $ 9,318
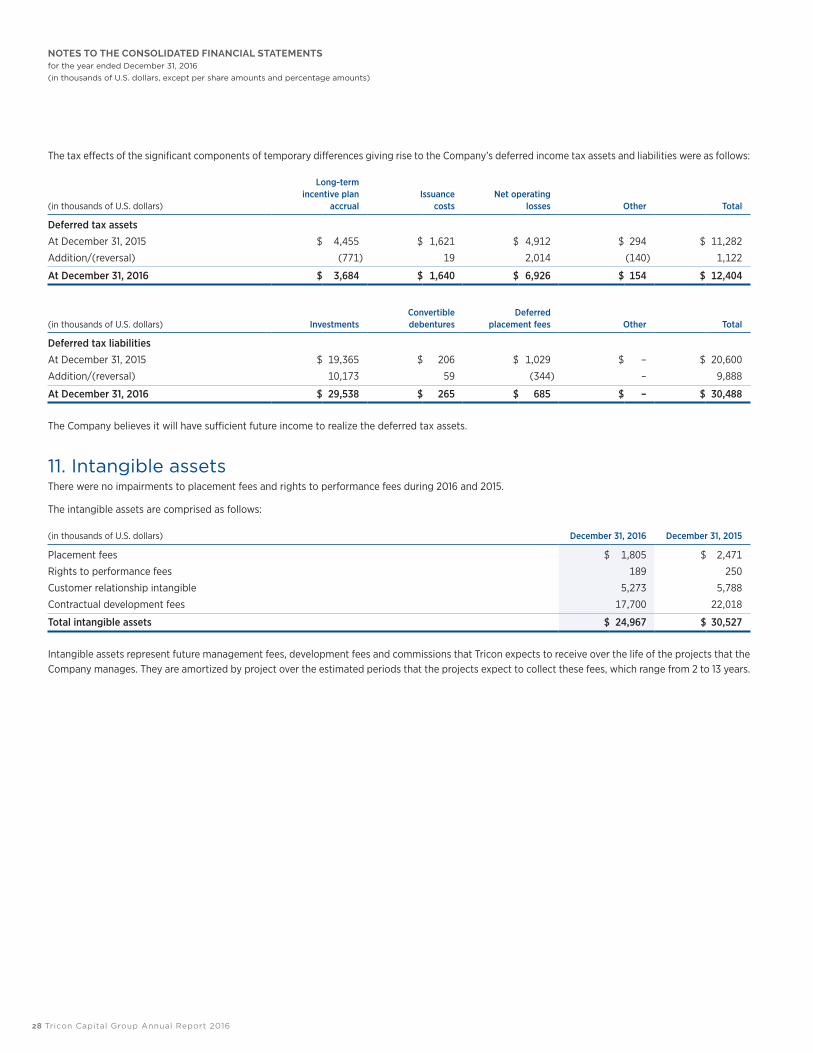
28 Tricon Capital Group Annual Report 2016
NOTES TO THE CONSOLIDATED FINANCIAL STATEMENTSfor the year ended December 31, 2016 (in thousands of U.S. dollars, except per share amounts and percentage amounts)
The tax effects of the significant components of temporary differences giving rise to the Company’s deferred income tax assets and liabilities were as follows:
(in thousands of U.S. dollars)
Long-term incentive plan
accrual Issuance
costs Net operating
losses Other Total
Deferred tax assets
At December 31, 2015 $ 4,455 $ 1,621 $ 4,912 $ 294 $ 11,282
Addition/(reversal) (771) 19 2,014 (140) 1,122
At December 31, 2016 $ 3,684 $ 1,640 $ 6,926 $ 154 $ 12,404
(in thousands of U.S. dollars) InvestmentsConvertible debentures
Deferred placement fees Other Total
Deferred tax liabilities
At December 31, 2015 $ 19,365 $ 206 $ 1,029 $ – $ 20,600
Addition/(reversal) 10,173 59 (344) – 9,888
At December 31, 2016 $ 29,538 $ 265 $ 685 $ – $ 30,488
The Company believes it will have sufficient future income to realize the deferred tax assets.
11. Intangible assetsThere were no impairments to placement fees and rights to performance fees during 2016 and 2015.
The intangible assets are comprised as follows:
(in thousands of U.S. dollars) December 31, 2016 December 31, 2015
Placement fees $ 1,805 $ 2,471
Rights to performance fees 189 250
Customer relationship intangible 5,273 5,788
Contractual development fees 17,700 22,018
Total intangible assets $ 24,967 $ 30,527
Intangible assets represent future management fees, development fees and commissions that Tricon expects to receive over the life of the projects that the Company manages. They are amortized by project over the estimated periods that the projects expect to collect these fees, which range from 2 to 13 years.
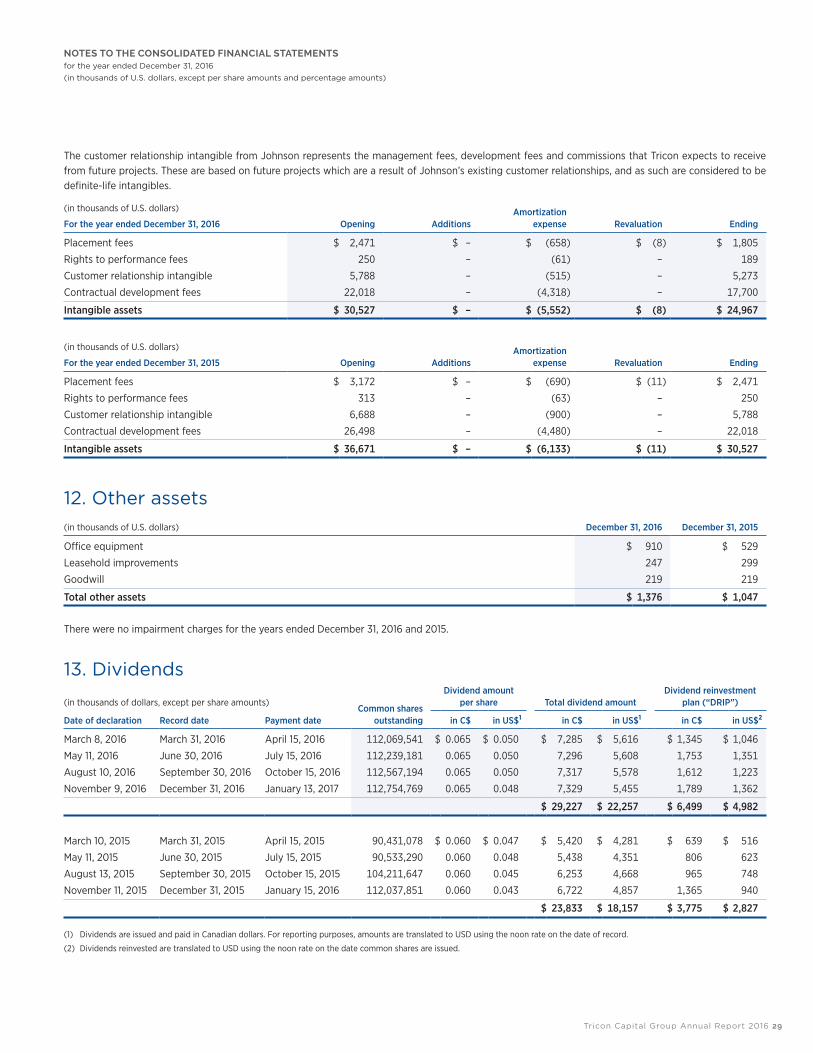
Tricon Capital Group Annual Report 2016 29
NOTES TO THE CONSOLIDATED FINANCIAL STATEMENTSfor the year ended December 31, 2016 (in thousands of U.S. dollars, except per share amounts and percentage amounts)
The customer relationship intangible from Johnson represents the management fees, development fees and commissions that Tricon expects to receive from future projects. These are based on future projects which are a result of Johnson’s existing customer relationships, and as such are considered to be definite-life intangibles.
(in thousands of U.S. dollars)
For the year ended December 31, 2016 Opening AdditionsAmortization
expense Revaluation Ending
Placement fees $ 2,471 $ – $ (658) $ (8) $ 1,805
Rights to performance fees 250 – (61) – 189
Customer relationship intangible 5,788 – (515) – 5,273
Contractual development fees 22,018 – (4,318) – 17,700
Intangible assets $ 30,527 $ – $ (5,552) $ (8) $ 24,967
(in thousands of U.S. dollars)
For the year ended December 31, 2015 Opening AdditionsAmortization
expense Revaluation Ending
Placement fees $ 3,172 $ – $ (690) $ (11) $ 2,471
Rights to performance fees 313 – (63) – 250
Customer relationship intangible 6,688 – (900) – 5,788
Contractual development fees 26,498 – (4,480) – 22,018
Intangible assets $ 36,671 $ – $ (6,133) $ (11) $ 30,527
12. Other assets(in thousands of U.S. dollars) December 31, 2016 December 31, 2015
Office equipment $ 910 $ 529
Leasehold improvements 247 299
Goodwill 219 219
Total other assets $ 1,376 $ 1,047
There were no impairment charges for the years ended December 31, 2016 and 2015.
13. Dividends
(in thousands of dollars, except per share amounts)Common shares
outstanding
Dividend amount per share Total dividend amount
Dividend reinvestment plan (“DRIP”)
Date of declaration Record date Payment date in C$ in US$1 in C$ in US$1 in C$ in US$2
March 8, 2016 March 31, 2016 April 15, 2016 112,069,541 $ 0.065 $ 0.050 $ 7,285 $ 5,616 $ 1,345 $ 1,046
May 11, 2016 June 30, 2016 July 15, 2016 112,239,181 0.065 0.050 7,296 5,608 1,753 1,351
August 10, 2016 September 30, 2016 October 15, 2016 112,567,194 0.065 0.050 7,317 5,578 1,612 1,223
November 9, 2016 December 31, 2016 January 13, 2017 112,754,769 0.065 0.048 7,329 5,455 1,789 1,362
$ 29,227 $ 22,257 $ 6,499 $ 4,982
March 10, 2015 March 31, 2015 April 15, 2015 90,431,078 $ 0.060 $ 0.047 $ 5,420 $ 4,281 $ 639 $ 516
May 11, 2015 June 30, 2015 July 15, 2015 90,533,290 0.060 0.048 5,438 4,351 806 623
August 13, 2015 September 30, 2015 October 15, 2015 104,211,647 0.060 0.045 6,253 4,668 965 748
November 11, 2015 December 31, 2015 January 15, 2016 112,037,851 0.060 0.043 6,722 4,857 1,365 940
$ 23,833 $ 18,157 $ 3,775 $ 2,827
(1) Dividends are issued and paid in Canadian dollars. For reporting purposes, amounts are translated to USD using the noon rate on the date of record.
(2) Dividends reinvested are translated to USD using the noon rate on the date common shares are issued.

30 Tricon Capital Group Annual Report 2016
NOTES TO THE CONSOLIDATED FINANCIAL STATEMENTSfor the year ended December 31, 2016 (in thousands of U.S. dollars, except per share amounts and percentage amounts)
The Company has a Dividend Reinvestment Plan (“DRIP”) under which eligible shareholders may elect to have their cash dividends automatically reinvested into additional common shares. These additional shares are issued from treasury (or purchased on the open market) at a discount, in the case of treasury issuances, of up to 5% of the Average Market Price, as defined under the DRIP, of the common shares as of the dividend payment date. If common shares are purchased in the open market, they are priced at the average weighted cost to the Company of the shares purchased.
Brokerage, commissions and service fees are not charged to shareholders for purchases or withdrawals of the Company’s shares under the DRIP, and all DRIP administrative costs are assumed by the Company.
For the year ended December 31, 2016, 728,239 common shares were issued under the DRIP (2015 – 318,615) for a total amount of $4,560 (2015 – $2,558).
14. Share capitalThe Company is authorized to issue an unlimited number of common shares. The common shares of the Company do not have par value.
As of December 31, 2016, the Company had 112,754,769 common shares outstanding (December 31, 2015 – 112,037,851).
December 31, 2016 December 31, 2015
Number of shares issued
Share capitalNumber of
shares issued
Share capital
(in thousands of dollars) in US$ in C$ in US$ in C$
Beginning balance 112,037,851 $ 561,347 $ 677,277 90,192,448 $ 393,200 $ 456,148
Shares issued under DRIP1 728,239 4,560 6,075 318,615 2,558 3,210
Stock options exercised2 10,503 77 100 135,890 1,075 1,426
Shares issued for phantom units released from escrow3 104,595 617 643 112,434 528 691
Normal course issuer bid (NCIB) (244,520) (1,113) (1,538) (636,400) (2,921) (3,856)
Deferred share units exercised4 118,101 827 1,129 152,779 972 1,209
Debenture conversions – – – 8,604,085 56,499 75,384
Bought deal offering5 – 1,362 1,903 13,158,000 109,436 143,065
Ending balance 112,754,769 $ 567,677 $ 685,589 112,037,851 $ 561,347 $ 677,277
(1) In 2016, 728,239 common shares were issued under the DRIP at an average price of $6.26 (C$8.34) per share.
(2) In 2016, a total of 10,503 shares were issued for stock options vested and exercised at an average price of $7.33 per share (C$9.52).
(3) On August 15, 2016, 104,595 shares were issued for phantom units vested at $5.91 per share (C$6.15).
(4) In 2016, 118,101 deferred shared units (DSUs) were vested and exercised at an average price of $6.99 (C$9.56).
(5) The increase in share capital in 2016 relates to tax savings on equity issuance costs from 2016.
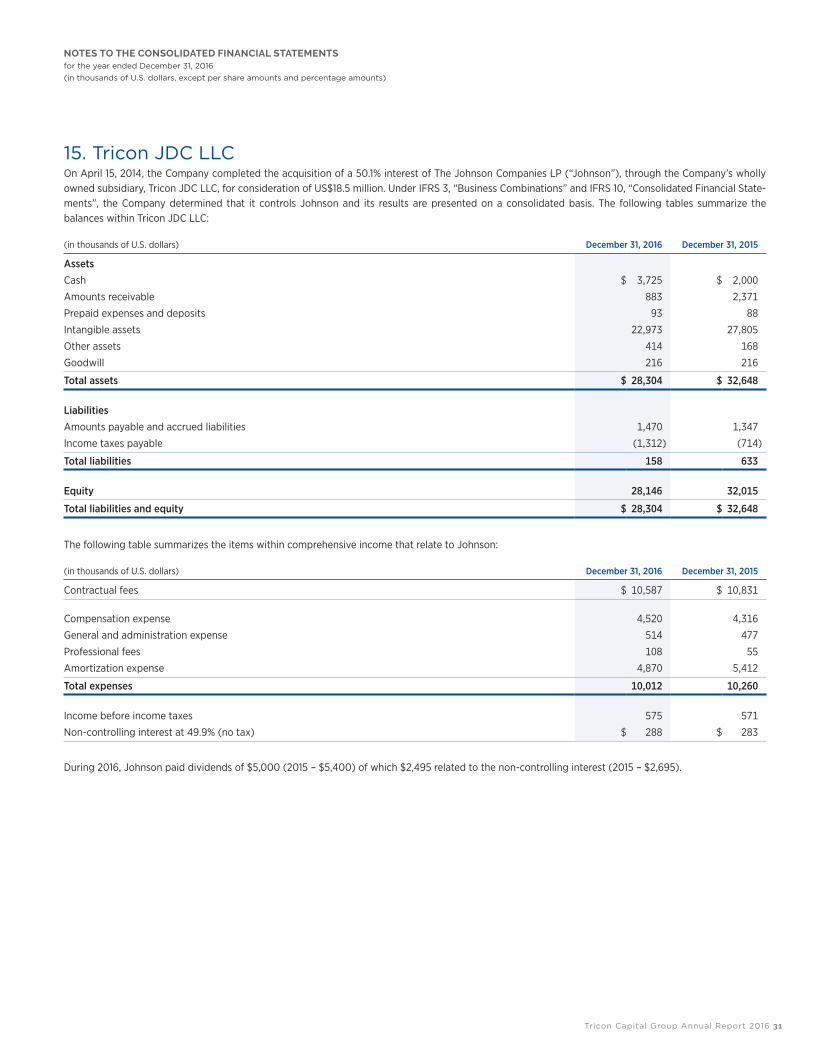
Tricon Capital Group Annual Report 2016 31
NOTES TO THE CONSOLIDATED FINANCIAL STATEMENTSfor the year ended December 31, 2016 (in thousands of U.S. dollars, except per share amounts and percentage amounts)
15. Tricon JDC LLCOn April 15, 2014, the Company completed the acquisition of a 50.1% interest of The Johnson Companies LP (“Johnson”), through the Company’s wholly owned subsidiary, Tricon JDC LLC, for consideration of US$18.5 million. Under IFRS 3, “Business Combinations” and IFRS 10, “Consolidated Financial State-ments”, the Company determined that it controls Johnson and its results are presented on a consolidated basis. The following tables summarize the balances within Tricon JDC LLC:
(in thousands of U.S. dollars) December 31, 2016 December 31, 2015
Assets
Cash $ 3,725 $ 2,000
Amounts receivable 883 2,371
Prepaid expenses and deposits 93 88
Intangible assets 22,973 27,805
Other assets 414 168
Goodwill 216 216
Total assets $ 28,304 $ 32,648
LiabilitiesAmounts payable and accrued liabilities 1,470 1,347
Income taxes payable (1,312) (714)
Total liabilities 158 633
Equity 28,146 32,015
Total liabilities and equity $ 28,304 $ 32,648
The following table summarizes the items within comprehensive income that relate to Johnson:
(in thousands of U.S. dollars) December 31, 2016 December 31, 2015
Contractual fees $ 10,587 $ 10,831
Compensation expense 4,520 4,316
General and administration expense 514 477
Professional fees 108 55
Amortization expense 4,870 5,412
Total expenses 10,012 10,260
Income before income taxes 575 571
Non-controlling interest at 49.9% (no tax) $ 288 $ 283
During 2016, Johnson paid dividends of $5,000 (2015 – $5,400) of which $2,495 related to the non-controlling interest (2015 – $2,695).

32 Tricon Capital Group Annual Report 2016
NOTES TO THE CONSOLIDATED FINANCIAL STATEMENTSfor the year ended December 31, 2016 (in thousands of U.S. dollars, except per share amounts and percentage amounts)
16. Earnings per shareBasic Basic earnings per share is calculated by dividing net income attributable to shareholders of Tricon by the sum of the weighted average number of shares outstanding, vested phantom units and vested deferred share units during the year.
(in thousands of U.S. dollars, except per share amounts which are in U.S. dollars)
For the years ended December 31 2016 2015
Net income attributable to the shareholders of Tricon $ 59,472 $ 58,180
Weighted average number of common shares outstanding 112,378,522 96,312,491
Adjustments for vested units 111,497 176,168
Weighted average number of common shares outstanding for basic earnings per share 112,490,019 96,488,659
Basic earnings per share $ 0.53 $ 0.60
DilutedDiluted earnings per share is calculated by adjusting the weighted average number of shares outstanding to assume conversion of all potential dilutive shares. The Company has three categories of potentially dilutive shares: stock options, deferred share units (see Note 17) and the convertible debentures (see Note 7). For the stock options and deferred share units, the number of dilutive shares is based on the number of shares that could have been acquired at fair value (determined using the market price of the Company’s shares as of December 31, 2016) based on the monetary value awarded under the AIP and LTIP. For the convertible debentures, the number of dilutive shares is based on the number of common shares into which the elected amount would then be convertible. The number of shares calculated as described above is comparable to the number of shares that would have been issued assuming the vesting of the stock compensation arrangement and conversion of debentures.
Stock options and deferred share unitsFor the year ended December 31, 2016, the Company’s stock compensation plans resulted in 2,408,452 dilutive share units (December 31, 2015 – 1,527,161) as the exercise price of the potential share units is below the average market share price of $6.73 (C$8.91) for the year.
Convertible debenturesFor the year ended December 31, 2016, the Company’s convertible debentures are dilutive (December 31, 2015 – dilutive), as debenture interest expense and the change in fair value of the derivative financial instruments, net of tax, would not result in an increased earnings per share upon conversion.
(in thousands of U.S. dollars, except per share amounts which are in U.S. dollars)
For the years ended December 31 2016 2015
Net income attributable to the shareholders of Tricon $ 59,472 $ 58,180
Adjustment for convertible debenture interest expense – net of tax 4,158 8,145
Changes in fair value for financial instruments through profit or loss – net of tax (6,326) 935
Adjusted net income attributable to the shareholders of Tricon $ 57,304 $ 67,260
Weighted average number of common shares outstanding 112,490,019 96,488,659
Adjustments for stock compensation 2,408,452 1,527,161
Adjustments for convertible debentures 8,748,061 16,459,031
Weighted average number of common shares outstanding for diluted earnings per share 123,646,532 114,474,851
Diluted earnings per share $ 0.46 $ 0.59
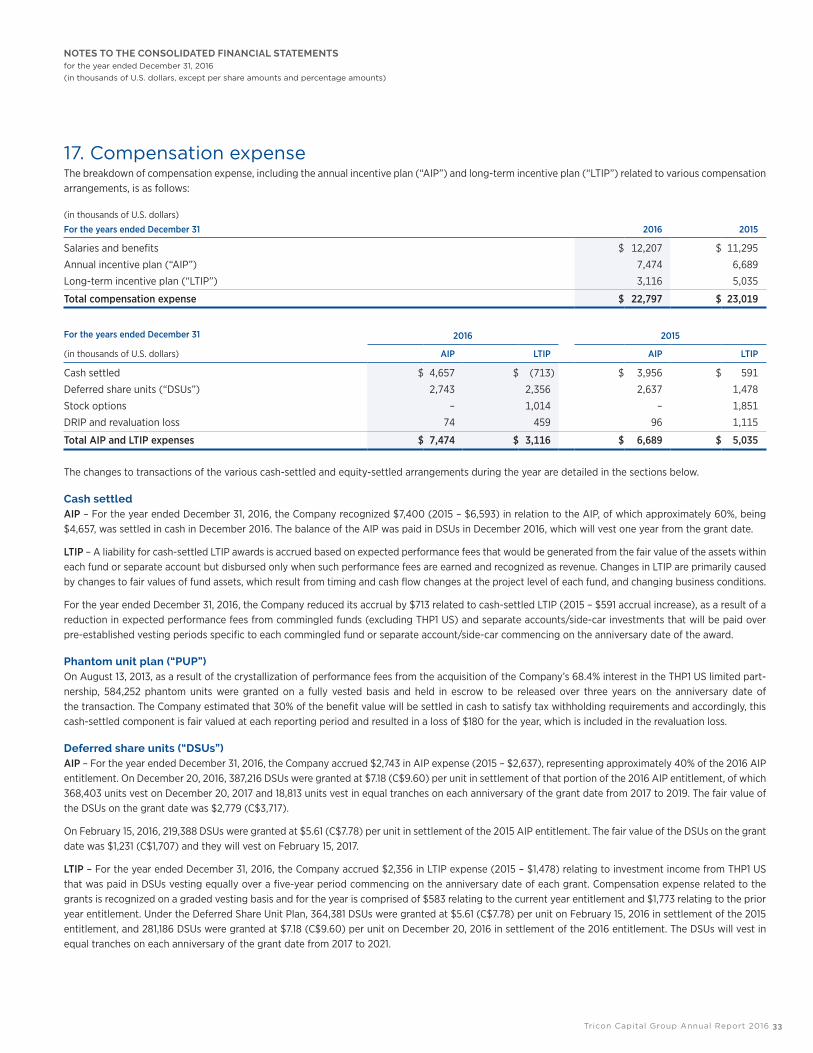
Tricon Capital Group Annual Report 2016 33
NOTES TO THE CONSOLIDATED FINANCIAL STATEMENTSfor the year ended December 31, 2016 (in thousands of U.S. dollars, except per share amounts and percentage amounts)
17. Compensation expenseThe breakdown of compensation expense, including the annual incentive plan (“AIP”) and long-term incentive plan (“LTIP”) related to various compensation arrangements, is as follows:
(in thousands of U.S. dollars)
For the years ended December 31 2016 2015
Salaries and benefits $ 12,207 $ 11,295
Annual incentive plan (“AIP”) 7,474 6,689
Long-term incentive plan (“LTIP”) 3,116 5,035
Total compensation expense $ 22,797 $ 23,019
For the years ended December 31 2016 2015
(in thousands of U.S. dollars) AIP LTIP AIP LTIP
Cash settled $ 4,657 $ (713) $ 3,956 $ 591
Deferred share units (“DSUs”) 2,743 2,356 2,637 1,478
Stock options – 1,014 – 1,851
DRIP and revaluation loss 74 459 96 1,115
Total AIP and LTIP expenses $ 7,474 $ 3,116 $ 6,689 $ 5,035
The changes to transactions of the various cash-settled and equity-settled arrangements during the year are detailed in the sections below.
Cash settled AIP – For the year ended December 31, 2016, the Company recognized $7,400 (2015 – $6,593) in relation to the AIP, of which approximately 60%, being $4,657, was settled in cash in December 2016. The balance of the AIP was paid in DSUs in December 2016, which will vest one year from the grant date.
LTIP – A liability for cash-settled LTIP awards is accrued based on expected performance fees that would be generated from the fair value of the assets within each fund or separate account but disbursed only when such performance fees are earned and recognized as revenue. Changes in LTIP are primarily caused by changes to fair values of fund assets, which result from timing and cash flow changes at the project level of each fund, and changing business conditions.
For the year ended December 31, 2016, the Company reduced its accrual by $713 related to cash-settled LTIP (2015 – $591 accrual increase), as a result of a reduction in expected performance fees from commingled funds (excluding THP1 US) and separate accounts/side-car investments that will be paid over pre-established vesting periods specific to each commingled fund or separate account/side-car commencing on the anniversary date of the award.
Phantom unit plan (“PUP”) On August 13, 2013, as a result of the crystallization of performance fees from the acquisition of the Company’s 68.4% interest in the THP1 US limited part-nership, 584,252 phantom units were granted on a fully vested basis and held in escrow to be released over three years on the anniversary date of the transaction. The Company estimated that 30% of the benefit value will be settled in cash to satisfy tax withholding requirements and accordingly, this cash-settled component is fair valued at each reporting period and resulted in a loss of $180 for the year, which is included in the revaluation loss.
Deferred share units (“DSUs”)AIP – For the year ended December 31, 2016, the Company accrued $2,743 in AIP expense (2015 – $2,637), representing approximately 40% of the 2016 AIP entitlement. On December 20, 2016, 387,216 DSUs were granted at $7.18 (C$9.60) per unit in settlement of that portion of the 2016 AIP entitlement, of which 368,403 units vest on December 20, 2017 and 18,813 units vest in equal tranches on each anniversary of the grant date from 2017 to 2019. The fair value of the DSUs on the grant date was $2,779 (C$3,717).
On February 15, 2016, 219,388 DSUs were granted at $5.61 (C$7.78) per unit in settlement of the 2015 AIP entitlement. The fair value of the DSUs on the grant date was $1,231 (C$1,707) and they will vest on February 15, 2017.
LTIP – For the year ended December 31, 2016, the Company accrued $2,356 in LTIP expense (2015 – $1,478) relating to investment income from THP1 US that was paid in DSUs vesting equally over a five-year period commencing on the anniversary date of each grant. Compensation expense related to the grants is recognized on a graded vesting basis and for the year is comprised of $583 relating to the current year entitlement and $1,773 relating to the prior year entitlement. Under the Deferred Share Unit Plan, 364,381 DSUs were granted at $5.61 (C$7.78) per unit on February 15, 2016 in settlement of the 2015 entitlement, and 281,186 DSUs were granted at $7.18 (C$9.60) per unit on December 20, 2016 in settlement of the 2016 entitlement. The DSUs will vest in equal tranches on each anniversary of the grant date from 2017 to 2021.

34 Tricon Capital Group Annual Report 2016
NOTES TO THE CONSOLIDATED FINANCIAL STATEMENTSfor the year ended December 31, 2016 (in thousands of U.S. dollars, except per share amounts and percentage amounts)
Stock option planIn 2016, 995,000 stock options were granted (2015 – 1,741,500). The following table summarizes the assumptions used in the Black-Scholes option pricing model:
For the years ended December 31 2016 2015
Risk-free interest rate (%) 1.0 0.6
Expected option life (years) 5.3 3.6
Expected volatility (%) 28.93 21.17
Average 2016 share price ($C) 8.91 10.58
Weighted average exercise price ($C) 8.85 10.24
For the year, the Company recorded $1,014 (2015 – $1,851) in relation to stock option compensation expense.
The following table summarizes the movement in the stock option plan during the year:
For the years ended December 31 2016 2015
Number of options
Weighted average exercise price (C$)
Number of options
Weighted average exercise price (C$)
Opening balance – outstanding 3,398,835 $ 8.42 2,101,500 $ 6.48
Granted 995,000 8.85 1,741,500 10.24
Exercised (42,000) 6.99 (407,498) 6.27
Forfeited (5,000) 10.57 (36,667) 7.19
Ending balance – outstanding 4,346,835 $ 8.53 3,398,835 $ 8.42
December 31, 2016
Grant date Expiration dateOptions
outstandingOptions
exercisable
Exercise price on outstanding
options (C$)
May 19, 2010 May 19, 2020 587,000 587,000 $ 6.00
August 3, 2010 August 3, 2020 54,000 54,000 5.26
November 22, 2011 November 22, 2020 20,000 20,000 4.16
May 17, 2013 May 17, 2020 804,334 804,334 6.81
November 25, 2013 November 25, 2020 171,501 171,501 7.74
March 16, 2015 March 16, 2020 717,000 240,998 10.57
November 17, 2015 November 17, 2020 1,000,000 343,329 10.03
November 14, 2016 November 14, 2023 995,000 – 8.85
Total 4,348,835 2,221,162 $ 8.53
AIP liability is disclosed under the following balance sheets headings:
Balance sheets
(in thousands of U.S. dollars) December 31, 2016 December 31, 2015
Amounts payable and accrued liabilities $ 529 $ 1,998
Equity – contributed surplus 5,155 3,104
AIP – end of year $ 5,684 $ 5,102
LTIP liability is shown included under the following balance sheets headings:
Balance sheets
(in thousands of U.S. dollars) December 31, 2016 December 31, 2015
LTIP $ 13,359 $ 15,717
Equity – contributed surplus 9,553 6,457
LTIP – end of year $ 22,912 $ 22,174
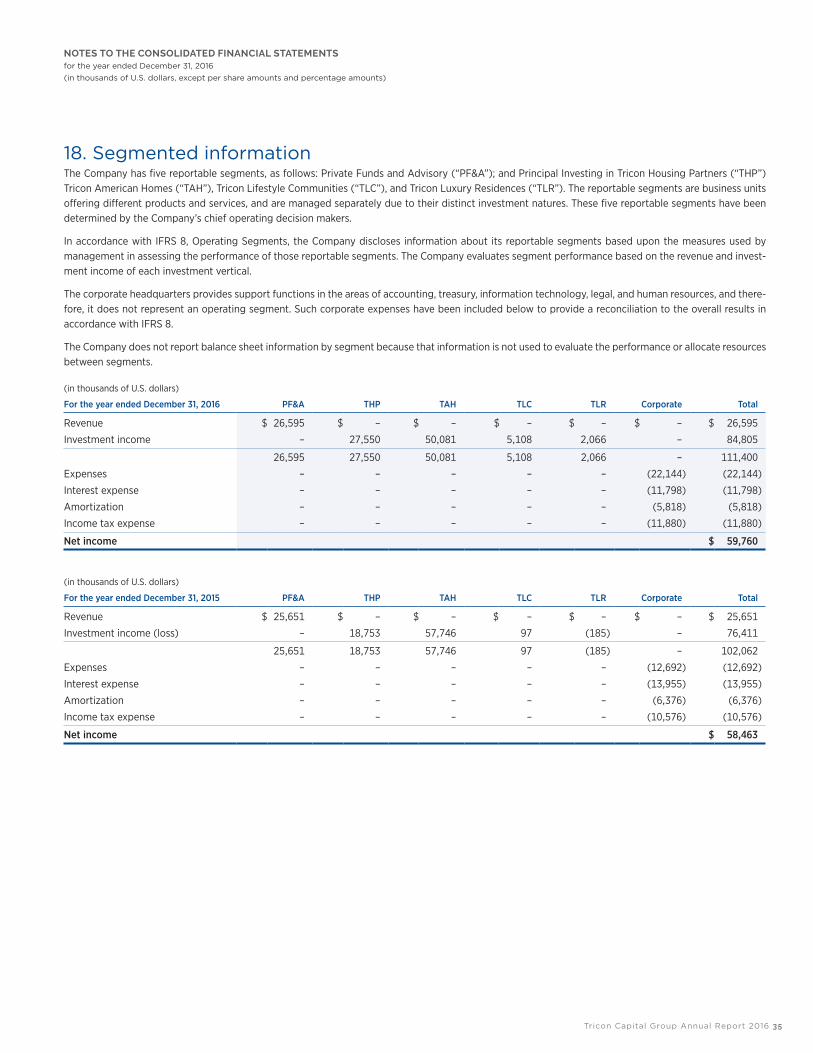
Tricon Capital Group Annual Report 2016 35
NOTES TO THE CONSOLIDATED FINANCIAL STATEMENTSfor the year ended December 31, 2016 (in thousands of U.S. dollars, except per share amounts and percentage amounts)
18. Segmented informationThe Company has five reportable segments, as follows: Private Funds and Advisory (“PF&A”); and Principal Investing in Tricon Housing Partners (“THP”) Tricon American Homes (“TAH”), Tricon Lifestyle Communities (“TLC”), and Tricon Luxury Residences (“TLR”). The reportable segments are business units offering different products and services, and are managed separately due to their distinct investment natures. These five reportable segments have been determined by the Company’s chief operating decision makers.
In accordance with IFRS 8, Operating Segments, the Company discloses information about its reportable segments based upon the measures used by management in assessing the performance of those reportable segments. The Company evaluates segment performance based on the revenue and invest-ment income of each investment vertical.
The corporate headquarters provides support functions in the areas of accounting, treasury, information technology, legal, and human resources, and there-fore, it does not represent an operating segment. Such corporate expenses have been included below to provide a reconciliation to the overall results in accordance with IFRS 8.
The Company does not report balance sheet information by segment because that information is not used to evaluate the performance or allocate resources between segments.
(in thousands of U.S. dollars)
For the year ended December 31, 2016 PF&A THP TAH TLC TLR Corporate Total
Revenue $ 26,595 $ – $ – $ – $ – $ – $ 26,595
Investment income – 27,550 50,081 5,108 2,066 – 84,805
26,595 27,550 50,081 5,108 2,066 – 111,400
Expenses – – – – – (22,144) (22,144)
Interest expense – – – – – (11,798) (11,798)
Amortization – – – – – (5,818) (5,818)
Income tax expense – – – – – (11,880) (11,880)
Net income $ 59,760
(in thousands of U.S. dollars)
For the year ended December 31, 2015 PF&A THP TAH TLC TLR Corporate Total
Revenue $ 25,651 $ – $ – $ – $ – $ – $ 25,651
Investment income (loss) – 18,753 57,746 97 (185) – 76,411
25,651 18,753 57,746 97 (185) – 102,062
Expenses – – – – – (12,692) (12,692)
Interest expense – – – – – (13,955) (13,955)
Amortization – – – – – (6,376) (6,376)
Income tax expense – – – – – (10,576) (10,576)
Net income $ 58,463

36 Tricon Capital Group Annual Report 2016
NOTES TO THE CONSOLIDATED FINANCIAL STATEMENTSfor the year ended December 31, 2016 (in thousands of U.S. dollars, except per share amounts and percentage amounts)
19. Related party transactions and balancesThe Company has a ten-year sub-lease commitment on the head office premises with Mandukwe Inc., a company owned and controlled by a current direc-tor and shareholder of Tricon. For the year ended December 31, 2016, the Company paid $140 in rental payments to Mandukwe, including realty taxes, maintenance and utility costs (2015 – $87).
Transactions with related partiesThe following table summarizes revenue earned from related parties including consolidated subsidiaries. These are contractual arrangements from invest-ment funds managed by the Company, of which the Company is the general partner of the investment. In addition, the table includes investment income from related entities fair valued by the Company.
(in thousands of U.S. dollars)
For the years ended December 31 2016 2015
Contractual fees $ 24,518 $ 23,947
General partner distributions 1,297 1,290
Performance fees 780 414
Total revenue $ 26,595 $ 25,651
Investment income – Tricon Housing Partners $ 27,550 $ 18,753
Investment income – Tricon American Homes 50,081 57,746
Investment income – Tricon Lifestyle Communities 5,108 97
Investment income (loss) – Tricon Luxury Residences 2,066 (185)
Total investment income $ 84,805 $ 76,411
Balances arising from transactions with related partiesThe items set out below are included on various line items comprising the Company’s consolidated financial statements.
(in thousands of U.S. dollars) December 31, 2016 December 31, 2015
Receivables from related parties included in amounts receivable
Contractual fees receivable from investment funds managed $ 320 $ 96
Other receivables 5,043 2,082
Employee relocation housing loans1 782 963
Loan receivables from investment in associates and joint ventures 21,101 18,000
Long-term incentive plan 22,912 22,174
Annual incentive plan 5,684 5,102
Dividends payable to employees and associated corporations 302 290
Other payables to related parties included in amounts payable and accruals 6,705 333
(1) The employee relocation housing loans are non-interest bearing for a term of five years, maturing in 2019.
Revenues and receivables from related parties relate to general partnership distributions and contractual and performance fees for services provided by the Company. The receivables are unsecured and non-interest bearing. There are no provisions recorded against receivables from related parties at December 31, 2016 (December 31, 2015 – $nil).
Key management compensationKey management includes directors and the Named Executive Officers (“NEO”), who are the Chief Executive Officer, Chief Financial Officer and the three other most highly-compensated officers or employees of the Company. Compensation paid and payable to key management for employee services is based on employment agreements and is as follows:
(in thousands of U.S. dollars)
For the years ended December 31 2016 2015
Total salary and benefits $ 1,689 $ 2,185
Total AIP 3,957 4,361
Total LTIP 8,364 7,084
Total key management compensation $ 14,010 $ 13,630

Tricon Capital Group Annual Report 2016 37
NOTES TO THE CONSOLIDATED FINANCIAL STATEMENTSfor the year ended December 31, 2016 (in thousands of U.S. dollars, except per share amounts and percentage amounts)
20. Financial risk management The Company’s activities expose it to certain financial risks during or at the end of the reporting period as described below. The risk management function within the Company is carried out in respect of financial risks. Financial risks are risks arising from financial instruments to which the Company is exposed during or at the end of the reporting period. Financial risk comprises market risk (including currency risk and interest rate risk), credit risk, concentration risk and liquidity risk. The primary objectives of the financial risk management function are to establish risk limits, and then ensure that exposure to risks stays within these limits.
The Board provides written principles for overall risk management, as well as written policies covering specific areas, such as foreign exchange risk, interest rate risk, and credit risk and investing excess liquidity. Key financial risk management reports are produced frequently and provided to the key management personnel of the Company.
Market riskMarket risk is the risk that the fair value or future cash flows of a financial instrument will fluctuate because of changes in market prices, and the Company’s investment risk. The sensitivities to market risks included below are based on a change in one factor while holding all other factors constant. In practice, this is unlikely to occur, and changes in some of the factors may be correlated – for example, changes in interest rates and changes in foreign currency rates.
Interest rate riskInterest rate risk is the risk that the fair value or future cash flows of a financial instrument will fluctuate because of changes in market interest rates. The Company invests in debt instruments, the fair values of which vary depending on market interest rates. At December 31, 2016, if interest rates at that date had been 50 basis points higher or lower with all other variables held constant, interest expense for the year would have been:
For the years ended December 31 2016 2015
(in thousands of U.S. dollars) 50 bps increase 50 bps decrease 50 bps increase 50 bps decrease
Interest expense $ 58 $ (58) $ 50 $ (50)
Interest rate risk arises from the Company’s financing arrangements (Note 7). Borrowings issued at variable rates expose the Company to cash flow interest rate risk. The Company does not have borrowings at fixed rates and therefore has no significant exposure to fair value interest rate risk.
Foreign currency riskThe Company has exposure to monetary and non-monetary foreign currency risk due to the effects of changes in foreign exchange rates related to consoli-dated Canadian subsidiaries, investments in Tricon Housing Partners, Tricon Luxury Residences, and cash and debt in Canadian dollars held at the corporate level. A 1% increase or decrease in the Canadian dollar exchange rate would result in the following impacts to assets and liabilities:
Potential impact of foreign currency fluctuation
December 31, 2016 1% increase 1% decrease
Assets
Investments – Tricon Housing Partners Canadian funds 95 (95)
Investments – Tricon Luxury Residences 264 (264)
359 (359)
Liabilities
Convertible debentures 551 (551)
551 (551)
December 31, 2015 1% increase 1% decrease
Assets
Investments – Tricon Housing Partners Canadian funds 84 (84)
Investments – Tricon Luxury Residences 38 (38)
122 (122)
Liabilities
Convertible debentures 513 (514)
Derivative financial instruments 84 (83)
597 (597)

38 Tricon Capital Group Annual Report 2016
NOTES TO THE CONSOLIDATED FINANCIAL STATEMENTSfor the year ended December 31, 2016 (in thousands of U.S. dollars, except per share amounts and percentage amounts)
The Company manages foreign currency risk by raising equity in Canadian dollars and by matching its principal cash outflows to the currency in which the principal cash inflows are denominated.
Credit riskCredit risk is the risk that one party to a financial instrument will cause financial loss for the other party by failing to discharge an obligation. Management believes the credit risk on cash is low because the counterparties are banks with high credit ratings. The Company has no significant concentrations of credit risk and its exposure to credit risk arises through loans and receivables which are due primarily from controlled subsidiaries. The loans and receivables due from subsidiaries are subject to the risk that the underlying real estate assets may not generate sufficient cash inflows in order to recover them. The Company manages this risk by:
• Ensuring a due diligence process is conducted on each investment prior to funding; • Approval of all loan disbursements by management;• Approval of total loan facilities by the Investment Committee; and • Actively monitoring the loan portfolio and initiating recovery procedures when necessary.
The Company assesses all counterparties, including its partners, for credit risk before contracting with them. The Company’s maximum exposure to credit risk is detailed in the table below. The Company does not include any collateral or other credit risk enhancers, which may reduce the Company’s exposure.
At December 31, 2016, the Company’s maximum exposure to credit risk was $21,101 (December 31, 2015 – $18,000). Through the equity portion of its invest-ments, the Company is also indirectly exposed to credit risk arising on loans advanced by investees to individual real estate development projects.
The Company provides loans to land developers, which are represented as debt investments. The credit quality of these investments is based on the finan-cial performance of the underlying real estate assets. For those assets that are not past due, it is believed that the capital repayments and interest payments will be made in accordance with the agreed terms and conditions. No terms or conditions have been renegotiated.
As at December 31, 2016, the assets held by the Company are not past due or impaired (2015 – nil).
For the year ended December 31, 2016, unrealized gain (losses) of nil (2015 – nil) are attributable to changes in credit risk of these debt instruments.
Concentration riskConcentration risk arises as a result of the potential concentration of exposures, by country, geographical location, product type, industry sector or counter-party type. The following is a summary of the Company’s concentration risk, based on the composition of the fair value of its investments – Tricon Housing Partners, Tricon American Homes, Tricon Lifestyle Communities, and Tricon Luxury Residences balances:
Province/State December 31, 2016 December 31, 2015
CanadaBritish Columbia $ 2,877 $ 2,298
Alberta 2,992 2,783
Ontario 30,109 7,101
USA
California 200,882 275,310
Arizona 104,503 93,788
Florida 73,707 68,368
North Carolina 67,511 58,860
South Carolina 17,654 12,781
Georgia 80,292 60,154
Nevada 46,318 46,863
Indiana 18,536 8,521
Texas 251,345 131,719
$ 896,726 $ 768,547

Tricon Capital Group Annual Report 2016 39
NOTES TO THE CONSOLIDATED FINANCIAL STATEMENTSfor the year ended December 31, 2016 (in thousands of U.S. dollars, except per share amounts and percentage amounts)
Liquidity riskLiquidity risk is the risk that an entity will have difficulty in meeting obligations associated with its financial liabilities as they fall due or can only do so on terms that are materially disadvantageous. Prudent liquidity risk management includes maintaining sufficient cash on hand and the availability of funding through an adequate amount of committed credit facilities. The Company uses long-term borrowings to finance its investment strategy for Tricon American Homes, Tricon Lifestyle Communities and Tricon Luxury Residences. Periodic cash flow forecasts are performed to ensure the Company has sufficient cash to meet operational and financing costs. Liquidity risk from the convertible debentures is mitigated by the Company’s option, under the terms of the debentures, to settle the obligation with shares.
The maturity analysis of the Company’s financial liabilities is as follows:
(in thousands of U.S. dollars)
As at December 31, 2016 Demand and
less than 1 year From 1 to 3 years From 3 to 5 years Later than 5 years Total
Liabilities
Amounts payable and accrued liabilities $ 10,892 $ – $ – $ – $ 10,892
Dividends payable 5,459 – – – 5,459
Revolving term credit facility – 113,750 – – 113,750
Debentures payable – – 63,852 – 63,852
Derivative financial instruments – – 28 – 28
Total $ 16,351 $ 113,750 $ 63,880 $ – $ 193,981
(in thousands of U.S. dollars)
As at December 31, 2015 Demand and
less than 1 year From 1 to 3 years From 3 to 5 years Later than 5 years Total
LiabilitiesAmounts payable and accrued liabilities $ 7,621 $ – $ – $ – $ 7,621
Dividends payable 4,857 – – – 4,857
Revolving term credit facility 20,000 – – – 20,000
Debentures payable – – 61,940 – 61,940
Total $ 32,478 $ – $ 61,940 $ – $ 94,418
During 2016, the change in the Company’s liquidity resulted in a working capital surplus of $20,920 (December 31, 2015 – deficit of $17,355). As of Decem- ber 31, 2016, the outstanding credit facility was $113,750 (December 31, 2015 – $20,000).
The details of the net current assets (liabilities) are shown below:
(in thousands of U.S. dollars) December 31, 2016 December 31, 2015
Cash $ 17,780 $ 4,493
Amounts receivable 16,892 8,088
Prepaid expenses and deposits 2,599 2,542
Current assets 37,271 15,123
Amounts payable and accruals 10,892 7,621
Dividends payable 5,459 4,857
Net current assets before undernoted 20,920 2,645
Revolving credit facility – 20,000
Net current assets (liabilities) $ 20,920 $ (17,355)
During the year ended December 31, 2016, the Company received distributions of $212,658 (2015 – $160,444) from its investments.

40 Tricon Capital Group Annual Report 2016
NOTES TO THE CONSOLIDATED FINANCIAL STATEMENTSfor the year ended December 31, 2016 (in thousands of U.S. dollars, except per share amounts and percentage amounts)
21. Capital management The Company’s objectives when managing capital are (i) to safeguard its ability to meet financial obligations and growth objectives, including future invest-ments; (ii) to provide an appropriate return to its shareholders; and (iii) to maintain an optimal capital structure that allows multiple financing options, should a financing need arise. The Company’s capital consists of debt, including bank debt, convertible debentures, demand credit facility, cash and share-holders’ equity. In order to maintain or adjust the capital structure, the Company manages equity as capital and may adjust the amount of dividends paid to shareholders, return capital to shareholders, issue new shares or sell assets.
As of December 31, 2016, the Company is in compliance with all financial covenants (Note 7).
22. CommitmentsThe Company has three lease commitments on office premises. The lease on office premises located at 1067 Yonge Street is with Mandukwe Inc., a related party (see Note 19). The Company also leases office equipment. The future minimum payments are as follows:
(in thousands of U.S. dollars) Office equipment Office leases Total
2017 $ 44 $ 207 $ 251
2018 37 231 268
2019 37 142 179
2020 37 29 66
2021 25 – 25
2022 and thereafter – – –
Total $ 180 $ 609 $ 789
During 2015, the Company entered into a contract to purchase an office space in a commercial building under development, for $9,917. The new office will be used as the Company’s head office upon completion. To date the Company has paid deposits of $1,892 with remaining future deposits to be paid as follows:
(in thousands of U.S. dollars) Amount
Commencement of finishing period $ 587
At close 7,438
$ 8,025
23. Working capital changes(in thousands of U.S. dollars)
For the years ended December 31 2016 2015
Amounts receivable $ (8,804) $ (2,573)
Prepaid expenses and deposits (57) (1,359)
Amounts payable and accruals 3,271 (10,956)
$ (5,590) $ (14,888)
Tricon Capital Group Annual Report 2016 41
NOTES TO THE CONSOLIDATED FINANCIAL STATEMENTSfor the year ended December 31, 2016 (in thousands of U.S. dollars, except per share amounts and percentage amounts)
24. IdemnificationPursuant to Indemnification Agreements with certain General Partners of Limited Partnerships managed by the Company and certain shareholders of the Company (who are also officers and directors of the Company), the Company has agreed to indemnify the General Partner and those shareholders and, where applicable, any of their directors, officers, agents and employees (collectively, the Indemnified Parties) for any past, present or future amounts paid or payable by any of the Indemnified Parties to the Limited Partnership in the form of a capital contribution or clawback guarantee relating to performance fees for any claim or obligation, as set out in the Limited Partnership Agreements. There are no amounts payable in respect of this indemnification as of December 31, 2016 (December 31, 2015 – $nil).
25. Variability of resultsThe nature of our business does not allow for consistent year-to-year revenue comparisons. Revenues earned from a fund are dependent upon where the fund is in its life cycle. At the beginning of the fund’s life cycle, consistent contractual fees and general partner distributions are earned to the end of the investment period. Subsequent to the investment period, contractual fees and general partner distributions start to decline as investments are realized. Performance fees that are earned at the end of the life cycle can vary significantly depending on fund performance, resulting in volatile revenue streams. Similarly, the performance of the Company’s investments carried at FVTPL may not be consistent from period to period.
26. Subsequent eventsSubsequent to year-end, TAH completed the acquisition of all of the minority interest in its real estate holdings and its property management entity.
On February 21, 2017, the Board of Directors of the Company declared a dividend of six and one half cents per share in Canadian dollars payable on April 14, 2017 to shareholders of record on March 31, 2017.

Tricon Capital Group Inc. 1067 Yonge Street
Toronto, Ontario M4W 2L2 T 416.925.7228 F 416.925.5022
www.triconcapital.com