unisystems information technology commercial consolidated ... · 2 opinion in our opinion, the...
TRANSCRIPT

Financial Statements at 31 December 2010
(1 January – 31 December 2010)
(Amounts in Euro thousands unless otherwise stated)
(Translation from an original text in Greek)
UniSystems Information Technology Commercial S.A.
Consolidated and Separate Financial Statements
for the Year 2012
(period from 1 January to 31 December 2012)
Compiled in accordance with
the International Financial Reporting Standards
(Translation from an original text in Greek)
Unisystems S.A. S.A. Reg.No. 1218 31201000
19-23 Al. Pantou Street GR-176 71 Kallithea
Athens - Hellas
March 2013

Financial Statements at 31 December 2012
(1 January – 31 December 2012)
(Amounts in Euro thousands unless otherwise stated)
(Translation from an original text in Greek)
Contents
Independent Auditor‟s Report 1
Statement of Financial Position 2
Income Statement 3
Statement of Comprehensive Income 4
Statement of Changes in Equity 4
Statement of Cash Flows 7
Notes to the financial statements 8
1. General Information 8
2. Summary of significant accounting policies 10
3. Financial risk management 24
4. Critical accounting estimates and judgments 28
5. Segmental information 29
6. Property, plant and equipment 30
7. Intangible assets 33
8. Investment property 35
9. Investments in subsidiaries 35
10. Investments in associates 37
11. Available-for-sale financial assets 37
12. Deferred income tax 38
13. Inventories 41
14. Trade and other receivable 42
15. Cash and cash equivalents 43
16. Equity 43
17. Retirement benefit obligations 45
18. Trade and other payables 46
19. Borrowings 47
20. Expenses by nature 48
21. Employee benefit expense 49
22. Other income/ (expenses) 49
23. Finance income and costs - net 50
24. Income tax expense 50
25. Cash generated from operations 52
26. Earnings per share 53
27. Commitments 53
28. Contingencies 54
29. Existing real liens 55
30. Related-party transactions 55
31. Events after the balance sheet date 56

1
Independent Auditor‟s Report
To the Shareholders of “UNISYSTEMS S.A.”
Report on the Separate and Consolidated Financial Statements
We have audited the accompanying separate and consolidated financial statements of “UNISYSTEMS S.A.”
and its subsidiaries which comprise the separate and consolidated statement of financial position as of 31
December 2012 and the separate and consolidated income statement and statement of comprehensive income,
statement of changes in equity and cash flow statement for the year then ended and a summary of significant
accounting policies and other explanatory information.
Management‟s Responsibility for the Separate and Consolidated Financial Statements
Management is responsible for the preparation and fair presentation of these separate and consolidated
financial statements in accordance with International Financial Reporting Standards, as adopted by the
European Union, and for such internal control as management determines is necessary to enable the
preparation of separate and consolidated financial statements that are free from material misstatement, whether
due to fraud or error.
Auditor‟s Responsibility
Our responsibility is to express an opinion on these separate and consolidated financial statements based on
our audit. We conducted our audit in accordance with International Standards on Auditing. Those standards
require that we comply with ethical requirements and plan and perform the audit to obtain reasonable assurance
about whether the separate and consolidated financial statements are free from material misstatement.
An audit involves performing procedures to obtain audit evidence about the amounts and disclosures in the
separate and consolidated financial statements. The procedures selected depend on the auditor's judgment,
including the assessment of the risks of material misstatement of the separate and consolidated financial
statements, whether due to fraud or error. In making those risk assessments, the auditor considers internal
control relevant to the entity's preparation and fair presentation of the separate and consolidated financial
statements in order to design audit procedures that are appropriate in the circumstances, but not for the
purpose of expressing an opinion on the effectiveness of the entity's internal control. An audit also includes
evaluating the appropriateness of accounting policies used and the reasonableness of accounting estimates
made by management, as well as evaluating the overall presentation of the separate and consolidated financial
statements.
We believe that the audit evidence we have obtained is sufficient and appropriate to provide a basis for our audit opinion.

2
Opinion
In our opinion, the separate and consolidated financial statements present fairly, in all material respects, the
financial position of the “UNISYSTEMS S.A.” and its subsidiaries as at 31 December 2012, and their financial
performance and cash flows for the year then ended in accordance with International Financial Reporting
Standards, as adopted by the European Union.
Reference on Other Legal and Regulatory Matters
We verified the conformity and consistency of the information given in the Board of Directors’ report with the accompanying separate and consolidated financial statements in accordance with the requirements of articles 43a, 108 and 37 of Codified Law 2190/1920.
Athens, 05/04/ 2013
The Certified Auditor Accountant
[SIGNED]
Certified Auditors
268 Kifisias Avenue
15232 Halandri,
Athens Greece Despoina Marinou
SOEL Reg. No. 113 Reg. No 17681

Financial Statements at 31 December 2012
(1 January – 31 December 2012)
(Amounts in Euro thousands unless otherwise stated)
(Translation from an original text in Greek)
2
Statement of Financial Position amounts in thousandEuro GROUP COMPANY
Note 31.12.2012 31.12.2011 31.12.2012 31.12.2011
ASSETS Non-current assets Own used property, plant and equipment 6 11.263 10.081 11.257 10.070 Intangible assets 7 544 567 577 680 Investment in property 8 6.100 6.110 6.100 6.110 Investments in subsidiaries 9 - - 99 261 Available-for-sale financial assets 11 375 927 375 927 Deferred income tax assets 12 490 959 482 931 Other long-term receivables 14 232 264 232 264
19.004 18.908 19.122 19.243
Current Assets Inventories 13 4.369 4.131 4.366 4.131 Trade and other receivables 14 49.601 42.693 49.374 42.654 Current income tax assets 534 1.219 531 1.216 Cash and cash equivalents 15 13.199 13.218 13.076 12.727
67.703 61.261 67.347 60.728
Total Assets 86.707 80.169 86.469 79.971
EQUITY 16 Capital and reserves attributable to equity holders Share Capital 12.000 12.000 12.000 12.000 Share premium 9.329 9.329 9.329 9.329 Other reserves 3.637 3.638 3.645 3.645 Retained earnings 14.783 14.587 14.707 14.552
39.749 39.554 39.681 39.526 Minority interests - - - -
Total equity 39.749 39.554 39.681 39.526
Liabilities Non-current liabilities Borrowings 19 1.867 - 1.867 - Deferred income tax liabilities 12 566 487 566 487 Retirement benefit obligations 17 1.781 1.976 1.781 1.976 Other non-current liabilities
4.214 2.463 4.214 2.463
Current liabilities Trade and other payables 18 37.872 32.522 37.702 32.352 Current income tax liabilities 249 585 249 585 Borrowings 19 4.623 5.045 4.623 5.045
Total current liabilities 42.744 38.152 42.574 37.982
Total Liabilities 46.958 40.615 46.788 40.445
Total Equity & Liabilities 86.707 80.169 86.469 79.971
The notes on pages 10 to 56 are an integral part of these financial statements.

Financial Statements at 31 December 2012
(1 January – 31 December 2012)
(Amounts in Euro thousands unless otherwise stated)
(Translation from an original text in Greek)
3
IInnccoommee SSttaatteemmeenntt
amounts in Euro thousands
GROUP COMPANY
From 1 January to From 1 January to
Note 31.12.2012 31.12.2011 31.12.2012 31.12.2011
Sales 5 61.576 63.857 61.375 63.506
Cost of sales 20 (49.185) (50.414) (49.287) (50.626)
Gross profit 12.391 13.443 12.088 12.880
Selling and marketing costs 20 (4.971) (5.362) (4.770) (5.103)
Administrative expenses 20 (4.935) (5.364) (4.818) (5.007)
Other income/(expense) - net 22 139 38 139 13
Other profit/(loss) - net 22 (1.018) (180) (1.097) (371)
Earnings/(loss) before taxes, financing and investing results 1.606 2.575 1.542 2.412
Finance income 23 265 107 259 99
Finance costs 23 (852) (639) (851) (634)
Finance costs – net 23 (587) (532) (592) (535)
Profit/(loss) before income tax 1.019 2.043 950 1.877
Income tax expense 24 (823) (1.660) (796) (1.590)
Profit/(loss) for the year 196 383 154 287
Attributable to:
Owners of the parent 196 383 154 287
Non controlling interests - - - -
196 383 154 287
Earnings/(loss) per share attributable to owners of the parent for the year (expressed in € per share)
Basic and diluted 26 0,0049 0,0096 0,0039 0,0072
The notes on pages 10 to 56 are an integral part of these financial statements.

Financial Statements at 31 December 2012
(1 January – 31 December 2012)
(Amounts in Euro thousands unless otherwise stated)
(Translation from an original text in Greek)
4
SSttaatteemmeenntt ooff CCoommpprreehheennssiivvee IInnccoommee
amounts in Euro thousands
GROUP COMPANY
From 1 January to From 1 January to
31.12.2010 31.12.2009 31.12.2010 31.12.2009
Profit/(loss) for the year net of tax 196 383 154 287 Total comprehensive profit/(loss) for the year net of tax 196 383 154 287
Attributable to:
Owners of the parent 196 383 154 287
Non controlling interests - - - -
196 383 154 287
The notes on pages 10 to 56 are an integral part of these financial statements.

Financial Statements at 31 December 2012
(1 January – 31 December 2012)
(Amounts in Euro thousands unless otherwise stated)
(Translation from an original text in Greek)
5
SSttaatteemmeenntt ooff CChhaannggeess iinn EEqquuiittyy
GROUP
amounts in Euro thousands
Attributable to owners of the parent Non
controlling interests
Total Equity
Share capital &
Share premium
Other reserves
Retained Earnings
Total
Balance at 1 January 2011 Note
21.329 3.531
14.312
39.172
-
39.172
Net income/expense for the year - - 383 383 - 383
Total recognised net income/expense for the year - - 383 383 - 383
Statutory reserves - 108 (108) - - Exchange gains/ (losses) from conversion of subsidiaries abroad -
(1) - (1) - (1)
Absorption/(Merger) of company 16 -
- - - - -
Balance at 31 December 2011
21.329
3.638
14.587
39.554
-
39.554
Net income/expense for the year - - 196 196 - 196
Total recognised net income/expense for the year - - 196 196 - 196
Statutory reserves - - - - - Exchange gains/ (losses) from conversion of subsidiaries abroad -
(1) - (1) - (1)
Absorption/(Merger) of company 16 -
- - - -
-
Othess - - - - - -
Balance at 31 December 2012
21.329
3.637
14.783
39.749
-
39.749
The notes on pages 10 to 56 are an integral part of these financial statements.

Financial Statements at 31 December 2012
(1 January – 31 December 2012)
(Amounts in Euro thousands unless otherwise stated)
(Translation from an original text in Greek)
6
COMPANY
amounts in Euro thousands
Share capital & Share premium
Other reserves
Retained Earnings
Total Equity
Balance at 1 January 2011 Note 21.329 3.536 14.191 39.056 Net income/expense of absorbed company recognised in Equity 182 182
Net income/expense for the year -
- 288 288
Total recognised net income/expense for the year
-
- 470 470
Statutory reserves
- 108 (108) -
Balance at 31 December 2011
21.329 3.644
14.553
39.526 470
Net income/expense for the year -
- 154 154
Total recognised net income/expense for the year
- - - -
Statutory reserves 16
- - - - Absorption/(Merger) of company
- - - -
Balance at 31 December 2012 21.329 3.644 14.707 39.680
The notes on pages 10 to 56 are an integral part of these financial statements.
Financial Statements at 31 December 2012
(1 January – 31 December 2012)
(Amounts in Euro thousands unless otherwise stated)
(Translation from an original text in Greek)
7
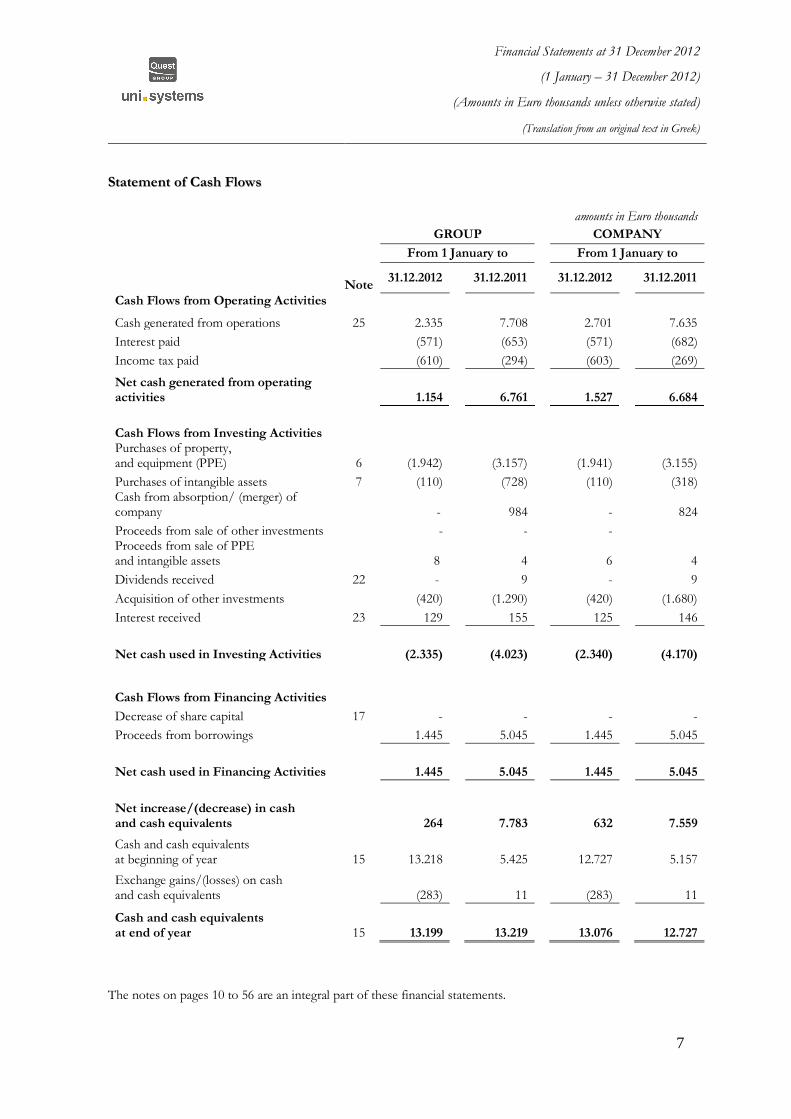
SSttaatteemmeenntt ooff CCaasshh FFlloowwss
amounts in Euro thousands
GROUP COMPANY
From 1 January to From 1 January to
Note 31.12.2012 31.12.2011 31.12.2012 31.12.2011
Cash Flows from Operating Activities
Cash generated from operations 25 2.335 7.708 2.701 7.635
Interest paid (571) (653) (571) (682)
Income tax paid (610) (294) (603) (269)
Net cash generated from operating activities 1.154 6.761 1.527 6.684
Cash Flows from Investing Activities Purchases of property, and equipment (PPE) 6 (1.942) (3.157) (1.941) (3.155)
Purchases of intangible assets 7 (110) (728) (110) (318) Cash from absorption/ (merger) of company - 984 - 824
Proceeds from sale of other investments - - - Proceeds from sale of PPE and intangible assets 8 4 6 4
Dividends received 22 - 9 - 9
Acquisition of other investments (420) (1.290) (420) (1.680)
Interest received 23 129 155 125 146
Net cash used in Investing Activities (2.335) (4.023) (2.340) (4.170)
Cash Flows from Financing Activities
Decrease of share capital 17 - - - -
Proceeds from borrowings 1.445 5.045 1.445 5.045
Net cash used in Financing Activities 1.445 5.045 1.445 5.045
Net increase/(decrease) in cash and cash equivalents 264 7.783 632 7.559
Cash and cash equivalents at beginning of year 15 13.218 5.425 12.727 5.157
Exchange gains/(losses) on cash and cash equivalents (283) 11 (283) 11
Cash and cash equivalents at end of year 15 13.199 13.219 13.076 12.727
The notes on pages 10 to 56 are an integral part of these financial statements.

Financial Statements at 31 December 2012
(1 January – 31 December 2012)
(Amounts in Euro thousands unless otherwise stated)
(Translation from an original text in Greek)
8
Notes to the financial statements 1.1 General Information
The Financial Statements comprise the separate financial statements of Unisystems Information Technology
SA (the “Company”) and the consolidated financial statements of the Company and its subsidiaries (the
“Group”) as of 31 December 2012, according to the International Financial Reporting Standards (“IFRS”). The
names of these subsidiaries are set out in Note 1.2.
The Companies of the group are engaged in the field of information technology and especially in providing
integrated data processing and network services and solutions, covering equipment and software and in the
implementation of large-scale projects.
The Company is domiciled in Kallithea and the address of its registered office is 19-23 Al. Pantou Street and its
web site address is www.unisystems.com.
The financial statements of "Unisystems Information Technology SA" are included by the full consolidation
method in the consolidated financial statements of Quest Holdings SA with registered office in Kallithea-
Athens, which at 31.12.2012 participates in the Company, holding a percentage of 100%.
In brief, the basic information for the Company is as follows:
Board of Directors Theodore D. Fessas Chairman Supervisory Authority
Prefecture of Athens
Companies Register No.
1447/01ΝΤ/Β/86/331(08)
Tax Payers No. 094029552
Ioannis K. Loumakis Vice Chairman &
Managing Director Markos G. Bitsakos Vice Chairman
Dimitrios A. Karageorgis Member
Stylianos Ch. Avlichos Member
The term of the Board of Directors ends on 17.05.2016.
The Board of Directors of the Company approved the annual financial statements of the Group and the Company for the 42ndh financial year ended 31 December 2012, at its meeting held on 21st of March 2013.

Financial Statements at 31 December 2012
(1 January – 31 December 2012)
(Amounts in Euro thousands unless otherwise stated)
(Translation from an original text in Greek)
9
1.2 Structure Of The Group
Financial Statements at 31 December 2012
(1 January – 31 December 2012)
(Amounts in Euro thousands unless otherwise stated)
(Translation from an original text in Greek)
10
2. Summary of significant accounting policies
2.1 Basis of preparation of financial statements
The financial statements of “Unisystems Information Technology SA” at 31 December 2012, covering the 42th
financial year from 1 January to 31 December 2012, have been prepared by Management under the historical
cost convention, as modified by the revaluation of certain assets and liabilities items at fair value, and are in
accordance with International Financial Reporting Standards (IFRS), that are prescribed by the International
Accounting Standards Board (IASB), as well as their interpretations, as published by the International Financial
Reporting Interpretations Committee (I.F.R.I.C.) of the IASB and which have been endorsed by the European
Union.
The accounting policies applied in the preparation and presentation of these financial statements of the
Company and the Group for the year ended 31 December 2012, are consistent with the accounting policies
applied in the previous year (2011).
The preparation of financial statements in conformity with IFRS requires the use of certain critical accounting
estimates and management to exercise its judgement in the process of applying the Company’s policies. It also
requires the use of estimates and assumptions that have a significant risk of causing a material adjustment to the
carrying amounts of assets and liabilities, the disclosure of contingent assets and liabilities at the date of
preparation of financial statements and the reported amounts of revenue and expenses during the reporting
year. Despite the fact that these estimates are based on Management’s best possible knowledge with respect to
current circumstances and actions, the related actual results may finally differ to those estimates.
New standards, amendments to standards and interpretations: Certain new standards, amendments to standards and interpretations have been issued that are mandatory for periods beginning during the current financial year and subsequent years. The Group’s evaluation of the effect of these new standards, amendments to standards and interpretations is as follows:
Standards and Interpretations effective for the current financial year
IFRS 7 (Amendment) “Financial Instruments: Disclosures” – transfers of financial assets
This amendment sets out disclosure requirements for transferred financial assets not derecognised in their entirety as well as on transferred financial assets derecognised in their entirety but in which the reporting entity has continuing involvement. It also provides guidance on applying the disclosure requirements. This amendment does not affect the Group’s financial statements.
Standards and Interpretations effective from periods beginning on or after 1 January 2013
IFRS 9 “Financial Instruments” (effective for annual periods beginning on or after 1 January 2015)
IFRS 9 is the first Phase of the Board’s project to replace IAS 39 and deals with the classification and measurement of financial assets and financial liabilities. The IASB intends to expand IFRS 9 in subsequent phases in order to add new requirements for impairment and hedge accounting. The Group is currently investigating the impact of IFRS 9 on its financial statements. The Group cannot currently early adopt IFRS 9 as it has not been endorsed by the EU. Only once approved will the Group decide if IFRS 9 will be adopted prior to 1 January 2015.
IAS 12 (Amendment) “Income Taxes” (Effective for annual periods beginning on or after 1 January 2013)

Financial Statements at 31 December 2012
(1 January – 31 December 2012)
(Amounts in Euro thousands unless otherwise stated)
(Translation from an original text in Greek)
11
The amendment to IAS 12 provides a practical approach for measuring deferred tax liabilities and deferred tax assets when investment property is measured using the fair value model in IAS 40 “Investment Property”. This amendment is not relevant to the Group.
IFRS 13 “Fair Value Measurement” (Effective for annual periods beginning on or after 1 January 2013)
IFRS 13 provides new guidance on fair value measurement and disclosure requirements. These requirements do not extend the use of fair value accounting but provide guidance on how it should be applied where its use is already required or permitted by other standards within IFRSs. IFRS 13 provides a precise definition of fair value and a single source of fair value measurement and disclosure requirements for use across IFRSs. Disclosure requirements are enhanced and apply to all assets and liabilities measured at fair value, not just financial ones.
IFRIC 20 “Stripping costs in the production phase of a surface mine” (Effective for annual periods beginning on or after 1 January 2013)
This interpretation sets out the accounting for overburden waste removal (stripping) costs in the production phase of a mine. The interpretation may require mining entities to write off existing stripping assets to opening retained earnings if the assets cannot be attributed to an identifiable component of an ore body. IFRIC 20 applies only to stripping costs that are incurred in surface mining activity during the production phase of the mine, while it does not address underground mining activity or oil and natural gas activity.
IAS 1 (Amendment) “Presentation of Financial Statements” (effective for annual periods beginning on or after 1 July 2012)
The amendment requires entities to separate items presented in other comprehensive income into two groups, based on whether or not they may be recycled to profit or loss in the future.
IAS 19 (Amendment) “Employee Benefits” (effective for annual periods beginning on or after 1 January 2013)
This amendment makes significant changes to the recognition and measurement of defined benefit pension expense and termination benefits (eliminates the corridor approach) and to the disclosures for all employee benefits. The key changes relate mainly to recognition of actuarial gains and losses, recognition of past service cost / curtailment, measurement of pension expense, disclosure requirements, treatment of expenses and taxes relating to employee benefit plans and distinction between “short-term” and “other long-term” benefits.
IFRS 7 (Amendment) “Financial Instruments: Disclosures” (effective for annual periods beginning on or after 1 January 2013)
The IASB has published this amendment to include information that will enable users of an entity’s financial statements to evaluate the effect or potential effect of netting arrangements, including rights of set-off associated with the entity’s recognised financial assets and recognised financial liabilities, on the entity’s financial position.
IAS 32 (Amendment) “Financial Instruments: Presentation” (effective for annual periods beginning on or after 1 January 2014)
This amendment to the application guidance in IAS 32 clarifies some of the requirements for offsetting financial assets and financial liabilities on the statement of financial position.
Group of standards on consolidation and joint arrangements (effective for annual periods beginning on or after 1 January 2014)

Financial Statements at 31 December 2012
(1 January – 31 December 2012)
(Amounts in Euro thousands unless otherwise stated)
(Translation from an original text in Greek)
12
The IASB has published five new standards on consolidation and joint arrangements: IFRS 10, IFRS 11, IFRS 12, IAS 27 (amendment) and IAS 28 (amendment). These standards are effective for annual periods beginning on or after 1 January 2014. Earlier application is permitted only if the entire “package” of five standards is adopted at the same time. The Group is in the process of assessing the impact of the new standards on its consolidated financial statements. The main provisions are as follows:
IFRS 10 “Consolidated Financial Statements”
IFRS 10 replaces all of the guidance on control and consolidation in IAS 27 and SIC 12. The new standard changes the definition of control for the purpose of determining which entities should be consolidated. This definition is supported by extensive application guidance that addresses the different ways in which a reporting entity (investor) might control another entity (investee). The revised definition of control focuses on the need to have both power (the current ability to direct the activities that significantly influence returns) and variable returns (can be positive, negative or both) before control is present. The new standard also includes guidance on participating and protective rights, as well as on agency/ principal relationships.
IFRS 11 “Joint Arrangements”
IFRS 11 provides for a more realistic reflection of joint arrangements by focusing on the rights and obligations of the arrangement, rather than its legal form. The types of joint arrangements are reduced to two: joint operations and joint ventures. Proportional consolidation of joint ventures is no longer allowed. Equity accounting is mandatory for participants in joint ventures. Entities that participate in joint operations will follow accounting much like that for joint assets or joint operations today. The standard also provides guidance for parties that participate in joint arrangements but do not have joint control.
IFRS 12 “Disclosure of Interests in Other Entities”
IFRS 12 requires entities to disclose information, including significant judgments and assumptions, which enable users of financial statements to evaluate the nature, risks and financial effects associated with the entity’s interests in subsidiaries, associates, joint arrangements and unconsolidated structured entities. An entity can provide any or all of the above disclosures without having to apply IFRS 12 in its entirety, or IFRS 10 or 11, or the amended IAS 27 or 28.
IAS 27 (Amendment) “Separate Financial Statements”
This Standard is issued concurrently with IFRS 10 and together, the two IFRSs supersede IAS 27 “Consolidated and Separate Financial Statements”. The amended IAS 27 prescribes the accounting and disclosure requirements for investment in subsidiaries, joint ventures and associates when an entity prepares separate financial statements. At the same time, the Board relocated to IAS 27 requirements from IAS 28 “Investments in Associates” and IAS 31 “Interests in Joint Ventures” regarding separate financial statements.
IAS 28 (Amendment) “Investments in Associates and Joint Ventures”
IAS 28 “Investments in Associates and Joint Ventures” replaces IAS 28 “Investments in Associates”. The objective of this Standard is to prescribe the accounting for investments in associates and to set out the requirements for the application of the equity method when accounting for investments in associates and joint ventures, following the issue of IFRS 11.
IFRS 10, IFRS 11 and IFRS 12 (Amendment) “Consolidated financial statements, joint arrangements
and disclosure of interests in other entities: Transition guidance” (effective for annual periods beginning on or after 1 January 2013)
The amendment to the transition requirements in IFRSs 10, 11 and 12 clarifies the transition guidance in IFRS 10 and limits the requirements to provide comparative information for IFRS 12 disclosures only to the period that immediately precedes the first annual period of IFRS 12 application. Comparative disclosures are not

Financial Statements at 31 December 2012
(1 January – 31 December 2012)
(Amounts in Euro thousands unless otherwise stated)
(Translation from an original text in Greek)
13
required for interests in unconsolidated structured entities. These amendments have not yet been endorsed by the EU.
IFRS 10, IFRS 12 and IAS 27 (Amendment) “Investment entities” (effective for annual periods beginning on or after 1 January 2014)
The amendment to IFRS 10 defines an investment entity and introduces an exception from consolidation. Many funds and similar entities that qualify as investment entities will be exempt from consolidating most of their subsidiaries, which will be accounted for at fair value through profit or loss, although controlled. The amendments to IFRS 12 introduce disclosures that an investment entity needs to make. These amendments have not yet been endorsed by the EU.
Amendments to standards that form part of the IASB’s 2011 annual improvements project
The amendments set out below describe the key changes to IFRSs following the publication in May 2012 of the results of the IASB’s annual improvements project. These amendments are effective for annual periods beginning on or after 1 January 2013 and have not yet been endorsed by the EU.
IAS 1 “Presentation of financial statements”
The amendment clarifies the disclosure requirements for comparative information when an entity provides a third balance sheet either (a) as required by IAS 8 “Accounting policies, changes in accounting estimates and errors” or (b) voluntarily.
IAS 16 “Property, plant and equipment”
The amendment clarifies that spare parts and servicing equipment are classified as property, plant and equipment rather than inventory when they meet the definition of property, plant and equipment, i.e. when they are used for more than one period.
IAS 32 “Financial instruments: Presentation”
The amendment clarifies that income tax related to distributions is recognised in the income statement and income tax related to the costs of equity transactions is recognised in equity, in accordance with IAS 12.
IAS 34, „Interim financial reporting‟
The amendment clarifies the disclosure requirements for segment assets and liabilities in interim financial statements, in line with the requirements of IFRS 8 “Operating segments”.
2.2 Basis of consolidation
(a) Subsidiaries
Subsidiaries are all entities over which the Group, directly or indirectly, has the power to govern the financial
and operating policies. Subsidiaries are fully consolidated (full consolidation) from the date on which control is
transferred to the group and they are de-consolidated from the date that control ceases.
The purchase method of accounting is used to account for the acquisition of subsidiaries by the group. The
cost of an acquisition is measured, as the fair value of the assets given, equity instruments issued and liabilities
incurred or assumed at the date of exchange, plus costs directly attributable to the acquisition. Identifiable
assets acquired and liabilities and contingent liabilities assumed in a business combination are measured initially

Financial Statements at 31 December 2012
(1 January – 31 December 2012)
(Amounts in Euro thousands unless otherwise stated)
(Translation from an original text in Greek)
14
at their fair values at the acquisition date, irrespective of the extent of the participation percentage. The excess
of the cost of acquisition over the fair value of the group’s share of the identifiable net assets acquired is
recognised as goodwill. If the cost of acquisition is less than the fair value of the net assets of the subsidiary
acquired, the difference is recognised directly in the income statement.
Inter-company transactions, balances and unrealised gains on transactions between group companies are
eliminated. Unrealised losses are also eliminated but considered an impairment indicator of the asset
transferred. Accounting policies of subsidiaries have been changed where necessary to ensure consistency with
the policies endorsed by the Group.
The Company recognises the investments in associates in the separate financial statements at cost net of any
impairment loss.
The Subsidiary which is fully consolidated to the group is Unisystems Cyprus S.A and which incorporates the
Financial Statements of its subsidiaries Unisystems Bulgaria Ltd and Unisystems Information Technology
Systems SRL.
(b) Joint Ventures
The Company participates at 31.12.2012 in the Joint-Ventures:
Joint-Venture Unisystems AE – Singular Logic AE Athens, undertaken project the Computerization of the
Central Department of the Penal Register of the Ministry of Justice and
Joint-Venture Unisystems AE – Singular Logic AE Athens, undertaken project the Computerization of the
Department of the Penal Register with the Court of First Instance Prosecutor’s Office of six cities.
Joint-Venture ALTEC-INFO QUEST-INTRACOM ΙΤ SERVICES-PC SYSTEMS with distinctive name
“K.O.E.P.”: J-V for Integrated IT projects.
Joint-Venture "Info Quest-ALGOSYSTEMS AE".
Joint-Venture "Info Quest-SPACE HELLAS ".
It is noted that, the above Joint-Ventures:
a) Have been established, according to the legislation in force, for tax purposes and no participating interest
exists between the Company and these Joint-Ventures.
b) Have all the characteristics of jointly controlled operations, as provided for by IAS 31 par. 13 and 14.
c) The Company, through relative billing, has recognised in the separate financial statements the proportion
of its net fee (proportional income less expenses) on the above-mentioned projects that have been
executed by the Joint Ventures until 31.12.2012. Therefore, the proportionate consolidation of these Joint
Ventures has been realised in the separate financial statements of the Company, as relatively provided for
in IAS 31 paragraph 15.
For the above-mentioned reasons, these Joint Ventures were not included in the consolidation.
(c) Associates
Associates are all entities over which the Group has significant influence but not control, generally
accompanying a shareholding of between 20% and 50% of the voting rights. Investments in associates are

Financial Statements at 31 December 2012
(1 January – 31 December 2012)
(Amounts in Euro thousands unless otherwise stated)
(Translation from an original text in Greek)
15
accounted for using the equity method of accounting and are initially recognised at cost. The account
investment in associates includes and the goodwill identified on acquisition (net of any impairment loss).
The Group’s share of its associates’ post-acquisition profits or losses is recognised in the income statement, and
its share of post-acquisition movements in reserves is recognised in reserves. The cumulative post-acquisition
movements are adjusted against the carrying amount of the investment. When the group’s share of losses in an
associate equals or exceeds its interest in the associate, the group does not recognise further losses, unless it has
incurred obligations or made payments on behalf of the associate.
Unrealised gains on transactions between the Group and the associates are eliminated to the extent of the
Group’s interest in the associates. Accounting policies of associates have been changed where necessary to
ensure consistency with the policies endorsed by the Group.
Even if the Group has certain investments where its shareholding is between 20% and 50% however it cannot
have significant influence on these entities, since the other shareholders either individually or in agreement
between them control these entities. For this reason, the Group classifies the above-mentioned investments as
available-for-sale financial assets.
2.3 Foreign currency translation
(a) Functional and presentation currency
Items included in the financial statements of each of the Group’s companies are measured using the currency
of the primary economic environment in which the company operates (“the functional currency”). The
consolidated financial statements are presented in Euro thousands, which is the functional measurement
currency and the presentation currency of the parent Company as well as of the Group’s companies.
(b) Transactions and balances
Foreign currency transactions are translated into the functional currency using the exchange rates prevailing at
the dates of the transactions. Foreign exchange gains and losses resulting from the settlement of such
transactions and from the translation at year-end exchange rates of monetary assets and liabilities denominated
in foreign currencies are recognised in the income statement. Translation differences on non-monetary financial
assets and liabilities measured at their fair value, are reported as part of the fair value and consequently are
recognised where also the fair value gain or loss.
2.4 Property, plant and equipment
The property, plant and equipment is stated at historical cost less accumulated depreciation and any impairment
loss. Historical cost includes expenditure that is directly attributable to the acquisition of the items.
Subsequent costs are included in the asset’s carrying amount or recognised as a separate asset, as appropriate,
only when it is probable that future economic benefits associated with the item will flow to the Group and the
cost of the item can be measured reliably. The carrying amount of the replaced part is derecognised. The repairs

Financial Statements at 31 December 2012
(1 January – 31 December 2012)
(Amounts in Euro thousands unless otherwise stated)
(Translation from an original text in Greek)
16
and maintenance costs are charged to the income statement during the financial period in which they are
incurred.
Land is not depreciated. Depreciation on other assets is calculated using the straight-line method by equal
annual charges over the estimated useful life of the asset, thus the cost to be written down to its residual value.
The cost method, as analysed above, is used and for the valuation of investment property.
The estimated useful life of assets has as follows:
Buildings 50 years
Machinery-technical installations and other
mechanical equipment
λοιπός μηχανολογικός εξοπλισμός
1-7 years
Vehicles 5-8 years
Furniture, fittings and equipment 1-7 Years
The assets’ residual values and useful lives are reviewed and adjusted if appropriate at each balance sheet date.
An asset’s carrying amount is written down immediately to its recoverable amount if the asset’s carrying amount
is greater than its estimated recoverable amount.
Gains and losses on disposals are determined by comparing the proceeds with the carrying amount and are
recognised as gains or losses in the income statement.
The PPE classified as “Investment Property” is valued using the cost method.
2.5 Intangible assets
(a) Goodwill
Goodwill represents the excess of the cost of an acquisition over the fair value of the Group’s share of the net
identifiable assets of the acquired subsidiary/associate at the date of acquisition. Goodwill on acquisitions of
subsidiaries is included in “Intangible assets”. Goodwill on acquisitions of associates is induced in “investments
in associates” and is tested for impairment as part of the overall balance. Separately recognised goodwill is
tested annually for impairment and carried at cost less accumulated impairment losses. Impairment losses on
goodwill are not reversed. Gains and losses on the disposal of an entity include the carrying amount of goodwill
relating to the entity sold. Goodwill is allocated to cash-generating units for the purpose of impairment testing.
An impairment loss is recognised for the amount by which the asset’s net carrying amount exceeds its
recoverable amount. Gains or losses arising from sale of a company include the goodwill of the company sold.
Impairment losses are recognised as an expense in the income statement when they arise and they are not
reversed.
(b) Trademarks and licences
Acquired trademarks and licences are shown at historical cost less amortisation and any impairment loss.
Amortisation is calculated using the straight-line method over the estimated useful lives of the assets, 3 to 5
years.

Financial Statements at 31 December 2012
(1 January – 31 December 2012)
(Amounts in Euro thousands unless otherwise stated)
(Translation from an original text in Greek)
17
(c) Computer software
Acquired computer software licences are measured at cost less amortisation and any impairment loss.
Amortisation is calculated using the straight-line method over the estimated useful life of the assets, which is 4
years.
Costs that are directly associated with the development of software where the findings of the research are
applied to a plan or design for the production of new or substantially improved products and process, are
capitalised only when the product or process is technically and commercially feasible and the Company has
adequate resources to complete the development. The capitalised cost, fully documented, includes the cost of
materials, the direct labour and an appropriate portion of relevant overheads. All other development costs are
recognised in the income statement when they incur. The capitalised development costs are stated at cost less
the accumulated depreciation and their impairment losses. Amortisation is calculated using the straight-line
method over their estimated useful lives 3 to 5 years.
It is deemed that the present value of the anticipated net cash flows from the use or distribution of intangible
assets does not fall short of their respective carrying amounts at 31.12.2012.
2.6 Impairment of non-financial assets
Assets that have an indefinite useful life, for example goodwill, are not subject to amortisation and are tested
annually for impairment. Assets that are subject to amortisation are reviewed for impairment whenever events
or changes in circumstances indicate that the carrying amount may not be recoverable. The recoverable amount
is the higher of an asset’s fair value less costs to sell and value in use. For the purposes of assessing impairment,
assets are grouped at the lowest levels for which there are separately identifiable cash flows (cash-generating
units). An impairment loss is recognised as an expense in the income statement in the year it incurs. Non-
financial assets (other than goodwill) that suffered any impairment are reviewed for possible reversal of the
impairment at each reporting date.
2.7 Financial assets
The investments of the Group are classified in the following categories depending on the purpose for which the
financial assets were acquired. Management determines the appropriate classification of the investment at initial
recognition and reviews the classification at each reporting date.
(a) Loans and receivables
Loans and receivables are non-derivative financial assets with fixed or determinable payments that are not
quoted in an active market. They are included in current assets, except for maturities greater than 12 months
after the balance sheet date. These are classified as non-current assets. The group’s loans and receivables are
presented in the balance sheet classified as “Other non-current receivables”, “Trade receivables”, “Other
receivables”, and “Cash and cash equivalents”.
(b) Available-for-sale financial assets
Available-for-sale financial assets are non-derivatives that are either designated in this category or not classified
in any of the other categories since these are not held for trading and are not generated by the Company or
held-to-maturity. They are included in non-current assets unless Management intends to dispose of the

Financial Statements at 31 December 2012
(1 January – 31 December 2012)
(Amounts in Euro thousands unless otherwise stated)
(Translation from an original text in Greek)
18
investment within 12 months of the balance sheet date. Purchases and sales of financial assets are recognised
on the trade -date- the date on which the Group commits to purchase or sell the asset. Investments are initially
recognised at fair value plus transaction costs. Financial assets are derecognised when the rights to receive cash
flows from the investments have expired or have been transferred and the group has transferred substantially
all risks and rewards of ownership.
Un-realised gains or losses arising from changes in the fair value of the “Available-for-sale financial assets”
category are recognised in revaluation reserve of investments. When assets classified as available-for-sale are
sold or impaired, the accumulated fair value adjustments recognised in equity are removed to income statement.
The fair values of financial assets traded in active markets are based on current bid prices. The Group
establishes fair value by using valuation techniques if the market for a financial asset is not active and for
unlisted securities. These include the use of recent arm’s length transactions, reference to other instruments that
are substantially the same and discounted cash flow analysis adjusted so as to reflect the entity-specific inputs.
At each balance sheet date the Group assesses whether there is objective evidence that a financial asset or
group of financial assets is impaired. For equity securities classified as financial assets available-for-sale, such
evidence is a significant or prolonged decline in the fair value of the share below its cost. If such evidence
exists, the cumulative loss-measured as the difference between the acquisition cost and the current fair value,
less any impairment loss on that financial asset previously recognised in profit or loss, is removed from equity
(revaluation reserve) and recognised in the income statement. Impairment losses of equity securities recognised
in the income statement are not reversed through the income statement.
2.8 Inventories
Inventories are stated at the lower of cost and net realisable value. Net realisable value is the estimated selling
price in the ordinary course of business, less applicable completion cost and selling expenses.
The cost of inventories is determined using the average weighted cost method. Cost of inventories does not
include finance expenses.
Sufficient provisions are set up for obsolete and useless inventories. The decreases of the value of inventories
as net realisable value are recognised in the income statement during the period they are presented.
2.9 Trade receivables
Trade receivables, are recognised initially at fair value and subsequently measured at amortised cost using the
effective interest method, less provision or impairment. A provision for impairment of trade receivables is
established when there is objective evidence that the Group will not be able to collect all amounts due
according to the original terms of the receivables. The amount of the provision is the difference between the
asset’s carrying amount and the present value of estimated future cash flows, discounted at the original effective
interest rate. The amount of the loss is recognised in the income statement within “Selling and marketing
costs”. When a trade receivable is un-collectible, it is written off against the allowance account for trade
receivables. Subsequent recoveries of amounts previously written off are credited against “Selling and marketing
costs” in the income statement.

Financial Statements at 31 December 2012
(1 January – 31 December 2012)
(Amounts in Euro thousands unless otherwise stated)
(Translation from an original text in Greek)
19
2.10 Cash and cash equivalents
Cash and cash equivalents include cash in hand, current deposits with banks and bank overdrafts as well as
other short-term highly liquid investments with maturities of three months and low risk. Bank overdrafts are
shown within borrowings in current liabilities on the balance sheet.
2.11 Non-current assets held for sale and discontinued operations
The non-current assets (or group of assets held for sale) are classified as assets management intends to dispose
of if their carrying amount will be recovered mainly through their sale and not from their continued use.
Assets held for sale are measured at the lower between carrying amount and fair value impaired by the cost of
sale and their amortisation ceases from the date of their classification in this category.
2.12 Share capital
Ordinary shares are classified as equity.
Incremental costs directly attributable to the issue of new shares are shown in equity as a deduction, net of tax,
from the proceeds. Incremental costs directly attributable to the issue of new shares for acquisition of
enterprises are included in cost of the enterprise that is acquired.
The consideration paid for the purchase of treasury shares is deducted from equity attributable to company’s
equity holders until the treasury shares are cancelled, reissued or disposed of. Any gain or loss from sale of
treasury shares net of any directly attributable incremental transaction costs and the related income tax effect is
included in equity as reserve.
2.13 Borrowings
Borrowings are recognised initially at fair value, net of transaction costs incurred. Subsequently are stated at
amortised cost using the effective interest method. Any difference between the proceeds (net of transaction
costs) and the redemption value is recognised in the income statement over the period of the borrowings using
the effective interest method.
Borrowings are classified as current liabilities unless the Group has an unconditional right to defer settlement of
the liability for at least 12 months after the balance sheet date.
2.14 Current and deferred income tax
The Income tax charge for the year includes the current and the deferred tax, that is the tax or the tax relief
relating to the economic benefits arising in the year but have already been allocated or will be allocated by the
tax authorities in different years.
Current income tax includes the current liabilities to the tax authorities relating to the payable taxes on the
taxable income for the year and any additional income tax concerning previous years.

Financial Statements at 31 December 2012
(1 January – 31 December 2012)
(Amounts in Euro thousands unless otherwise stated)
(Translation from an original text in Greek)
20
The current income tax charge is calculated according to the effective tax rates and the tax laws enacted in the
fiscal years to which they relate, based on the year’s taxable profit.
Deferred income tax is provided in full, using the liability method, on temporary differences arising between the
tax bases of assets and liabilities and their carrying amounts in the financial statements. However, the deferred
income tax is not accounted for if it arises from initial recognition of an asset or liability in a transaction other
than a business combination that at the time of the transaction affects neither accounting nor taxable profit nor
loss.
Deferred income tax is determined using tax rates (and laws) that have been enacted or substantially enacted by
the balance sheet date and are expected to apply when the related deferred income tax asset is realised or the
deferred income tax liability is settled. In case it is not possible to determine the time of reversal of the
temporary tax differences, the tax rate used is that of the fiscal year following that of the balance sheet.
Deferred income tax assets are recognised to the extent that it is probable that future taxable profit will be
available against which the temporary differences can be utilised.
Deferred income tax is provided on temporary differences arising on investments in subsidiaries and associates,
except where the Group controls the timing of the reversal of the temporary difference and it is probable that
the temporary difference will not reverse in the foreseeable future.
Deferred income tax constitutes an expense, which is recognised in the Income Statement, if the transactions
and financial events that concern this tax effect are recognised also in the Income Statement. Deferred income
tax constitutes an expense, which is directly recognised in Equity, if the transactions and financial events that
concern this tax effect are recognised also in Equity.
Income tax assets and liabilities (current and deferred) are offset when there is a legally enforceable right to
offset current tax assets against current tax liabilities and when the deferred income taxes relate to the same
fiscal authority.
2.15 Employee benefits
(a) Short-term benefits
Short-term benefits to employees (except for termination or retirement) in money or in kind are recognised as
an expense when they are accrued. Any outstanding amounts are recognised as a liability, while in the case
where the amount already paid exceeds the amount of the benefits, the Company recognises the excessive
amount as an assets item (prepaid expense), only to the extent that the prepayment will lead to a reduction of
future payments or to a refund.
(b) Post-employment benefits
Post-employment benefit schemes comprise both defined contribution plans and defined benefit plans.
Defined contribution plans
Based on the defined contribution plan, the Company’s obligation (legal) is restricted to the amount that has
been agreed to contribute to the Social Security Fund, which manages the contributions and grants the benefits
(pensions, Medicare, etc.) and as a consequence the Group has no further payment obligations once the
contributions have been paid in circumstances where the State Fund is unable to pay pensions to the retired.

Financial Statements at 31 December 2012
(1 January – 31 December 2012)
(Amounts in Euro thousands unless otherwise stated)
(Translation from an original text in Greek)
21
The accrued cost of the defined contribution plans is recognised as an expense in the period it concerns.
Defined Benefit Plans
According to the Greek labour law, the employees are entitled to termination benefits when employment is
terminated, the value of which depends on their annual compensation, years of service in the Company and
reason for employment termination (dismissal or retirement). In case of resignation or justified dismissal this
right does not apply. The payable amount at retirement amounts to 40% of the total amount that is paid in case
of unjustified dismissal. This plan is a defined benefit plan for the employer and it is not funded.
Independent actuaries, using the projected unit credit method, calculate the commitment annually. A defined
benefit plan is a pension-plan that is not a defined contribution plan. Typically, defined benefit plans define an
amount of pension benefit that an employee will receive on retirement, usually dependent on one or more
factors such as age, years of service and compensation. The provisions that concern the current year, are
included in the respective employee cost in the accompanying income statement and consist of the current
service cost, the relative finance cost, the actuarial gains and losses that are recognised and whatever probable
additional charges.
Actuarial gains and losses arising from experience adjustments and changes and are above or below the margin
of 10% of accumulated obligation, are recognised as an expense over the expected average working lives of
existing employees.
Past-service costs are recognised immediately in income, unless the changes to the pension plan are conditional
on the employee remaining in service for a specified period of time (the vesting period). In this case, the past-
service costs are amortised on a straight-line basis over the vesting period.
(c) Employee termination benefits
The benefits due to termination of the employment relationship are paid when employees leave before their
normal retirement date. The Group records such benefits when it is committed, either when it actually
terminates the employment of current employees based upon a detailed formal plan without possibility of
withdrawal, or when it provides the said benefits as an incentive for voluntary redundancy. When these benefits
are due for payment in a period, which exceeds twelve months from the balance sheet date, they are prepaid in
their present value. In case of an employment termination where the number of employees that will be using
those benefits cannot be determined, they are not recorded but presented as contingent liability.
2.16 Government Grants
Grants from the government are recognised at their fair value where there is a reasonable assurance that the
grant will be received and the Group will comply with all attached conditions. Government grants relating to
costs are deferred and recognised in the income statement over the period necessary to match them with the
costs that they are intended to compensate. Government grants relating to property, plant and equipment are
included in non-current liabilities as deferred government grants and are credited to the income statement on a
straight-line basis over the expected lives of the related assets.

Financial Statements at 31 December 2012
(1 January – 31 December 2012)
(Amounts in Euro thousands unless otherwise stated)
(Translation from an original text in Greek)
22
2.17 Provisions
Provisions are recognised in the balance sheet when:
i. There is a present legal or constructive obligation as a result of a past event.
ii. It is probable that an outflow of resources will be required to settle the obligation.
iii. The required amount can be reliably estimated.
Where there are a number of similar obligations, the likelihood that an outflow will be required in settlement is
determined by considering the class of obligations as a whole. A provision is recognised even if the likelihood
of an outflow with respect to any one item included in the same class of obligations may be small.
Provisions are measured at the present value of the expenditures, expected, based on management’s best
estimation, to be required to settle the present obligation at balance sheet date. The discounted interest rate
used for the determination of the present value reflects current market assessments of the time value of money
and the risks specific to the obligation.
2.18 Revenue recognition
Revenue comprises the fair value of the consideration received or receivable for the sale of goods and services
in the ordinary course of the Company’s activities, net of value-added tax, returns, rebates and discounts. Inter-
company revenue within the Group is fully eliminated.
Revenue is accounted for only when economic benefits, relating to the transaction, will flow to the company.
The specific criteria for recognition as in effect are as follows:
(a) Sales of goods: Sales of goods are recognised when a Group entity has delivered products to the customer,
the customer has accepted the products and collectability of the receivables is reasonably assured. In case of
money refund guarantee for sales of goods, the returns are accounted for at each balance sheet date as decrease
of revenue, using statistical data.
(b) Sales of services: Sales of services are recognised in the accounting period in which the services are
rendered, by reference to the stage of completion of the specific transaction at the balance sheet date.
(c) Interest income: Interest income is recognised on a time-proportion basis using the effective interest
method. When a receivable is impaired, the Group reduces the carrying amount to its recoverable amount,
being the estimated future cash flow discounted at the original effective interest rate of the instrument, and
continues unwinding the discount as interest income. Interest income on impaired (new carrying) value is
recognised using the original effective interest rate.
(d) Dividend income: Dividend income is recognised when received.
2.19 Leases
Lease of property, plant and equipment where the Group has substantially all the risks and rewards of
ownership are classified as finance leases. Finance leases are capitalised at the lease’s inception at the lower of
the fair value of the leased property and the present value of the minimum lease payments. The corresponding
rental obligations, net of finance charges, are included in other long-term payables. The interest element of the

Financial Statements at 31 December 2012
(1 January – 31 December 2012)
(Amounts in Euro thousands unless otherwise stated)
(Translation from an original text in Greek)
23
finance cost is charged to the income statement over the lease period. The property, plant and equipment
acquired under finance leases are depreciated over the shorter of the asset’s useful life and the lease term.
Leases where the leaser retains substantially all the risks and rewards of ownership are classified as operating
leases. Payments made under operating leases (net of any incentives received from the leaser) are charged to the
income statement proportionately over the period of the lease.
2.20 Dividend distribution
Dividend distribution relating to ordinary shares is recognised as a liability in the period in which it is
announced and approved by the General Meeting of Shareholders.
2.21 Comparatives
For the presentation of the financial statements for the year ended 31.12.2012 comparative records of the
financial statements at 31.12.2011 were used.
Some comparative records were reclassified in order to be comparable with the respective records of closing
period.
Any differences presented between the amounts in the financial statements and the respective amounts in the
notes are due to figure rounding.

Financial Statements at 31 December 2012
(1 January – 31 December 2012)
(Amounts in Euro thousands unless otherwise stated)
(Translation from an original text in Greek)
24
3. Financial risk management
3.1. Financial risk factors
The Group is exposed to a variety of financial risks, as market risk (including currency risk, interest rate risk and
price risk), credit risk and liquidity risk. The Group’s overall risk management programme focuses on the
unpredictability of financial markets and seeks to minimise potential adverse effects on the Group’s financial
performance.
Risk management is carried out by the central treasury department of the Group under policies approved by the
Board of Directors. The Board provides written principles for overall risk management, as well as written
policies covering specific areas, such as foreign exchange risk, interest rate risk and credit risk.
(a) Market risk
(i) Foreign exchange risk
The Group operates in Europe and therefore the largest volume of the Group’s commercial transactions is
denominated in Euro. Part of the Group’s purchase of inventory is denominated in other currencies, mainly in
U.S. Dollars. Early payment of these suppliers reduces significantly the foreign exchange risk. The Group, by
consistent practice, does not buy in advance foreign currency and does not conclude external foreign exchange
contracts.
In detail the Group and Company exposure in foreign exchange risk at 31.12.2012 and at 31.12.2011 is as
follows:
GROUP 31.12.2012
US $ UK
Pounds Bulgarian
Lev Romanian
RON Total Receivables in foreign currency 25 - 30 306 361 Payables in foreign currency 6.366 1 2 273 6.642
Total 6.391 1 32 579 7.003
31.12.2011
US $ UK
Pounds Bulgarian
Lev Romanian
RON Total Receivables in foreign currency 27 - 3 26 56 Payables in foreign currency 356 2 2 4 364
Total 383 2 5 30 420

Financial Statements at 31 December 2012
(1 January – 31 December 2012)
(Amounts in Euro thousands unless otherwise stated)
(Translation from an original text in Greek)
25
COMPANY
31.12.2012
US $ UK
Pounds Total Receivables in foreign currency 25 - 25 Payables in foreign currency 6.366 1 6.367
Total 6.391 1 6.392
31.12.2011
US $ UK
Pounds Total Receivables in foreign currency 27 - 27 Payables in foreign currency 356 2 358
Total 383 2 385
(ii) Price risk
The Group does not hold marketable securities and consequently it is not exposed to risk arising from changes
in capital market prices of securities.
The risk arising for the Company from changes in prices of goods is minimal.
(iii) Interest rate risk
As the Group has no significant interest-bearing assets, the Group’s income and operating cash flows are
substantially independent of changes in market interest rates. The Group raises long-term borrowings at
floating rates and depending on market conditions converts borrowings from floating rates to fixed rates. The
Group does not use derivative financial instruments.
The Group’s bank borrowings and subsequent risk from changes in interest rates mainly arises from short-term
bank borrowings. Borrowings issued at variable rates expose the Group to cash flow interest rate risk.
Borrowings issued at fixed rates expose the Group to fair value interest rate risk.
(b) Credit risk
The Company provides services exclusively to recognised and solvent counter-parties. It is the Company’s and
the Group’s policy in general that all customers, to whom services are provided on credit, to be subject to
procedures assessing their credit quality. Moreover, the trade receivables are monitored, on a regular basis,
having as a result limiting the risk from doubtful receivables. As regards credit risk arising from the other
financial assets of the Company, comprising of cash and cash equivalents, the risk derives from the non-
keeping the contractual terms by the counter-party, with maximum exposure equal to the carrying amount of
the instruments. There are no significant concentrations of credit risk in the Company.
Relative ageing analysis of receivables of the Group and the Company is included in note 14.

Financial Statements at 31 December 2012
(1 January – 31 December 2012)
(Amounts in Euro thousands unless otherwise stated)
(Translation from an original text in Greek)
26
(c) Liquidity risk
Liquidity risk is kept at low levels by maintaining sufficient cash and cash equivalents as well as flexibility in
funding by maintaining availability under committed credit lines.
The table below analyses the Group’s and the Company’s financial liabilities into their relevant maturity:
GROUP
31.12.2012 Less than
1 year Between
1 and 2 years Between
3 and 5 years Over
5 years Total Borrowings 4.623 467 1.400 - 6.490 Trade and other payables 37.872 - - - 37.872
42.495 467 1.400 - 44.362
31.12.2011 Less than
1 year Between
1 and 2 years Between
3 and 5 years Over
5 years Total Borrowings 5.045 - - - 5.045 Trade and other payables 32.522 - - - 32.522
37.567 - - - 37.567
COMPANY
31.12.2012 Less than
1 year Between
1 and 2 years Between
3 and 5 years Over
5 years Total Borrowings 4.623 467 1.400 - 6.490 Trade and other payables 37.702 - - - 37.702
42.325 467 1.400 - 44.192
31.12.2011 Less than
1 year Between
1 and 2 years Between
3 and 5 years Over
5 years Total Borrowings 5.045 - - - 5.045 Trade and other payables 32.352 - - - 32.352
37.397 - - - 37.397
3.2 Capital risk management
The Group’s objectives when managing capital are to safeguard the Group’s ability to continue as a going
concern in order to provide satisfactory returns for shareholders and to maintain an optimal capital structure to
reduce the cost of capital.
In order to maintain or adjust the capital structure, the group may adjust the amount of dividends paid to
shareholders, return capital to shareholders, issue new shares or sell assets to reduce debt.
The Group monitors capital on the basis of the gearing ratio. This ratio is calculated as net debt divided by total
capital (own and borrowed). Net debt is calculated as total borrowings (long-term and short-term) less cash and
cash equivalents.

Financial Statements at 31 December 2012
(1 January – 31 December 2012)
(Amounts in Euro thousands unless otherwise stated)
(Translation from an original text in Greek)
27
The gearing ratios at 31 December 2012 and 31 December 2011 for the group are as follows:
31.12.2012 31.12.2011
Total borrowings (Note 19) 6.490 5.045 Less: Cash and cash equivalents (Note 15) (13.199) (13.218)
Net debt (6.709) (8.173) Total equity 39.749 39.554
Total capital 33.040 31.381
Gearing ratio (20,31%) (26,04%)
3.3 Fair value estimation
The fair value of financial instruments traded in active markets (stock exchange), (such as equity securities,
bonds, mutual funds), is based on quoted market prices at the balance sheet date. The quoted market price used
for financial assets held by the Group is the current bid price and for financial liabilities is the current market
price.
The fair value of financial instruments that are not traded in an active market is determined by using valuation
techniques and assumptions that are based on market conditions existing at each balance sheet date.
The carrying value less impairment provision of trade receivables and payables is assumed to approximate their
fair values. The fair value of financial liabilities for disclosure purposes is estimated by discounting the future
contractual cash flows at the current market interest rate that is available to the Group for similar financial
instruments.

Financial Statements at 31 December 2012
(1 January – 31 December 2012)
(Amounts in Euro thousands unless otherwise stated)
(Translation from an original text in Greek)
28
4. Critical accounting estimates and judgments
Estimates and judgments are continually evaluated and are based on historical experience and other factors
including expectations of future events that are believed to be reasonable under the circumstances.
Critical accounting estimates and assumptions
The Group makes estimates and assumptions concerning the future. The estimates and assumptions that have a
significant risk of causing a material adjustment to the carrying amounts of assets and liabilities within the next
twelve (12) months concern:
(a) Estimates in relation with the revenue from software development contracts:
In order to calculate the rate of completion for the projects under development which is the base for the revenue recognition from software development contracts, the management estimates the expected expenses to be made until the completion of the projects
(b) Income taxes
Significant Group judgment is required in determining the provision for income taxes. There are many
transactions and calculations for which the ultimate tax determination is uncertain. Where the final tax outcome
of these matters is different from the amounts that were initially recorded, such differences will impact the
income tax and deferred tax provisions in the period in which such determination is made.
(c) Depreciation rates of tangible fixed assets:
The tangible fixed assets of the Company are depreciated according to their remaining useful live. These useful
lives are periodically reassessed in order to determine whether they continue to be the proper ones. The actual
useful lives of tangible fixed assets may be subject to change by factors such as maintenance costs.

Financial Statements at 31 December 2012
(1 January – 31 December 2012)
(Amounts in Euro thousands unless otherwise stated)
(Translation from an original text in Greek)
29
5. Segmental information
A segment is a distinguishable component of the Group that is engaged in providing services (business
segment) or services within a particular economic environment (geographical segment), that is subject to risks
and returns that are different from those of segments operating in other economic environments.
The registered office of the Group Companies and their main activity is in Greece. The sales of the Group are
mainly in Greece and in other countries of the European Union.
The revenue of the Group per geographical segment is analysed as follows:
GROUP
Sales Total assets
Investments in PPE and Intangible
assets
1.1 -31.12.2012 31.12.2012 1.1 -31.12.2012
Greece 51.990 79.313 2.047 Euro-zone 7.814 4.787 5 Other countries 1.772 2.608 0
Total 61.576 86.708 2.052
Sales Total assets
Investments in PPE and Intangible
assets
1.1 -31.12.2011 31.12.2011 1.1 -31.12.2011
Greece 56.577 76.209 4.052 Euro-zone 6.795 3.324 108 Other countries 486 636 0
Total 63.858 80.169 4.160
Analysis of revenues by category:
GROUP
From 1 January to
31.12.2012 31.12.2011
Sales of goods 6.938 8.156 Revenue from services 54.638 55.702 Other - -
Total 61.576 63.858

Financial Statements at 31 December 2012
(1 January – 31 December 2012)
(Amounts in Euro thousands unless otherwise stated)
(Translation from an original text in Greek)
30
6. Property, plant and equipment
The property, plant and equipment of the Company and of the Group are analysed as follows:
GROUP
Land & Buildings
Vehicles & Machinery
Furniture fittings &
equipment Work in progress Total
Cost
At 1 January 2011 6.066 488 5.455 1.837 13.846 First incorporation of subsidiaries - - - - - Additions 87 - 1.346 1.707 3.140 Absorption/(Merger) of subsidiary - - 292 - 292 Disposals/write-offs - - (217) - (217) Reclassifications - (235) 235 - -
At 31st December 2011 6.153 253 7.111 3.544 17.061
Accumulated depreciation
At 1st January 2011 (1.609) (442) (4.285) - (6.336) First incorporation of subsidiaries - - - - - Depreciation charge (29) (9) (550) - (588) Absorption/(Merger) of subsidiary - - (287) - (287) Disposals/write-offs - - 216 - 216 Reclassifications 16 235 (235) - 16
At 31st December 2011 (1.622) (216) (5.141) - (6.979)
Cost At 1 January 2012 6.153 253 7.111 3.544 17.061 Additions 8 8 143 1.637 1.796 Disposals/write-offs - (34) (202) - (236)
At 31st December 2012 6.161 227 7.052 5.181 18.621
Accumulated depreciation At 1 January 2012 (1.622) (216) (5.141) - (6.979) Depreciation charge (16) (9) (584) - (609) Disposals/write-offs - 32 198 - 230
At 31st December 2012 (1.638) (193) (5.527) - (7.358)
Net book amount at 31 December 2011 4.531 37 1.970 3.544 10.082
Net book amount at 31 December 2012 4.523 34 1.525 5.181 11.263

Financial Statements at 31 December 2012
(1 January – 31 December 2012)
(Amounts in Euro thousands unless otherwise stated)
(Translation from an original text in Greek)
31
COMPANY
Land & Buildings
Vehicles & Machinery
Furniture fittings &
equipment Work in progress Total
Cost
At 1 January 2011 6.066 474 5.364 1.837 13.741 Additions 87 - 1.346 1.706 3.139 Absorption/(Merger) of subsidiary - - 292 - 292 Disposals/write-offs - - (217) - (217) Reclassifications - (235) 235 - -
At 31st December 2011 6.153 239 7.020 3.543 16.955 Accumulated depreciation At 1st January 2011 (1.609) (433) (4.205) - (6.247)
Depreciation charge (28) (7) (548) - (583) Absorption/(Merger) of subsidiary - - (287) - (287) Disposals/write-offs - - 216 - 216 Reclassifications 16 235 (235) - 16 At 31st December 2011 (1.621) (205) (5.059) - (6.885)
Cost At 1 January 2012 6.153 239 7.020 3.543 16.955 Additions 8 8 142 1.637 1.795 Disposals/write-offs - (22) (202) - (224) At 31st December 2012 6.161 225 6.960 5.180 18.526
Accumulated depreciation
At 1 January 2012 (1.621) (205) (5.059) - (6.885) Depreciation charge (16) (7) (581) - (604)
Disposals/write-offs - 21 199 - 220
At 31st December 2012 (1.637) (191) (5.441) - (7.269)
Net book amount at 31 December 2011 4.532 34 1.961 3.543 10.070
Net book amount at 31 December 2012 4.524 34 1.519 5.180 11.257
The Group’s additions of PPE for the year 2012 of € 1.796 thousands concern mainly expenditures for the
construction of the new office building of the Company and the purchase of Electronic Equipment while the
disposals/write-offs of € 236 thousands concern mainly the destruction of fully depreciated Electronic
Equipment. With the Board of Directors decision dated December 17th 2011 the buildings useful life was
defined to be 50 years, compared to the previously nominated 15 to 33 years, therefore their net fixed asset
value was redefined.

Financial Statements at 31 December 2012
(1 January – 31 December 2012)
(Amounts in Euro thousands unless otherwise stated)
(Translation from an original text in Greek)
32
In order to finance the the construction of a new office building in Kallithea, at Kosmeridi Kanakidou-1 str, the value of which amounted to € 4.966.324,26 the company received bond loan amounted € 2.100.000,00. The remaining part of the investment of € 2.866.324,26 was funded through other short term loans. Of the total funding for the construction of the above mentioned building the company capitalized the related to the bond loan interests and part of the other short term loans, totaling € 278.796,40.
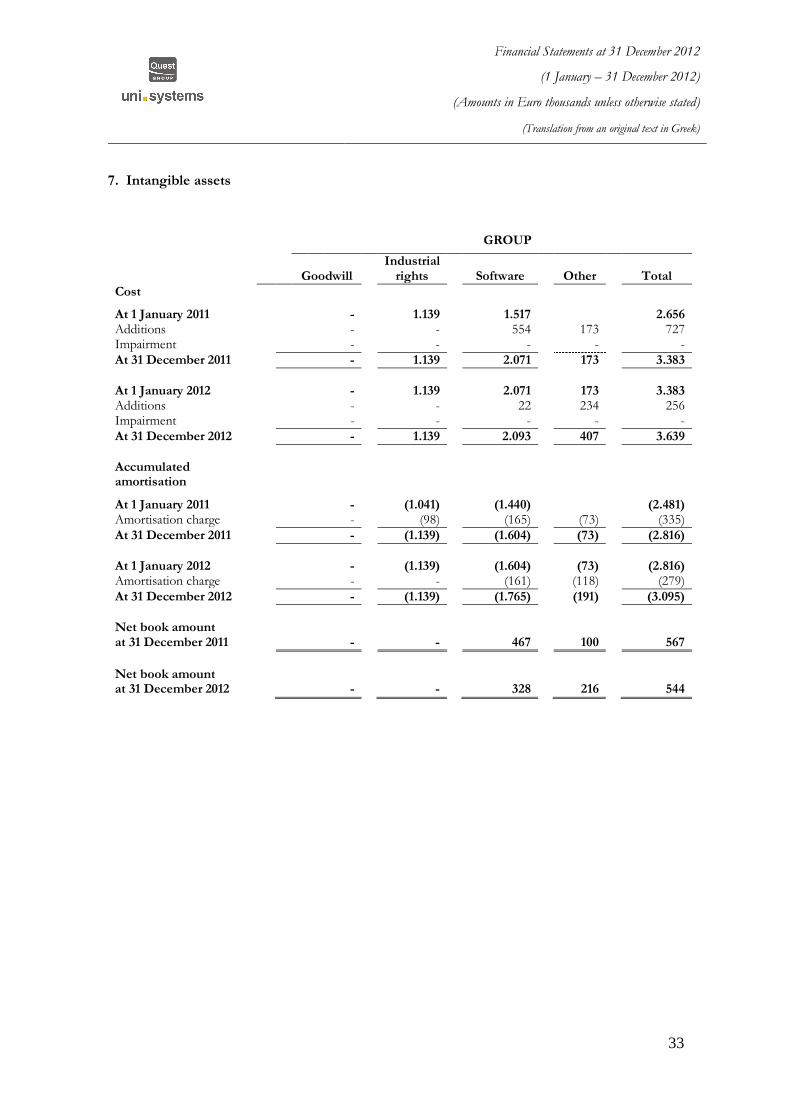
Financial Statements at 31 December 2012
(1 January – 31 December 2012)
(Amounts in Euro thousands unless otherwise stated)
(Translation from an original text in Greek)
33
7. Intangible assets
GROUP
Goodwill
Industrial rights Software
Other Total
Cost
At 1 January 2011 - 1.139 1.517
2.656 Additions - - 554 173 727 Impairment - - - - -
At 31 December 2011 - 1.139 2.071 173 3.383
At 1 January 2012 - 1.139 2.071 173 3.383 Additions - - 22 234 256 Impairment - - - - -
At 31 December 2012 - 1.139 2.093 407 3.639
Accumulated amortisation
At 1 January 2011 - (1.041) (1.440)
(2.481) Amortisation charge - (98) (165) (73) (335)
At 31 December 2011 - (1.139) (1.604) (73) (2.816)
At 1 January 2012 - (1.139) (1.604) (73) (2.816) Amortisation charge - - (161) (118) (279)
At 31 December 2012 - (1.139) (1.765) (191) (3.095)
Net book amount at 31 December 2011 - - 467
100 567
Net book amount at 31 December 2012 - - 328
216 544
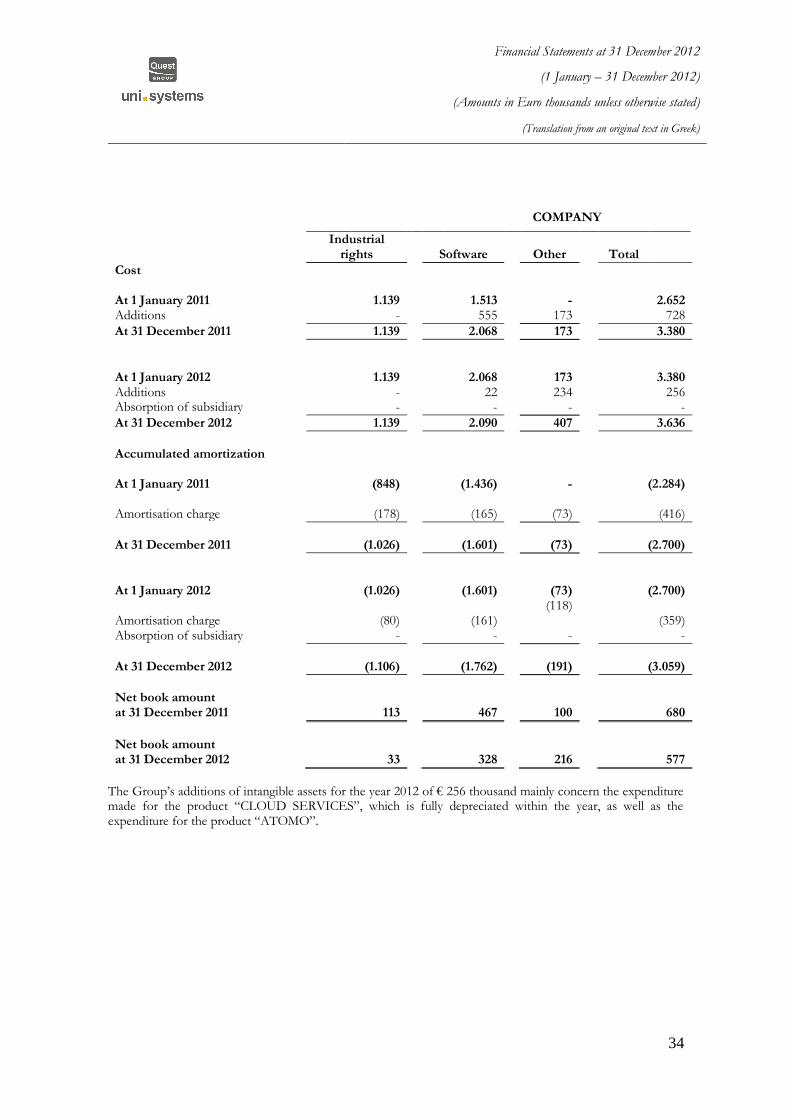
Financial Statements at 31 December 2012
(1 January – 31 December 2012)
(Amounts in Euro thousands unless otherwise stated)
(Translation from an original text in Greek)
34
COMPANY
Industrial
rights Software
Other Total
Cost
At 1 January 2011 1.139
1.513
- 2.652 Additions - 555 173 728
At 31 December 2011 1.139 2.068 173 3.380
At 1 January 2012 1.139
2.068
173 3.380 Additions - 22 234 256 Absorption of subsidiary - - - -
At 31 December 2012 1.139 2.090 407 3.636
Accumulated amortization
At 1 January 2011 (848)
(1.436)
- (2.284)
Amortisation charge (178)
(165)
(73) (416)
At 31 December 2011 (1.026)
(1.601)
(73) (2.700)
At 1 January 2012 (1.026)
(1.601)
(73) (2.700)
Amortisation charge (80)
(161) (118)
(359) Absorption of subsidiary - - - -
At 31 December 2012 (1.106)
(1.762)
(191) (3.059)
Net book amount at 31 December 2011 113 467
100 680
Net book amount at 31 December 2012 33 328
216 577
The Group’s additions of intangible assets for the year 2012 of € 256 thousand mainly concern the expenditure made for the product “CLOUD SERVICES”, which is fully depreciated within the year, as well as the expenditure for the product “ATOMO”.

Financial Statements at 31 December 2012
(1 January – 31 December 2012)
(Amounts in Euro thousands unless otherwise stated)
(Translation from an original text in Greek)
35
8. Investment property
The change in investment property in the Group and the Company is as follows:
GROUP COMPANY
Amounts in Euro thousands 31.12.2012 31.12.2011 31.12.2012 31.12.2011
Cost
Beginning of year 6.144 6.144 6.144
6.144
End of year 6.144 6.144 6.144 6.144 Accumulated deprecation Beginning of year (34) (24) (34) (24) Depreciation charge (10) (10) (10) (10)
End of year (44) (34) (44) (34)
Net-book amount at end of year 6.100 6.110 6.100 6.110
The above amount Euro 6.100 thousands concerns value of land, which the company had purchased in the year
2006 with initial purpose the construction of a building for the relocation of its offices. In the year 2007 it was
decided that no new building was to be built on this land. Therefore, and provided that the above land is held
for long-term rise of its value rather than for short -term sale over the ordinary course of business, based on the
relevant provisions of IAS 40 “Investment property” this asset was transferred from tangible assets to
investment property.
9. Investments in subsidiaries
GROUP COMPANY
31.12.2012 31.12.2011 31.12.2012 31.12.2011
Beginning of year - - 261 61 Additions - - - 1.680 Disposals/write-offs - - (62) (1.290) Impairment - - (100) (190)
End of year - - 99 261
The participation percentages of the Company in subsidiaries are as follows:
31 December 2012
Name Cost Impairment Balance
Sheet value Country of
incorporation % Interest
held
Unisystems Belgium SA 61 (61) - BELGIUM 99,84%
Unisystems Cyprus Limited 2.104 (2.005) 99 CYPRUS 100,00%
2.165 (2.066) 99

Financial Statements at 31 December 2012
(1 January – 31 December 2012)
(Amounts in Euro thousands unless otherwise stated)
(Translation from an original text in Greek)
36
31 December 2011
Name Cost Impairment
/write-off Balance
Sheet value Country of
incorporation % Interest
held
Unisystems Belgium SA 61 - 61 BELGIUM 99,84%
Unisystems Cyprus Limited 2.104 (1.905) 199 CYPRUS 100,00%
2.165 (1.905) 260
On December 28th 2012, Unisystems' Belgium S.A. Extraordinary General Assembly decided the liquidation of
the company. The mother company authorized a lawyer based in Brussels to represent it. The disruption of the
Belgium subsidiary's activity was decided on the ground that the demand can be met by the Belgium branch.
Therefore, it was not feasible to separate the financial result of the company in "result from continuing and
discontinued operations".
On 31.12.2012 the Company’s Management tested for any impairment in the acquisition cost arising from the
investment in the company Unisystems Cyprus Limited and decided for a further impairment of € 100
thousands.

Financial Statements at 31 December 2012
(1 January – 31 December 2012)
(Amounts in Euro thousands unless otherwise stated)
(Translation from an original text in Greek)
37
10. Investments in associates
The Company has a participation of 40% in the share capital of the company ParkMobile Hellas S.A. The
acquisition value was € 800.000,00 which was fully impaired in 2009. During the current year the company
participated in a new share capital injecting the amount of € 420.00,00 which was fully impaired as well. The
data relating to the associate is as follows:
31 December 2012
Name Assets Liabilities Revenues Profit/ (Loss)
% Interest held
Country of Incorporation
PARKMOBILE HELLAS S.A. 497 859 7 (394) 40% Greece
497 859 7 (394)
31 December 2011
Name Assets Liabilities Revenues Profit/ (Loss)
% Interest held
Country of Incorporation
PARKMOBILE HELLAS S.A. 909 1.857 722 (440) 40% Greece
909 1.857 722 (440)
11. Available-for-sale financial assets
GROUP COMPANY
31.12.2012 31.12.2011 31.12.2012 31.12.2011
Beginning of year 927 1.136 1.108 1.108 Additions - - - - Impairment (552) (209) (552) (209)
End of year 375 927 375 927
GROUP COMPANY
31.12.2012 31.12.2011 31.12.2012 31.12.2011
Unlisted securities: - Equity securities – Greece 375 927 375 927
375 927 375 927
GROUP COMPANY
The available-for-sale financial assets are analysed per currency as follows
31.12.2012
31.12.2011
31.12.2012
31.12.2011
Euro 375 927 375 927
375 927 375 927
The available-for-sale financial assets concern unlisted equity securities the total of which is expressed in Euro.
Among the unlisted equity securities are included and those of the companies ITEC S.A. and CREATIVE
MARKETING S.A., which despite the fact that the Company holds significant percentage in their share capital,

Financial Statements at 31 December 2012
(1 January – 31 December 2012)
(Amounts in Euro thousands unless otherwise stated)
(Translation from an original text in Greek)
38
34% and 40% respectively, were not consolidated because the Company does not exercised any material
influence and provided that the shareholders representing the balance share capital of each company exercise
control in these companies since they together hold the remaining percentage and constitute the absolute
majority. In the year 2012 no additions or disposals of available-for-sale financial assets occurred.
During 2012 the company made additional provision for impairment of its participation to the companies
PROBANK SA and “ACROPOLIS HIGH TECH PARK” amounted € 552 thousand
The fair values of unlisted equity securities are determined using valuation techniques and assumptions based
on market conditions at the date of the financial statements. Investments in equity securities not having a
quoted price in an active market whose fair value cannot be measured reliably are measured at cost.
12. Deferred income tax
Deferred Income tax assets and liabilities are offset when there is a legally enforceable right to offset current tax
assets against current tax liabilities and when the deferred income taxes relate to same fiscal authority. The
offset amounts, are as follows:
GROUP COMPANY
31.12.2012 31.12.2011 31.12.2012 31.12.2011
Deferred tax liabilities: 566 487 566 487
Deferred tax assets: 490 959 482 931
(76) 472 (84) 444
The gross movement on the deferred income tax account is as follows:
GROUP COMPANY
31.12.2012 31.12.2011 31.12.2012 31.12.2011
Beginning of the year 472 1.484 444 1.436
Income statement charge (Note 24) (548) (1.012) (528) (992)
Acquisition of subsidiary -
Tax charged directly to equity - - - -
End of year (76) 472 (84) 444

Financial Statements at 31 December 2012
(1 January – 31 December 2012)
(Amounts in Euro thousands unless otherwise stated)
(Translation from an original text in Greek)
39
GROUP
Deferred tax liabilities:
Accelerated tax
depreciation Revenue
recognition Other Total
At 1 January 2011 - 3 722 725 Charged/(Credited) to the income statement - (1) (237) (238)
At 31 December 2011 - 2 485 487
At 1 January 20012 - 2 485 487 Charged/(Credited) to the income statement - 80 - 80
At 31 December 2012 - 82 485 567
Deferred tax assets:
Provisions for receivables
Intangible assets
written off Tax
losses Revenue
recognition Other Total
At 31 January 2011 (22) 515 - - 1.716 2.209 Charged/(Credited) to the income statement 191 (81) - - (1.360) (1.250)
At 31 December 2011 169 434 - - 356 959
At 1 January 2012 169 434 - - 356 959 Charged/(Credited) to the income statement - (519) - - 50 (469)
At 31 December 2012 169 (85) - - 406 490

Financial Statements at 31 December 2012
(1 January – 31 December 2012)
(Amounts in Euro thousands unless otherwise stated)
(Translation from an original text in Greek)
40
COMPANY
Deferred tax liabilities:
Accelerated tax
depreciation Revenue
recognition Other Total
At 1 January 2011 - 3 722 725 Charged/(Credited) to the income statement - (1) (237) (238)
At 31 December 2011 - 2 485 487
At 1 January 2012 - 2 485 487 Charged/(Credited) to the income statement - 80 - 80
Acquisition of subsidiary - - - -
At 31 December 2012 - 82 485 567
Deferred tax assets:
Provisions for
receivables Revenue
recognition Other Total
At 1 January 2011 (22) 467 1.716 2.161 Charged/(Credited) to the income statement 191 (61) (1.360) (1.230)
At 31 December 2011 169 406 356 931
At 1 January 2012 169 406 356 931 Charged/(Credited) to the income statement - (499) 50 (449)
At 31 December 2012 169 (93) 406 482
On 28/02/2012 the Tax Office’s Ordinary Tax audit charged additional income tax of € 560.732,48 for the
audited years 2008-2009. This amount had no effect on the 2012 results due to the existence of equal amount
under the “provision for unaudited periods”.
The remaining amount of provision for the unaudited fiscal year 2010 is € 302.267,52.

Financial Statements at 31 December 2012
(1 January – 31 December 2012)
(Amounts in Euro thousands unless otherwise stated)
(Translation from an original text in Greek)
41
13. Inventories
GROUP COMPANY
Amounts in Euro thousands 31.12.2012 31.12.2011 31.12.2012 31.12.2011
Finished goods 5.841 4.911 5.839 4.911 Other 477 477 477 477
Total 6.318 5.388 6.316 5.388
Less: Provision for unfit, slow moving and destroyed inventories: Finished goods 1.949 1.257 1.949 1.257
1.949 1.257 1.949 1.257
Total net realisable value 4.369 4.131 4.367 4.131
GROUP COMPANY
Amounts in Euro thousands 31.12.2012 31.12.2011 31.12.2012 31.12.2011
Provision Analysis
Beginning of the year 1.257 1.467 1.257 1.467
Provision for impairment 1.200 - 1.200 -
Use of provision within the year (508) (210) (508) (210)
End of the year 1.949 1.257 1.949 1.257
The use of provision was made because within the year the company destroyed inventories worth € 508 thousands.

Financial Statements at 31 December 2012
(1 January – 31 December 2012)
(Amounts in Euro thousands unless otherwise stated)
(Translation from an original text in Greek)
42
14. Trade and other receivable
GROUP COMPANY
Amounts in Euro thousands 31.12.2012 31.12.2011 31.12.2012 31.12.2011
Trade receivables 25.754 22.502 25.424 22.484 Less: Provision for impairment of trade receivables (2.177) (1.753) (2.177) (1.753)
Trade receivables – net 23.577 20.749 23.247 20.731 Pre-payments 85 176 85 176 Prepaid expenses 14.223 9.178 14.223 9.178 Accrued income 11.478 37 11.478 37 S/W development contracts’ receivables - 12.411 - 12.411 Other receivables 431 393 426 360 Guarantees - - - - Receivables from related parties (Note 30) 39 13 147 25
Total 49.833 42.957 49.606 42.918
Non-current assets 232 264 232 264 Current assets 49.601 42.693 49.374 42.654
Total 49.833 42.957 49.606 42.918
The ageing analysis of the Group and Company trade and other receivables is as follows:
GROUP COMPANY
Amounts in Euro thousands 31.12.2012 31.12.2011 31.12.2012 31.12.2011
Fully performing trade receivables 20.661 16.792 20.448 16.843
Impaired trade receivables 2.177 1.753 2.177 1.753 Provision for receivables impairment amount: (2.177) (1.753) (2.177) (1.753)
Total - - - -
Past due but not impaired trade receivables
1 to 3 months - 1.073 - 1.015
3 to 6 months 820 139 820 139
6 to 9 months 603 174 602 174 9 to 12 months 482 1.632 482 1.632 Over 12 months 1.050 953 1.042 953
Total 2.955 3.971 2.946 3.913 Total 23.616 20.763 23.394 20.756
Movements on the provision for impairment of trade receivables are as follows:
GROUP COMPANY
31.12.2012 31.12.2011 31.12.2012 31.12.2011
Beginning of the year 1.753 915 1.753 915 Provision for receivables impairment 424 838 424 838 Receivables written off – Absorption of Uninortel - - - - Unused amounts reversed - - - -
End of year 2.177 1.753 2.177 1.753

Financial Statements at 31 December 2012
(1 January – 31 December 2012)
(Amounts in Euro thousands unless otherwise stated)
(Translation from an original text in Greek)
43
The carrying amounts of trade and other receivables are denominated in the following currencies:
GROUP COMPANY
Amounts in Euro thousands 31.12.2012 31.12.2011 31.12.2012 31.12.2011
Euro (€) 49.473 42.900 49.581 42.891 US Dollar ($) 25 27 25 27 Other 335 30 - -
49.833 42.957 49.606 42.918
15. Cash and cash equivalents
GROUP COMPANY
Amounts in Euro thousands 31.12.2012 31.12.2011 31.12.2012 31.12.2011
Cash at bank and on hand 47 213 29 108 Short-term bank deposits 13.152 13.005 13.047 12.618
Total 13.199 13.218 13.076 12.726
16. Equity
Share capital and premium
The share capital of the Company at 31 December 2012 consists of 40.000.000 registered ordinary shares of par
value Euro 0,30 each share. All holders of shares are entitled to receive the dividends approved and have a
voting right per share at the Meetings of the Company Shareholders. All shares have equal treatment as regards
to the dividend policy of the Company. The total share capital amounts to Euro 12.000.000,00 and the share
premium capital from the issue of shares above par to Euro 9.328.718,40.
Number of shares
Ordinary shares
Share premium
Treasury shares Total
At 1 January 2011 40.000.000 12.000 9.329 - 21.329 Issue of shares to third parties - - - - -
At 31 December 2011 40.000.000 12.000 9.329 - 21.329
At 1 January 2012 40.000.000 12.000 9.329 - 21.329 Decrease of share capital - - - - -
At 31 December 2012 40.000.000 12.000 9.329 - 21.329

Financial Statements at 31 December 2012
(1 January – 31 December 2012)
(Amounts in Euro thousands unless otherwise stated)
(Translation from an original text in Greek)
44
Other reserves and Retained earnings
GROUP
Amounts in Euro thousands Statutory
reserve IAS
Reserve Other
Reserve Total
Balance at 1 January 2011 3.536 - (6) 3.530 Changes during the year 109 - (1) 108 Absorption/(Merger) company - - - -
Balance at 31 December 2011 3.645 - (7) 3.638 Changes during the year - - (1) (1) Absorption/ (Merger) company - - - -
Balance at 31 December 2012 3.645 - (8) 3.637
COMPANY
Amounts in Euro thousands Statutory
reserve IAS
Reserve Other
Reserve Total
Balance at 1 January 2011 3.536 - - 3.536 Changes during the year 109 - - 109 Absorption/(Merger) company - - - -
Balance at 31 December 2011 3.645 - - 3.645 Changes during the year - - - Absorption/(Merger) company - - - -
Balance at 31 December 2012 3.645 - - 3.645
The statutory reserve is set up according to the provisions of the Greek Law L. 2190/1920 where an amount at
least equal to 5% of annual net (after taxes) profit and before the distribution of dividend, is mandatory to be
transferred to the Statutory Reserve up until its amount covers the one third (1/3) of the paid-up share capital.
The statutory reserve can be used for covering losses after relevant resolution of the Ordinary General Meeting
of Shareholders and therefore it cannot be used for whichever other reason. For the fiscal year 2012 no
statutory reserve was set up, as the remaining balance of profit after tax plus carrying forward losses is not
sufficient enough for its formation.
In the Retained earnings account, in the Group and the Company, are included tax-free reserves from tax
exempted income and income taxed at special provisions of total amount Euro 2.967 thousands of which
amount € 230 thousand resulting from the absorption of Uni Nortel Communication Technologies (Hellas) SA
during 2010. In the case where these reserves are distributed shall be taxed at the effective tax rate of that year.
The Group has no intention to distribute or capitalize the specific reserves and consequently it has not
calculated the income tax that would have been imposed in such a circumstance.
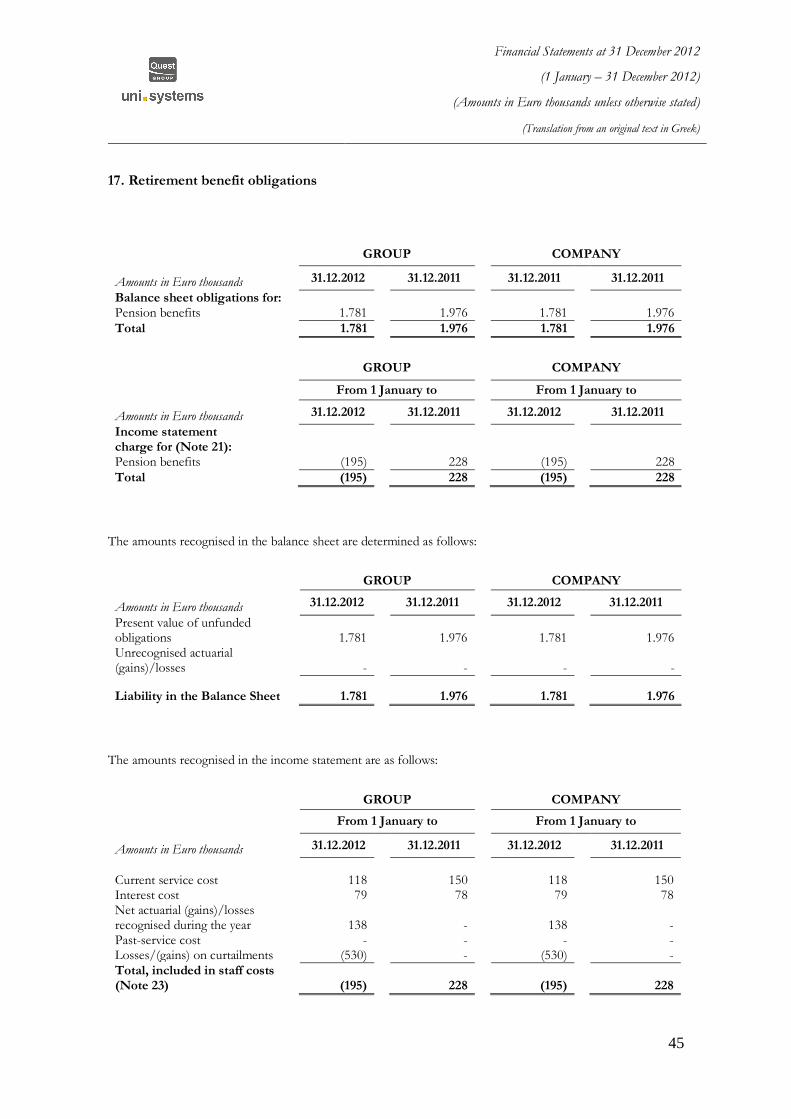
Financial Statements at 31 December 2012
(1 January – 31 December 2012)
(Amounts in Euro thousands unless otherwise stated)
(Translation from an original text in Greek)
45
17. Retirement benefit obligations
GROUP COMPANY
Amounts in Euro thousands 31.12.2012 31.12.2011 31.12.2011 31.12.2011
Balance sheet obligations for: Pension benefits 1.781 1.976 1.781 1.976
Total 1.781 1.976 1.781 1.976
GROUP COMPANY
From 1 January to From 1 January to
Amounts in Euro thousands 31.12.2012 31.12.2011 31.12.2012 31.12.2011
Income statement charge for (Note 21): Pension benefits (195) 228 (195) 228
Total (195) 228 (195) 228
The amounts recognised in the balance sheet are determined as follows:
GROUP COMPANY
Amounts in Euro thousands 31.12.2012 31.12.2011 31.12.2012 31.12.2011
Present value of unfunded obligations
1.781
1.976
1.781
1.976
Unrecognised actuarial (gains)/losses
-
-
- -
Liability in the Balance Sheet 1.781 1.976 1.781 1.976
The amounts recognised in the income statement are as follows:
GROUP COMPANY
From 1 January to From 1 January to
Amounts in Euro thousands 31.12.2012 31.12.2011 31.12.2012 31.12.2011
Current service cost 118 150 118 150 Interest cost 79 78 79 78 Net actuarial (gains)/losses recognised during the year 138 - 138 - Past-service cost - - - - Losses/(gains) on curtailments (530) - (530) - Total, included in staff costs (Note 23) (195) 228 (195) 228

Financial Statements at 31 December 2012
(1 January – 31 December 2012)
(Amounts in Euro thousands unless otherwise stated)
(Translation from an original text in Greek)
46
The movement in the obligations recognised in the balance sheet, is as follows:
GROUP COMPANY
Amounts in Euro thousands 31.12.2010 31.12.2009 31.12.2010 31.12.2009
Beginning of year 1.976 1.748 1.976 1.748 Credit exchange differences - - - - Absorption/(Merger) of company - - - - Benefits paid - - - - Total charged/(credited) to income statement (195) 228 (195) 228
End of year 1.781 1.976 1.781 1.976
The principal actuarial assumptions used were as follows:
GROUP COMPANY
31.12.2012 31.12.2011 31.12.2012 31.12.2011
Discount rate 4,00% 0,51% 4,00% 1,53%
Future salary increases 2,00% 6,00% 2,00% 6,00%
18. Trade and other payables
GROUP COMPANY
Amounts in Euro thousands 31.12.2012 31.12.2011 31.12.2012 31.12.2011
Trade payables 14.161 8.355 14.109 8.296 Amounts due to related parties (Note 30) 807 770 806 830 Accrued expenses 3.547 3.101 3.477 3.002 S/W development contracts’ payables 12.533 14.224 12.533 14.224 Social security and other taxes-duties 3.932 2.757 3.886 2.756 Other payables 2.892 3.315 2.891 3.244
Total 37.872 32.522 37.702 32.352
Analysis of liabilities: 31.12.2012 31.12.2011 31.12.2012 31.12.2011
Non-current - - - -
Current 37.872 32.522 37.702 32.352
Total 37.872 32.522 37.702 32.352
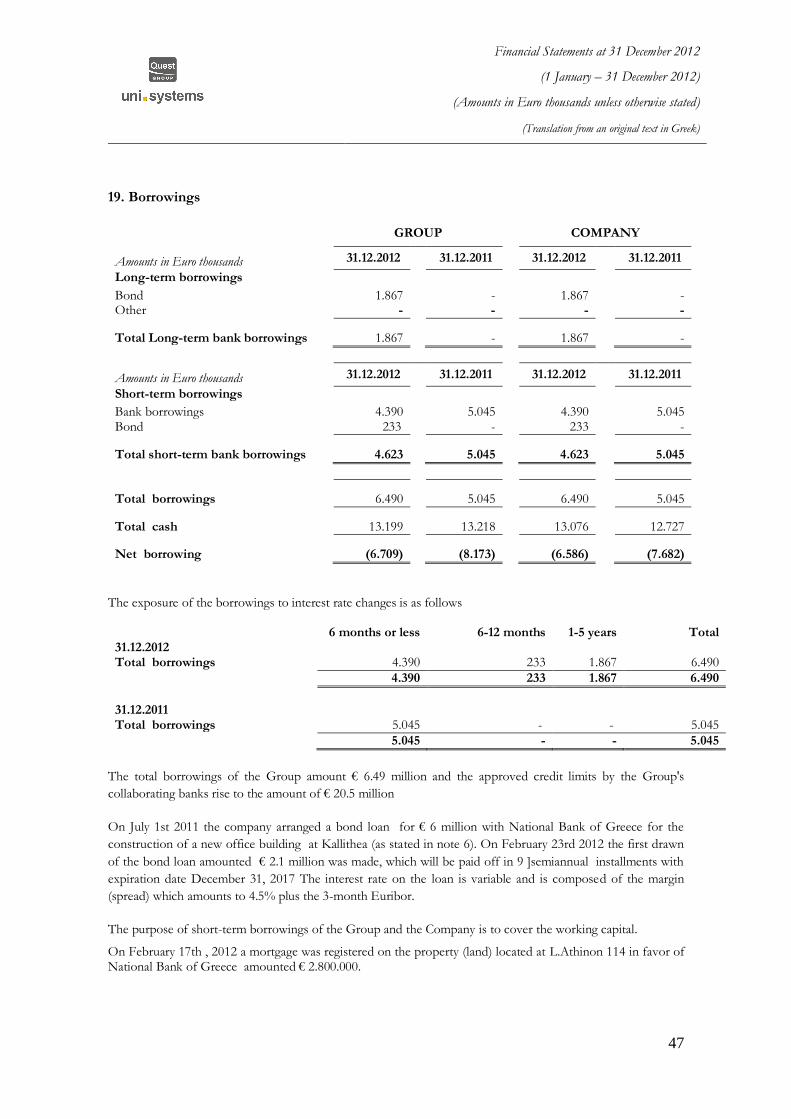
Financial Statements at 31 December 2012
(1 January – 31 December 2012)
(Amounts in Euro thousands unless otherwise stated)
(Translation from an original text in Greek)
47
19. Borrowings
GROUP COMPANY
Amounts in Euro thousands 31.12.2012 31.12.2011 31.12.2012 31.12.2011
Long-term borrowings
Bond 1.867 - 1.867 - Other - - - -
Total Long-term bank borrowings 1.867 - 1.867 -
Amounts in Euro thousands 31.12.2012 31.12.2011 31.12.2012 31.12.2011
Short-term borrowings
Bank borrowings 4.390 5.045 4.390 5.045 Bond 233 - 233 -
Total short-term bank borrowings 4.623 5.045 4.623 5.045
Total borrowings 6.490 5.045 6.490 5.045
Total cash 13.199 13.218 13.076 12.727
Net borrowing (6.709) (8.173) (6.586) (7.682)
The exposure of the borrowings to interest rate changes is as follows
6 months or less 6-12 months 1-5 years Total 31.12.2012 Total borrowings 4.390 233 1.867 6.490
4.390 233 1.867 6.490
31.12.2011 Total borrowings 5.045 - - 5.045
5.045 - - 5.045
The total borrowings of the Group amount € 6.49 million and the approved credit limits by the Group's
collaborating banks rise to the amount of € 20.5 million
On July 1st 2011 the company arranged a bond loan for € 6 million with National Bank of Greece for the
construction of a new office building at Kallithea (as stated in note 6). On February 23rd 2012 the first drawn
of the bond loan amounted € 2.1 million was made, which will be paid off in 9 ]semiannual installments with
expiration date December 31, 2017 The interest rate on the loan is variable and is composed of the margin
(spread) which amounts to 4.5% plus the 3-month Euribor.
The purpose of short-term borrowings of the Group and the Company is to cover the working capital.
On February 17th , 2012 a mortgage was registered on the property (land) located at L.Athinon 114 in favor of National Bank of Greece amounted € 2.800.000.
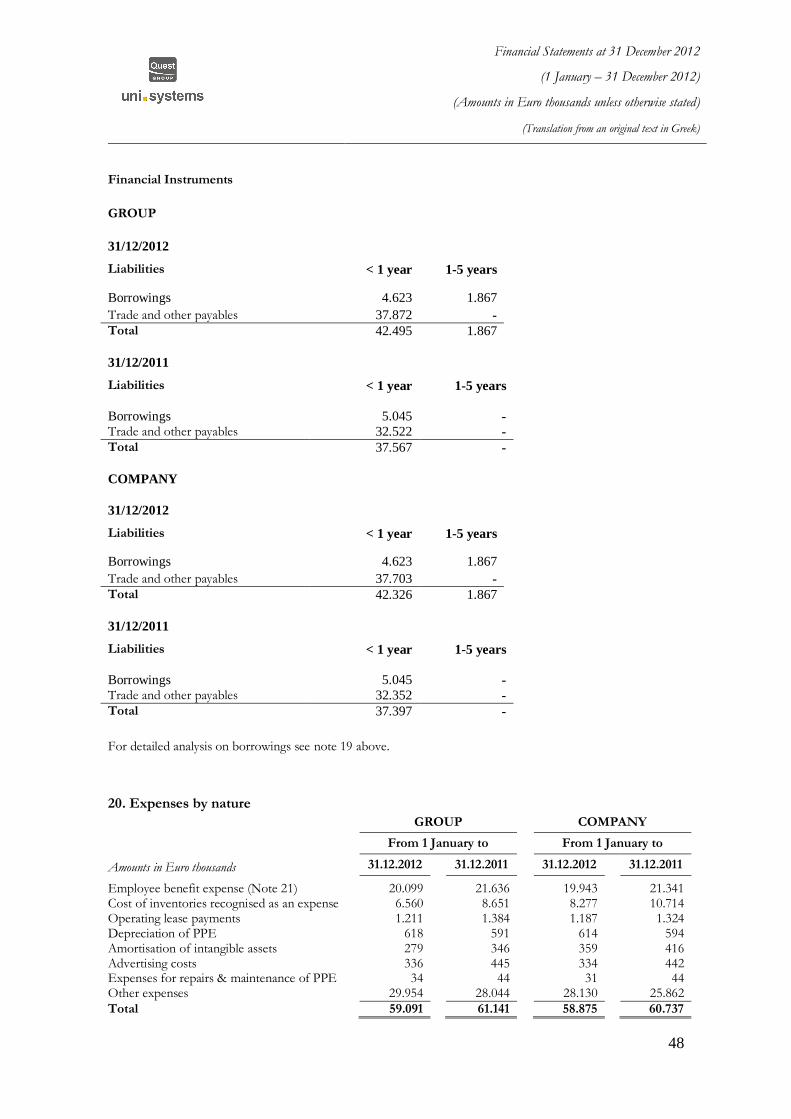
Financial Statements at 31 December 2012
(1 January – 31 December 2012)
(Amounts in Euro thousands unless otherwise stated)
(Translation from an original text in Greek)
48
Financial Instruments
GROUP
31/12/2012
Liabilities < 1 year 1-5 years
Borrowings 4.623 1.867
Trade and other payables 37.872 -
Total 42.495 1.867
31/12/2011
Liabilities < 1 year 1-5 years
Borrowings 5.045 - Trade and other payables 32.522 -
Total 37.567 -
COMPANY
31/12/2012
Liabilities < 1 year 1-5 years
Borrowings 4.623 1.867
Trade and other payables 37.703 -
Total 42.326 1.867
31/12/2011
Liabilities < 1 year 1-5 years
Borrowings 5.045 - Trade and other payables 32.352 -
Total 37.397 -
For detailed analysis on borrowings see note 19 above.
20. Expenses by nature
GROUP COMPANY
From 1 January to From 1 January to
Amounts in Euro thousands 31.12.2012 31.12.2011 31.12.2012 31.12.2011
Employee benefit expense (Note 21) 20.099 21.636 19.943 21.341 Cost of inventories recognised as an expense 6.560 8.651 8.277 10.714 Operating lease payments 1.211 1.384 1.187 1.324 Depreciation of PPE 618 591 614 594 Amortisation of intangible assets 279 346 359 416 Advertising costs 336 445 334 442 Expenses for repairs & maintenance of PPE 34 44 31 44 Other expenses 29.954 28.044 28.130 25.862
Total 59.091 61.141 58.875 60.737
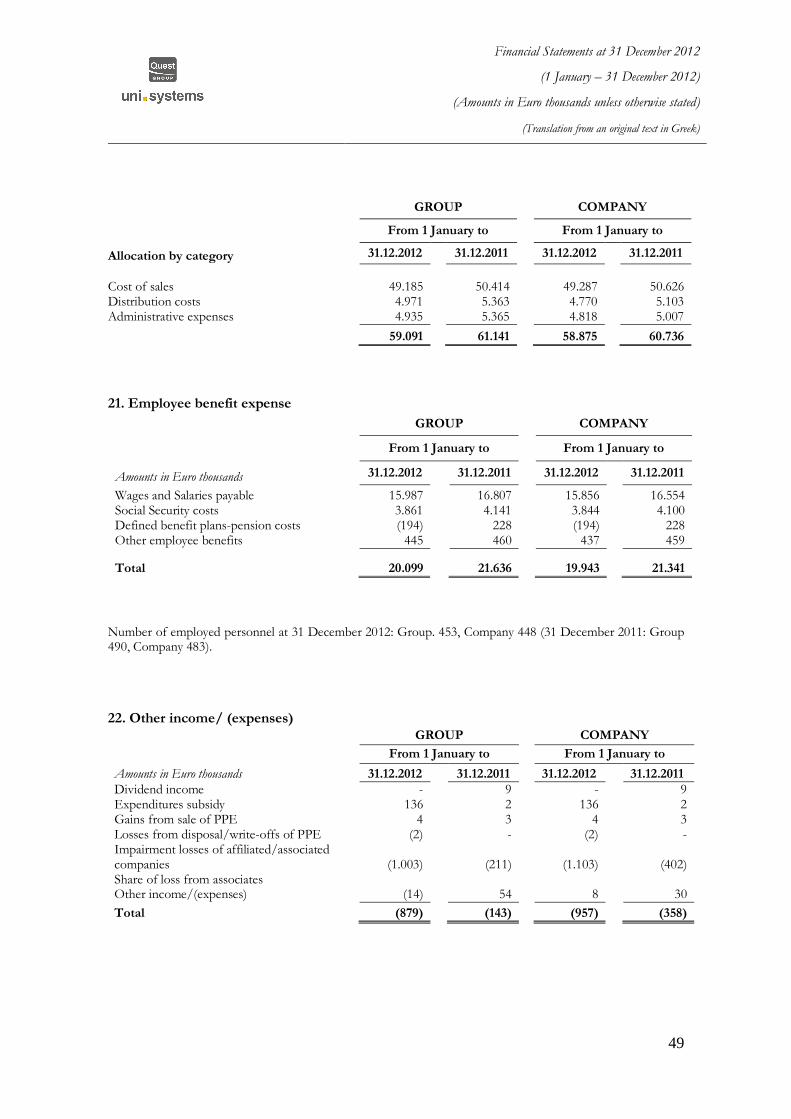
Financial Statements at 31 December 2012
(1 January – 31 December 2012)
(Amounts in Euro thousands unless otherwise stated)
(Translation from an original text in Greek)
49
GROUP COMPANY
From 1 January to From 1 January to
Allocation by category 31.12.2012 31.12.2011 31.12.2012 31.12.2011
Cost of sales 49.185 50.414 49.287 50.626 Distribution costs 4.971 5.363 4.770 5.103 Administrative expenses 4.935 5.365 4.818 5.007
59.091 61.141 58.875 60.736
21. Employee benefit expense
GROUP COMPANY
From 1 January to From 1 January to
Amounts in Euro thousands 31.12.2012 31.12.2011 31.12.2012 31.12.2011
Wages and Salaries payable 15.987 16.807 15.856 16.554 Social Security costs 3.861 4.141 3.844 4.100 Defined benefit plans-pension costs (194) 228 (194) 228 Other employee benefits 445 460 437 459
Total 20.099 21.636 19.943 21.341
Number of employed personnel at 31 December 2012: Group. 453, Company 448 (31 December 2011: Group 490, Company 483).
22. Other income/ (expenses)
GROUP COMPANY
From 1 January to From 1 January to
Amounts in Euro thousands 31.12.2012 31.12.2011 31.12.2012 31.12.2011
Dividend income - 9 - 9 Expenditures subsidy 136 2 136 2 Gains from sale of PPE 4 3 4 3 Losses from disposal/write-offs of PPE (2) - (2) - Impairment losses of affiliated/associated companies (1.003) (211) (1.103)
(402)
Share of loss from associates Other income/(expenses) (14) 54 8 30
Total (879) (143) (957) (358)

Financial Statements at 31 December 2012
(1 January – 31 December 2012)
(Amounts in Euro thousands unless otherwise stated)
(Translation from an original text in Greek)
50
The analysis of the other income/ (expenses) is as follows:
GROUP COMPANY
From 1 January to From 1 January to
Amounts in Euro thousands 31.12.2012 31.12.2011 31.12.2012 31.12.2011
Income from rents 3 2 3 2 Other income / (expenses) (17) - 5 - Prior years’ income - 52 - 28
(14) 54 8 30
The losses from impairment on associates and affiliates mainly derive from the participation in : PARKMOBILE AE amounting to € 420 thousand, PROBANK A.E. € 368 thousand, HIGH-TECH PARK «Acropolis» € 184 thousand and the subsidiary Unisystems Cyprus Ltd amounting € 100 thousand. For further details see notes 10, 11 and 9 respectively.
23. Finance income and costs - net
The analysis of the financial results of the Group and the Company has as follows:
GROUP COMPANY
From 1 January to From 1 January to
Amounts in Euro thousands 31.12.2012 31.12.2011 31.12.2012 31.12.2011
Interest expenses - Bank loans (110) (88) (110) (86) - Interest on amounts due to trade debtors (104) (281) (102) (279) - Commissions on letters of guarantee (343) (271) (343) (269) - Debit exchange differences (279) - (280) - - Sundry bank expenses & other similar charges (16) 1 (16) -
(852) (639) (851) (634) Interest income 74 56 69 48
(778) (583) (782) (586) Credit exchange differences 192 51 190 51
Total (586) (532) (592) (535)
24. Income tax expense
GROUP COMPANY
From 1 January to From 1 January to
Amounts in Euro thousands 31.12.2012 31.12.2011 31.12.2012 31.12.2011
Current tax (275) (649) (268) (599) Deferred tax (note 12) (548) (1.011) (528) (991)
Total (823) (1.660) (796) (1.590)
In addition, the cumulative provision for the future income tax payables of the Company and the Group
concerning the un-audited fiscal years was on 31.12.2012 and on 31.12.2011 as follows:
Amounts in Euro thousands 31.12.2012 31.12.2011 31.12.2012 31.12.2011
Provision for un-audited fiscal years 302 302 302 302

Financial Statements at 31 December 2012
(1 January – 31 December 2012)
(Amounts in Euro thousands unless otherwise stated)
(Translation from an original text in Greek)
51
The tax on the Company’s profit before taxes differs from the theoretical amount that would arise using the
weighted average tax rate applicable to profits. The difference has as follows:
GROUP COMPANY
From 1 January to From 1 January to
Amounts in Euro thousands 31.12.2012 31.12.2011 31.12.2012 31.12.2011
Profit before tax 1.019 2.043 950 1.877 Tax calculated at domestic tax rates applicable to profits in the respective countries
(280)
(466)
(273)
(413)
Income not subject to tax (1.158) (2.034) (1.138) (2.017) Expenses not deductible for tax purposes 882 1.301 882 1.301 Tax losses for which no deferred income tax asset was recognised - - - - Differences due to changes in tax rates - (151) - (151) Other tax adjustments (267) (310) (267) (310)
Total (823) (1.660) (796) (1.590)
The tax returns of the Company are filed annually but the profits or losses declared are considered temporary
till the time when the tax returns and the books of the Company will be examined by the tax authorities and will
be accepted as final.

Financial Statements at 31 December 2012
(1 January – 31 December 2012)
(Amounts in Euro thousands unless otherwise stated)
(Translation from an original text in Greek)
52
25. Cash generated from operations
GROUP COMPANY
Amounts in Euro thousands From 1 January to From 1 January to
Note 31.12.2012 31.12.2011 31.12.2012 31.12.2011
Profit before income tax 196 383 154 287
Adjustments for:
Tax 24 823 1.660 796 1.590
Depreciation of PPE 6,8 608 591 605 584
Amortisation of intangible assets 7 289 346 368 426
(Profit)/loss on disposal of PPE & other investments 22 (2) (3) (2) (3)
Interest income 23 (129) (154) (125) (146)
Interest expense 23 571 688 571 682
Dividend income 22 - (9) - (9) Foreign exchange losses/(gains) on operating activities 147 (18)
- 148
- (17)
Impairment in associates 972 208 1.072 399
3.475 3.692 3.587 3.793
Changes in working capital:
(Increase)/decrease of inventories (930) 1.181 (927) 1.181
(Increase/decrease of receivables (9.323) 12.036 (9.073) 12.012
Increase/(decrease) of payables 9.411 490 9.412 340
Increase/(decrease) of provisions 1.032 (9.670) 1032 (9.670)
Increase/(decrease) of employee retirement benefit obligations (1.330) (21) (1330) (21)
(1.140) 4.016 (886) 3.842
Cash generated from operations 2.335 7.708 2.701 7.635

Financial Statements at 31 December 2012
(1 January – 31 December 2012)
(Amounts in Euro thousands unless otherwise stated)
(Translation from an original text in Greek)
53
26. Earnings per share
Basic and diluted
Basic and diluted earnings per share is calculated by dividing the profit/(loss) attributable to equity holders of
the company by the weighted average number of ordinary shares in issue during the year, excluding ordinary
shares purchased by the company and held as treasury shares.
Ordinary shares issued as part of the cost of business combinations are included in the weighted average
number of shares from the date of acquisition. This is because the acquirer incorporates the profits or losses of
the acquiree in its income statement from that date.
Amounts in Euro
GROUP COMPANY
31.12.2012 31.12.2011 31.12.2012 31.12.2011
Profit attributable to equity holders of the parent 196.065 382.941 154.310 287.397
Weighted average number of ordinary shares in issue 40.000.000 40.000.000 40.000.000 40.000.000
Basic and diluted earnings / (losses) per share (€ per share) 0,0049 0,0096 0,0039 0,0072
27. Commitments
Capital commitments
At the date of preparation of the annual financial statements, there are no significant capital expenditures
contracted and not yet incurred.
Finance lease commitments
The Company has not contracted finance lease agreements.
Operating lease commitments
The future minimum lease payments under non-cancellable operating leases are as follows:
GROUP COMPANY
Amounts in Euro thousands 31.12.2012 31.12.2011 31.12.2012 31.12.2011
No later than 1 year 1.198 1.367 1.198 1.367 Later than 1 year and no later than 5 years 4.679 5.433 4.679 5.433 No later than 5 years 2.714 4.929 2.714 4.929
8.591 11.729 8.591 11.729

Financial Statements at 31 December 2012
(1 January – 31 December 2012)
(Amounts in Euro thousands unless otherwise stated)
(Translation from an original text in Greek)
54
28. Contingencies
The Group and the Company have contingent liabilities and receivables in respect of banks, other guarantees
and other matters arising in the ordinary course of business whereas it is not anticipated that any material
liabilities will arise from the contingent liabilities.
The contingent liabilities are as follows:
GROUP COMPANY
Amounts in Euro thousands 31.12.2012 31.12.2011 31.12.2012 31.12.2011
Guarantees for down payments 7.444 6.572 7.444 6.572 Guarantees for securing good performance of contracts with customers 7.614 11.402 7.614 11.402 Guarantees in relation to participation in tenders 3.633 2.544 3.633 2.544 Mortgages on Land 2.800 - 2.800 - Guarantees at Banks in favour of associates - - - -
21.491 20.518 21.491 20.518
The contingent receivables are as follows:
GROUP COMPANY
Amounts in Euro thousands 31.12.2012 31.12.2011 31.12.2012 31.12.2011
Guarantees for securing trade receivables 3.159 2.798 3.159 2.798
Third party guarantees to suppliers 500 - 500 -
Third party Collateral (checks) 23 - 23 -
3.682 2.798 3.682 2.798
The tax liabilities of the Company and the Group have not been made final as yet since there remain un-audited
by the tax authorities previous fiscal years, which are as follows:
Group Companies Un-audited tax years
1. Unisystems Information Technology Commercial SA 2010
2. Uni-Nortel Communication Technologies (Hellas) SA 2010
3. Unisystems Cyprus Ltd 2010-2012
4. Unisystems Information Technology Systems SRL 2006-2012
5. Unisystems Bulgaria Ltd 2008-2012
6. Unisystems Belgium SA 2009-2012
7. Parkmobile Hellas A.E. 2010-2012
8. FAST HELALS S.A. 2010-2011

Financial Statements at 31 December 2012
(1 January – 31 December 2012)
(Amounts in Euro thousands unless otherwise stated)
(Translation from an original text in Greek)
55
Moreover, there are certain disputed cases of Group companies where Management deems that it is not
anticipated that any material liabilities will arise from.
Tax Compliance certificate From the financial year 2011 and onwards, all Greek Societe Anonyme and Limited Liability Companies that are required to prepare audited statutory financial statements must in addition obtain an “Annual Tax ertificate” as provided for by paragraph 5 of Article 82 of L.2238/1994. This “Annual Tax Certificate” must be issued by the same statutory auditor or audit firm that issues the audit opinion on the statutory financial statements. Upon completion of the tax audit, the statutory auditor or audit firm must issue to the entity a "Tax Compliance Report" which will subsequently be submitted electronically to the Ministry of Finance, by the statutory auditor or audit firm. This "Tax Compliance Report" must be submitted to the Ministry of Finance, within ten days from the date of approval of the financial statements by the General Meeting of Shareholders. The Ministry of Finance will subsequently select a sample of at least 9% of all companies for which a "Tax Compliance Report" has been submitted for the performance of a tax audit by the relevant auditors from the Ministry of Finance. The audit by the Ministry of Finance must be completed within a period of eighteen months from the date when the "Tax Compliance Report" was submitted to the Ministry of Finance.
The Company’s 2011 tax audit has been completed and for 2012 is on process conducted by the statutory
auditors. Upon completion of the tax audit, management does not expect to arise any significant tax liabilities
beyond those recorded and reported in the financial statements.
29. Existing real liens
Borrowings of the Group subsidiaries are secured with guarantees granted by the Company (Note 28). There
are no mortgages and pre-notices on land and buildings of the Company and the Group beyond the stated in
the notes 19 and 28.
30. Related-party transactions
The following transactions were carried out with related parties:
GROUP COMPANY
From 1 January to From 1 January to
Amounts in Euro thousands 31.12.2012 31.12.2011 31.12.2012 31.12.2011
i) Sales of goods and services
Sales of goods 20 56 20 56
Parent 3 2 3 2 Subsidiaries - - - - Associates - - - 54 Other 17 54 17 -
Sales of services 140 97 305 174
Parent 59 3 59 3
Subsidiaries - - 165 77
Associates - - - -
Other 81 94 81 94
160 153 325 230
ii) Purchases of goods and services
Purchases of goods 977 1.630 977 1.630
Parent - 820 - 820
Subsidiaries - - - - Associates - - - -
Other 977 810 977 810
Purchases of services 2.716 2.825 4.533 4.865
Parent 1.644 1.806 1.644 1.806

Financial Statements at 31 December 2012
(1 January – 31 December 2012)
(Amounts in Euro thousands unless otherwise stated)
(Translation from an original text in Greek)
56
Subsidiaries - - 1.817 2.040
Associates - 2 - 2
Other 1.072 1.017 1.072 1.017
3.693 4.455 5.510 6.495
iii) Key management compensation Salaries and other short-term employee benefits 1.590 1.276 1.590 1.263 Termination benefits - - - - Other long-term benefits - - - -
1.590 1.276 1.590 1.263
iv) Year-end balances arising from sales/purchases of goods/services
GROUP COMPANY
Amounts in Euro thousands 31.12.2012 31.12.2011 31.12.2012 31.12.2011
Receivables from related parties:
- Parent 20 - 20 -
- Subsidiaries - - 108 12 - Associates - - - -
- Other 19 13 19 13
39 13 147 25
Payables to related parties:
- Parent 191 195 191 195 - Subsidiaries - - - 59
- Associates - 9 - 9
- Other 615 566 615 567
806 770 806 830
The services from and to related parties as well as the sales and purchases of goods are made according to the
price list effective for non-related parties.
32. Post balance sheet Events
Due to the new tax law set in act on January 23rd 2013, the Greek corporate tax rate increased to 26% (from
20%) for fiscal years starting from January 1, 2013 onwards. This increase was not effective on the balance
sheet date and consequently has not affected the financial statements of 2012.
Kallithea, 21 March 2013
The Chairman of the B. of. D.
The Vice Chairman of the B. of D.
and Managing Director
The Vice Chairman of the B. of D.
Theodore D. Fessas Ioannis K. Loumakis Markos G. Bitsakos
ID. No. ΑΕ 106909 ID. No. AΚ 082270 ID. No. AA 079768