tribo-rheology and sensory analysis of a dairy semi-solid
TRANSCRIPT

Accepted Manuscript
Tribo-Rheology and Sensory Analysis of a Dairy Semi-Solid
Fernanda C. Godoi, Bhesh R. Bhandari, Sangeeta Prakash
PII: S0268-005X(16)31036-0
DOI: 10.1016/j.foodhyd.2017.04.011
Reference: FOOHYD 3859
To appear in: Food Hydrocolloids
Received Date: 11 January 2017
Accepted Date: 06 April 2017
Please cite this article as: Fernanda C. Godoi, Bhesh R. Bhandari, Sangeeta Prakash, Tribo-Rheology and Sensory Analysis of a Dairy Semi-Solid, (2017), doi: 10.1016/j.Food Hydrocolloidsfoodhyd.2017.04.011
This is a PDF file of an unedited manuscript that has been accepted for publication. As a service to our customers we are providing this early version of the manuscript. The manuscript will undergo copyediting, typesetting, and review of the resulting proof before it is published in its final form. Please note that during the production process errors may be discovered which could affect the content, and all legal disclaimers that apply to the journal pertain.

ACCEPTED MANUSCRIPT
RESEARCH HIGHLIGHTS
Tribo-rheology of a dairy semi-solid model, custard
Effect of starch, carrageenan and fat on the flow behaviour, lubricant properties and particle
size distribution
Insights on determination of tribological regimes in friction curves: coefficient of friction vs
sliding speed
It was suggested that tribology mechanisms are mainly influenced by hydrophobic
interactions and selective entrainment based on particle size
Sensory evaluation of bulk-related attributes well correlated to viscosity measurements;
however no sensitive perception of fat-related attributes was observed.

ACCEPTED MANUSCRIPT
1
1
2
3 TRIBO-RHEOLOGY AND SENSORY ANALYSIS OF A DAIRY SEMI-SOLID
4
5 Fernanda C. Godoi1; Bhesh R. Bhandari1 and Sangeeta Prakash1*
6
7 1 The ARC Dairy Innovation Hub, The University of Queensland, Brisbane 4072, Australia.
8
9
10
11
12
13
14
15
16
17
18
19
20 *Corresponding author:
21 Dr Sangeeta Prakash
23 School of Agriculture and Food Sciences
24 Hartley Teakle Building, Room C406
25 The University of Queensland
26 Brisbane QLD 4072
27

ACCEPTED MANUSCRIPT
2
28 Abstract
29
30 Tribology science is devoted on explaining the friction behaviour of interacting surfaces in relative motion.
31 Several tribological systems have been used to measure coefficient of friction (CoF) vs sliding speed of entrained
32 food layer between two rubbing surfaces. These results can be correlated with fat-related attributes perceived
33 during oral processing. This study aims to investigate the effect of starch, carrageenan and fat on the friction
34 profile; flow behaviour and particle size distribution. Friction curves were obtained for custards using a tribo-
35 rheometer with a rotating metallic geometry rubbing the surface of 3M tape with roughness similar to that
36 depicted by human tongue. Confocal Laser Scanning Microscopy (CLSM) images of custard collected during
37 friction experiment helped to explain the characteristics of tribological regimes. As expected, fat-containing
38 samples depicted remarkably lower CoF than skim compositions (fat: 0.2<CoF<0.08 and skim: 0.6<CoF<0.3).
39 The presence of fat not only influenced CoF magnitude but the establishment of tribological regimes (TRs). Fat-
40 custards depicted three TRs, assigned as: (1) fluid entrainment (decreasing-CoF), (2) gel particle entrainment
41 (increasing-CoF) and (3) accumulation of multi-layers of material at high speeds (decreasing or sometimes
42 constant-CoF). Skim–samples, however, presented a prolonged decreasing CoF over the sliding speed range
43 tested. Conversely to tribo-rheological results, sensory analysis revealed lack of hydrocolloid effect on the
44 perception of fat-related attributes. This was assigned to the presence of saliva facilitating the food microstructure
45 breakdown. We emphasize that our tribological study focused on the friction trend; future experiments will
46 involve the use of saliva to explain the mechanisms of food oral processing.
47 Key-words: rheology, tribology, sensory, dairy semi-solid.
48
49
50
51
52

ACCEPTED MANUSCRIPT
3
53 1. INTRODUCTION
54
55 Semi-solid foods usually consist of complex gel networks made of proteins or carbohydrates
56 (polysaccharides) with high or low fat content. Oral processing of semi-solids requires minimum mastication
57 efforts because they already resemble the bolus formed for swallowing (de Wijk, Prinz, Engelen, & Weenen,
58 2004; Engelen, et al., 2003). At the first stage of food ingestion in the mouth a thick layer of product is present
59 between the surface of tongue and palate and rheological behavior plays an important role on the perception of
60 thickness. As a subsequent step, microstructure break-down of the food entrapped between tongue and palate
61 takes place by the action of enzymes present in saliva, shear forces and sliding speeds.
62
63 Hydrocolloids (proteins and carbohydrates) are known by their ability of attracting water molecules and
64 entrapping fat which justify their intense use as texture modifiers in food. Improvements on the oral perception,
65 for example, of creaminess and thickness relies on the mechanism of entrapped fat migration from inner regions
66 of the semi-solid network to surfaces of tongue and palate under friction by the sliding movements of tongue (de
67 Wijk & Prinz, 2007; de Wijk, et al., 2004; Engelen, et al., 2003). Researchers have successfully associated bulk-
68 related sensory attributes, such as thickness, with flow behavior and viscoelastic properties determined by means
69 of rheological methods. However, fat-related attributes like creaminess and oiliness cannot be fully assigned to
70 rheological behavior. For this reason, the combined study of tribology and rheology has been suggested as a
71 promising alternative to explain oral perception (Chen, Liu, & Prakash, 2014; Liu, Stieger, van der Linden, &
72 van de Velde, 2015; Malone, Appelqvist, & Norton, 2003; Nguyen,Bhandari & Prakash, 2016; Nguyen,
73 Nguyen, Bhandari & Prakash, 2015; Pradal & Stokes, 2016; Prakash, Tan, & Chen, 2013).
74
75 Classical tribology which is the study of friction behaviour of Newtonian isotropic lubricants has been
76 applied, with adaptations, to understand the lubricant properties of food multicomponent systems. In classical
77 tribology, the general lubrication trend is explained by the Stribeck curve consisting of a plot of coefficient of
78 friction (CoF) versus the dimensionless lubrication parameter , which is defined by relation between

ACCEPTED MANUSCRIPT
4
79 dynamic viscosity d [N s m2], sliding speed [mm s-1] and normal load force projected on the geometrical
80 surface [N m-1] (Eq. 1).
81
N
d
F
(1)
82
83 Three regimes can be distinguished from the classical Stribeck curve, they are named: (1) boundary, (2) mixed
84 and (3) hydrodynamic. The boundary regime is typically observed at low speeds and the friction is mainly
85 generated by the interaction between the two rubbing surfaces (severe wear). As the sliding speed increases,
86 the entrained lubricant reduces the contact of the surface roughness, until the limiting condition of fully
87 separated surfaces is reached; this phase is assigned as mixed regime. Subsequently, further increase in speed
88 causes an increase in the friction coefficient, which relies on the internal friction of the lubricant fluid
89 (resistance to flow) (Gohar & Rahnejat, 2008).
90
91 Food Tribology is an emerging research area focused on understanding the lubrication between tongue and
92 palate in the presence of a thin layer of food experiencing sliding speeds ranging from 1 to 50 mm s-1
93 (Chojnicka-Paszun, de Jongh, & de Kruif, 2012; Malone, et al., 2003). Many efforts have been devoted to
94 mimic the environment conditions of the mouth in tribo-rheological apparatus, including temperature control
95 (generally maintained at 35-37 ○C) and injection of saliva on the surface of the substrate (Selway & Stokes,
96 2013) which must present roughness similar to that observed by the tongue (Nguyen, Nguyen, Bhandari, &
97 Prakash, 2015). The use of saliva, however, cannot assure complete sensory correlation as it is produced as
98 part of a dynamic process during oral processing. Moreover, the composition of human saliva is variable
99 among individuals (Chiappin, Antonelli, Gatti, & De Palo, 2007) which compromises the efficacy of using
100 artificial saliva for this kind of study.
101
102 Thus, finding the correlation between sensory attributes and tribo-rhelogical results is an exciting but still
103 unsolved problem. The deep understanding about tribological regime is essential before achieving correlation with
104 sensory. As an example, Selway and Stokes (2013) investigated the effect of fat content on commercial

ACCEPTED MANUSCRIPT
5
105 samples of custards and yogurt in the rheology and tribology profile. Another interesting work was conducted
106 by Liu, Stieger, van der Linden, & van de Velde (2015) where sensory profile was correlated with tribological
107 and rheological behavior of emulsion-filled gels as models for semi-solid and solid foods. They have used
108 Confocal Laser Scanning Microscopy (CLSM) to capture differences in the microstructure after submitting
109 the product to shear in an Optical tribological configuration (OCT). Their edible system was prepared with
110 non-dairy fat from various sources (beef, pork and poultry), surfactants (Tween 20, whey protein isolate) and
111 pork gelatin as gel matrix. Laguna et al. (2017) have recently shown that typical Stribeck curves presented
112 different sensitivity to fat content for dairy liquid and semi-solids. The friction curves were not successful in
113 discriminating whole and skim milk in presence of artificial saliva. Conversely, the curves were effective in
114 differentiating the fat content of yoghurt and cheese for experiments conducted with and without saliva.
115
116 Although Stribeck analysis has been widely reported in the study of food-related products; Gabriele, Spyropoulos
117 & Norton (2010) have reported that the dependence of friction on increasing sliding speed ramp for fluid gels
118 composed of agarose could not be analyzed in terms of classical tribology. They proposed a mechanism of
119 fluid gel lubrication which divides the friction curves in three zones: Zone A, at low sliding speed, only the
120 fluid medium can be entrained into the gap formed between ball and the disk (decreasing CoF trend); Zone B,
121 represented by the entrainment of the particles (increasing CoF trend) and Zone C where the sliding speed is
122 high allowing more particles in the gap and CoF depicts a decreasing trend again as the magnitude of the gap
123 is higher than the size of the entrained particles. The rich literature reporting about tribology of fluids and gels
124 which are commonly used as emulsifiers and thickener agents helps to understand the mechanisms of friction
125 represented by real multicomponent food systems (Fernández Farrés & Norton, 2015; Gabriele, Spyropoulos,
126 & Norton, 2010; Garrec & Norton, 2013; Malone, et al., 2003; Moakes, Sullo, & Norton, 2015).
127
128 In this research, we investigated the combined effect of essential ingredients (starch, -carrageenan and fat) on
129 the friction behavior of custard desserts. A simple tribo-rheometer set-up (Nguyen,Bhandari & Prakash, 2016;
130 Nguyen, Nguyen, Bhandari & Prakash, 2015) was used to evaluate the friction behavior. Depending on the
131 product tested, this device can perform friction measurements at sliding speeds up to 1000 mm s-1. For less

ACCEPTED MANUSCRIPT
6
132 viscous materials, such as chocolate milk, a threshold sliding speed is observed at 50 mm s-1 when friction
133 sound can be heard, due the vibration caused by micro-impact of the two rubbing surfaces.
134
135 Our findings were focused on the description of tribological regimes without the use of saliva as lubricant
136 agent of the substrate surface. CLSM images were taken at the turning points of the identified tribo-regimes to
137 support our hypothesis of selective particle/fluid entrainment within the gap formed between the geometry and
138 substrate surface by increasing sliding speed. Sensory analysis was conducted to reveal whether the panelists
139 were able to discriminate the samples based on the concentration of fat, starch and -carrageenan. The
140 sensitivity of sensory analysis was compared with the one obtained by rheology and tribology experiments by
141 showing different trends and magnitudes according to the formulation tested. It is worth mentioning that tribo-
142 rheological experiments mimic the food oral processing only in terms of temperature, shear range and
143 roughness of the substrate (3M tape).
144
145
146 2. MATERIALS AND METHODS
147
148 2.1 Materials
149 Custard formulations were prepared in the laboratory using skim milk powder purchased from Total Foodtec
150 Pty ltd.; natural vanilla extract (Queen Fine Foods, Australia), caster sugar and pure cream (Parmalat,
151 Australia) from local markets. Other ingredients such as, modified tapioca starch (product code: Kreation
152 440), -Carrageenan (product code: MV306) and sodium hexametaphosphate (product code: 65 Food Grade)
153 were provided by IMCD-Australia.
154
155
156
157
158

ACCEPTED MANUSCRIPT
7
159 2.2 Custard preparation
160 Custard dessert formulations were prepared as follows. At first, skim milk powder was hydrated in water for 3
161 hrs using an overhead propeller stirrer at 1200 rpm. Afterwards, caster sugar, hexametaphosphate, thickener
162 agent (-Carrageenan) and cream were incorporated to the mixture which was transferred to a water bath (T =
163 95 ºC) and held under constant stirring for 15 minutes. Then, pre-gelatinized starch was poured into the
164 mixture which remained in the water bath for 30 min. Vanilla flavor was added to the composition 5 min
165 before the completion of cooking. The thermo-reversible gels formed after subsequent cooling at room
166 temperature were disrupted and homogenized using a MultimixTM high-shear mixer (HSM 2003 SV/SLI).
167
168 A central composite design (CCD) containing a 23 factorial design with 3 center points was performed to
169 estimate the effects of starch (ST), -Carrageenan (Car) and fat (F) on the particle size distribution and
170 rheological behavior of the custard dessert formulations. The tested concentrations of starch, Car and fat are
171 described in Table 1. The content of skim milk powder (10% w/w), caster sugar (4.5% w/w), Vanilla flavor
172 (1% w/w) and sodium hexametaphosphate (0.1% w/w) were kept constant.
173
174 Table 1
175
176 2.3 Laser scattering
177 Laser scattering technique was performed for measuring the particle size distribution of each custard sample. A
178 Mastersizer 2000 (Malvern Instruments, Worcestershire, UK) was used for the measurements; assuming a regular
179 spherical shape of the particles (Mie Scattering Principle) (Malvern-Instruments, 2007a). The refractive index of
180 the material and dispersant was, respectively, 1.46 (milk-fat) and 1.33 (water) (Malvern-Instruments, 2007b).
181 Volume mean diameter (D4,3) was considered as dependent variable of the factorial design.
182
183
184
185

ACCEPTED MANUSCRIPT
8
186 2.4 Rheological and tribological measurements
187 All samples were equilibrated at room temperature (22 - 25C) for 1 hour prior to rheological and tribological
188 measurements which were performed at 35C to simulate the oral condition.
189
190 2.4.1 Rheological and tribological measurements
191 Rheometer set-up
192 Steady state and dynamic measurements were conducted with an AR-G2 rheometer (TA Instruments, USA) at
193 1000 m gap using 40 mm stainless steel sandblasted geometry (surface roughness of 4 ± 2 µm). A solvent
194 trap cover and solvent trap geometry partially filled with distilled water were used to maintain a thermally
195 stable vapour barrier and avoid sample evaporation during the experiments.
196
197 Steady state and dynamic operational procedure
198 For the steady state shear measurements, a shear rate ranging from 0.1 to 1000 s-1 was applied with acquisition
199 rate of 10 points per decade. Since shear rates ranging from 10 to 100 s-1 demonstrate a correlation for
200 chewing and swallowing of foods (Shama & Sherman, 1973), the apparent viscosity at 50 s-1 was used as a
201 parameter of comparison among samples. Dynamic experiments were conducted for semi-solid samples only
202 within the linear viscoelastic range (LVR) running a frequency sweep small enough to avoid the collapse of
203 the structure (strain 0.01%). Storage modulus ( ) and the loss modulus ( ) were recorded over the range 'G ''G
204 =1-100 rad s-1 of angular frequency.
205
206
207 2.4.2 Tribological measurements
208 Tribo-rheometer set-up
209 Tribological tests were performed on a Discovery Hybrid Rheometer (TA Instruments, USA) to evaluate the
210 lubricant properties of each custard formulation, as described elsewhere (Nguyen,Bhandari & Prakash, 2016;
211 Nguyen, Nguyen, Bhandari & Prakash, 2015). Fig. 1 illustrates the tribo-rheometer configuration which
212 consists of a ring on plate geometry coupled to a rheometer head through coupling adapter and beam coupling

ACCEPTED MANUSCRIPT
9
213 to perform rotation movement. The ring's dimensions allows for a well-defined contact surface permitting the
214 computation of the friction and normal stress.
215
216 Figure 1
217
218 Solid substrate (3M Transpore Surgical Tape 1527-2) with known surface roughness and well depth (Ra =
219 31.5 m, well depth = 170 m, respectively) was cut in a square shape, placed and fixed on top of the
220 lower plate geometry before the measurement (Nguyen, Nguyen, Bhandari & Prakash, 2015). The choice of
221 the substrate was based on the human tongue roughness ranging from 42-95 m (Nagaoka, et al., 2001)
222 and the heights of filiform and fungiform papillae within 200-300 m and 100 m, respectively (Ranc,
223 Servais, Chauvy, Debaud, & Mischler, 2006).
224
225 Friction behavior operational procedure
226 Through preliminary tests, it was possible to determine the time and quantity of material necessary for each
227 run. It is worth mentioning that the time applied during the tribological test cannot be related to the time of
228 oral processing, but it is associated to the time required for reaching friction equilibrium at each sliding speed
229 recorded. The amount of sample must be enough to cover the surface of the substrate with a thin film (~ 2
230 mm) of product. For custard, the recommended amount of material to spread over the surface of the substrate
231 is 0.5 g. A practicable time of 10 min was adopted for all the experiments based on the reproducibility of the
232 friction curves and absence of dried debris at the end of the run. The samples were spread over the surface of
233 the substrate and a normal force of 2N was set by adjusting the gap between the surface and geometry.
234 Conditioning step was performed by pre-shearing the samples at the rotational speed of 0.01 rad s-1 for 1
235 minute, and then they were equilibrated for another 1 minute before each measurement. Afterwards,
236 increasing rotational speed (IRS) ramp was set from 0.01 to 6.5 rad s-1 with acquisition of 20 points per
237 decade during 10 min of experiment. During the tribological test, the coefficient of friction (CoF) was
238 determined as the ratio of friction stress ( ) to the normal stress ( ), described by Eq. 2, and plotted F N
239 against the increasing sliding speed (Eq. 3) in log-log scale.

ACCEPTED MANUSCRIPT
10
240
2
12
2
12
rrrr
FMCoF
NN
F
(2)
241
242 Where : torque [N m] and : normal force [N].M NF
243
Rvs (3)
244 Where is the sliding speed [mm s-1], is the average between ring inner and outer radius ( =14.5 mm sv R 1r
245 and =16 mm) and is the controlled rotational speed [rad s-1]. 2r
246
247 The friction curves (CoF vs sliding speed) were analyzed in terms of the following friction parameters: initial
248 CoF (CoFi), corresponding to CoF measured at 0.15 mm s-1; minimum CoF (CoFmin) and peak height (h,
249 observed only for certain samples) from the baseline built passing through CoFmin using the Peak Analyzer
250 Tool of OriginLab (version OriginPro 8.5) at second derivative mode.
251
252
253 2.5 Confocal laser microscopy (CLSM)
254 Staining was performed at ambient temperature. Except for nile red which was dissolved in PEG200 solution, all
255 the dyes used were dissolved in distilled water at concentration of 0.01 g L-1. Nile red (Sigma-Aldrich), fast-
256 green FCF (Sigma-Aldrich), fluorescein-isothiocyanate FITC (Sigma-Aldrich) and calco-fluor white (Sigma-
257 Aldrich) were used to label, respectively, fat, protein, starch and Car. Equal proportions of the dyes were added
258 to sample before tribological experiment (10 L of dye mixture per g of sample). Stained custard was placed on
259 the surface of the substrate and an increasing speed setting was programmed as described in Section 2.4. The
260 rotating geometry was stopped at different stages of the friction curve (0.5, 2.5 and 10 mm s-1 of sliding speed)
261 determined by the friction behavior results. Once the geometry was stopped, it was raised and the tape was
262 removed for imaging of the friction area using a Diskovery Spinning Disk Confocal system (Nikon).
263

ACCEPTED MANUSCRIPT
11
264
265
266 2.6 Contact angle measurement
267 Aiming to estimate the hydrophobicity of the 3M tape, the contact angle formed by sessile droplets of water
268 and ethanol was measured using an OCA 15 EC/B Dataphysics GmbH (Germany). The drop was allowed to
269 equilibrate on the substrate surface for a total of 30 seconds.
270
271
272 2.7 Sensory evaluation
273 Custard samples selected for sensory measurements are indicated in Table 1 by asterisk symbols (*). Panelists
274 were seated in sensory booths with appropriate ventilation and lighting. Two sessions were conducted
275 according to the Ranking descriptive analysis (RDA) sensory method described in (Richter, de Almeida,
276 Prudencio, & de Toledo Benassi, 2010):
277
278 Session I (attribute generation): all the samples were presented to the assessors simultaneously.
279 They were asked to evaluate each sample and record all the perceived attributes related to texture.
280 Upon evaluation of all samples, they were asked to give a list of descriptive terms. To prepare the
281 panel for Session 2, the assessors were told to order the samples for intensity; e.g. least viscous to
282 most viscous.
283
284 Session II (sample rating): a list of common attributes were generated from Session I and given to
285 the same assessors. They were asked to rank the samples in order of intensity for each attribute. Table
286 2 shows the textural descriptors and their definitions used in our study.
287
288 A maximum of 5 samples were served per session. Equal amounts of each sample were placed into 60 mL
289 cups labelled with randomly selected 3-digit codes and equilibrated at room temperature for at least 1 h before
290 consumption. Samples were served to panelists with mineral water for palate cleaning. Eleven panelists
291 evaluated samples for predefined textural attributes (Table 2) using a quantitative scale with increasing score

ACCEPTED MANUSCRIPT
12
292 from 1 to 5. Friedman non-parametric analysis of variance was performed to detect differences in the
293 perception of oral attributes. The analysis was conducted in Minitab 17 (Minitab Inc., Chicago).
294
295 The least significant difference (LSD) for rank sums was also used for comparison between two individual
296 products. Samples whose rank sums differed by more than LSD calculated amount (Eq. 6) were considered
297 significant different (Lawless, 2010).
298
6
196.1
JJKLSD (6)
299
300 Where and which represent the number of products ranked and panelists, respectively. Hence, 5J 11K
301 in this study, .55.14LSD
302
303 Table 2
304305 2.8 Statistical analysis
306
307 Particle volume mean diameter (D4,3), apparent viscosity measured at 50 s-1 shear rate (50) and the friction
308 parameters (CoFi, CoFmin and h) were presented as mean ± standard deviation (SD) of triplicate experiments.
309 MiniTab 17 software was used to analyse the significance of differences between the values (where
310 applicable) using Analysis of Variance (ANOVA) with Tukey's HSD (honest significant difference) post hoc
311 test at family error rate 5 at 95% of confidence level.
312
313
314
315
316
317

ACCEPTED MANUSCRIPT
13
318 3. RESULTS AND DISCUSSION
319
320 3.1 Particle size distribution
321 Particle size distribution of the custard formulations ST(1)_Car(0.0)_F(0), ST(2)_Car(0.15)_F(3) and
322 ST(3)_Car(0.30)_F(6) are depicted by Fig. 2a, 2b and 2c, respectively. In absence of fat and Car, custard
323 exhibited a mono-modal distribution which was assigned to the dispersed swollen starch granules. Overall,
324 bimodal distribution was predominant for samples containing fat and Car. However, a small peak could be
325 observed between 100 and 1000 m for lower concentrations of Car which was assigned to the partial
326 coalescence of milk-fat droplets. The major population coincided with that seen for ST(1)_Car(0.0)_F(0).
327 The small population with particle sizes ranging from 2 to 10 m was attributed to the presence of fat
328 globules. These results are in agreement with previous observation for custard size distribution (Tarrega &
329 Costell, 2006).
330
331 Table 3 describes the calculated volume mean diameter (D4,3) for all custard samples prepared at the proposed
332 conditions by the factorial design explained in Section 2.2. Sample ST(3)_Car(0.3)_F(0) depicted an average
333 size of 35.3 ± 0.9 m which was not significant different from samples ST(1)_Car(0.3)_F(0),
334 ST(1)_Car(0.3)_F(6) and ST(2)_Car(0.15)_F(3). The average size observed for these samples are of higher
335 magnitude than the 3M tape roughness, Ra = 31.5 m, determined previously by Nguyen, Nguyen, Bhandari
336 & Prakash (2015). This important information can explain the entrainment of particles at low speeds of the
337 friction curves (to be discussed in details by Section 3.4.1). A clear view of the significant effects of starch,
338 Car and fat on D4,3 is shown by the Pareto charts illustrated by Fig. 3a. By adding Car, the average particle
339 size increased as a result of small aggregated particles entrapped by the network formed between Car and
340 casein micelles. However, the combined effects of Car and starch resulted in a decay of the average particle
341 size. Probably, an increase in the concentration of these two ingredients reduces the formation of gel
342 structures between Car and casein and halts the development of aggregated particles. Negative effect was
343 observed upon addition of fat which has lower size than that observed by starch granules in Fig. 2a.
344

ACCEPTED MANUSCRIPT
14
345 Figure 2
346
347 Table 3
348
349 Figure 3
350
351
352 3.1 Flow curves of custard dessert
353 The Pareto’s chart shown by Fig. 3b demonstrates that the linear effects of Car, starch and the interaction
354 between Car and starch increased significantly the 50 values. This trend is in agreement with previous
355 studies which show the ability of starch and polysaccharides, such as Car, to act as thickener agents
356 (Tarrega, et al., 2006; Toker, Dogan, Caniyilmaz, Ersöz, & Kaya, 2013). Carrageenans are widely used in
357 dairy desserts due their gelling, thickening, and stabilizing properties. Their structures are characterized by a
358 linear polysaccharide consisting of repeating disaccharide sequences containing α-D-galactopyranose) and β-
359 D-galactopyranose linked through 1-C-3 and 1-C-4 positions, respectively. Among the common varieties of
360 carrageenans (Kappa, Iota and Lambda), kappa possesses the stronger gelling ability followed by iota, which
361 form soft gels in presence of potassium and calcium. Lamda does not form gel when dispersed in aqueous
362 solution; it is used as thickener agent. Gelling types carrageenan contain a 3,6 anhydro bridge on the B unit
363 which forces the carbohydrate backbone to flip from 4-C-1 to a 1-C-4 conformation. The generated helix
364 conformation can form cross-link networks and gels (Necas & Bartosikova, 2013).
365
366 Fig. 3b also reveals that the interaction effects “Car & fat” and “starch & fat” decreased the 50 values. This
367 indicates that the interspersed fat throughout the Car-starch network possesses the ability of reducing the gel
368 strength. Similar behavior has been observed for different dairy semi-solid systems. As an example, Nguyen,
369 Bhandari & Prakash (2016) observed a decrease in the strength of protein network as the fat content increased in
370 cream cheese samples.
371

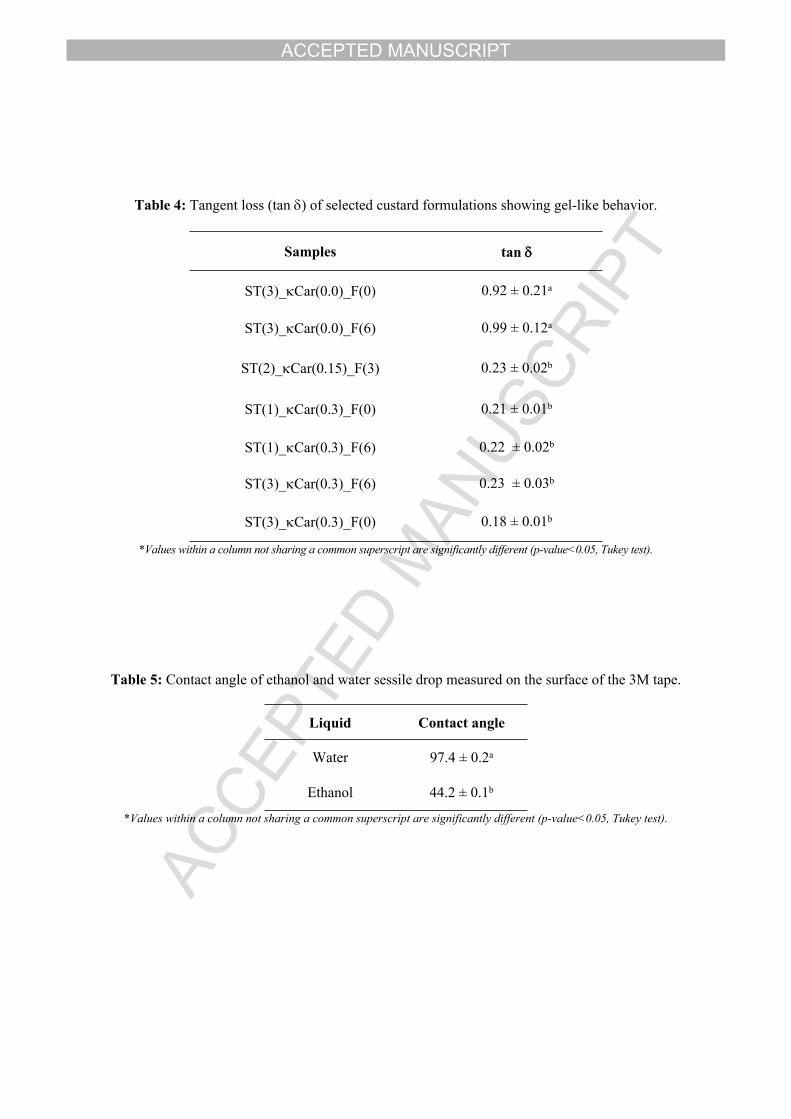
ACCEPTED MANUSCRIPT
15
372 Fig. 4 shows that the rheological pattern in terms of the viscosity dependence against shear rate was
373 influenced by the composition of starch, Car and fat in the prepared custard desserts. A stronger
374 pseudoplastic behavior was observed for the samples containing high levels of starch and Car which is a
375 common characteristic of semi-solid foods (McCarthy, 2003). Compositions low in starch and κCar (e.g.,
376 ST(1)_Car(0.0)_F(6) and ST(1)_kCar(0.0)_F(0)) depicted apparent viscosity ranging from around 0.1 to
377 0.001 Pa s over the four decades of shear rate, which is within the range of liquid dairy products (Nguyen,
378 Bhandari & Prakash, 2016).
379
380 Figure 4
381
382 3.2 Viscoelastic properties
383 Fig. 5 depicts the storage modulus (G’) and loss modulus (G’’) between two decades of the angular frequency
384 axis. The majority of the custard formulations exhibited viscoelastic properties including both solid (elastic)
385 and liquid properties (viscous). Addition of Car produced a remarkable increase in both viscoelastic
386 functions: G’ and G’’. Furthermore, formulations containing Car depicted G’> G’’ which characterizes gel-
387 like behavior. A clear effect of Car, fat and starch concentrations on the viscoelastic properties was observed
388 by calculating the loss factor equation ( ) at an angular frequency of 10 rad s-1 (Table 4). As tan/G''G'
389 described by Table 4, no significant difference was observed on the gel strength upon addition of fat to the
390 custard formulation.
391
392 Figure 5
393
394 Table 4
395
396 3.3 Friction curves of custard dessert
397 By allowing a product to be entrained between two rubbing surfaces friction loss and/or gain can be observed
398 depending on the ability of the material to deposit on the static surface at different speeds. Conditions that
ACCEPTED MANUSCRIPT
16
399 facilitate the material entrainment, such as, particle size smaller than the surface roughness and interactions
400 forces within functional groups of material and tape will reduce friction by preventing the dry contact between
401 the two rubbing surfaces. The mechanisms of product entrainment in the gap formed between the rubbing-
402 surfaces of the tribo-pair can be explained by measuring CoF from a condition of dry-contact (very low
403 sliding speed) to high sliding speeds.
404
405 Fig. 6 shows four pairs of friction curves (with and without fat) grouped according to their composition of
406 starch and Car where: ST(1)_Car(0.30), ST(1)_Car(0.0), ST(3)_Car(0.30) and ST(3)_Car(0.0) sets are
407 depicted by Figs. 6a to 6d, respectively. As can be seen, the trend presented by the friction data differed
408 widely in shape from Classical Stribeck curves which is characterized by a decrease in friction during ramp-
409 up sliding speed experiments, followed by a minimum CoF as the hydrodynamic regime is activated. Despite
410 this, our study enabled to discern broad patterns in the CoF measures, both across two main groups (with and
411 without fat) and over long stretches of sliding speed.
412
413 Figure 6
414
415 Fig. 7 illustrates a schematic representation of the friction behaviour exhibited by non-fat and fat-containing
416 samples. The friction parameters indicated by the arrows in Fig. 7 are described in Table 3; they correspond
417 to CoF measured at 0.15 mm s-1 (CoFi), minimum CoF (CoFmin) and peak height from the baseline shown as
418 dashed line (h). The last two parameters were determined by creating a baseline and finding peaks using the
419 Peak Analyzer Tool of OriginLab (version OriginPro 8.5) at second derivative mode. As expected, non-fat
420 samples presented higher CoF values (see Table 3, non-fat samples showed CoFi ~ 0.57 and CoFmin ~ 0.34;
421 while fat-containing samples depicted CoFi = 0.20 to 0.13 and CoFmin ~ 0.12) over the sliding speed range
422 investigated. Interestingly, non-fat and fat-containing samples were different not only in magnitude but in
423 friction behaviour against sliding speed.
424
425 Figure 7

ACCEPTED MANUSCRIPT
17
426 The friction profile of non-fat samples was characterized by a decreasing CoF trend until CoFmin at around 10
427 mm s-1. It is worth mentioning that, although the addition of κCar (0 to 0.3% w/w) and starch (from 1 to 3%
428 w/w) caused an increase in viscosity for free-fat samples (as illustrated by flow curves, Fig. 4), the friction
429 behavior in absence of fat was slightly influenced by Car and starch. It is believed that, for non-fat samples,
430 the mechanisms governing product entrainment in the decreasing CoF zone are not strongly dependent on
431 hydrophobic interactions, as per the absence of fat. Probably, it mostly relies on the selective entrainment of
432 liquid and/or particles of smaller size than the magnitude of the tape roughness which defines the gap formed
433 between the tape and tribo-geometry as the sliding speed increases.
434
435 The friction behaviour of fat-containing samples, however, is more likely to be associated with hydrophobic
436 interactions between the entrained product and the substrate surface. The 3M tape used in this study as
437 substrate is made of polyester-rayon blend which naturally shows hydrophobic and hydrophilic sites, from
438 polyester and rayon (regenerated cellulose fiber), respectively. As described by Table 5 the comparison
439 between the contact angle formed by a sessile droplet of water (most polar solvent) and ethanol reinforces the
440 predominant hydrophobic characteristic of the material which composes the substrate. The prevailing non-
441 polar sites lead to hydrophobic interactions with the emulsified fat droplets, forming a lubricant film on the
442 surface of the tape (see Fig. 7).
443
444 Table 5
445
446 Fig. 7 clearly shows that fat-containing samples depicted CoFmin much earlier in the friction curve (at ~ 1 mm
447 s-1 against ~ 10 mm s-1 for non-fat samples). Afterwards, depending on the content of starch or Car, a peak or
448 upward curve reaching a plateau could be observed within the first and second decades of sliding speed range.
449 The high of the peaks (seen for samples ST(1)_Car(0.3)_F(6), ST(3)_Car(0.3)_F(6) and
450 ST(2)_Car(0.15)_F(3)) or plateau shape (ST(3)_Car(0.0)_F(6) only) was not significantly different within
451 samples (h = 0.03) and it represents an input of at least 30 % on the pre-determined CoFmin values.
452
ACCEPTED MANUSCRIPT
18
453 In this study we hypothesize that the parameters CoFi, CoFmin and CoFmin + h can be identified as boundary
454 elements that delimit tribological regimes in fat-containing samples; except for sample ST(1)_κCar(0.0)_F(6)
455 which presented visible fat lumps (causing inaccurate CoF measure, as per the large error bars) due to the
456 absence of Car and low concentration of starch. The tribological regimes were named as TR_1, TR_2 and
457 TR_3 as indicated by Fig. 7 and can be explained as follows:
458 TR_1: this regime was characterized by a decreasing trend on CoF values from CoFi to CoFmin as a
459 result of selective entrainment of the fluid medium between the surfaces in contact (at this stage no
460 particles are driven in the gap) (Gabriele, Spyropoulos & Norton, 2010). The lack of consistency on
461 CoF measurement was associated to a transition period from dry-contact condition (static tribo-
462 geometry) to the early stage of liquid entrainment.
463
464 TR_2: this corresponds to the upward curve observed after CoFmin as the sliding speed further develops. The
465 estimated 30 % augment in CoFmin (based on h value, see Table 3) was assigned to a gradual gel particles
466 entrainment which was confirmed by CLSM images illustrated in next section for ST(2)_kCar(0.15)_F(3)
467 friction experiment recorded at sliding speed of 2.5 mm s-1 (Gabriele, Spyropoulos & Norton, 2010).
468
469 TR_3: the trend observed in TR_3 relies on the ability of the entrained material to accumulate on the
470 surface of the static substrate. Different layers will be formed as the number of particles driven to the
471 gap increases. As the thickness of the lubricant film is, at this stage, much larger than the size of an
472 individual particle, friction and viscosity effects take place. The decay of CoF will rely on the ability
473 of the multicomponent system to thicken the lubricant film (Liu, Stieger, van der Linden, & van de
474 Velde, 2015). While formulations ST(1)_Car(0.3)_F(6) and ST(3)_Car(0.3)_F(6) depicted a
475 decreasing CoF, for ST(3) _Car(0.0)_F(6) CoF remained constant in TR_3. This suggests that the
476 late release of the fat initially entrapped in very inner regions of the formed network by starch-Car-
477 milk proteins can contribute for a faster CoF decay.
478
479

ACCEPTED MANUSCRIPT
19
480
481 3.4 Microstructure analysis
482 Figs. 8a to 8c illustrate magnified images (20 x) of skim milk colloidal suspension (control sample),
483 ST(3)_Car(0.0)_F(0) and ST(2)_Car(0.15)_F(3) custards, respectively. Fig. 8a depicts a homogenous phase
484 characteristic of dissolved skim milk powder. During the preparation of custard, pre-gelatinized starch is introduced
485 to the system. In Figs. 8b and 8c, it is possible to observe the microstructure starch granules with size ranging
486 from 10 to 40 m; which corroborates with the size distribution curves depicted by Fig. 2. Fig. 8d shows the
487 CLSM image acquired for stained ST(2)_Car(0.15)_F(3), prior to friction experiment, using fluorescence probes
488 Nile Red, Fast Green, Calco-Fluor White and FITC to label, respectively, fat, protein, polysaccharide (in this case,
489 Car) and starch. Although FITC is a common probe used to bind starch, it has not effectively labeled starch in the
490 sample tested. It can be suggested that the expected reactions between starch and probe were hindered by the
491 network formed with gelatinized starch and casein. Hence, the black spaces shown in Fig. 8d were associated to the
492 presence of gelatinized starch surrounded by a network composed of protein (pink colour) and Car (blue colour).
493
494 Figure 8
495
496 Fig. 9 shows CLSM images obtained at different stages of the friction curve for ST(2)_Car(0.15)_F(3). This
497 sample was chosen because it presents all the proposed mechanisms of entrainment from low to high speeds. As
498 observed by Fig. 8d, the microstructure of custard before the action of friction shows a network formed between
499 protein (pink), starch (green) and Car (blue) containing entrapped fat (red). At low speeds, the decay of CoF
500 previously explained by the entrainment of liquid can be observed by the presence of all the labeled ingredients
501 evenly distributed at the CLSM image recorded at 0.5 mm s-1. The CLSM image acquired at 2.5 mm s-1, where
502 Car and fat can be predominantly seen demonstrates an indicative of gel particles entrainment zone (TR_2).
503 Upon application of friction, the entrained particles will have their structure disrupted and milk fat droplets
504 which are non-polar by nature tend to move towards the hydrophobic sites of the 3M tape surface used to mimic
505 tongue surface which is intrinsically hydrophobic but hydrophilic if coated with mucous fluid (Dresselhuis, Van
506 Aken, De Hoog, & Cohen Stuart, 2008). Thus, decreasing and/or constant CoF regime (TR_3) takes place due to

ACCEPTED MANUSCRIPT
20
507 the accumulation of multilayers of material which favor the separation of the two rubbing surfaces. Evidences of
508 multilayer deposition at high speeds can be observed by the CLSM image taken at 10 mm s-1. This image clearly
509 shows that the amount of protein and fat increased in comparison to the previous picture (2.5 mm s-1). The
510 increase of all labeled ingredients was assigned to the multilayer deposition at high speeds.
511
512 Figure 9
513
514
515 3.5 Sensory profiling of selected custard formulations
516 Table 6 shows that by using ranking test analysis, the selected samples were successfully differentiated in
517 terms of thickness, stickiness, oiliness, creaminess and smoothness (p<0.05). Higher viscosity was perceived
518 for ST(3)_Car(0.3)_F(6), followed by ST(1)_Car(0.3)_F(6), ST(2)_Car(0.15)_F(3),
519 ST(3)_Car(0.0)_F(6) and ST(3)_Car(0.0)_F(0). Exactly the same decreasing order of viscosities measured
520 at a shear rate of 50 s-1 was observed; suggesting that this condition represented well the flow behavior of
521 custard in the mouth during sensory rating. The perception of thickness was closely related to the presence of
522 Car, once no significant differences were observed by decreasing the amount of starch in the comparison
523 between samples ST(1)_Car(0.3)_F(6) and ST(3)_Car(0.3)_F(6). Similarly, the effect of fat on the
524 thickness attribute was neglected; as the difference rank sum within the products ST(3)_Car(0.0)_F(0) and
525 ST(3)_Car(0.0)_F(6) was lower than 14.55 (value of LSD).
526
527 Table 6
528
529 As expected, samples presenting high ranking sum for the viscous attribute depicted the highest levels of
530 stickiness. Stickiness, however, cannot be mainly characterized as a bulk-related sensory attribute.
531 Surface-related features, such as, lubricant properties are likely to play an important role on the
532 perception of stickiness.
533

ACCEPTED MANUSCRIPT
21
534 Oiliness, creaminess and smoothness were only perceived upon variations in the fat content; as per
535 comparison among samples ST(2)_Car(0.15)_F(3), ST(3)_Car(0.0)_F(0) and ST(3)_Car(0.0)_F(6) (RS >
536 14.55). These are common attributes used to describe mouthfeel when food is confined to an extent that the
537 shearing surfaces of tongue and palate interact (Selway & Stokes, 2013). As an example, De Wijk and
538 collaborators have extensively studied the effect of fat content on creaminess and oiliness attributes of custard
539 desserts. They have demonstrated that liberation of fat from starch matrix occurs when it is broken down by
540 salivary amylase. Then free fat can migrate by convection currents to the surface of the food bolus acting as
541 lubricant agent between the bolus and oral tissue (de Wijk, et al., 2007; de Wijk, et al., 2004; Engelen, et al.,
542 2003). Aligned to saliva effect, entrainment speed also play important role on breaking down the gel
543 microstructure of custard facilitating the transport of fat from inner-gel to regions near the surface where it can
544 reduce friction. Our tribological study considered only the effect of entrainment speed on friction profile. In
545 absence of saliva it was possible to observe influences exerted by Car and starch on CoF which were
546 associated to mechanisms of particle entrainment and interactions between product and substrate (3M tape).
547 As it has been well reported by literature (Selway & Stokes, 2013; Laguna et al., 2017) the presence of saliva
548 facilitates the food microstructure breaking down and it renders hydrophilic features to the intrinsically
549 hydrophobic tongue surface. Hence, mechanisms of product entrainment between tongue and palate will
550 deviate from that observed by the tribometer set-up which uses a substrate, with predominant hydrophobic
551 sites, non-wetted by mucus fluid.
552
553
554
555
556 4. CONCLUSION
557 This study demonstrated that Car played an important role in the flow and friction behavior of fat-containing
558 custard formulations. However, no influences were observed in the friction profile upon addition of this
559 hydrocolloid in free-fat formulations. This indicates that the mechanisms of product entrainment as the sliding
560 speed increases are affected by adding Car or even increasing the content of starch due to changes on the

ACCEPTED MANUSCRIPT
22
561 hydrophobic interactions between the tape and emulsified fat. Despite the friction profile has demonstrated
562 sensitivity to the addition of Car, no influences on surface-related attributes (e.g., oiliness, creaminess) was
563 observed on sensory measurements of samples with and without Car. This was attributed to the presence of
564 saliva, during the real oral processing, facilitating the food microstructure breakdown and release of fat which,
565 in turn, migrates to the surface of tongue and palate forming a lubricant film. Our present tribological study
566 takes into consideration only the effects of sliding speed range, temperature and roughness of surface similar
567 to that observed in the tongue; further studies will involve the addition of saliva in the tribological apparatus
568 to achieve improved simulation of the mouth conditions. By understanding how hydrocolloids influences flow
569 and friction behavior and its relation with sensory measurements much savings can be generated to industry.
570
571
572 Acknowledgements
573 The authors are thankful to Dr Shaun Walters from School of Biomedical Sciences (SBMS-UQ) for his
574 support during the acquisition of CLSM images.
575
576
577 Funding Sources
578 This research was supported under Australian Research Council's Industrial Transformation Research
579 Program (ITRP) funding scheme (project number IH120100005). The ARC Dairy Innovation Hub is a
580 collaboration between The University of Melbourne, The University of Queensland and Dairy Innovation
581 Australia Ltd.
582
583
584
585
586
587

ACCEPTED MANUSCRIPT
23
588
589
590
591
592 REFERENCES
593
594
595 Chen, J., Liu, Z., & Prakash, S. (2014). Lubrication studies of fluid food using a simple experimental set up.
596 Food Hydrocolloids.
597 Chiappin, S., Antonelli, G., Gatti, R., & De Palo, E. F. (2007). Saliva specimen: A new laboratory tool for
598 diagnostic and basic investigation. Clinica Chimica Acta, 383(1-2), 30-40.
599 Chojnicka-Paszun, A., de Jongh, H. H. J., & de Kruif, C. G. (2012). Sensory perception and lubrication
600 properties of milk: Influence of fat content. International Dairy Journal, 26(1), 15-22.
601 de Wijk, R. A., & Prinz, J. F. (2007). Fatty versus creamy sensations for custard desserts, white sauces, and
602 mayonnaises. Food Quality and Preference, 18(4), 641-650.
603 de Wijk, R. A., Prinz, J. F., Engelen, L., & Weenen, H. (2004). The role of α-amylase in the perception of oral
604 texture and flavour in custards. Physiology & Behavior, 83(1), 81-91.
605 Dresselhuis, D. M., Van Aken, G. A., De Hoog, E. H. A., & Cohen Stuart, M. A. (2008). Direct observation of
606 adhesion and spreading of emulsion droplets at solid surfaces. Soft Matter, 4(5), 1079-1085.
607 Engelen, L., de Wijk, R. A., Prinz, J. F., Janssen, A. M., Weenen, H., & Bosman, F. (2003). The effect of oral
608 and product temperature on the perception of flavor and texture attributes of semi-solids. Appetite,
609 41(3), 273-281.

ACCEPTED MANUSCRIPT
24
610 Fernández Farrés, I., & Norton, I. T. (2015). The influence of co-solutes on tribology of agar fluid gels. Food
611 Hydrocolloids, 45, 186-195.
612 Gabriele, A., Spyropoulos, F., & Norton, I. T. (2010). A conceptual model for fluid gel lubrication. Soft
613 Matter, 6(17), 4205-4213.
614 Garrec, D. A., & Norton, I. T. (2013). Kappa carrageenan fluid gel material properties. Part 2: Tribology.
615 Food Hydrocolloids, 33(1), 160-167.
616 Gohar, R., & Rahnejat, H. (2008). Fundamentals of tribology. London: Imperial College Press.
617 Laguna, L., Farrell, G., Bryant, M., Morina, A., & Sarkar, A. (2017). Relating rheology and tribology of
618 commercial dairy colloids to sensory perception. Food & Function, 8(2), 563-573.
619 Lawless, H. T. (2010). Sensory Evaluation of Food : Principles and Practices (2nd Edition). New York: New
620 York, NY, USA: Springer New York.
621 Liu, K., Stieger, M., van der Linden, E., & van de Velde, F. (2015). Fat droplet characteristics affect
622 rheological, tribological and sensory properties of food gels. Food Hydrocolloids, 44, 244-259.
623 Malone, M. E., Appelqvist, I. A. M., & Norton, I. T. (2003). Oral behaviour of food hydrocolloids and
624 emulsions. Part 1. Lubrication and deposition considerations. Food Hydrocolloids, 17(6), 763-773.
625 Malvern-Instruments. (2007a). Mastersizer 2000 - User Manual. In). United Kingdom: Malvern Instruments.
626 Malvern-Instruments. (2007b). Sample dispersion and refractive index guide. In). United Kingdom: Malvern
627 Instruments Ltd. 2007.

ACCEPTED MANUSCRIPT
25
628 McCarthy, O. J. (2003). Liquid products and semi-solid products. In Encyclopedia of Dairy Sciences (pp.
629 2445-2456). Amsterdam: Academic Press.
630 Moakes, R. J. A., Sullo, A., & Norton, I. T. (2015). Preparation and characterisation of whey protein fluid
631 gels: The effects of shear and thermal history. Food Hydrocolloids, 45, 227-235.
632 Nagaoka, S., Hirata, Y., Iwaki, H., Sakamoto, K., Takagi, M., & Amagasa, T. (2001). A Study of the Surface
633 Roughness of Tongue Cancer and Leukoplakia Using a Non-contact Three-dimensional Curved Shape
634 Measuring System. Oral Medicine & Pathology, 6(2), 85-90.
635 Necas, J., & Bartosikova, L. (2013). Carrageenan: A review. Veterinarni Medicina, 58(4), 187-205.
636 Nguyen, P. T. M., Bhandari, B., & Prakash, S. (2016). Tribological method to measure lubricating properties
637 of dairy products. Journal of Food Engineering, 168, 27-34.
638 Nguyen, P. T. M., Nguyen, T. A. H., Bhandari, B., & Prakash, S. (2015). Comparison of solid substrates to
639 differentiate the lubrication property of dairy fluids by tribological measurement. Journal of Food
640 Engineering.
641 Pradal, C., & Stokes, J. R. (2016). Oral tribology: Bridging the gap between physical measurements and
642 sensory experience. Current Opinion in Food Science, 9, 34-41.
643 Prakash, S., Tan, D. D. Y., & Chen, J. (2013). Applications of tribology in studying food oral processing and
644 texture perception. Food Research International, 54(2), 1627-1635.
645 Ranc, H., Servais, C., Chauvy, P. F., Debaud, S., & Mischler, S. (2006). Effect of surface structure on
646 frictional behaviour of a tongue/palate tribological system. Tribology International, 39(12), 1518-
647 1526.

ACCEPTED MANUSCRIPT
26
648 Richter, V. B., de Almeida, T. C. A., Prudencio, S. H., & de Toledo Benassi, M. (2010). Proposing a ranking
649 descriptive sensory method. Food Quality and Preference, 21(6), 611-620.
650 Selway, N., & Stokes, J. R. (2013). Insights into the dynamics of oral lubrication and mouthfeel using soft
651 tribology: Differentiating semi-fluid foods with similar rheology. Food Research International, 54(1),
652 423-431.
653 Shama, F., & Sherman, P. (1973). Identification of stimuli controlling the sensory evaluation of viscosity II.
654 Oral Methods. Journal of Texture Studies, 4(1), 111-118.
655 Tarrega, A., & Costell, E. (2006). Effect of composition on the rheological behaviour and sensory properties
656 of semisolid dairy dessert. Food Hydrocolloids, 20(6), 914-922.
657 Toker, O. S., Dogan, M., Caniyilmaz, E., Ersöz, N. B., & Kaya, Y. (2013). The Effects of Different Gums and
658 Their Interactions on the Rheological Properties of a Dairy Dessert: A Mixture Design Approach.
659 Food and Bioprocess Technology, 6(4), 896-908.
660
661
662663664665666

ACCEPTED MANUSCRIPT
FIGURE CAPTIONS
Figure 1: Schematic illustration of the tribo-rheometer set up.
Figure 2: Particle size distribution for (a) ST1%_κCar(0.0)_F(0), (b) ST(2)_κCar(0.15)_F(3) and (c)
ST(3)_Car0.30%_F(6). The presented curves are representative of the average of triplicate experiments (error bars
not shown).
Figure 3: Pareto’s chart of standardized estimated effects of Starch, Car and Fat content in the (a) particle volume
mean diameter, D4,3 and (b) apparent viscosity measured at 50 s-1 of shear rate, 50.
Figure 4: Flow behavior of custard prepared at different compositions.
Figure 5: Storage modulus G’ (circle symbols) and loss modulus G’’ (square symbols) measured and plotted against
angular frequency for custard formulations with various starch, Car and fat concentrations.
Figure 6: Friction curves of free-fat custard formulations: (a) ST(1)_κCar(0.3)_F(0) & ST(1)_κCar(0.3)_F(6); (b)
ST(1)_κCar(0.0)_F(0) & ST(1)_κCar(0.0)_F(6); (c) ST(3)_κCar(0.3)_F(0) & ST(3)_κCar(0.3)_F(6); and (d)
ST(3)_κCar(0.0)_F(0) & ST(3)_κCar(0.0)_F(6). The presented curves are representative of the average of triplicate
experiments (error bars are shown in grey colour).
Figure 7: Schematic representation of the friction profile depicted by non-fat and fat-containing custard formulations.
Figure 8: Light microscopy (LM) images (20 x) obtained for (a) skim milk powder colloidal suspension, (b)
ST(3)_Car(0.0)_F(0) and (c) ST(2)_Car(0.15)_F(3) . Confocal Laser Scanning Microscopy (CLSM) image shown
in (d) for ST(2)_Car(0.15)_F(3). In the CLSM image, fat, protein and Car are labelled, respectively, with red, pink
and blue colours.
Figure 9: CLSM images obtained at different stages of the friction curve. In the CLSM images, fat, protein and Car
are labelled, respectively, with red, pink and blue colours. The scale bars are 100 m.

ACCEPTED MANUSCRIPT

ACCEPTED MANUSCRIPT

ACCEPTED MANUSCRIPT

ACCEPTED MANUSCRIPT

ACCEPTED MANUSCRIPT

ACCEPTED MANUSCRIPT

ACCEPTED MANUSCRIPT

ACCEPTED MANUSCRIPT

ACCEPTED MANUSCRIPT

ACCEPTED MANUSCRIPT

ACCEPTED MANUSCRIPT
TABLES
Table 1: Levels of the dependent variables (concentration of Starch, Car and Fat, %w/w) of the
factorial design with their respective designated nomenclature.
Nomenclature Starch [% w/w] Car [%w/w] Fat [%w/w]
ST(1)_Car(0.0)_F(0) 1 0.0 0
ST(1)_Car(0.3)_F(0) 1 0.3 0
ST(1)_Car(0.0)_F(6) 1 0.0 6
ST(1)_Car(0.3)_F(6) 1 0.3 6
ST(2)_Car(0.15)_F(3)* 2 0.15 3
ST(3)_Car(0.0)_F(0)* 3 0.0 0
ST(3)_Car(0.3)_F(0) 3 0.3 0
ST(3)_Car(0.0)_F(6)* 3 0.0 6
ST(3)_Car(0.3)_F(6)* 3 0.3 6
*Asterisk symbols indicate samples chosen to perform sensory analysis.

ACCEPTED MANUSCRIPT
Table 2: Definitions of the textural attributes.
Attributes Definitions
Thickness Resistance to flow in the mouth
Smoothness Perception of smoothness in the mouth from smooth to rough
Powderiness The feeling of some particles and a chalky sensation in the mouth
Creaminess The perception of ‘oiliness’ in the mouth and the degree of mouth coating. Usually,
creaminess is perceived only when a certain viscosity threshold is reached.
Oiliness Perception of the amount of fat in the sample

ACCEPTED MANUSCRIPT
Table 3: D4,3, 50, CoFi, CoFmin and h measured for the custard samples at conditions proposed by the
factorial design.
Samples D4,3 [m]* 50 [Pa s]** CoFi*** CoFmin*** h***
ST(1)_Car(0.0)_F(0) 33.1 ± 0.2e 0.0041±0.0015d 0.54 ± 0.02a 0.38 ± 0.01a NA
ST(1)_Car(0.0)_F(6) 27.9 ± 0.9g 0.0083±0.0012d 0.20 ± 0.04b 0.12 ± 0.01b NA
ST(1)_Car(0.3)_F(0) 37.5 ± 0.2a,b 0.698±0.083c 0.53 ± 0.02a 0.41 ± 0.02a NA
ST(1)_Car(0.3)_F(6) 38.2 ± 0.3a 0.785±0.085c 0.13 ± 0.02c 0.11 ± 0.00b 0.03 ± 0.00a
ST(3)_Car(0.0)_F(0) 35.0 ± 0.1d 0.121±0.058d 0.55 ± 0.00a 0.42 ± 0.05a NA
ST(3)_Car(0.0)_F(6) 31.5 ± 0.3f 0.0951±0.0093d 0.14 ± 0.02b,c 0.10 ± 0.00b 0.03 ± 0.00a
ST(3)_Car(0.3)_F(0) 36.6 ± 0.2b,c 3.52±0.19a 0.57 ± 0.01a 0.41 ± 0.01a NA
ST(3)_Car(0.3)_F(6) 33.6 ± 0.7e 1.988±0.088b 0.13 ± 0.01c 0.13 ± 0.00b 0.03 ± 0.00a
ST(2)_Car(0.15)_F(3) 35.5 ± 0.1c,d 0.594±0.037c 0.17 ± 0.01b,c 0.12 ± 0.01b 0.04 ± 0.01a
*Values within a column not sharing a common superscript are significantly different (p-value<0.05, Tukey test).
*D4,3 express the particle volume mean diameter
** 50 is the apparent viscosity measured at 50 s-1 shear rate.
*** CoFi, CoFmin and h are friction parameters corresponding to, respectively, CoF measured at 0.15 mm s-1, minimum CoF
and peak height from the baseline built at CoFmin.
ACCEPTED MANUSCRIPT
Table 4: Tangent loss (tan ) of selected custard formulations showing gel-like behavior.
Samples tan
ST(3)_Car(0.0)_F(0) 0.92 ± 0.21a
ST(3)_Car(0.0)_F(6) 0.99 ± 0.12a
ST(2)_Car(0.15)_F(3) 0.23 ± 0.02b
ST(1)_Car(0.3)_F(0) 0.21 ± 0.01b
ST(1)_Car(0.3)_F(6) 0.22 ± 0.02b
ST(3)_Car(0.3)_F(6) 0.23 ± 0.03b
ST(3)_Car(0.3)_F(0) 0.18 ± 0.01b
*Values within a column not sharing a common superscript are significantly different (p-value<0.05, Tukey test).
Table 5: Contact angle of ethanol and water sessile drop measured on the surface of the 3M tape.
Liquid Contact angle
Water 97.4 ± 0.2a
Ethanol 44.2 ± 0.1b
*Values within a column not sharing a common superscript are significantly different (p-value<0.05, Tukey test).

ACCEPTED MANUSCRIPT
Table 6: Rank sum of selected sensory attributes obtained for samples ST(1)_Car(0.3)_F(6),
ST(2)_Car(0.15)_F(3), ST(3)_Car(0.0)_F(0), ST(3)_Car(0.0)_F(6) and ST(3)_Car(0.3)_F(6).
Rank sum (RS)
Viscous Sticky Oily Creamy Smooth Powdery Astringency
ST(1)_Car(0.3)_F(6) 43 40 39.5 38.5 36.5 43 37.5
ST(2)_Car(0.15)_F(3) 33.5 31 33.5 41.5 40 37 36
ST(3)_Car(0.0)_F(0) 11 11 11 14 19.5 27 32
ST(3)_Car(0.0)_F(6) 22.5 28 36 39 39.5 26 32.5
ST(3)_Car(0.3)_F(6) 55 55 45 32 29.5 32 27
p-value p<0.001 p<0.001 p<0.001 0.001 0.028 0.119 0.659