trends of infant mortality and its determinants in
TRANSCRIPT

RESEARCH ARTICLE Open Access
Trends of infant mortality and itsdeterminants in Ethiopia: mixed-effectbinary logistic regression and multivariatedecomposition analysisGetayeneh Antehunegn Tesema1, Wullo Sisay Seretew1*, Misganaw Gebrie Worku2 and Dessie Abebaw Angaw1
Abstract
Background: Infant mortality remains a serious global public health problem. The global infant mortality rate hasdecreased significantly over time, but the rate of decline in most African countries, including Ethiopia, is far belowthe rate expected to meet the SDG targets. Therefore, this study aimed to investigate the trends of infant mortalityand its determinants in Ethiopia based on the four consecutive Ethiopian Demographic and Health Surveys (EDHSs).
Methods: This analysis was based on the data from four EDHSs (EDHS 2000, 2005, 2011, and 2016). A totalweighted sample of 46,317 live births was included for the final analysis. The logit-based multivariatedecomposition analysis was used to identify significantly contributing factors for the decrease in infant mortality inEthiopia over the last 16 years. To identify determinants, a mixed-effect logistic regression model was fitted. TheIntra-class Correlation Coefficient (ICC) and Likelihood Ratio (LR) test were used to assess the presence of asignificant clustering effect. Deviance, Akaike Information Criteria (AIC), and Bayesian Information Criteria (BIC) wereused for model comparison. Variables with a p-value of less than 0.2 in the bi-variable analysis were considered forthe multivariable analysis. In the multivariable analysis, the Adjusted Odds Ratio (AOR) with 95% Confidence Interval(CI) were reported to identify the statistically significant determinants of infant mortality.
Results: Infant mortality rate has decreased from 96.9 per 1000 births in 2000 to 48 per 1000 births in 2016, with anannual rate of reduction of 4.2%. According to the logit based multivariate decomposition analysis, about 18.1% ofthe overall decrease in infant mortality was due to the difference in composition of the respondents with respectto residence, maternal age, type of birth, and parity across the surveys, while the remaining 81.9% was due to thedifference in the effect of residence, parity, type of birth and parity across the surveys. In the mixed-effect binarylogistic regression analysis; preceding interval < 24 months (AOR = 1.79, 95% CI; 1.46, 2.19), small size at birth(AOR = 1.55, 95% CI; 1.25, 1.92), large size at birth (AOR = 1.26, 95% CI; 1.01, 1.57), BMI < 18.5 kg/m2 (AOR = 1.22, 95%CI; 1.05, 1.50), and twins (AOR = 4.25, 95% CI; 3.01, 6.01), parity> 6 (1.51, 95% CI; 1.01, 2.26), maternal age and malesex (AOR = 1.50, 95% CI: 1.25, 1.79) were significantly associated with increased odds of infant mortality.
(Continued on next page)
© The Author(s). 2021 Open Access This article is licensed under a Creative Commons Attribution 4.0 International License,which permits use, sharing, adaptation, distribution and reproduction in any medium or format, as long as you giveappropriate credit to the original author(s) and the source, provide a link to the Creative Commons licence, and indicate ifchanges were made. The images or other third party material in this article are included in the article's Creative Commonslicence, unless indicated otherwise in a credit line to the material. If material is not included in the article's Creative Commonslicence and your intended use is not permitted by statutory regulation or exceeds the permitted use, you will need to obtainpermission directly from the copyright holder. To view a copy of this licence, visit http://creativecommons.org/licenses/by/4.0/.The Creative Commons Public Domain Dedication waiver (http://creativecommons.org/publicdomain/zero/1.0/) applies to thedata made available in this article, unless otherwise stated in a credit line to the data.
* Correspondence: [email protected] of Epidemiology and Biostatistics, institute of public health,college of medicine and health science, University of Gondar, Gondar,EthiopiaFull list of author information is available at the end of the article
Tesema et al. BMC Pregnancy and Childbirth (2021) 21:362 https://doi.org/10.1186/s12884-021-03835-0

(Continued from previous page)
Conclusion: This study found that the infant mortality rate has declined over time in Ethiopia since 2000.Preceding birth interval, child-size at birth, BMI, type of birth, parity, maternal age, and sex of child were significantpredictors of infant mortality. Public health programs aimed at rural communities, and multiparous mothersthrough enhancing health facility delivery would help maintain Ethiopia’s declining infant mortality rate.Furthermore, improving the use of ANC services and maternal nutrition is crucial to reducing infant mortality andachieving the SDG targets in Ethiopia.
Keywords: Infant mortality, Mixed effect analysis, Multivariate decomposition analysis, Ethiopia
BackgroundThe death of a child during the first year of life is calledinfant mortality [1]. The global infant mortality hasfallen dramatically from 8.8 million in the last two de-cades to 4.1 million [2] and the rate dropped from 65deaths per 1000 live births in 1990 to 29 deaths per1000 live births in 2017 [3]. Despite the substantial de-cline in global infant mortality, low-and middle-incomecountries still bear the enormous burden of infant mor-tality [2, 4, 5]. Ethiopia is one of the countries with ahigh infant mortality rate (48 per 1000 live births) in Af-rica [6]. Nearly 80% of infant deaths are from prevent-able causes [7].Infant mortality is one of the commonest health-
related indicators used to assess the health status of thecommunity [8]. Despite the progress made by manycountries to achieve the Millennium Development Goal(MDG) 4 to reduce child mortality by two-thirds [9]; halfof the world’s nations including Ethiopia are still behindtheir targets and MDG-4 continued as unfinishedagenda [10].The Ethiopian government strongly motivated to im-
prove maternal-child and maternal health for the lasttwo decades [11] but infant mortality remains a signifi-cant health care problem in the country [12]. It has re-duced from 123 per 1000 births in 1990 to 48 per 1000births in 2015 but it is far below the national target [13,14]. According to the Ethiopian Demographic andHealth Surveys (EDHSs), the infant mortality rate hasdeclined from 97 per 1000 live births in 2000 [15] to 48per 1000 live births in 2016 [6] with a huge disparityacross regions and within countries [12].Maternal age [16, 17], maternal education status [18,
19], household wealth status [20], Antenatal Care (ANC)visit during pregnancy [21, 22], parity [23], birth order[24], place of delivery [25, 26], child nutritional status(stunting, wasting and underweight) [26], vaccinationstatus [27], and residence [28] were reported by previousresearchers as significant predictors of infant mortality.Though infant mortality rates have decreased over
time in Ethiopia, previous studies were focused on theprevalence and associated factors of infant mortality only[21, 29, 30] and failed to capture the trends and
determinants of infant mortality in Ethiopia over timeusing a Logit based Multivariate Decomposition analysisfor Non-linear Response Model (MVDCMP) and Gener-alized Linear Mixed Model (GLLM). Therefore, thisstudy aimed to investigate the trend and determinants ofinfant mortality in Ethiopia over time. Understandingthe trends and determinants of infant mortality couldhelp public health planners, and partners to designevidence-based interventions to effectively reduce infantmortality in Ethiopia.
Methods and materialsData sourcesA community-based time-series cross-sectional study wasused to answer the research objectives. All the Demo-graphic and Health Surveys (DHSs) (EDHS 2000, 2005,2011, and 2016) conducted in Ethiopia were used. TheEDHS was employed in every five-year interval to generateupdated health and health-related indicators. The majorityof the country’s population lives in the regional states ofAmhara, Oromia, and Southern Nations Nationalities andPeople’s Regions (SNNPR) [25]. Ethiopia is the 13th in theworld and 2nd most populous country in Africa [26]. In2016, there were an estimated 102 million people.A two-stage sampling technique was employed to se-
lect the sample and a total of 539 Enumeration Areas(EAs) in EDHS 2000, 540 EAs in EDHS 2005, 624 EAsin EDHS 2011, and 645 EAs in EDHS 2016 were ran-domly selected. Then, on average 27 to 32 householdsper EA were selected. The source population was all livebirths from reproductive-age women within 5 years be-fore the survey in Ethiopia whereas all live births fromreproductive-age women in the selected enumerationareas were the study population. A total weighted sam-ple of 46,317 live births (12,260 in EDHS 2000, 11,163 inEDHS 2005, 11,872 in EDHS 2011, and 11,022 in EDHS2016) from reproductive-age women were used for ana-lysis. The detailed sampling procedure was presented inthe full EDHSs report [18, 19, 31, 32].
Study variablesThe outcome variable for this study was infant mortality(the death of live birth within 1 year of birth). In EDHS
Tesema et al. BMC Pregnancy and Childbirth (2021) 21:362 Page 2 of 16

there was a question about whether the child was aliveor died at the time of the survey and for dead infants-age at death were recorded. Death of a child within 1year of age was coded as 1, and 0 if the child was alive.The unit of analysis in this study was all live births inthe 5 years preceding the survey. The infant mortalityrate is defined as the number of infant deaths per 1000live births [33]. The independent variables considered inthis study were region (coded as Tigray, Afar, Amhara,Oromia, Somali, Benishangul, SNNPR, Gambella, Harari,Addis Ababa, and Dire Dawa), residence (coded as rural,and urban), sex of household head (coded as male andfemale), maternal age (recoded as < 20, 20–29, 30–39and 40–49 years), women education (recoded as no, pri-mary, and secondary and higher), paternal education(recoded as no, primary, and secondary and above), pre-ceding birth interval (recoded as < 24 and ≥ 24 months),Body Mass Index (BMI) of the mother (recoded as <18.5, 18.5–24.9, and ≥ 25 kg/m2), wealth index (coded aspoor, middle and rich), parity (recoded as 1–3, 4–6and > 6 births), type of birth (coded as single and mul-tiple), place of delivery (coded as home and health facil-ity), ANC visit during pregnancy (no visit, 1–4 and > 4ANC visits), cigarettes smoking (coded as no and yes),mode of delivery (coded as vaginal and caesarean deliv-ery), child nutritional status (stunting; coded as normal,moderately stunted, and severely stunted; wasting codedas normal, moderately wasted, and severely stunted; andunderweight coded as normal, moderately underweightand severely underweight), media exposure (coded as noand yes), religion (coded as orthodox, muslim, protest-ant, catholic and others), sex of child (coded as male andfemale), covered by health insurance (coded as no andyes), and birth weight (large, average and small).Wealth Index (WI) was considered as a living standard
measure for each respective year and generated using thePrincipal Component Analyses (PCA). The variables in-cluded in the PCA were ownership of durable assets, likeradios, cars, refrigerators, TV sets, motorcycles, and bicy-cles; housing characteristics, such as the number of roomsfor sleeping and building materials (walls, floors, androofs); access to utilities and infrastructures, like electricitysupply, source of drinking water, and sanitation facilities.
Data management and analysisThe Ethiopian Demographic and Health survey consistsof different datasets including men, women, kids (KR),birth, household, and household datasets. For this study,we used the Kids Record (KR) data set. The data wereweighted using sampling weight, primary sampling unit,and strata before any statistical analysis to restore therepresentativeness of the survey to get reliable statisticalestimates. Descriptive and summary statistics were doneusing STATA version 14 software.
Trend analysisFor the decomposition analysis, we appended the ex-tracted data of 2000, 2005, 2011 and 2016 using theSTATA command “append using” after we kept thesimilar variables across the surveys. The change in infantmortality rate in Ethiopia for the last 16 years wasexamined.To determine the factors that contributed to the de-
crease in the infant mortality rate over the last 16 years,the Multivariate Decomposition Analysis for the Non-linear Response variable (MVDCMP) was used. Themultivariate decomposition analysis based on the logitlink function uses the output from the binary logistic re-gression model to divide into components. The decreasein infant mortality can be explained by the difference incomposition between the surveys (i.e., differences incharacteristics or endowment) and/or the difference ineffects of the explanatory variables across the surveys(i.e., differences in coefficients).The multivariate decomposition analysis of the logit or
log-odd of infant mortality is taken as:
Logit Að Þ−Logit Bð Þ ¼ F XAβAð Þ−F XBβBð Þ¼ F XAβAð Þ−F XBβAð Þ½ �
Eþ ½F XBβAð Þ−F XBβBð �
C
The E component refers to the part of the overall de-crease in infant mortality explained by the change in thecomposition of the study participants across the surveys.There is no error term in the logit-based multivariatedecomposition analysis because we used the logit linkfunction. The C component refers to the percentage ofthe overall decrease in infant mortality attributable tothe differences in coefficients or effects of the explana-tory variable across the surveys. For the decompositionanalysis of infant mortality using the mvdcmp STATAcommand (28). Variables with a p-value < 0.2 in the bi-variable Logit-based multivariate decomposition analysiswere considered for the multivariable Logit-based multi-variate decomposition analysis. Finally, p-value < 0.05and the corresponding coefficient (B) with a 95% confi-dence interval were used to declare significant factorsthat contributed to the decrease in infant mortality.
Determinants of infant mortalityAs the data used for this study had nested structure, in-fants within the same cluster might share similar charac-teristics than infants out of that cluster. In hierarchicaldata, advanced statistical models such as mixed-effect re-gression analysis to get reliable estimate. Therefore, atwo-level mixed-effect logistic regression model (bothfixed and random effect) was fitted using EAs as a ran-dom variable to draw a valid conclusion. The assump-tions of the mixed-effect binary logistic regression modelwere checked using the Intra-class Correlation
Tesema et al. BMC Pregnancy and Childbirth (2021) 21:362 Page 3 of 16

Coefficient (ICC) and Likelihood Ratio (LR) test. TheMedian Odds Ratio (MOR) and Proportional Change inVariance (PCV) were computed to measure the variationacross clusters. ICC quantifies the degree of heterogen-eity of infant mortality between clusters (the proportionof the total observed individual-level variation in infantmortality that is attributable to between clustervariations).
ICC ¼ σ2= σ2þ π2=3ð Þ;
The MOR measures the between cluster variation interms of odds ratio. The median value of the odds ratiobetween the cluster at high risk of infant mortality andcluster at lower risk of the infant when randomly pickingout two clusters (EAs).
MOR ¼ exp √ 2�∂2�0:6745ð Þ� � � MOR¼ exp 0:95�∂ð Þ
∂2 indicates that cluster variancePCV measures the total variation in infant mortality
explained by the final model compared to the nullmodel.
PCV ¼ var null modelð Þ− var full modelð Þð Þ= var null modelð Þð Þ
Akaike Information Criteria (AIC), Bayesian Informa-tion Criteria (BIC), and deviance were used for modelcomparison and a model with the lower deviance waschosen since the model was nested. We identified the in-dependent variables based on previous literature con-ducted on determinants of infant mortality. As the dataused for this study was secondary there was missing onthe outcome variable (age at death), and we drop the ob-servation that has missing value on the outcome vari-ables. In the bi-variable mixed-effect binary logisticregression analysis; residence, sex of household head,maternal age, maternal education, wealth status, mater-nal BMI, preceding birth interval, parity, covered byhealth insurance, size at birth, ANC visit during preg-nancy, sex of the child, place of delivery and type ofbirth had a p-value less than 0.2 and were considered formultivariable analysis. However, in the multivariableanalysis; parity, type of birth, maternal age, maternalBMI, number of ANC visits, preceding birth interval, sexof a child, and size at birth were significantly associatedwith infant mortality. The Adjusted Odds Ratio (AOR)with a 95% Confidence Interval (CI) and p-value < 0.05in the multivariable model were used to declare signifi-cant determinant factors of infant mortality.
Ethical considerationAs the study was a secondary data analysis accessedfrom the MEASURE DHS program, this study did notrequire ethical approval and participant consent. Wehave granted permission from http:/www.dhsprogram.com to download and use the data for this study. In thedata sets, there is no name of persons or householdaddresses.
ResultsCharacteristics of the study populationA total of 46,317 live births were included in this study.The non-response rate in EDHS 2000, EDHS 2005,EDHS 2011, and EDHS 2016 were 2.2, 4, 5 and 5%, re-spectively. More than one-third of live births in all foursurveys were found in the Oromia region. The propor-tion of mothers who had a primary level of educationslightly increased from 13% in 2000 to 26.8% in 2016.Besides, the percentage of women who had media expos-ure has increased from 27.1 to 33.1% in the last 16 years.Regarding ANC visits during pregnancy, the percentageof women who had 1–4 ANC visits during pregnancywas increased from 19.8% in 2000 to 46.6% in 2016. Thepercentage of health facility delivery has increased from5.2 to 27.4% for the last 16 years (Table 1).
Trends of infant mortality rate from 2000 to 2016The overall infant mortality rate has decreased from 96.9[93.6, 104.2] per 1000 live births in 2000 to 48.0 [44.2,52.2] to 1000 live births in 2016 with an Annual Rate ofReduction (ARR) of 4.2% (Fig. 1). The infant mortalityrate has decreased across regions over time, it was de-creased from 122 per 1000 live births in 2000 to 41 per1000 live births in 2016 in the Gambella region (Fig. 2).Regarding the place of residence, there was a 54.2- and51.5-point decrease in the infant mortality rate amongurban residents and mothers who had no formal educa-tion over the last 16 years, respectively. The infant mor-tality rate among births in the health facility decreasedby 66.1 per 1000 live births from 2000 to 2016 (Table 2).
Decomposition analysisThere was a significant decline in the infant mortalityrate for the last 16 years (2000–2016). The overall multi-variate decomposition analysis revealed that about 18.1%of the overall decrease in infant mortality rate over thelast 16 years was attributable to the difference in endow-ment (composition) across the surveys whereas theremaining 81.9% was attributable to the difference in co-efficient (effects of characteristics) over the surveys(Table 3). Among the difference in endowment; the dif-ference in composition of rural residents (B = − 0.0006,95% CI: − 0.0009, − 0.0004, p = 0.03), maternal age 30–39 years (B = 0.0007, 95% CI: − 0.001, − 0.0002, p =
Tesema et al. BMC Pregnancy and Childbirth (2021) 21:362 Page 4 of 16
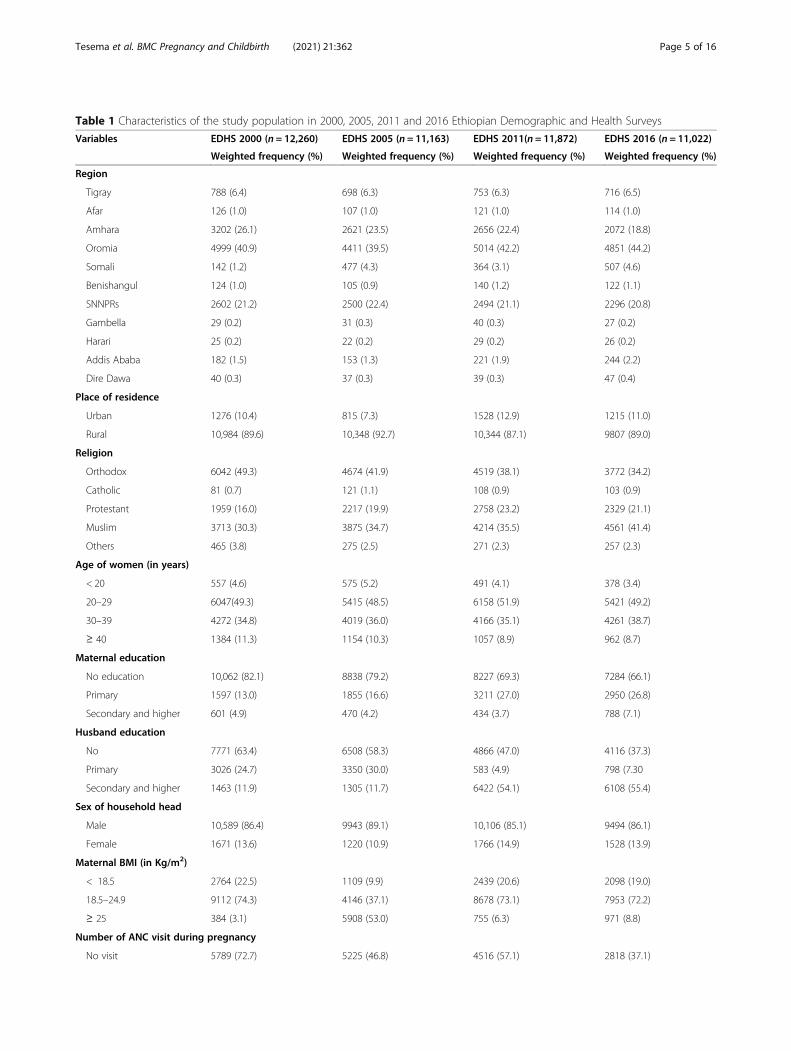
Table 1 Characteristics of the study population in 2000, 2005, 2011 and 2016 Ethiopian Demographic and Health Surveys
Variables EDHS 2000 (n = 12,260) EDHS 2005 (n = 11,163) EDHS 2011(n = 11,872) EDHS 2016 (n = 11,022)
Weighted frequency (%) Weighted frequency (%) Weighted frequency (%) Weighted frequency (%)
Region
Tigray 788 (6.4) 698 (6.3) 753 (6.3) 716 (6.5)
Afar 126 (1.0) 107 (1.0) 121 (1.0) 114 (1.0)
Amhara 3202 (26.1) 2621 (23.5) 2656 (22.4) 2072 (18.8)
Oromia 4999 (40.9) 4411 (39.5) 5014 (42.2) 4851 (44.2)
Somali 142 (1.2) 477 (4.3) 364 (3.1) 507 (4.6)
Benishangul 124 (1.0) 105 (0.9) 140 (1.2) 122 (1.1)
SNNPRs 2602 (21.2) 2500 (22.4) 2494 (21.1) 2296 (20.8)
Gambella 29 (0.2) 31 (0.3) 40 (0.3) 27 (0.2)
Harari 25 (0.2) 22 (0.2) 29 (0.2) 26 (0.2)
Addis Ababa 182 (1.5) 153 (1.3) 221 (1.9) 244 (2.2)
Dire Dawa 40 (0.3) 37 (0.3) 39 (0.3) 47 (0.4)
Place of residence
Urban 1276 (10.4) 815 (7.3) 1528 (12.9) 1215 (11.0)
Rural 10,984 (89.6) 10,348 (92.7) 10,344 (87.1) 9807 (89.0)
Religion
Orthodox 6042 (49.3) 4674 (41.9) 4519 (38.1) 3772 (34.2)
Catholic 81 (0.7) 121 (1.1) 108 (0.9) 103 (0.9)
Protestant 1959 (16.0) 2217 (19.9) 2758 (23.2) 2329 (21.1)
Muslim 3713 (30.3) 3875 (34.7) 4214 (35.5) 4561 (41.4)
Others 465 (3.8) 275 (2.5) 271 (2.3) 257 (2.3)
Age of women (in years)
< 20 557 (4.6) 575 (5.2) 491 (4.1) 378 (3.4)
20–29 6047(49.3) 5415 (48.5) 6158 (51.9) 5421 (49.2)
30–39 4272 (34.8) 4019 (36.0) 4166 (35.1) 4261 (38.7)
≥ 40 1384 (11.3) 1154 (10.3) 1057 (8.9) 962 (8.7)
Maternal education
No education 10,062 (82.1) 8838 (79.2) 8227 (69.3) 7284 (66.1)
Primary 1597 (13.0) 1855 (16.6) 3211 (27.0) 2950 (26.8)
Secondary and higher 601 (4.9) 470 (4.2) 434 (3.7) 788 (7.1)
Husband education
No 7771 (63.4) 6508 (58.3) 4866 (47.0) 4116 (37.3)
Primary 3026 (24.7) 3350 (30.0) 583 (4.9) 798 (7.30
Secondary and higher 1463 (11.9) 1305 (11.7) 6422 (54.1) 6108 (55.4)
Sex of household head
Male 10,589 (86.4) 9943 (89.1) 10,106 (85.1) 9494 (86.1)
Female 1671 (13.6) 1220 (10.9) 1766 (14.9) 1528 (13.9)
Maternal BMI (in Kg/m2)
< 18.5 2764 (22.5) 1109 (9.9) 2439 (20.6) 2098 (19.0)
18.5–24.9 9112 (74.3) 4146 (37.1) 8678 (73.1) 7953 (72.2)
≥ 25 384 (3.1) 5908 (53.0) 755 (6.3) 971 (8.8)
Number of ANC visit during pregnancy
No visit 5789 (72.7) 5225 (46.8) 4516 (57.1) 2818 (37.1)
Tesema et al. BMC Pregnancy and Childbirth (2021) 21:362 Page 5 of 16
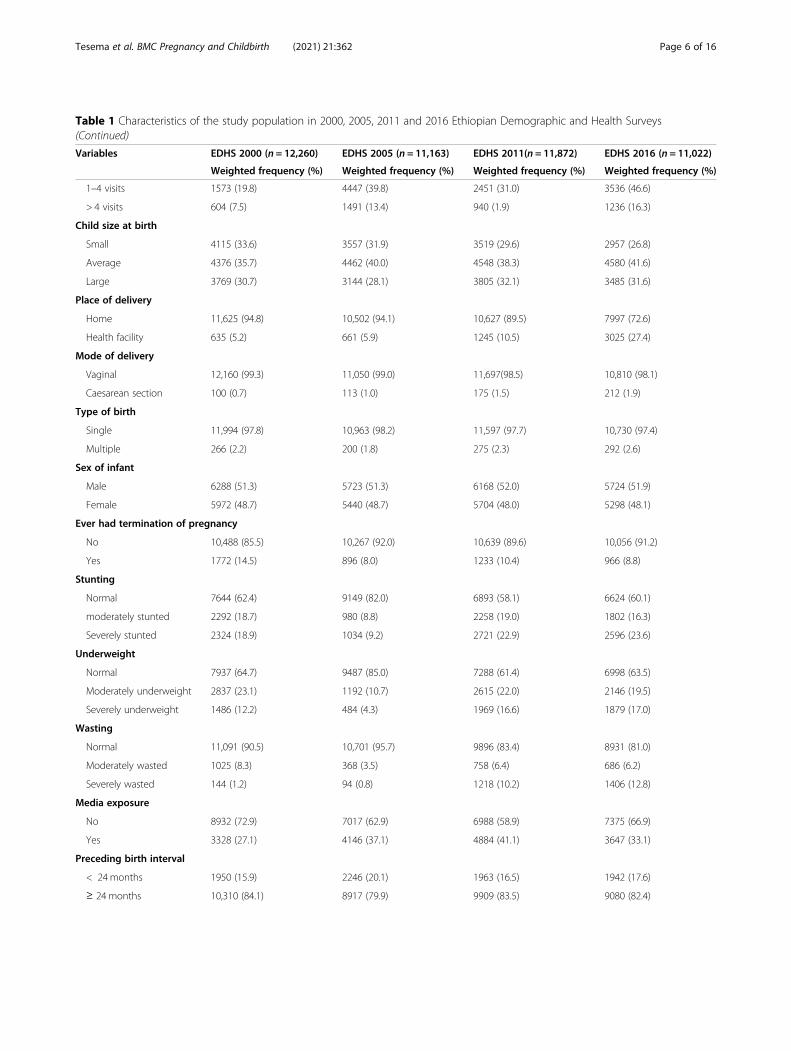
Table 1 Characteristics of the study population in 2000, 2005, 2011 and 2016 Ethiopian Demographic and Health Surveys(Continued)
Variables EDHS 2000 (n = 12,260) EDHS 2005 (n = 11,163) EDHS 2011(n = 11,872) EDHS 2016 (n = 11,022)
Weighted frequency (%) Weighted frequency (%) Weighted frequency (%) Weighted frequency (%)
1–4 visits 1573 (19.8) 4447 (39.8) 2451 (31.0) 3536 (46.6)
> 4 visits 604 (7.5) 1491 (13.4) 940 (1.9) 1236 (16.3)
Child size at birth
Small 4115 (33.6) 3557 (31.9) 3519 (29.6) 2957 (26.8)
Average 4376 (35.7) 4462 (40.0) 4548 (38.3) 4580 (41.6)
Large 3769 (30.7) 3144 (28.1) 3805 (32.1) 3485 (31.6)
Place of delivery
Home 11,625 (94.8) 10,502 (94.1) 10,627 (89.5) 7997 (72.6)
Health facility 635 (5.2) 661 (5.9) 1245 (10.5) 3025 (27.4)
Mode of delivery
Vaginal 12,160 (99.3) 11,050 (99.0) 11,697(98.5) 10,810 (98.1)
Caesarean section 100 (0.7) 113 (1.0) 175 (1.5) 212 (1.9)
Type of birth
Single 11,994 (97.8) 10,963 (98.2) 11,597 (97.7) 10,730 (97.4)
Multiple 266 (2.2) 200 (1.8) 275 (2.3) 292 (2.6)
Sex of infant
Male 6288 (51.3) 5723 (51.3) 6168 (52.0) 5724 (51.9)
Female 5972 (48.7) 5440 (48.7) 5704 (48.0) 5298 (48.1)
Ever had termination of pregnancy
No 10,488 (85.5) 10,267 (92.0) 10,639 (89.6) 10,056 (91.2)
Yes 1772 (14.5) 896 (8.0) 1233 (10.4) 966 (8.8)
Stunting
Normal 7644 (62.4) 9149 (82.0) 6893 (58.1) 6624 (60.1)
moderately stunted 2292 (18.7) 980 (8.8) 2258 (19.0) 1802 (16.3)
Severely stunted 2324 (18.9) 1034 (9.2) 2721 (22.9) 2596 (23.6)
Underweight
Normal 7937 (64.7) 9487 (85.0) 7288 (61.4) 6998 (63.5)
Moderately underweight 2837 (23.1) 1192 (10.7) 2615 (22.0) 2146 (19.5)
Severely underweight 1486 (12.2) 484 (4.3) 1969 (16.6) 1879 (17.0)
Wasting
Normal 11,091 (90.5) 10,701 (95.7) 9896 (83.4) 8931 (81.0)
Moderately wasted 1025 (8.3) 368 (3.5) 758 (6.4) 686 (6.2)
Severely wasted 144 (1.2) 94 (0.8) 1218 (10.2) 1406 (12.8)
Media exposure
No 8932 (72.9) 7017 (62.9) 6988 (58.9) 7375 (66.9)
Yes 3328 (27.1) 4146 (37.1) 4884 (41.1) 3647 (33.1)
Preceding birth interval
< 24months 1950 (15.9) 2246 (20.1) 1963 (16.5) 1942 (17.6)
≥ 24 months 10,310 (84.1) 8917 (79.9) 9909 (83.5) 9080 (82.4)
Tesema et al. BMC Pregnancy and Childbirth (2021) 21:362 Page 6 of 16

0.001), 40–49 years (B = 0.0008, 95% CI: 0.0002, 0.0014,p = 0.04), multiple births (B = − 0.0003, 95% CI: − 0.0002,− 0.0004, p = 0.003), and births from mother who have >6 births (B = − 0.005, 95% CI:-0.0086, − 0.0018, p = 0.02)were significantly contributed for the decrease in infantmortality rate over the last 16 years. Among the differ-ence in coefficients, the difference in effects of rural resi-dents (B = − 0.02, 95% CI: − 0.0001, − 0.047, p = 0.003),multiple births (B = − 0.0008, 95% CI: − 0.0015, − 0.0018,p = 0.012), health facility delivery (B = 0.004, 95% CI:0.001, 0.006, p = 0.023), and husband with secondaryeducation or higher (B = 0.0036, 95% CI: 0.0002, 0.007,p = 0.001) were significantly contributed to the decreasein infant mortality rate over the last 16 years (Table 4).
Determinants of infant mortalityModel comparisonThe mixed-effect binary logistic regression model wasthe best-fitted model since it had a lower deviance value(Table 5). The ICC value was 0.13(95% CI: 0.09, 0.21),which indicates that about 13% of the overall variabilityof infant mortality was due to the between cluster vari-ability, and the LR test was (X2 = 10.44, p = 0.0006)which informed us the mixed-effect binary logistic re-gression model (GLMM) was the best-fitted model.Moreover, the MOR-value in the null model was 1.98(95% CI: 1.81, 2.21), indicates that infants in high infant
mortality clusters were a 1.98 times higher likelihood ofdying in their first year of life compared to infants inlow infant mortality clusters. The PCV value in the finalmodel was 0.13, which showed that the final model ex-plained the variability in infant mortality by the finalmodel was 13% (Table 6).In the multivariable mixed-effect logistic regression model;
size at birth, preceding birth interval, the number of ANCvisits, maternal age, type of birth, maternal BMI, sex of thechild, and parity were significant determinants factors of in-fant mortality. The odds of mortality among infant born tomothers aged 20–29 years, 30–39 years, and 40–49 yearswere decreased by 37% (95% CI: 0.41, 0.99, p = 0.02), 48%(95% CI: 0.32, 0.84, p = 0.001), and 49% (95% CI: 0.28, 0.93,p = 0.02) compared to those born to mothers aged < 20years, respectively. Infants born to mothers having the pre-ceding birth interval of < 24months were 1.79 (95 CI: 1.46,2.19, p = 0.05) times higher odds of death within the firstyear of birth than those born with a preceding birth intervalof 24months or above. The odds of infant mortality amonginfants who were small and large size at birth were 1.55 (95%CI: 1.25, 1.92, p = 0.006) and 1.26 (95% CI: 1.01, 1.57, p =0.003) times higher than those infants who were average sizeat birth, respectively. The odds of mortality among infantsborn from underweight women (< 18.5 kg/m2) were 1.22(95% CI: 1.05, 1.50, p = 0.03) times higher than those born tomothers with normal BMI (18.5–24.9 Kg/m2). Births frommothers who had no ANC visits during pregnancy had a3.14 (95% CI: 2.11, 4.66, p = 0.001) times higher likelihood ofdeath within the first year of birth than an infant born tomothers who had > four ANC visit during pregnancy. Theodds of infant death among twins were 4.25 (95% CI: 3.01,6.01, p = 0.0001) times higher than those in single births.The infant born to multiparous women having greater than6 children had a 1.51 (95% CI: 1.01, 2.26, p = 0.01) timeshigher odds of death than compared to an infant born towomen having 1–3 births. Being male had a 1.50 (95% CI:1.25, 1.79, p = 0.007) higher odds of death in the first year oflife as compared to female infants (Table 7).
DiscussionThe trends of infant mortality in Ethiopia was decreasedfrom 96.9 to 48 per 1000 live births with an annual rateof reduction of 4.2%. This was consistent with a study
Table 1 Characteristics of the study population in 2000, 2005, 2011 and 2016 Ethiopian Demographic and Health Surveys(Continued)
Variables EDHS 2000 (n = 12,260) EDHS 2005 (n = 11,163) EDHS 2011(n = 11,872) EDHS 2016 (n = 11,022)
Weighted frequency (%) Weighted frequency (%) Weighted frequency (%) Weighted frequency (%)
Parity
1–3 5338 (43.6) 4576 (41.0) 5295 (44.6) 4836 (43.9)
4–6 4038 (32.9) 3962 (35.5) 4014 (33.8) 3732 (33.9)
> 6 2884 (23.5) 2625 (23.5) 2564 (21.6) 2454 (22.2)
Fig. 1 The trends of infant mortality rate among live births fromreproductive-age women in Ethiopia over time (2000–2016)
Tesema et al. BMC Pregnancy and Childbirth (2021) 21:362 Page 7 of 16

reported in sub-Saharan Africa [34]. This might be becauseof improvement in the management of childhood illness overtime [35], increased universal immunization coverage mainlytargeting the commonest cause of infant mortality such aspneumonia, diarrheal diseases (Rotavirus), pertussis, andmeasles [36]. Besides, in the last two decades, the establish-ment of health extension workers plays a significant role inimproving maternal and child health by providing preventive(such as a vaccine, ANC service) services and extending ser-vices to rural residents [31, 37]; possibly contributing to thesignificant decrease in the infant mortality rate for the last16 years in Ethiopia.The multivariate decomposition analysis identified the
significant factors that contributed to the decrease in in-fant mortality rate over the last 16 years. The overall de-crease in infant mortality rate over the last 16 years wasassociated with the difference in the composition ofrural residents, maternal age, parity and type of birth,and the difference in effects of rural residents, health fa-cility delivery, and husband education. This was sup-ported by the study findings reported in Indonesia [32],Nicaragua [18, 38], Nigeria [18, 19], and Canada [39].This could be because teenage pregnancies are morelikely to suffer from adverse pregnancy outcomes bothduring and after birth including anemia, asphyxia, lowbirth weight, Intra-uterine Growth Reduction (IUGR),and congenital malformation; therefore the decrease inteenage pregnancy over time may contribute to the re-duction of infant mortality [40]. Ethiopia proposed ma-ternal education to increase a mother’s knowledge ofhealth care practices related to contraceptive utilization,nutrition, hygiene, and disease prevention in the reduc-tion of infant mortality [34]. Furthermore, improved ser-vices provision at health facilities for women and theavailability of skilled professionals for saving maternaland newborn lives.
In the mixed effect logistic regression analysis; size atbirth, preceding birth interval, the number of ANCvisits, maternal age, type of birth, sex of the child, mater-nal BMI, and parity were significant predictors of infantmortality. In this study, child size at birth was a signifi-cant predictor of infant mortality. The infant who wassmall or large size at birth were significantly associatedwith higher odds of infant mortality than average size in-fants. This was consistent with study findings in theUSA [41] and Bangladesh [42]. This might be due tosmall size babies are commonly due to preterm birth orsmall for gestational age, they are prone to sepsis,hypothermia, and undernutrition and this could increasetheir risk of mortality. Also, low birth weight babiesmight have underlined medical conditions such as con-genital heart diseases, down syndrome, HIV/AIDS, orother diseases and this could make them vulnerable tochildhood infections like pneumonia and diarrheal dis-eases, consequently increase their risk of death. Regard-ing large size babies, commonly macrosomia is a resultof maternal underlined diseases like diabetic mellites,chronic illness, and genetic causes, this could increasetheir risk of mortality before reaching the first year ofage [43]. The shorter preceding birth interval was signifi-cantly associated with higher odds of infant mortality.This was consistent with the study findings in Malawi[44] and Zimbabwe [45]. The possible explanation mightbe since shorter preceding birth intervals are associatedwith increased risk of preterm birth, low birth weight,and IUGR for the succeeding births [46]. Besides,mothers had less time to recuperate from the previousbirth, and less able to provide nourishment for the in-fant, this might increase the risk of infant mortality [47].Babies born to underweight mothers (BMI < 18.5Kg/
m2) have higher odds of death in the first year of birth.This finding is consistent with previous study findings
Fig. 2 The trends of infant mortality rate across region regions in Ethiopia over time (2000–2016)
Tesema et al. BMC Pregnancy and Childbirth (2021) 21:362 Page 8 of 16
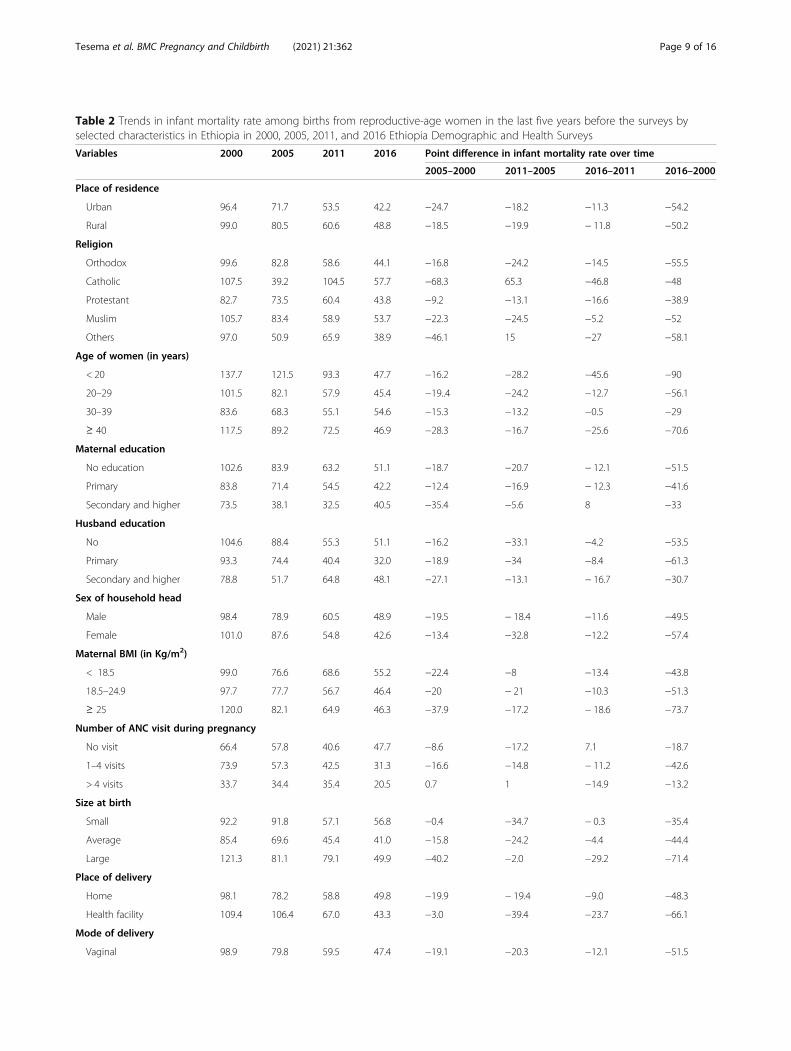
Table 2 Trends in infant mortality rate among births from reproductive-age women in the last five years before the surveys byselected characteristics in Ethiopia in 2000, 2005, 2011, and 2016 Ethiopia Demographic and Health Surveys
Variables 2000 2005 2011 2016 Point difference in infant mortality rate over time
2005–2000 2011–2005 2016–2011 2016–2000
Place of residence
Urban 96.4 71.7 53.5 42.2 −24.7 −18.2 −11.3 −54.2
Rural 99.0 80.5 60.6 48.8 −18.5 −19.9 − 11.8 −50.2
Religion
Orthodox 99.6 82.8 58.6 44.1 −16.8 −24.2 −14.5 −55.5
Catholic 107.5 39.2 104.5 57.7 −68.3 65.3 −46.8 −48
Protestant 82.7 73.5 60.4 43.8 −9.2 −13.1 −16.6 −38.9
Muslim 105.7 83.4 58.9 53.7 −22.3 −24.5 −5.2 −52
Others 97.0 50.9 65.9 38.9 −46.1 15 −27 −58.1
Age of women (in years)
< 20 137.7 121.5 93.3 47.7 −16.2 −28.2 −45.6 −90
20–29 101.5 82.1 57.9 45.4 −19..4 −24.2 −12.7 −56.1
30–39 83.6 68.3 55.1 54.6 −15.3 −13.2 −0.5 −29
≥ 40 117.5 89.2 72.5 46.9 −28.3 −16.7 −25.6 −70.6
Maternal education
No education 102.6 83.9 63.2 51.1 −18.7 −20.7 − 12.1 −51.5
Primary 83.8 71.4 54.5 42.2 −12.4 −16.9 − 12.3 −41.6
Secondary and higher 73.5 38.1 32.5 40.5 −35.4 −5.6 8 −33
Husband education
No 104.6 88.4 55.3 51.1 −16.2 −33.1 −4.2 −53.5
Primary 93.3 74.4 40.4 32.0 −18.9 −34 −8.4 −61.3
Secondary and higher 78.8 51.7 64.8 48.1 −27.1 −13.1 − 16.7 −30.7
Sex of household head
Male 98.4 78.9 60.5 48.9 −19.5 − 18.4 −11.6 −49.5
Female 101.0 87.6 54.8 42.6 −13.4 −32.8 −12.2 −57.4
Maternal BMI (in Kg/m2)
< 18.5 99.0 76.6 68.6 55.2 −22.4 −8 −13.4 −43.8
18.5–24.9 97.7 77.7 56.7 46.4 −20 − 21 −10.3 −51.3
≥ 25 120.0 82.1 64.9 46.3 −37.9 −17.2 − 18.6 −73.7
Number of ANC visit during pregnancy
No visit 66.4 57.8 40.6 47.7 −8.6 −17.2 7.1 −18.7
1–4 visits 73.9 57.3 42.5 31.3 −16.6 −14.8 − 11.2 −42.6
> 4 visits 33.7 34.4 35.4 20.5 0.7 1 −14.9 −13.2
Size at birth
Small 92.2 91.8 57.1 56.8 −0.4 −34.7 − 0.3 −35.4
Average 85.4 69.6 45.4 41.0 −15.8 −24.2 −4.4 −44.4
Large 121.3 81.1 79.1 49.9 −40.2 −2.0 −29.2 −71.4
Place of delivery
Home 98.1 78.2 58.8 49.8 −19.9 − 19.4 −9.0 −48.3
Health facility 109.4 106.4 67.0 43.3 −3.0 −39.4 −23.7 −66.1
Mode of delivery
Vaginal 98.9 79.8 59.5 47.4 −19.1 −20.3 −12.1 −51.5
Tesema et al. BMC Pregnancy and Childbirth (2021) 21:362 Page 9 of 16

[48]; malnourished mothers have an increased risk ofpoor pregnancy outcomes including obstructed labor,premature delivery, and low-birth-weight babies [49].Therefore, an infant born to a malnourished mother ismore prone to malnutrition and childhood illnesses likediarrheal diseases and respiratory diseases which are theleading cause of child mortality [50]. In this study, parityand twin birth were significant predictors of infant mor-tality; an infant born to multiparous women who havegreater than 6 births, and twin births, had higher odds ofdeath before reaching the first year of birth. This was
Table 2 Trends in infant mortality rate among births from reproductive-age women in the last five years before the surveys byselected characteristics in Ethiopia in 2000, 2005, 2011, and 2016 Ethiopia Demographic and Health Surveys (Continued)
Variables 2000 2005 2011 2016 Point difference in infant mortality rate over time
2005–2000 2011–2005 2016–2011 2016–2000
Caesarean section 77.9 93.0 74.6 82.8 15.1 −18.4 8.2 4.9
Type of birth
Single 90.3 76.6 55.6 44.0 −13.7 −21.0 −11.6 −46.3
Multiple 360.9 260.0 167.3 196.2 −100.9 −92.7 28.9 − 164.7
Sex of infant
Male 104.8 92.2 69.6 59.9 −12.6 −22.6 −9.7 −44.9
Female 92.3 66.9 49.0 35.2 −25.4 −17.9 − 13.8 −57.1
Ever had termination of pregnancy
No 99.2 80.0 60.6 47.2 −19.2 − 19.4 − 13.4 −52.0
Yes 95.7 79.2 52.1 57.1 −16.0 −27.1 −5.0 −38.6
Stunting
Normal 0 0 0 0 0 0 0 0
moderately stunted 0 0 0 0 0 0 0 0
Severely stunted 158 97.5 260.4 204.0 −60.5 162.9 −56.4 46.0
Underweight
Normal 0 0 0 0 0 0 0 0
Moderately underweight 0 0 0 0 0 0 0 0
Severely underweight 153 94.0 359.9 281.0 −69 265.9 −78.9 128
Wasting
Normal 0 0 0 0 0 0 0 0
Moderately wasted 0 0 0 0 0 0 0 0
Severely wasted 109 83.0 581.5 376.7 −26 498.5 − 204.8 267.7
Media exposure
No 102.1 80.6 59.1 42.9 −21.5 −21.5 −16.2 −60.2
Yes 89.6 78.8 60.1 58.5 −10.8 − 18.7 − 1.6 −31.1
Preceding birth interval
< 24months 150.4 131.5 94.1 83.6 −18.9 −37.4 − 10.5 −66.8
≥ 24 months 88.9 66.9 52.9 40.4 −22.0 −14.0 −12.5 −48.5
Parity
1–3 99.1 77.6 52.8 43.9 −21.5 −24.8 −8.9 −55.2
4–6 87.5 72.7 64.2 48.3 −14.8 −8.5 −15.9 −39.4
> 6 113.7 94.7 91.0 80.9 −19.0 −3.7 −10.2 −34.8
Table 3 The overall Logit based multivariate decompositionanalysis of infant mortality in Ethiopia, 2000–2016
Infant mortality Coef. [95% Conf. Interval] Pct.
E −0.008 −0.016 -0.0007 18.1a
C −0.037 − 0.047 -0.027 81.9a
R −0.045 − 0.052 -0.038aE Endowment, C Coefficient, R Residuals, Coef Coefficient, Pct Percent
Tesema et al. BMC Pregnancy and Childbirth (2021) 21:362 Page 10 of 16

consistent with studies reported in Pristina [51] andAustralia [52]. The possible reason could be due to mul-tiparous women and twins are related to an increasedrate of adverse perinatal outcomes, such as prematurebirth and low birth weight [53]. The higher mortalityrate among multiple births compared with single births
Table 4 The detailed Logit based multivariate decomposition analysis of infant mortality in Ethiopia, 2000–2016
Infant death Difference due to characteristics(E) Difference due to coefficient (C)
Coef. with p-value Pct. Coef. with p-value Pct.
Residence
Urban 0 0
Rural − 0.0006[− 0.0009, − 0.0004]*, 0.03 −1.08 − 0.02 [− 0.0001, − 0.047]**, 0.003 − 52.1
Age of women
< 20 0 0
20–29 −0.0001 [− 0.0003, 0.0007], 0.23 0.29 0.005 [− 0.013, 0.022], 0.12 − 10.4
30–39 − 0.0007 [− 0.001, − 0.0002]**, 0.001 1.4 0.004 [− 0.01, 0.018], 0.06 −8.3
≥ 40 0.0008 [0.0002, 0.0014]*, 0.04 −1.8 −0.001 [− 0.006, 0.004], 0.21 2.4
Maternal education
No education 0 0
Primary −0.0006 [− 0.002, 0.0008], 0.07 1.3 − 0.0002[− 0.003, 0.003], 0.42 0.05
Secondary and higher − 0.0003 [− 0.001, 0.0004], 0.31 0.71 0.0017 [− 0.001, 0.004], 0.34 1.9
Type of birth
Single 0 0
Multiple −0.0003 [− 0.0002, − 0.0004]**, 0.003 −0.69 − 0.0008 [− 0.0015, 0.0018]*, 0.012 −1.9
Place of delivery
Home 0 0
Health facility −0.002 [− 0.005, 0.0006], 0.08 4.4 0.004 [0.001, 0.006]*, 0.023 −7.9
Parity
1–3 0 0
4–6 0.00005[−0.0003, 0.0003], 0.09 −0.3 0.005 [− 0.002, 0.011], 0.07 − 10.1
> 6 − 0.005 [− 0.0086, − 0.0018]*, 0.02 11.5 0.001 [− 0.002, 0.004], 0.09 −16.4
Ever had termination of pregnancy
No 0 0
Yes −0.0005 [− 0.0014, 0.0004], 0.071 1.07 0.0014 [− 0.0022, 0.005], 0.51 −3.06
Body mass index of women (kg/m2)
< 18.5 0 0
18.5–24.9 0.0006 [−0.0002, 0.001], 0.4 −1.36 −0.014 [− 0.026, 0.0001], 0.21 31.4
≥25 −0.0014 [− 0.002, 0.0003], 0.37 2.33 −0.0014 [− 0.003, 0.0001], 0.17 3.06
Husband education
no education 0 0
Primary 0.0003 [−0.0017, 0.0024], 0.08 −0.74 0.0005 [− 0.0055, 0.0065], 0.47 −1.12
Secondary 0.0008 [−0.0035, 0.0052], 0.13 −1.8 0.0036 [0.0002, 0.007]**, 0.001 −8.03
Media exposure
No 0 0
Yes 0.0001 [−0.0007, 0.0003], 0.19 −0.28 0.0039 [− 0.0018, 0.0097], 0.07 − 8.8
Constant −0.071 [− 0.119, − 0.023], 0.3 157.14
Table 5 Model comparison between standard logisticregression and mixed-effects logistic regression
Model comparison AIC BIC Deviance
Logistic regression model 4033.79 4221.50 3987.80
Mixed effect logistic regression model 4026.93 4201.47 3978.94
AIC Akaike Information Criteria, BIC Bayesian Information Criteria
Tesema et al. BMC Pregnancy and Childbirth (2021) 21:362 Page 11 of 16

could be because twins are more likely to be born pre-maturely, higher risk of malnutrition, and more likely tobe of lower birth weight than single infants this could in-crease the risk of death within 1 year of birth [54].In our study, ANC was a significant predictor of in-
fant mortality. The odds of infant mortality amongwomen who had no ANC visit during pregnancy washigher than those who have ANC checkup. This wassupported by the study findings in India [55] andNepal [56], it could be due to reason that ANC visitis an entry point for the other maternal health ser-vices, and births from mother who had no ANC visitare not aware of danger signs of pregnancy andunderlying medical conditions that could lead to lowbirth weight, prematurity, congenital anomalies ascompared to women who had ANC visit [57]. Theodds of infant mortality among births mothers aged≥20 years were lower than births from mothers agedless than 20 years. It was consistent with prior studies[58], the possible explanation could be due to thereason that teenagers have biological immaturity andnutrition which could increase the risk of infant mor-tality [59]. Besides, teenagers are less likely to usematernal health care services such as ANC, institu-tional delivery, PNC, and routine immunization thiscould increase the odds of infant mortality [60]. Maleinfants were significantly associated with higher oddsof infant mortality, which is supported by previousstudies [61, 62]. The possible explanation for this dif-ference might be due to sex differences in geneticand biological makeup, with boys being biologicallyweaker and more susceptible to diseases and prema-ture death [63].
Strength and limitationsThis study had several strengths. First, the study wasbased on nationally representative large datasets, andthus it had adequate statistical power. Second, the es-timates of the study were done after the data wereweighted for the probability sampling and non-response, to make it representative at national and re-gional levels: therefore, it can be generalized to all
births from reproductive-age women in Ethiopia.Third, multivariate decomposition analysis was ap-plied to understand the factors that significantly con-tributed to the decrease in infant mortality over time.Limitations included that variables were not consist-ently collected in all EDHS surveys; the wealth indexwas not collected in EDHS 2000 even if it wasplanned for collection, thus this variable was not usedfor the decomposition analysis. In addition, importantvariables such as underlying medical conditions suchas pneumonia, meningitis, birth asphyxia, congenitalheart diseases, diarrheal diseases, sepsis, HIV/AIDS,congenital infections were not considered in themodel as these variables didn’t found in the EDHS.Furthermore, the EDHS survey did not incorporatecommunity-level variables like community norm, cul-ture, and beliefs, and medical factors rather it reliedon mothers or caregivers report and might have thepossibility of social desirability and recall bias sinceinfant mortality is not socially acceptable though CSAclaims that strong effort was made to minimize itmainly through extensive training of data collectors,recruiting experienced data collectors and supervisorsthis might underestimate our finding.
Policy implications of this studyInfant mortality has been considered as the crucial indi-cator of the quality of the health care delivery systemand progress of Ethiopia. Though the infant mortalityrate in Ethiopia showed a significant reduction overtime, still we are expected to have double progress toachieve the ENAP plan. To keep this progress maternaland child health programs should focus on promotingANC visits, and adequate birth spacing as these factorsare amenable to change. Moreover, health care providersshould give special attention to abnormal weight babies,multiple births, and male births to reduce the incidenceof infant mortality in the country.
ConclusionsThe infant mortality rate has shown a dramatic de-crease over the last 16 years in Ethiopia. The multi-variate decomposition analysis revealed that about18.1% of the overall decrease in infant mortality wasattributable to the difference in endowment (the com-position of respondents) in terms of residence, mater-nal age, type of birth, and parity across the surveyswhereas the remaining 81.9% was due to the differ-ence in the effect of residence, parity, health facilitydelivery and husband education over the surveys.These findings highlight that the governmental andnon-governmental organizations should scale uphealth facility delivery and give special attention totwin births, multiparous women, rural dwellers to
Table 6 Random effect parameters
Random effect parameters Null model Full model
Cluster variance 0.52 (0.39, 0.70) 0.45 (0.23, 0.91)
ICC 0.1 (0.04, 0.13) 0.06 (0.015, 0.20)
MOR 1.98 (1.81, 2.21) 1.89 (1.58, 2.48)
PCV Ref. 0.13
ICC Intra-class Correlation Coefficient, MOR Median Odds Ratio, PCVProportional Change in Variance
Tesema et al. BMC Pregnancy and Childbirth (2021) 21:362 Page 12 of 16
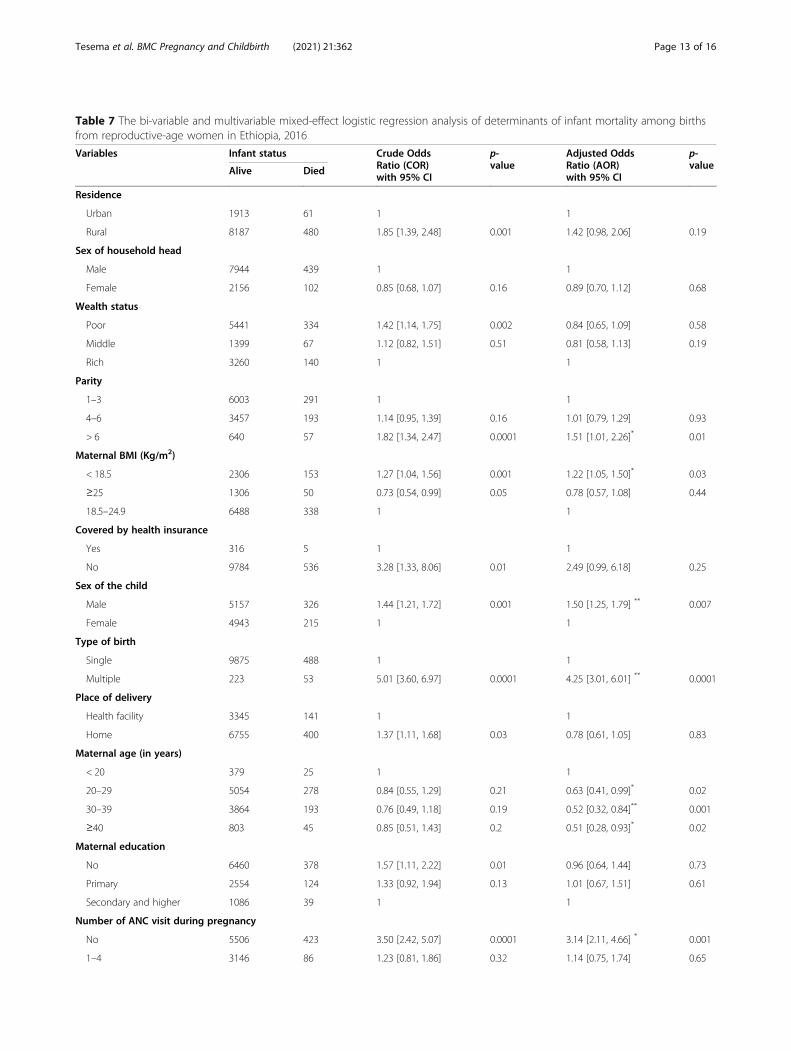
Table 7 The bi-variable and multivariable mixed-effect logistic regression analysis of determinants of infant mortality among birthsfrom reproductive-age women in Ethiopia, 2016
Variables Infant status Crude OddsRatio (COR)with 95% CI
p-value
Adjusted OddsRatio (AOR)with 95% CI
p-valueAlive Died
Residence
Urban 1913 61 1 1
Rural 8187 480 1.85 [1.39, 2.48] 0.001 1.42 [0.98, 2.06] 0.19
Sex of household head
Male 7944 439 1 1
Female 2156 102 0.85 [0.68, 1.07] 0.16 0.89 [0.70, 1.12] 0.68
Wealth status
Poor 5441 334 1.42 [1.14, 1.75] 0.002 0.84 [0.65, 1.09] 0.58
Middle 1399 67 1.12 [0.82, 1.51] 0.51 0.81 [0.58, 1.13] 0.19
Rich 3260 140 1 1
Parity
1–3 6003 291 1 1
4–6 3457 193 1.14 [0.95, 1.39] 0.16 1.01 [0.79, 1.29] 0.93
> 6 640 57 1.82 [1.34, 2.47] 0.0001 1.51 [1.01, 2.26]* 0.01
Maternal BMI (Kg/m2)
< 18.5 2306 153 1.27 [1.04, 1.56] 0.001 1.22 [1.05, 1.50]* 0.03
≥25 1306 50 0.73 [0.54, 0.99] 0.05 0.78 [0.57, 1.08] 0.44
18.5–24.9 6488 338 1 1
Covered by health insurance
Yes 316 5 1 1
No 9784 536 3.28 [1.33, 8.06] 0.01 2.49 [0.99, 6.18] 0.25
Sex of the child
Male 5157 326 1.44 [1.21, 1.72] 0.001 1.50 [1.25, 1.79] ** 0.007
Female 4943 215 1 1
Type of birth
Single 9875 488 1 1
Multiple 223 53 5.01 [3.60, 6.97] 0.0001 4.25 [3.01, 6.01] ** 0.0001
Place of delivery
Health facility 3345 141 1 1
Home 6755 400 1.37 [1.11, 1.68] 0.03 0.78 [0.61, 1.05] 0.83
Maternal age (in years)
< 20 379 25 1 1
20–29 5054 278 0.84 [0.55, 1.29] 0.21 0.63 [0.41, 0.99]* 0.02
30–39 3864 193 0.76 [0.49, 1.18] 0.19 0.52 [0.32, 0.84]** 0.001
≥40 803 45 0.85 [0.51, 1.43] 0.2 0.51 [0.28, 0.93]* 0.02
Maternal education
No 6460 378 1.57 [1.11, 2.22] 0.01 0.96 [0.64, 1.44] 0.73
Primary 2554 124 1.33 [0.92, 1.94] 0.13 1.01 [0.67, 1.51] 0.61
Secondary and higher 1086 39 1 1
Number of ANC visit during pregnancy
No 5506 423 3.50 [2.42, 5.07] 0.0001 3.14 [2.11, 4.66] * 0.001
1–4 3146 86 1.23 [0.81, 1.86] 0.32 1.14 [0.75, 1.74] 0.65
Tesema et al. BMC Pregnancy and Childbirth (2021) 21:362 Page 13 of 16

further reduce the infant mortality rate in Ethiopia.Besides; birth interval, maternal BMI, size at birth,parity, maternal age, type of birth, sex of the child,and ANC visit were significantly associated with in-fant mortality. Therefore, it could help the policy-makers and health planners to focus on designingprevention programs and health care delivery, thus al-locating public health resources for further reducinginfant mortality.
AbbreviationsANC: Antenatal Care; AOR: Adjusted Odds Ratio; COR: Crude Odds Ratio,CSA=Central Statistical Agency; DHS: Demographic health survey;EAs: Enumeration areas; EDHS: Ethiopian demographic and health survey;GIS: Geographic Information System; ICC: Intra-cluster Correlation Coefficient;IUGR: Intra uterine growth restriction; LLR: Log likelihood ratio; LR: Likelihoodratio; MDG: Millennium Development Goals; RR: Relative risk; SNNP: SouthernNations and Nationalities of People
AcknowledgmentsWe would like to thank the measure DHS program for providing the dataset.
Authors’ contributionsConceptualization: GAT, DAA, WSS and MGW, Data curation GAT, DAA, WSS,and MGW. Investigation: GAT, DAA, WSS and MGW, Methodology: GAT, DAA,WSS and MGW, Software: GAT, DAA, WSS and MGW, Validation: GAT, DAA,WSS and MGW, Writing: GAT, DAA, WSS and MGW, Writing – review, andediting: GAT, DAA, WSS, and MGW. All the authors read and approve themanuscript.
FundingNo funding was obtained for this study.
Availability of data and materialsData is available online and you can access it from www.measuredhs.com.
Declarations
Ethics approval and consent to participateThe EDHS data is available to the general public by request in differentformats from the Measure DHS website http://www.measuredhs.com. Wesubmitted a request to the Measure DHS by briefly stating the objectives ofthis analysis and thereafter received permission to download the maternaland children’s dataset in STATA format.
Consent for publicationNot applicable.
Competing interestsAuthors declare that they have no conflict of interest.
Author details1Department of Epidemiology and Biostatistics, institute of public health,college of medicine and health science, University of Gondar, Gondar,Ethiopia. 2Department of Human Anatomy, School of Medicine, College ofMedicine and Health Science, University of Gondar, Gondar, Ethiopia.
Received: 5 October 2020 Accepted: 27 April 2021
References1. Mortality NCtPI. Death before life: the tragedy of infant Mortality: the report
of the National Commission to prevent infant Mortality: the commission;1988.
2. UNICEF W. Levels and trends in child mortality: report 2011. Estimatesdeveloped by the UN Inter-agency Group for child mortality estimationNew York: United Nation’s Children Fund 2011.
3. WHO. Global Health Observatory (GHO) data 2017.4. Sartorius BK, Sartorius K. Global infant mortality trends and attributable
determinants–an ecological study using data from 192 countries for theperiod 1990–2011. Popul Health Metrics. 2014;12(1):29. https://doi.org/10.1186/s12963-014-0029-6.
5. Rutstein SO. Factors associated with trends in infant and child mortality indeveloping countries during the 1990s. Bull World Health Organ. 2000;78(10):1256–70.
6. ICF CSACEa. Ethiopia Demographic and Health Survey 2016. Addis Ababaand Rockville: CSA and ICF; 2016.
7. de Oliveira CM, do Bonfim CV, Guimarães MJB, Frias PG, Medeiros ZM. Infantmortality: temporal trend and contribution of death surveillance. Acta PaulEnferm. 2016;29(3):282–90. https://doi.org/10.1590/1982-0194201600040.
8. Deogaonkar M. Socio-economic inequality and its effect on healthcaredelivery in India: inequality and healthcare. Electron J Soc. 2004;11.
9. Rajaratnam JK, Marcus JR, Flaxman AD, Wang H, Levin-Rector A, Dwyer L,et al. Neonatal, postneonatal, childhood, and under-5 mortality for 187countries, 1970–2010: a systematic analysis of progress towards millenniumdevelopment goal 4. Lancet. 2010;375(9730):1988–2008. https://doi.org/10.1016/S0140-6736(10)60703-9.
10. Tomashek KM, Qin C, Hsia J, Iyasu S, Barfield WD, Flowers LM. Infantmortality trends and differences between American Indian/Alaska nativeinfants and white infants in the United States, 1989–1991 and 1998–2000.Am J Public Health. 2006;96(12):2222–7. https://doi.org/10.2105/AJPH.2004.053744.
11. Ruducha J, Mann C, Singh NS, Gemebo TD, Tessema NS, Baschieri A, et al.How Ethiopia achieved millennium development goal 4 throughmultisectoral interventions: a countdown to 2015 case study. Lancet Glob
Table 7 The bi-variable and multivariable mixed-effect logistic regression analysis of determinants of infant mortality among birthsfrom reproductive-age women in Ethiopia, 2016 (Continued)
Variables Infant status Crude OddsRatio (COR)with 95% CI
p-value
Adjusted OddsRatio (AOR)with 95% CI
p-valueAlive Died
> 4 1452 32 1 1
Preceding birth interval
< 24months 1943 175 1.97 [1.63, 2.38] 0.001 1.79 [1.46, 2.19]* 0.05
≥24 months 8157 366 1 1
Size at birth
Average 3051 163 1 1
Small 2811 197 1.64 [1.32, 2.02] 0.0001 1.55 [1.25, 1.92]** 0.003
Large 4238 181 1.24 [0.99, 1.55] 0.015 1.26 [1.01, 1.57]** 0.006*ANC Antenatal Care Utilization, AOR Adjusted Odds Ratio, BMI Body Mass Index, CI Confidence Interval, COR Crude Odds Ratio, *p-value < 0.05, **p-value < 0.01
Tesema et al. BMC Pregnancy and Childbirth (2021) 21:362 Page 14 of 16

Health. 2017;5(11):e1142–e51. https://doi.org/10.1016/S2214-109X(17)30331-5.
12. Assefa Y, Van Damme W, Williams OD, Hill PS. Successes and challenges ofthe millennium development goals in Ethiopia: lessons for the sustainabledevelopment goals. BMJ Glob Health. 2017;2(2):e000318. https://doi.org/10.1136/bmjgh-2017-000318.
13. CSA I. Ethiopia demographic and health survey 2011, vol. 430. Addis Ababaand Calverton: Central Statistical Agency and ICF International; 2012.
14. 2016. CSACEaI. Ethiopia Demographic and Health Survey 2016. Addis Ababaand Rockville: CSA and ICF; 2016.
15. Macro. CSAEaO. Ethiopia Demographic and Health Survey 2000, vol. 2001.Addis Ababa and Calverton: Central Statistical Authority and ORC Macro;2001. Report No
16. Finlay JE, Özaltin E, Canning D. The association of maternal age with infantmortality, child anthropometric failure, diarrhoea and anaemia for firstbirths: evidence from 55 low-and middle-income countries. BMJ Open.2011;1(2):e000226. https://doi.org/10.1136/bmjopen-2011-000226.
17. Friede A, Baldwin W, Rhodes PH, Buehler JW, Strauss LT. Older maternal ageand infant mortality in the United States. Obstet Gynecol. 1988;72(2):152–7.
18. Peña R, Wall S, Persson L-A. The effect of poverty, social inequity, andmaternal education on infant mortality in Nicaragua, 1988-1993. Am JPublic Health. 2000;90(1):64–9. https://doi.org/10.2105/ajph.90.1.64.
19. Caldwell J, McDonald P. Influence of maternal education on infant and childmortality: levels and causes. Health Policy Educ. 1982;2(3–4):251–67. https://doi.org/10.1016/0165-2281(82)90012-1.
20. Stockwell EG. Infant mortality and socio-economic status: a changingrelationship. Milbank Mem Fund Q. 1962;40(1):101–11. https://doi.org/10.2307/3348613.
21. Dube L, Taha M, Asefa H. Determinants of infant mortality in community of Gilgelgibe field research center, Southwest Ethiopia: a matched case control study. BMCPublic Health. 2013;13(1):401. https://doi.org/10.1186/1471-2458-13-401.
22. Slinkard SA, Pharr JR, Bruno T, Patel D, Ogidi A, Obiefune M, et al.Determinants of infant Mortality in Southeast Nigeria: results from thehealthy beginning initiative, 2013-2014. Int J MCH AIDS. 2018;7(1):1–8.https://doi.org/10.21106/ijma.229.
23. Kozuki N, Lee AC, Silveira MF, Sania A, Vogel JP, Adair L, et al. Theassociations of parity and maternal age with small-for-gestational-age,preterm, and neonatal and infant mortality: a meta-analysis. BMC PublicHealth. 2013;13(S3):S2. https://doi.org/10.1186/1471-2458-13-S3-S2.
24. Ayeni O, Oduntan SO. The effects of sex, birthweight, birth order andmaternal age on infant mortality in a Nigerian community. Ann Hum Biol.1978;5(4):353–8. https://doi.org/10.1080/03014467800002991.
25. Stanley WA, Huber LRB, Laditka SB, Racine EF. Association of type of birthattendant and place of delivery on infant mortality in sub-Saharan Africa.Afr Health Sci. 2016;16(1):1–9. https://doi.org/10.4314/ahs.v16i1.1.
26. Fawzi WW, Herrera MG, Spiegelman DL, El Amin A, Nestel P, Mohamed KA. Aprospective study of malnutrition in relation to child mortality in the Sudan.Am J Clin Nutr. 1997;65(4):1062–9. https://doi.org/10.1093/ajcn/65.4.1062.
27. Bawah AA, Phillips JF, Adjuik M, Vaughan-Smith M, Macleod B, Binka FN. Theimpact of immunization on the association between poverty and childsurvival: evidence from Kassena-Nankana District of northern Ghana. Scand JPublic Health. 2010;38(1):95–103. https://doi.org/10.1177/1403494809352532.
28. Clarke LL, Coward RT. A multivariate assessment of the effects of residenceon infant mortality. J Rural Health. 1991;7(3):246–65. https://doi.org/10.1111/j.1748-0361.1991.tb00726.x.
29. Kumar PP, File G. Infant and child mortality in Ethiopia: a statistical analysisapproach. Ethiop J Educ Sci. 2010;5(2).
30. Weldearegawi B, Melaku YA, Abera SF, Ashebir Y, Haile F, Mulugeta A, et al.Infant mortality and causes of infant deaths in rural Ethiopia: a population-based cohort of 3684 births. BMC Public Health. 2015;15(1):770. https://doi.org/10.1186/s12889-015-2090-x.
31. Alebachew A, Hatt L, Kukla M. Monitoring and evaluating progress towardsuniversal health coverage in Ethiopia. PLoS Med. 2014;11(9):e1001696.https://doi.org/10.1371/journal.pmed.1001696.
32. Soejoenoes A. Tenage pregnancy. Indonesian J Obstet Gynecol. 2017:128–9.https://doi.org/10.32771/inajog.v5i3.533.
33. Sullivan JM, Rutstein SO, Bicego GT. Infant and child mortality: macrointernational Calverton, Maryland; 1994.
34. Akachi Y, Canning D. Health trends in sub-Saharan Africa: conflictingevidence from infant mortality rates and adult heights. Econ Hum Biol.2010;8(2):273–88. https://doi.org/10.1016/j.ehb.2010.05.015.
35. Miller NP, Amouzou A, Tafesse M, Hazel E, Legesse H, Degefie T, et al.Integrated community case management of childhood illness in Ethiopia:implementation strength and quality of care. Am J Trop Med Hyg. 2014;91(2):424–34. https://doi.org/10.4269/ajtmh.13-0751.
36. Kiros G-E, White MJ. Migration, community context, and child immunizationin Ethiopia. Soc Sci Med. 2004;59(12):2603–16. https://doi.org/10.1016/j.socscimed.2004.04.009.
37. Gove S. Integrated management of childhood illness by outpatient healthworkers: technical basis and overview. The WHO Working Group onGuidelines for Integrated Management of the Sick Child. Bull World HealthOrgan. 1997;75(Suppl 1):7.
38. Peña R, Liljestrand J, Zelaya E, Persson L-A. Fertility and infant mortalitytrends in Nicaragua 1964–1993. The role of women's education. J EpidemiolCommunity Health. 1999;53(3):132–7. https://doi.org/10.1136/jech.53.3.132.
39. Joseph K, Kramer MS. Recent trends in infant mortality rates andproportions of low-birth-weight live births in Canada. Cmaj. 1997;157(5):535–41.
40. Molla T. Higher education policy reform in Ethiopia: the representation ofthe problem of gender inequality. High Educ Policy. 2013;26(2):193–215.https://doi.org/10.1057/hep.2012.25.
41. Shi L, Macinko J, Starfield B, Xu J, Regan J, Politzer R, et al. Primary care,infant mortality, and low birth weight in the states of the USA. J EpidemiolCommunity Health. 2004;58(5):374–80. https://doi.org/10.1136/jech.2003.013078.
42. Yasmin S, Osrin D, Paul E, Costello A. Neonatal mortality of low-birth-weightinfants in Bangladesh. Bull World Health Organ. 2001;79(7):608–14.
43. Black RE, Allen LH, Bhutta ZA, Caulfield LE, De Onis M, Ezzati M, et al.Maternal and child undernutrition: global and regional exposures andhealth consequences. Lancet. 2008;371(9608):243–60. https://doi.org/10.1016/S0140-6736(07)61690-0.
44. Madise NJ, Diamond I. Determinants of infant mortality in Malawi: ananalysis to control for death clustering within families. J Biosoc Sci. 1995;27(1):95–106. https://doi.org/10.1017/S0021932000007033.
45. Kembo J, Van Ginneken JK. Determinants of infant and child mortality inZimbabwe: results of multivariate hazard analysis. Demogr Res. 2009;21:367–84. https://doi.org/10.4054/DemRes.2009.21.13.
46. McDONALD SD, Han Z, Mulla S, Murphy KE, Beyene J, Ohlsson A. Pretermbirth and low birth weight among in vitro fertilization singletons: asystematic review and meta-analyses. Eur J Obstet Gynecol Reprod Biol.2009;146(2):138–48. https://doi.org/10.1016/j.ejogrb.2009.05.035.
47. Curtis SL, Diamond I, McDonald JW. Birth interval and family effects onpostneonatal mortality in Brazil. Demography. 1993;30(1):33–43. https://doi.org/10.2307/2061861.
48. Edwards LE, Alton IR, Barrada MI, Hakanson EY. Pregnancy in theunderweight woman: course, outcome, and growth patterns of the infant.Am J Obstet Gynecol. 1979;135(3):297–302. https://doi.org/10.1016/0002-9378(79)90693-8.
49. Konje JC, Ladipo OA. Nutrition and obstructed labor. Am J Clin Nutr. 2000;72(1):291S–7S. https://doi.org/10.1093/ajcn/72.1.291S.
50. Foster SO. Immunizable and respiratory diseases and child mortality. PopulDev Rev. 1984;10:119–40. https://doi.org/10.2307/2807958.
51. Andrejevic A, Cvetkovic S, Vitosevic Z, Andrejevic L, Relic G. Multiparity,perinatal morbidity and mortality. Clin Exp Obstet Gynecol. 2011;38(1):71–5.
52. Bai J, Wong FW, Bauman A, Mohsin M. Parity and pregnancy outcomes. AmJ Obstet Gynecol. 2002;186(2):274–8. https://doi.org/10.1067/mob.2002.119639.
53. Boulet SL, Schieve LA, Nannini A, Ferre C, Devine O, Cohen B, et al. Perinataloutcomes of twin births conceived using assisted reproduction technology:a population-based study. Hum Reprod. 2008;23(8):1941–8. https://doi.org/10.1093/humrep/den169.
54. Suri K, Bhandari V, Lerer T, Rosenkrantz TS, Hussain N. Morbidity andmortality of preterm twins and higher-order multiple births. J Perinatol.2001;21(5):293–9. https://doi.org/10.1038/sj.jp.7200492.
55. Sahu D, Nair S, Singh L, Gulati B, Pandey A. Levels, trends & predictors ofinfant & child mortality among scheduled tribes in rural India. Indian J MedRes. 2015;141(5):709–19. https://doi.org/10.4103/0971-5916.159593.
56. Katz J, West KP Jr, Khatry SK, Christian P, LeClerq SC, Pradhan EK, et al. Riskfactors for early infant mortality in Sarlahi district, Nepal. Bull World HealthOrgan. 2003;81(10):717–25.
57. Pembe AB, Carlstedt A, Urassa DP, Lindmark G, Nyström L, Darj E. Quality ofantenatal care in rural Tanzania: counselling on pregnancy danger signs.
Tesema et al. BMC Pregnancy and Childbirth (2021) 21:362 Page 15 of 16

BMC Pregnancy Childbirth. 2010;10(1):35. https://doi.org/10.1186/1471-2393-10-35.
58. Olausson PO, Cnattingius S, Haglund B. Teenage pregnancies and risk oflate fetal death and infant mortality. BJOG Int J Obstet Gynaecol. 1999;106(2):116–21. https://doi.org/10.1111/j.1471-0528.1999.tb08210.x.
59. Chen X-K, Wen SW, Fleming N, Demissie K, Rhoads GG, Walker M. Teenagepregnancy and adverse birth outcomes: a large population basedretrospective cohort study. Int J Epidemiol. 2007;36(2):368–73. https://doi.org/10.1093/ije/dyl284.
60. Barber S. Does the quality of prenatal care matter in promoting skilledinstitutional delivery? A study in rural Mexico. Matern Child Health J. 2006;10(5):419–25. https://doi.org/10.1007/s10995-006-0079-x.
61. Mondal D, Galloway TS, Bailey TC, Mathews F. Elevated risk of stillbirth inmales: systematic review and meta-analysis of more than 30 million births.BMC Med. 2014;12(1):220. https://doi.org/10.1186/s12916-014-0220-4.
62. Drevenstedt GL, Crimmins EM, Vasunilashorn S, Finch CE. The rise and fall ofexcess male infant mortality. Proc Natl Acad Sci. 2008;105(13):5016–21.https://doi.org/10.1073/pnas.0800221105.
63. Liselele HB, Boulvain M, Tshibangu KC, Meuris S. Maternal height andexternal pelvimetry to predict cephalopelvic disproportion in nulliparousAfrican women: a cohort study. BJOG Int J Obstet Gynaecol. 2000;107(8):947–52. https://doi.org/10.1111/j.1471-0528.2000.tb10394.x.
Publisher’s NoteSpringer Nature remains neutral with regard to jurisdictional claims inpublished maps and institutional affiliations.
Tesema et al. BMC Pregnancy and Childbirth (2021) 21:362 Page 16 of 16