sim toolkit: a framework for infant mortality assessments · from infant death to the immediate...
TRANSCRIPT
A Standardized Approach for Examining Infant Mortality
State Infant Mortality Toolkit
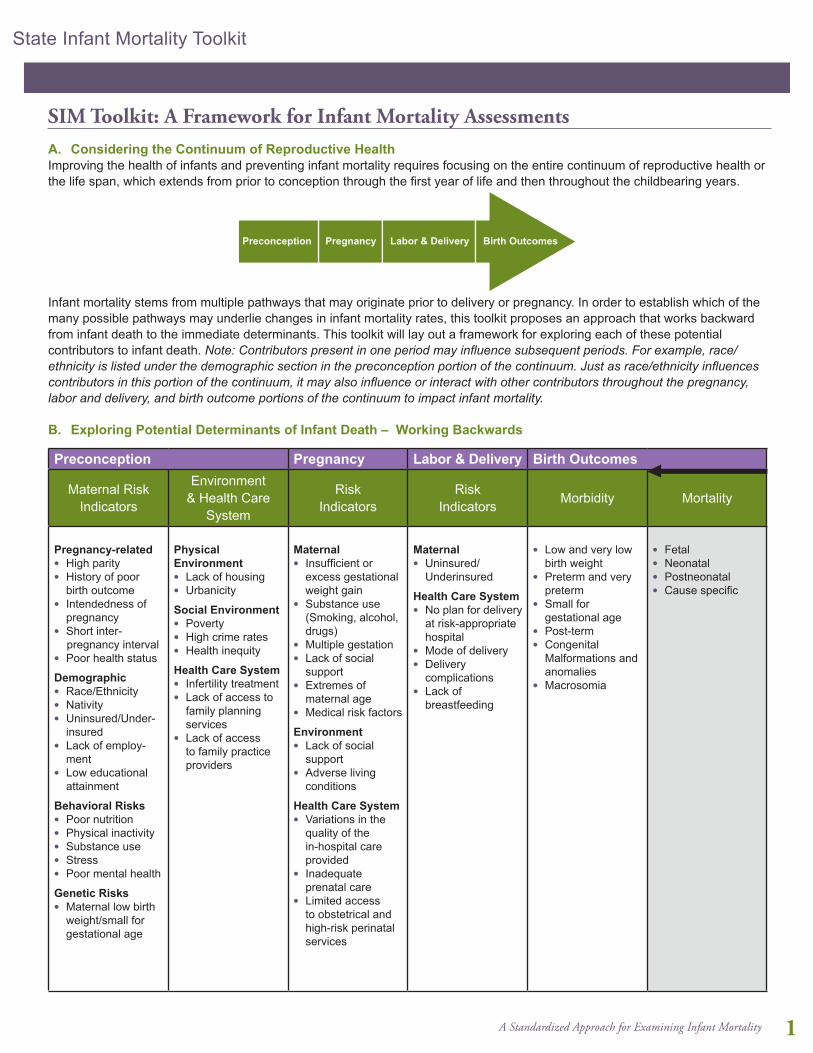
A. Considering the Continuum of Reproductive HealthImproving the health of infants and preventing infant mortality requires focusing on the entire continuum of reproductive health or the life span, which extends from prior to conception through the first year of life and then throughout the childbearing years.
Infant mortality stems from multiple pathways that may originate prior to delivery or pregnancy. In order to establish which of the many possible pathways may underlie changes in infant mortality rates, this toolkit proposes an approach that works backward from infant death to the immediate determinants. This toolkit will lay out a framework for exploring each of these potential contributors to infant death. Note: Contributors present in one period may influence subsequent periods. For example, race/ethnicity is listed under the demographic section in the preconception portion of the continuum. Just as race/ethnicity influences contributors in this portion of the continuum, it may also influence or interact with other contributors throughout the pregnancy, labor and delivery, and birth outcome portions of the continuum to impact infant mortality. B. Exploring Potential Determinants of Infant Death – Working Backwards
Preconception Pregnancy Labor & Delivery Birth Outcomes
Maternal Risk Indicators
Environment & Health Care
System
RiskIndicators
RiskIndicators Morbidity Mortality
Pregnancy-relatedl High parityl History of poor
birth outcomel Intendedness of
pregnancyl Short inter- pregnancy interval l Poor health status
Demographicl Race/Ethnicityl Nativity l Uninsured/Under-
insuredl Lack of employ-
mentl Low educational
attainment
Behavioral Risksl Poor nutritionl Physical inactivityl Substance usel Stressl Poor mental health
Genetic Risksl Maternal low birth
weight/small for gestational age
Physical Environmentl Lack of housingl Urbanicity
Social Environmentl Povertyl High crime ratesl Health inequity
Health Care Systeml Infertility treatmentl Lack of access to
family planning services
l Lack of access to family practice providers
Maternall Insufficient or
excess gestational weight gain
l Substance use (Smoking, alcohol, drugs)
l Multiple gestationl Lack of social
supportl Extremes of
maternal agel Medical risk factors
Environmentl Lack of social
supportl Adverse living
conditions
Health Care Systeml Variations in the
quality of the in-hospital care provided
l Inadequate prenatal care
l Limited access to obstetrical and high-risk perinatal services
Maternall Uninsured/
Underinsured
Health Care Systeml No plan for delivery
at risk-appropriate hospital
l Mode of deliveryl Delivery
complicationsl Lack of
breastfeeding
l Low and very low birth weight
l Preterm and very preterm
l Small for gestational age
l Post-terml Congenital
Malformations and anomalies
l Macrosomia
l Fetall Neonatall Postneonatall Cause specific
SIM Toolkit: A Framework for Infant Mortality Assessments
Preconception Pregnancy Labor & Delivery Birth Outcomes
1

A Standardized Approach for Examining Infant Mortality
State Infant Mortality Toolkit
1
C. The Framework in Two StagesThis framework is presented in two stages, with multiple steps within each stage. The first stage is developing an overview of infant mortality trends for selected groups. The second stage is developing a more focused investigation based on the results identified in the first stage.
The steps within each stage are illustrated in Table 1 and described in the following sections.
Table 1: Stages for Analyzing Infant Mortality Trends
Stage 1: Overview Investigation
Develop a SIM team
Establish time period, study population and baseline infant mortality rates
Review reporting changes
Consider causes of infant death and variation over time
Understand trends in adverse pregnancy outcomes and infant mortality rates
Examine when the deaths take place: maturity at birth and maturity-specific mortality
Stage 2: Focused Investigation
Based on pathways, explore changes in determinants and contributors to infant death
1. Stage One: Overview InvestigationThis section includes: l Develop a SIM team l MCH epidemiologist or perinatal epidemiologist l MCH program director and/or program staff l MCH policy analyst l MCH subject matter expert and/or community members
l Establish time period, study population and baseline infant mortality rates
l Review reporting changes: l Fetal deaths l Live births l Infant deaths
l Consider causes of infant death and variation over time l Impact of classification system for causes of death l Modified Dolfus classification l Comparability between ICD-9 and ICD-10
l Understand trends in adverse pregnancy outcomes and infant mortality rates
l Examine when the deaths take place: Maturity at birth and maturity-specific mortality l Apply the Perinatal Periods of Risk (PPOR) Framework l Excess in Maternal Health/Prematurity Deaths: Kitagawa Analysis
SIM Toolkit: A Framework for Infant Mortality Assessments – Stage 1
2

A Standardized Approach for Examining Infant Mortality
State Infant Mortality Toolkit
for greater statistical stability. While data for all births in the United States and for many states have a sufficient number of cases per year to support year-to-year comparisons, most small counties, urban areas and tribes require data to be aggregated for several years to ensure statistical stability for the rates.
TECHNICAL NOTE: In some cases, aggregated data for two time periods may not be equal in the number of years. While using equal numbers of years in each period is preferable, this may not be possible due to data availability and changes in cause of death coding over time. Other considerations for grouping years of data are the emergence of new technologies (e.g., the widespread implementation of the use of surfactant that may span several years to be routinely used throughout various populations).
After the team determines whether one year of data are sufficient or whether the years must be aggregated to ensure sufficient sample size for analysis, consider benchmark comparisons. These comparisons could include the national infant mortality rate, the Healthy People 2020 Target provided in the introduction of this toolkit, or the rates of surrounding states, counties, or regions. These comparative measures provide your team with a starting point to evaluate the magnitude of the infant mortality rate in your area.
Begin by limiting your population to the geographic area of interest (i.e. state, county or tribe): Explore how much geographic detail is available in your data source and limit your analysis to the group that most closely resembles your population of interest. As you consider your target population, be sure that the number of deaths for that population in a given year is not too small to be meaningful. There is not a hard and fast rule on the number of deaths required to be used in an infant mortality investigation; however, for some of the analytic steps in Stage I analysis of this toolkit a minimum number of 60 deaths per category is recommended. Note: If you have less than 60 infant deaths occurring in your area, you may use the toolkit; however, there may be certain analyses you will be unable to conduct due to small sample size issues. While multiple years of data may be aggregated to meet this criterion, it is recommended that no more than five years of data be grouped to complete the investigation. If aggregation of more years is required to meet the minimum number of deaths, a wider geographic region or larger target population should be considered.
Once the geographic region of interest has been identified, it may be appropriate to use geographic information systems (GIS) or geospatial techniques to map infant deaths in
SIM Toolkit: A Framework for Infant Mortality Assessments – Stage 1 continued
Develop a SIM team
The first step in the investigation of infant mortality is to develop a cohesive SIM team, including members who represent expertise in data, program, and policy so that results of the SIM may be applied to inform changes in programs or amendments in policies at the state, county, urban, or tribal level. Consideration also should be given to adding subject matter experts to the team who have specific knowledge of any population subgroups that have been identified as of special interest or focus in the SIM analysis. For example, if working with tribal groups, a tribal representative or tribal leader should be invited to the SIM team to participate in the planning of the analysis and discussion of SIM findings.
Based on the experience of the original SIM states, it is best to develop a core SIM team for the Stage I analysis and interpretation of findings. Once the team has completed the Stage I analysis and determined the direction for Stage II, the team should be expanded to include partners, community members, special interest groups, and others who assist the team in mobilizing community support and implementation of best practices as noted in Stage II. Communicating findings is especially relevant during Stage II of the SIM, and a team membership should include those who can communicate findings to a wide variety of audiences.
Once the team is established, Stage I analysis can begin.
Establish Time Period, Study Population and Baseline Infant Mortality Rates
The first step in the analytic stage of the investigation is to determine the time period and study population, and then accordingly establish baseline infant mortality rates.
Examine more than two years: A key consideration is that even if a rate seems to have changed in one year, the years immediately preceding and following that year should be included in the analysis. An increase or decrease in an infant mortality rate for one year may not be meaningful, even if it is statistically significant, if it is not replicated in subsequent years. In particular, rates based on small numbers may change dramatically annually, but without examining several years of data, this will not be apparent and may result in incorrect interpretations. Therefore, the team should examine the trends in the infant mortality rate over a period of years. For those teams with larger numbers, it may be sufficient to review the annual trends for five years of data; for those with smaller numbers, it may be more appropriate to aggregate years of data and review rolling averages. Note: Examples presented in this toolkit aggregate several years together
3
A Standardized Approach for Examining Infant Mortality
State Infant Mortality Toolkit
3
the defined area. Such mapping techniques may yield information on specific populations by county, zip code or census track. For example, infant deaths may be proximate to a risk-appropriate facility in an urban setting; this would be expected if high-risk women are receiving care and delivering at appropriate facilities. GIS mapping also may help the SIM team to determine whether to focus on multiple urban areas or specific areas based on the number of deaths occurring in and around those urban settings.
Frequency of infant mortality analysis: There are no hard guidelines for how often the team should update or review the SIM analysis once complete. However, if your state, county, urban area, tribe or region experiences a change in infant mortality, whether it is a rapid increase or decrease, a follow-up assessment should occur. Of the original states that participated in the SIM Collaborative, many states continue to regularly update the original analyses in order to monitor the trends and changes in infant mortality.
Review Reporting Changes
Once you have identified baseline rates and a time period, it is critical to review the data to ensure that changes in infant mortality rates are due to real influences in infant death and not due to changes in the way data were reported during that time period. A thorough review includes the following general principles:
l Investigating vital records and processing issues that may impact reporting
l Reporting-related issues in the collection of vital records data that include:
l Data quality l Underreporting l Definitional criteria l Timeliness
l Examining in-state trends from existing vital records databases that may be suggestive of reporting changes
l Reviewing multistate comparisons from existing National Center for Health Statistics databases that may suggest under- or over-reporting of vital events (www.cdc.gov/nchs/VitalStats.htm)
The reporting changes for fetal deaths, live births and infant deaths will be explored independently as each of these will be included in the infant mortality investigation.
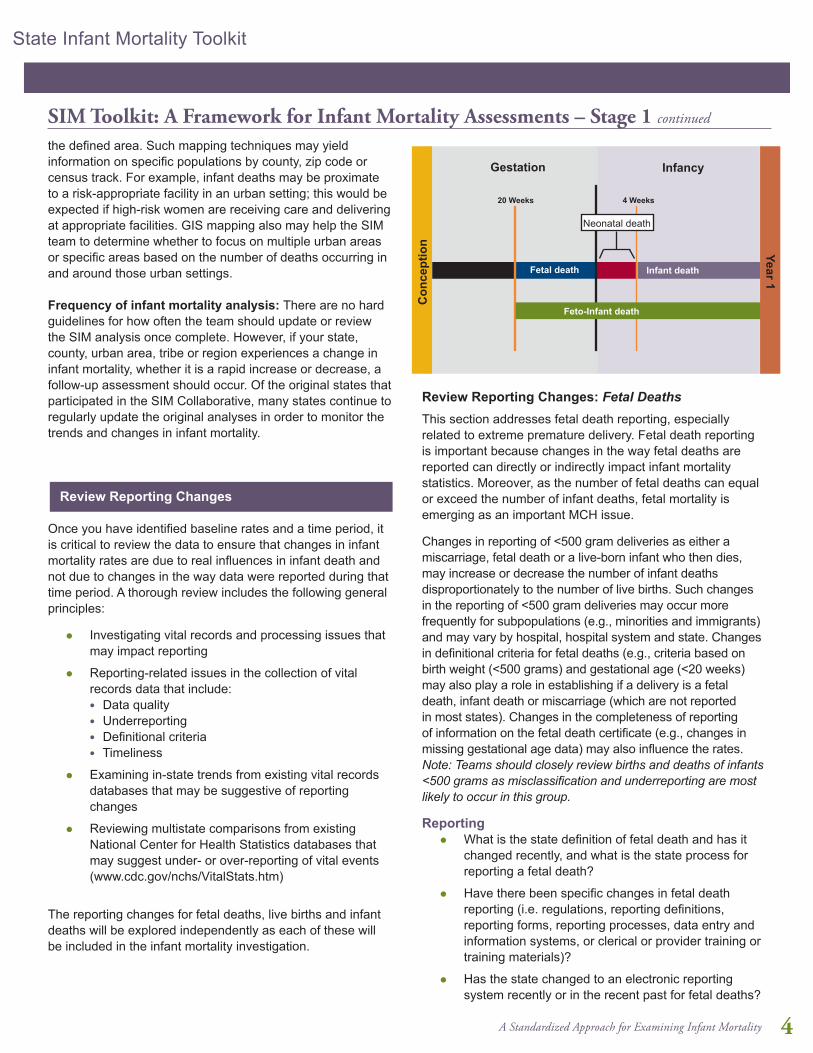
Review Reporting Changes: Fetal DeathsThis section addresses fetal death reporting, especially related to extreme premature delivery. Fetal death reporting is important because changes in the way fetal deaths are reported can directly or indirectly impact infant mortality statistics. Moreover, as the number of fetal deaths can equal or exceed the number of infant deaths, fetal mortality is emerging as an important MCH issue.
Changes in reporting of <500 gram deliveries as either a miscarriage, fetal death or a live-born infant who then dies, may increase or decrease the number of infant deaths disproportionately to the number of live births. Such changes in the reporting of <500 gram deliveries may occur more frequently for subpopulations (e.g., minorities and immigrants) and may vary by hospital, hospital system and state. Changes in definitional criteria for fetal deaths (e.g., criteria based on birth weight (<500 grams) and gestational age (<20 weeks) may also play a role in establishing if a delivery is a fetal death, infant death or miscarriage (which are not reported in most states). Changes in the completeness of reporting of information on the fetal death certificate (e.g., changes in missing gestational age data) may also influence the rates. Note: Teams should closely review births and deaths of infants <500 grams as misclassification and underreporting are most likely to occur in this group.
Reportingl What is the state definition of fetal death and has it
changed recently, and what is the state process for reporting a fetal death?
l Have there been specific changes in fetal death reporting (i.e. regulations, reporting definitions, reporting forms, reporting processes, data entry and information systems, or clerical or provider training or training materials)?
l Has the state changed to an electronic reporting system recently or in the recent past for fetal deaths?
SIM Toolkit: A Framework for Infant Mortality Assessments – Stage 1 continued
Gestation Infancy
20 Weeks 4 Weeks
Neonatal death
Fetal death Infant death
Feto-Infant death
Con
cept
ion Year 1
4

A Standardized Approach for Examining Infant Mortality
State Infant Mortality Toolkit
Multistate/Regional Comparisonsl Show tables, charts and scattergrams of the multistate
tables of the percentage of fetal deaths 20 to 27 weeks gestational age of all fetal deaths of 20+ weeks.
Example: Five-Year Fetal Mortality Rates by Birth Weight, Delaware, 1989-2002
From 1989-1993 through 1995-1999, the <500 gram fetal mortality rate increased steadily, after which time it began to decline. The 500-749 gram fetal mortality rate showed a similar trend. The 750-999 gram fetal mortality rate declined during the time period that the <750 gram fetal mortality rates were increasing, and increased during the time period that the <750 grams fetal mortality rates were declining.
Concurrent with these trends was a 1991 change in the fetal death reporting requirement from “deaths 20 weeks or 400 grams” to “deaths greater than or equal to 350 grams, or greater than or equal to 20 weeks in the absence of weight.” This increased attention to gestational age contributed to the change in rates. In addition, examination of fetal and infant mortality trends by the Delaware Division of Public Health revealed that reporting of live-born infants <500 grams steadily increased beginning in 1993, and many infants born at <500 grams were classified as surviving live births rather than as fetal or infant deaths.
TECHNICAL NOTE: The Delaware fetal death example uses a technique called rolling averages, which is a useful approach for presenting trend data for areas and indicators with a small number of events. The Delaware graph shows five-year rolling averages starting with 1989 and ending with 2002. Each five-year average is calculated separately and plotted for the defined five-year time period (for more details, the Delaware Case Study shows the table that corresponds with this graph).
350
300
250
200
150
100
50
089-93
90-94
91-95
92-96
93-97
94-98
95-99
96-00
97-01
98-02
<500 grams
500-749 grams
750-999 grams
Deaths per 1,000 Births
Five-year interval
l Has there been any clarification or training related to fetal deaths, appropriateness of gestational age or gestational viability?
l What is the state quality review process specifically for fetal deaths (i.e. edits, queries, quality reports, completeness reports) and has it recently changed in terms of process or staffing?
l Have there been changes in induced abortion reporting related to either service delivery (i.e., regulations, service providers, advocacy) or vital records reporting (i.e. regulation, processing, enforcement)?
In-State Trendsl Examine the number of and percentage with unknown
birth weight and gestational ages over time.
l Examine the frequencies, proportions and mortality rates of fetal deaths by birth weight and gestational age, both overall and by race. If warranted, also examine by geography or delivery facility.
l Birth weight (grams): <500, 500-749, 750-999, 1000-1499, 1500-2499, and 2500+; <1500, <2500
l Gestational age (weeks): <24, 24-27, 28-31, 32-33, 34-36, 37-38, and 39+ ; <32, <37
l As most underreporting is among extremely preterm fetal deaths, specifically examine the trend of the percentage of fetal deaths 20 to 27 weeks gestational age as all fetal deaths 20+ weeks may show changes in fetal death reporting. Examine overall and by race/ethnicity.
l If any changes in reporting or coding have taken place, examine fetal death rates prior to and following implementation of these changes to ensure consistency in reporting (i.e., that the data do not indicate any sudden increases or decreases in the rate of fetal deaths).
SIM Toolkit: A Framework for Infant Mortality Assessments – Stage 1 continued
5

A Standardized Approach for Examining Infant Mortality
State Infant Mortality Toolkit
5
Review Reporting Changes: Live BirthsThis section addresses live birth reporting, especially among extremely preterm and low birth weight deliveries. Live birth reporting is important because the number of live births is the denominator for overall mortality rates, as well birth weight- and gestational age-specific mortality rates. Moreover, live births provide the population of extremely low birth weight babies by which complete reporting from hospitals and other birthing centers can be examined.
Reportingl What is the state process for reporting live births?
l Have there been changes in live birth reporting (i.e. regulations, reporting definitions, reporting forms, reporting processes, data entry and information systems, or clerical or provider training or training materials)?
l Has the state changed to an electronic reporting system recently or in the recent past?
l Has there been any clarification or training related to live births, appropriateness of gestational age or gestational viability?
l What is the state vital records quality review process specific to live births (i.e. edits, queries, quality reports, completeness of reports), and has it recently changed in terms of process or staffing?
In-State Trendsl Examine the frequencies and percentages of live
births by birth weight and gestational age over time, both overall percentages and also by race. Other trends that may also be valuable to examine include percentages by geography or delivery facility.
l Common birth weight (grams) categories: <500, 500-749, 750-999, 1000-1499, 1500-2499 and 2500+; <1500, <2500
l Common gestational age (weeks) categories: <24, 24-27, 28-31, 32-33, 34-36, 37-38 and 39+; <32, <37
l As most underreporting is among extremely preterm and low birth weight live births, specifically focusing on the trend of the percentage of live births <500 grams and 500-750 grams, and the percentage of live births <24 weeks and 24 to 27 weeks may best reveal changes in live birth reporting. Again, examining overall trends, but also race, geography or facility trends may provide valuable information related to underreporting.
Multistate/Regional Comparisonsl Trends and percentages of registered live births <500
grams/500-750 grams and <24 weeks/24-27 weeks from other states can provide a useful comparison to states for the following:
l Identifying if state trends are similar to those seen in neighboring states or states with comparable demographics
l Understanding what percentages of these births are typical in other states
Example:In Louisiana, the annual percentage of live births <500g was stable at 0.3 percent from 1998 to 2004. However, Louisiana investigators found underreporting of mortality among live births <500g between 1998 and 2004, which resulted in implausibly low mortality rates within this high-risk birth weight category. These uncounted deaths artificially lowered infant mortality rates during that time period. An adjustment to the infant mortality rate that added an estimate of the missing infant deaths increased the 2000 infant mortality rate from 8.9 to 9.8, which smoothed fluctuations in the infant mortality rate between 1998 and 2004.
Since no changes in fetal death definitions had occurred in Louisiana, strategies to address underreporting focused on training. Louisiana worked to create a generalized approach to data reporting issues and an analytic plan that could be adapted by other states. One strategy to address underreporting required hospital chart abstraction of 5 percent to 10 percent of deliveries, but required hospital permissions and personnel time. Other strategies used the FIMR model to sample from the larger obstetric population to review pregnancies after 20 weeks, or used a billing record review to match fetal deaths with insurance and Medicaid records.
SIM Toolkit: A Framework for Infant Mortality Assessments – Stage 1 continued
6

A Standardized Approach for Examining Infant Mortality
State Infant Mortality Toolkit
Infant Mortality Rates for <500g Live Births: Louisiana and U.S.
Infa
nt d
eath
s pe
r 1,0
00 li
ve b
irths
Louisiana
USA
1000900800700600500400300200100
01991 1992 1993 1994 1995 1996 1997 1998 1999 2000 2001 2002
Review Reporting Changes: Infant DeathsThis section addresses infant death reporting, especially among extremely preterm or low birth weight infant deaths. Infant death reporting is important because the number of infant deaths is the numerator for overall mortality rates, as well as birth weight and gestational age specific mortality rates. This section also describes the use of feto-infant deaths and mortality rates for identifying whether a possible change in how fetal deaths and infant deaths has occurred.
Reportingl What is the state process for reporting infant deaths?
l Have there been specific changes in infant death reporting (i.e., regulations, reporting definitions, reporting forms, reporting processes, data entry and information systems, or clerical or provider training or training materials)?
l Has the state or regional system changed to an electronic reporting system recently or in the recent past? Are linked birth/death certificate data available and, if not, what is the feasibility of a point-in-time linkage?
l Has there been a change in the way that infant death certificates are linked to live birth certificates or in the match rate of linked records over time (i.e., the number of linked infant deaths divided by the number of all infant deaths)?
l What is the state vital records quality review process for infant deaths (i.e., edits, queries, quality reports, completeness reports) and has it recently changed in terms of process or staffing?
l Does the state follow up with hospitals on all live births <750 grams without an infant death certificate, or the birth mate of multiple gestation births that died, to ensure that the infant was discharged from the hospital alive and not missing an infant death certificate? Has this querying process changed over time?
In-State Trendsl Examine the number and percentage of unlinked
infant death records over time.
l Examine the number and percentage of infant deaths with an unknown birth weight or gestational age over time.
l Examine the frequencies, percentages, and rates of infant deaths by birth weight and gestational age, both overall and by race. Other trends that may be valuable to examine include trends by geography, delivery facility or inter-facility transfer.
l Common birth weight (grams) categories: <500, 500-749, 750-999, 1000-1499, 1500-2499 and 2500+; <1500, <2500 l Common gestational age (weeks) categories:
<24, 24-27, 28-31, 32-33, 34-36, 37-38 and 39+; <32, <37
l Examine the frequencies, percentages, and rates of feto-infant deaths (combination of fetal and infant deaths) by birth weight and gestational age, both overall and by race. Other trends that may be valuable to examine include trends by geography or delivery facility. Worth consideration, is breaking mortality rates down into very small age groups, such as <6 hours, <12 hours, <1 day or <2 days, depending on the accuracy of age at death reporting, to help determine if there may be variability in reporting by institution.
l Common birth weight (grams) categories (grams): <500, 500-749, 750-999, 1000-1499, 1500-2499 and 2500+; <1500, <2,500
l Common gestational age (weeks) categories: <24, 24-27, 28-31, 32-33, 34-36, 37-38 and 39+; <32, <37
l Underreporting is most common among extremely preterm and low birth weight infant deaths. Examining trends in mortality of live births <500 grams and 500-750 grams, and the mortality rates of live births <24 weeks gestation and 24-27 weeks gestation, both overall and by race, may help to reveal changes in infant death reporting.
Multistate/Regional Comparisonsl Trends and percentages of registered live births <500
grams/500-750 grams and <24 weeks/24-27 weeks from other states can provide a useful comparison to states for the following:
l Identifying if state trends are similar to those seen nationally, in neighboring states or states with comparable demographics
l Understanding what percentages of these births and deaths are typically observed in other states
Example:
SIM Toolkit: A Framework for Infant Mortality Assessments – Stage 1 continued
7

A Standardized Approach for Examining Infant Mortality
State Infant Mortality Toolkit
Most underreporting of infant deaths occurs among low birth weight infant deaths, specifically those <500 grams. In Louisiana, the underreporting of <500 gram births resulted in gaps between the U.S. total and the Louisiana state <500 gram infant mortality rate. The biggest discordance occurred in 2000, making the <500 gram infant mortality rate that year the lowest for Louisiana in over a decade. Awareness of the underreporting problem helps to correctly interpret the changes in the data.
Consider Causes of Infant Death and Variation Over Time
Causes of infant death also vary by age at infant death (i.e., neonatal or postneonatal). Rank Cause of death,
2008Percentage of total deaths (in specified group)
Mortality rate (per 100,000 live births in specified group)
NEONATAL (64.9% of infant deaths; mortality rate of 428.7)
1 Disorders related to short gestation and low birth weight, not elsewhere classified
25.4% 109.0
2 Congenital malformations, deformations and chromosomal anomalies
21.7% 93.1
3 Maternal complications of pregnancy
9.6% 41.0
4 Complications of placenta, cord and membranes
5.9% 25.1
5 Bacterial sepsis 3.7% 15.9POSTNEONATAL
(35.1% of infant deaths; mortality rate of 231.8)
1 Sudden infant death syndrome 21.7% 50.4
2 Congenital malformations, deformations and chromosomal anomalies
15.6% 39.6
3 Unintentional injuries 12.0% 27.9
4 Diseases of the circulatory system 4.9% 11.5
5 Gastritis, duodenitis, and non-infective enteritis and colitis
3.4% 7.9
Changes in causes of infant deaths over time can result from changes in reporting, disease definitions, medical technology and many other contributing factors. Because they are leading causes of mortality, increases in premature birth or congenital anomalies may result in an overall increase in the infant mortality rate. Improvements in medical care may shift etiologically related deaths from the fetal to neonatal or postneonatal periods. Improvement in cause-specific mortality may be unevenly distributed among racial/ethnic groups, potentially masking important information. Investigation of cause- and timing-specific mortality includes assessing trends in causes of death and changes in classification of death; comparing death rates between fetal, neonatal and postneonatal periods over time; and assessing changes in cause and timing within categories of infant maturity.
Possible pathways to investigate include changes in:l Specific cause(s) of death, after accounting
for possible changes in classification and certification preference
l Timing of death (age at death)
l Cause and/or timing of death within specific categories of birth weight, gestational age, race/ethnicity, etc.
Impact of Classification System for Causes of DeathInternational Statistical Classification of Diseases (ICD) codes are used to describe causes of death from the death certificate. A classification system of causes of infant deaths is needed because the number of individual ICD codes is extensive and unmanageable. Additionally, individual codes are sensitive to changes in classification preference, and are less comparable over time and across revisions (e.g. ICD-9 to ICD-10). Classification methods for assigning deaths to a causation grouping support organizing these data for analytic and programmatic purposes.
Some classification methods for infant death include:
l Wigglesworth: www.ncbi.nlm.nih.gov/pmc/articles/PMC1590112/pdf/archdisch00899-0005.pdf
l Aberdeen: Baird D, Walker J, Thomson AM. The causes and prevention of stillbirths and first week deaths. J Obstet Gynaecol Br Comm 1954;61:433.
l British Necropsy: Claireaux AE. Perinatal mortality in the United Kingdom. In: Keller RJ, ed. Modern trends in obstetrics Ill. London: Butterworths, 1962:191-211.
l Naeye’s Classification: http://jama.jamanetwork.com/data/Journals/JAMA/8650/jama_238_3_017.pdf
l Neonatal and Intrauterine Death Classification according to Etiology (NICE): www.ije.oxfordjournals.org/content/27/3/499.full.pdf
SIM Toolkit: A Framework for Infant Mortality Assessments – Stage 1 continued
Source: www.cdc.gov/nchs/data/nvsr/nvsr60/nvsr60_06.pdf
8

A Standardized Approach for Examining Infant Mortality
State Infant Mortality Toolkit
l Dollfus: l www.ncbi.nlm.nih.gov/pubmed/2371093 l www.ncbi.nlm.nih.gov/pmc/articles/PMC1509002/pdf/
amjph00011-0138.pdf l International Collaborative Effort on Perinatal and Infant
Mortality : l www.cdc.gov/nchs/data/misc/ice92_3acc.pdf l www.cdc.gov/nchs/data/misc/ice90_2acc.pdf l www.cdc.gov/nchs/data/misc/ice2_85_2.pdf l NCHS: www.cdc.gov/nchs/data/nvsr/nvsr59/nvsr59_08.pdf l Modified Dollfus: www.ncbi.nlm.nih.gov/pmc/articles/
PMC1509002/pdf/amjph00011-0138.pdf
Modified Dollfus ClassificationFor users of the SIM toolkit, the modified Dollfus classification method has been recommended by subject matter experts as the preferred method for classifying cause of infant death since there are only nine categories and it has good comparability between ICD-9 and ICD-10.
Comparability between ICD-9 and ICD-10ICD–10 differs from ICD–9 in several respects. ICD–10 is more detailed than ICD–9, with about 8,000 ICD-10 categories compared with about 5,000 ICD-9 categories. ICD–10 uses alphanumeric codes, while ICD-9 uses numeric codes. Also, with ICD-10 some additions and modifications have been made to the ICD chapters, and some of the coding rules and rules for selecting the underlying cause of death have been changed.
Comparability studies have been conducted to determine the effects of the new revision of the ICD on the coding of causes of infant death. The key measure of a comparability study is the comparability ratio, which is derived from dual classification (i.e., classifying underlying cause of deaths for a single year of mortality data by both the new and previous revision). It is calculated by dividing the number of deaths classified by the new revision by the number of deaths classified by the previous revision. The resulting ratios represent the net effect of the new revision on cause-of-death statistics and can be used to adjust mortality statistics for causes of death classified by a previous revision to be comparable to rates for the same causes classified by the new revision. Ratios closer to the value of 1.00 suggest better comparability between ICD-9 and ICD-10 coding.
Modified Dollfus Classifications (and associated ICD9-to-ICD10 comparability ratios)
Cause of Infant Death Comparability Ratio
1. Prematurity and related conditions 1.031 2. Congenital anomaly 0.928 3. SIDS 1.017 4. Obstetric conditions 1.021 5. Birth asphyxia 1.325 6. Perinatal infections 1.026 7. Other infections 0.746 8. External causes/Injuries 0.998 9. All other 1.072
Note: Comparability ratios do not apply to fetal deathsSource: www.cdc.gov/nchs/data/nvsr/nvsr49/nvsr49_02.pdf
Regardless of the system chosen, each classification system is limited by accuracy in the recorded underlying cause of death. Potential contributors to inaccuracies in cause of death recording include automated systems and the completeness of the death certificates.
Examples:While several systems of classification of perinatal death exist, no single system has been adopted as a standard. In the SIMC, states were encouraged to use the modified Dollfus classification because it has only nine categories, has good comparability between ICD-9 and ICD-10, and is etiology-based with a focus on prevention. Analyses included calculation of cause-specific mortality rates stratified by birth weight, plurality, and maternal demographic characteristics (i.e.,. age, race/ethnicity and socioeconomic status). Teams assessed changes in specific causes, the classification of causes, and the timing of death within birth weight and gestational age categories.
North Carolina examined cause and timing of infant death in 2001-2003 using National Vital Statistics System data. Infants born to African American women were at 2.5 times the risk of dying compared with those born to White women. Preterm birth was the leading cause of death, and African Americans experienced 3.6 times the infant deaths due to preterm birth compared to white infants. Compared with the United States, North Carolina had higher infant mortality rates from 2001 to 2003, but the distribution of causes was comparable. Mortality decreased across the fetal, neonatal and postneonatal periods, suggesting that improvements seen in the infant mortality rates included increased survival rather than postponement of death. The only increase observed was in the percentage of infant deaths occurring in the first hour of life, which increased from 26 percent to 29 percent from 1989-93 to 1999-2002.
The Delaware investigation into changes in timing of infant death found an increase in the proportion of infant deaths in the early neonatal period (0-6 days) relative to the late neonatal and
SIM Toolkit: A Framework for Infant Mortality Assessments – Stage 1 continued
9
A Standardized Approach for Examining Infant Mortality
State Infant Mortality Toolkit
9
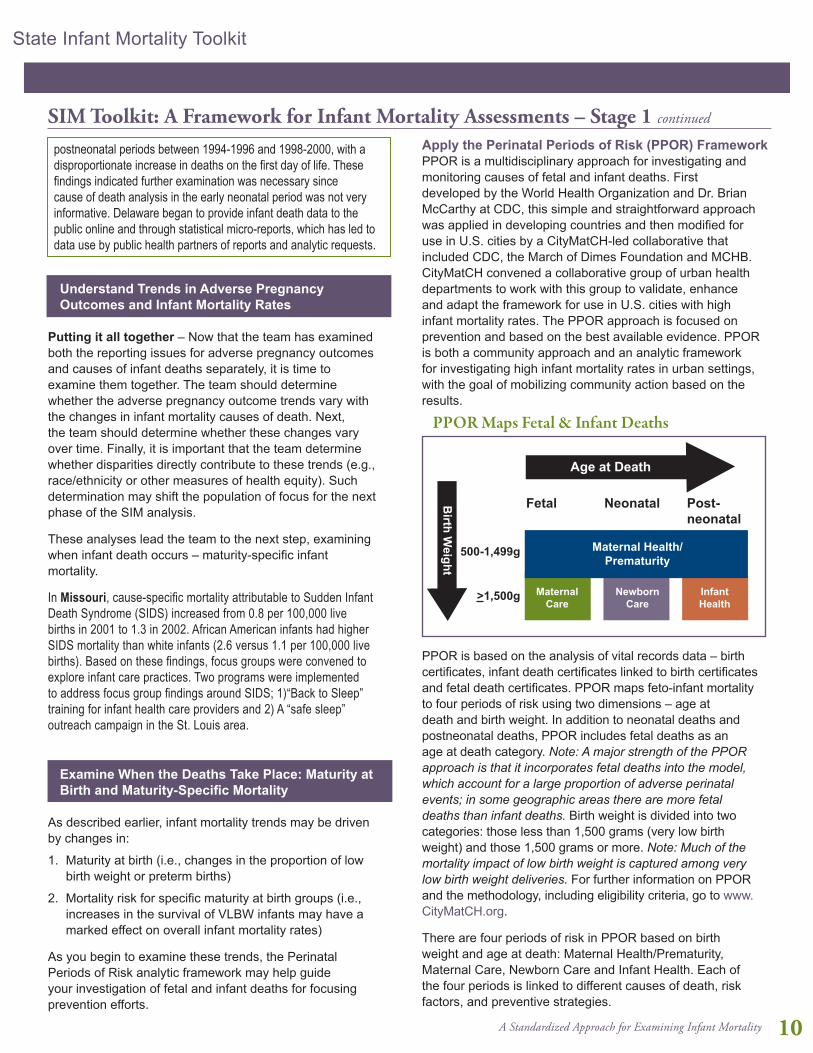
Apply the Perinatal Periods of Risk (PPOR) FrameworkPPOR is a multidisciplinary approach for investigating and monitoring causes of fetal and infant deaths. First developed by the World Health Organization and Dr. Brian McCarthy at CDC, this simple and straightforward approach was applied in developing countries and then modified for use in U.S. cities by a CityMatCH-led collaborative that included CDC, the March of Dimes Foundation and MCHB. CityMatCH convened a collaborative group of urban health departments to work with this group to validate, enhance and adapt the framework for use in U.S. cities with high infant mortality rates. The PPOR approach is focused on prevention and based on the best available evidence. PPOR is both a community approach and an analytic framework for investigating high infant mortality rates in urban settings, with the goal of mobilizing community action based on the results.
PPOR is based on the analysis of vital records data – birth certificates, infant death certificates linked to birth certificates and fetal death certificates. PPOR maps feto-infant mortality to four periods of risk using two dimensions – age at death and birth weight. In addition to neonatal deaths and postneonatal deaths, PPOR includes fetal deaths as an age at death category. Note: A major strength of the PPOR approach is that it incorporates fetal deaths into the model, which account for a large proportion of adverse perinatal events; in some geographic areas there are more fetal deaths than infant deaths. Birth weight is divided into two categories: those less than 1,500 grams (very low birth weight) and those 1,500 grams or more. Note: Much of the mortality impact of low birth weight is captured among very low birth weight deliveries. For further information on PPOR and the methodology, including eligibility criteria, go to www.CityMatCH.org.
There are four periods of risk in PPOR based on birth weight and age at death: Maternal Health/Prematurity, Maternal Care, Newborn Care and Infant Health. Each of the four periods is linked to different causes of death, risk factors, and preventive strategies.
PPOR Maps Fetal & Infant Deaths
Infant Health
Number of Excess Deaths
MaternalCare
NewbornCare
Maternal Health/Prematurity
Post-neonatal
NeonatalFetal
Age at Death
Birth W
eight
500-1,499g
>1,500g
postneonatal periods between 1994-1996 and 1998-2000, with a disproportionate increase in deaths on the first day of life. These findings indicated further examination was necessary since cause of death analysis in the early neonatal period was not very informative. Delaware began to provide infant death data to the public online and through statistical micro-reports, which has led to data use by public health partners of reports and analytic requests.
Understand Trends in Adverse Pregnancy Outcomes and Infant Mortality Rates
Putting it all together – Now that the team has examined both the reporting issues for adverse pregnancy outcomes and causes of infant deaths separately, it is time to examine them together. The team should determine whether the adverse pregnancy outcome trends vary with the changes in infant mortality causes of death. Next, the team should determine whether these changes vary over time. Finally, it is important that the team determine whether disparities directly contribute to these trends (e.g., race/ethnicity or other measures of health equity). Such determination may shift the population of focus for the next phase of the SIM analysis.
These analyses lead the team to the next step, examining when infant death occurs – maturity-specific infant mortality.
In Missouri, cause-specific mortality attributable to Sudden Infant Death Syndrome (SIDS) increased from 0.8 per 100,000 live births in 2001 to 1.3 in 2002. African American infants had higher SIDS mortality than white infants (2.6 versus 1.1 per 100,000 live births). Based on these findings, focus groups were convened to explore infant care practices. Two programs were implemented to address focus group findings around SIDS; 1)“Back to Sleep” training for infant health care providers and 2) A “safe sleep” outreach campaign in the St. Louis area.
Examine When the Deaths Take Place: Maturity at Birth and Maturity-Specific Mortality
As described earlier, infant mortality trends may be driven by changes in:
1. Maturity at birth (i.e., changes in the proportion of low birth weight or preterm births)
2. Mortality risk for specific maturity at birth groups (i.e., increases in the survival of VLBW infants may have a marked effect on overall infant mortality rates)
As you begin to examine these trends, the Perinatal Periods of Risk analytic framework may help guide your investigation of fetal and infant deaths for focusing prevention efforts.
SIM Toolkit: A Framework for Infant Mortality Assessments – Stage 1 continued
10

A Standardized Approach for Examining Infant Mortality
State Infant Mortality Toolkit
Phase 1 Example:CityMatCH How to Do PPOR – Orientation Phase 1 and Exercisewww.CityMatCH.org/ppor_how.php
Before comparisons to the reference group can be made, counts need to be changed into rates: divide by the total population at risk. In this case, the total population of infants, including those that were born alive plus those which were stillborn (fetal deaths).
TECHNICAL NOTE: To conduct PPOR analysis, there should be at least 60 deaths over at most a five-year period and at least 10 deaths in each cell for each population being studied. Studying fewer than 60 deaths would result in numbers that fluctuate from year to year simply due to randomness. Studying at least 60 deaths allows us to differentiate between real underlying changes and random fluctuations. In addition, imputation for key data items may be necessary. Bias is introduced if more than 5 percent to 10 percent of births, deaths, and fetal deaths are missing data items such as birth weight, age at death, and maternal characteristics.
There are well-defined cut-off criteria for mapping fetal and infant deaths. Fetal deaths are limited to fetal deaths with gestational ages of 24 weeks or more. Fetal deaths and live births are limited to birth weights of 500 grams or more. These limitations are necessary because there are large reporting differences in vital records across geographic areas for events below these two cutoffs. Fetal death data do not include spontaneous and induced terminations of pregnancy.
l Maternal Health/Prematurity l Contributors to feto-infant deaths in this period
include access to preconception health care, health between pregnancies, health behaviors and perinatal care
l Prevention efforts in this period may focus on access to care during the preconception period; reducing unintended pregnancy, smoking and drug abuse; and specialized perinatal care
l Maternal Care l Contributors to fetal deaths in this period include
prenatal care, risk referral, high-risk obstetric care l Prevention efforts in this period may focus on early
and continuous prenatal care, referral of high-risk pregnancies, and appropriate medical management of diabetes, seizures, post maturity or other medical problems
l Newborn Care l Contributors to infant death in this period include
perinatal management, neonatal care and pediatric surgery
l Prevention efforts in this period may focus on advanced neonatal care and treatment of congenital anomalies
l Infant Health l Contributors to infant death in this period include
environmental factors l Prevention efforts in this period may focus on safe
infant sleep environments, breastfeeding, access to a medical home, and injury prevention
There are two analytic phases of the PPOR approach. In Phase 1, populations with excess mortality are identified. In Phase 2 of PPOR analysis, the focus is on identifying causes for excess mortality, risk factors for those causes and estimates for the potential impact of risk factors.
PPOR: Phase 1 In Phase 1, feto-infant mortality rates are calculated and mapped to the four periods of risk. The state, county, urban area, tribe or region (agency) then selects a reference group whose population has a low mortality rate. In each prevention area, excess mortality is determined by subtracting the reference group mortality rate from the mortality rate of the study population. These differences represent potential preventable deaths that occurred in the study population. The PPOR approach presumes the whole population can achieve the same low feto-mortality rates as any subgroup within the population. Each prevention area or cell adds up to the overall feto-infant mortality rate. In this way, each prevention area can be used to interpret or understand how each period contributes to the overall rate.
SIM Toolkit: A Framework for Infant Mortality Assessments – Stage 1 continued
PPOR Map of Feto-Infant DeathsUrban County, All Races 2000-2002
23,199 Live births
153 Died as infants
83 Fetal deaths
Denominator = 23,199 + 83= 23,282
Number of Excess Deaths
48Maternal
Care(fetal
deaths)
44Newborn
Care(infant
deaths)
47Infant Health(infant
deaths)
97Maternal Health/Prematurity
(35 fetal deaths, 62 infant deaths)
11

A Standardized Approach for Examining Infant Mortality
State Infant Mortality Toolkit
11
“Excess” Mortality and Reference Group SelectionInternal and external reference groups can be used to identify excess mortality. An internal reference group should be a population group with low risk for poor pregnancy outcomes. In general, this group should represent roughly 15 percent or more of the population. External reference groups are useful when the number of events for the reference group is less than 60 deaths or when there are data quality problems. A combination of internal and external reference groups also may be useful when examining how much of the excess mortality is specific to the target population and how much of it is influenced by the overall environment.
In this chart, each row represents a different PPOR map. Excess mortality rates are calculated by subtracting the bottom row (reference group feto-infant mortality rates) from the top row (local feto-infant mortality rates).
Note: The excess number of deaths was obtained by multiplying the excess mortality rate and the number of infant and fetal deaths of each racial and ethnic group in the urban county.
The excess number of deaths provides additional information to rates. For example, although African American mothers account for only 14 percent of deaths (3,291/23,283), they experience 39 percent of the excess deaths (39/101).
PPOR: Phase 2Phase 2 of the PPOR analysis has three steps. In the first step of Phase 2, the state, county, urban area, tribe or region (agency) examines vital records and other local and population-based data to determine causes of fetal and infant mortality that most likely contribute to differences found in Phase 1 analysis. In the second step, the community examines local and population-based data to determine known risk factors for those causes that most likely contribute to the identified differences in fetal and infant mortality. In the third step, the community develops estimates for the potential impact of addressing contributors to fetal and infant mortality so that preventive actions can be prioritized.
Excess in the Infant Health PeriodIf excess mortality is identified in the Infant Health period, PPOR uses the ICD-10 Codes for underlying causes from the death certificate to focus the investigation within the period. The mortality rates by underlying cause of death, both broad and detailed groupings, should be compared between the study population and the reference group. Next, assess the prevalence of known risk factors for those causes more prevalent among the study population than among the reference population within the period. Together, this information may be used to initially identify potential interventions.
SIM Toolkit: A Framework for Infant Mortality Assessments – Stage 1 continued
Calculating Excess Number of DeathsFrom Feto-Infant Mortality RatesUsing External Comparison Group Urban County, 2000-2002
Racial Ethnic Group
White Non-Hispanic
Black Non-Hispanic
Other Race
All4.3
4.4
11.8
2.8
3,291
3,947
23,282
16,045
Excess Mortality
Rate
Infant and Fetal Deaths
Multiply Number of Excess Deaths
= 45
= 39
= 17
= 101
2.8 x 16,0451,000
11.8 x 3,2911,000
4.4 x 3,9471,000
4.3 x 23,2821,000
Calculating Excess RatesOverall Population Urban County 2000-2002(External Reference Group)
Urban County
All
Maternal Health/
Prematurity
4.2
Maternal Care
2.1
Number of Excess Deaths
Feto-Infant Mortality
10.1
Infant Health
2.0
Newborn Care
1.9
USA Reference Group
Maternal Health/
Prematurity
2.2
Maternal Care
1.5
Feto-Infant Mortality
5.9
Infant Health
1.0
Newborn Care
1.1
Excess Mortality RateBy Subtraction
Maternal Health/
Prematurity
2.0
Maternal Care
0.6
Feto-Infant Mortality
4.3
Infant Health
1.0
Newborn Care
0.8 More information on PPOR and analytic examples can be found at CityMatCH: www.CityMatCH.org/ppor_index.php
12

A Standardized Approach for Examining Infant Mortality
State Infant Mortality Toolkit
Underlying Cause of Death Risk Factors
SUID--Sudden Unexpected Infant Death
l Passive smoke exposurel Sleep positionl Lack of breastfeedingl Presence of bedding in cribl Young or advanced maternal agel Lack of maternal education on preventable risksl Substance abuse
Congenital Anomalies l Lack of folic acid intakel Lack of genetic counselingl Lack of appropriate prenatal screeningsl Delivery at a site inappropriate for riskl Substance abusel Obesityl Prenatal use of some prescription medications
Infection l Lack of medical homel Lack of immunizationl Lack of maternal education on care seekingl Lack of breastfeedingl Smoking in householdl Lack of prenatal care testing
Injuries l Presence of bedding in cribsl Bed sharingl Lack of, or improper, car seat usel Abuse
Perinatal conditions l Lack of medical homel Maternal smoking or smoking in householdl Lack of high risk follow up
Excess deaths in the Maternal Care PeriodFor PPOR Phase 2 analysis of excess deaths in the Maternal Care period, maternal information from vital records may be limited and commonly there is a high frequency of missing information from fetal death certificates. Defining a causal pathway is more difficult than for the Infant Health period because the cause of death information for fetal deaths is not currently as useful in identifying prevention strategies. With currently available data, the best investigative approach for excess Maternal Care deaths may be an examination of the known risk factors using vital records and other data sources, and conducting fetal and infant mortality reviews on these fetal deaths from a public health prevention perspective.
SIM Toolkit: A Framework for Infant Mortality Assessments – Stage 1 continued Risk factors for death in the Maternal Care period, that are typically reliably collected from vital records include birth weight, gestational age, maternal age, race, parity, smoking, education, socioeconomic factors, previous fetal loss, inter-pregnancy interval and multiple gestation pregnancies. Additional population-based risk factors from other health information systems include body mass index, inappropriate gestational weight gain, and other select maternal medical conditions (diabetes, hypertension, Rh disease, etc.). Some of these risk factors may be collected on the newly revised fetal death certificate, WIC program databases, and other public health datasets.
PPOR Analytic Phase 2 – Excess in Maternal Health/Prematurity Deaths: Kitagawa AnalysisIn Phase 2 of the analysis where excess mortality is concentrated in the Maternal Health/Prematurity period, teams may want to use the Kitagawa method to explore whether excess deaths are due to birth weight-specific mortality (the mortality rate of infants born in a specific birth weight range) or to birth weight distribution (the frequency of low and very low birth weight births). Kitagawa quantifies the relative contribution of the birth weight-specific mortality rate and the birth weight distribution to the total change in feto-infant mortality rates, where both may be changing simultaneously.
Partitioning excess deaths using the Kitagawa method can help states, counties, urban areas, tribes or regions to focus their intervention efforts. Teams that find a high frequency of very low birth weight births contributing to excess mortality may choose to examine risk factors associated with very low birth weight/preterm birth. Teams that find excess mortality is due to higher birth weight-specific mortality may choose to examine aspects of their perinatal care system that may be contributing to higher birth weight-specific infant mortality rates.
13

A Standardized Approach for Examining Infant Mortality
State Infant Mortality Toolkit
13
SIM Toolkit: A Framework for Infant Mortality Assessments – Stage 1 continued
Enter Enter Calculated Calculated
Birth Weight (grams)
Number of Live Births & Fetal Deaths
Number of Feto-Infant Deaths
Birth Weight Distribution
Feto-Infant Mortality Rates (per 1,000 live births and
fetal deaths)
500 –749 104 70 0.9% 673.1
750 –999 103 27 0.9% 262.1
1,000–1,249 103 12 0.9% 116.5
1,250–1,499 117 9 1.0% 76.9
1,500–1,999 319 13 2.6% 40.8
2,000–2,499 883 20 7.3% 22.7
2,500+ 10,417 56 86.5% 5.4
Total 12,046 207 100.0% 17.2
Example:Table 1. Population Group 1 = Target Population
There are seven birth weight categories. The birth weight frequency for the target population (P1n) is found in the third column of Table 1. The birth weight-specific mortality for the target population (M1n) is in the last column of Table 1. For example, for the birth weight category 500-749 grams (n=1), P11 =0.9% and M11= 673.1.
Kitagawa Formula
Difference (MR1-MR2) = (Birth weight-specific mortality (Perinatal Care)) + (Frequency of low birth weight (very low birth weight births))
n = Number of birth weight categories (birth weight “strata”)
MR1 = Overall feto-infant mortality rate for the target group
MR2 = Overall feto-infant mortality rate for the reference group
P1n = Proportion of births for a specific birth weight category for the target group
P2n = Proportion of births for a specific birth weight category for the reference group
M1n = Birth weight-specific mortality rate for the target group
M2n = Birth weight-specific mortality rate for the reference group
An Excel spreadsheet with Kitagawa calculations where you can input local data and estimate the contributions of birth weight distribution and birth weight-specific mortality can be found at: www. CityMatCH.org/ppor_how.php.
� ���� +� �
��� −� �� + �
�� +� ��
�� − � ����
∑n
1((P1n+P2n) x(M1n- M2n))2 +((M1n+M2n) x(P1n - P2n))2( )
14

A Standardized Approach for Examining Infant Mortality
State Infant Mortality Toolkit
Enter Enter Calculated Calculated
Birth Weight(grams)
Number of Live Births & Fetal Deaths
Number of Feto-Infant Deaths
Birth Weight Distribution
Feto-Infant Mortality Rates
500 –749 7,008 4,019 0.2% 573.5
750 –999 7,961 1,945 0.2% 244.3
1,000–1,249 9,383 1,263 0.2% 134.6
1,250–1,499 11,075 1,085 0.3% 98.0
1,500–1,999 43,178 2,178 1.1% 50.4
2,000–2,499 128,439 2,552 3.4% 19.9
2,500+ 3,566,957 9,690 94.5% 2.7
Total 3,774,001 22,732 100.0% 6.0
SIM Toolkit: A Framework for Infant Mortality Assessments – Stage 1 continued
Table 2. National Reference Population;Example U.S. White non-Hispanic Mothers, Age >=20 years, Education >=13 years
The birth weight frequency for the reference population (P2n) is found in the third column of Table 2. The birth weight-specific mortality for the reference population (M2n) is found in the last column of Table 2. For example, for the birth weight category 500-749 grams (n=1), P21=0.2% and M21=573.5.
Calculated Calculated Calculated
Birth Weight(grams)
Birth Weight Frequency
Feto-Infant Mortality Rates Total
500 –749 4.2 0.5 4.7
750 –999 1.6 0.1 1.7
1,000–1,249 0.8 -0.1 0.7
1,250–1,499 0.6 -0.1 0.5
1,500–1,999 0.7 -0.2 0.5
2,000–2,499 0.8 0.1 1.0
2,500+ -0.3 2.4 2.1
Total 8.4 2.8 11.2
Table 3. Birth weight-specific components for the absolute difference in overall feto-infant mortality rates between populations due to birth weight distribution and feto-infant mortality rates
In this table, the Kitagawa Formula is applied to estimate the effects of the two components contributing to the overall difference of 11.2. Let us compute these two components for the first birth weight category, 500-749 grams. The birth weight frequency component:
Similarly, for the mortality component:
The sum 4.2+0.5=4.7 represents the contribution of 500-749 grams births and fetal deaths to the overall excess.� ��
�� +� ��
�� −� �� + ��� +� �
��� − � �� �
�
5.06.990052.0)5.5731.673(
2
)002.0009.0()1211(
2
)1211(=×=−×
+=−×
+MM
PP
� ���� +� �
��� −� �� + �
�� +� ��
�� − � �� ��
2.40068.03.623)002.0009.0(2
)5.5731.673()1211(
2
)1211(=×=−×
+=−×
+PP
MM
15
A Standardized Approach for Examining Infant Mortality
State Infant Mortality Toolkit
15
SIM Toolkit: A Framework for Infant Mortality Assessments – Stage 1 continued
Calculated Calculated Calculated
Birth Weight(grams)
Birth Weight Frequency
Feto-Infant Mortality Rates Total
500 –749 37.8% 4.7% 42.5%
750 –999 14.6% 0.9% 15.5%
1,000–1,249 6.8% -0.9% 5.9%
1,250–1,499 5.3% -1.2% 4.1%
1,500–1,999 6.1% -1.6% 4.5%
2,000–2,499 7.5% 1.3% 8.8%
2,500+ -2.9% 21.6% 18.6%
Total 75.3% 24.7% 100.0%
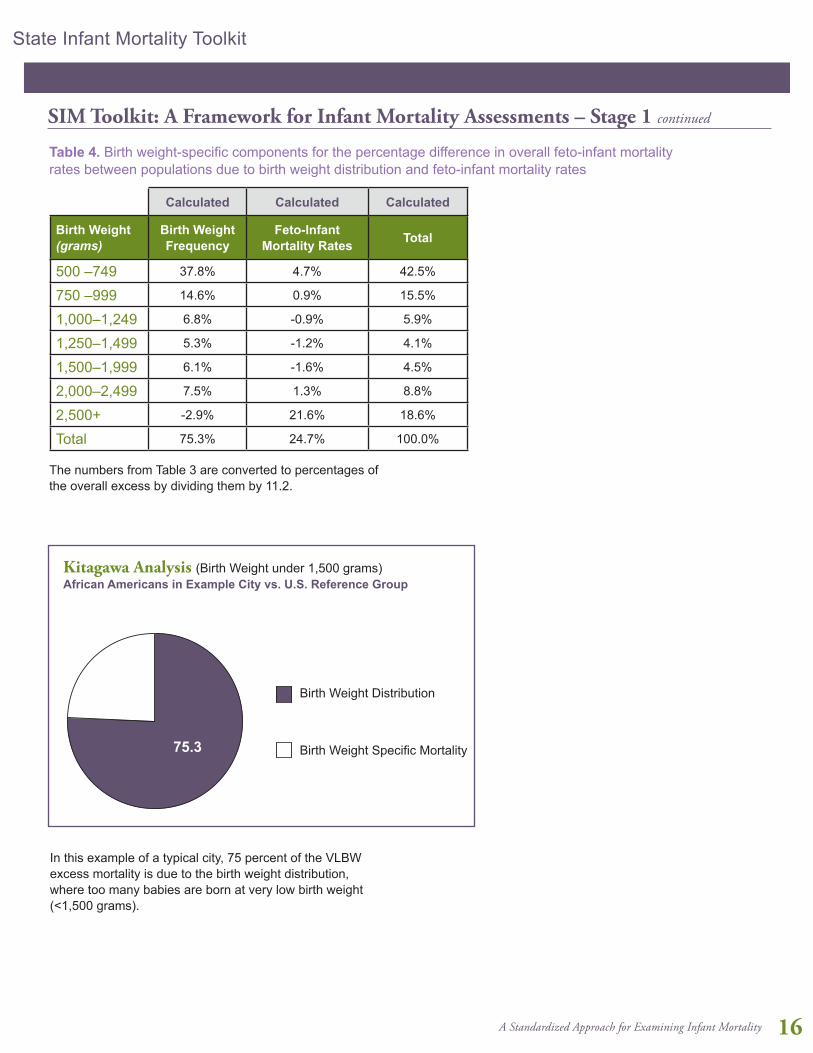
Table 4. Birth weight-specific components for the percentage difference in overall feto-infant mortality rates between populations due to birth weight distribution and feto-infant mortality rates
The numbers from Table 3 are converted to percentages of the overall excess by dividing them by 11.2.
In this example of a typical city, 75 percent of the VLBW excess mortality is due to the birth weight distribution, where too many babies are born at very low birth weight (<1,500 grams).
∑_1^n�[(((P_1n+P_2n ))/2×(M_1n-M_2n ))+(((M"1n" +M"2n" ))/2×(P"1n" -P"2n" ))]
� ���� +� �
��� −� �� + �
�� +� ��
�� − � �� ��
24.7
75.3
Birth Weight Distribution
Birth Weight Specific Mortality
Kitagawa Analysis (Birth Weight under 1,500 grams)African Americans in Example City vs. U.S. Reference Group
16

A Standardized Approach for Examining Infant Mortality
State Infant Mortality Toolkit
2. Stage Two: Focused Investigation
SIM Toolkit: A Framework for Infant Mortality Assessments – Stage 2
Contributors associated with an excess in infant mortality or an adverse pregnancy outcome
There may be no single factor that is THE cause of infant mortality, which is more commonly the result of multiple contributing factors to the birth of a high-risk infant and influencing subsequent survival. Often interacting with one another, these risk factors include:
l Maternal socio-demographic characteristics and behavioral risk factors
l Attributes of the social and physical environment
l Systems of care
A full assessment of trends in infant mortality rates should consider potential changes, both positive and negative, among a diversity of risk factors. Each state, county, urban area and tribe should develop an analysis plan that measures attributes in these three areas using available data. National, regional, state and county-level data are available for some of these measures as described in Table 2 in For Those Just Getting Started - Standing on Common Ground: Data Sources, Definitions, Basic Calculations. In the focused
investigation, each team may choose to develop a working model or framework that separates direct contributing factors (e.g., risk behaviors like smoking during pregnancy or drug use during pregnancy) from indirect contributing factors (e.g., urban poverty, discrimination). Separation of these contributors will enable the team to focus recommendations for advocates who will communicate findings to a wide audience and mobilize community members to implement programs or amend policy.
The following sections address some examples from the Stage Two portion of the checklist, but do not provide an exhaustive list. It is expected as new research continues to emerge the list of both direct and indirect determinants of infant mortality will continue to change. Therefore, the remainder of the SIM toolkit will focus on highlighting examples from the three areas highlighted above, recommending SIM team development of analytic plans using various resources and providing case studies and examples of best practices.
Maternal Socio-demographic characteristics and behavioral risk factorsA variety of maternal socio-demographic characteristics, behavioral risk factors and pregnancy attributes influence the outcome of infant mortality by contributing to the delivery of a high-risk infant (e.g., low birth weight infant).
Table 1: Stages for Analyzing Infant Mortality Trends
Stage 1: Overview Investigation
Develop a SIM team
Establish time period, study population and baseline infant mortality rates
Review reporting changes
Consider causes of infant death and variation over time
Understand trends in adverse pregnancy outcomes and infant mortality rates
Examine when the deaths take place: maturity at birth and maturity-specific mortality
Stage 2: Focused Investigation
Based on pathways, explore changes in determinants and contributors to infant death
17

A Standardized Approach for Examining Infant Mortality
State Infant Mortality Toolkit
17
SIM Toolkit: A Framework for Infant Mortality Assessments – Stage 2 continued For example, these may include, but are not limited to, the following: • Socio-cultural issues (health equity, disparity, poverty,
access to care)
• Maternal characteristics (age, race/ethnicity, marital status, education, income, employment and socioeconomic status, nativity and immigrant status, and insurance status)
• Behavioral risks (tobacco/substance use, physical activity and nutrition)
• Pregnancy-related risks (maternal complications and infections, parity/gravidity, pregnancy spacing, prior pregnancy outcomes and abortion, and prior health status [chronic disease, mental health, etc.])
• Genetic (including paternal) and intergenerational risks
• Beliefs and attitudes (pregnancy intendedness)
Note: When examining infant mortality, a free resource with online maternal and infant health data is Peristats (www.marchofdimes.com/peristats). Peristats provides national, state, and local perinatal data by maternal characteristics (age, race/ethnicity, plurality, health insurance, poverty), behavioral risks (tobacco, alcohol and illicit drug use), and pregnancy-related risks (infections, obesity).
Adverse pregnancy outcomes vary considerably by maternal demographic characteristics. Examining maternal
demographic characteristics will provide the SIM team with basic contextual information for understanding the observed infant mortality rates. A starting point in the study of maternal risks contributing to infant mortality may focus on common variables found in vital records, such as maternal race/ethnicity, maternal age, plurality, nativity and highest level of educational attainment.
a. Race/ethnicity:Infant mortality rates vary considerably by race and ethnicity. To help understand contributors to these disparities, it is essential for states and localities to analyze infant mortality and related perinatal outcomes for each racial/ethnic group. While infant mortality rates have reached historic lows, racial and ethnic disparities have persisted. Infants born to non-Hispanic African American mothers are more than twice as likely as infants born to non-Hispanic white mothers to die in the first year of life (12.7 and 5.5 per 1,000 live births respectively, in 2008). Likewise, infant mortality was higher among American Indian/Alaska Native women compared with white mothers in 2008 (8.4 per 1,000). Disparities may be influenced by differential risk exposure, health status and access to health services.
Differences in fertility and maternal and infant health characteristics contribute to infant mortality disparities between Hispanic and non-Hispanic mothers. The infant mortality experience of the Hispanic population has been called an ‘epidemiological paradox’ because of generally
18

A Standardized Approach for Examining Infant Mortality
State Infant Mortality Toolkit
SIM Toolkit: A Framework for Infant Mortality Assessments – Stage 2 continued good birth outcomes despite a higher prevalence of socioeconomic and demographic risks. Additionally, Hispanics consist of heterogeneous subgroups that reflect many different cultures and experiences; therefore disparities in infant mortality may be masked within the Hispanic population. When possible, infant mortality among Hispanic subgroups should be investigated. In 2008, among Hispanic mothers, infant mortality rates were the highest for Puerto Rican mothers (7.3 per 1,000 live mothers) and the lowest for Central and South American mothers (4.8 per 1,000 live births).
Infant mortality data by race/ethnicity reflect race and ethnicity of the mother as indicated on the birth certificate. Infant mortality data described by race typically includes six categories: white, black or African American, Asian, American Indian or Alaska Native, Native Hawaiian or Pacific Islander and multiracial (exclusive of Hispanic ethnicity). For ethnicity, Hispanic is divided into a multitude of categories, but is typically reported as Mexican, Puerto Rican, Cuban, Central and South American, and other or unknown Hispanic.
It is important to note that race and ethnicity should not be interpreted as etiologic risk factors for infant mortality, and there should be no assumption of causality. Instead, race/ethnicity is considered to be a marker of or proxy for differential risk. Racial and ethnic populations may have different socioeconomic, environmental, and cultural factors that contribute to differences in infant mortality and place certain populations at higher or lower risk for infant death. Many socioeconomic and cultural factors are not found in vital records data and need to be gathered from other data sources, such as PRAMS or the Behavioral Risk Factor Surveillance System (BRFSS). See Table 2 in For Those Just Getting Started - Standing on Common Ground: Data Sources, Definitions, Basic Calculations for other possible sources.
There are limitations related to the classification of race and ethnicity in vital records. When race of the mother is missing from the birth certificate, National Center for Health Statistics (NCHS) imputes race using race of the father, if available, or by assigning the specific race of the mother on the preceding record with a known race of the mother. This occurs infrequently as race of the mother is missing on less than 2 percent of birth certificates. In addition, multiple races on birth certificates were reported by 30 states during 2008. To provide uniformity and comparability, NCHS bridges multiple-race responses to one race through a combination of races, Hispanic origin, sex and age indicated on the birth certificate. To better understand how this algorithm is calculated, please see the NCHS user guide by calendar year on the following website: www.cdc.gov/nchs/data_access/Vitalstatsonline.htm.
b. Maternal age:To examine infant deaths by maternal age, infant death certificates should be linked to a birth certificate. Most states do not report the age of the mother directly, and maternal age is calculated by NCHS using the difference between the date of birth of the mother and date of birth of the infant as reported on the birth certificate. When examining infant mortality rates by maternal age, it is helpful to initially categorize maternal age into five-year age groups: younger than 15, 15-19, 20-24, 25-29, 30-34, 35-40, and 40 and older. Infant mortality rates for teens are often further broken down into the maternal age groupings of 15-17 and 18-19 years.
Disparities in adverse perinatal outcomes are apparent by maternal age and generally follow a U-shaped distribution, with infant mortality rates highest at the extremes of maternal age. This relationship may be influenced by obstetric (e.g., parity), socioeconomic or biological factors. In 2008, infant mortality rates were highest for teen mothers (younger than age 20 years) and mothers of advanced maternal age (40-54 years) (9.6 and 8.1 per 1,000 live births, respectively).
19

A Standardized Approach for Examining Infant Mortality
State Infant Mortality Toolkit
19
SIM Toolkit: A Framework for Infant Mortality Assessments – Stage 2 continued Teen births are at higher risk for low birth weight and preterm birth than infants born to women 20 years and older. Teen mothers are less likely to receive adequate prenatal care than older mothers and face economic, social and educational disadvantages that may contribute to their higher risk of infant death. Moreover, biologic immaturity may contribute to adverse outcomes among the youngest teens. Infants born to the youngest mothers, <15 years of age, had the highest infant mortality rate of all age groups – 14.9 per 1,000 live births in 2008.
Women are delaying childbearing and electing to become mothers for the first time at a later reproductive age than in the past. From 1970 and 2006, the proportion of first births to women ages 35 years and older increased nearly eight-fold, from 1 out of 100 first births in 1970 to 1 out of 12 first births in 2006. Women of advanced maternal age have an increased risk for obstetric and maternal complications and spontaneous multiple births. Women 35 years and older are also more likely than younger women to receive infertility treatment, thus increasing their risk of multiples and adverse birth and pregnancy outcomes associated with infertility treatment.
c. Plurality:Multiple births (including twins, triplets and higher-order births) continue to represent a growing population of infants with a greater likelihood of being born smaller and earlier than singleton births. About 60 percent of twins, more than 90 percent of triplets, and virtually all quadruplets and higher-order multiples are born preterm.
Due to the increase in fertility management and increases in birth rates among women over 35 years of age, the ratio of multiple births is increasing. From 1998 to 2008, the multiple birth ratio in the United States increased 14 percent from 30.0 to 34.1 per 1,000 live births. Multiples are at increased risk for infant mortality. In 2007, the infant mortality rate for twins was nearly five times (28.4/1,000) the rate of singleton births (5.9/1,000) in the United States. Moreover, the rate for triplets was 11 times (64.7/1,000) and the rate for quadruplets (140.9/1,000) was 24 times higher than the infant mortality rate for singleton births (5.9/1,000).
Although multiple births accounted for 3 percent of live births in the United States in 2007, they represented 15 percent of all infant deaths. Because multiples have a higher risk profile than singletons, an infant mortality assessment needs to examine infant mortality by plurality. The singleton delivery rate is calculated as the number of singleton live births divided by all live births, multiplied by 100. All multiple birth calculations are shown as a ratio rather than a percent, and are multiplied by 1,000 instead of by 100, which is consistent with procedures used by NCHS.
d. Nativity:In general, better birth outcomes have been reported among mothers born outside of the 50 states and D.C. (foreign-born) than among mothers born in the 50 states and D.C. (U.S.-born), even after controlling for socio-demographic risk factors. In 2008, the infant mortality rate for U.S.-born mothers was higher than foreign-born mothers (7.0 and 5.1 per 1,000 live births, respectively). Among racial and ethnic groups, only foreign-born Cuban and Puerto Rican mothers had higher infant mortality rates than their U.S.-born counterparts. Some explanations suggested for infant mortality differences by nativity include:• The healthy migrant effect, whereby women who
move to the United States are healthier on average than those who do not migrate
• Social support and ties within the immigrant populations once they arrive in the United States may buffer the adverse effects of low socioeconomic status
• Risky behaviors such as tobacco use are lower among foreign-born mothers
For these reasons, differences in infant mortality by nativity status should be examined, and when the data are sufficient, examined in conjunction with race/ethnicity. Stratification by nativity and race/ethnicity may help to reveal differences in infant mortality rates among the study population. Education and socioeconomic characteristics also may play a role in infant mortality differences by nativity. Long-term exposures to racism, discrimination, and stress may be experienced by African Americans, Asians, American Indians, and Hispanics and contribute to higher infant mortality rates among U.S.-born mothers of minority race and ethnicity.
20

A Standardized Approach for Examining Infant Mortality
State Infant Mortality Toolkit
SIM Toolkit: A Framework for Infant Mortality Assessments – Stage 2 continued e. Maternal Education:Low educational attainment is associated with poor pregnancy outcomes. Infant mortality rates are higher for mothers with fewer years of education. Data collected on educational attainment is not considered comparable between the 1989 and 2003 revisions of the U.S. birth certificate. Not all states have adopted the 2003 revision of the U.S. birth certificate, and among those that have, adoption occurred at different times. Therefore, when investigating infant mortality by education, it is important to know which revision your state is using, and if the 2003 revision is being used, it is important to know when it was implemented by your state. Twenty seven states – California, Colorado, Delaware, Florida, Georgia, Idaho, Indiana, Iowa, Kansas, Kentucky, Michigan, Montana, Nebraska, New Hampshire, New Mexico, New York (including New York City), North Dakota, Ohio, Oregon, Pennsylvania, South Carolina, South Dakota, Tennessee, Texas, Vermont, Washington and Wyoming – have implemented the 2003 revision of the U.S. birth certificate as of January 2008. NCHS expects all jurisdictions to begin using the 2003 standard birth certificates by 2014 (www.naphsis.org/about/Documents/NAPHSIS_Timeliness%20Report_Digital%20%281%29.pdf). Among the 22 states that implemented the 2003 revision of the U.S. birth certificate by January 2007, mothers who had less than a high school diploma had a higher infant mortality rate than mothers who had a bachelor’s degree or higher (7.7 and 3.7 per 1,000 live births, respectively).
Infant mortality rates reported on data from the 2003 revision of the U.S. birth certificate generally include the following education categories: less than high school diploma, high school diploma, some college or technical school, and bachelor’s degree or higher. Maternal education categories based on the 1989 revision are often grouped by years of education and include: less than 12 years, 12 years, 13-15 years, and more than 16 years of education.
Educational attainment is related to other maternal characteristics associated with increased infant mortality, and so differences in infant mortality by educational attainment are a reflection of these related characteristics. For example, women with less education tend to have lower family income and women who have not completed high school include teen mothers who have an increased risk for experiencing an infant death.
f. Behavioral Risks:Overwhelming evidence indicates that known perinatal risk factors such as substance use (tobacco, alcohol, and other drugs), inadequate nutrition, obesity and stress are best managed if high-quality medical care begins long before a woman becomes pregnant. While this task is not simple, because much of the needed data are not routinely or reliably
collected, data at the state (all U.S. states), and select county and local levels are available for women of reproductive age from the Behavioral Risk Factor Surveillance System (BRFSS). There is also data, for selected states, about women who recently experienced a live birth available through the Pregnancy Risk Assessment and Monitoring System (PRAMS).
g. Pregnancy-Related Risks:Pregnancy-related risks include complications and conditions that occur before and during pregnancy. Health problems before pregnancy can adversely affect pregnancy outcomes and include chronic conditions such as asthma, diabetes, hypertension, and obesity, as well as mental health conditions (i.e. depression). For example, women with high blood pressure prior to becoming pregnant are at risk for developing preeclampsia and placental abruptions, increasing the likelihood an infant will be born low birth weight and/or preterm. Placental conditions, preeclampsia, and intrauterine growth restriction are a few examples of health problems that develop during pregnancy, which increases the likelihood of delivery of a high-risk infant. Additionally, infections left untreated during pregnancy (i.e., Group B Strep, influenza and sexually transmitted infections) can lead to pregnancy complications and infant death.
Obstetrical experiences, such as parity, gravidity, increased inter-pregnancy intervals and prior pregnancy outcomes, are associated with maternal and infant health. Outcomes of previous pregnancies may be repeated in subsequent pregnancies; similarly, conditions present in prior pregnancies may persist into subsequent pregnancies. A history of spontaneous preterm birth is one of the strongest risk factors for a preterm birth in the next pregnancy. Pregnancy-related risks, including health problems that may occur before and during pregnancy and reproductive history, may provide valuable information on contributors to infant mortality, enabling the team to identify appropriate opportunities for intervention.
PLAN FOR ANALYSISRecommendations for developing an analysis plan include assessing the available surveillance data for your geographic region and determining your population of interest. Obtain the data for each specific subgroup and measure the prevalence of each maternal or pregnancy-related attribute. Then focus efforts on attributes that exhibit the highest rates or rates significantly different from chosen reference groups. For example, if infant deaths are occurring predominantly in women age 35 years and older who have private insurance, the team may want to examine data available from fertility clinics in the region or information available on the birth certificate related to assisted reproductive technologies, as this may contribute to infant mortality in your area.
21

A Standardized Approach for Examining Infant Mortality
State Infant Mortality Toolkit
21
SIM Toolkit: A Framework for Infant Mortality Assessments – Stage 2 continued The team may determine that the most appropriate way to collect information related to maternal risks is by using qualitative methodologies. For example, the team may implement focus groups with postpartum women in an urban health department to better understand the effect of discrimination on receipt of care, or may interview providers to assess how women access ancillary mental health services during pregnancy. The team may also determine that data are unavailable to answer questions related to infant mortality and may make recommendations to implement new systems that support a better understanding of infant death such as a Fetal and Infant Mortality Review. Note: It is strongly recommended that the team also examine data reporting and reliability for selected measures if possible.
Attributes of the social and physical environment
Attributes of the physical and social environments of populations may influence directly or indirectly (e.g., via stress) the occurrence of high-risk deliveries, as measured by birth weight and gestational age, maturity-specific mortality rates (via access and availability of health services), and selected causes of infant injury and morbidities. These attributes include:
a. The physical environment: toxins, pollutants and contaminants; housing; environmental hazards; and disasters
b. The social environment: family; community and social support networks; racism; poverty; and violence
Although indirect contributors or contextual factors, such as health equity, economic disparity, social determinants of health, and the built environment (including access to food, recreation, and health care services) impact infant mortality, these factors are often difficult to measure using existing data sources. Indices and scales exist to measure these complex concepts, but they often require additional data sources. However, the SIM team can measure the impact on infant mortality rates of policies implemented to address these issues on infant mortality rates. For example, changes in Medicaid eligibility criteria can be assessed to determine the affect on health equity among pregnant women. Environmental policies also can be used to measure impact on adverse birth outcomes, including clean air legislation or cigarette taxes on preterm birth rates.
22

A Standardized Approach for Examining Infant Mortality
State Infant Mortality Toolkit
SIM Toolkit: A Framework for Infant Mortality Assessments – Stage 2 continued PLAN FOR ANALYSISRecommendations for developing an analysis plan related to social determinants includes: examining the social determinants of health in your region, state, locality, community, or tribe, comparing racial and ethnic groups in your setting to the nation, or other comparable; identifying other measures of health equity that may impact programs or policies affecting infant mortality rates in your area (for example, does access to the Special Supplemental Nutrition Program for Women, Infants, and Children (WIC) services affect how and where families obtain healthy and nutritious foods geographically?); and reviewing the prevalence measures of social determinants of health and the programs and policies serving vulnerable populations. Developing questions from these measures about access, effectiveness, and efficiency is one strategy to begin measuring the associations between the social environment and infant mortality.
Recommendations for developing an analysis plan related to the physical environment and exposures include reviewing the Agency for Toxic Substances and Disease Registry (ATSDR) website, specifically the Division of Health Assessment and Consultation, where there is information available on previous community assessments and how to conduct an assessment in your community (www.atsdr.cdc.gov/HAC/PHA/index.asp). For more information on community indicators and tools to measure prevention, including the built environment, see the Community Health and Health Equity Program (www.cdc.gov/nccdphp/dach/chhep), Data Sources for an Environmental Quality Index: Availability, Quality, and Utility (http://ajph.aphapublications.org/doi/full/10.2105/AJPH.2011.300184), and The Community Guide (www.thecommunityguide.org/index.html).
Systems of Care (Health service attributes and utilization)Changes in health service attributes in the population also may influence the occurrence of high risk deliveries, maturity specific mortality, and selective causes of death. Health service attributes include:
a. Types of systems/services: preconception care and family planning; prenatal/obstetrical care; perinatal care and hospital levels; pediatric care; public health, prevention, immunization, and ancillary services; and assisted reproductive technology, cesarean delivery, and other medical procedures
b. Attributes of systems and services: quality; content; organization and functioning; access and availability; and work force training
c. Utilization of systems and services
Health care systems directly impact both the access to and receipt of health care prior to, during, and following pregnancy
and delivery. Although assessment of the health care systems is complex, understanding how it contributes to infant mortality is important in finalizing a plan to address infant death. Assessing how the regionalized system is structured within your state, county, urban area or tribal region is paramount to understanding where high-risk infants are delivered in your area and whether they are delivered at risk-appropriate facilities. Having a better understanding of the exiting health care systems will allow for an assessment of the neonatal transport in your area, whether maternal transport is an option, and the types of services available at each birthing facility. Additionally, understanding the facility designation will allow for assessment of staffing in your area and for the team to make determinations on issues related to provider shortages.
PLAN FOR ANALYSISRecommendations for developing an analytic plan include examining your area hospital systems; the types of services provided, how clinics and hospitals define those services (i.e., from program and service definitions to Certificate of Need legislation); the percentage of high-risk women cared for at those facilities, the percentage of infants delivered at those facilities; and the quality of the care and services provided to those women and infants. These measures together with the attributes of systems of care describe health service in general and its contributing effect on infant mortality. For example, understanding delivery volume in a level II hospital and the time to neonatal transport may explain a portion of the underlying contribution to infant mortality in your area. Understanding how risk-appropriate care is defined in your region, state, locality, community or tribe is integral to understanding your infant mortality rate. Note: As was recommended previously, qualitative methodologies may be useful for collecting information from health care providers and women who have delivered.
23