trends in real estate - greer advisors
TRANSCRIPT

Greer Advisors, LLC
Trends in
Real Estate
Everett (Allen) Greer
Greer Advisors, LLC
August 19, 2013 – Costa Mesa , CA - KOR

2 Greer Advisors, LLC
Goals of Presentation
Market Drivers
Economic Trends
Capital Markets for Real Estate
Rents and Vacancy Trends
Sale Volume and Price Trends
Financial Regulations (Dodd-Frank)
Outlook & Forecast

3 Greer Advisors, LLC
Market Drivers

4 Greer Advisors, LLC
Market Drivers
Non-Res. Supply Growth was Very Limited Growth
Most Demand ties to Jobs, which is tied to GDP
Office – FIRE Employment, Portion of Service Employment Retail – Household Formations, Income Growth Industrial – Manufacturing vs Distribution Multifamily – Households Hotel – Corporate Travel – Office Employment
Jobs & Retail Sales - Drive Supply & Demand!!!
Supply / Demand – Not as bad as early 90’s, Better than 2008
Financing – Is the Most Important Fundamental
Leverage, Rate, Term, Recourse
5 Greer Advisors, LLC
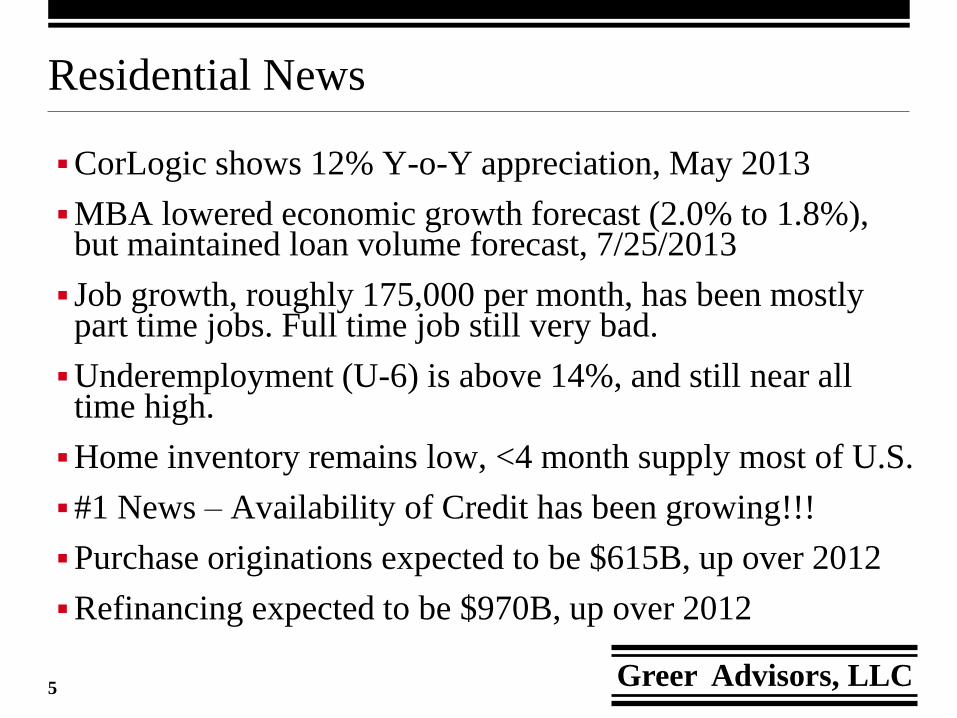
Residential News
CorLogic shows 12% Y-o-Y appreciation, May 2013
MBA lowered economic growth forecast (2.0% to 1.8%), but maintained loan volume forecast, 7/25/2013
Job growth, roughly 175,000 per month, has been mostly part time jobs. Full time job still very bad.
Underemployment (U-6) is above 14%, and still near all time high.
Home inventory remains low, <4 month supply most of U.S.
#1 News – Availability of Credit has been growing!!!
Purchase originations expected to be $615B, up over 2012
Refinancing expected to be $970B, up over 2012
6 Greer Advisors, LLC
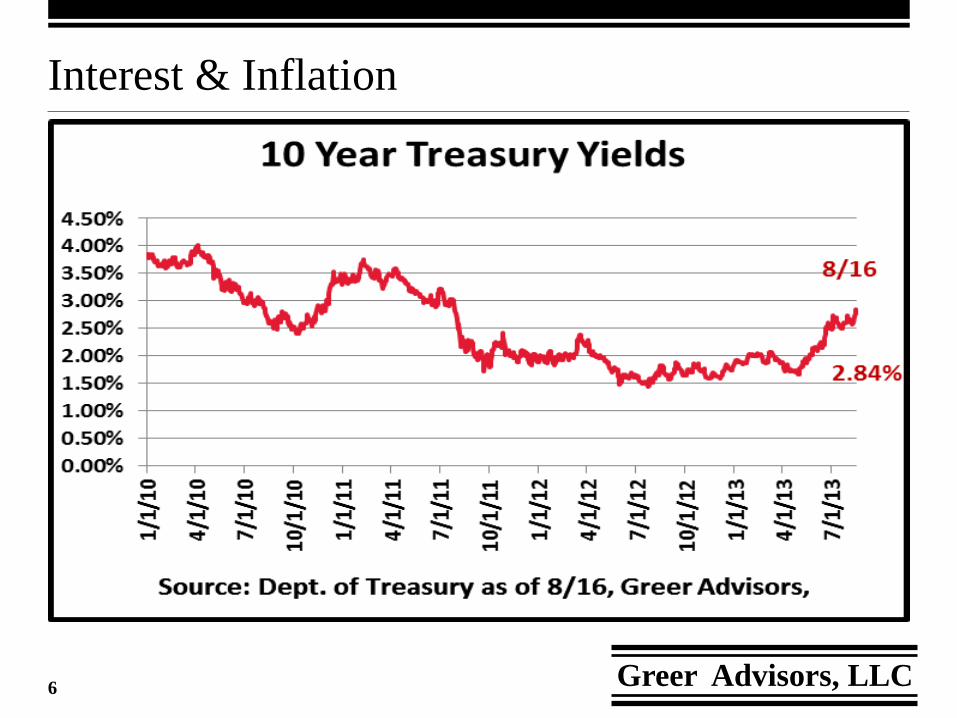
Interest & Inflation

7 Greer Advisors, LLC
Interest & Inflation

8 Greer Advisors, LLC
Economy – Consumer Confidence & Sales

9 Greer Advisors, LLC
Economy – Employment

10 Greer Advisors, LLC
Corp Bond Spread – Risk Indicator

11 Greer Advisors, LLC
Economy
Consumer Confidence Finally Up 80.3 (July Conf. Board)
Unemployment Improving 7.4% (July – BLS)
Potential Sovereign Defaults - “Negotiating” (PIGS)
Event Threats Growing – run on guns, ammo, EMP threat
Liquidity, Leverage, Interest (for non-AAA Debt) – Poor
Retail Sales are Growing, the Rest is Mixed
Consumer Side
Investment Banks
Capital IQ and Deal Logic show LBO’s☺ /M&A on the rise
Record Profits – GS near 1,000 batting average every day since the Crisis Started
IB’s record profits – cost of taxpayer Leveraged Buy Out

12 Greer Advisors, LLC
Real Estate Capital Markets

13 Greer Advisors, LLC
CMBS Delinquency – Coming Down

14 Greer Advisors, LLC
CMBS Issuance – Still Off, but better

15 Greer Advisors, LLC
CMBS / CMBx Pricing Model – Break Even
Tranche Yield Suboord
AAA 3.32% 29.76%
AJ 4.19% 12.70%
AA 5.81% 10.63%
A 10.24% 8.00%
BBB 27.91% 4.72%
BBB- 29.25% 3.68%
BB 102.95% 2.69%
Unrated 177.00% 0.00%
Greer CMBS / CMBx Yield RateTM
10.43%
75.00%
15.07%
33.57%
17.06%
2.07%
2.63%
3.28%
1.04%
0.99%
2.69%
Contribution
to Total
2.33%
0.71%
0.12%
0.27%
0.92%
0.30%
1.02%
Notes: ① The table is somewhat complicated, as evidenced by the
numerous footnotes. Several conclusions can be drawn. 1) If the
'Implied Overall Debt Yield' is greater than loan rates in the
marketplace, the CMBS market CAN NOT recover because the
required bond yields are too high to make debt affordable to
borrowers. 2) When the spread between AAA and BB tranches is
above 500 bps (now at 9,963 bps), the market can't recover
because of risk aversion for lower-rated tranches. As a point of
reference, January '07 AAA-BB CMBS spreads were around 65 bps.
Lastly, the yields for each tranche provide tremendous insight into
the pricing of risk premiums for each layer in the capital stack.
② MarkitTM Data and Calculations based on close of 8/19. Swap
(10Yr) as of 8/16.
③ Coupon and Price data were from MarkitTM for AAA Senior
through BB bonds. MarkitTM data was used as part of the
calculations by Greer Advisors, LLC to determine Spreads.
Subordination levels were from MarkitTM.
④ Profit / arbitrage opportunity for the issuer was ignored.
⑤ The yield spread for "unrated" classes were based on (BBB-
yield minus BB yield) times 1.0, round to the nearest bp. Class-A
property equity yield was assumed equal to the BBB- (last
investment-grade piece) yield rounded to the nearest 100 bp. Class-
B property equity yield was assumed equal to the BB yield, rounded
to 100 bps.
Class-A Equity Yield | Total Yield 29.00%
Class-B Equity Yield | Total Yield 103.00%
Implied Overall Debt Yield
Loan to Value Ratio
4.76%
Weight of
Debt
70.24%
100.00%

16 Greer Advisors, LLC
REIT Bond Issuance – Never Better

17 Greer Advisors, LLC
REIT Market Capitalization – New Records
18 Greer Advisors, LLC
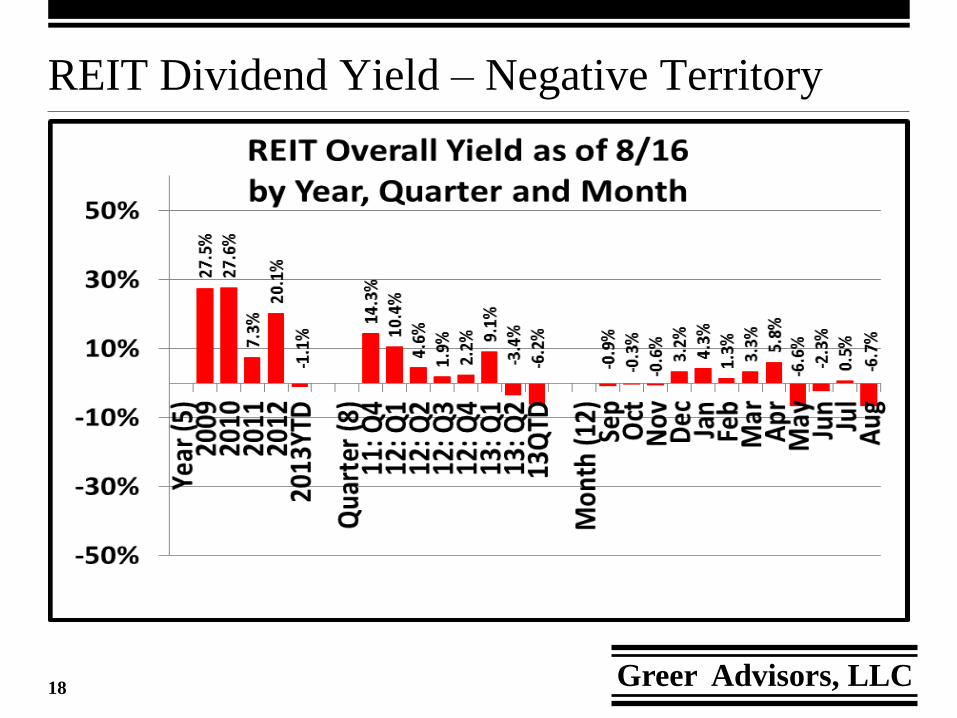
REIT Dividend Yield – Negative Territory

19 Greer Advisors, LLC
REIT Dividend Yield - Volatility

20 Greer Advisors, LLC
Market Performance

21 Greer Advisors, LLC
National Distressed Sale Ratio
Source: Real Capital Analytics, |
Greer Advisors, LLC

22 Greer Advisors, LLC
National Price per SF Trends
Source: Real Capital Analytics, |Greer Advisors, LLC
Note: Apt price based on 1,000 SF Apt.

23 Greer Advisors, LLC
Financial Regulations

24 Greer Advisors, LLC
Financial Regulations
16 Titles – See Summary on Wikipedia – Post TARP☺
243 Rules to be created (reportedly over half not done) 67 Studies required (most are not done) 22 New Periodic Reports
Restructure of Regulators, elimination of OTS
Financial Stability Oversight Council (New) Office of Financial Research (New)
Keys for Real Estate:
Major for Residential, Minor for Commercial Rating Agency Reform Securitization Reform (nominal change due to QIB clawbacks) Derivatives – minimal change thus far due to “netting” Troubled Asset Relief Program
Dodd-Frank Wall Street Reform & Consumer Protection Act

25 Greer Advisors, LLC
Outlook & Forecast

26 Greer Advisors, LLC
Conclusions
Financing Drives Value – Financing is the new “Fundamental”
Rates (Debt / Capitalization / Yield) are at all-time lows
Rents / Vacancies Remain better than early 1990s
Price Growth has Been due to Cap Rate Decline more than Rent
SBA will remain Top Source for Small Properties, especially with High Leverage
MBS – Very Very Slow Return. Need New Business Model
CASH WILL REMAIN KING!

27 Greer Advisors, LLC
Greer’s Recovery Signs – Prereq’s to Recovery
√CDS Exposure under $25 Trillion (i.e. under 50% of peak)
Stable or Decline in CMBx Yield Spreads for 6 weeks
Re-emergence of CMBS market New CMBS Market will include: Issuer Keeps 1-5% 1st-loss piece AAA Subordination near 30%.... AAA is 70%, not 90% of issue
√ REIT Market Capitalization (Total Value) Stabilizes or Increases for 6 months
Consumer Confidence Rises and Stays Above 70 for 6 months As of July 2013 index at 80.3 (1985=100) Almost….
Risk Curve (AAA Sr. vs BB) flattens to under 500 bps. As of 8/19/13, CMBx spread has remained near 10,000 bps.

28 Greer Advisors, LLC
Greer’s 3-Year Forecast as of August 19, 2013
Barbell Modest Growth or Global Recession
Global Economy Heals or Not
Cap Rates will Remain Where They Stand
Trophy Class A will remain low until Flight to Quality Stops Class B/C will maintain Risk Premium ‘til Future Gets Brighter
Margins (to 10 Yr Treasuries or LIBOR) will rise and settle at 200-250±50 bps over 10 year Treasuries, but might over-correct in the short run
Values have recovered slightly, and will continue
Individual Market Performance will continue to vary widely.
10-30% difference in Top vs Bottom
Change Creates Opportunities – Build Businesses
SBA remains very Active

29 Greer Advisors, LLC
Quote of the Day
“…prediction is very difficult, especially when it’s about the future…” NY Yankees #8, Yogi Bera
Niels Bohr Nobel Laureate, 1922
Atomic Structure /
Quantum Mechanics

30 Greer Advisors, LLC
Questions / Answers
Greer Advisors, LLC
www.GreerAdvisors.com