quadrant real estate advisors llc u.s. economic &...
TRANSCRIPT

Quadrant Real Estate Advisors LLC
U.S. Economic & Market
Commentary2nd Quarter 2017
www.quadrantrea.com
Atlanta, Georgia London, England
Kurt Wright, CFA Chief Executive Officer
(770) 752‐6713 [email protected]
U.S. ECONOMIC & MARKET COMMENTARY 2nd Quarter 2017
Quadrant Real Estate Advisors LLC 1 www.quadrantrea.com
Table of Contents
Executive Summary…………………………………………………………………………………………………………………… ....2
State of the U.S. Economy………………………………………………………………………………………………………….….3
Commercial Real Estate Market Relative Value….………………………………………………………………………….6
Commercial Real Estate Market Quadrants………….…………………………………………………………………….….7
Public Debt Market Review…………………………………………………………………………………………………………...8
Public Equity Market Review……………………………………………………………………………………………………….10
Private Debt Market Review……………………………………………………………………….………………………………..12
Private Equity Market Review……………………………………….……………………………………………………………..15
Property Sector Updates & Outlooks……..……………………………………………………………………………………..18
Contacts & Important Disclosures.………………………………………………………………………………………………..28
About Quadrant Real Estate Advisors
Quadrant Real Estate Advisors LLC (“Quadrant”) is a United States SEC registered investment adviser
and Australian Securities and Investments Commission (ASIC) Foreign Registered Corporation (ABN
39 123 863 963). QREA Europe LLP ("QREA") is a subsidiary of Quadrant. QREA Europe LLP
(registration number 610613) is authorized and regulated by the Financial Conduct Authority.
Quadrant has approximately $9.0 billion of commercial and multifamily real estate investments
under management on behalf of institutional investors. Clients include insurance companies,
pension funds, sovereign wealth management funds, and high net worth investors.
Since 1993 Quadrant’s senior management has worked together as a team providing the firm’s
clients with access to both privately placed and publicly traded U.S. commercial real estate debt and
equity investments through commingled funds and single client accounts. In addition to experience,
senior management controls 100% of the firm, thereby providing true alignment of interests and
accountability.
U.S. ECONOMIC & MARKET COMMENTARY 2nd Quarter 2017
Quadrant Real Estate Advisors LLC 2 www.quadrantrea.com
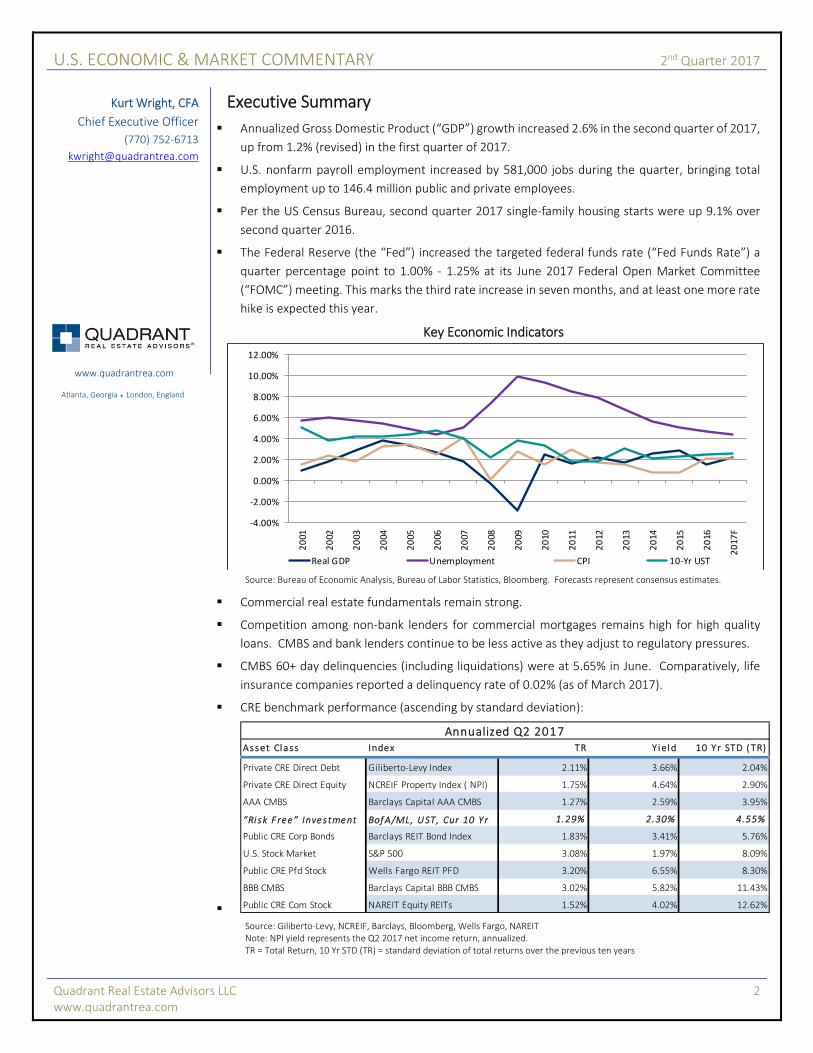
Executive Summary
Annualized Gross Domestic Product (“GDP”) growth increased 2.6% in the second quarter of 2017,
up from 1.2% (revised) in the first quarter of 2017.
U.S. nonfarm payroll employment increased by 581,000 jobs during the quarter, bringing total
employment up to 146.4 million public and private employees.
Per the US Census Bureau, second quarter 2017 single‐family housing starts were up 9.1% over
second quarter 2016.
The Federal Reserve (the “Fed”) increased the targeted federal funds rate (“Fed Funds Rate”) a
quarter percentage point to 1.00% ‐ 1.25% at its June 2017 Federal Open Market Committee
(“FOMC”) meeting. This marks the third rate increase in seven months, and at least one more rate
hike is expected this year.
Key Economic Indicators
Source: Bureau of Economic Analysis, Bureau of Labor Statistics, Bloomberg. Forecasts represent consensus estimates.
Commercial real estate fundamentals remain strong.
Competition among non‐bank lenders for commercial mortgages remains high for high quality
loans. CMBS and bank lenders continue to be less active as they adjust to regulatory pressures.
CMBS 60+ day delinquencies (including liquidations) were at 5.65% in June. Comparatively, life
insurance companies reported a delinquency rate of 0.02% (as of March 2017).
CRE benchmark performance (ascending by standard deviation):
Source: Giliberto‐Levy, NCREIF, Barclays, Bloomberg, Wells Fargo, NAREIT Note: NPI yield represents the Q2 2017 net income return, annualized. TR = Total Return, 10 Yr STD (TR) = standard deviation of total returns over the previous ten years
‐4.00%
‐2.00%
0.00%
2.00%
4.00%
6.00%
8.00%
10.00%
12.00%
2001
2002
2003
2004
2005
2006
2007
2008
2009
2010
2011
2012
2013
2014
2015
2016
2017
F
Real GDP Unemployment CPI 10‐Yr UST
Asset Class Index TR Y ield 10 Yr STD (TR)
Private CRE Direct Debt Giliberto‐Levy Index 2.11% 3.66% 2.04%
Private CRE Direct Equity NCREIF Property Index ( NPI) 1.75% 4.64% 2.90%
AAA CMBS Barclays Capital AAA CMBS 1.27% 2.59% 3.95%
“Ri sk F ree” Investment BofA/ML, UST, Cur 10 Yr 1.29% 2.30% 4.55%
Public CRE Corp Bonds Barclays REIT Bond Index 1.83% 3.41% 5.76%
U.S. Stock Market S&P 500 3.08% 1.97% 8.09%
Public CRE Pfd Stock Wells Fargo REIT PFD 3.20% 6.55% 8.30%
BBB CMBS Barclays Capital BBB CMBS 3.02% 5.82% 11.43%
Public CRE Com Stock NAREIT Equity REITs 1.52% 4.02% 12.62%
Annualized Q2 2017
Kurt Wright, CFA
Chief Executive Officer
(770) 752‐6713
www.quadrantrea.com
Atlanta, Georgia London, England
U.S. ECONOMIC & MARKET COMMENTARY 2nd Quarter 2017
Quadrant Real Estate Advisors LLC 3 www.quadrantrea.com
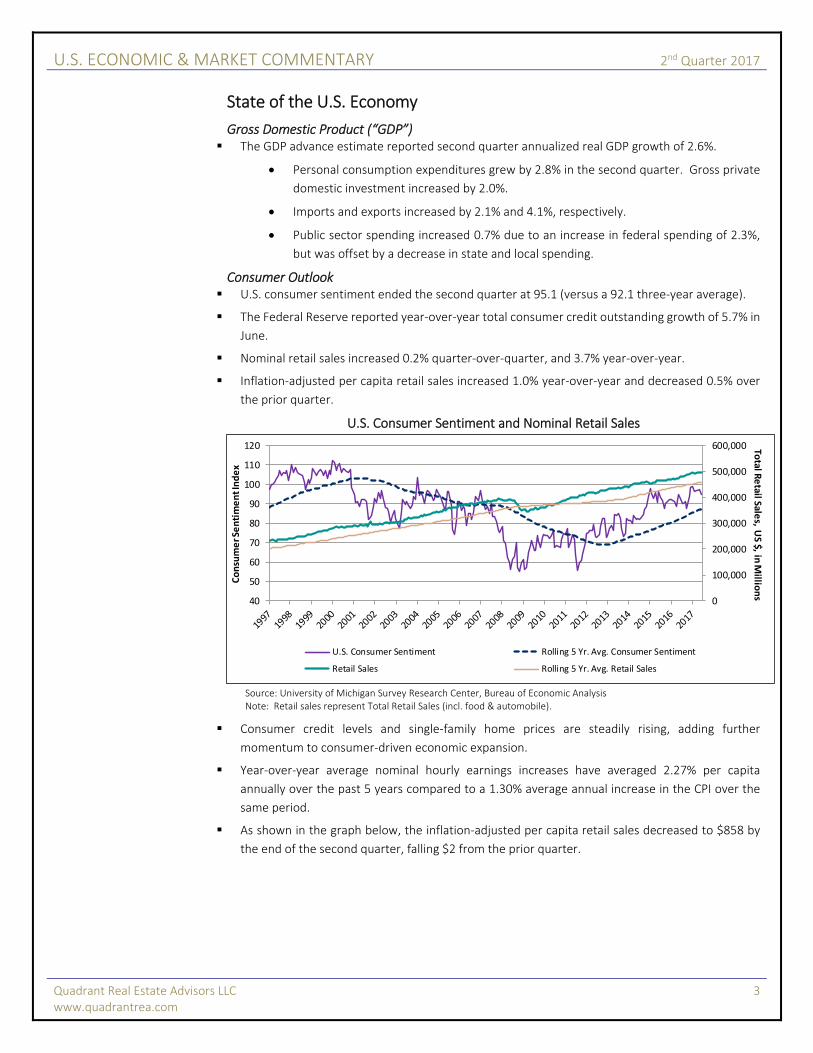
State of the U.S. Economy
Gross Domestic Product (“GDP”) The GDP advance estimate reported second quarter annualized real GDP growth of 2.6%.
Personal consumption expenditures grew by 2.8% in the second quarter. Gross private
domestic investment increased by 2.0%.
Imports and exports increased by 2.1% and 4.1%, respectively.
Public sector spending increased 0.7% due to an increase in federal spending of 2.3%,
but was offset by a decrease in state and local spending.
Consumer Outlook U.S. consumer sentiment ended the second quarter at 95.1 (versus a 92.1 three‐year average).
The Federal Reserve reported year‐over‐year total consumer credit outstanding growth of 5.7% in
June.
Nominal retail sales increased 0.2% quarter‐over‐quarter, and 3.7% year‐over‐year.
Inflation‐adjusted per capita retail sales increased 1.0% year‐over‐year and decreased 0.5% over
the prior quarter.
U.S. Consumer Sentiment and Nominal Retail Sales
Source: University of Michigan Survey Research Center, Bureau of Economic Analysis Note: Retail sales represent Total Retail Sales (incl. food & automobile).
Consumer credit levels and single‐family home prices are steadily rising, adding further
momentum to consumer‐driven economic expansion.
Year‐over‐year average nominal hourly earnings increases have averaged 2.27% per capita
annually over the past 5 years compared to a 1.30% average annual increase in the CPI over the
same period.
As shown in the graph below, the inflation‐adjusted per capita retail sales decreased to $858 by
the end of the second quarter, falling $2 from the prior quarter.
0
100,000
200,000
300,000
400,000
500,000
600,000
40
50
60
70
80
90
100
110
120 Total R
etail Sale
s, US $, in
Millio
ns
Consumer Sentiment Index
U.S. Consumer Sentiment Rolling 5 Yr. Avg. Consumer Sentiment
Retail Sales Rolling 5 Yr. Avg. Retail Sales
U.S. ECONOMIC & MARKET COMMENTARY 2nd Quarter 2017
Quadrant Real Estate Advisors LLC 4 www.quadrantrea.com
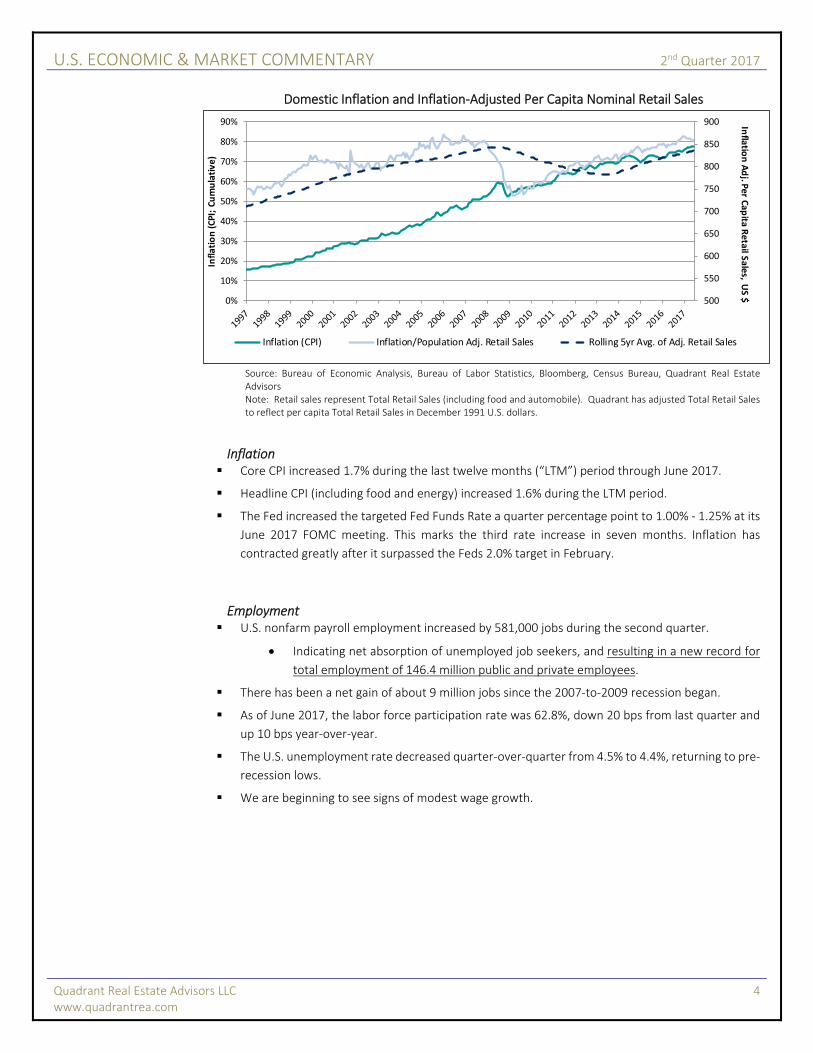
Domestic Inflation and Inflation‐Adjusted Per Capita Nominal Retail Sales
Source: Bureau of Economic Analysis, Bureau of Labor Statistics, Bloomberg, Census Bureau, Quadrant Real Estate Advisors Note: Retail sales represent Total Retail Sales (including food and automobile). Quadrant has adjusted Total Retail Sales to reflect per capita Total Retail Sales in December 1991 U.S. dollars.
Inflation Core CPI increased 1.7% during the last twelve months (“LTM”) period through June 2017.
Headline CPI (including food and energy) increased 1.6% during the LTM period.
The Fed increased the targeted Fed Funds Rate a quarter percentage point to 1.00% ‐ 1.25% at its
June 2017 FOMC meeting. This marks the third rate increase in seven months. Inflation has
contracted greatly after it surpassed the Feds 2.0% target in February.
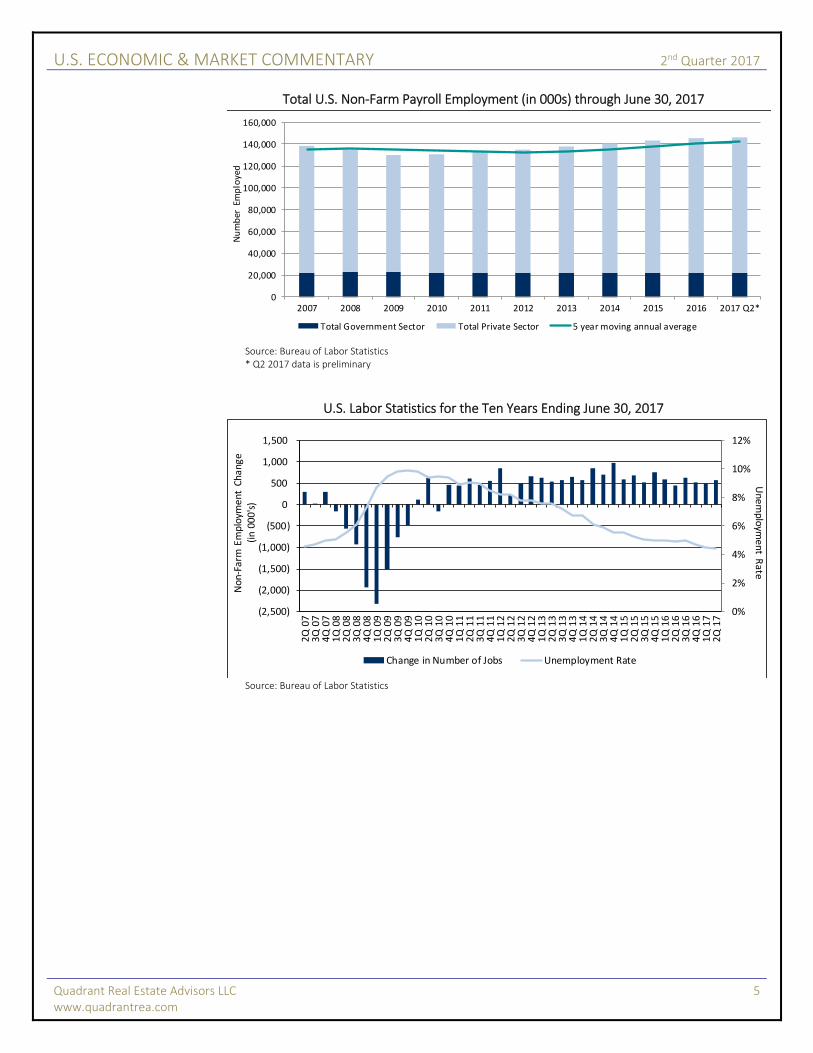
Employment U.S. nonfarm payroll employment increased by 581,000 jobs during the second quarter.
Indicating net absorption of unemployed job seekers, and resulting in a new record for
total employment of 146.4 million public and private employees.
There has been a net gain of about 9 million jobs since the 2007‐to‐2009 recession began.
As of June 2017, the labor force participation rate was 62.8%, down 20 bps from last quarter and
up 10 bps year‐over‐year.
The U.S. unemployment rate decreased quarter‐over‐quarter from 4.5% to 4.4%, returning to pre‐
recession lows.
We are beginning to see signs of modest wage growth.
500
550
600
650
700
750
800
850
900
0%
10%
20%
30%
40%
50%
60%
70%
80%
90% Infla
tion Adj. P
er Cap
ita Retail S
ales, U
S $
Infla
tion (C
PI; Cu
mulative)
Inflation (CPI) Inflation/Population Adj. Retail Sales Rolling 5yr Avg. of Adj. Retail Sales
U.S. ECONOMIC & MARKET COMMENTARY 2nd Quarter 2017
Quadrant Real Estate Advisors LLC 5 www.quadrantrea.com
Total U.S. Non‐Farm Payroll Employment (in 000s) through June 30, 2017
Source: Bureau of Labor Statistics * Q2 2017 data is preliminary
U.S. Labor Statistics for the Ten Years Ending June 30, 2017
Source: Bureau of Labor Statistics
0
20,000
40,000
60,000
80,000
100,000
120,000
140,000
160,000
2007 2008 2009 2010 2011 2012 2013 2014 2015 2016 2017 Q2*
Number Employed
Total Government Sector Total Private Sector 5 year moving annual average
0%
2%
4%
6%
8%
10%
12%
(2,500)
(2,000)
(1,500)
(1,000)
(500)
0
500
1,000
1,500
2Q 07
3Q 07
4Q 07
1Q 08
2Q 08
3Q 08
4Q 08
1Q 09
2Q 09
3Q 09
4Q 09
1Q 10
2Q 10
3Q 10
4Q 10
1Q 11
2Q 11
3Q 11
4Q 11
1Q 12
2Q 12
3Q 12
4Q 12
1Q 13
2Q 13
3Q 13
4Q 13
1Q 14
2Q 14
3Q 14
4Q 14
1Q 15
2Q 15
3Q 15
4Q 15
1Q 16
2Q 16
3Q 16
4Q 16
1Q 17
2Q 17
Unemplo
yment R
ate
Non‐Farm
Employm
ent Chang
e
(in 00
0's)
Change in Number of Jobs Unemployment Rate
U.S. ECONOMIC & MARKET COMMENTARY 2nd Quarter 2017
Quadrant Real Estate Advisors LLC 6 www.quadrantrea.com
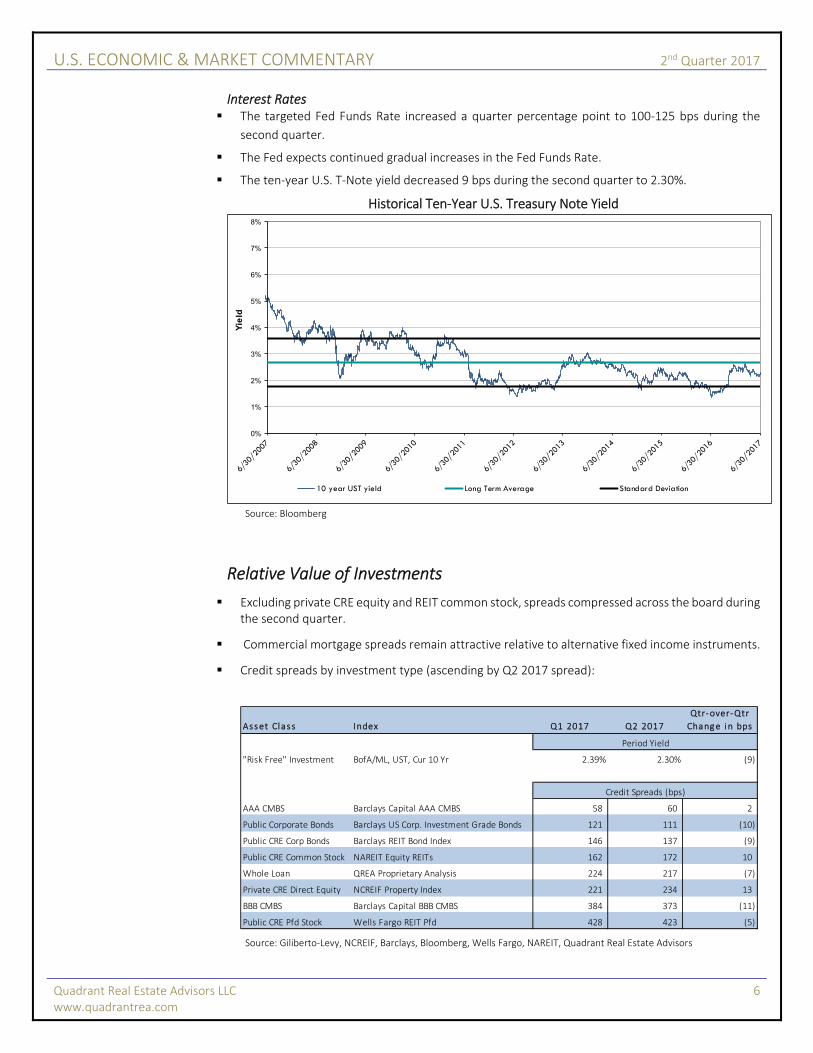
Interest Rates The targeted Fed Funds Rate increased a quarter percentage point to 100‐125 bps during the
second quarter.
The Fed expects continued gradual increases in the Fed Funds Rate.
The ten‐year U.S. T‐Note yield decreased 9 bps during the second quarter to 2.30%.
Historical Ten‐Year U.S. Treasury Note Yield
Source: Bloomberg
Relative Value of Investments
Excluding private CRE equity and REIT common stock, spreads compressed across the board during the second quarter.
Commercial mortgage spreads remain attractive relative to alternative fixed income instruments.
Credit spreads by investment type (ascending by Q2 2017 spread):
Source: Giliberto‐Levy, NCREIF, Barclays, Bloomberg, Wells Fargo, NAREIT, Quadrant Real Estate Advisors
0%
1%
2%
3%
4%
5%
6%
7%
8%
Yield
10 year UST yield Long Term Average Standard Deviation
Asset Class Index Q1 2017 Q2 2017
Qtr‐over‐Qtr
Change in bps
Period Yield
"Risk Free" Investment BofA/ML, UST, Cur 10 Yr 2.39% 2.30% (9)
Credit Spreads (bps)
AAA CMBS Barclays Capital AAA CMBS 58 60 2
Public Corporate Bonds Barclays US Corp. Investment Grade Bonds 121 111 (10)
Public CRE Corp Bonds Barclays REIT Bond Index 146 137 (9)
Public CRE Common Stock NAREIT Equity REITs 162 172 10
Whole Loan QREA Proprietary Analysis 224 217 (7)
Private CRE Direct Equity NCREIF Property Index 221 234 13
BBB CMBS Barclays Capital BBB CMBS 384 373 (11)
Public CRE Pfd Stock Wells Fargo REIT Pfd 428 423 (5)
U.S. ECONOMIC & MARKET COMMENTARY 2nd Quarter 2017
Quadrant Real Estate Advisors LLC 7 www.quadrantrea.com
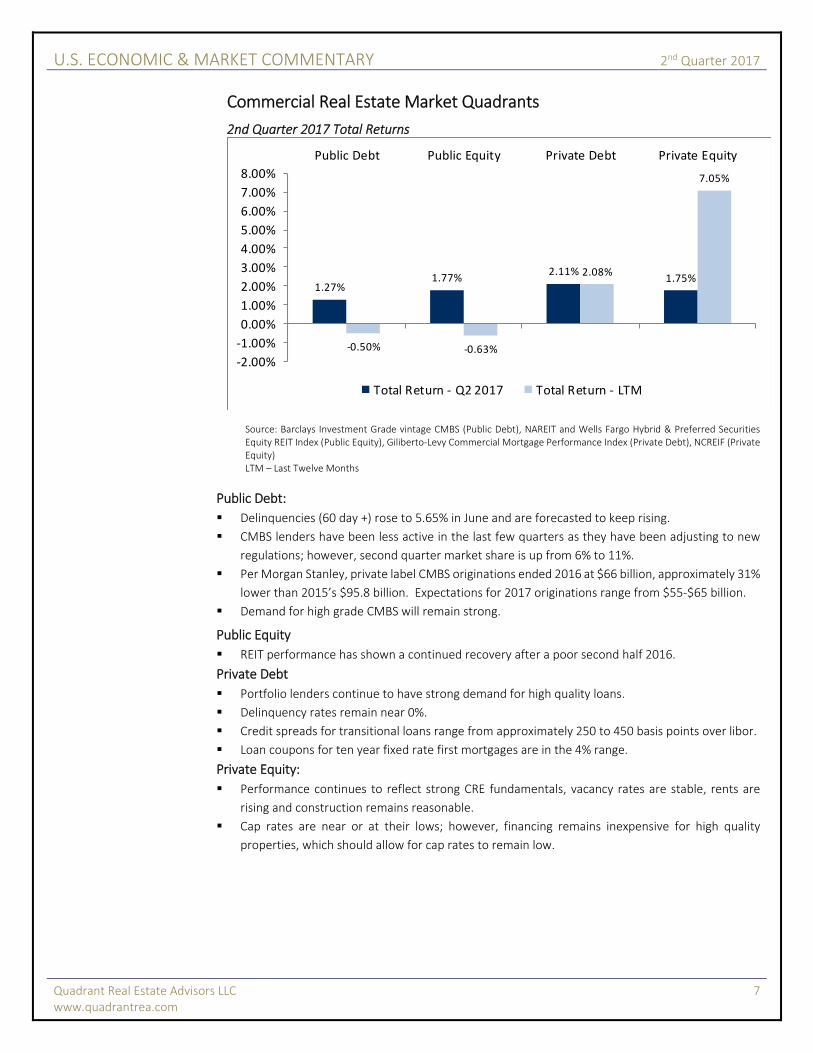
Commercial Real Estate Market Quadrants
2nd Quarter 2017 Total Returns
Source: Barclays Investment Grade vintage CMBS (Public Debt), NAREIT and Wells Fargo Hybrid & Preferred Securities Equity REIT Index (Public Equity), Giliberto‐Levy Commercial Mortgage Performance Index (Private Debt), NCREIF (Private Equity) LTM – Last Twelve Months
Public Debt:
Delinquencies (60 day +) rose to 5.65% in June and are forecasted to keep rising.
CMBS lenders have been less active in the last few quarters as they have been adjusting to new
regulations; however, second quarter market share is up from 6% to 11%.
Per Morgan Stanley, private label CMBS originations ended 2016 at $66 billion, approximately 31%
lower than 2015’s $95.8 billion. Expectations for 2017 originations range from $55‐$65 billion.
Demand for high grade CMBS will remain strong.
Public Equity
REIT performance has shown a continued recovery after a poor second half 2016.
Private Debt
Portfolio lenders continue to have strong demand for high quality loans.
Delinquency rates remain near 0%.
Credit spreads for transitional loans range from approximately 250 to 450 basis points over libor.
Loan coupons for ten year fixed rate first mortgages are in the 4% range.
Private Equity:
Performance continues to reflect strong CRE fundamentals, vacancy rates are stable, rents are
rising and construction remains reasonable.
Cap rates are near or at their lows; however, financing remains inexpensive for high quality
properties, which should allow for cap rates to remain low.
1.27%1.77%
2.11%1.75%
‐0.50% ‐0.63%
2.08%
7.05%
‐2.00%
‐1.00%
0.00%
1.00%
2.00%
3.00%
4.00%
5.00%
6.00%
7.00%
8.00%
Public Debt Public Equity Private Debt Private Equity
Total Return ‐ Q2 2017 Total Return ‐ LTM
U.S. ECONOMIC & MARKET COMMENTARY 2nd Quarter 2017
Quadrant Real Estate Advisors LLC 8 www.quadrantrea.com
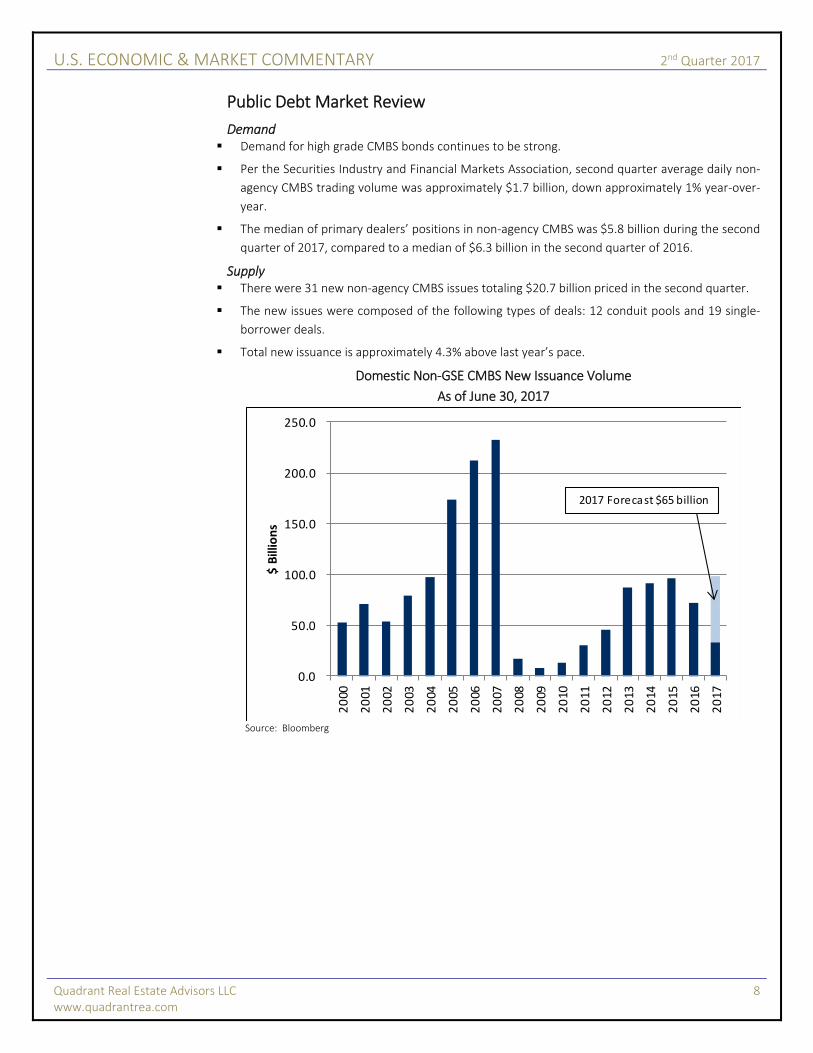
Public Debt Market Review
Demand Demand for high grade CMBS bonds continues to be strong.
Per the Securities Industry and Financial Markets Association, second quarter average daily non‐
agency CMBS trading volume was approximately $1.7 billion, down approximately 1% year‐over‐
year.
The median of primary dealers’ positions in non‐agency CMBS was $5.8 billion during the second
quarter of 2017, compared to a median of $6.3 billion in the second quarter of 2016.
Supply There were 31 new non‐agency CMBS issues totaling $20.7 billion priced in the second quarter.
The new issues were composed of the following types of deals: 12 conduit pools and 19 single‐
borrower deals.
Total new issuance is approximately 4.3% above last year’s pace.
Domestic Non‐GSE CMBS New Issuance Volume
As of June 30, 2017
Source: Bloomberg
0.0
50.0
100.0
150.0
200.0
250.0
2000
2001
2002
2003
2004
2005
2006
2007
2008
2009
2010
2011
2012
2013
2014
2015
2016
2017
$ Billions
2017 Forecast $65 billion
U.S. ECONOMIC & MARKET COMMENTARY 2nd Quarter 2017
Quadrant Real Estate Advisors LLC 9 www.quadrantrea.com
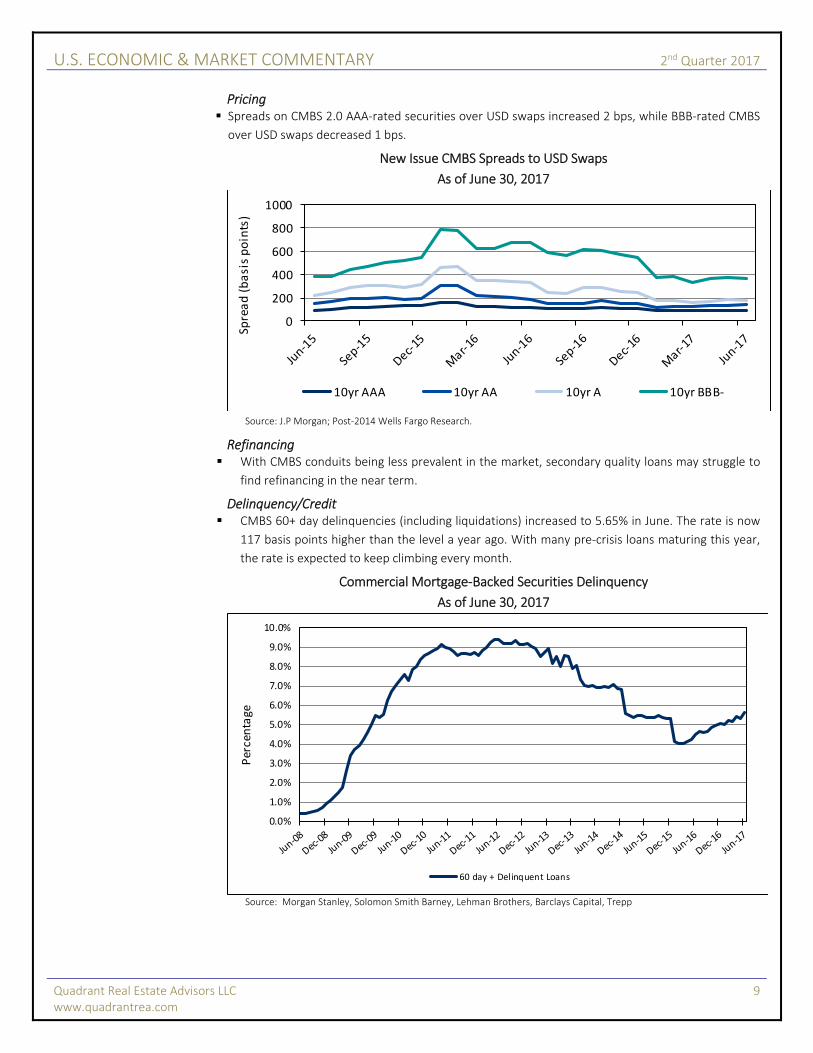
Pricing Spreads on CMBS 2.0 AAA‐rated securities over USD swaps increased 2 bps, while BBB‐rated CMBS
over USD swaps decreased 1 bps.
New Issue CMBS Spreads to USD Swaps
As of June 30, 2017
Source: J.P Morgan; Post‐2014 Wells Fargo Research.
Refinancing With CMBS conduits being less prevalent in the market, secondary quality loans may struggle to
find refinancing in the near term.
Delinquency/Credit CMBS 60+ day delinquencies (including liquidations) increased to 5.65% in June. The rate is now
117 basis points higher than the level a year ago. With many pre‐crisis loans maturing this year,
the rate is expected to keep climbing every month.
Commercial Mortgage‐Backed Securities Delinquency
As of June 30, 2017
Source: Morgan Stanley, Solomon Smith Barney, Lehman Brothers, Barclays Capital, Trepp
0
200
400
600
800
1000
Spread (basis points)
10yr AAA 10yr AA 10yr A 10yr BBB‐
0.0%
1.0%
2.0%
3.0%
4.0%
5.0%
6.0%
7.0%
8.0%
9.0%
10.0%
Percentage
60 day + Delinquent Loans
U.S. ECONOMIC & MARKET COMMENTARY 2nd Quarter 2017
Quadrant Real Estate Advisors LLC 10 www.quadrantrea.com
Problem Loan Liquidation and Modification In May, 48 loans with an original balance of $1.9 billion reported losses totaling $439.0 million. In
June, 23 loans reported losses totaling $150.0 million, bringing the total losses year‐to‐date to $2.4
billion, in line with 2016.
The average loss severity decreased from 2016 levels, with the year‐to‐date average reported at
24.2% compared with an average rate of 35.5% in 2016.
OUTLOOK:
Demand from fixed income investors for high grade CMBS is expected to remain strong. Supply,
however is expected to be limited given that CMBS issuers must consider compliance with the newly
enacted risk retention rules.
Public Equity Market Review
Pricing The NAREIT Equity REITs Index increased 1.52% during the second quarter of 2017.
Sector Activity REITs raised $10.2 billion of senior unsecured debt (29 transactions). Secondary offerings of
common equity totaled $8.8 billion, and secondary offerings of preferred equity totaled $1.2
billion. There were four IPO’s in the second quarter, raising $765.0 million.
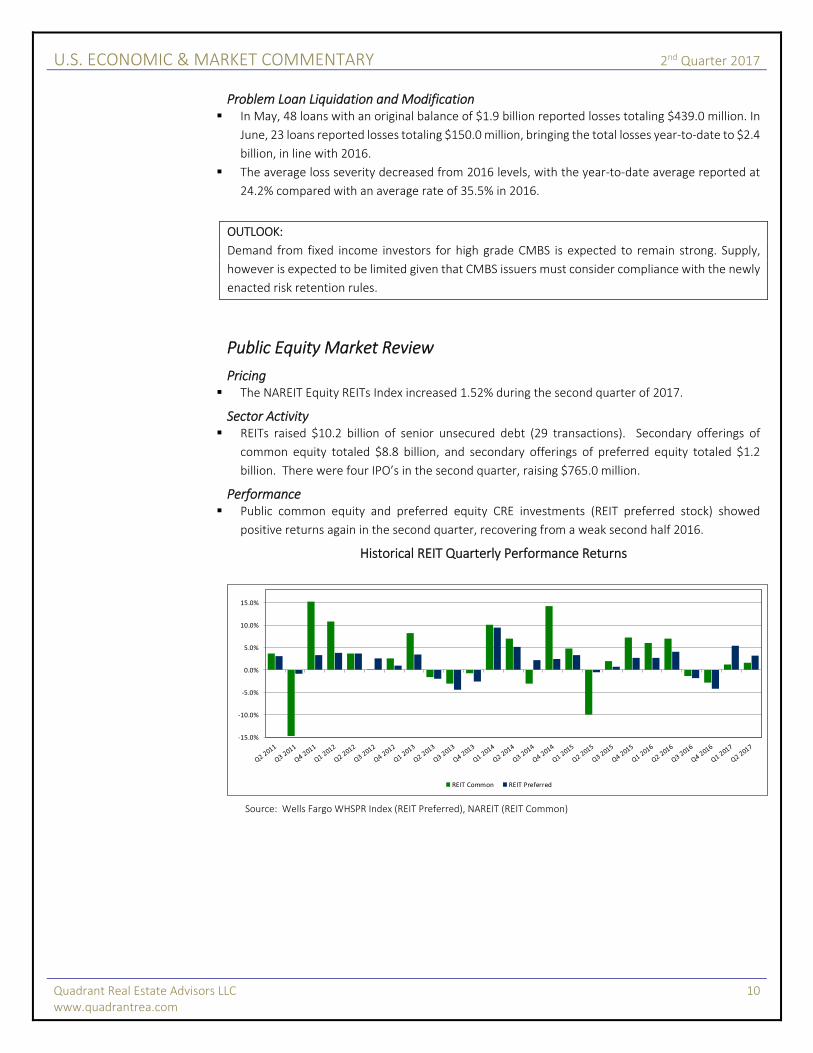
Performance Public common equity and preferred equity CRE investments (REIT preferred stock) showed
positive returns again in the second quarter, recovering from a weak second half 2016.
Historical REIT Quarterly Performance Returns
Source: Wells Fargo WHSPR Index (REIT Preferred), NAREIT (REIT Common)
‐15.0%
‐10.0%
‐5.0%
0.0%
5.0%
10.0%
15.0%
REIT Common REIT Preferred
U.S. ECONOMIC & MARKET COMMENTARY 2nd Quarter 2017
Quadrant Real Estate Advisors LLC 11 www.quadrantrea.com
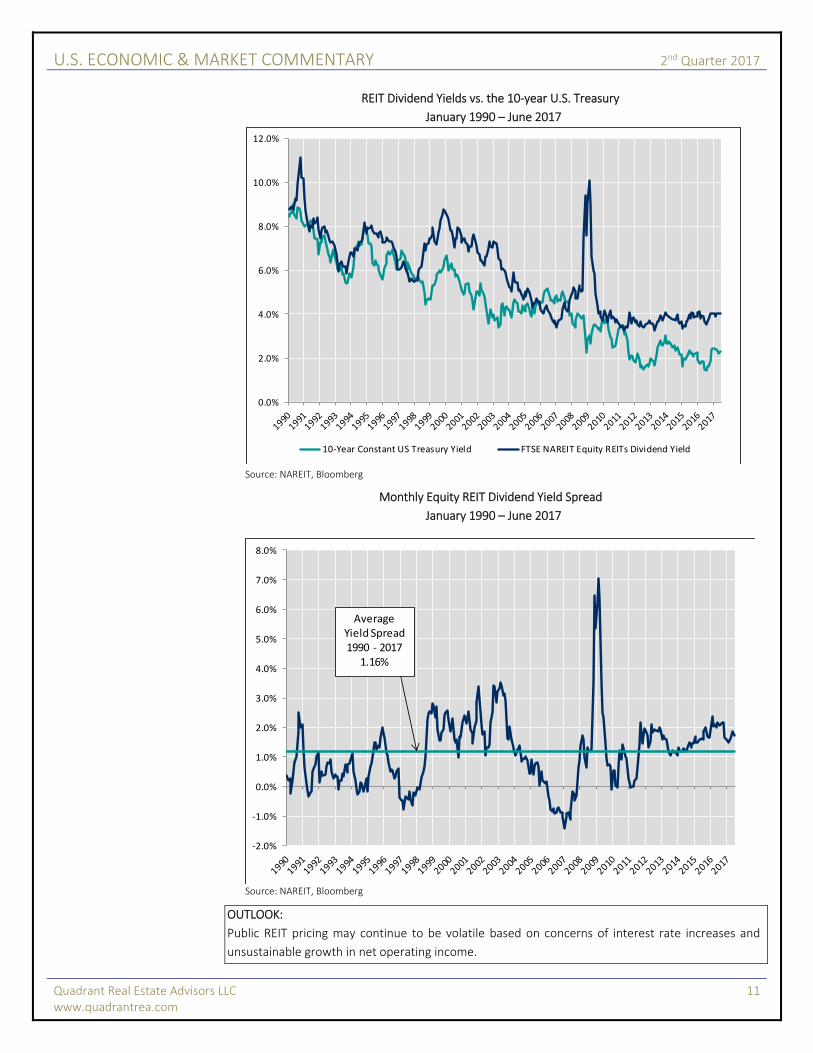
REIT Dividend Yields vs. the 10‐year U.S. Treasury
January 1990 – June 2017
Source: NAREIT, Bloomberg
Monthly Equity REIT Dividend Yield Spread
January 1990 – June 2017
Source: NAREIT, Bloomberg
OUTLOOK:
Public REIT pricing may continue to be volatile based on concerns of interest rate increases and
unsustainable growth in net operating income.
0.0%
2.0%
4.0%
6.0%
8.0%
10.0%
12.0%
10‐Year Constant US Treasury Yield FTSE NAREIT Equity REITs Dividend Yield
‐2.0%
‐1.0%
0.0%
1.0%
2.0%
3.0%
4.0%
5.0%
6.0%
7.0%
8.0%
Average Yield Spread 1990 ‐ 2017
1.16%
U.S. ECONOMIC & MARKET COMMENTARY 2nd Quarter 2017
Quadrant Real Estate Advisors LLC 12 www.quadrantrea.com
Private Debt Market Review
Commercial Mortgage Loan Originations
Source: MBA Survey of Commercial/Multifamily Originations, Morgan Stanley Research
As indicated in the charts above, Life Insurance and agency lenders (Fannie Mae and Freddie Mac) have easily taken up the slack for higher quality loans from the CMBS conduits since the Global Financial Crisis.
Fundamentals The average life insurance company whole loan delinquency rate as reported by ACLI for the first
quarter of 2017 was 0.02% in contrast to the 5.65% delinquency in the CMBS market.
Historical Delinquency Rates
As of March, 2017
0.00%
1.00%
2.00%
3.00%
4.00%
5.00%
6.00%
7.00%
8.00%
9.00%
10.00%
2001 2002 2003 2004 2005 2006 2007 2008 2009 2010 2011 2012 2013 2014 2015 2016 2017Q1
CMBS‐ 60 day + Life Insurance Companies
U.S. ECONOMIC & MARKET COMMENTARY 2nd Quarter 2017
Quadrant Real Estate Advisors LLC 13 www.quadrantrea.com
Source: ACLI, Barclays Capital
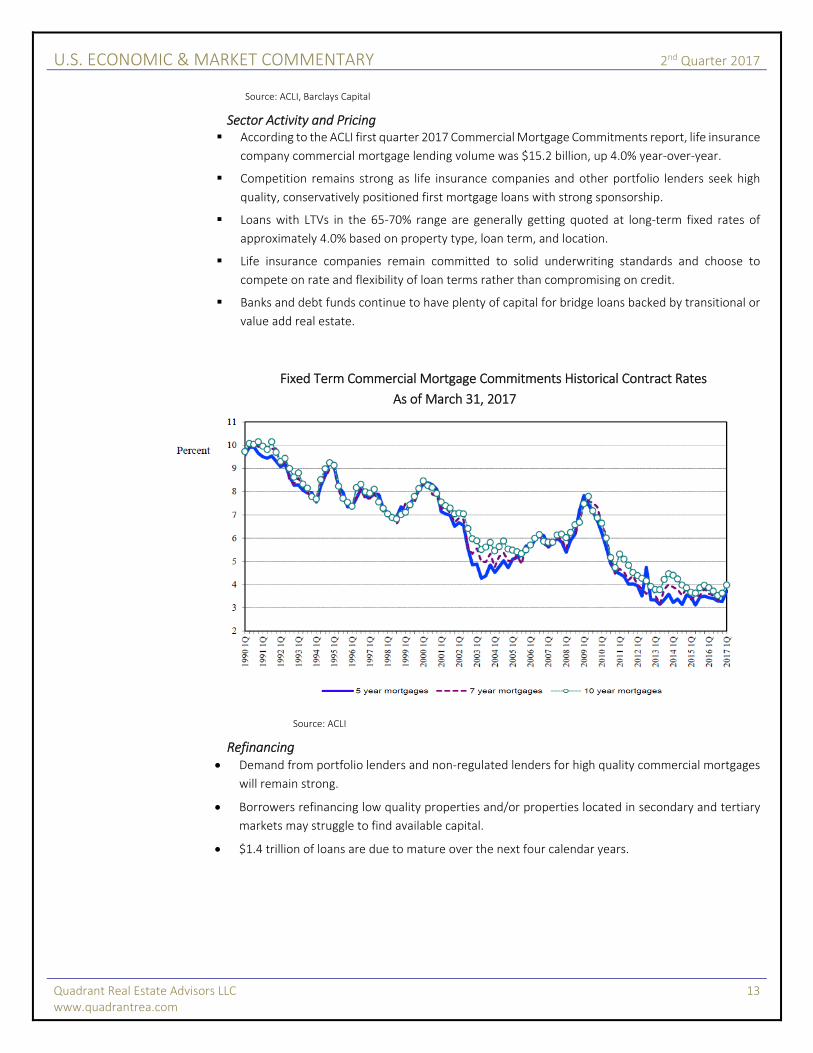
Sector Activity and Pricing According to the ACLI first quarter 2017 Commercial Mortgage Commitments report, life insurance
company commercial mortgage lending volume was $15.2 billion, up 4.0% year‐over‐year.
Competition remains strong as life insurance companies and other portfolio lenders seek high
quality, conservatively positioned first mortgage loans with strong sponsorship.
Loans with LTVs in the 65‐70% range are generally getting quoted at long‐term fixed rates of
approximately 4.0% based on property type, loan term, and location.
Life insurance companies remain committed to solid underwriting standards and choose to
compete on rate and flexibility of loan terms rather than compromising on credit.
Banks and debt funds continue to have plenty of capital for bridge loans backed by transitional or
value add real estate.
Fixed Term Commercial Mortgage Commitments Historical Contract Rates
As of March 31, 2017
Source: ACLI
Refinancing Demand from portfolio lenders and non‐regulated lenders for high quality commercial mortgages
will remain strong.
Borrowers refinancing low quality properties and/or properties located in secondary and tertiary
markets may struggle to find available capital.
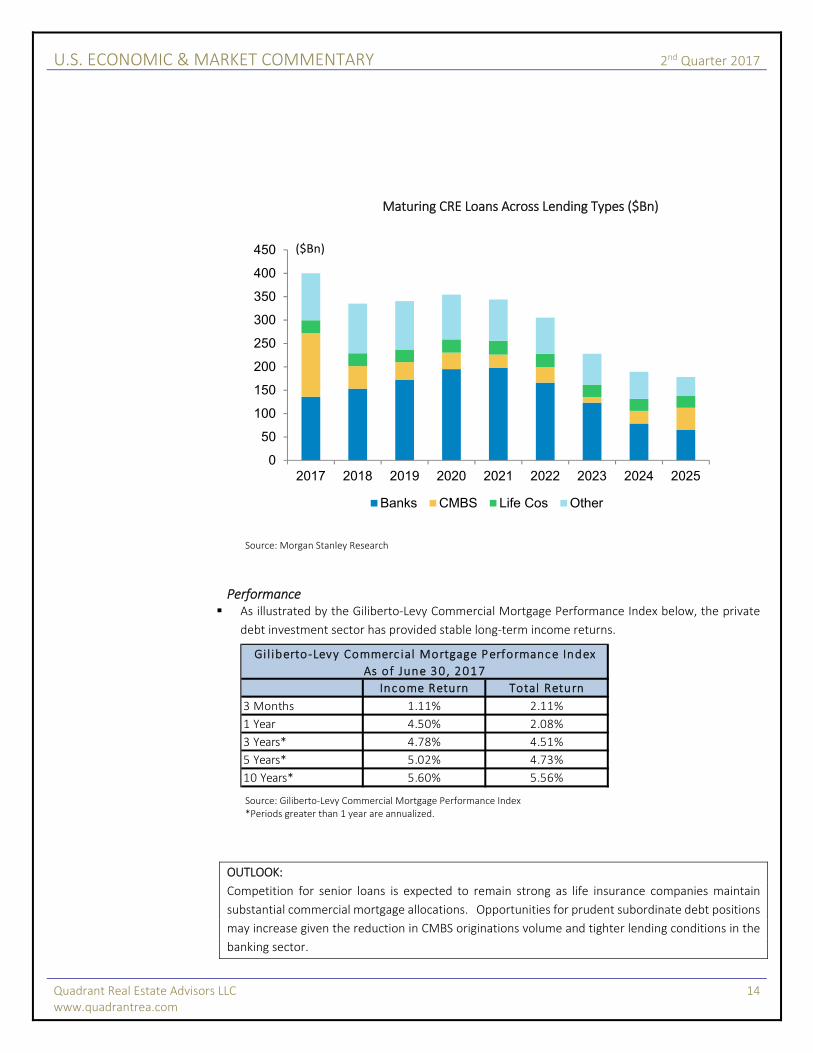
$1.4 trillion of loans are due to mature over the next four calendar years.
U.S. ECONOMIC & MARKET COMMENTARY 2nd Quarter 2017
Quadrant Real Estate Advisors LLC 14 www.quadrantrea.com
Maturing CRE Loans Across Lending Types ($Bn)
Source: Morgan Stanley Research
Performance As illustrated by the Giliberto‐Levy Commercial Mortgage Performance Index below, the private
debt investment sector has provided stable long‐term income returns.
Source: Giliberto‐Levy Commercial Mortgage Performance Index *Periods greater than 1 year are annualized.
OUTLOOK:
Competition for senior loans is expected to remain strong as life insurance companies maintain
substantial commercial mortgage allocations. Opportunities for prudent subordinate debt positions
may increase given the reduction in CMBS originations volume and tighter lending conditions in the
banking sector.
0
50
100
150
200
250
300
350
400
450
2017 2018 2019 2020 2021 2022 2023 2024 2025
Banks CMBS Life Cos Other
($Bn)
Gil iberto‐Levy Commerc ial Mortgage Performance Index
As of June 30 , 2017
Income Return Total Return
3 Months 1.11% 2.11%
1 Year 4.50% 2.08%
3 Years* 4.78% 4.51%
5 Years* 5.02% 4.73%
10 Years* 5.60% 5.56%
U.S. ECONOMIC & MARKET COMMENTARY 2nd Quarter 2017
Quadrant Real Estate Advisors LLC 15 www.quadrantrea.com
Private Equity Market Review
Fundamentals Dodge Data and Analytics (“Dodge”) reports that the number of non‐residential construction
starts, which excludes multi‐family construction, for the six months ending June 30, 2017 has
increased 6% year‐over‐year.
Dodge reports that the value of multifamily construction fell 7% in June, sliding back for the third
month in a row.
The American Institute of Architects (“AIA”) reported that the Architecture Billings Index (“ABI”)
ended the second quarter at 54.2, up from a score of 53.0 in May. A reading above 50.0 indicates
rising demand for design services.
The ABI levels as of the end of the second quarter are as follows:
Source: American Institute of Architects
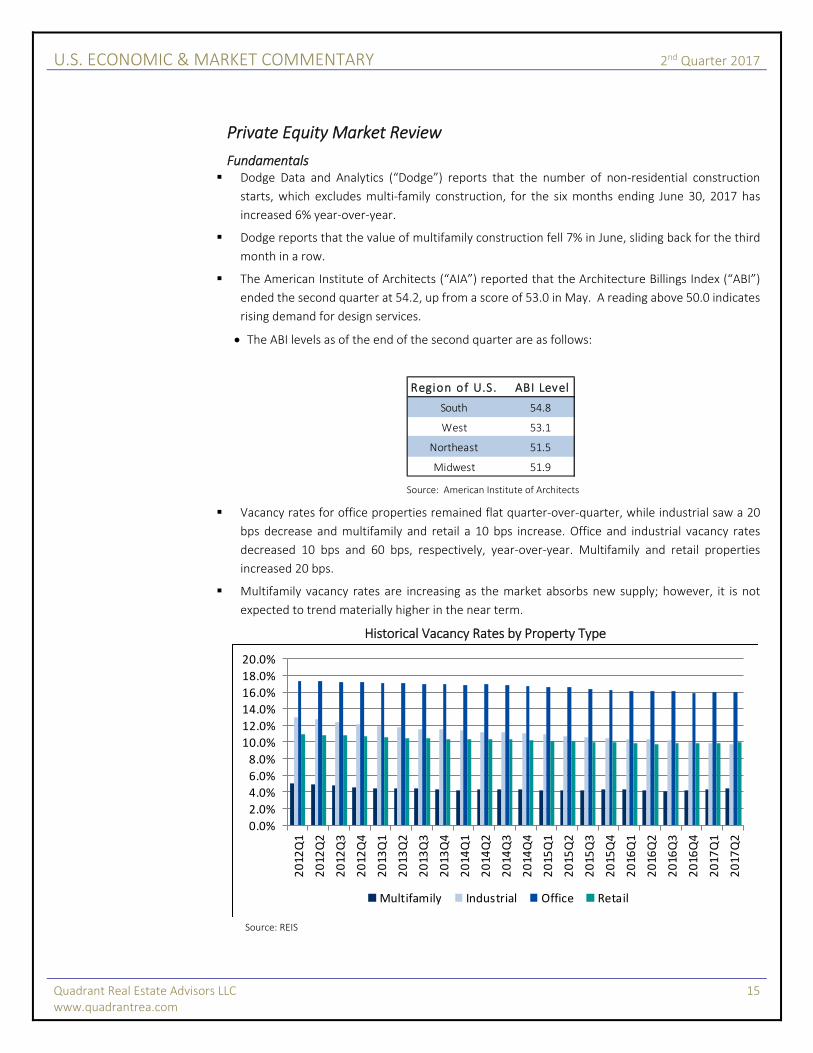
Vacancy rates for office properties remained flat quarter‐over‐quarter, while industrial saw a 20
bps decrease and multifamily and retail a 10 bps increase. Office and industrial vacancy rates
decreased 10 bps and 60 bps, respectively, year‐over‐year. Multifamily and retail properties
increased 20 bps.
Multifamily vacancy rates are increasing as the market absorbs new supply; however, it is not
expected to trend materially higher in the near term.
Historical Vacancy Rates by Property Type
Source: REIS
Region of U.S. ABI Level
South 54.8
West 53.1
Northeast 51.5
Midwest 51.9
0.0%
2.0%
4.0%
6.0%
8.0%
10.0%
12.0%
14.0%
16.0%
18.0%
20.0%
2012
Q1
2012
Q2
2012
Q3
2012
Q4
2013
Q1
2013
Q2
2013
Q3
2013
Q4
2014
Q1
2014
Q2
2014
Q3
2014
Q4
2015
Q1
2015
Q2
2015
Q3
2015
Q4
2016
Q1
2016
Q2
2016
Q3
2016
Q4
2017
Q1
2017
Q2
Multifamily Industrial Office Retail
U.S. ECONOMIC & MARKET COMMENTARY 2nd Quarter 2017
Quadrant Real Estate Advisors LLC 16 www.quadrantrea.com
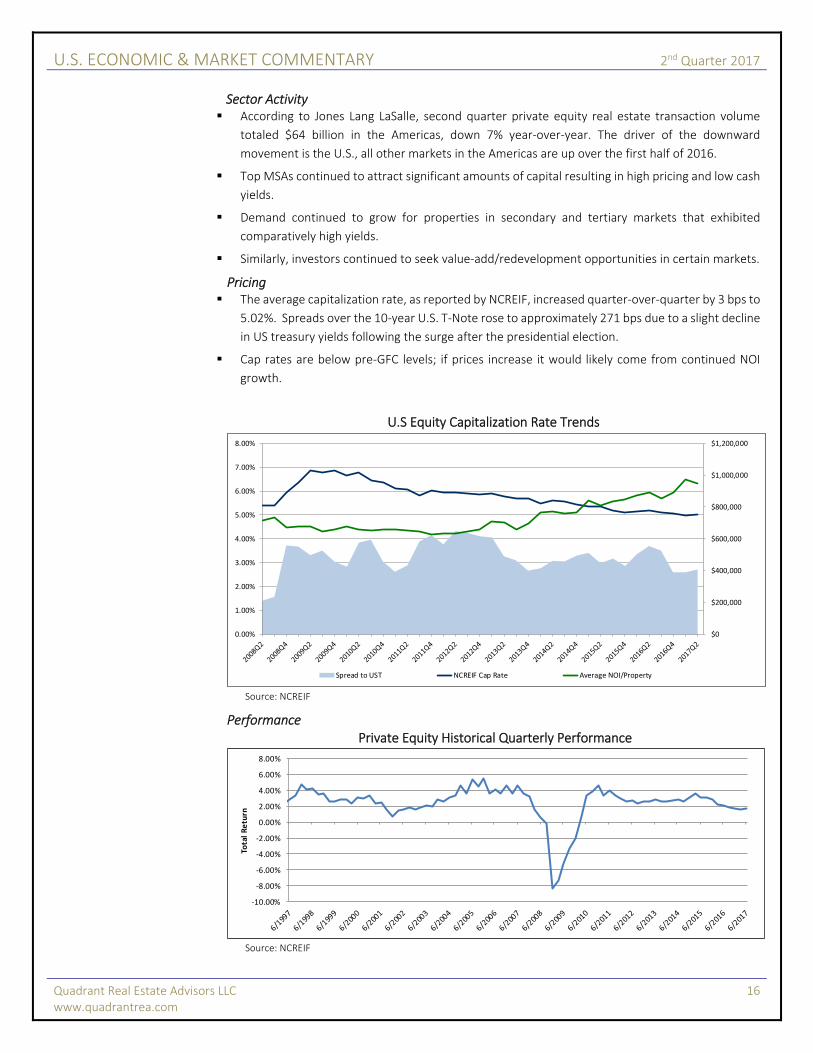
Sector Activity According to Jones Lang LaSalle, second quarter private equity real estate transaction volume
totaled $64 billion in the Americas, down 7% year‐over‐year. The driver of the downward
movement is the U.S., all other markets in the Americas are up over the first half of 2016.
Top MSAs continued to attract significant amounts of capital resulting in high pricing and low cash
yields.
Demand continued to grow for properties in secondary and tertiary markets that exhibited
comparatively high yields.
Similarly, investors continued to seek value‐add/redevelopment opportunities in certain markets.
Pricing The average capitalization rate, as reported by NCREIF, increased quarter‐over‐quarter by 3 bps to
5.02%. Spreads over the 10‐year U.S. T‐Note rose to approximately 271 bps due to a slight decline
in US treasury yields following the surge after the presidential election.
Cap rates are below pre‐GFC levels; if prices increase it would likely come from continued NOI
growth.
U.S Equity Capitalization Rate Trends
Source: NCREIF
Performance Private Equity Historical Quarterly Performance
Source: NCREIF
$0
$200,000
$400,000
$600,000
$800,000
$1,000,000
$1,200,000
0.00%
1.00%
2.00%
3.00%
4.00%
5.00%
6.00%
7.00%
8.00%
Spread to UST NCREIF Cap Rate Average NOI/Property
‐10.00%
‐8.00%
‐6.00%
‐4.00%
‐2.00%
0.00%
2.00%
4.00%
6.00%
8.00%
Total Return
U.S. ECONOMIC & MARKET COMMENTARY 2nd Quarter 2017
Quadrant Real Estate Advisors LLC 17 www.quadrantrea.com
OUTLOOK: Transaction activity over the next several years for high quality properties will be supported by relatively inexpensive financing options, global capital (equity and debt) inflows, and strong commercial real estate fundamentals. Nominal cap rates are very low in certain primary markets, which limits near‐term valuation upside for stabilized assets in these markets. The spread between primary and secondary markets has begun to tighten as investors seek yield beyond the top CBD markets, although that phenomenon may be short lived if financing becomes less plentiful in those markets. The relatively high cap rate spread over U.S. T‐Notes provides a degree of buffer to rising benchmark interest rates in the near term, which helps reduce rate‐driven downside valuation risk. Furthermore, any incremental increase in inflation, which Quadrant expects to be a prerequisite for the Fed to begin material interest rate increases, should support rising long‐term CRE private equity valuations as rents and construction costs rise (i.e. increasing income and limiting new supply).
U.S. ECONOMIC & MARKET COMMENTARY 2nd Quarter 2017
Quadrant Real Estate Advisors LLC 18 www.quadrantrea.com
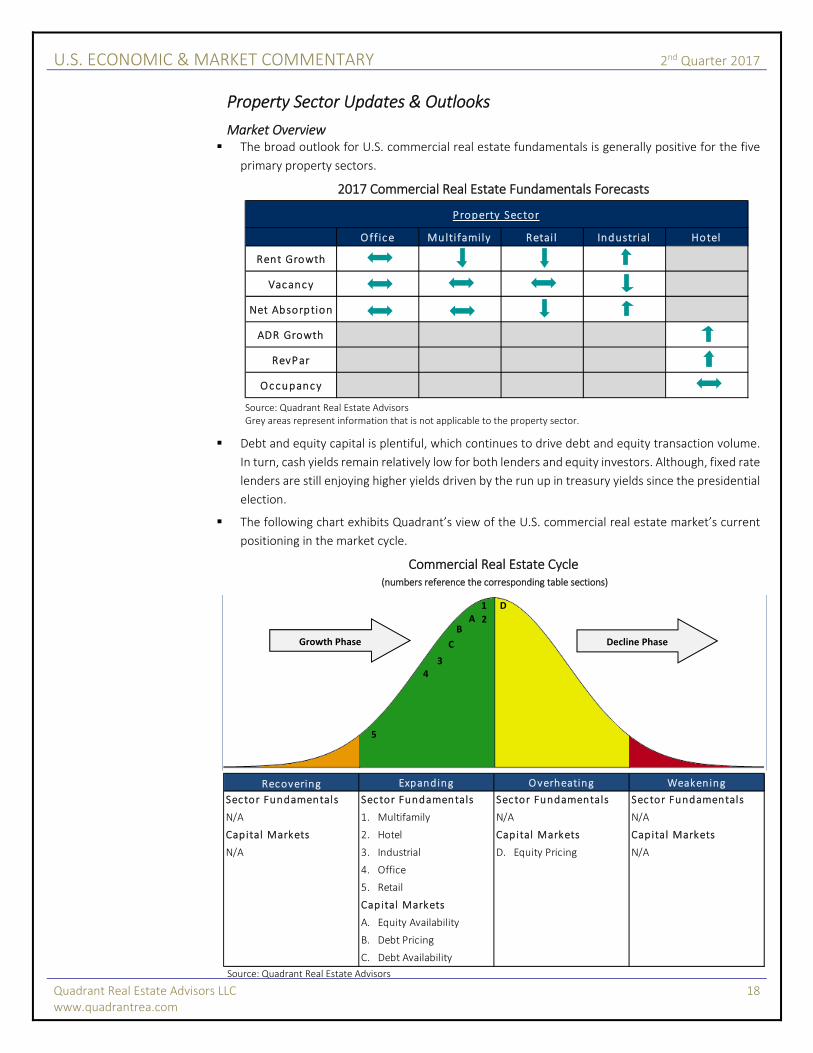
Property Sector Updates & Outlooks
Market Overview The broad outlook for U.S. commercial real estate fundamentals is generally positive for the five
primary property sectors.
2017 Commercial Real Estate Fundamentals Forecasts
Source: Quadrant Real Estate Advisors Grey areas represent information that is not applicable to the property sector.
Debt and equity capital is plentiful, which continues to drive debt and equity transaction volume.
In turn, cash yields remain relatively low for both lenders and equity investors. Although, fixed rate
lenders are still enjoying higher yields driven by the run up in treasury yields since the presidential
election.
The following chart exhibits Quadrant’s view of the U.S. commercial real estate market’s current
positioning in the market cycle.
Commercial Real Estate Cycle (numbers reference the corresponding table sections)
Source: Quadrant Real Estate Advisors
Off ice Multifamily Retai l Industrial Hotel
Rent Growth
Vacancy
Net Absorption
ADR Growth
RevPar
Occupancy
Property Sector
Recovering Expanding Overheating Weakening
Sector Fundamentals Sector Fundamentals Sector Fundamentals Sector Fundamentals
N/A 1. Multifamily N/A N/A
Capital Markets 2. Hotel Capital Markets Capital Markets
N/A 3. Industrial D. Equity Pricing N/A
4. Office
5. Retail
Capital Markets
A. Equity Availability
B. Debt Pricing
C. Debt Availability
Growth Phase Decline Phase
1
2
3 4
5
A D
B
C
U.S. ECONOMIC & MARKET COMMENTARY 2nd Quarter 2017
Quadrant Real Estate Advisors LLC 19 www.quadrantrea.com
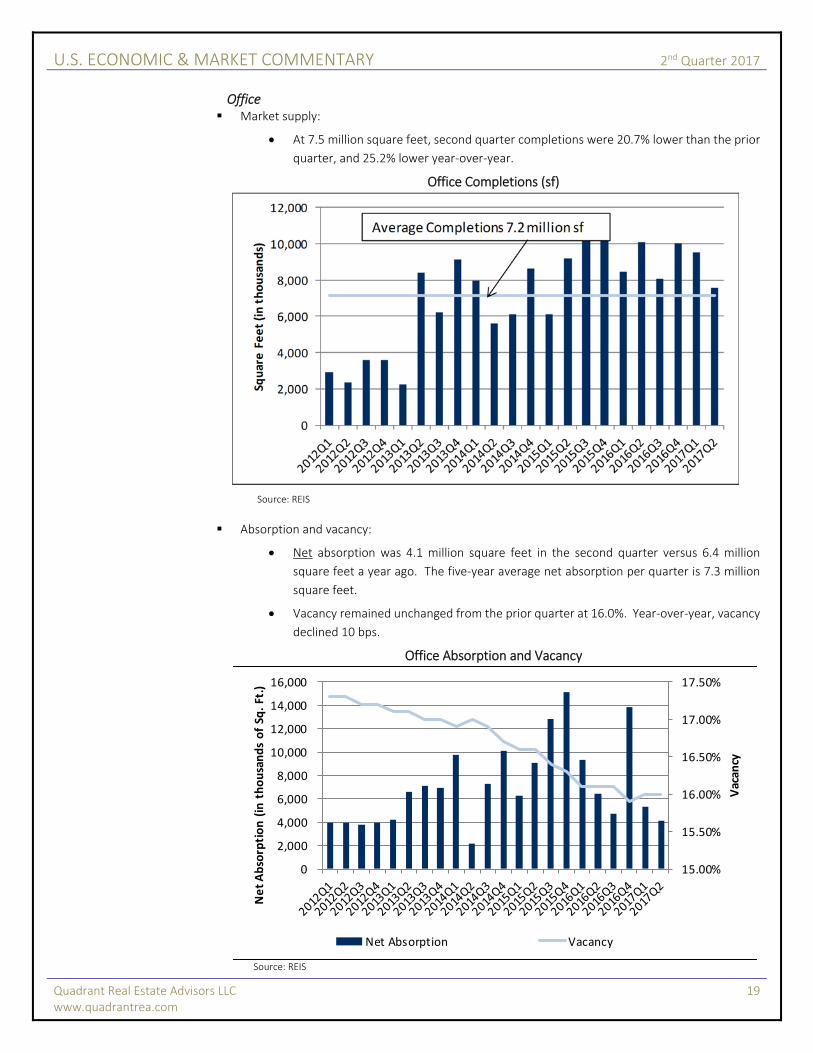
Office Market supply:
At 7.5 million square feet, second quarter completions were 20.7% lower than the prior
quarter, and 25.2% lower year‐over‐year.
Office Completions (sf)
Source: REIS
Absorption and vacancy:
Net absorption was 4.1 million square feet in the second quarter versus 6.4 million
square feet a year ago. The five‐year average net absorption per quarter is 7.3 million
square feet.
Vacancy remained unchanged from the prior quarter at 16.0%. Year‐over‐year, vacancy
declined 10 bps.
Office Absorption and Vacancy
Source: REIS
15.00%
15.50%
16.00%
16.50%
17.00%
17.50%
0
2,000
4,000
6,000
8,000
10,000
12,000
14,000
16,000
Vacan
cy
Net Absorption (in thousands of Sq
. Ft.)
Net Absorption Vacancy
U.S. ECONOMIC & MARKET COMMENTARY 2nd Quarter 2017
Quadrant Real Estate Advisors LLC 20 www.quadrantrea.com
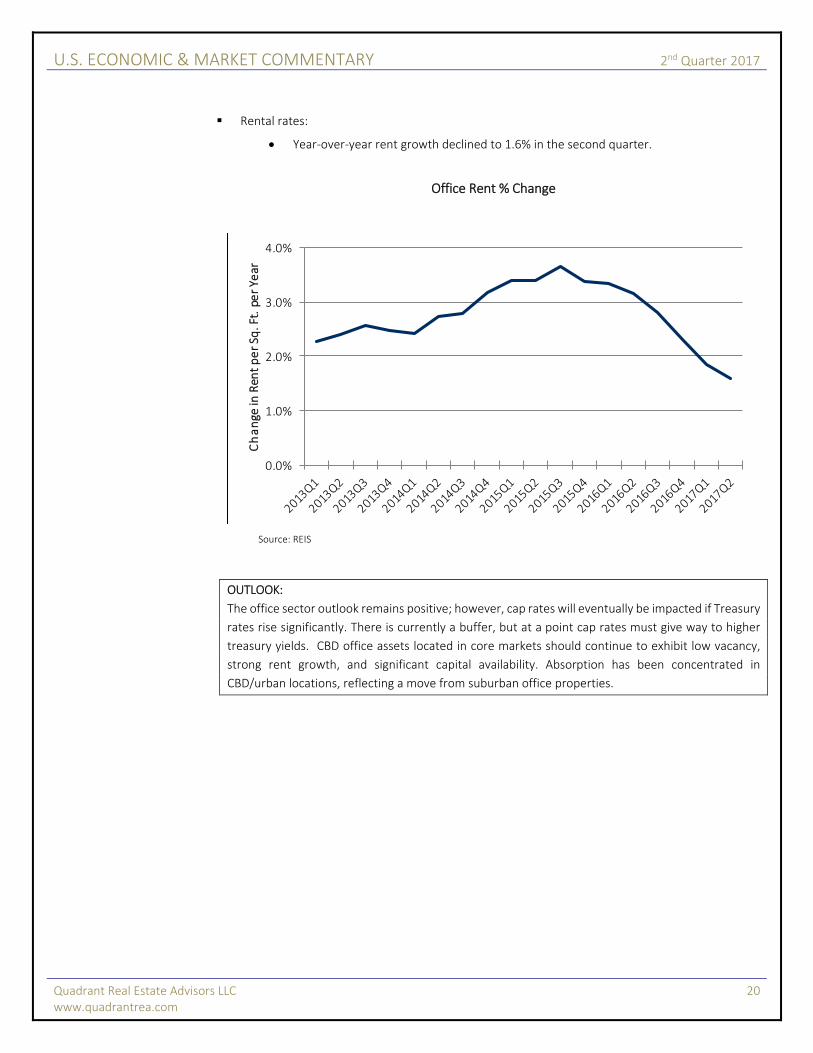
Rental rates:
Year‐over‐year rent growth declined to 1.6% in the second quarter.
Office Rent % Change
Source: REIS
OUTLOOK:
The office sector outlook remains positive; however, cap rates will eventually be impacted if Treasury
rates rise significantly. There is currently a buffer, but at a point cap rates must give way to higher
treasury yields. CBD office assets located in core markets should continue to exhibit low vacancy,
strong rent growth, and significant capital availability. Absorption has been concentrated in
CBD/urban locations, reflecting a move from suburban office properties.
0.0%
1.0%
2.0%
3.0%
4.0%Change in
Ren
t per Sq
. Ft. per Ye
ar
U.S. ECONOMIC & MARKET COMMENTARY 2nd Quarter 2017
Quadrant Real Estate Advisors LLC 21 www.quadrantrea.com
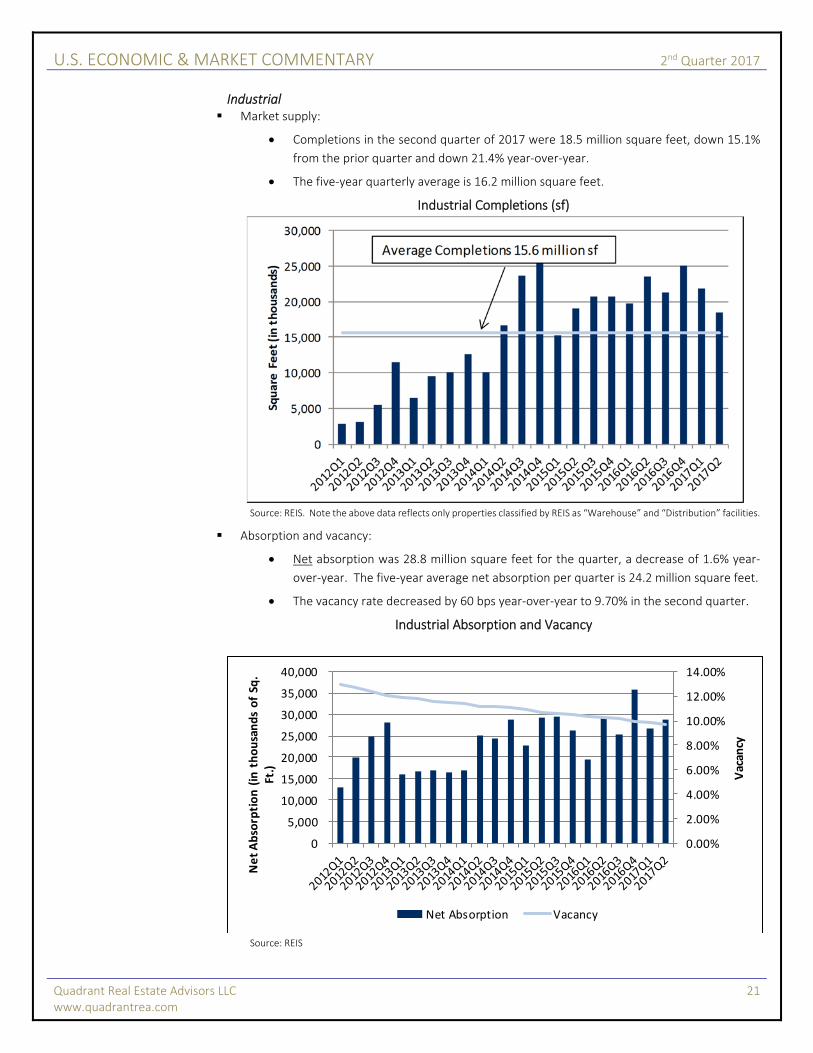
Industrial Market supply:
Completions in the second quarter of 2017 were 18.5 million square feet, down 15.1%
from the prior quarter and down 21.4% year‐over‐year.
The five‐year quarterly average is 16.2 million square feet.
Industrial Completions (sf)
Source: REIS. Note the above data reflects only properties classified by REIS as “Warehouse” and “Distribution” facilities.
Absorption and vacancy:
Net absorption was 28.8 million square feet for the quarter, a decrease of 1.6% year‐
over‐year. The five‐year average net absorption per quarter is 24.2 million square feet.
The vacancy rate decreased by 60 bps year‐over‐year to 9.70% in the second quarter.
Industrial Absorption and Vacancy
Source: REIS
0.00%
2.00%
4.00%
6.00%
8.00%
10.00%
12.00%
14.00%
0
5,000
10,000
15,000
20,000
25,000
30,000
35,000
40,000
Vacan
cy
Net Absorption (in thousands of Sq
. Ft.)
Net Absorption Vacancy
U.S. ECONOMIC & MARKET COMMENTARY 2nd Quarter 2017
Quadrant Real Estate Advisors LLC 22 www.quadrantrea.com
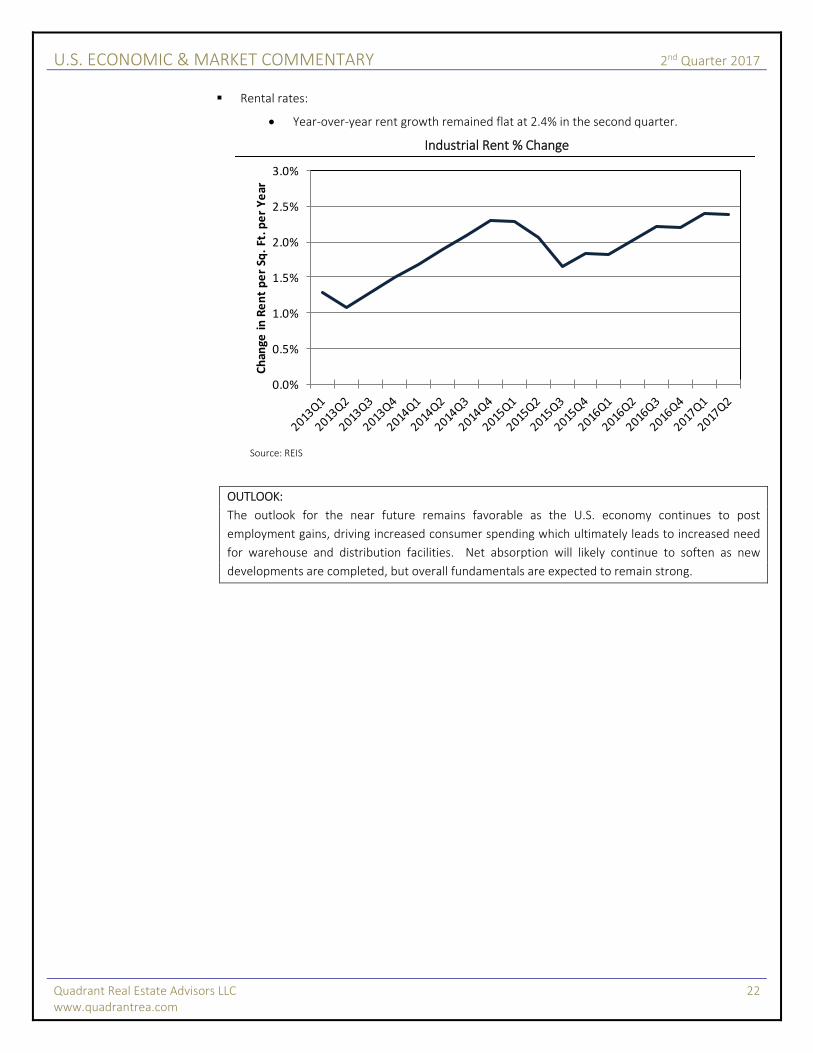
Rental rates:
Year‐over‐year rent growth remained flat at 2.4% in the second quarter.
Industrial Rent % Change
Source: REIS
OUTLOOK:
The outlook for the near future remains favorable as the U.S. economy continues to post
employment gains, driving increased consumer spending which ultimately leads to increased need
for warehouse and distribution facilities. Net absorption will likely continue to soften as new
developments are completed, but overall fundamentals are expected to remain strong.
0.0%
0.5%
1.0%
1.5%
2.0%
2.5%
3.0%
Chan
ge in Rent per Sq
. Ft. p
er Year
U.S. ECONOMIC & MARKET COMMENTARY 2nd Quarter 2017
Quadrant Real Estate Advisors LLC 23 www.quadrantrea.com
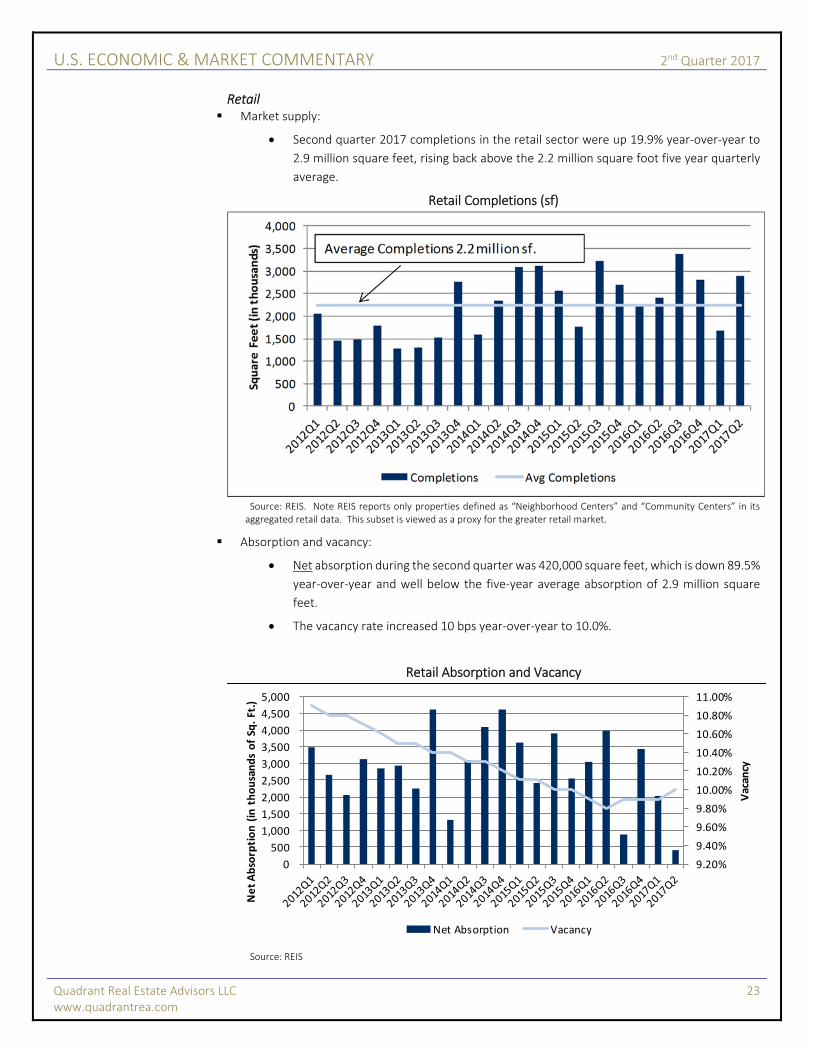
Retail Market supply:
Second quarter 2017 completions in the retail sector were up 19.9% year‐over‐year to
2.9 million square feet, rising back above the 2.2 million square foot five year quarterly
average.
Retail Completions (sf)
Source: REIS. Note REIS reports only properties defined as “Neighborhood Centers” and “Community Centers” in its aggregated retail data. This subset is viewed as a proxy for the greater retail market.
Absorption and vacancy:
Net absorption during the second quarter was 420,000 square feet, which is down 89.5%
year‐over‐year and well below the five‐year average absorption of 2.9 million square
feet.
The vacancy rate increased 10 bps year‐over‐year to 10.0%.
Retail Absorption and Vacancy
Source: REIS
9.20%
9.40%
9.60%
9.80%
10.00%
10.20%
10.40%
10.60%
10.80%
11.00%
0
500
1,000
1,500
2,000
2,500
3,000
3,500
4,000
4,500
5,000
Vacan
cy
Net Absorption (in thousands of Sq
. Ft.)
Net Absorption Vacancy
U.S. ECONOMIC & MARKET COMMENTARY 2nd Quarter 2017
Quadrant Real Estate Advisors LLC 24 www.quadrantrea.com
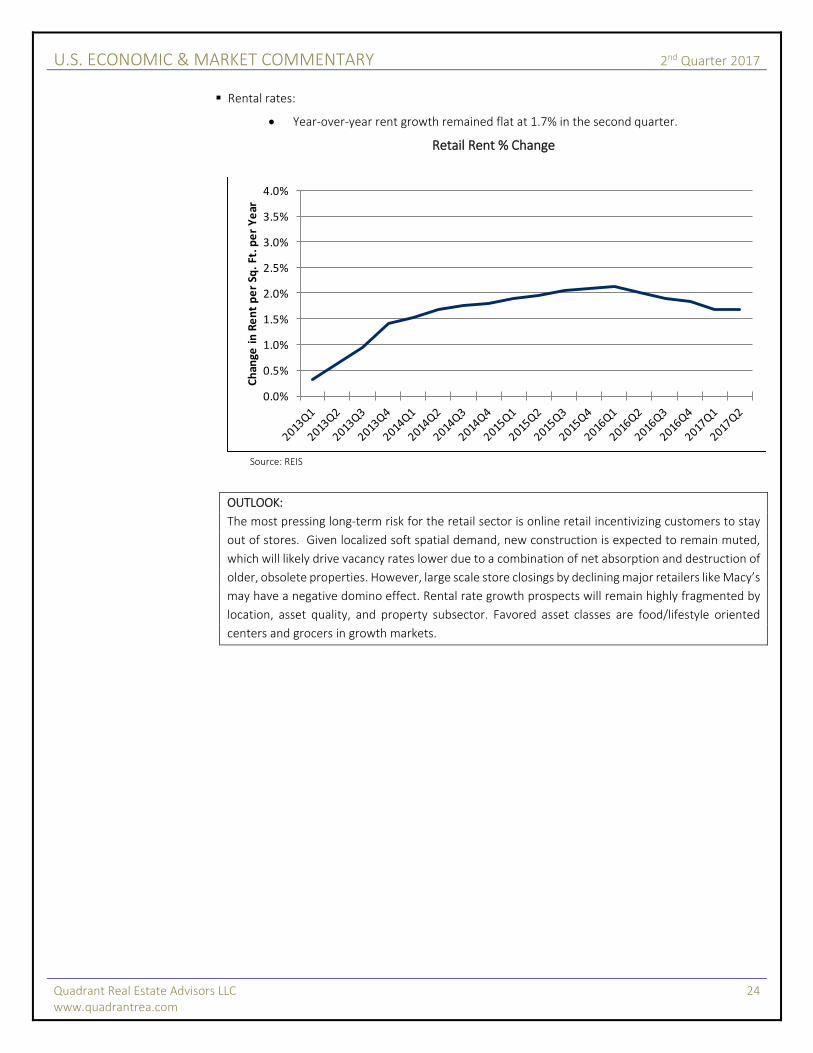
Rental rates:
Year‐over‐year rent growth remained flat at 1.7% in the second quarter.
Retail Rent % Change
Source: REIS
OUTLOOK:
The most pressing long‐term risk for the retail sector is online retail incentivizing customers to stay
out of stores. Given localized soft spatial demand, new construction is expected to remain muted,
which will likely drive vacancy rates lower due to a combination of net absorption and destruction of
older, obsolete properties. However, large scale store closings by declining major retailers like Macy’s
may have a negative domino effect. Rental rate growth prospects will remain highly fragmented by
location, asset quality, and property subsector. Favored asset classes are food/lifestyle oriented
centers and grocers in growth markets.
0.0%
0.5%
1.0%
1.5%
2.0%
2.5%
3.0%
3.5%
4.0%
Chan
ge in Rent per Sq
. Ft. p
er Year
U.S. ECONOMIC & MARKET COMMENTARY 2nd Quarter 2017
Quadrant Real Estate Advisors LLC 25 www.quadrantrea.com
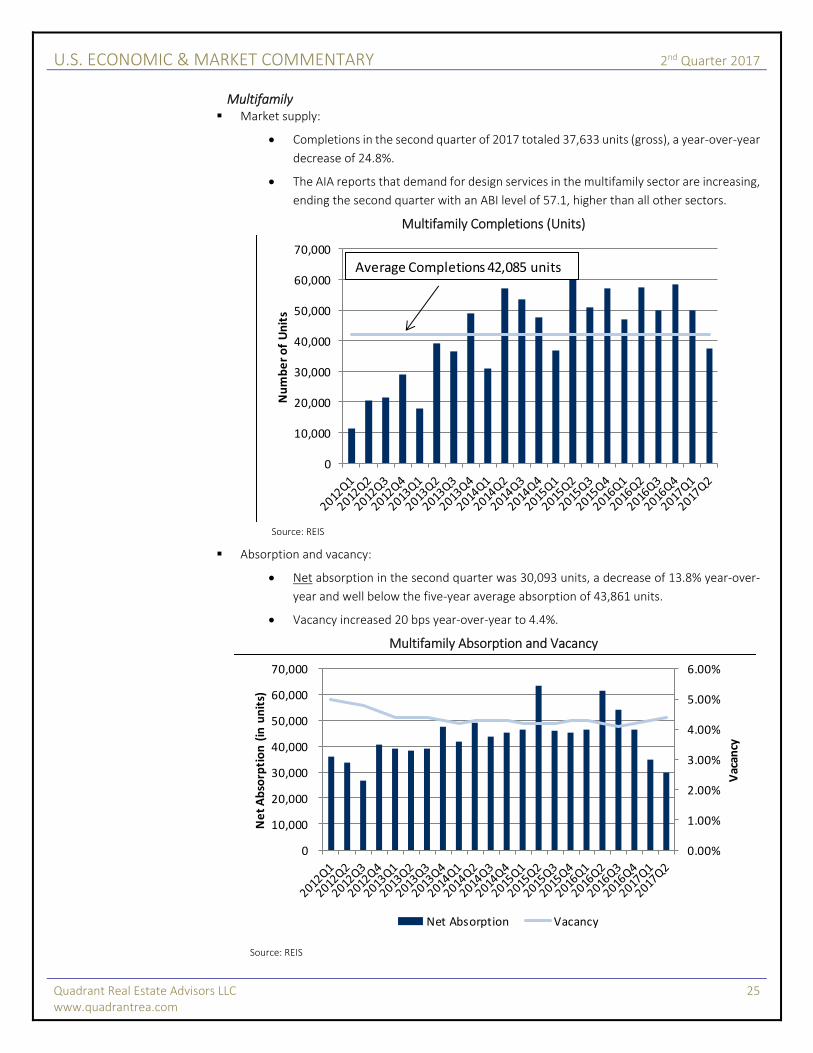
Multifamily Market supply:
Completions in the second quarter of 2017 totaled 37,633 units (gross), a year‐over‐year
decrease of 24.8%.
The AIA reports that demand for design services in the multifamily sector are increasing,
ending the second quarter with an ABI level of 57.1, higher than all other sectors.
Multifamily Completions (Units)
Source: REIS
Absorption and vacancy:
Net absorption in the second quarter was 30,093 units, a decrease of 13.8% year‐over‐
year and well below the five‐year average absorption of 43,861 units.
Vacancy increased 20 bps year‐over‐year to 4.4%.
Multifamily Absorption and Vacancy
Source: REIS
0
10,000
20,000
30,000
40,000
50,000
60,000
70,000
Number of Units
Average Completions 42,085 units
0.00%
1.00%
2.00%
3.00%
4.00%
5.00%
6.00%
0
10,000
20,000
30,000
40,000
50,000
60,000
70,000
Vacan
cy
Net Absorption (in units)
Net Absorption Vacancy
U.S. ECONOMIC & MARKET COMMENTARY 2nd Quarter 2017
Quadrant Real Estate Advisors LLC 26 www.quadrantrea.com
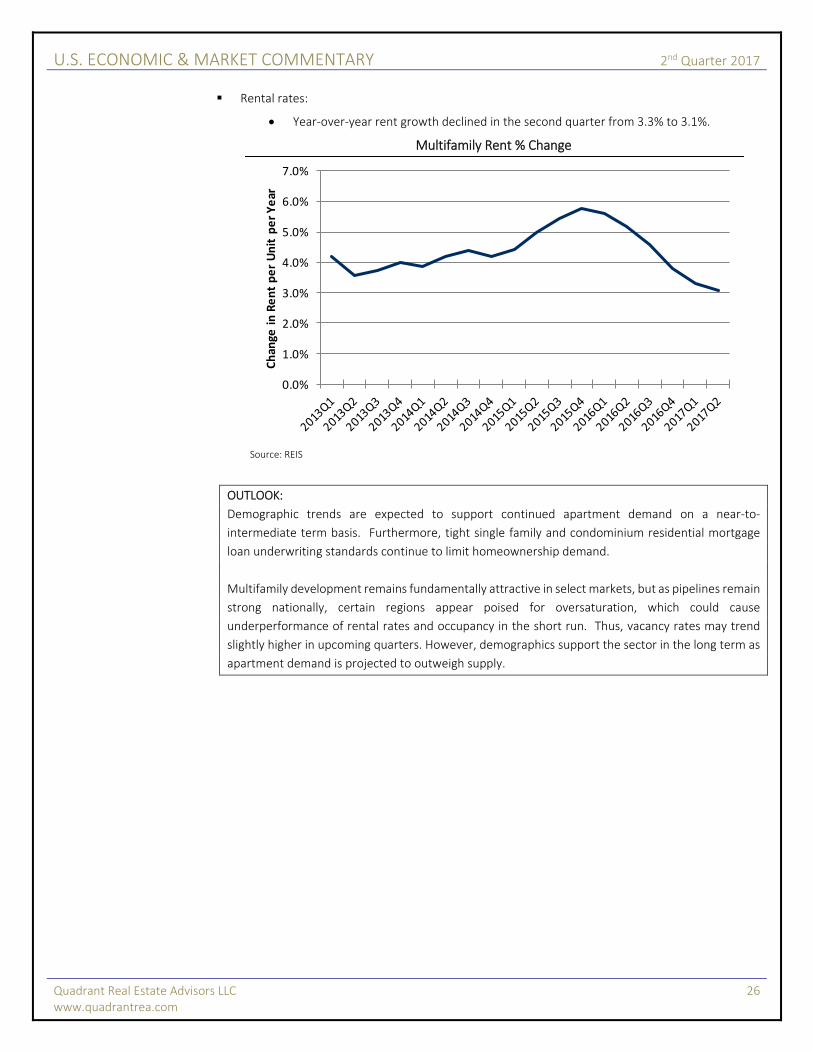
Rental rates:
Year‐over‐year rent growth declined in the second quarter from 3.3% to 3.1%.
Multifamily Rent % Change
Source: REIS
OUTLOOK:
Demographic trends are expected to support continued apartment demand on a near‐to‐
intermediate term basis. Furthermore, tight single family and condominium residential mortgage
loan underwriting standards continue to limit homeownership demand.
Multifamily development remains fundamentally attractive in select markets, but as pipelines remain
strong nationally, certain regions appear poised for oversaturation, which could cause
underperformance of rental rates and occupancy in the short run. Thus, vacancy rates may trend
slightly higher in upcoming quarters. However, demographics support the sector in the long term as
apartment demand is projected to outweigh supply.
0.0%
1.0%
2.0%
3.0%
4.0%
5.0%
6.0%
7.0%
Chan
ge in Rent per Unit per Year
U.S. ECONOMIC & MARKET COMMENTARY 2nd Quarter 2017
Quadrant Real Estate Advisors LLC 27 www.quadrantrea.com
Hotels Market demand:
Lodging demand remains robust.
According to STR the U.S. hotel industry’s occupancy in the second quarter increased
0.7% to 73.4%.
Market supply:
According to the June 2017 STR Pipeline Report, the total active hotel development
pipeline (by number of rooms) was up 11.6% year‐over‐year.
The In‐Construction metric was up 12.4% year‐over‐year.
The total active pipeline included projects in the In‐Construction, Final Planning, and
Planning stages, but it did not include projects in the Pre‐Planning stage.
Key metrics:
According to STR, RevPAR increased 2.8% to $94.73.
Similarly, ADR increased 2.1% to $129.12.
OUTLOOK:
Economic improvement and upward trending consumer sentiment are expected to support further
RevPAR, ADR, and occupancy improvement in the near‐term. However, RevPAR and ADR growth
may slow and fall negative as new supply comes on line. Given the hotel sector’s particularly high
correlation to the broad economic environment and business/consumer sentiment, downside risk is
primarily tied to the risk of slowing GDP growth and/or geopolitical threats that could affect both
business and leisure travel.
U.S. ECONOMIC & MARKET COMMENTARY 2nd Quarter 2017
Quadrant Real Estate Advisors LLC 28 www.quadrantrea.com
Contacts
United States:
Thomas Mattinson
Executive Vice President
+1 (1) 770 752 6714
U.K. & Europe:
Linda Nel
Senior Vice President
+1 (1) 770 752 6726
Important Disclosures
This report is for informational purposes only and does not constitute, form, nor should be construed
as an offer to sell or a solicitation of an offer to buy investments or any fund and does not constitute
any commitment or recommendation on the part of Quadrant Real Estate Advisors. An investment
offering will be made only through a confidential private offering memorandum subject at all time to
revision and completion.
The information contained herein is derived from various sources which Quadrant believes but does
not guarantee to be accurate as of the date hereof. Neither Quadrant nor any of its affiliates nor any
other person makes any representation or warranty, express or implied, as to the accuracy or
completeness of the information contained in this newsletter and nothing contained herein shall be
relied upon or construed as a promise or reorientation of past or future performance.