trends in lung cancer morbidity and mortality€¦ · cause-of-death titles and corresponding...
TRANSCRIPT

Trends in Lung Cancer Morbidity and Mortality
American Lung Association Epidemiology and Statistics Unit
Research and Program Services Division November 2014

Table of Contents Trends in Lung Cancer Morbidity and Mortality Introduction Lung Cancer Mortality Trends, 1979-2012 Lung Cancer Incidence Trends, 1973-2011 Lung Cancer Trends in Hospital Discharges, 1979-2010 Lung Cancer Types and Stage Distribution, 2001-2010 Lung Cancer Trends in Survival Rates, 1960-2010 Smoking-Attributable Lung Cancer Deaths, 2005-2009 Lifetime Risk of Being Diagnosed with and Dying from Lung Cancer, 2009-2011 International Lung Cancer Data, 2012 Summary Glossary Sources List of Tables and Figures Table 1: Number of Deaths by Race and Sex, 1979-1998, 1999-2012 Table 2: Age-Adjusted Mortality Rates by Race and Sex, 1979-1998, 1999-2012 Figure 1: Age-Adjusted Mortality Rates by Sex and Site, 2007-2011 Figure 2: Age-Adjusted Mortality Rates by Race/Ethnicity and Sex, 2007-2011 Table 3: Number of Deaths by Race/Ethnicity, Sex and 10-Year Age Groups, 2005-2012 Table 4: Age-Adjusted and Age-Specific Mortality Rates by Race/Ethnicity and Sex, 2005-2012 Table 5: Age-Adjusted Mortality Rates by State and Sex, 2003-2012 Table 6: Age-Adjusted Mortality Rates by State and Race, 2003-2012 Table 7: Prevalence Counts by Race, Sex and Years Since Diagnosis, 2006-2011 Table 8: Lung Cancer Age-Adjusted Incidence Rates by Site, Race and Sex, 1975-2011 Figure 3: Lung Cancer Age-Adjusted Incidence Rates by Sex, 1975-2011 Table 9: Mesothelioma Age-Adjusted Incidence Rates by Site, Race and Sex, 1977-2011 Table 10: Oral Cavity and Pharynx Age-Adjusted Incidence Rates by Site, Race and Sex, 1975-2011 Table 11: Larynx Age-Adjusted Incidence Rates by Site, Race and Sex, 1975-2011 Table 12: Age-Adjusted Incidence Rates by Race/Ethnicity and Sex, 2007-2011 Table 13: Incidence Counts and Age-Adjusted Rates by State and Sex, 2011 Table 14: Number of First-Listed Hospital Discharges and Rate Per 10,000 Population by Age, 1979-2010 Table 15: Number of First-Listed Hospital Discharges and Rate Per 10,000 Population by Race, 1988-
2010 Figure 4: Stage Distribution (%) at Time of Diagnosis by Type, 2004-2010 Table 16: Relative Five-year Survival Rates by Race and Site, Cases Diagnosed in 1960-1963, 1970-2010 Table 17: Five-Year Survival Rates (%) by Type, Race and Sex, 1975-2010 Figure 5: Five-Year Survival Rates (%) by Type and Stage, 2004-2010 Table 18: Lifetime Risk (%) of Being Diagnosed With or Dying From Lung Cancer, by Race and Sex, 2009-
2011

IntroductionI
The incidence and mortality attributed to lung cancer rose steadily since the 1930’s, primarily due to the popularity of cigarette smoking pre and post World Wars I and II, before plateauing and possibly starting to decrease in recent years. Lung cancer has been the leading cause of cancer deaths among men since the early 1950’s and, in 1987, surpassed breast cancer to become the leading cause of cancer deaths among women in the United States. Lung cancer was estimated to cause 159,260 deaths in 2014, accounting for 27 percent of all cancer deaths.1 The following report delineates data available from national surveys on lung cancer mortality, prevalence, incidence, hospitalizations and survival rates.
Mortality Trends
Beginning with 1999 mortality data, the population standard used for calculating age-adjusted death rates was changed from the 1940 population to the 2000 population.II In addition, starting with 1999 data, the tenth revision of international classification of diseases (ICD-10) replaced ninth revision (ICD-9) in coding and classifying mortality data from death certificates.III Due to decennial revisions of the International Classification of Diseases (ICD) coding system and the change in age-adjusted standard population, the number and rate of lung cancer deaths for 1999–2012 are not directly comparable to those reported between 1978 and 1998.
Lung cancer causes more deaths than the next three leading causes of cancer death combined (colorectal, breast and pancreatic). Death rate trends differ between the sexes. Death rates in men have continued to decline since 1991, and after several decades of continuous increases, have plateaued among females.2
Table 1 documents the number of deaths due to lung cancer by race and sex between 1979 and 2012. The number of deaths due to lung cancer has increased approximately 3.5 percent from 152,156 in 1999 to 157,499 in 2012. In 2012, the greatest number of lung cancer deaths were among white males and the fewest among black females.3
Table 2 displays the age-adjusted death rate per 100,000 population by race and sex for the same years. In 2012, the age-adjusted death rate was 44.9 per 100,000 persons. The age-adjusted death rate was 54.1 percent greater in males (56.1 per 100,000) than in females (36.4 per 100,000). The age-adjusted death rate in the black population (48.3 per 100,000) was 5.9 percent greater than the
I Unless otherwise noted, terms such as higher or less are not intended to indicate statistical significance. II This change had three important outcomes: (i) provided age-adjusted rates that are less divergent from crude rates (ii) ensured that all government agencies use the same standard and (iii) corrected the public perception that age-adjustment to the 1940 population provided out-of-date statistics. Use of the 2000 population standard placed more weight on death rates at older ages and less weight on death rates at younger ages. Because most lung disease rates increase with age, death rates using the new standard generally were higher than those using the old standard. III The ICD is periodically revised to reflect changes in the medical field. This change has had several consequences: (i) new cause-of-death titles and corresponding cause-of-death codes, i.e. ICD-10 has alphanumeric categories rather than numeric categories, (ii) breaks in comparability of cause-of-death statistics, and (iii) restructuring of the leading causes of death. In order to assess the net effect of the new revision on death statistics, a comparability ratio is derived. The comparability ratio is calculated by dividing the number of deaths for a selected cause of death classified by the new revision by the number of deaths classified to the most nearly comparable cause of death by the previous revision. A comparability ratio of 1 denotes no change between revisions; a ratio of less than 1 signifies a decrease and a ratio of greater than 1 symbolizes an increase in deaths. The comparability ratio for lung cancer is 0.9837, indicating a 2 percent decrease in assignments of deaths due to lung cancer when using ICD-10.
Trends In Lung Cancer 1

rate in the white population (45.6 per 100,000). The age-adjusted death rate in black males (68.6 per 100,000) was 22.5 percent higher than that of white males (56.0 per 100,000). In contrast, white women had an age-adjusted death rate that was 8.4 percent higher than black women (37.6 versus 34.7 per 100,000, respectively). Overall, age-adjusted death rates have decreased by 19.8% between 1999 and 2012.4
Figure 1 depicts the 2007-2011 age-adjusted death rates for selected cancer sites by sex.
Figure 2 depicts age-adjusted death rates by race/ethnicity and sex for 2007-2011. Age-adjusted lung cancer death rates among Hispanics, American Indians/Alaska Natives and Asians/Pacific Islanders were considerably lower than rates among whites and blacks.5
Tables 3 and 4 show the number of deaths and the age-specific death rates due to lung cancer by race/ethnicity and sex for 10-year age groups from 2005 through 2012. Deaths attributed to lung cancer increase with age and are greatest among those over 65 years of age. In 2012, age-specific death rates were highest in non-Hispanic black males for all age groups. Age-specific death rates were lower among non-Hispanic black females compared to non-Hispanic white females for those aged 85 and older, 75-84, and 65-74, but similar for those aged 55-64, 45-54, and 35-44.6
Table 5 delineates state-specific age-adjusted lung cancer death rates by sex from 2003 to 2012. Kentucky experienced the highest lung cancer death rates overall (68.8 per 100,000), among males (110.7 per 100,000) and among females (55.3 per 100,000). Utah had the lowest lung cancer death rate overall (20.3 per 100,000), among males (26.5 per 100,000) and among females (15.3 per 100,000).7
Table 6 displays state-specific age-adjusted lung cancer death rates by race from 1999 to 2008. Among whites, the highest death rate was reported in Kentucky (74.0 per 100,000) while the lowest was reported in Utah (23.1 per 100,000). When examining the death rate in blacks, the small number of deaths in some states makes the corresponding data unreliable. Among the states with more than 20 deaths, the highest death rate in blacks was reported in Kentucky (91.4 per 100,000) while the lowest was reported in New York (37.2 per 100,000).8
Morbidity Trends
The American Cancer Society estimates that there will be 224,210 new cases of lung cancer in 2014. These new cases will account for almost 14 percent of all cancer diagnoses.9 There are two national cancer registries that collect data on cancer prevalence and incidence: the Surveillance, Epidemiology and End Results (SEER) program of the National Cancer Institute and the National Program of Cancer Registries (NPCR) program of the Centers for Disease Control and Prevention.
Table 7 presents lung cancer prevalence counts by race, sex and years since diagnosis. In 2011, 402,326 Americans were living with lung cancer. The majority (57%) of lung cancer patients living have been diagnosed within the last 5 years.10
Tables 8 through 11 delineate age-adjusted cancer incidence rates for respiratory cancers by site, sex and race between 1975 and 2011. Lung cancer incidence increased by 6.3 percent from 52.2 per 100,000 in 1975 to 55.5 per 100,000 in 2011. The lung cancer incidence rate peaked at 69.6 per 100,000 in 1992, a 33.3% increase since 1975, and has decreased 20.3 percent since this high point (Figure 3).
Trends In Lung Cancer 2

The2011incidenceratesforlungcancerinmenandwomenwere64.8per100,000and48.6per100,000,respectively.Overthepast37years,thelungcancerage‐adjustedincidenceratehasdecreased27.5percentinmalescomparedtoanincreaseof98.4percentinfemales.Ratespeakedformenat102.1per100,000in1984,andforwomenat52.8per100,000in1998.Thesepeakswere14.2percentand53.6percenthigherthantheratesin1975,andcurrentratesare36.5percentand8.0percentlower,respectively.11
Between1975and2011,theage‐adjustedlungcancerincidencerateinbothwhiteandblackmalesdecreasedasimilaramountat27.2percentand25.8percent,respectively.However,the2011incidencerateinblackmenwas32.5percenthigherthanthatofwhitemen(85.3vs.64.4per100,000,respectively).Lungcancerinbothwhiteandblackwomenhasmorethandoubledsince1975,increasingby103.6percentand106.5percent,respectively.Unlikemales,theincidenceratesoflungcancerinwhitewomen(50.7per100,000)andblackwomen(51.0per100,000)weresimilarin2011.12
Malignantmesotheliomaisanuncommon,butnolongerrare,cancerthatisdifficulttodiagnoseandpoorlyresponsivetotherapy.Malignantmesotheliomaisthemostseriousofallasbestos‐relateddiseases.In2011,theage‐adjustedmesotheliomacancerincidenceratewas1.0per100,000persons(Table9).Althoughtheincidencerateremainslow,ithasincreased67percentbetween1977and2011.13Themajorityofmesotheliomacasesareseeninmalesthathavehadoccupationalexposuretoasbestos.
Age‐adjustedoralcavityandpharynxincidencerateshavedecreasedinbothwhitesandblacksbetween1975and2011(Table10).In2011,theage‐adjustedoralcancerincidenceratewas11.2per100,000personsoverall,11.8per100,000personsinwhitesand9.0per100,000inblacks.14
Theoverallincidencerateforcancerofthelarynxhasdecreased42.0percentbetween1975and2011(Table11).The2011incidencerateinblackfemales(1.3per100,000)was18.2percenthigherthanwhitefemales(1.1per100,000).Blackmaleshadanincidenceratethatwas59.6percenthigherthanthatofwhitemales(8.3vs.5.2per100,000,respectively).15
Table12displayslungcancerage‐adjustedincidenceratesbyrace,ethnicityandsexfor2007through2011.Overthis5‐yearperiod,Hispanics,Asians/PacificIslanders,andAmericanIndians/AlaskaNativeswerelesslikelytodeveloplungcancerthannon‐Hispanicblacksorwhites.16
Table13delineatesstate‐specificlungcancercountsandratesbysex.In2011,Kentuckyhadthehighestage‐adjustedincidencerateinmales(112.2per100,000)andinfemales(79.3per100,000).Utahhadthelowestat34.5per100,000inmalesand25.0per100,000infemales.17Theseratesareconsistentwithstate‐specificsmokingprevalencerates.18
Hospitalization Trends
Table11delineatesage‐specifichospitaldischargedataderivedfromtheNationalHospitalDischargeSurvey.In2010,thetotalnumberofdischargesreportedforlungcancerwas177,000.Thisrepresentsadischargerateof5.8per10,000andwasa40.2percentdecreasefromthedischargerateof9.7per10,000reportedin1988.Thegreatestnumberofdischargesoccurredinthepopulationoverage65.19
Trends in Lung Cancer 3

Table 12 displays the race-specific number of discharges and discharge rate between 1988 and 2010. The 2010 discharge rate for lung cancer was slightly higher for whites (5.5 per 10,000) than blacks (5.2 per 10,000). These rates should be interpreted with caution due to the large percentage of discharges (14.4 percent) for which race was not reported.20
Lung Cancer Types
There are two major types of lung cancer: small cell lung cancer (SCLC) and non-small cell lung cancer (NSCLC). Sometimes a lung cancer may have characteristics of both types, which is known as mixed small cell/large cell carcinoma.
Small cell lung cancer is less common, accounting for approximately 14 percent of all lung cancer cases.21 This type of lung cancer grows more quickly and is more likely to spread to other organs in the body. Small cell lung cancer often starts in the bronchi and towards the center of the lungs. Smoking is the main cause.
Non-small cell lung cancer accounts for the remaining 86 percent of lung cancer cases.22 It generally grows and spreads more slowly than small cell lung cancer. There are three main types of non-small cell lung cancer. They are named for the type of cells in which the cancer develops: squamous cell carcinoma, adenocarcinoma, and large cell carcinoma. Adenocarcinoma is the most frequent form of lung cancer in the United States.
Figure 4 delineates the stage distribution for the most common lung cancer types. Staging is used to determine whether the cancer has spread and, if so, to what parts of the body. Stages include localized (within lungs), regional (spread to lymph nodes) and distant (spread to other organs). Between 2004 and 2010, 72 percent of all small cell lung cancer cases were diagnosed during the distant stage and only 5 percent were diagnosed at the localized stage. This compares to 55 percent of non-small cell lung cancer diagnosed in the distant stage and 18 percent of cases diagnosed in the localized stage.23
Trends in Survival Rates
Table 13 depicts trends in survival rates for lung and other types of cancer by race from 1960 through 2010 (except 1964–1969). Survival rates for lung cancer tend to be much lower than other common cancers. The expected five-year survival rate for all patients in whom lung cancer is diagnosed is 17.8 percent compared to 65.4 percent for colon, 90.5 percent for breast and 99.6 percent for prostate cancer. Survival rates for all cancers listed have experienced significant increases since 1975–1977.24
Compared to whites, blacks experienced lower five-year survival rates for each type of cancer listed. The five-year survival rate for lung cancer in blacks during the period spanning 2004–2010 was 14.9 percent. The survival rate for lung cancer in Whites was better at 18.2 percent.25
Table 14 displays trends in the five-year survival rates by lung cancer type, race and sex. Survival rates for non-small cell lung cancer are greater than those seen for small cell lung cancer. Between 2004 and 2010 the survival rate for non-small cell lung cancer was 21.7 percent compared to 6.6 percent for small cell lung cancer.26
The prognosis (outlook for survival) for a patient with lung cancer depends, to a large extent, on the cancer's stage. Figure 5 displays the five-year survival rates for all stages by type of lung cancer.
Trends In Lung Cancer 4

Theaveragefive‐yearsurvivalratefrom2004through2010forlocalizedlungcancerwas54.0percentcomparedto16.8percentoveralland4.0percentforadistanttumor.Unfortunately,only15percentofpeoplewithlungcancerarediagnosedatanearly,localizedstage.27
Smoking‐Attributable Lung Cancer Deaths
ThemostimportantcauseoflungcancerintheUnitedStatesiscigarettesmoking.Itisestimatedthat80percentoflungcancerdeathsinwomenand90percentinmen,respectively,arecausedbysmoking.Comparedtonon‐smokers,menwhosmokeare23timesmorelikelytodeveloplungcancer,whilewomenare13timesmorelikely.Theriskincreaseswiththedurationofsmokingandamountsmokedperday.28Between2005and2009,anaverageof130,659Americans(74,300malesand56,359females)diedofsmoking‐attributablelungcancerannually.29
Lifetime Risk of Being Diagnosed With and Dying From Lung Cancer
UsingdatafromtheSEERregistry,theNationalCancerInstitutehascalculatedthelifetimeriskofbeingdiagnosedwithlungcancer,aswellasthelifetimeriskofdyingfromlungcancer.Thisriskiscalculatedfortheentirepopulationandincludessmokersandnon‐smokers.ThesedataaredisplayedinTable18byraceandsexfor2009through2011.Overall,7.43percentofmalesand6.47percentoffemaleswillbediagnosedwithlungcanceratsomepointduringtheirlives.Thelifetimeriskofbeingdiagnosedwithanddyingfromlungcancerishighestinmales.30
International Lung Cancer Data
Lungcanceristhemostcommoncancerandcancercauseofdeathintheworld,accountingfor1.8millionnewcases(12.9%ofallnewcancercases)and1.6milliondeaths(19.4%ofallcancerdeaths)in2012.31Lungcancerdeathratesvarybycountryandmimicthedevelopmentofthesmokingepidemicwithinthatcountry,suchthatmenhavehigherratesearlier,butwomentakeonmoreofthelungcancerburdenastheybeginsmokingmore.
Summary
LungcanceristheleadingcauseofcancermortalityinbothmenandwomenintheUnitedStates.Anestimated224,210newcasesareexpectedtobediagnosedin2014,accountingforalmost14percentofallcancerdiagnoses.32Ithasbeenshownthatrisesanddeclinesinlungcancerincidenceandmortalityratesparallelpasttrendsofcigarettesmoking.Ithasbeenestimatedthatactivesmokingisresponsibleforcloseto90percentoflungcancercases;radoncauses10percent,occupationalexposurestocarcinogensaccountforapproximately9to15percentandoutdoorairpollution1to2percent.Becauseoftheinteractionsbetweenexposures,thecombinedattributableriskforlungcancercanexceed100percent.33Five‐yearsurvivalratesarelowcomparedtoothercommoncancersat16.8percent.34
Trends in Lung Cancer 5

Glossary
Mortality is the term used to refer to deaths. Mortality rates are per 100,000 population and are usually age-adjusted to the 2000 U.S. standard population.
Age-Adjusted Mortality Rate is a figure that is statistically adjusted to remove the distorting effect of age when comparing populations with different age structures. Most rates are age-adjusted to the 2000 U.S. standard population.
Morbidity is defined as illness and is the term used to refer to measures of illness, such as hospitalizations or emergency room visits.
Prevalence is the number of existing cases of a particular condition, disease or other occurrence (e.g. persons smoking) at a given time. Prevalence rates are the number of existing cases in a particular population quantity at a given time (e.g. 10 cases per 100,000). Chronic disease prevalence is reported per 1,000 population.
Incidence is the number of new cases occurring in a population during a particular period of time (e.g. 100 cases of tuberculosis from 1998 to 2002). Incidence rates are reported per 100 or 100,000 population.
Trends In Lung Cancer 6

Sources:
1 American Cancer Society. Cancer Facts and Figures, 2014. 2 Centers for Disease Control and Prevention, National Center for Health Statistics. CDC WONDER On-line Database, compiled from Compressed Mortality File 1999-2012 Series 20 No. 2R, 2014. 3 Ibid. 4 Ibid. 5 U.S. National Institutes of Health. National Cancer Institute: SEER Cancer Statistics Review, 1973-2011. 6 Centers for Disease Control and Prevention. National Center for Health Statistics. CDC WONDER On-line Database, compiled from Compressed Mortality File 1999-2012 Series 20 No. 2R, 2014. 7 Ibid. 8 Ibid. 9 American Cancer Society. Cancer Facts and Figures, 2014. 10 U.S. National Institutes of Health. National Cancer Institute: SEER Cancer Statistics Review, 1973-2011. 11 Ibid. 12 Ibid. 13 Ibid. 14 Ibid. 15 Ibid. 16 Ibid. 17 U.S. National Institutes of Health. National Cancer Institute: State Cancer Profiles web tool, accessed October 6, 2014. 18 Centers for Disease Control and Prevention. Behavioral Risk Factor Surveillance System. 2013 raw data analyzed by American Lung Association using SPSS and SUDAAN software. 19 National Center for Health Statistics: National Hospital Discharge Survey. 2010 raw data analyzed by American Lung Association using SPSS software. 20 Ibid. 21 U.S. National Institutes of Health. National Cancer Institute: SEER Cancer Statistics Review, 1973-2011. 22 Ibid. 23 Ibid. 24 Ibid. 25 Ibid. 26 Ibid. 27 Ibid. 28 U.S. Department of Health and Human Services. The Health Consequences of Smoking: A Report of the Surgeon General. 2004. 29 U.S. Department of Health and Human Services. The Health Consequences of Smoking—50 Years of Progress: A Report of the Surgeon General. 2014. 30 U.S. National Institutes of Health. National Cancer Institute: SEER Cancer Statistics Review, 1973-2011. 31 World Health Organization. International Agency for Research on Cancer. GLOBOCAN 2012: Estimated Cancer Incidence, Mortality and Prevalence Worldwide in 2012. Lung Cancer. Accessed November 10, 2014. 32 American Cancer Society. Cancer Facts and Figures, 2014. 33 Alberg AJ and Samet J. Epidemiology of Lung Cancer. Chest, January 2003; 123:21S–49S. 34 U.S. National Institutes of Health. National Cancer Institute: SEER Cancer Statistics Review, 1973-2011.
Trends In Lung Cancer 7

Year Total Male Female Total Male Female Total Male Female Total Male Female
19792 98,541 72,803 25,648 87,532 64,338 23,194 11,009 8,465 2,454 10,247 7,991 2,256
1980 103,844 75,535 28,309 92,182 66,651 25,531 11,662 8,884 2,778 10,957 8,382 2,575
1981 106,561 76,764 29,797 94,441 67,525 26,916 12,120 9,239 2,881 11,372 8,697 2,675
1982 111,393 79,228 32,165 98,780 69,686 29,094 12,613 9,542 3,071 11,857 9,003 2,854
1983 115,023 80,338 34,685 101,857 70,598 31,259 13,166 9,740 3,426 12,282 9,117 3,165
1984 118,730 82,491 36,239 105,027 72,239 32,788 13,703 10,252 3,451 12,708 9,569 3,139
1985 122,566 83,854 38,702 108,529 73,519 35,010 14,037 10,335 3,692 13,009 9,615 3,394
1986 125,522 85,057 40,465 111,049 74,517 36,532 14,473 10,540 3,933 13,354 9,773 3,581
1987 130,009 87,261 42,748 114,888 76,398 38,490 15,121 10,863 4,258 13,886 10,065 3,821
1988 133,284 88,059 45,225 117,826 77,063 40,763 15,458 10,996 4,462 14,131 10,112 4,019
1989 137,150 89,052 48,098 121,023 77,659 43,364 16,127 11,393 4,734 14,703 10,457 4,246
1990 141,285 91,091 50,194 124,650 79,488 45,162 16,635 11,603 5,032 15,144 10,632 4,512
1991 143,758 91,690 52,068 126,872 80,028 46,844 16,886 11,662 5,224 15,201 10,545 4,656
1992 145,943 91,405 54,538 128,719 79,728 48,991 17,224 11,677 5,547 15,472 10,530 4,942
1993 148,855 92,564 56,291 131,337 80,620 50,717 17,518 11,944 5,574 15,641 10,733 4,908
1994 149,482 91,893 57,589 131,871 80,096 51,775 17,611 11,797 5,814 15,670 10,555 5,115
1995 151,200 91,856 59,344 133,366 80,088 53278 17,834 11,768 6,066 15,790 10,537 5,253
1996 152,015 91,620 60,395 134,055 79,809 54246 17,960 11,811 6,149 15,835 10,463 5,372
1997 153,310 91,352 61,958 135,060 79,624 55436 18,250 11,728 6,522 16,014 10,336 5,678
1998 154,561 91,447 63,114 136,026 79,649 56377 18,535 11,798 6,737 16,105 10,288 5,817
19993152,156 89,453 62,703 133,752 77,846 55,906 18,404 11,607 6,797 15,963 10,135 5,828
2000 155,521 90,469 65,052 136,912 78,747 58,165 18,609 11,722 6,887 16,066 10,153 5,913
2001 156,058 90,426 65,632 137,274 78,665 58,609 18,784 11,761 7,023 16,019 10,131 5,888
2002 157,713 90,171 67,542 138,661 78,465 60,196 19,052 11,706 7,346 16,316 10,075 6,241
2003 158,086 89,964 68,122 138,743 78,215 60,528 19,343 11,749 7,594 16,372 9,988 6,384
2004 158,091 89,630 68,461 138,425 77,730 60,695 19,666 11,900 7,766 16,472 9,995 6,477
2005 159,292 90,187 69,105 139,442 78,379 61,063 19,850 11,808 8,042 16,567 9,887 6,680
2006 158,664 89,279 69,385 138,814 77,476 61,338 19,850 11,803 8,047 16,493 9,823 6,670
2007 158,760 88,372 70,388 138,730 76,502 62,228 20,030 11,870 8,160 16,494 9,839 6,655
2008 158,656 88,586 70,070 138,715 76,761 61,954 19,941 11,825 8,116 16,250 9,638 6,612
2009 158,158 87,741 70,417 138,111 75,906 62,205 20,047 11,835 8,212 16,334 9,695 6,639
2010 158,318 87,740 70,578 137,698 75,675 62,023 20,620 12,065 8,555 16,688 9,793 6,895
2011 157,017 86,774 70,243 136,347 74,817 51,530 20,670 11,957 8,713 16,594 9,646 6,948
2012 157,499 86,740 70,759 136,465 74,547 61,918 21,034 12,193 8,841 16,792 9,779 7,013
Notes:(1) All races other than white. (2) International Classification Of Diseases, 9th Revision (ICD-9) Code 162. (3) International Classification Of Diseases, 10th Revision (ICD-10) Code C33-C34.
Source: Centers for Disease Control and Prevention. National Center for Health Statistics. WONDER Online Database, compiled from Compressed Mortality File 1999-2012 Series 20 No. 2R, 2014.
Table 1: Number of Deaths by Race and Sex, 1979-1998, 1999-2012
All Races
All Other Races1
Total BlackWhite
Trends In Lung Cancer 8

Year Total Male Female Total Male Female Total Male Female Total Male Female
1979433.6 55.7 16.3 33.0 54.3 16.4 38.4 67.4 15.7 41.6 74.2 16.6
1980 34.8 56.9 17.6 34.2 55.5 17.6 39.8 69.2 17.1 43.9 77.2 18.5
1981 35.1 56.9 18.2 34.4 55.3 18.2 40.2 70.0 17.2 44.7 79.0 18.9
1982 35.9 57.6 19.2 35.3 56.0 19.4 40.6 70.6 17.6 45.6 80.4 19.5
1983 36.4 57.3 20.3 35.8 55.7 20.5 41.3 70.6 19.1 46.5 80.4 21.2
1984 37.0 58.0 20.8 36.4 56.2 21.0 41.9 72.5 18.9 47.2 83.1 20.7
1985 37.6 58.1 21.8 37.0 56.4 22.1 41.9 71.6 19.5 47.6 82.6 21.8
1986 37.8 57.9 22.3 37.2 56.2 22.5 42.1 71.4 20.2 48.0 82.8 22.6
1987 38.5 58.5 23.1 37.9 56.8 23.3 42.8 71.9 21.3 49.0 84.0 23.7
1988 38.9 58.2 24.0 38.3 56.5 24.3 42.5 71.0 21.6 48.9 83.1 24.3
1989 39.3 57.9 24.9 38.6 56.0 25.3 43.4 72.3 22.1 50.2 85.3 25.0
1990 39.9 58.5 25.6 39.3 56.6 25.9 43.9 72.3 23.2 51.3 86.2 26.4
1991 39.6 57.5 25.8 39.1 55.8 26.1 42.7 70.0 22.8 49.9 83.2 26.1
1992 39.3 56.0 26.4 38.8 54.4 26.7 42.4 68.1 23.6 49.8 81.4 27.3
1993 39.3 55.7 26.6 38.9 54.0 27.0 41.7 67.7 22.9 48.9 80.8 26.2
1994 38.7 54.2 26.6 38.4 52.7 27.1 40.7 64.9 23.1 47.9 77.6 26.7
1995 38.3 53.0 26.9 38.0 51.6 27.4 40.1 63.0 23.5 47.3 75.8 26.9
1996 37.8 51.8 26.8 37.6 50.5 27.5 40.7 64.8 23.3 46.2 73.2 26.5
1997 37.4 50.5 27.0 37.1 49.3 27.5 39.4 61.4 23.8 45.3 70.6 27.4
1998 37.0 49.5 27.0 36.8 48.4 27.5 39.2 56.8 23.6 44.6 68.5 27.5
1999556.0 77.0 40.8 56.0 75.8 41.5 55.7 84.9 35.4 65.2 101.8 . 40.5
2000 56.5 76.6 41.8 56.6 75.5 42.8 54.8 83.4 34.8 64.1 99.5 40.2
2001 55.3 75.2 41.0 55.6 74.2 42.1 52.8 81.1 33.8 62.5 99.1 38.7
2002 54.9 73.2 41.6 55.3 72.5 42.6 51.5 77.0 34.1 61.9 95.0 40.1
2003 54.1 71.7 41.3 54.5 71.1 42.3 50.8 75.1 34.2 60.8 92.4 40.2
2004 53.2 70.1 40.9 53.6 69.4 41.9 49.9 73.2 34.0 59.8 90.0 39.9
2005 52.6 69.0 40.5 53.1 68.7 41.5 48.6 69.9 33.9 58.4 86.4 40.0
2006 51.5 67.0 40.0 52.1 66.8 41.1 47.0 67.5 32.8 56.8 83.7 39.0
2007 50.6 65.1 40.0 51.2 64.8 41.2 46.1 66.3 32.4 55.6 82.2 38.1
2008 49.5 63.6 39.0 50.2 63.4 40.2 44.6 63.9 31.3 53.4 78.5 36.9
2009 48.5 61.8 38.5 49.1 61.7 39.8 42.9 61.3 30.5 52.0 76.9 35.9
2010 47.6 60.3 38.1 48.3 60.1 39.3 43.0 60.3 31.0 51.4 73.7 36.5
2011 46.0 57.7 37.1 46.7 57.7 38.3 41.2 57.0 30.1 49.2 69.6 35.4
2012 44.9 56.1 36.4 45.6 56.0 37.6 40.3 56.0 29.4 48.3 68.6 34.7
Notes:
(4) International Classification of Diseases, 9th Revision (ICD-9) Code 162. (5) International Classification of Diseases, 10th Revision (ICD-10) Code C33-C34.
(2) Rates for 1999-2011 are per 100,000 persons and age-adjusted to the 2000 U.S. standard population. (1) Rates for 1979-1998 are per 100,000 persons and age-adjusted to the 1940 U.S. standard population.
(3) All races other than white.
Source: Centers for Disease Control and Prevention. National Center for Health Statistics. WONDER Online Database, compiled from Compressed Mortality File 1999-2012 Series 20 No. 2R, 2014.
Table 2: Age-Adjusted Mortality Rates1,2 by Race And Sex, 1979-1998, 1999-2012
BlackAll Races White Total
All Other Races2
Trends In Lung Cancer 9

All Sites Colon/Rectum Lung Breast ProstateMale 211.6 19.1 61.6 0.3 22.3Female 147.4 13.5 38.5 22.2
0
50
100
150
200
250
Figure 1: Age‐Adjusted Mortality Rates1 by Sex and Site, 2007‐2011
Age‐Ad
justed
Death Rate pe
r 100,000
Pop
ulation
Source: National Cancer Institute. SEER Cancer Statistics Review, 1975‐2011
Notes:(1) Rates are per 100,000 persons, age‐adjusted to the 2000 U.S. standard population and coded by ICD‐10.‐‐‐ Number of deaths is too small to calculate a rate.
‐‐‐
Trends In Lung Cancer10

White Black Hispanic Asian/Pacific Isl Amer Ind/AK NatMale 61.4 75.7 30.5 34.7 41.0Female 39.8 36.5 14.0 18.4 26.1
0.0
10.0
20.0
30.0
40.0
50.0
60.0
70.0
80.0
Figure 2: Lung Cancer Age‐Adjusted Mortality Rates1 by Race/Ethnicity2and Sex, 2007‐2011
Age‐Ad
justed
Death Rate pe
r 100,000
Pop
ulation
Source: National Cancer Institute. SEER Cancer Statistics Review, 1975‐20011
Notes:(1) Rates are per 100,000 persons, age‐adjusted to the 2000 U.S. standard population and coded by ICD‐10.(2) Hispanics are not mutually exclusive from whites, blacks, Asian/Pacific Islanders and American Indians/Alaska Natives.
Trends In Lung Cancer11

Total Male Female Total Male Female Total Male Female Total Male Female
2012
All Ages 157,499 86,740 70,759 5,231 3,139 2,092 131,045 71,288 59,757 16,640 9,683 6,957
<1 0 0 0 0 0 0 0 0 0 0 0 0
1-14 6 3 3 2 1 1 4 2 2 0 0 0
15-24 25 18 7 5 4 1 15 9 6 5 5 025-34 174 101 73 29 16 13 103 55 48 30 23 7
35-44 1,174 585 589 83 41 42 823 402 421 185 98 87
45-54 11,110 6,038 5,072 428 253 175 8,413 4,490 3,923 1,867 1,082 785
55-64 31,460 18,283 13,177 1,009 622 387 25,057 14,344 10,713 4,470 2,764 1,706
65-74 49,422 28,012 21,410 1,510 978 532 41,522 23,229 18,293 5,078 3,032 2,046
75-84 45,070 24,402 20,668 1,541 924 617 38,488 20,669 17,819 3,768 2,085 1,683
85+ 19,055 9,297 9,758 624 300 324 16,618 8,088 8,530 1,237 594 643
2011
All Ages 157,017 86,774 70,243 5,093 3,160 1,933 131,219 71,631 59,588 16,452 9,566 6,886
<1 3 1 2 1 1 0 0 0 0 2 0 2
1-14 3 2 1 1 1 0 2 1 1 0 0 0
15-24 30 17 13 7 3 4 18 10 8 4 4 0
25-34 122 62 60 20 13 7 63 29 34 27 13 14
35-44 1,259 632 627 88 53 35 910 447 463 173 85 88
45-54 11,494 6,195 5,299 400 238 162 8,850 4,683 4,167 1,904 1,088 816
55-64 31,773 18,824 12,949 986 653 333 25,410 14,866 10,544 4,507 2,807 1,700
65-74 48,178 27,535 20,643 1,470 945 525 40,495 22,793 17,702 4,970 3,053 1,917
75-84 45,579 24,653 20,926 1,481 899 582 39,265 21,101 18,164 3,639 1,978 1,661
85+ 18,572 8,851 9,721 638 353 285 16,205 7,701 8,504 1,224 537 687
2010
All Ages 158,318 87,740 70,578 4,953 3,046 1,907 132,658 72,584 60,074 16,536 9,711 6,825
<1 0 0 0 0 0 0 0 0 0 0 0 0
1-14 7 3 4 1 1 0 4 2 2 1 0 1
15-24 31 15 16 4 3 1 15 7 8 10 4 6
25-34 162 90 72 35 16 19 98 55 43 24 17 7
35-44 1,351 663 688 88 43 45 1,037 505 532 161 86 75
45-54 12,093 6,645 5,448 440 245 195 9,229 4,968 4,261 2,053 1,215 838
55-64 31,147 18,457 12,690 940 616 324 24,882 14,482 10,400 4,434 2,824 1,610
65-74 48,606 27,759 20,847 1,400 927 473 41,074 23,117 17,957 4,928 2,999 1,929
75-84 46,658 25,296 21,362 1,501 903 598 40,300 21,738 18,562 3,657 1,993 1,664
85+ 18,262 8,811 9,451 544 292 252 16,018 7,709 8,309 1,268 573 695
2009
All Ages 158,157 87,740 70,417 4,780 2,962 1,818 133,268 72,911 60,357 16,188 9,592 6,596
<1 4 3 1 0 0 0 2 1 1 2 2 0
1-14 8 4 4 4 1 3 2 1 1 2 2 0
15-24 25 17 8 3 2 1 11 7 4 8 6 2
25-34 146 85 61 26 16 10 86 47 39 22 17 5
35-44 1,517 766 751 99 49 50 1,135 562 573 212 112 100
45-54 12,488 6,852 5,636 428 273 155 9,661 5,202 4,459 2,062 1,191 871
55-64 30,964 18,419 12,545 889 561 328 24,906 14,614 10,292 4,341 2,744 1,597
65-74 48,536 27,545 20,991 1,423 907 516 41,183 23,013 18,170 4,841 2,979 1,862
75-84 46,860 25,559 21,301 1,406 893 513 40,722 22,038 18,684 3,600 1,980 1,620
85+ 17,605 8,488 9,117 502 260 242 15,557 7,425 8,132 1,096 557 539
Table 3: Number of Deaths1 by Race/Ethnicity, Sex and 10-Year Age Groups, 2005-2012
Year/Age
Hispanic Non-Hispanic White Non-Hispanic BlackTotal
Continued on next page
Trends In Lung Cancer 12

Total Male Female Total Male Female Total Male Female Total Male Female
2008
All Ages 158,656 88,586 70,070 4,804 3,007 1,797 133,866 73,732 60,134 16,101 9,542 6,559
<1 4 4 0 0 0 0 1 1 0 2 2 0
1-14 8 4 4 5 2 3 2 2 0 1 0 1
15-24 29 22 7 4 3 1 20 14 6 4 4 0
25-34 145 85 60 14 12 2 103 57 46 20 9 11
35-44 1,604 834 770 87 49 38 1,170 603 567 265 140 125
45-54 12,532 7,051 5,481 422 245 177 9,658 5,332 4,326 2,093 1,260 833
55-64 30,796 18,296 12,500 909 595 314 25,024 14,613 10,411 4,104 2,627 1,477
65-74 48,293 27,672 20,621 1,438 919 519 40,955 22,193 17,762 4,740 2,852 1,888
75-84 47,948 26,121 21,827 1,433 905 528 41,718 22,521 19,197 3,696 2,059 1,637
85+ 17,297 8,497 8,800 492 277 215 15,215 7,396 7,819 1,176 589 587
2007
All Ages 158,760 88,372 70,388 4,622 2,822 1,800 134,134 73,717 60,417 16,360 9,744 6,616
<1 1 1 0 0 0 0 0 0 0 1 1 0
1-14 5 5 0 1 1 0 2 2 0 2 2 0
15-24 25 17 8 4 4 0 16 9 7 4 3 1
25-34 135 79 56 20 9 11 91 52 39 18 14 4
35-44 1,852 911 941 93 44 49 1,391 681 710 288 145 143
45-54 12,480 6,939 5,541 404 248 156 9,502 5,179 4,323 2,231 1,311 920
55-64 31,216 18,326 12,890 855 545 310 25,518 14,727 10,791 4,112 2,654 1,458
65-74 48,157 27,568 20,589 1,430 905 525 40,732 23,038 17,694 4,933 3,006 1,927
75-84 48,358 26,475 21,883 1,340 814 526 42,343 23,038 19,305 3,643 2,017 1,626
85+ 16,528 8,049 8,479 475 252 223 4,538 6,990 7,548 1,126 590 536
2006
All Ages 158,664 89,279 69,385 4,355 2,746 1,609 134,408 74,685 59,723 16,360 9,738 6,622
<1 1 1 0 0 0 0 0 0 0 1 1 0
1-14 3 2 1 0 0 0 1 1 0 1 1 0
15-24 27 10 17 5 1 4 13 5 8 8 4 4
25-34 155 85 70 13 5 8 99 56 43 32 19 13
35-44 2,023 1,034 989 100 53 47 1,492 762 730 344 175 169
45-54 12,608 7,196 5,412 381 240 141 9,563 5,387 4,176 2,316 1,352 964
55-64 31,317 18,514 12,803 796 545 251 25,677 14,875 10,802 4,098 2,637 1,461
65-74 47,882 27,695 20,187 1,359 864 495 40,622 23,210 17,412 4,865 2,994 1,871
75-84 48,732 27,015 21,717 1,290 804 486 42,805 23,579 19,226 3,684 2,066 1,618
85+ 15,915 7,727 8,188 411 234 177 14,135 6,810 7,325 1,011 489 522
2005
All Ages 159,292 90,187 69,105 4,490 2,878 1,612 134,924 75,500 59,424 16,437 9,794 6,643
<1 0 0 0 0 0 0 0 0 0 0 0 0
1-14 4 3 1 1 1 0 3 2 1 0 0 0
15-24 16 9 7 2 0 2 12 8 4 1 1 0
25-34 133 77 56 15 9 6 82 49 33 19 11 8
35-44 2,323 1,197 1,126 111 64 47 1,743 882 861 384 202 182
45-54 12,624 7,327 5,297 407 257 150 9,647 5,565 4,082 2,228 1,316 912
55-64 31,363 18,663 12,700 848 594 254 25,619 14,922 10,697 4,176 2,694 1,482
65-74 48,390 28,207 20,183 1,355 894 461 41,162 23,737 17,425 4,869 2,987 1,882
75-84 49,032 27,196 21,836 1,337 843 494 43,076 23,761 19,315 3,682 2,053 1,629
85+ 15,404 7,506 7,898 414 216 198 13,578 6,573 7,005 1,077 529 548
Notes:(1) International Classification Of Diseases, 10th Revision (ICD-10) Code C33-C34.
Year/Age
Total Hispanic Non-Hispanic White Non-Hispanic Black
Table 3 continued: Number of Deaths1 by Race/Ethnicity, Sex and 10-Year Age Groups, 2005-2012
Source: Centers for Disease Control and Prevention. National Center for Health Statistics. WONDER Online Database, compiled from Compressed Mortality File 1999-2012 Series 20 No. 2R, 2014.
Trends In Lung Cancer 13

Total Male Female Total Male Female Total Male Female Total Male Female
2012
All Ages 44.9 56.1 36.4 19.2 26.8 13.6 48.0 58.5 40.0 49.6 70.5 35.6
<1 ** ** ** ** ** ** ** ** ** ** ** **
1-14 ** ** ** ** ** ** ** ** ** ** ** **
15-24 0.1 ** ** ** ** ** ** ** ** ** ** **
25-34 0.4 0.5 0.3 0.3 ** ** 0.4 0.4 0.4 0.5 0.8 **
35-44 2.9 2.9 2.9 1.1 1.0 1.1 3.4 3.3 3.4 3.6 4.0 3.2
45-54 25.1 27.7 22.6 7.3 8.5 6.0 27.8 29.9 25.8 34.0 41.9 26.9
55-64 81.5 98.3 65.9 27.8 35.6 20.5 87.7 102.8 73.3 104.5 142.1 73.1
65-74 206.1 250.0 167.5 80.8 116.4 51.7 221.4 261.3 185.5 230.2 320.9 162.3
75-84 339.6 432.0 271.1 162.8 237.3 110.8 360.7 448.1 294.2 344.4 508.5 246.0
85+ 323.7 473.4 248.7 189.7 258.0 152.4 336.2 488.3 259.6 295.4 496.2 215.0
2011
All Ages 46.0 57.7 37.1 19.8 28.7 13.3 49.2 60.3 40.7 50.5 71.6 36.3
<1 ** ** ** ** ** ** ** ** ** ** ** **
1-14 ** ** ** ** ** ** ** ** ** ** ** **
15-24 0.1 ** ** ** ** ** ** ** ** ** ** **
25-34 0.3 0.3 0.3 0.2 ** ** 0.3 0.2 0.3 0.5 ** **
35-44 3.1 3.1 3.1 1.2 1.4 1.0 3.7 3.6 3.7 3.3 3.5 3.2
45-54 25.7 28.1 23.3 7.0 8.3 5.7 28.7 30.6 26.8 34.5 41.9 27.9
55-64 83.5 102.5 65.7 28.5 39.4 18.5 89.3 106.9 72.4 109.3 149.7 75.6
65-74 214.3 262.8 171.9 83.7 120.2 54.2 230.6 274.4 191.3 237.9 342.0 160.2
75-84 345.9 442.4 275.3 162.8 240.6 108.6 368.4 461.0 298.7 338.2 493.2 246.1
85+ 323.7 467.3 252.9 210.1 330.3 144.8 333.6 478.2 261.9 309.5 484.3 241.4
2010
All Ages 47.6 60.3 38.1 20.4 29.6 13.8 50.8 62.7 41.7 52.6 75.6 37.3
<1 ** ** ** ** ** ** ** ** ** ** ** **
1-14 ** ** ** ** ** ** ** ** ** ** ** **
15-24 0.1 ** ** ** ** ** ** ** ** ** ** **
25-34 0.4 0.4 0.4 0.4 ** ** 0.4 0.5 0.4 0.4 ** **
35-44 3.3 3.2 3.3 1.2 1.2 1.3 4.1 3.9 4.2 3.1 3.5 2.7
45-54 26.9 30.0 23.8 8.1 9.0 7.1 29.3 31.8 26.9 37.2 46.9 28.6
55-64 85.4 104.9 67.2 29.2 40.1 19.3 90.5 107.8 74.0 114.0 159.8 75.9
65-74 223.9 274.9 179.5 84.9 126.2 51.7 241.0 287.3 199.5 245.0 350.0 167.1
75-84 357.2 461.9 281.7 174.1 256.3 117.3 378.0 479.3 303.0 351.8 519.4 253.7
85+ 332.4 492.3 255.2 201.0 307.9 143.4 342.4 504.4 263.8 331.2 534.4 252.2
2009
All Ages 48.4 61.4 38.6 20.4 29.8 13.6 51.6 63.9 42.3 52.6 76.7 36.7
<1 ** ** ** ** ** ** ** ** ** ** ** **
1-14 ** ** ** ** ** ** ** ** ** ** ** **
15-24 0.1 ** ** ** ** ** ** ** ** ** ** **
25-34 0.4 0.4 0.3 0.3 ** ** 0.4 0.4 0.3 0.4 ** **
35-44 3.7 3.7 3.6 1.4 1.3 1.4 4.4 4.3 4.4 4.0 4.5 3.5
45-54 27.8 31.0 24.7 8.1 10.3 5.9 30.6 33.2 28.0 37.8 46.5 30.1
55-64 87.5 107.9 68.4 29.1 38.5 20.5 92.9 111.6 75.1 116.4 162.1 78.4
65-74 228.6 279.4 184.5 89.7 128.6 58.5 246.4 292.3 205.6 246.3 356.2 164.9
75-84 359.8 470.5 280.6 168.9 263.3 104.0 381.2 487.7 303.1 351.0 525.5 249.6
85+ 328.0 489.1 251.0 195.8 290.7 144.9 339.2 499.5 262.3 295.8 540.1 201.6
Table 4: Age-Adjusted and Age-Specific Mortality Rates1,2 by Race and Ethnic Origin and Sex, 2005-2012
Year/Age
Hispanic Non-Hispanic White Non-Hispanic BlackTotal
Continued on next page
Trends In Lung Cancer 14

Total Male Female Total Male Female Total Male Female Total Male Female
2008
All Ages 49.5 63.6 39.0 20.5 29.7 13.7 52.8 66.3 42.6 54.6 80.3 37.7
<1 ** ** ** ** ** ** ** ** ** ** ** **
1-14 ** ** ** ** ** ** ** ** ** ** ** **
15-24 0.1 0.1 ** ** ** ** 0.1 ** ** ** ** **
25-34 0.4 0.4 0.3 ** ** ** 0.4 0.5 0.4 0.4 ** **
35-44 3.8 3.9 3.6 1.2 1.3 1.2 4.3 4.4 4.2 5.0 5.6 4.4
45-54 28.2 32.3 24.3 8.5 9.6 7.3 30.4 33.8 27.0 40.2 52.4 29.7
55-64 91.4 112.6 71.7 31.8 43.2 21.3 97.1 116.1 79.0 120.6 173.2 78.2
65-74 240.0 298.7 189.9 95.5 135.2 62.9 257.9 313.1 209.7 257.9 372.4 176.1
75-84 368.1 489.5 283.9 170.1 259.8 106.9 390.7 509.7 306.8 363.2 556.6 252.7
85+ 302.3 456.0 228.1 157.1 247.1 106.9 315.4 472.4 239.9 289.4 489.4 205.2
2007
All Ages 50.6 65.1 40.0 20.9 29.6 14.4 53.9 67.7 43.5 56.8 84.0 39.0
<1 ** ** ** ** ** ** ** ** ** 0.2 0.3 **
1-14 ** ** ** ** ** ** ** ** ** ** ** **
15-24 0.1 0.1 ** 0.1 0.1 ** 0.1 0.1 0.1 0.1 0.1 **
25-34 0.3 0.4 0.3 0.2 0.2 0.3 0.4 0.4 0.3 0.3 0.5 0.1
35-44 4.3 4.2 4.4 1.4 1.2 1.5 5.0 4.8 5.1 5.3 5.7 5.0
45-54 28.4 32.1 24.9 8.5 10.3 6.7 30.0 33.0 27.1 43.6 55.5 33.4
55-64 95.4 116.2 76.1 31.8 42.1 22.2 101.4 119.8 83.8 126.0 182.5 80.6
65-74 248.8 310.2 196.7 100.0 140.7 66.7 266.7 324.2 216.7 276.0 403.9 184.8
75-84 371.3 498.3 283.8 167.1 246.1 111.7 393.8 520.4 305.2 363.2 554.8 254.3
85+ 299.8 453.0 227.0 169.8 256.1 123.0 310.7 467.7 237.7 287.9 514.8 193.9
2006
All Ages 51.5 67.0 40.0 20.7 30.3 13.6 54.7 69.7 43.5 57.9 85.4 39.8
<1 ** ** ** ** ** ** ** ** ** ** ** **
1-14 ** ** ** ** ** ** ** ** ** ** ** **
15-24 0.1 ** ** ** ** ** ** ** ** ** ** **
25-34 0.4 0.4 0.4 ** ** ** 0.4 0.5 0.4 0.6 ** **
35-44 4.6 4.7 4.5 1.5 1.5 1.5 5.2 5.3 5.1 6.3 6.8 5.9
45-54 29.1 33.8 24.6 8.4 10.5 6.3 30.4 34.5 26.3 46.2 58.5 35.7
55-64 99.1 121.6 78.2 31.3 44.8 19.0 105.1 124.8 86.4 131.3 189.5 84.5
65-74 253.1 319.4 197.0 98.8 140.1 65.2 271.5 334.0 217.3 277.8 410.3 183.1
75-84 373.5 509.9 280.3 167.9 254.2 107.6 395.0 531.2 300.5 370.8 574.5 255.3
85+ 300.5 457.7 226.9 160.8 263.9 106.0 313.0 474.2 237.8 268.4 448.1 195.1
2005
All Ages 52.6 69.0 40.5 22.4 33.3 14.3 55.5 71.4 43.7 59.6 88.1 40.9
<1 ** ** ** ** ** ** ** ** ** ** ** **
1-14 ** ** ** ** ** ** ** ** ** ** ** **
15-24 ** ** ** ** ** ** ** ** ** ** ** **
25-34 0.3 0.4 0.3 ** ** ** 0.3 0.4 0.3 ** ** **
35-44 5.3 5.5 5.1 1.7 1.9 1.6 5.9 6.0 5.9 7.0 7.9 6.3
45-54 29.7 35.1 24.5 9.5 11.9 7.1 31.0 36.0 26.0 45.5 58.2 34.6
55-64 103.3 127.6 80.7 35.7 52.3 20.4 108.6 129.7 88.5 140.7 203.5 90.1
65-74 259.6 330.7 199.6 102.6 151.4 63.1 277.8 345.6 219.3 283.5 417.3 187.9
75-84 375.6 515.1 280.9 183.3 281.6 114.9 394.7 534.1 298.7 373.4 575.5 258.8
85+ 302.3 468.0 226.2 177.1 269.0 129.0 311.3 480.2 234.1 294.1 503.4 209.9
Notes:(1) Rates are per 100,000 population
** Number of deaths is too small to calculate a rate
Non-Hispanic White Non-Hispanic Black
Table 4 continued: Age-Adjusted and Age-Specific Mortality Rates1,2 by Race and Ethnic Origin and Sex, 2005-2012
Source: Centers for Disease Control and Prevention. National Center for Health Statistics. WONDER Online Database, compiled from Compressed Mortality File 1999-2012 Series 20 No. 2R, 2014.
(2) International Classification Of Diseases, 10th Revision (ICD-10) Code C33-C34
Year/Age
Total Hispanic
Trends In Lung Cancer 15

State Total Male Female Total Male Female Total Male Female Total Male Female Total Male Female
Alabama 64.9 96.9 42.3 62.7 91.6 42.4 63.8 92.8 42.9 60.2 88.5 39.9 61.6 90.3 40.9
Alaska 55.7 77.4 37.5 57.4 65.9 50.2 51.0 58.4 44.7 46.2 49.4 43.7 55.2 68.4 43.4
Arizona 48.3 61.6 37.9 46.2 57.8 37.1 43.3 53.6 34.8 43.0 53.1 34.7 39.4 48.5 31.8
Arkansas 67.4 96.2 46.1 68.9 95.8 49.3 70.4 98.1 49.6 65.4 92.6 45.0 63.7 84.5 47.6
California 43.8 54.2 36.3 42.3 52.2 34.9 41.5 50.9 34.6 40.3 49.8 33.2 39.4 48.3 32.8
Colorado 41.4 53.6 32.7 39.1 47.7 33.3 38.5 46.2 33.2 37.9 45.4 32.8 45.9 44.8 32.1
Connecticut 49.1 61.0 40.9 49.8 64.7 39.1 47.2 58.8 39.0 47.1 56.8 40.6 57.0 54.2 40.3
Delaware 62.4 81.3 48.5 65.9 85.5 51.3 62.4 79.7 49.6 59.7 70.1 52.0 63.8 66.0 50.4
D.C. 51.3 73.3 36.9 50.7 72.0 35.8 49.4 69.6 36.6 47.1 70.6 30.6 45.9 60.2 37.6
Florida 54.6 70.2 42.3 54.1 68.7 42.5 52.7 68.5 40.0 51.3 65.8 39.4 64.4 60.6 39.3
Georgia 59.1 83.7 42.3 58.4 85.6 39.1 56.3 80.4 39.3 55.8 79.6 38.9 47.0 76.2 39.6
Hawaii 37.1 50.1 27.2 37.5 51.0 27.1 40.0 52.5 29.7 38.7 51.9 27.9 36.1 49.8 25.4
Idaho 46.2 55.0 40.0 40.8 50.8 32.8 45.3 58.2 35.4 42.0 51.0 34.7 41.4 51.2 33.8
Illinois 55.7 73.9 42.7 54.6 72.8 41.7 52.6 68.8 41.2 52.5 69.1 41.1 53.8 68.2 43.7
Indiana 65.6 87.4 50.0 60.8 82.2 45.3 63.0 83.6 48.2 61.8 82.4 47.4 61.0 80.8 46.7
Iowa 52.4 71.0 38.6 53.7 72.8 39.8 54.0 73.5 40.1 49.4 67.1 36.3 52.4 67.6 41.1
Kansas 53.7 72.7 39.8 54.1 72.4 40.3 57.0 72.7 46.1 54.8 71.1 42.8 51.3 70.0 37.6
Kentucky 78.5 110.7 55.3 77.0 105.6 56.8 77.2 106.7 56.0 74.4 101.0 55.6 74.4 100.4 55.6
Louisiana 66.2 94.2 46.6 66.7 95.0 46.2 64.3 90.2 45.6 61.5 84.8 44.3 58.9 80.4 43.3
Maine 62.2 79.2 50.0 61.0 77.8 48.9 60.0 77.3 47.4 61.2 77.4 49.5 56.4 70.2 46.7
Maryland 57.1 74.4 44.7 52.9 67.6 42.3 54.9 71.0 43.4 52.7 66.6 42.7 50.1 62.9 41.1
Massachusetts 54.7 67.0 45.8 52.1 65.0 43.5 52.1 64.4 43.8 52.7 66.3 43.4 50.7 62.4 42.8
Michigan 56.3 73.0 44.1 56.6 74.2 44.0 55.7 72.6 43.2 55.2 70.6 44.0 55.4 70.1 45.0
Minnesota 46.0 59.1 36.8 46.8 59.0 37.9 44.5 57.0 35.6 45.0 56.3 37.1 45.6 57.7 36.7
Mississippi 66.8 101.7 42.1 68.1 99.6 45.3 64.2 94.3 42.8 67.6 100.0 44.2 64.3 97.8 40.4
Missouri 61.9 84.0 45.9 65.2 89.7 47.6 62.2 85.2 45.3 62.0 81.6 47.7 60.1 78.8 46.3
Montana 52.6 65.6 42.6 48.9 56.0 43.3 52.7 64.0 44.2 48.2 58.0 40.3 51.3 58.9 45.8
Nebraska 47.8 64.5 35.5 47.4 66.1 33.4 48.5 63.7 37.3 47.7 65.9 34.5 48.8 65.5 36.2
Nevada 63.6 75.0 54.0 57.2 61.2 53.3 57.6 66.4 50.4 56.0 64.8 48.4 53.7 59.7 48.4
New Hampshire 52.1 66.7 41.2 55.1 67.9 45.4 53.7 67.8 43.4 51.4 61.9 44.2 52.9 59.9 47.8
New Jersey 50.9 65.5 40.9 48.5 60.7 40.1 48.0 61.1 39.0 47.1 58.7 39.0 47.0 58.9 38.9
New Mexico 39.6 51.6 30.5 35.8 44.5 28.9 36.5 45.5 29.5 35.0 43.2 28.4 37.8 46.1 31.1
New York 46.9 60.6 37.4 45.9 58.4 37.2 45.3 57.6 36.7 44.1 56.3 35.6 44.2 54.9 36.8
North Carolina 58.1 81.9 41.2 59.1 83.9 41.2 59.6 82.6 43.1 59.6 82.7 43.1 56.4 79.7 41.9
North Dakota 43.7 54.0 36.4 48.6 66.5 35.7 43.1 55.0 34.1 48.2 64.2 36.1 40.9 52.4 32.3
Ohio 60.6 82.5 44.9 60.2 79.6 46.3 59.3 79.2 44.9 59.3 80.0 44.8 58.9 77.7 45.5
Oklahoma 62.4 85.3 45.5 63.0 84.7 46.6 62.6 85.6 45.4 63.5 82.2 49.3 63.9 85.4 48.2
Oregon 55.5 67.3 46.7 54.8 65.5 46.6 54.0 66.2 44.9 53.2 62.4 46.4 49.8 58.8 42.9
Pennsylvania 53.4 72.8 39.7 53.2 70.4 40.9 54.2 73.3 40.8 52.7 70.0 40.5 52.0 68.4 40.3
Rhode Island 54.0 73.0 40.7 55.2 74.2 42.0 50.4 62.0 43.0 49.8 64.2 40.2 54.6 71.4 43.8
South Carolina 62.0 89.4 41.7 57.8 84.5 38.6 60.5 85.9 41.9 58.5 81.9 41.4 56.4 78.6 39.9
South Dakota 47.7 66.5 33.9 49.5 68.4 34.8 53.2 67.9 42.1 48.2 62.2 38.1 46.4 63.4 33.8
Tennessee 67.5 96.6 47.1 68.1 97.6 47.0 69.8 97.7 49.5 67.7 95.1 47.9 65.7 91.1 47.3
Texas 53.4 73.2 38.9 51.9 69.8 38.7 50.3 68.5 36.9 49.2 65.5 37.0 47.4 63.0 35.9
Utah 24.3 33.2 17.2 26.1 35.4 18.5 23.8 33.4 15.8 23.3 29.6 18.1 21.9 26.2 18.4
Vermont 48.3 58.2 40.7 47.4 63.9 35.0 49.0 58.3 42.7 49.8 57.0 44.6 56.2 67.4 48.3
Virginia 57.3 76.8 43.0 55.8 74.6 42.2 56.5 76.1 42.1 54.3 71.8 41.5 52.9 69.7 41.2
Washington 55.2 66.1 47.5 51.8 63.0 43.5 51.2 61.4 43.8 49.3 59.1 41.9 49.5 56.3 44.4
West Virginia 66.6 90.4 49.1 65.8 90.8 48.3 66.7 89.8 50.0 70.7 93.3 53.6 66.3 87.2 50.7
Wisconsin 47.5 63.7 36.2 50.0 66.2 38.2 48.5 61.0 39.7 47.8 58.8 39.8 48.3 61.0 38.8
Wyoming 49.0 65.1 36.7 39.8 50.1 31.7 48.0 53.9 42.5 44.7 54.3 38.5 46.0 52.0 41.7
U.S. Total 54.1 71.6 41.2 53.2 70.0 40.9 52.6 69.0 40.5 51.5 67.1 40.0 50.6 65.1 40.0
Notes:
Source: Centers for Disease Control and Prevention. National Center for Health Statistics. CDC Wonder On-line Database, compiled from Compressed Mortality File 1999-2012 Series 20 No. 2R, 2014.
(1) Rates are per 100,000 persons, age-adjusted to the 2000 U.S. population and coded by ICD-10 revision.
Table 5: Age-Adjusted Mortality Rates1 by State and Sex, 2003-2012
(Continued on next page)
2003 2004 2005 2006 2007
Trends In Lung Cancer 16

State Total Male Female Total Male Female Total Male Female Total Male Female Total Male Female
Alabama 58.8 85.9 38.8 61.6 87.3 42.9 60.0 85.3 41.1 57.0 79.9 39.9 54.1 75.5 38.4
Alaska 53.0 60.5 47.2 55.3 67.9 45.7 49.4 55.2 45.2 49.4 57.1 42.5 50.0 60.3 41.4
Arizona 38.6 47.6 31.3 39.9 48.3 33.3 39.0 47.2 32.3 36.8 44.5 30.5 37.1 44.4 31.1
Arkansas 67.8 95.5 46.3 64.7 91.1 44.2 63.0 87.4 44.7 61.3 83.3 44.4 60.8 84.4 41.9
California 38.1 46.4 31.9 37.8 46.4 31.4 36.6 43.9 31.1 34.8 41.9 29.5 33.2 39.3 28.5
Colorado 36.5 44.7 30.5 36.2 42.9 31.3 35.2 42.4 29.9 32.7 38.6 28.1 31.4 35.0 28.5
Connecticut 43.8 54.5 36.3 43.0 51.1 37.2 44.3 51.6 39.0 40.7 49.0 34.9 37.6 45.0 32.3
Delaware 58.0 69.2 49.5 51.9 63.8 42.8 58.3 73.5 46.8 52.1 64.6 42.3 52.4 61.6 46.5
D.C. 49.6 67.5 37.1 41.5 52.5 33.9 38.5 50.1 30.5 40.0 47.9 34.3 40.3 51.3 32.5
Florida 48.9 61.4 38.6 48.0 59.6 38.5 47.5 59.1 38.3 45.3 56.0 36.5 44.5 55.6 35.4
Georgia 50.9 69.9 37.5 51.7 70.1 38.7 49.4 66.9 36.8 48.5 65.0 36.5 48.7 66.0 36.0
Hawaii 35.8 49.6 25.1 34.4 46.1 25.3 34.1 45.0 25.5 32.8 41.2 26.1 29.5 39.0 22.6
Idaho 41.9 48.0 37.0 41.4 47.8 36.0 38.8 48.1 30.9 37.6 44.9 32.0 36.4 40.9 32.5
Illinois 52.1 66.9 41.7 50.3 62.8 41.4 49.9 62.1 41.2 48.6 60.9 39.6 47.9 59.3 39.7
Indiana 62.1 81.9 48.0 59.3 78.2 45.3 58.7 75.2 46.2 54.5 71.8 41.7 54.7 70.6 42.7
Iowa 50.5 66.1 39.1 48.7 60.1 40.3 47.8 62.5 36.4 46.8 61.8 35.3 46.2 57.8 37.5
Kansas 51.8 69.5 38.1 51.3 65.7 40.4 48.3 60.9 38.7 47.5 58.0 39.5 46.4 55.6 39.4
Kentucky 74.2 98.9 55.6 68.8 89.0 54.2 74.1 96.9 57.4 69.2 88.6 54.8 68.8 88.6 54.1
Louisiana 60.1 83.1 43.7 58.6 79.1 42.8 58.0 77.8 43.2 56.5 75.3 42.3 55.5 72.5 42.3
Maine 56.7 73.4 44.4 53.6 65.6 44.2 55.7 66.9 47.3 52.1 65.0 41.9 53.3 64.4 44.4
Maryland 50.1 64.1 40.2 48.6 59.1 40.9 46.1 56.4 38.3 43.8 52.4 37.4 43.5 53.7 36.1
Massachusetts 49.3 61.0 41.4 48.7 58.2 42.3 47.4 56.7 41.0 44.9 53.3 38.9 44.4 52.6 38.7
Michigan 54.4 68.5 44.2 54.0 68.1 43.6 52.3 64.9 43.0 51.0 62.2 42.5 49.6 60.6 41.1
Minnesota 45.3 53.7 39.1 42.8 50.2 37.5 41.7 50.7 35.3 39.7 48.7 32.9 38.9 45.7 34.0
Mississippi 65.3 96.9 42.8 62.4 92.0 40.9 62.0 89.6 41.3 59.4 83.9 41.2 58.0 81.1 40.8
Missouri 60.1 79.4 45.7 57.1 73.4 45.4 57.3 72.5 46.0 55.1 69.3 44.4 55.9 70.6 44.8
Montana 48.1 59.6 39.0 40.3 43.9 37.5 40.0 44.0 36.7 47.6 57.8 39.2 39.1 44.4 34.7
Nebraska 45.3 56.9 36.4 44.4 57.2 34.4 46.1 58.9 36.2 42.2 52.9 34.0 43.2 52.2 36.4
Nevada 53.5 60.0 48.1 51.9 59.2 46.2 47.4 53.6 42.0 48.6 56.4 42.3 46.1 50.5 42.7
New Hampshire 47.5 59.4 38.7 50.4 61.9 42.5 46.1 52.7 41.5 51.6 62.2 43.7 46.8 52.3 43.0
New Jersey 45.1 55.9 37.7 42.8 52.1 36.4 42.4 53.5 34.7 41.3 49.4 35.7 39.5 49.2 32.4
New Mexico 36.2 46.0 28.2 32.5 39.3 27.3 34.3 41.9 28.2 30.9 37.8 25.4 32.7 39.4 27.4
New York 43.1 53.7 35.7 42.2 52.6 34.9 42.3 51.4 35.9 41.1 50.1 34.7 41.1 51.1 34.0
North Carolina 56.3 77.0 41.4 53.8 73.7 39.5 54.0 73.5 39.7 52.4 70.7 38.9 49.8 66.7 37.2
North Dakota 45.2 56.6 37.5 39.4 51.4 30.4 37.5 49.9 27.7 41.2 55.3 31.0 42.3 54.5 33.5
Ohio 57.2 75.1 44.3 56.8 73.7 44.1 54.9 71.2 42.9 54.6 69.1 43.6 54.3 67.4 44.7
Oklahoma 60.0 80.5 44.6 60.0 77.1 46.9 58.1 76.1 44.4 59.6 75.9 47.3 55.4 70.5 44.1
Oregon 49.8 59.9 41.6 48.2 56.2 42.4 47.2 54.9 41.4 45.9 52.1 41.2 45.3 52.6 39.7
Pennsylvania 51.6 67.3 40.6 49.4 63.4 39.3 49.1 63.6 38.5 47.6 59.8 38.8 46.9 60.1 37.3
Rhode Island 56.7 69.5 48.1 49.1 61.9 40.7 49.0 59.9 41.8 47.7 58.9 40.0 48.3 63.0 37.8
South Carolina 55.8 78.7 38.8 54.8 75.1 39.6 52.8 70.6 39.8 52.0 71.5 37.4 51.7 68.1 39.3
South Dakota 47.3 65.6 33.1 41.1 53.2 31.5 45.3 61.8 33.3 47.2 53.3 43.0 43.7 56.2 34.3
Tennessee 63.3 87.9 45.5 63.4 85.7 47.0 62.7 86.8 45.3 59.4 80.4 43.4 58.4 76.9 44.4
Texas 46.0 60.0 35.4 44.6 58.2 34.2 43.5 56.3 33.8 42.5 55.1 32.7 40.8 52.1 32.3
Utah 17.9 23.0 13.8 20.9 28.6 14.6 21.7 27.2 17.2 20.1 25.1 15.9 20.3 26.5 15.3
Vermont 52.4 62.5 44.6 50.4 60.9 42.3 53.9 64.3 45.6 49.3 52.9 46.5 42.4 46.9 39.9
Virginia 50.7 67.8 38.4 49.7 62.9 39.8 48.7 62.9 38.2 47.4 60.3 37.6 46.0 58.2 36.7
Washington 47.9 56.6 41.6 47.3 55.0 41.7 47.0 56.3 39.6 43.8 52.6 36.9 42.3 48.2 38.1
West Virginia 64.0 81.6 50.8 65.5 82.8 52.5 65.1 84.2 50.2 62.0 80.9 47.6 59.8 76.3 47.2
Wisconsin 47.0 57.9 39.1 45.4 58.3 35.8 46.3 56.8 38.5 47.4 56.1 40.8 43.5 53.2 36.5
Wyoming 41.3 48.0 35.6 42.1 51.9 33.7 40.0 46.1 34.6 38.4 49.1 29.4 37.3 39.0 35.5
U.S. Total 49.5 63.6 39.0 48.4 61.4 38.6 47.6 60.3 38.1 46.0 57.8 37.1 44.9 56.1 36.4
Notes:
20122010 2011
(1) Rates are per 100,000 persons, age-adjusted to the 2000 U.S. population and coded by ICD-10 revision.
Source: Centers for Disease Control and Prevention. National Center for Health Statistics. CDC Wonder On-line Database, compiled from Compressed Mortality File 1999-2012 Series 20 No. 2R, 2014.
Table 5 continued: Age-Adjusted Mortality Rates1 by State and Sex, 2003-2012
2008 2009
Trends In Lung Cancer 17

State White Black Other2 White Black Other2 White Black Other2 White Black Other2 White Black Other2
Alabama 67.3 56.5 ** 64.7 57.5 ** 65.0 61.3 ** 61.5 54.7 27.6* 62.9 57.3 **Alaska 56.7 ** 55.1 55.6 ** 63.5 47.8 ** 64.2 45.7 ** 50.6 50.4 ** 75.3Arizona 49.5 55.4 15.4 47.3 54.2 18.1 45.2 43.3 9.1 45.2 47.0 9.6 41.7 46.7 15.1Arkansas 67.3 67.8 ** 69.8 64.7 ** 70.3 74.4 ** 65.2 66.9 ** 63.9 61.2 **California 45.4 57.6 29.8 44.1 53.9 27.8 43.1 55.9 27.1 42.0 55.9 26.6 41.2 52.7 26.6Colorado 41.2 57.0 29.8 39.6 45.7 17.7* 38.7 40.3 33.9 37.9 47.7 29.0 37.8 43.1 18.5Connecticut 49.8 43.4 ** 50.5 48.3 13.6* 47.6 36.9 20.0* 47.1 42.9 11.4* 45.7 39.1 21.5*Delaware 61.6 72.4 ** 66.6 62.4 ** 61.3 73.0 ** 58.8 63.5 ** 58.0 49.3 **D.C. 36.2 60.3 ** 36.1 59.6 ** 28.5 64.7 ** 33.1 57.4 ** 39.8 55.4 **Florida 55.5 46.5 18.9 54.8 47.7 22.5 53.9 43.5 24.4 52.5 44.7 21.7 50.4 42.3 20.4Georgia 60.9 56.1 24.3 60.7 53.9 21.1 59.4 52.7 17.2 59.4 48.1 17.6 57.2 51.0 25.2Hawaii 44.5 ** 34.8 38.1 ** 37.9 52.4 ** 35.8 40.7 ** 38.3 42.8 ** 34.1Idaho 46.3 ** ** 41.3 ** ** 45.5 ** 43.2* 41.9 ** 40.0* 41.9 ** **Illinois 55.1 68.9 19.6 54.1 67.3 22.1 51.9 67.0 19.3 51.8 65.4 25.7 53.0 68.8 21.7Indiana 64.8 79.1 25.2* 60.6 68.0 ** 63.0 67.9 ** 61.1 73.0 ** 60.3 71.9 **Iowa 52.2 71.4 ** 53.5 86.9 ** 53.6 76.3 65.1* 48.9 74.2 ** 51.7 77.8 **Kansas 54.0 51.6 41.4* 53.4 70.0 57.2 56.4 74.7 47.4 53.6 75.1 52.6 50.8 46.4 64.3Kentucky 78.4 86.3 ** 77.2 82.6 ** 77.6 73.9 ** 73.7 90.9 ** 74.7 75.1 **Louisiana 64.8 69.9 29.3* 64.7 72.8 18.5* 62.2 68.5 32.7* 61.2 62.6 16.7* 58.3 64.1 25.0*Maine 62.5 ** ** 61.7 ** ** 60.1 ** ** 60.6 ** ** 55.8 ** **Maryland 56.7 64.5 26.1 53.4 57.5 16.4 56.0 55.5 28.4 53.9 53.0 22.0 51.6 51.0 18.9Massachusetts 55.4 51.1 35.8 53.2 45.3 23.2 53.3 49.9 24.1 54.0 43.9 29.6 52.0 40.0 23.0Michigan 55.1 68.2 42.9 55.5 67.3 35.1 55.2 60.2 38.9 53.8 67.8 30.9 54.6 61.1 30.9Minnesota 45.8 56.5 43.5 46.7 49.7 43.0 44.1 67.5 36.2 44.7 49.1 37.8 45.1 51.0 39.7Mississippi 67.4 65.9 ** 67.6 70.3 ** 64.3 63.8 57.9* 66.0 70.8 ** 65.7 60.0 **Missouri 61.5 72.4 21.1* 64.3 81.1 32.8* 61.7 70.0 20.6* 61.3 69.4 24.3* 59.4 64.6 29.5Montana 52.3 ** 79.0 48.5 ** 50.8* 52.3 ** 50.6* 46.8 ** 74.1 49.8 ** 82.2Nebraska 46.1 123.3 ** 46.8 71.1 ** 48.1 65.9 ** 47.1 59.3 ** 48.3 58.7 **Nevada 65.7 49.9 24.2 59.0 42.2 28.8 60.0 55.0 28.6 58.5 52.9 27.3 57.0 40.2 22.1New Hampshire 53.1 ** ** 56.5 ** ** 54.7 ** ** 52.2 ** ** 53.3 ** **New Jersey 51.7 58.0 21.2 49.5 56.0 21.2 49.4 51.6 14.3 48.4 49.5 18.1 49.1 43.5 15.9New Mexico 41.5 55.1* 9.8* 37.3 37.1* 14.9 38.3 ** 10.8* 36.0 38.9* 14.8 39.4 46.2* 14.9New York 49.4 41.2 23.9 48.5 39.9 26.0 47.8 40.1 23.3 47.3 37.0 22.6 47.6 37.7 24.6North Carolina 58.5 54.8 25.6 58.9 56.5 48.0 60.3 55.9 44.3 59.5 57.8 28.2 57.1 55.4 39.3North Dakota 42.9 ** 70.9* 46.7 ** 114.1 40.4 ** 108.1 46.2 ** 93.3* 38.6 ** 94.9*Ohio 59.9 72.2 22.6 59.2 74.1 12.4* 58.4 71.6 16.3 58.7 66.4 20.0 57.6 69.0 19.3Oklahoma 63.2 78.3 41.3 63.9 66.0 51.6 62.5 66.5 59.5 64.2 63.9 46.8 64.6 63.9 50.3Oregon 55.8 77.2 33.3 54.8 70.4 32.1 55.0 51.5 24.0 53.6 54.9 34.1 50.3 53.1 29.5Pennsylvania 52.8 66.8 20.1 52.1 72.4 24.3 53.4 67.9 23.3 51.6 66.9 16.5 50.6 66.6 20.2Rhode Island 54.9 48.3* ** 56.4 48.9* ** 50.6 61.3 ** 50.1 52.0* ** 54.3 50.2 51.6*South Carolina 62.1 62.2 ** 60.0 50.9 ** 62.9 54.1 49.1* 59.4 55.1 32.2* 57.1 54.7 **South Dakota 47.9 ** 61.5* 47.7 ** 80.6 53.2 ** 73.1 47.6 ** 84.5 46.2 ** 70.8Tennessee 67.2 71.0 ** 67.6 72.9 35.0* 69.0 78.4 23.4* 67.3 73.6 27.1* 66.1 66.4 25.5*Texas 52.7 69.7 22.7 51.1 69.0 22.2 49.9 67.1 21.5 49.1 58.5 20.5 47.0 59.3 25.6Utah 24.4 ** 23.4* 26.3 ** 28.4* 24.2 ** 29.7* 23.5 ** 30.2* 22.3 ** 29.6*Vermont 49.1 ** ** 48.6 ** ** 49.8 ** ** 50.1 ** ** 56.7 ** **Virginia 57.3 64.7 22.3 55.6 65.0 24.6 57.0 62.4 23.7 55.2 56.7 21.0 52.3 63.4 29.9Washington 56.7 61.1 35.6 53.4 45.1 32.3 53.0 52.9 33.8 50.4 57.4 32.3 50.8 57.3 31.6West Virginia 67.0 55.1 ** 66.4 52.8 ** 66.5 54.0 ** 69.6 60.5 ** 65.4 53.8 **Wisconsin 46.5 87.3 30.0* 48.5 84.2 52.6 47.3 74.4 36.6 46.9 68.9 33.8 47.2 67.0 47.3Wyoming 49.1 ** ** 40.2 ** ** 47.7 ** ** 43.9 ** ** 45.2 ** **U.S. Total3 54.5 60.6 28.3 53.6 59.5 28.4 53.2 58.1 27.7 52.1 56.3 26.9 51.2 55.0 27.2
** Rates have been suppressed due to confidentiality constraints. * These rates should be interpreted with caution as they represent 20 or fewer deaths.
(1) Rates are per 100,000 persons, age-adjusted to the 2000 U.S. population and coded by ICD-10 revision. (2) Includes races other than white and black. (3) Due to rounding, U.S. total rates presented in this table may differ from those in Table 2.
(Continued on next page)
Notes:
Source: Centers for Disease Control and Prevention. National Center for Health Statistics. CDC Wonder On-line Database, compiled from Compressed Mortality File 1999-2012 Series 20 No. 2R, 2014.
Table 6: Age-Adjusted Mortality Rates1 by State and Race, 2003-2012
20072003 2004 2005 2006
Trends In Lung Cancer 18

State White Black Other2 White Black Other2 White Black Other2 White Black Other2 White Black Other2
Alabama 61.4 49.3 23.0* 63.7 54.4 18.7* 61.5 54.1 34.0* 58.1 54.1 35.9 55.8 48.5 15.7*
Alaska 51.2 ** 61.3 56.4 ** 53.5 47.8 ** 53.8 46.5 ** 61.2 45.8 ** 66.5Arizona 41.2 39.3 18.6 41.1 42.9 15.0 40.3 34.5 13.9 38.2 33.4 14.6 38.2 37.6 14.9Arkansas 67.6 70.7 ** 65.0 66.6 ** 63.5 62.6 ** 61.7 58.6 39.7* 61.8 59.3 **California 40.0 47.3 26.6 39.2 49.7 26.1 37.8 48.4 25.3 35.8 46.3 25.5 34.3 42.1 23.8Colorado 37.0 29.7 23.2 36.4 44.0 24.6 35.1 53.1 21.6 32.5 43.7 27.1 31.3 39.1 27.1Connecticut 43.1 39.9 21.5* 43.2 43.4 24.6 45.1 43.2 20.2* 41.5 36.8 13.6* 38.5 30.7 22.5Delaware 59.5 48.0 ** 51.5 57.6 ** 60.9 48.0 ** 54.0 45.9 ** 52.6 51.5 47.6*D.C. 34.9 62.5 ** 25.1 52.1 ** 23.2 48.9 ** 24.1 51.1 ** 20.9 51.9 **Florida 50.4 42.7 21.5 49.5 38.1 21.2 48.9 38.2 24.8 46.7 36.6 19.8 46.2 35.1 16.2Georgia 53.4 48.5 13.4 53.9 48.0 10.1 51.8 44.4 21.2 51.7 40.9 19.9 51.2 42.8 20.4Hawaii 40.2 ** 35.3 36.8 ** 33.6 37.8 ** 33.0 36.3 ** 31.1 29.3 ** 29.4Idaho 42.1 ** ** 41.9 ** ** 38.9 ** ** 38.1 ** ** 36.8 ** **Illinois 51.9 62.9 21.4 50.5 57.2 19.0 49.5 61.3 22.8 48.6 57.7 18.5 48.0 57.0 18.7Indiana 61.9 62.2 31.3* 59.3 67.6 ** 58.7 64.3 20.3* 54.3 64.8 24.4* 54.6 64.9 13.0*Iowa 50.0 64.7 35.7* 48.7 65.5 ** 47.6 77.2 ** 46.7 64.9 49.7* 46.7 30.0* **Kansas 51.1 62.6 43.5 50.9 64.3 39.0 47.3 69.5 56.4 47.2 63.6 34.6 45.7 62.3 50.8Kentucky 74.0 88.5 ** 69.2 69.6 43.2* 74.4 77.1 ** 69.4 74.1 ** 69.7 63.6 24.1*Louisiana 60.1 61.8 17.2* 56.7 64.7 35.0 56.3 65.0 23.1* 55.8 59.1 34.5 54.8 58.0 34.0Maine 55.7 ** ** 53.6 ** ** 56.0 ** ** 52.5 ** ** 53.8 ** **Maryland 51.3 51.3 19.4 50.6 45.8 22.7 46.7 48.7 21.9 44.3 47.1 16.5 44.7 44.4 22.8Massachusetts 50.3 33.9 26.0 50.8 27.1 21.4 48.9 32.1 28.1 46.2 37.0 24.2 45.7 32.6 28.6Michigan 53.0 62.9 31.2 53.5 60.9 30.1 51.9 58.8 30.1 50.7 57.1 32.4 49.0 58.7 24.3Minnesota 44.6 48.5 40.5 43.1 38.4 35.8 41.9 40.3 38.4 39.8 32.5 42.2 38.9 37.7 35.9Mississippi 65.4 63.7 ** 64.1 59.3 ** 61.8 62.5 ** 61.2 54.4 44.7* 57.0 61.7 **Missouri 60.2 58.0 20.9* 57.6 58.1 10.2* 57.2 64.0 26.4 55.3 58.1 19.6* 55.7 60.1 32.6Montana 46.6 ** 62.2 40.1 ** 45.3* 39.6 ** 43.7 47.0 ** 63.3 38.5 ** 54.9Nebraska 44.6 64.6 41.4* 44.4 54.0 ** 45.6 68.5 46.0* 41.8 64.6 ** 42.6 67.5 32.5*Nevada 56.2 46.2 25.9 55.4 40.5 23.6 50.0 41.6 24.4 50.9 50.5 25.0 48.2 52.9 21.4New Hampshire 47.6 ** ** 50.9 ** ** 46.5 ** ** 52.3 ** ** 47.3 ** **New Jersey 45.9 49.6 18.9 44.0 46.4 15.4 44.2 41.2 18.2 42.6 42.7 20.9 41.2 39.7 16.4New Mexico 38.5 41.8* 8.6* 34.0 47.0* 9.2* 35.3 64.6 14.4 32.7 41.3* 6.4* 34.6 ** 13.3New York 46.7 35.1 22.4 44.9 34.6 22.3 44.6 36.9 22.7 43.5 36.3 21.1 43.6 35.1 23.1North Carolina 56.5 50.8 28.3 54.7 50.9 37.0 54.2 54.9 37.4 52.6 53.2 34.7 49.9 49.8 41.0North Dakota 43.5 ** 76.0* 38.5 ** 78.6* 35.6 ** 101.6 40.7 ** 48.1* 40.8 ** 99.5Ohio 55.9 66.1 29.4 56.2 65.4 27.7 54.4 64.5 30.1 54.5 59.6 21.3 54.2 60.3 22.8Oklahoma 60.0 55.0 62.4 60.7 56.5 52.4 58.1 54.5 59.6 59.9 67.0 52.5 55.6 60.8 51.9Oregon 50.0 68.9 34.6 48.5 56.4 38.5 47.8 63.0 29.9 46.7 46.5 26.7 45.7 47.7 37.1Pennsylvania 50.8 59.4 15.4 48.7 62.4 25.8 48.6 61.0 18.6 47.1 58.1 24.9 46.4 58.0 26.5Rhode Island 56.9 53.1 ** 50.2 34.5* ** 50.4 30.4* ** 48.7 32.3* ** 50.0 24.4* **South Carolina 57.9 49.6 27.9* 55.8 51.7 38.0* 55.0 45.6 20.1* 52.9 48.9 37.7 52.6 49.8 24.0*South Dakota 47.9 ** 66.8* 40.6 ** 54.0 44.2 ** 67.3 46.5 ** 73.6 42.3 ** 87.0Tennessee 63.4 66.7 22.8* 64.1 60.4 29.7 63.2 62.6 24.5* 60.0 58.0 21.1 58.2 63.7 28.7Texas 45.4 61.3 21.4 44.3 55.7 21.3 43.2 54.7 17.9 42.4 51.8 18.4 40.8 50.4 17.0Utah 18.5 ** 22.9* 21.0 ** ** 21.8 ** ** 20.2 ** 19.1* 20.5 ** **Vermont 52.5 ** ** 50.9 ** ** 53.9 ** ** 49.5 ** ** 42.7 ** **Virginia 51.4 53.4 27.5 50.4 52.7 22.8 49.2 52.7 22.7 48.4 49.0 19.8 46.2 50.7 24.0Washington 49.1 60.2 34.3 48.7 44.2 30.0 48.1 45.0 33.5 44.9 45.4 31.0 43.5 35.3 31.4West Virginia 62.7 68.3 ** 65.6 68.9 ** 65.6 58.7 ** 62.5 57.3 ** 60.3 50.1 **Wisconsin 45.7 72.6 46.2 44.4 71.6 36.7 45.5 70.1 42.7 46.7 65.9 39.1 42.3 70.0 46.6Wyoming 41.2 ** ** 42.5 ** ** 40.7 ** ** 37.6 ** ** 37.6 ** **U.S. Total3 50.2 52.9 27.0 49.1 51.3 25.9 48.3 51.4 26.1 46.8 49.2 25.4 45.6 48.2 24.9
Notes:
Table 6 continued: Age-Adjusted Mortality Rates1 by State and Race, 2003-2012
2012
* These rates should be interpreted with caution as they represent 20 or fewer deaths. ** Rates have been suppressed due to confidentiality constraints.
(1) Rates are per 100,000 persons, age-adjusted to the 2000 U.S. population and coded by ICD-10 revision.
2008 201120102009
(2) Includes races other than white and black. (3) Due to rounding, U.S. total rates presented in this table may differ from those in Table 2.
Source: Centers for Disease Control and Prevention. National Center for Health Statistics. CDC Wonder On-line Database, compiled from Compressed Mortality File 1999-2012 Series 20 No. 2R, 2014.
Trends In Lung Cancer 19

Total Male Female Total Male Female Total Male Female Total Male Female Total Male Female
Total
2011 402,326 183,215 219,111 342,459 153,615 188,844 40,459 19,151 21,308 NA NA NA NA NA NA
2010 399,431 183,410 216,021 340,206 153,595 186,611 40,171 19,508 20,663 NA NA NA NA NA NA
2009 387,762 178,490 209,272 331,327 149,762 181,565 38,285 18,807 19,478 NA NA NA NA NA NA
2008 373,489 173,428 200,061 320,145 145,820 174,325 35,947 17,801 18,146 NA NA NA NA NA NA
2007 370,617 172,739 197,878 317,797 145,246 172,551 35,685 17,728 17,957 NA NA NA NA NA NA
2006 364,996 171,522 193,474 312,993 144,370 168,623 35,285 17,524 17,761 NA NA NA NA NA NA
0 to <5
2011 231,126 107,276 123,850 196,046 90,417 105,629 24,928 11,660 13,268 8,687 4,093 4,594 7,365 3,791 3,574
2010 231,996 108,211 123,785 197,163 91,187 105,976 25,150 12,105 13,045 8,530 4,159 4,371 7,002 3,589 3,413
2009 224,508 104,519 119,989 191,522 88,141 103,381 23,966 11,723 12,243 7,956 3,986 3,970 6,612 3,473 3,139
2008 214,402 101,209 113,193 184,129 85,874 98,255 22,189 11,030 11,159 6,635 3,432 3,203 6,278 3,349 2,929
2007 213,542 100,425 113,117 183,440 85,221 98,219 22,255 11,033 11,222 6,506 3,341 3,165 5,962 3,109 2,853
2006 209,050 98,835 110,215 179,953 84,397 95,556 21,763 10,526 11,237 6,284 3,314 2,970 5,727 3,052 2,675
5 to <10
2011 77,607 34,010 43,597 67,584 29,237 38,347 7,416 3,506 3,910 2,559 1,156 1,403 2,011 964 1,047
2010 75,108 33,462 41,646 65,648 28,787 36,861 6,834 3,399 3,435 2,434 1,083 1,351 1,951 942 1,009
2009 73,096 32,530 40,566 64,113 28,202 35,911 6,652 3,226 3,426 2,206 1,069 1,137 1,700 809 891
2008 69,655 31,015 38,640 61,258 26,864 34,394 6,066 2,881 3,185 1,939 993 946 1,603 789 814
2007 69,437 30,787 38,650 61,075 26,665 34,410 6,098 2,890 3,208 1,898 929 969 1,642 854 788
2006 69,333 31,266 38,067 60,907 26,889 34,018 6,180 3,132 3,048 1,751 906 845 1,557 859 698
10 to <15
2011 41,694 17,823 23,871 36,611 15,323 21,288 3,703 1,755 1,948 1,275 606 669 1,020 548 472
2010 41,458 17,795 23,663 36,169 15,084 21,085 3,960 1,952 2,008 1,169 578 591 979 536 443
2009 40,029 17,506 22,523 35,002 14,846 20,156 3,723 1,905 1,818 1,171 578 593 916 521 395
2008 38,971 17,928 21,043 34,230 15,432 18,798 3,553 1,816 1,737 1,233 584 649 864 492 372
2007 38,895 17,826 21,069 34,181 15,348 18,833 3,559 1,817 1,742 1,016 508 508 760 428 332
2006 38,216 17,584 20,632 33,688 15,254 18,434 3,492 1,745 1,747 965 457 508 660 379 281
15 to <20
2011 22,634 10,198 12,436 19,757 8,775 10,982 2,194 1,068 1,126 NA NA NA NA NA NA
2010 22,038 9,916 12,122 19,441 8,691 10,750 2,047 942 1,105 NA NA NA NA NA NA
2009 21,696 10,024 11,672 19,420 8,931 10,489 1,787 853 934 NA NA NA NA NA NA
2008 20,535 9,571 10,964 18,320 8,397 9,923 1,696 920 776 NA NA NA NA NA NA
2007 20,533 9,540 10,993 18,319 8,367 9,952 1,711 927 784 NA NA NA NA NA NA
2006 20,390 9,575 10,815 18,225 8,362 9,863 1,697 974 723 NA NA NA NA NA NA
20 to <25
2011 12,124 5,209 6,915 10,797 4,505 6,292 998 548 450 NA NA NA NA NA NA
2010 11,527 5,160 6,367 10,233 4,482 5,751 971 518 453 NA NA NA NA NA NA
2009 11,093 4,915 6,178 9,843 4,264 5,579 967 496 471 NA NA NA NA NA NA
2008 10,970 4,964 6,006 9,683 4,353 5,330 1,003 454 549 NA NA NA NA NA NA
2007 10,999 4,966 6,033 9,701 4,347 5,354 1,022 466 556 NA NA NA NA NA NA
2006 10,614 4,868 5,746 9,281 4,190 5,091 1,076 524 552 NA NA NA NA NA NA
≥25
2011 17,141 8,699 8,442 11,664 5,358 6,306 1,220 614 606 NA NA NA NA NA NA
2010 17,304 8,866 8,438 11,552 5,364 6,188 1,209 592 617 NA NA NA NA NA NA
2009 17,340 8,996 8,344 11,427 5,378 6,049 1,190 604 586 NA NA NA NA NA NA
2008 18,956 8,741 10,215 12,525 4,900 7,625 1,440 700 740 NA NA NA NA NA NA
2007 17,211 9,195 8,016 11,081 5,298 5,783 1,040 595 445 NA NA NA NA NA NA
2006 17,393 9,394 7,999 10,939 5,278 5,661 1,077 623 454 NA NA NA NA NA NA
NA - Not Available.
(2) Total prevalence counts are based on 2011 cancer prevalence proportions from the SEER registries and 1/1/2011 U.S. population estimates based on the average of 2010 and 2011 population estimates from the U.S. Bureau of the Census, respectively.
(1) Prevalence proportions were calculated using only the First Malignant Tumor Ever for a person.
(3) Statistics based on SEER 9 areas.(4) Statistics based on NHIA for Hispanic for SEER 11 areas and Rural Georgia.(5) Statistics based on SEER 11 areas and Rural Georgia.
Table 7: Prevalence Counts1, 2 by Race, Sex and Years Since Diagnosis, 2006-2011
Since Diagnosis
Source: National Cancer Institute. SEER Cancer Statistics Review, 1975-2011 .
Notes:
All Races White3 Black3 Hispanics4 Asian/Pacific Islander5
Trends In Lung Cancer 20

Total Males Females Total Males Females Total Males Females
1975 52.2 89.4 24.5 51.9 89.1 24.9 64.7 114.9 24.7
1976 55.4 93.8 27.3 54.6 92.7 27.3 72.3 131.0 28.6
1977 56.7 95.5 28.3 55.9 94.7 28.1 73.5 124.7 33.9
1978 57.9 96.7 29.7 57.3 95.9 29.9 74.6 130.7 31.6
1979 58.6 95.7 31.6 58.0 95.1 31.6 74.3 127.4 34.0
1980 60.6 99.9 32.2 59.4 97.6 32.4 86.6 151.5 38.3
1981 62.0 99.4 35.1 61.5 98.5 35.5 82.2 143.0 37.2
1982 63.3 100.7 36.8 63.1 99.7 37.7 80.4 141.1 35.7
1983 63.4 99.4 37.8 63.0 97.6 39.0 86.7 151.3 39.5
1984 65.5 102.1 39.5 64.4 100.0 39.7 93.0 159.2 44.8
1985 64.7 98.8 40.2 64.0 97.0 40.8 89.7 149.6 46.1
1986 65.8 99.1 42.3 65.2 97.5 42.9 92.9 156.1 48.7
1987 68.0 101.6 44.2 68.1 100.7 45.5 84.8 143.7 43.2
1988 68.1 98.9 46.3 68.3 98.0 47.8 88.2 145.1 48.0
1989 67.7 98.2 46.2 67.8 97.3 47.4 89.1 142.6 51.4
1990 68.2 97.3 47.8 68.4 96.5 48.9 86.9 137.1 52.1
1991 69.4 97.6 49.6 69.1 96.3 50.6 93.3 145.0 56.9
1992 69.6 97.4 49.9 69.0 95.2 51.0 94.1 149.3 55.7
1993 67.8 94.1 49.2 67.9 92.7 50.8 86.3 135.3 52.2
1994 67.3 91.1 50.6 67.0 90.3 51.7 87.2 131.3 56.2
1995 66.9 87.9 50.4 67.1 88.0 52.3 86.2 138.7 50.2
1996 66.4 87.9 51.2 66.7 86.6 52.9 84.0 127.3 54.8
1997 66.6 86.3 52.5 67.2 84.9 54.9 82.0 129.3 50.4
1998 67.4 87.9 52.8 68.0 86.6 54.9 86.8 130.2 57.5
1999 65.6 84.4 52.3 66.1 83.0 54.2 83.8 121.4 58.3
2000 63.7 81.4 51.0 64.3 80.2 53.0 79.3 113.3 56.4
2001 62.7 79.5 50.4 63.7 79.3 52.4 78.5 112.2 55.8
2002 62.1 77.8 50.8 62.7 77.1 52.4 80.1 110.4 59.9
2003 62.7 78.5 51.3 63.6 77.1 53.9 78.5 115.5 53.5
2004 60.0 73.6 50.2 60.6 72.7 52.0 73.0 100.0 54.9
2005 61.0 73.2 52.2 61.9 73.0 54.0 72.2 94.2 57.6
2006 60.0 71.3 51.6 60.5 70.1 53.5 73.0 95.7 57.2
2007 59.3 69.9 51.6 60.4 69.1 54.1 69.5 93.5 53.4
2008 58.8 70.2 50.5 59.3 68.7 52.7 73.4 101.2 54.8
2009 58.8 69.3 51.3 59.2 68.3 52.8 72.5 95.1 57.5
2010 56.7 66.8 49.2 57.8 66.6 51.2 65.4 84.0 53.2
2011 55.5 64.8 48.6 56.5 64.4 50.7 64.6 85.3 51.0
Notes:
-- Rates based on less than 25 cases for the time interval.
Year/Site
Source: National Cancer Institute. SEER Cancer Statistics Review, 1975-2011.
Table 8: Lung Cancer Age-Adjusted Incidence Rates1 by Site, Race and Sex, 1975-2011
All Races Whites Blacks
(1) Rates are per 100,000 persons and are age-adjusted to the 2000 U.S. standard population.
Trends In Lung Cancer 21

89.4
102.1
64.8
52.2
69.6
55.5
24.5
52.848.6
0
20
40
60
80
100
120
1975 1980 1985 1990 1995 2000 2005 2010
Rate per 100.000
pop
ulation
MalesTotalFemales
Source: National Cancer Institute. SEER Cancer Statistics Review, 1975‐20011
Notes:(1) Rates are per 100,000 persons, age‐adjusted to the 2000 U.S. standard population and coded by ICD‐10.
+14.2%
‐36.5%
+33.3% ‐20.3%
+115.5%
‐8.0%
Figure 3: Lung Cancer Age‐Adjusted Incidence Rates1 by Sex, 1975‐2011
Trends In Lung Cancer22

Total Males Females Total Males Females Total Males Females
1977 0.6 1.0 0.3 0.6 1.1 0.3 0.2 0.3 0.1
1978 0.7 1.4 0.2 0.8 1.5 0.2 0.3 0.3 0.3
1979 0.8 1.5 0.3 0.8 1.6 0.3 0.6 0.9 0.4
1980 1.0 1.8 0.4 1.0 2.0 0.4 0.2 0.7 0.0
1981 0.8 1.4 0.3 0.8 1.5 0.3 0.3 0.8 0.0
1982 0.8 1.4 0.4 0.9 1.5 0.4 0.3 0.9 0.0
1983 1.0 1.9 0.5 1.1 2.0 0.5 0.9 1.6 0.5
1984 1.1 2.0 0.4 1.2 2.2 0.4 0.3 0.8 0.0
1985 0.9 1.7 0.4 1.0 1.7 0.4 0.8 1.8 0.2
1986 0.9 1.7 0.4 1.0 1.8 0.5 0.5 0.9 0.2
1987 1.0 1.7 0.4 1.0 1.8 0.5 0.7 1.1 0.4
1988 1.0 1.8 0.4 1.1 2.0 0.4 0.6 1.2 0.3
1989 1.1 2.2 0.4 1.2 2.3 0.4 0.7 1.0 0.4
1990 1.1 2.2 0.5 1.3 2.3 0.5 0.7 1.4 0.3
1991 1.1 2.1 0.4 1.2 2.2 0.5 0.7 1.6 0.2
1992 1.2 2.5 0.4 1.3 2.7 0.4 0.7 1.3 0.2
1993 1.1 2.0 0.4 1.1 2.2 0.4 0.7 1.2 0.3
1994 1.2 2.2 0.4 1.2 2.3 0.5 1.1 1.8 0.5
1995 1.2 2.2 0.5 1.2 2.3 0.5 0.8 1.7 0.3
1996 1.1 2.1 0.5 1.3 2.4 0.5 0.4 0.8 0.2
1997 1.0 1.9 0.4 1.1 2.0 0.4 0.9 1.4 0.6
1998 1.1 2.1 0.4 1.2 2.2 0.5 0.6 1.3 0.2
1999 1.1 2.2 0.4 1.2 2.3 0.4 0.7 1.3 0.2
2000 1.1 2.1 0.3 1.2 2.4 0.4 0.6 1.1 0.2
2001 1.0 1.9 0.4 1.1 2.1 0.5 0.4 0.9 0.2
2002 1.0 1.9 0.4 1.1 2.1 0.4 -- -- --
2003 0.9 1.6 0.4 1.0 1.8 0.4 -- -- --
2004 1.1 2.0 0.4 1.2 2.2 0.5 -- -- --
2005 1.0 1.9 0.4 1.2 2.1 0.5 -- -- --
2006 0.9 1.6 0.4 1.0 1.7 0.5 -- -- --
2007 1.0 1.7 0.4 1.1 1.9 0.5 -- -- --
2008 0.9 1.7 0.3 1.0 1.9 0.4 -- -- --
2009 1.0 1.8 0.4 1.1 2.1 0.5 -- -- --
2010 1.0 1.8 0.4 1.1 2.0 0.4 -- -- --
2011 1.0 1.7 0.4 1.1 1.9 0.5 -- -- --
Notes:(1) Rates are per 100,000 persons and are age-adjusted to the 2000 U.S. standard population. -- Rates based on less than 25 cases for the time interval.
Table 9: Mesothelioma Age-Adjusted Incidence Rates1 by Site, Race and Sex, 1977-2011
All Races Whites Blacks
Year/Site
Source: National Cancer Institute. SEER Cancer Statistics Review, 1975-2011.
Trends In Lung Cancer 23

Total Males Females Total Males Females Total Males Females
1975 13.2 21.2 7.1 13.3 21.7 6.9 13.4 20.2 8.2
1976 13.3 21.0 7.4 13.2 21.0 7.4 15.1 23.8 8.3
1977 12.7 20.1 7.0 12.6 19.8 7.0 14.5 23.9 6.8
1978 13.4 20.9 7.7 13.2 20.8 7.6 15.8 25.8 8.1
1979 14.0 21.9 8.0 13.7 21.6 7.7 18.4 28.2 10.6
1980 13.3 20.3 7.9 13.0 20.0 7.6 16.8 25.4 9.6
1981 13.6 20.8 7.9 13.4 20.5 7.9 16.7 28.2 7.5
1982 13.3 20.3 7.9 13.1 19.9 7.8 17.1 27.4 8.9
1983 13.3 21.2 7.2 13.3 21.2 7.3 16.1 26.0 8.3
1984 13.5 20.8 7.9 13.0 20.1 7.6 18.9 30.0 10.1
1985 13.3 19.8 8.2 13.2 19.6 8.3 16.0 25.7 8.5
1986 12.5 19.1 7.2 12.3 18.8 7.3 16.1 28.0 7.0
1987 13.2 20.5 7.5 13.1 20.1 7.7 16.8 30.0 6.9
1988 12.1 18.1 7.3 11.7 17.6 7.1 16.4 25.6 9.1
1989 12.1 18.2 7.3 11.8 17.6 7.3 15.7 27.0 7.0
1990 12.6 19.4 7.3 12.4 18.8 7.4 16.1 28.0 6.9
1991 12.2 18.3 7.2 12.1 18.1 7.3 14.5 23.7 7.4
1992 12.0 18.3 6.9 11.8 18.0 6.9 14.8 25.1 6.9
1993 12.4 18.7 7.3 12.2 18.4 7.2 15.5 25.0 8.0
1994 11.7 17.7 6.8 11.4 16.8 6.9 15.8 26.8 7.1
1995 11.5 16.9 7.2 11.5 16.7 7.3 13.5 22.5 6.7
1996 11.7 17.7 7.0 11.4 17.1 6.9 14.8 24.2 7.5
1997 11.5 17.3 6.8 11.5 17.1 6.9 11.5 18.4 6.2
1998 11.2 16.6 6.7 11.2 16.3 6.9 12.9 22.3 6.2
1999 10.5 15.5 6.4 10.4 15.3 6.3 11.5 19.5 5.6
2000 10.7 16.0 6.3 10.7 15.6 6.4 11.6 20.5 4.9
2001 10.6 15.2 6.8 10.7 15.2 6.8 11.9 18.7 6.9
2002 10.8 15.9 6.5 11.0 16.0 6.6 10.9 16.7 6.4
2003 10.2 15.2 6.0 10.2 15.2 5.8 11.5 16.2 7.7
2004 10.4 15.5 6.0 10.6 15.7 6.0 9.9 15.7 5.6
2005 10.4 15.1 6.3 10.4 15.4 6.1 10.6 16.1 6.7
2006 10.3 15.0 6.2 10.4 15.0 6.4 9.6 15.9 5.0
2007 10.3 15.3 6.2 10.6 15.6 6.1 9.4 14.8 5.3
2008 10.8 16.0 6.3 11.1 16.4 6.4 8.8 13.7 5.0
2009 10.9 16.1 6.3 11.0 16.3 6.3 10.4 15.7 6.3
2010 10.8 16.1 6.2 11.2 16.5 6.3 8.7 13.3 5.0
2011 11.2 16.6 6.5 11.8 17.4 6.7 9.0 14.1 5.1
Notes:(1) Rates are per 100,000 persons and are age-adjusted to the 2000 U.S. standard population. -- Rates based on less than 25 cases for the time interval.
Table 10: Oral Cavity & Pharynx Cancer Age-Adjusted Incidence Rates1 by Site, Race and Sex, 1975-2011
All Races Whites Blacks
Year/Site
Source: National Cancer Institute. SEER Cancer Statistics Review, 1975-2011.
Trends In Lung Cancer 24

Total Males Females Total Males Females Total Males Females
1975 5.0 9.5 1.5 5.0 9.4 1.5 7.0 13.2 --
1976 5.2 10.0 1.4 5.2 9.9 1.4 7.3 14.6 --
1977 5.0 9.7 1.4 5.0 9.7 1.3 7.5 13.9 --
1978 5.3 9.8 1.8 5.3 9.8 1.9 6.9 13.2 --
1979 5.4 10.1 1.7 5.4 10.2 1.7 7.5 13.2 --
1980 5.2 10.0 1.6 5.2 9.9 1.5 7.3 14.3 --
1981 5.4 9.8 1.9 5.3 9.6 2.0 8.1 16.3 --
1982 5.3 9.7 1.8 5.3 9.8 1.8 7.9 14.4 --
1983 5.3 9.9 1.7 5.4 10.1 1.7 6.8 12.2 --
1984 5.1 9.6 1.6 5.0 9.6 1.5 8.5 14.9 3.4
1985 5.4 9.9 1.9 5.4 10.0 1.9 8.4 15.5 3.2
1986 5.0 9.4 1.6 4.9 9.2 1.7 7.8 15.5 --
1987 5.2 9.4 1.9 5.1 9.4 1.9 8.2 15.0 3.1
1988 5.2 9.6 1.9 5.2 9.6 1.8 8.2 14.8 3.3
1989 5.0 8.9 2.0 5.0 8.9 1.9 7.9 14.3 3.3
1990 5.1 9.2 1.9 5.0 9.0 1.9 9.5 17.8 3.6
1991 4.7 8.5 1.8 4.8 8.5 1.9 6.7 12.6 --
1992 5.0 9.1 1.8 4.9 8.9 1.7 8.7 15.8 3.4
1993 4.4 8.1 1.5 4.4 8.0 1.5 6.9 14.1 --
1994 4.7 8.3 1.8 4.5 8.1 1.7 8.9 15.8 3.8
1995 4.4 7.9 1.6 4.4 7.8 1.6 6.7 13.0 --
1996 4.3 7.5 1.7 4.3 7.5 1.6 6.4 11.4 2.8
1997 4.2 7.5 1.6 4.1 7.3 1.6 7.1 13.2 2.7
1998 3.8 6.7 1.6 3.7 6.5 1.6 6.5 11.8 2.8
1999 4.1 7.0 1.8 4.1 6.9 1.8 7.2 12.3 3.6
2000 4.0 7.2 1.4 4.0 7.1 1.5 6.1 11.3 2.3
2001 3.6 6.5 1.3 3.6 6.3 1.3 6.1 12.0 1.8
2002 3.5 6.2 1.3 3.4 6.0 1.3 6.2 11.1 2.6
2003 3.3 5.9 1.2 3.3 5.7 1.3 4.9 9.2 1.8
2004 3.4 6.0 1.3 3.4 5.9 1.3 5.8 10.9 2.3
2005 3.4 6.1 1.3 3.4 6.1 1.3 5.5 10.4 1.9
2006 3.2 5.7 1.2 3.3 5.7 1.3 5.2 10.2 1.5
2007 3.1 5.5 1.2 3.1 5.4 1.2 5.4 9.9 2.3
2008 3.1 5.4 1.1 3.1 5.5 1.1 4.5 8.3 1.9
2009 3.1 5.6 1.0 3.1 5.6 1.1 4.2 8.5 1.2
2010 3.2 5.7 1.1 3.2 5.5 1.2 5.0 9.4 1.8
2011 2.9 5.2 1.1 3.0 5.2 1.1 4.1 8.3 1.3
Notes:(1) Rates are per 100,000 persons and are age-adjusted to the 2000 U.S. standard population. -- Rates based on less than 25 cases for the time interval.
Table 11: Larynx Cancer Age-Adjusted Incidence Rates1 by Site, Race and Sex, 1975-2011
All Races Whites Blacks
Year/Site
Source: National Cancer Institute. SEER Cancer Statistics Review, 1975-2011.
Trends In Lung Cancer 25

Sex Total White Black Hispanic2Asian/Pacific
Islander American Indian/
Alaska Native
Males 72.2 72.4 93.0 39.6 49.4 49.5
Females 51.1 53.8 51.2 25.5 28.1 34.7
Total 60.1 61.7 68.0 31.3 37.0 40.9
Notes:
Source: National Cancer Institute. SEER Cancer Statistics Review, 1975-2011.
Table 12: Age-Adjusted Incidence Rates1 by Race/Ethnicity and Sex, 2007-2011
(1) Rates are per 100,000 age-adjusted to the 2000 U.S. standard population. Incidence rates obtained from 18 SEER areas. (2) Hispanics are not mutually exclusive from whites, blacks, Asian/Pacific Islanders and American Indians/Alaska Natives.
Trends In Lung Cancer 26

StateIncidence
Counts
Age-Adjusted
Incidence Rate1Incidence
Counts
Age-Adjusted
Incidence Rate1
Alabama 2,264 91.7 1,703 55.5Alaska 185 68.0 157 59.3Arizona 1,913 57.0 1,821 46.6Arkansas 1,548 98.7 1,066 56.8California 8,371 51.4 8,025 39.6Colorado 1,099 49.7 1,103 41.4Connecticut 1,335 72.7 1,271 54.7Delaware 438 91.0 358 61.6District of Columbia 176 69.9 153 45.6Florida 8,440 71.3 7,425 52.6Georgia 3,444 84.9 2,702 52.0Hawaii 425 57.1 342 39.2Idaho 428 56.0 408 47.2Illinois 4,805 80.4 4,336 56.9Indiana 2,816 89.0 2,364 60.4Iowa 1,309 78.8 1,017 50.5Kansas 1,043 73.2 899 52.7Kentucky 2,488 112.2 2,145 79.3Louisiana 1947 91.1 1441 53.6Maine 632 79.8 586 61.1Maryland 1,739 63.9 1,775 51.4Massachusetts 2,446 74.1 2,535 60.1Michigan* 3,915 75.9 3,737 59.2Minnesota 1,711 64.8 1,555 49.3Mississippi 1,409 98.7 983 54.5Missouri 2,692 86.8 2,311 60.9Montana 396 70.3 334 50.9Nebraska 615 67.6 521 46.7Nevada -- -- -- --
New Hampshire 502 71.3 532 64.1New Jersey 2,849 66.3 2,998 53.3New Mexico 506 47.8 436 35.0New York 6,815 71.8 6,766 54.5North Carolina 4,125 88.7 3,180 53.5North Dakota 264 73.4 202 47.8Ohio 5,051 83.9 4,262 57.3Oklahoma 1,616 85.0 1,354 59.2Oregon 1,343 65.8 1,389 57.3Pennsylvania 5,637 80.2 4,942 56.0Rhode Island 401 74.9 388 55.6South Carolina 2,024 84.8 1,509 50.7South Dakota 266 60.9 261 51.6Tennessee 3,092 94.6 2,398 59.5Texas 7,100 68.6 5,421 42.9Utah 354 34.5 291 25.0Vermont 245 67.6 267 65.2Virginia 2,681 71.0 2,375 50.5Washington 2,109 65.2 2,075 53.4West Virginia 1,130 101.4 811 62.4Wisconsin 2,035 68.1 1,935 54.8Wyoming 148 52.0 136 43.8
United States2 111,176 73.0 97,842 52.1
Notes:
Table 13: Incidence Counts and Age-Adjusted Rates by State and Sex, 2011
* Data do not include cases diagnosed in other states.
Male Female
-- Nevada data not available.
(1) Rates are per 100,000 population. Age-adjusted incidence rates are adjusted to the 2000 U.S. standard population.
Source: National Cancer Institute. State Cancer Profiles web system, statecancerprofiles.cancer.gov, accessed October 6, 2014.
(2) Total may not equal sum of all states due to reliance on data submissions from differing dates.
Trends In Lung Cancer 27
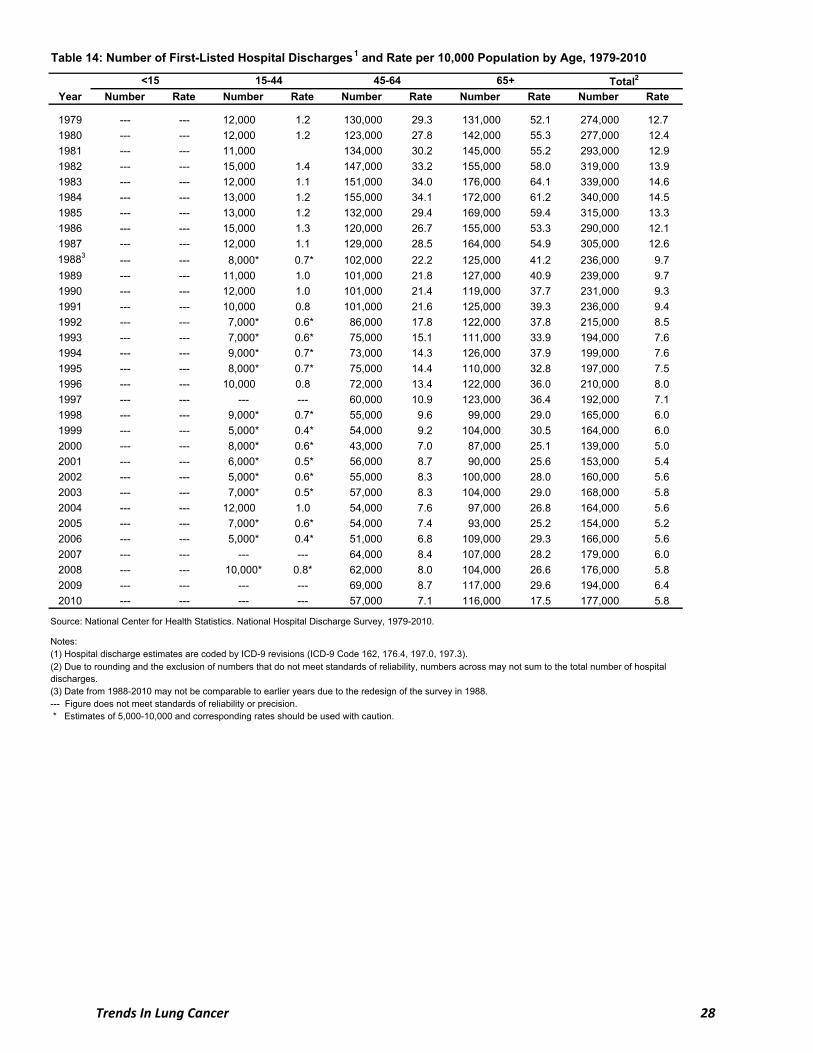
Year Number Rate Number Rate Number Rate Number Rate Number Rate
1979 --- --- 12,000 1.2 130,000 29.3 131,000 52.1 274,000 12.7
1980 --- --- 12,000 1.2 123,000 27.8 142,000 55.3 277,000 12.4
1981 --- --- 11,000 134,000 30.2 145,000 55.2 293,000 12.9
1982 --- --- 15,000 1.4 147,000 33.2 155,000 58.0 319,000 13.9
1983 --- --- 12,000 1.1 151,000 34.0 176,000 64.1 339,000 14.6
1984 --- --- 13,000 1.2 155,000 34.1 172,000 61.2 340,000 14.5
1985 --- --- 13,000 1.2 132,000 29.4 169,000 59.4 315,000 13.3
1986 --- --- 15,000 1.3 120,000 26.7 155,000 53.3 290,000 12.1
1987 --- --- 12,000 1.1 129,000 28.5 164,000 54.9 305,000 12.6
19883--- --- 8,000* 0.7* 102,000 22.2 125,000 41.2 236,000 9.7
1989 --- --- 11,000 1.0 101,000 21.8 127,000 40.9 239,000 9.7
1990 --- --- 12,000 1.0 101,000 21.4 119,000 37.7 231,000 9.3
1991 --- --- 10,000 0.8 101,000 21.6 125,000 39.3 236,000 9.4
1992 --- --- 7,000* 0.6* 86,000 17.8 122,000 37.8 215,000 8.5
1993 --- --- 7,000* 0.6* 75,000 15.1 111,000 33.9 194,000 7.6
1994 --- --- 9,000* 0.7* 73,000 14.3 126,000 37.9 199,000 7.6
1995 --- --- 8,000* 0.7* 75,000 14.4 110,000 32.8 197,000 7.5
1996 --- --- 10,000 0.8 72,000 13.4 122,000 36.0 210,000 8.0
1997 --- --- --- --- 60,000 10.9 123,000 36.4 192,000 7.1
1998 --- --- 9,000* 0.7* 55,000 9.6 99,000 29.0 165,000 6.0
1999 --- --- 5,000* 0.4* 54,000 9.2 104,000 30.5 164,000 6.0
2000 --- --- 8,000* 0.6* 43,000 7.0 87,000 25.1 139,000 5.0
2001 --- --- 6,000* 0.5* 56,000 8.7 90,000 25.6 153,000 5.4
2002 --- --- 5,000* 0.6* 55,000 8.3 100,000 28.0 160,000 5.6
2003 --- --- 7,000* 0.5* 57,000 8.3 104,000 29.0 168,000 5.8
2004 --- --- 12,000 1.0 54,000 7.6 97,000 26.8 164,000 5.6
2005 --- --- 7,000* 0.6* 54,000 7.4 93,000 25.2 154,000 5.2
2006 --- --- 5,000* 0.4* 51,000 6.8 109,000 29.3 166,000 5.6
2007 --- --- --- --- 64,000 8.4 107,000 28.2 179,000 6.0
2008 --- --- 10,000* 0.8* 62,000 8.0 104,000 26.6 176,000 5.8
2009 --- --- --- --- 69,000 8.7 117,000 29.6 194,000 6.4
2010 --- --- --- --- 57,000 7.1 116,000 17.5 177,000 5.8
Notes:(1) Hospital discharge estimates are coded by ICD-9 revisions (ICD-9 Code 162, 176.4, 197.0, 197.3).
Source: National Center for Health Statistics. National Hospital Discharge Survey, 1979-2010.
--- Figure does not meet standards of reliability or precision. * Estimates of 5,000-10,000 and corresponding rates should be used with caution.
(3) Date from 1988-2010 may not be comparable to earlier years due to the redesign of the survey in 1988.
(2) Due to rounding and the exclusion of numbers that do not meet standards of reliability, numbers across may not sum to the total number of hospital discharges.
Table 14: Number of First-Listed Hospital Discharges1 and Rate per 10,000 Population by Age, 1979-2010
45-64 65+ Total2<15 15-44
Trends In Lung Cancer 28

Year Total White Black All Other Total White Black All Other
1988 236,000 193,000 N/A N/A 9.7 9.3 N/A N/A
1989 239,000 194,000 N/A N/A 9.7 9.3 N/A N/A
1990 231,000 183,000 19,000 --- 9.3 8.7 6.3 ---
1991 236,000 181,000 21,000 7,000* 9.4 8.6 6.9 7.1*
1992 215,000 161,000 16,000 5,000* 8.5 7.6 5.2 4.7*
1993 194,000 149,000 16,000 --- 7.6 7.0 5.1 ---
1994 199,000 151,000 21,000 7,000* 7.6 7.0 6.4 6.0*
1995 197,000 140,000 21,000 --- 7.5 6.5 6.4 ---
1996 210,000 156,000 17,000 5,000* 8.0 7.1 5.3 4.4*
1997 192,000 142,000 20,000 --- 7.1 6.4 5.6 ---
1998 165,000 114,000 14,000 7,000* 6.0 5.1 3.8 5.1*
1999 164,000 115,000 13,000 8,000* 6.0 5.1 3.5 6.3*
2000 139,000 85,000 12,000 --- 5.0 3.7 3.5 ---
2001 153,000 95,000 14,000 --- 5.4 4.1 4.0 ---
2002 160,000 102,000 12,000 --- 5.6 4.4 3.3 ---
2003 168,000 113,000 16,000 --- 5.8 4.9 4.3 ---
2004 164,000 102,000 17,000 6,000* 5.6 4.3 4.5 3.2*
2005 154,000 98,000 15,000 6,000* 5.2 4.1 4.0 2.8*
2006 166,000 104,000 15,000 --- 5.6 4.3 4.1 ---
2007 179,000 118,000 22,000 --- 6.0 4.9 5.8 ---
2008 176,000 101,000 21,000 10,385 5.8 4.2 5.5 4.7*
2009 194,000 136,000 25,000 9,843* 6.4 5.6 6.4 4.3*
2010 177,000 135,000 21,000 8,469* 5.8 5.5 5.2 3.6*
Table 15: Number of First-Listed Hospital Discharges1 and Rate per 10,000 Population by Race, 1988-2010
Source: National Center for Health Statistics. National Hospital Discharge Survey, 1979-2010.
N/A - Not Available.
(1) Hospital discharge estimates are coded by ICD-9 revisions (ICD-9 Code 162, 176.4, 197.0, 197.3). Notes:
--- Figure does not meet standards of reliability or precision. * Estimates below 10,000 and corresponding rates should be used with caution.
Rate per 10,000 populationNumber of Discharges
Trends In Lung Cancer 29

Source: National Cancer Institute. SEER Cancer Statistics Review, 1975‐2011.
Notes:(1) Stages include localized (within lungs), regional (spread to lymph nodes), and distant (spread to other organs).(2) Rates are from the SEER 18 areas, based on follow‐up of patients into 2011.
Figure 4: Stage Distribution1 (%) at Time of Diagnosis by Type, 2004‐20102
Distant 72%Localized
5%
Unstaged3%
Regional21%
Small CellDistant57%
Regional22%
Localized15%
Unstaged6%
All
Distant55%
Regional24%
Localized18%
Unstaged3%
Non‐Small Cell
Trends In Lung Cancer30

Lung & Bronchus Colon Rectum Female Breast Esophagus Prostate
1960-19631-- -- -- -- -- --
1970-19731-- -- -- -- -- --
1975-1977 12.2 50.6 48.1 74.8 5.0 67.8
1978-1980 12.8 52.3 48.9 74.4 5.0 70.1
1981-1983 13.1 55.2 51.4 76.1 6.6 72.0
1984-1986 12.8 58.3 56.2 78.9 9.5 75.2
1987-1989 13.0 60.2 58.1 84.0 9.4 82.8
1990-1992 13.6 62.0 59.2 85.2 12.1 92.9
1993-1995 14.3 59.8 60.1 86.4 12.1 95.2
1996-1998 14.6 62.2 63.3 88.2 13.4 97.4
1999-2003 15.5 64.9 67.1 89.9 17.7 99.6
2004-2010 17.8* 65.4* 67.8* 90.5* 20.0* 99.6*
1960-196318 43 38 63 4 50
1970-1973110 49 45 68 4 63
1975-1977 12.2 50.9 48.2 75.6 5.5 68.5
1978-1980 12.9 52.4 49.7 75.1 5.3 71.2
1981-1983 13.3 55.4 52.0 77.1 7.3 73.1
1984-1986 13.0 59.0 57.0 80.0 10.2 76.4
1987-1989 13.3 60.6 58.7 85.1 10.5 84.4
1990-1992 14.0 62.8 59.9 86.5 12.9 94.1
1993-1995 14.5 60.5 60.5 87.7 13.4 95.9
1996-1998 14.8 62.9 63.6 89.4 14.2 97.9
1999-2003 15.8 66.3 67.8 91.2 18.7 99.8
2004-2010 18.2* 66.5* 68.0* 91.8* 21.0* 99.8*
1960-196315 34 27 46 1 35
1970-197317 37 30 51 4 55
1975-1977 11.3 44.7 44.4 62.0 3.5 60.7
1978-1980 11.7 48.9 34.6 63.3 4.3 62.1
1981-1983 11.3 48.5 39.9 63.3 4.3 62.7
1984-1986 11.1 49.1 45.8 65.0 8.7 65.6
1987-1989 10.9 52.3 52.3 71.0 6.6 71.1
1990-1992 10.4 53.2 51.1 71.4 9.1 84.3
1993-1995 12.9 51.1 53.9 72.6 7.6 91.6
1996-1998 12.3 53.5 54.8 76.1 10.2 94.8
1999-2003 12.7 54.1 60.2 78.1 12.0 97.5
2004-2010 14.9* 55.8* 63.2* 80.0* 13.2* 97.9*
Notes:
* The difference in rates between 1975-1977 and 2004-2010 is statistically significant (p<.05).
Source: National Cancer Institute. SEER Cancer Statistics Review, 1975-2011.
Table 16: Relative Five-Year Survival Rates by Race and Site, Cases Diagnosed in 1960-63, 1970-2010
Total
White
Black
(1) Rates are based on data from a series of hospital registries and one population based registry. Later rates are from the SEER 9 areas. -- Statistic could not be calculated.
Trends In Lung Cancer 31

Total Males Females Total Males Females Total Males Females
1975-1977 12.2 11.1 15.3 12.2 11.1 15.4 11.3 10.6 13.8
1978-1980 12.8 11.4 16.3 12.9 11.5 16.2 11.7 9.7 17.8
1981-1983 13.1 11.5 16.4 13.3 11.7 16.5 11.3 10.1 14.9
1984-1986 12.8 11.2 16.0 13.0 11.3 16.3 11.1 10.3 12.8
1987-1989 13.0 11.9 14.9 13.3 12.0 15.3 10.9 10.8 11.1
1990-1992 13.6 12.1 15.9 14.0 12.4 16.2 10.4 9.3 12.5
1993-1995 14.3 12.5 16.9 14.5 12.6 17.1 12.9 11.3 15.7
1996-1998 14.6 12.9 16.8 14.8 13.0 17.0 12.3 10.7 14.8
1999-2003 15.5 13.4 18.0 15.8 13.7 18.3 12.7 11.3 14.5
2004-2010 17.8* 15.5* 20.4* 18.2* 15.8* 20.7* 14.9* 13.0* 17.1*
1975-1977 3.6 3.1 4.8 3.7 3.1 4.9 3.7 3.8 3.6
1978-1980 4.2 3.2 6.4 4.3 3.3 6.4 3.1 2.4 5.0
1981-1983 4.5 3.5 6.2 4.6 3.6 6.1 5.0 3.7 8.2
1984-1986 4.5 3.5 6.2 4.7 3.6 6.4 3.5 2.2 5.6
1987-1989 5.1 3.9 6.6 5.1 3.9 6.8 4.0 3.3 5.1
1990-1992 5.4 4.5 6.4 5.5 4.5 6.6 3.9 3.9 3.9
1993-1995 6.4 5.1 7.9 6.3 5.1 7.7 6.7 4.0 10.4
1996-199825.9 5.2 6.5 6.1 5.4 6.7 3.6 2.7 4.5
1999-2003 6.1 4.8 7.4 6.0 4.5 7.6 5.2 5.4 4.9
2004-2010 6.6* 4.9* 8.3* 6.5* 4.8* 8.2* 6.9* 5.7* 8.0
1975-1977 16.4 14.8 21.0 16.7 15.0 21.4 13.6 12.5 17.7
1978-1980 16.7 14.8 21.4 17.0 15.2 21.5 14.2 11.6 22.8
1981-1983 17.1 15.0 21.8 17.5 15.4 22.1 13.9 12.2 19.2
1984-1986 16.6 14.4 21.0 17.0 14.7 21.5 13.2 11.9 16.4
1987-1989 16.9 15.2 19.8 17.4 15.5 20.6 13.2 12.9 14.0
1990-1992 17.6 15.5 21.1 18.3 16.1 21.7 12.8 11.1 16.1
1993-1995 18.7 16.1 22.5 19.3 16.5 23.2 15.1 13.3 18.4
1996-1998219.4 16.7 22.9 19.9 17.1 23.5 15.2 12.8 19.3
1999-2003 19.7 16.8 23.4 20.5 17.5 24.1 14.6 12.7 17.4
2004-2010 21.7* 18.7* 25.1* 22.6* 19.5* 26.0* 16.7* 14.2* 19.6
Notes:(1) Rates are from the SEER 9 areas, based on follow-up of patients into 2011.
* The difference in rates between 1975-1977 and 2004-2010 is statistically significant (p<.05). (2) Rates are from the SEER 18 areas, based on follow-up of patients into 2011.
Table 17: Five-Year Survival Rates1 (%) by Type, Race and Sex, 1975-2010
Source: National Cancer Institute. SEER Cancer Statistics Review, 1975-2011.
All Races Whites Blacks
Non-Small Cell Lung & Bronchus
Small Cell Lung & Bronchus
Lung & Bronchus
Type/Year of Diagnosis
Trends In Lung Cancer 32

All Stages Localized Regional Distant UnstagedAll Cell 16.8 54.0 26.5 4.0 7.4Small Cell 6.3 24.2 14.3 2.8 7.8Non‐Small Cell 20.7 58.2 29.8 4.5 12.3
0
10
20
30
40
50
60Pe
rcen
tage
Source: National Cancer Institute. SEER Cancer Statistics Review, 1975‐2011.
Notes:(1) Rates are per 100,000 persons, age‐adjusted to the 2000 U.S. standard population and coded by ICD‐10.(2) Rates are from the SEER 18 areas, based on follow‐up of patients into 2011.
Figure 5: Five‐Year Survival Rates (%) by Type and Stage, 2004‐2010
Trends In Lung Cancer33

Type of Risk Males Females Males Females Males Females
Lifetime Risk of Diagnosis 7.43 6.17 7.46 6.46 7.78 5.39
Lifetime Risk of Dying 6.47 4.95 6.53 5.14 6.49 4.15
Table 18: Lifetime Risk (%) of Being Diagnosed With or Dying From Lung Cancer, by Race and Sex, 2009-2011
All Races Whites Blacks
Source: National Cancer Institute. SEER Cancer Statistics Review, 1975-2011.
Trends In Lung Cancer 34