trends in container shipping - international transport forum · trends in container shipping olaf...
TRANSCRIPT

Trends in Container Shipping
Olaf Merk
Stakeholder Meeting on Container Shipping
8 February 2019
OECD Conference Centre

Trends
1. Concentration
2. Vertical integration
3. Price
4. Service quality
2
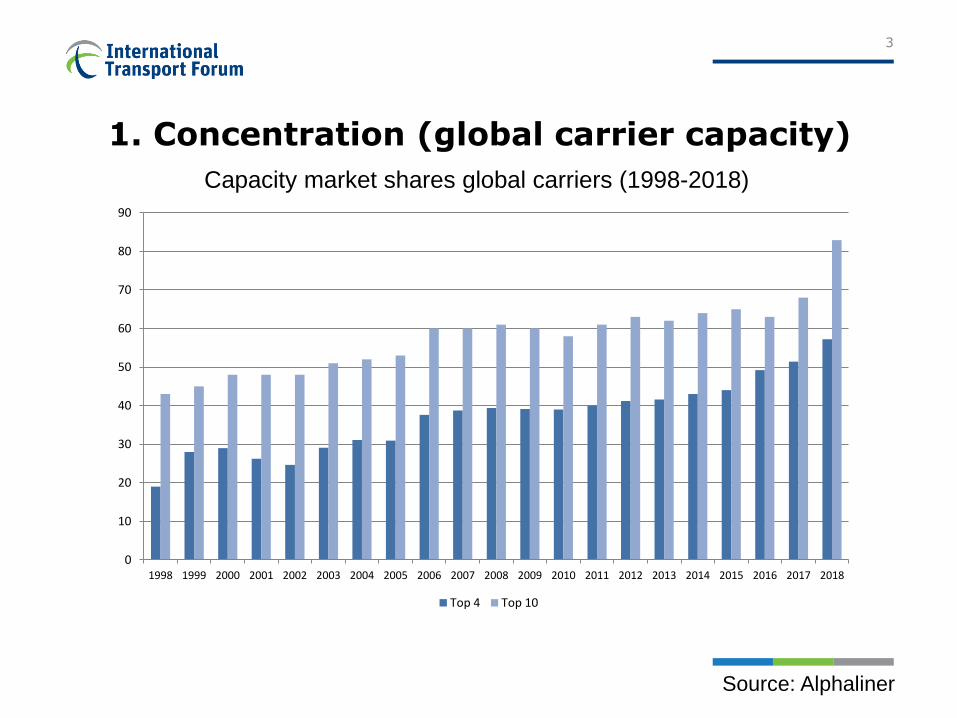
1. Concentration (global carrier capacity)
3
0
10
20
30
40
50
60
70
80
90
1998 1999 2000 2001 2002 2003 2004 2005 2006 2007 2008 2009 2010 2011 2012 2013 2014 2015 2016 2017 2018
Top 4 Top 10
Capacity market shares global carriers (1998-2018)
Source: Alphaliner
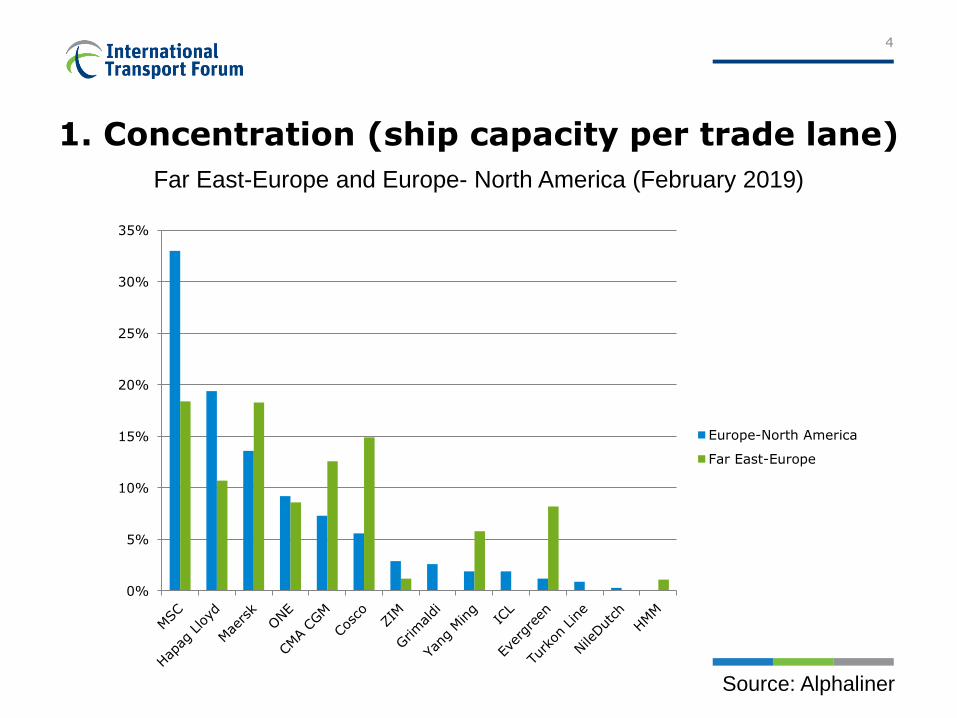
1. Concentration (ship capacity per trade lane)
4
0%
5%
10%
15%
20%
25%
30%
35%
Europe-North America
Far East-Europe
Far East-Europe and Europe- North America (February 2019)
Source: Alphaliner

1. Concentration (alliances)
5
0%
10%
20%
30%
40%
50%
60%
70%
80%
90%
100%
Med-N America East Coast
N Europe-N America East Coast
Asia-Med
Asia-North Europe
Share non-alliances in East-West trades (2012-2018)
Source: Sea Intelligence
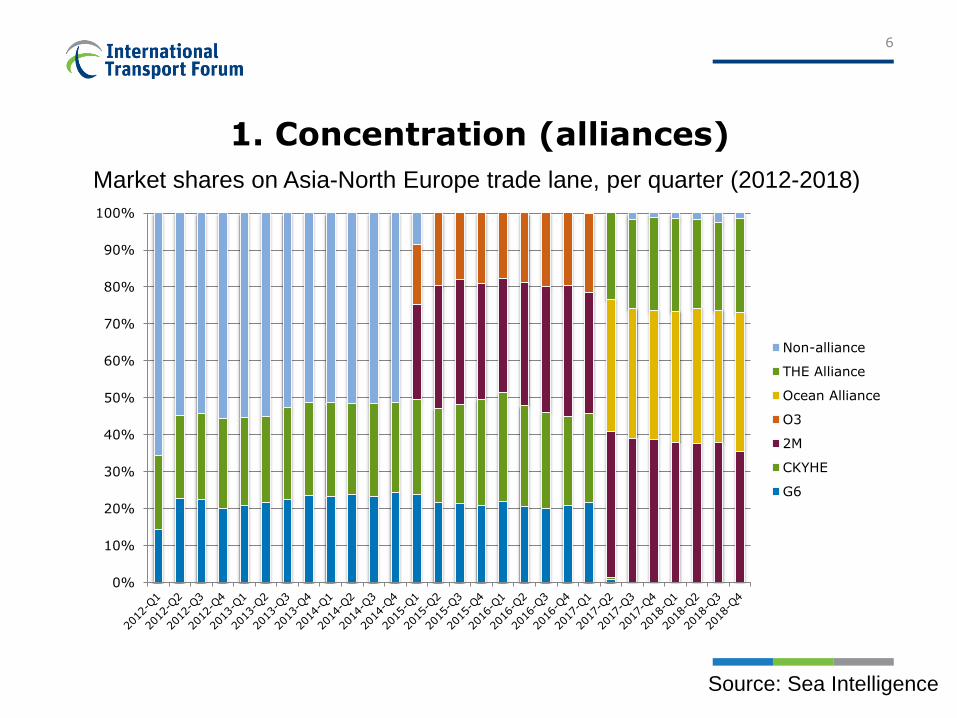
1. Concentration (alliances)
6
0%
10%
20%
30%
40%
50%
60%
70%
80%
90%
100%
Non-alliance
THE Alliance
Ocean Alliance
O3
2M
CKYHE
G6
Market shares on Asia-North Europe trade lane, per quarter (2012-2018)
Source: Sea Intelligence

1. Concentration (alliances)
7
0%
10%
20%
30%
40%
50%
60%
70%
80%
90%
100%
Non-Alliance
THE Alliance
Ocean Alliance
2M
G6
New World Alliance
Grand Alliance
Market shares on North Europe- North America East Coast trade lane (2012-2018)
Source: Sea Intelligence

1. Concentration (ship size)
8
Source: Sea Intelligence

2. Vertical integration (feedering)
9
0%
10%
20%
30%
40%
50%
60%
70%
80%
90%
100%
UK and Ireland Iberian Atlantic Baltic West Med Black Sea Adriatic and
Aegean
Common Dedicated
Share of common and dedicated operators in European regions
Source: Dynamar

2. Vertical integration (terminals)
10
0%
10%
20%
30%
40%
50%
60%
70%
80%
90%
100%
2007 2008 2009 2010 2011 2012 2013 2014 2015 2016 2017
Carrier-controlled operators Independent global terminal operators Other
Types of terminal operators in Europe (2007-2017)
Source: Drewry

3. Price
11
Source: Sea Intelligence

4. Service quality (direct liner connectivity)
12
0%
10%
20%
30%
40%
50%
60%
70%
2006 2008 2009 2010 2011 2012 2013 2014 2015 2016
0 transhipment 1 transhipment 2 transhipments
Share of countries that can be reached by German exporters with zero transhipment 2006-2016
Source: UNCTAD
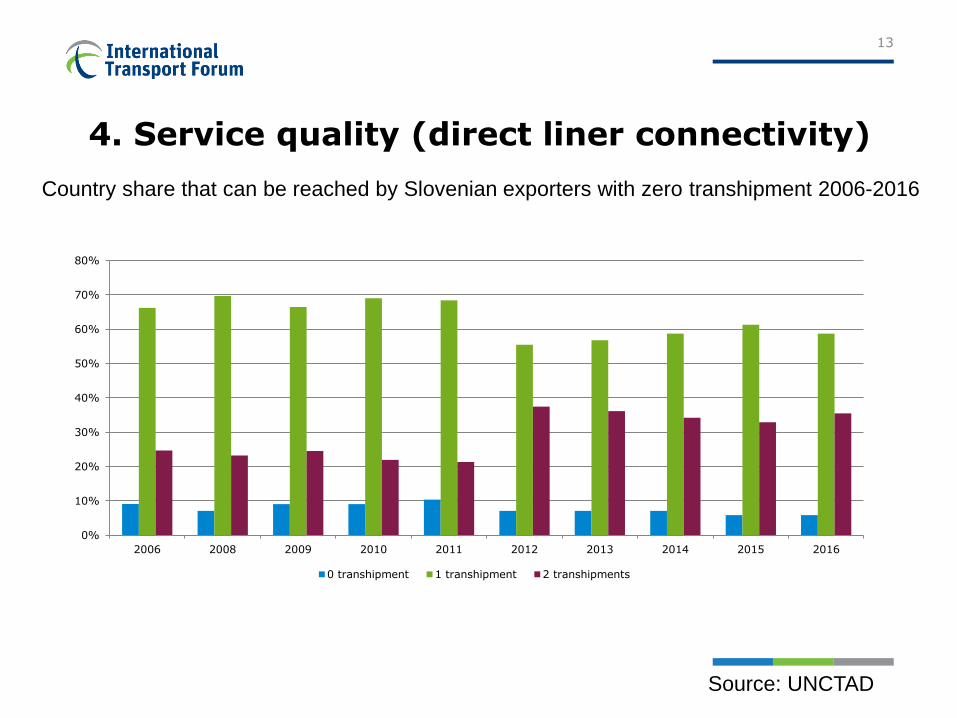
4. Service quality (direct liner connectivity)
13
0%
10%
20%
30%
40%
50%
60%
70%
80%
2006 2008 2009 2010 2011 2012 2013 2014 2015 2016
0 transhipment 1 transhipment 2 transhipments
Country share that can be reached by Slovenian exporters with zero transhipment 2006-2016
Source: UNCTAD

4. Service quality (port-to-port connections)
14
170
180
190
200
210
220
230
Dis
tin
ct
po
rt
pair
s
Distinct port pairs on Asia-North Europe services 2012-2018
Source: Sea Intelligence

4. Service quality (port-to-port connections)
15
240
260
280
300
320
340
360
Dis
tinct
port
pairs
Distinct port pairs on Asia-Med services 2012-2018
Source: Sea Intelligence

4. Service quality (service frequency)
16
10
12
14
16
18
20
22
24
26
Jan-12 Jan-13 Jan-14 Jan-15 Jan-16 Jan-17 Jan-18 Jan-19
Asia-NEUR Asia-MED Linear (Asia-NEUR) Linear (Asia-MED)
Weekly service frequency on Asia-Europe trade lanes 2012-2018
Source: Sea Intelligence

4. Service quality (service frequency)
17
5
7
9
11
13
15
17
Jan-12 Jan-13 Jan-14 Jan-15 Jan-16 Jan-17 Jan-18 Jan-19
NEUR-USEC MED-USEC Linear (NEUR-USEC) Linear (MED-USEC)
Weekly service frequency on Transatlantic trade lanes 2012-2018
Source: Sea Intelligence

4. Service quality (schedule reliability)
18
0%
10%
20%
30%
40%
50%
60%
70%
80%
90%
100%
Asia - Mediterranean
Asia - North Europe
Global average
Transatlantic Eastbound
Transatlantic Westbound
Schedule reliability on European trade lanes (2012-2018)
Source: Sea Intelligence

4. Service quality (blank sailings)
19
0
5
10
15
20
25
30
35
Nu
mb
er o
f b
lan
k s
ail
ing
s
Asia-North Europe
Asia-Mediterranean
Number of blanked sailings on Asia-Europe trade lanes (2012-2018)
Source: Sea Intelligence

4. Service quality (blank sailings)
20
0
50 000
100 000
150 000
200 000
250 000
300 000
350 000
400 000
450 000
Cap
cit
y w
ith
draw
n b
ecau
se o
f b
lan
ked
sail
ing
s (
TE
U)
Asia-North Europe
Asia-Mediterranean
Capacity withdrawn because of blanked sailings on Asia-Europe trade lanes (2012-2018)
Source: Sea Intelligence

Impact on transport stakeholders
• What are the most relevant developments in
container shipping since the last Review of the
Consortia Block Exemption Regulation?
• What are the most important concerns now and
for the future for your organisation that the
Review should take into account?
21