trend insights -...
TRANSCRIPT

TRENDINSIGHTS
Automotive Sales Analysis
Feb. 2016

2 TRENDS | INSIGHTS
Automotive News Data Center reported that U.S. auto sales reached all-time high in 2015
selling 17.47 million light trucks and vehicles, eclipsing the old mark set in 2000 when 17.35
million were sold. By comparison, in 2009 at the height of the economic recession, only 10.4
million vehicles were sold. (At that time both GM and Chrysler declared bankruptcy and
received government bailouts). The 2015 sales represent an increase of 5.7% from the previous
year, it marked the sixth consecutive year of annual increase in light vehicle sales. The last time
the industry experienced six consecutive years of sales growth was in the 1920’s.
U.S. Light Vehicle Sales 1999-2015(in millions)
Source: SME.org & Automotive News
U.S. AUTOMOTIVE SALES SETS A RECORD
1999 2000 2001 2002 2003 2004 2005 2006 2007 2008 2009 2010 2011 2012 2013 2014 2014
20
18
16
14
12
10
8
6
4
2
0
17.0 17.4 17.2 16.8 16.7 16.9 17.016.6
16.1
13.2
10.4
11.6
12.8
14.515.6
16.517.5

3
Reasons for the Strong Automotive Market: There were several reasons for such a strong
year in sales. The price of gas continues to drop, according to the AAA, averaging only
$2.00 a gallon by yearend nationwide. Another factor was the interest rates hovering
around zero. By comparison, in 2000, the interest rates averaged 6.2%. A stronger
economy, also helped boost sales, with more people working (The Bureau of Labor
Statistics reported that 2.65 million jobs were added in 2015, many of them under the age
of 35), consumers could now afford to buy new cars and many needed an automobile to
commute. Additionally, there are a lot of older cars on the road, according to a survey
from IHS Automotive, the average age of a vehicle on the road in 2015 was a record high
11.5 years and needed to be replaced. (Polk reports the replacement rate for vehicles
increases notably when they reach 13 years). Another reason for the strong year was the
popularity of leasing, according to Edmonds, leases on new cars accounted for 29% of
all U.S. retail sales, up 2% from 2014. In contrast, the leasing figure in 2005 was 16.6%.
To further emphasize the strong automotive market, the Wall Street Journal reported,
Americans, in total, spent approximately $570 billion in new cars in 2015. Additionally,
CNN/Money said in 2015 the balance on car loans exceeded $1 trillion for the first time.
Crossover SUV’s Popular: With the cost of gas dropping, one of the more popular car
type sold in 2015 were SUV’s. By fourth quarter 2015, Kelly Blue reported that small sized
(“crossover”) SUV’s garnered a 14% market share, greater than both small and midsize
sedans. The top selling model was the Honda CR-V with about 900 units sold each day of
the year. The Honda CR-V outsold Honda Civic for the second straight year. Another popular
crossover SUV model was the Nissan Rogue which reported an increase in sales of 44%.
Fuel Efficient Cars Not As Popular: With the cost of gas dropping the sales of the fuel
efficient small cars, hybrids and electric all decreased as consumers saw less of a need for
them. According to the Associated Press, The Toyota Prius hybrid had a fall-off in cars sold
of 11% in 2015 to 185,000 models sold. The Nissan Leaf an electric car had sales decline by
43% in 2015 to 17,000 models sold. The Chevrolet Sonic, a top subcompact car reported a
decrease in sales of 31% compared to the previous year.
TRENDS | INSIGHTS

4 TRENDS | INSIGHTS
Best Selling Vehicles: The ten best-selling car models all sold over 300,000 units in 2015.
For the sixth consecutive year Ford’s F-Series light trucks was the top selling car model.
In 2015 Ford sold 780,354 F Series trucks which, according to USNews.com, comes to
more than one every minute. Ford revamped its F-150 model during the year partially
adding aluminum to cut weight. According to Autodata, the sales of light trucks grew by
13% in 2015 to 9.7 million units. The top three selling vehicles in 2015 were light trucks.
Conversely, the sales of cars dropped by 2% selling 7.7 million vehicles. This marked the
sixth straight year that light trucks have outsold cars.
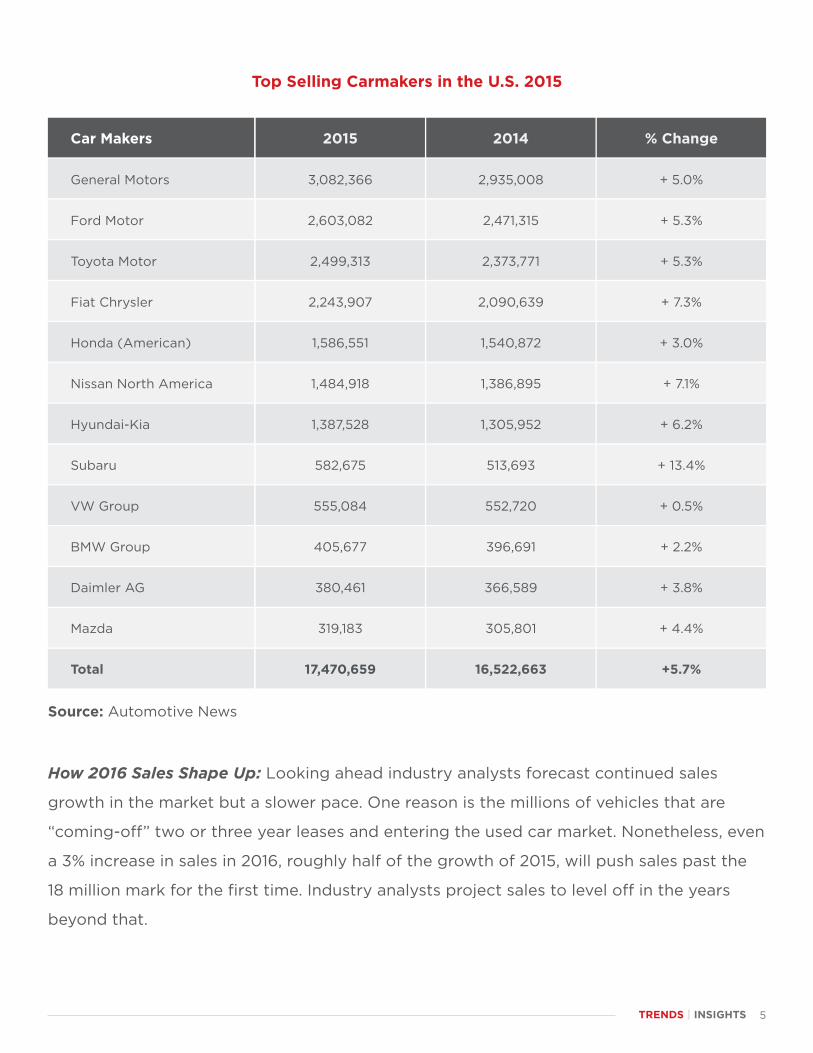
A Banner Year for Carmakers: According to Automotive News, General Motors, led all
automotive companies in 2015, selling over three million cars and trucks, a 5% increase
of over 2014. Ford Motor, Toyota Motor and Fiat Chrysler all sold over two million cars in
2015. Honda, Nissan and Hyundai-Kia all sold over one million automobiles in 2015. The
fastest growing car seller was Subaru who reported a sales increase of 13.5% when 2015
is compared to the previous year. The three top selling carmakers, General Motors, Ford
Motor and Toyota Motor accounted for nearly 47% of all cars sold in 2015.
Ford F Series
Chevrolet Silverado
Dodge Ram
Toyota Camry
Toyota Corolla
Honda Accord
Honda CR-V
Honda Civic
Nissan Altima
Toyota RAV4
780,354
600,544
451,116
429,355
363,332
355,557
345,647
335,384
333,398
315,412
Top Selling Car Models 2015 (Units)
Source: Automotive News
5TRENDS | INSIGHTS
How 2016 Sales Shape Up: Looking ahead industry analysts forecast continued sales
growth in the market but a slower pace. One reason is the millions of vehicles that are
“coming-off” two or three year leases and entering the used car market. Nonetheless, even
a 3% increase in sales in 2016, roughly half of the growth of 2015, will push sales past the
18 million mark for the first time. Industry analysts project sales to level off in the years
beyond that.
Top Selling Carmakers in the U.S. 2015
Source: Automotive News
2015
3,082,366
2,603,082
2,499,313
2,243,907
1,586,551
1,484,918
1,387,528
582,675
555,084
405,677
380,461
319,183
17,470,659
2014
2,935,008
2,471,315
2,373,771
2,090,639
1,540,872
1,386,895
1,305,952
513,693
552,720
396,691
366,589
305,801
16,522,663
Car Makers
General Motors
Ford Motor
Toyota Motor
Fiat Chrysler
Honda (American)
Nissan North America
Hyundai-Kia
Subaru
VW Group
BMW Group
Daimler AG
Mazda
Total
% Change
+ 5.0%
+ 5.3%
+ 5.3%
+ 7.3%
+ 3.0%
+ 7.1%
+ 6.2%
+ 13.4%
+ 0.5%
+ 2.2%
+ 3.8%
+ 4.4%
+5.7%

www.ComcastSpotlight.com