skills trend analysis - skillingpakistan.orgskillingpakistan.org/files/1/skills trend...
TRANSCRIPT

SKILLSSKILLSTRENDTRENDANALYSISANALYSIS
SKILLSTRENDANALYSISNational & International
Published by

National Vocational & Technical Training Commission (NAVTTC)5th Floor, Evacuee Trust ComplexSector F-5/1, IslamabadTel: +92 51 904404Fax: +92 51 904404Email: [email protected]
Author:Sayed Asghar Shah, Data Analyst, NSIS Cell, TVET Reform Support Programme Mansoor Zaib Khan, Labour Market Analyst, NSIS Cell, TVET Reform Support Programme
Layout and Design:Niaz Muhammad, Graphic Designer, TVET Reform Support Programme
Printed by:
February, 2017
This document has been produced with the technical assistance of TVET Reform Support Programme, which is funded by the European Union, the Embassy of the Kingdom of the Netherlands, Federal Republic of Germany and the Royal Norwegian Embassy. The Programme has been commissioned by the German Federal Ministry for Economic Cooperation and Development (BMZ) and is being implemented by the Deutsche Gesellschaft für Internationale Zusammenarbeit (GIZ) GmbH in close collaboration with National Vocational and Technical Training Commission as well as provincial technical and vocational training authorities and private sector organizations. The views expressed in this publication are those of author and do not necessarily representative of the position of the GIZ and NAVTTC.

Skills Trend AnalysisNational & International

TABLE OF CONTENTs
Abbreviations used
Executive Summary 4
Introduction 5
Objectives 7
Methodology 8 Country-wise Skilled Demand 9 Province Skilled Workforce Demand 9 District-wise Skilled workforce Demand 10 Level of Experience-wise Skilled Workforce Demand 10 Qualification-wise skilled workforce Demand 11 Gender-wise Skilled Workforce Demand 12 Sector-wise Skilled Workforce Demand in National & International Labour Market 12 Gender- & Age-wise Skilled Workforce Demand 13
Top 10 Most Demanding Trades 15
Recommendations 16
Annex 1: Skills Supply and Demand Gaps 17

ACRONYMs UsED
DAE Diploma in Associate Engineer
DBA Diploma in Business Administration
DIT Diploma in Information Technology
FATA Federally Administrated Tribal Area
GCC Gulf Cooperation Council
NSIS National Skills Information System
NVQF National Vocational Qualification Framework
NAVTTC National Vocational and Technical Training Commission
P&D Planning & Development
RAC Refrigeration and Air conditioning
S&C Skills Standards & Curricula
TVET Technical Vocational Education & Training
UAE United Arab Emirate

4 National Skills Information System (NSIS)
EXECUTIVE sUMMARY
Socio-economic development of a nation is linked with availability of educated and trained workforce. If education is considered to be the “key”, then Technical Vocational Education & Training (TVET) is termed as “master key” to development. In order to reform the TVET Sec-tor, National Vocational & Technical Training Commission is looking into the issues pertaining to policy guideline, coordination, standardization, regulation, National Vocational Qualifica-tions Framework (NVQF), Accreditation, Apprenticeship, demand driven and market based training by enhancing the greater role of employer including private sector working in TVET Sector.
The total supply of the skilled workforce in 2015 was 318000 (39% female and 61% male) against the labour market demand which is around 491000 (Pakistan & GCC countries only). The demand of national market was 33362 (20% of the total national demand) and overseas 463398 (GCC countries).Saudi Arab has the highest skilled workforce demand 49%, followed by UAE 36%, and Pakistan with 25% on third number.
As per the provincial distribution of skilled workforce demand Punjab was the highest with 43% followed by Sindh 18%. District workforce demand analysis postulate Karachi as highest with 15.4% and Islamabad tipped second with proportion of 14.3% followed by Lahore 10%. The female proportion in annual skilled workforce supply was 39%, but the female specific de-mand was around 6% only. The highest demand of national (71%) as well international labour market (52%) was observed for mid-level experience skilled workforce.
Highest demand was observed in Vocational trade, but most demanded trade even do not exist in Pakistan TVET system, around 43% gaps was observed in skilled worked force supply and labour market demand.
The age wise skilled workforce demand of international labour market is started from the age of 27 year and above, as against the national labour market where it is started from 18 year and closing on 35year.

5Skills Trend Analysis (National & International)
INTRODUCTION
Skill shortages and surpluses have emerged during the process of economic transition in Pakistan as a consequence of privatization and economic restructuring. Newly created jobs due to technological modification required different advance skills and demand for new skills that takes place more rapidly than the education and training system that could able to adapt to widespread skill shortages. Moreover, economical structural changes at National and Provincial level lead to skill mismatch making this a permanent phenomenon resulting in high levels of long-term unemployment. Such skills mismatch increases with the age of workers in Pakistan than falling as against happen in the developed economies.
Realizing the need, the National Vocational & Technical Training Commission (NAVTTC), Government of Pakistan established a National Skill Information System (NSIS) under TVET Reform Programme of GIZ at its Headquarters in Islamabad in December, 2014.
The main objective of NSIS Cell is following:• Develop/provideareliableInformationSystemforworkforcedevelopmentinemployable
skills- Skills Information System- Establish data collection system (Supply & Demand)- Supply & Market Demand Management- Supply & Market Demand Analysis
• Providetimelyandaccurateinformationondemandandsupplyanalysis,toTVETplan-ners, training institutions, industry, academia, students and public in general;- Information Dissemination System- Establishinteractiveplatform/networkforTVETStakeholders- Align TVET Plans, Policies, Programs with SIS
• Establishandfacilitatecareer/vocationalguidanceandplacementservicesforTVETgraduates and potential employers;- EstablishCareer/VocationalGuidanceService- Establish Job Placement Service- Provide information on skills available & skills required
The objective of the jobs analysis is to find out skills demand of job market in various TVET related trades in Pakistan, identify deficiencies and opportunities of each trade in national and international job markets.

6 National Skills Information System (NSIS)
Information compiled in this monthly report is collected by NSIS cell through the various jobs for skilled workforce, advertised in national and international job websites and newspapers on daily basis. The NSIS cell will also issue a regular monthly job bulletin. In addition to this, a periodical/annualreportwillalsobecompiledfromthemonthlydatabank.Thisdatawillpro-vide basis to conduct analysis, identify nation-wide supply and demand gaps of TVET Gradu-ates in addition to identification of trend and impact of training conducted in a whole year.
AllthenationalandInternationalTVETinformationisavailableontheNSISwebsite(http://www.skillingpakistan.org/)andsharingits’updatesonskillingPakistanFacebookpage(https://www.facebook.com/skillingpakistan)linkingthejobseekertonationalandinterna-tional market.

7Skills Trend Analysis (National & International)
OBJECTIVEs
There are two ways to calculate the National and International Market skills demand, one is to conduct sample based survey covering various sectors and the other is to collect job data from national and international job sites, dedicated job portals, newspapers and others sources including social media and company web portal. The NSIS cell is piloting both ways to collect job data in Khyber Pakhtunkhwa province. To this, a sample based survey has been conducted and collected job information from secondary sources including national and international job markets. This approach is taken judiciously by all the stakeholders and now, NSIS cell is consid-ering its replication in other provinces too.
In Pakistan, the employer hired a private job service provider to seek skilled human resource and seldom advertise jobs openly but in some cases they alsoadvertise within the industrial zones. Such data constraints owing to variety of reasons including the ones quoted earlier has limited this diagnostic report that only accounts for 20% of the actual demand of the national labour market. Followings are the main objectives of this diagnostic report:
1. To calculate skills supply and demand Gaps Analysis2. To adjust the skills supply as per the Labour Market demand

8 National Skills Information System (NSIS)
METHODOLOGY
NSIS adopted multi-pronged strategy to collect data from diverse sources to build job data bases. Firstly, daily jobs advertise from national and international (Including GCC countries- Hot market for Pakistani skilled and unskilled workers) job sites, newspaper, and social media enabling the policy planner to find means and ways to reduce demand and supply gaps exist in national and international markets. Secondly, sample based job survey has been conducted to find trends occurring in the local markets. This NSIS effort will enable creation of a growing job databases, create awareness among job seekers about the skills gap exist in the markets, and linking them with employer. This unique NSIS job database will also help employers to find out appropriate skill holders of their choice.

9Skills Trend Analysis (National & International)
CounTry WiSe Skilled demAndIn 2015, the Saudi Arab demand of skilled workforce was highest at 49% followed by UAE 36% and Pakistan 25% and all the remaining countries were below 5%. Trends shown in Figure 1 further endorses the fact that GCC countries has more of skills demand which can be tapped by meeting it with local skills market.
Figure 1: Country Wise Skills Workforce Demand
64606
48274
33362
4984 45492434 2286 1678 1555 1100 1060 54 18
0
10000
20000
30000
40000
50000
60000
70000
Saudi Arab
UAE Pakistan Bahrain Qatar Malaysia Oman Muscat Kuwait Turkey Egypt Iraq Yamen
NO
.
ProvinCe Skilled WorkforCe demAndThis is highly encouraging that Pakistan proportion of demand of skilled workforce is one-fourth of the total demand. Within Pakistan, this demand is spread out to all geographic regions. Punjab is having highest proportion of around 48% followed by Sindh 18%, Islamabad Capital Territory and Khyber Pakhtunkhwa 14% each while very less for Baluchistan.
Figure 2: Province Wise Skills Workforce Demand
14289
61454762 4706
1823 1283268 86
0
2000
4000
6000
8000
10000
12000
14000
16000
NO
.

10 National Skills Information System (NSIS)
diSTriCT WiSe Skilled WorkforCe demAndThis diagnostic is further unfolded to the district level with an objective to estimate skill gap and enable policy planners to determine the skilled workforce supply as per the local economy of district, province and national and remaining workforce to align the skills demand of the international market. TVET sector is the most sensitive area for economic transaction; it is suggested to conduct regular research activities for all the relevant stakeholders. As per the fol-lowing table, the highest skills demand is recorded in Karachi (15.4%) followed by Islamabad 14.3% and Lahore 10.0%.
Table 1: District Wise Skills Demanddistrict no. of Post Percentage
Karachi 5,139 15.4
Islamabad 4,762 14.3
Lahore 3,344 10.0
Peshawar 2,693 8.1
Faisalabad 2,202 6.6
FATA (Agencies) 1,823 5.5
Multan 1,472 4.4
sahiwal 1,200 3.6
Quetta 988 3.0
Khanawal 810 2.4
Bahawalpur 696 2.1
Kasur 580 1.7
Hafizabad 574 1.7
Rawalpindi 454 1.4
Jacobabad 450 1.3
seikhupura 396 1.2
swabi 392 1.2
Pakpattan 340 1.0
sailkot 338 1.0
D.G.Khan 312 0.9
Jehlum 312 0.9
Gujrat 264 0.8
Attock 260 0.8
Kohat 255 0.8
swat 238 0.7
Benazirabad 230 0.7
Charsadda 224 0.7
D.I.Khan 224 0.7
Mardan 224 0.7
Mianwali 210 0.6
sargodha 196 0.6
Muzaffarabad 188 0.6
Haripur 171 0.5
sukkur 170 0.5
Gwadar 160 0.5
Karak 160 0.5
Hyderabad 156 0.5
Guranwala 155 0.5
Abbottabad 140 0.4
Lasbela 120 0.4
Chakwal 94 0.3
Gilgit 86 0.3
Bawalnager 80 0.2
Mirpur 80 0.2
G. Total 33,362 100
level of exPerienCe WiSe Skilled WorkforCe demAndIt is often considered that majority of the employers tend to hire experienced skilled person, Figure 3 showcases the tendency of national and international market regarding the level of skill. In international market, the highest demand of mid-level experience skilled workforce is estimated around 52% followed by fresh 30% and high level experience 18%. The National market also is nearly following the same pattern. The proportion of mid-level experience skilled workforce is around 71% followed by 29% and high level of experience 0.3%.

11Skills Trend Analysis (National & International)
Figure 3: Level of Experience Wise Skills Demand
0
10000
20000
30000
40000
50000
60000
70000
80000
Fresh Mid Level Senior Level
No. International
National
QuAlifiCATion WiSe Skilled WorkforCe demAndThe table 2 summarizes information about the qualification wise skilled workforce demand in national and international labour market. As per the statistics, the highest demand of the skilled workforce is recorded in trade certificate (Vocational trades), it is 65% in national mar-ket while 68% in international market. Health diploma demand in international market is 16% while 7% in national market, DAE is 5% in international market and 16% in national market, B. Tech 8% in international and 1% national market.
Table 2: Qualification Wise Skills Demand
level origin B. Tech dAe diploma driving lisence
Trade Certifi-cate G. Total
Fresh
Total 426 1,744 1,670 6,392 39,267 49,499
International 422 1,549 1,445 3,341 33,215 39,972
National 4 195 225 3,051 6,052 9,527
Mid-Level
Total 5,690 8,640 11,781 1,226 65,020 92,357
International 5,514 3,404 9,647 443 49,620 68,628
National 176 5,236 2,134 783 15,400 23,729
senior Level
Total 5,021 1,172 9,661 360 7,900 24,114
International 5,021 1,154 9,661 360 7,812 24,008
National 18 88 106
Grand Total 11,137 11,556 23,112 7,978 112,187 165,970

12 National Skills Information System (NSIS)
Gender WiSe Skilled WorkforCe demAndHuge gap is identified in the gender wise skilled workforce supplies to the market demand. This may be attributed to the nature of work that suits more male than female. In international labour market, the demand for male skilled worker is around 98% while female skilled worker demand is around 2%. In the national labour market, trend is no different from international market, male skilled worker demand is around 89% while female skilled worker demand is 2% and 9% for both gender. The proportion of female in annual skilled workforce supply is around 39%. This raises a question of weak utilization of skilled female worker in national and international markets. More in-depth analysis is needed to determine the weak utilization of female workers as against the investments made in the TVET sector.
Figure 4: Gender Wise Skill Demand
130314
2270 24
29553
2270 30510
20000
40000
60000
80000
100000
120000
140000
Male Female Both Gender
No. International
National
SeCTor WiSe Skilled WorkforCe demAnd in nATionAl & inTernATionAl lABour mArkeTTable 3 provides sector wise analysis of skilled workforce demand in in national and interna-tional labour market. In international market, the highest demands concentrate in Construction sector with 55% followed by Maintenances & Repair at 17%, Services at 11% and manufacturing 8%. In national labour market, the highest demand is in manufacturing sector at 33% followed by services sector 27% and construction sector 16%. A clear divide is visible in sector demand in national and international labour market that accounts for skills gap persists in the local skill market. Such diagnostic reports will help policy planners to look into the trends over the years to make informed decisions for prioritizing the skills nationally and globally.
13Skills Trend Analysis (National & International)
Table 3: Sector Wise Skill demandSector international national Grand Total
Communication 1090 1165 2255
Construction 72671 5420 78091
Hospitality 1102 1102
Livestock 1564 123 1687
Maintenances & Repair 22786 3855 26641
Manufacturing 11236 11042 22278
Oil & Gas 4727 4727
Power 2833 2669 5502
services 14599 9088 23687
Grand Total 132608 33362 165970
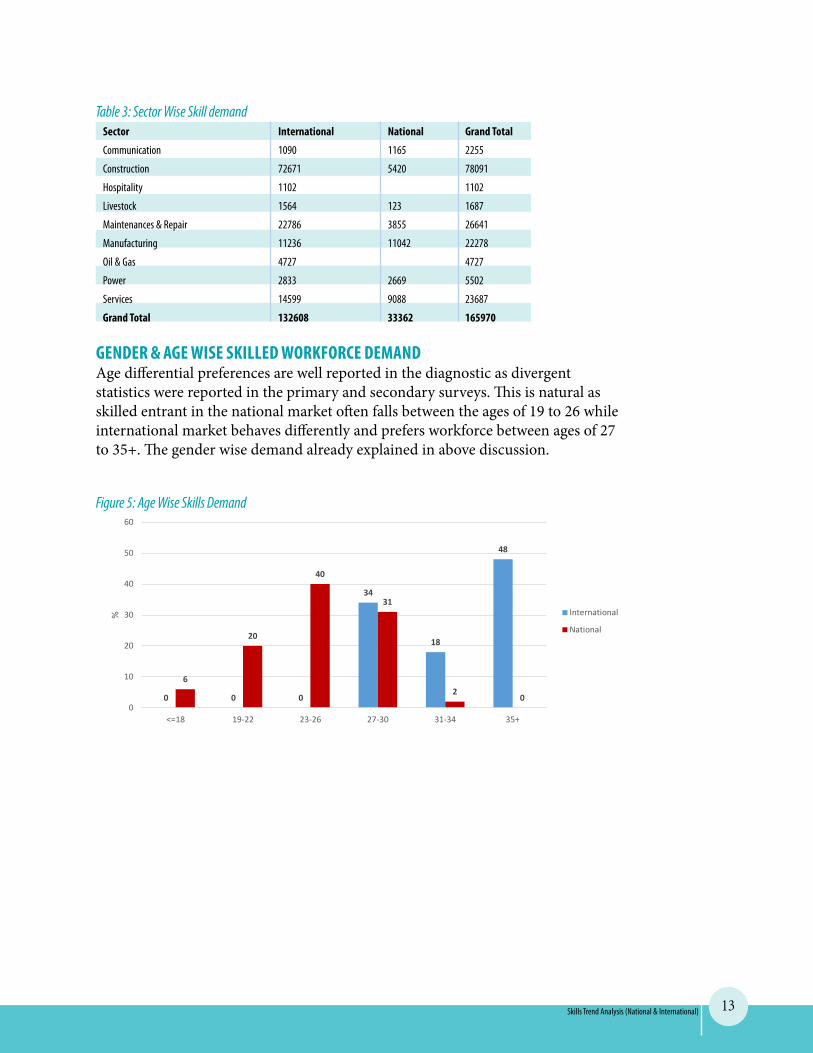
Gender & AGe WiSe Skilled WorkforCe demAndAge differential preferences are well reported in the diagnostic as divergent statistics were reported in the primary and secondary surveys. This is natural as skilled entrant in the national market often falls between the ages of 19 to 26 while international market behaves differently and prefers workforce between ages of 27 to 35+. The gender wise demand already explained in above discussion.
Figure 5: Age Wise Skills Demand
0 0 0
34
18
48
6
20
40
31
20
0
10
20
30
40
50
60
<=18 19-22 23-26 27-30 31-34 35+
% International
National

14 National Skills Information System (NSIS)
Table 4: Gender & Age Wise Skill DemandAge male female Both Grand Total
<= 18 1,703 44 158 1,905
19 - 22 6,023 138 678 6,839
23 - 26 11,848 306 1,281 13,435
27 - 30 52,828 1,329 880 55,037
31 - 34 24678 415 76 25169
35+ 62,787 796 2 63,585
Grand Total 159,867 3,028 3,075 165,970
15Skills Trend Analysis (National & International)
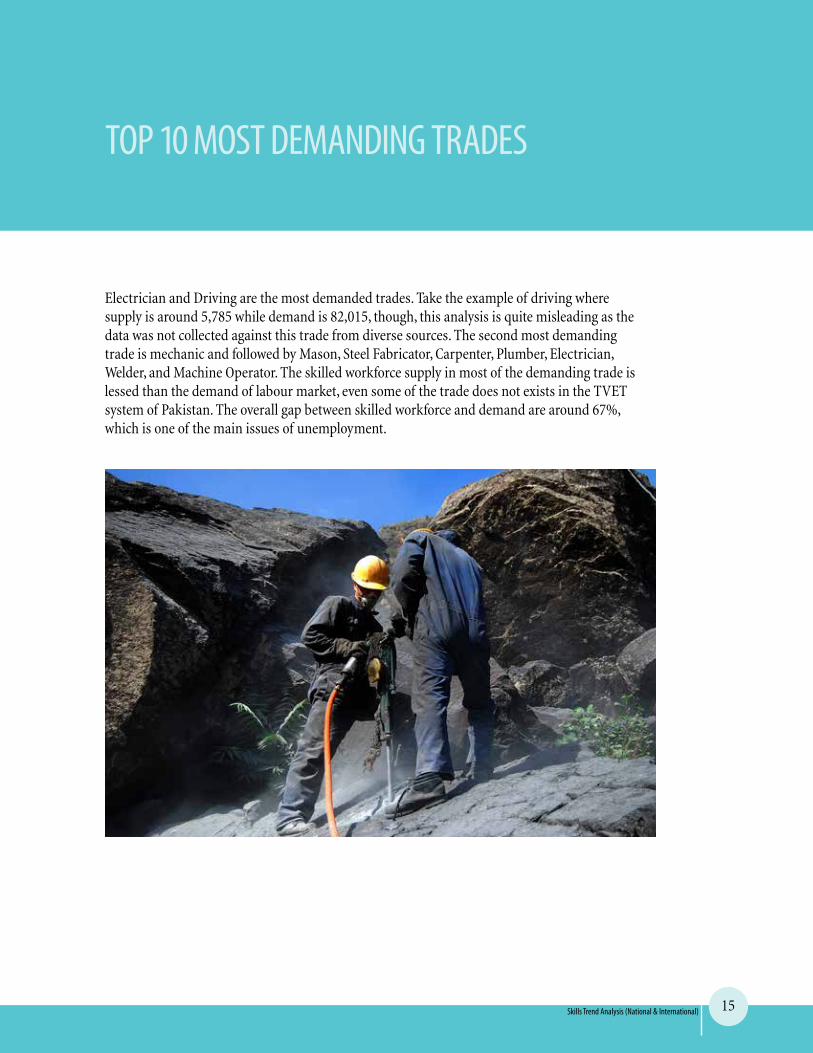
TOP 10 MOsT DEMANDING TRADEs
Electrician and Driving are the most demanded trades. Take the example of driving where supply is around 5,785 while demand is 82,015, though, this analysis is quite misleading as the data was not collected against this trade from diverse sources. The second most demanding trade is mechanic and followed by Mason, Steel Fabricator, Carpenter, Plumber, Electrician, Welder, and Machine Operator. The skilled workforce supply in most of the demanding trade is lessed than the demand of labour market, even some of the trade does not exists in the TVET system of Pakistan. The overall gap between skilled workforce and demand are around 67%, which is one of the main issues of unemployment.

16 National Skills Information System (NSIS)
RECOMMENDATIONs
• Theexistingsupplypatternsneedtochangeasperthedemandofnationalandinterna-tional labour market.
• Theproportionoffemaleinskilledworkforcesupplyisaround39%whiledemandisaround 6% raising an important question of utilization of 33% contributing either towards informal market or to the household economy
• Theproportionoftechnicalandvocationalsupplyneedtobaseonmarketdemand.• Provincialanddistrictlevelskilledworkforcesupplyneedtobaseonthelocaleconomy
skills gap analysis.• TheTVETsectorissensitivetoeconomictransition,thereforeitissuggestedthateach
stakeholder should establish research unit to calculate the impact of economic transition to avoid unemployment.

17Skills Trend Analysis (National & International)
ANNEX 1: sKILLs sUPPLY AND DEMAND GAPs
TradeSupply 2014-15 demand - 2015
Country nAvTTC Total local overseas PoePA Total Gaps
Driver 5,785 - 5,785 3,896 1,081 77,038 82,015 (76,230)
Mechanic 169 175 344 3,138 5,316 36,228 44,682 (44,338)
Mason 2,819 50 2,869 104 2,945 36,170 39,219 (36,350)
steel Fabricator 23 - 23 309 16,900 15,854 33,063 (33,040)
HTV Driver - - - 84 32,070 - 32,154 (32,154)
Carpenter 5,353 184 5,537 657 919 20,820 22,396 (16,859)
Electrician 7,443 2,566 10,009 1,089 507 19,890 21,486 (11,477)
Agricultural Field Assistant 118 25 143 10 30 18,069 18,109 (17,966)
Plumber 3,639 477 4,116 565 3,380 12,090 16,035 (11,919)
Machine Operator 463 25 488 711 1,579 11,288 13,578 (13,090)
Painter 997 - 997 252 745 12,046 13,043 (12,046)
Welder 7,626 1,011 8,637 400 1,628 10,643 12,671 (4,034)
Office Management 499 1,606 2,105 876 259 11,075 12,210 (10,105)
DBA 252 - 252 92 14 11,745 11,851 (11,599)
Fitter 625 40 665 322 5 10,052 10,379 (9,714)
Operator Heavy Machinery 103 - 103 12 10,158 - 10,170 (10,067)
sanitary Inspector 8 - 8 41 7,700 - 7,741 (7,733)
Concrete Plant Operator - - - - 7,739 - 7,739 (7,739)
Auto Diesel 1,597 190 1,787 - 5,443 - 5,443 (3,656)
Cook 2,355 775 3,130 939 132 4,238 5,309 (2,179)
Crane Operator - - - 36 5,256 - 5,292 (5,292)
Waiter - - - 60 71 5,063 5,194 (5,194)
supervisor - - - 70 44 4,805 4,919 (4,919)
Auto Mechanic 4,688 540 5,228 221 2,483 1,916 4,620 608
Tailoring 18,563 - 18,563 - - 4,366 4,366 14,197

18 National Skills Information System (NSIS)
TradeSupply 2014-15 demand - 2015
Country nAvTTC Total local overseas PoePA Total Gaps
Guard - - - 3,088 319 - 3,407 (3,407)
HVACR 6,727 988 7,715 356 2,636 - 2,992 4,723
Accounting 576 50 626 30 6 2,610 2,646 (2,020)
surveyor 72 15 87 63 - 2,229 2,292 (2,205)
AutoCAD 10,613 545 11,158 316 1,942 - 2,258 8,900
Computer Course 34,882 1,381 36,263 2,158 99 - 2,257 34,006
Aluminum Technician 1,758 - 1,758 110 1,871 - 1,981 (223)
shuttring carpenter 24 - 24 84 1,790 - 1,874 (1,850)
DAE - Civil 20,974 - 20,974 1,616 167 - 1,783 19,191
Fire Fighters - - - 10 1,732 - 1,742 (1,742)
Quantity surveyor 766 205 971 464 824 - 1,288 (317)
Mason Pluster - - - - 1,283 - 1,283 (1,283)
DAE - CIT 6,091 - 6,091 86 7 1,130 1,223 4,868
BTech Civil 453 - 453 914 300 - 1,214 (761)
Tile & Marble Fixer 20 - 20 84 1,066 - 1,150 (1,130)
Rigging supervisor - - - - 68 1,075 1,143 (1,143)
Labourer - - - 32 1,090 - 1,122 (1,122)
Lab Technician 65 263 328 1,058 34 - 1,092 (764)
Graphic Designing 756 387 1,143 66 98 832 996 147
scaffolder - - - - 877 - 877 (877)
Blacksmith - - - - 827 827 (827)
Machinist 2,162 471 2,633 525 271 - 796 1,837
DAE - Mechanical 12,121 - 12,121 585 148 - 733 11,388
Duct Fabricator - - - - 704 - 704 (704)
Civil surveyor 1,553 472 2,025 373 277 - 650 1,375 Vocational Teachers Training Diploma 631 25 656 - - 648 648 8
BTech Electricial 718 - 718 459 160 - 619 99
BTech Mechanical 736 - 736 387 206 - 593 143
DAE - Electrical 17,783 - 17,783 428 132 - 560 17,223
Helper - - - 198 353 - 551 (551)
Draftsman 27 - 27 6 1 533 540 (513)
stenographer 889 - 889 14 6 518 538 351

19Skills Trend Analysis (National & International)
TradeSupply 2014-15 demand - 2015
Country nAvTTC Total local overseas PoePA Total Gaps
Nursing Assistant - 25 25 156 225 111 492 (467)
Medical Assistant 27 - 27 480 1 - 481 (454)
Hydraulic Mechanic - - - 5 473 - 478 (478)
LTV Driver - - - - 452 - 452 (452)
Domestic Tailoring 3,190 - 3,190 311 127 - 438 2,752
DAE - Instruments & Process 30 - 30 382 51 - 433 (403)
Quality Control Inspector - - - 128 298 - 426 (426)
Goldsmith - - - - 367 367 (367)
Draftsman - Civil 1,295 25 1,320 166 113 - 279 1,041
DAE - Chemical 2,595 - 2,595 244 18 - 262 2,333
Radio & TV 1,276 40 1,316 259 3 - 262 1,054
Deziner - - - 255 - - 255 (255)
Lift Operator - - - 52 198 - 250 (250)
Auto Electrician 2,227 228 2,455 163 82 - 245 2,210
Mason Block - - - - 223 - 223 (223)
Dispenser 25 70 95 218 - - 218 (123)
Beautician 15,699 900 16,599 206 10 - 216 16,383
safety Officer 90 145 235 109 80 - 189 46
Pharmacist - - - - 177 177 (177)
X-Ray Technician - 35 35 170 4 - 174 (139)
Industrial Electrician 1,735 25 1,760 14 140 - 154 1,606
DAE - RAC 225 - 225 83 70 - 153 72
Hair & skin Care 101 25 126 94 58 - 152 (26)
Fabricator - 50 50 62 89 - 151 (101)
Dozzer Operator - - - - 144 - 144 (144)
DAE - Telecom 900 - 900 36 98 - 134 766
DAE - Architecture 614 - 614 127 7 - 134 480
Embroidery 2,868 276 3,144 124 - - 124 3,020
CAD / CAM 31 225 256 68 54 - 122 134
ECG Technician - - - 114 6 - 120 (120)
secretarial skill 83 45 128 113 5 - 118 10
Veterinary Assistant 73 25 98 115 1 - 116 (18)

20 National Skills Information System (NSIS)
TradeSupply 2014-15 demand - 2015
Country nAvTTC Total local overseas PoePA Total Gaps
Art & Painting 255 - 255 56 20 37 113 142
Cleaner - - - - 94 - 94 (94)
Insulator - - - - 94 - 94 (94)
Janitor - - - 88 - - 88 (88)
Clinical Assistant 1,456 - 1,456 86 1 - 87 1,369
CNC Machine Operator 25 502 527 62 15 - 77 450
Airport Loader - - - - 75 - 75 (75)
Control Room Operator - - - 74 - - 74 (74)
Instrumentation 959 - 959 5 67 - 72 887
Dress Designing & Making 4,019 1,927 5,946 71 - - 71 5,875
Photographer 5 - 5 10 - 52 62 (57)
Aircraft Cleaner - - - - 58 - 58 (58)
Driller - - - 54 4 - 58 (58)
Plastic Molding 22 - 22 36 21 - 57 (35)
Duplicate Machine Operator - - - 52 5 - 57 (57)
Home Appliances 3,017 435 3,452 44 9 - 53 3,399
House Keeper - 220 220 24 26 - 50 170
Fireman - - - 49 - - 49 (49)
Draftsman - Mechanical 371 - 371 37 11 - 48 323
Loader Operator - - - 22 26 - 48 (48)
Ultrasound Technician - - - 40 5 - 45 (45)
Fashion Designing 1,825 249 2,074 42 1 - 43 2,031
CCTV Camera Technician 45 - 45 30 12 - 42 3
Ditch Witch Operator - - - 42 - - 42 (42)
spray Painting 10 - 10 12 29 - 41 (31)
Motor Winding 2,355 614 2,969 34 5 - 39 2,930
Dresser - - - 38 - - 38 (38)
Health Technician - - - 38 - - 38 (38)
Marble Cutting & Polishing 2,234 - 2,234 - 37 - 37 2,197
Tractor Mechanic 1,683 - 1,683 36 - - 36 1,647
DAE - Electronics 4,844 - 4,844 - 35 - 35 4,809
Carpet Weaving 30 - 30 34 - - 34 (4)

21Skills Trend Analysis (National & International)
TradeSupply 2014-15 demand - 2015
Country nAvTTC Total local overseas PoePA Total Gaps
Grader Operator - - - - 34 - 34 (34)
Locomotive Driver - - - 34 - - 34 (34)
DAE - Biomedical 255 - 255 30 - - 30 225
Fibre Optic 80 - 80 - 30 - 30 50
Roler Operator - - - - 28 - 28 (28)
Draftsman - Electrical 10 - 10 18 9 - 27 (17)
Gardener - - - 12 15 - 27 (27)
Mobile Phone Repairing 676 255 931 14 11 - 25 906
Professional Cooking 35 150 185 24 1 - 25 160
Die Maker - 155 155 24 - - 24 131
Decoration & Designing 280 75 355 14 9 - 23 332
Farm Manager - - - 22 1 - 23 (23)
sports Goods 37 65 102 22 - - 22 80
Press Designing 13 - 13 10 12 - 22 (9)
Matric Vocational 2,860 - 2,860 20 - - 20 2,840
Fitness Trainer - - - 20 - - 20 (20)
Bulldozer Operator 39 - 39 - 19 - 19 20
Craftsman - - - 19 - - 19 (19)
DAE - Auto 1,344 - 1,344 17 1 - 18 1,326
Hotel Management 37 - 37 7 11 - 18 19
Excavator Operator - - - 10 8 - 18 (18)
Charge Hand Fabricator - - - 14 4 - 18 (18)
Turner 810 96 906 17 - - 17 889
DAE - Food 1,141 - 1,141 12 3 - 15 1,126
False Celling 30 - 30 - 15 - 15 15
DAE - Mining 47 - 47 14 - - 14 33
Cutting & Tailoring 2,365 1,188 3,553 12 1 - 13 3,540
DAE - Mechatronic 373 - 373 12 1 - 13 360
Coating Inspector - - - - 13 - 13 (13)
Haydrolic Mechnic - - - - 13 - 13 (13)
Aircraft Technician - - - 10 3 - 13 (13)
steam Boiler Technician - - - 12 1 - 13 (13)

22 National Skills Information System (NSIS)
TradeSupply 2014-15 demand - 2015
Country nAvTTC Total local overseas PoePA Total Gaps
Hand Embroidery 3,353 993 4,346 12 - - 12 4,334
Cobbler - - - 12 - - 12 (12)
Hydraulic supervisor - - - 12 - - 12 (12)
Jeweller - - - 12 - - 12 (12)
Web Developer 3,015 110 3,125 10 - - 10 3,115
Industrial stitching 198 335 533 10 - - 10 523
Foundry & Pattern Making 104 20 124 10 - - 10 114
Gem stone & Cutting 20 100 120 10 - - 10 110
Polishing 16 20 36 10 - - 10 26
solar Installation 19 - 19 10 - - 10 9
Automotive - - - - 10 - 10 (10)
Cartographer - - - 10 - - 10 (10)
Conservation Assistant - - - 10 - - 10 (10)
Front Desk Officer - - - 10 - - 10 (10)
Greaser - - - 10 - - 10 (10)
Topographer - - - 10 - - 10 (10)
Depilex - - - 8 - - 8 (8)
service Crew 681 - 681 - 7 - 7 674
Crew Member - - - 7 - - 7 (7)
Kit Operator - - - - 6 - 6 (6)
DIT 9,753 - 9,753 - 5 - 5 9,748
DAE - Petroleum 492 - 492 - 5 - 5 487
Textile Weaving 52 200 252 5 - - 5 247
Assembler - - - - 5 - 5 (5)
Cabin Crew Instructor - - - - 5 - 5 (5)
Brazer Compressor - - - - 4 - 4 (4)
UPs Repairing 1,465 320 1,785 - 3 - 3 1,782
Call Center Agent - - - - 3 - 3 (3)
skid steel Loader 1,007 - 1,007 - 2 - 2 1,005
Travel Agent - - - - 2 - 2 (2)
Motorcycle Mechanic 2,361 355 2,716 - 1 - 1 2,715
DAE - Garments 298 - 298 - 1 - 1 297

23Skills Trend Analysis (National & International)
TradeSupply 2014-15 demand - 2015
Country nAvTTC Total local overseas PoePA Total Gaps
shipping supervisor 4 - 4 - 1 - 1 3
Hostess - - - - 1 - 1 (1)
Lead Cabin Crew - - - - 1 - 1 (1)
Carving 3 - 3 - - - - 3
scissor Cutting 4 - 4 - - - - 4
spinning 5 - 5 - - - - 5
Chara Bafi 8 - 8 - - - - 8
Renal Dialysis technician 8 - 8 - - - - 8
Cardiac Technician 10 - 10 - - - - 10
Rug Weaving 10 - 10 - - - - 10
Threat Netting 11 - 11 - - - - 11
Kitchen Gardening 13 - 13 - - - - 13
Koresha 13 - 13 - - - - 13
Basic safety Precautions 15 - 15 - - - - 15
Cultural Heritage 15 - 15 - - - - 15
Glazing & Decoration 15 - 15 - - - - 15
Cross stitching 18 - 18 - - - - 18
Fruit Processing 19 - 19 - - - - 19
Pattu Weaving 20 - 20 - - - - 20
Total station 20 - 20 - - - - 20
Grinding - 20 20 - - - - 20
Dying 21 - 21 - - - - 21
DAE - Animation 24 - 24 - - - - 24
Tunnel Farming - 24 24 - - - - 24
Desktop Publishing 25 - 25 - - - - 25 Button Elastic Machine course - 25 25 - - - - 25
Chineese - 25 25 - - - - 25
Fruit Processing - 25 25 - - - - 25
Curtin Making 26 - 26 - - - - 26
Zari Tela Embroidery 26 - 26 - - - - 26
Cloth sewing 30 - 30 - - - - 30
Poultry Farming 30 - 30 - - - - 30

24 National Skills Information System (NSIS)
TradeSupply 2014-15 demand - 2015
Country nAvTTC Total local overseas PoePA Total Gaps
Commercial Art & Graphics 33 - 33 - - - - 33
DAE - Fashion Design 33 - 33 - - - - 33
Commercial Cooking 35 - 35 - - - - 35
EWT DeeniMadrissa 39 - 39 - - - - 39
Overlock & Peeko 40 - 40 - - - - 40
special education skills 42 - 42 - - - - 42
BTech Auto & Farm 45 - 45 - - - - 45
Italian Dhow 45 - 45 - - - - 45
CDM 49 - 49 - - - - 49
Handloom - 50 50 - - - - 50
Baskets Making 51 - 51 - - - - 51
Weaving shawl 51 - 51 - - - - 51
Metal Work 52 - 52 - - - - 52
Textile supervisor 52 - 52 - - - - 52
DAE - Meteorology 55 - 55 - - - - 55
Maudling & Modeling 56 - 56 - - - - 56
Computer Textile Designing 59 - 59 - - - - 59
D.Com 69 - 69 - - - - 69
Mining - 70 70 - - - - 70
French Language - 75 75 - - - - 75
DAE - Apparel Marketing 77 - 77 - - - - 77
Traditional Cap Making 80 - 80 - - - - 80
Halal Butcher 85 - 85 - - - - 85
Adult Literacy 88 - 88 - - - - 88
Drawing & Arts 92 - 92 - - - - 92
Kashigari 100 - 100 - - - - 100
Textile Fitter 102 - 102 - - - - 102
Wool Technology 103 - 103 - - - - 103
City & Guild Advance 106 - 106 - - - - 106
Bag & Purse Making 120 - 120 - - - - 120
DAE - Agriculture science 138 - 138 - - - - 138
Drafting & Cutting 142 - 142 - - - - 142

25Skills Trend Analysis (National & International)
TradeSupply 2014-15 demand - 2015
Country nAvTTC Total local overseas PoePA Total Gaps
Butcher 143 - 143 - - - - 143
Tour Operator - 150 150 - - - - 150
Arch & Interior 155 - 155 - - - - 155
Wiremen 155 - 155 - - - - 155
Cabinet Making 173 - 173 - - - - 173
Ceramic Body Preparation 80 100 180 - - - - 180
C H & N P 224 - 224 - - - - 224
stitching & sewing 233 - 233 - - - - 233
B.Ed 247 - 247 - - - - 247
Pattern Drafting & Cutting - 275 275 - - - - 275
surgical Instrument 337 - 337 - - - - 337
CNG Operator 434 - 434 - - - - 434
CNG Kit Installation 549 - 549 - - - - 549
Montessori Teaching 665 - 665 - - - - 665
DAE - Textile 708 - 708 - - - - 708
Printing & Graphics Art 729 - 729 - - - - 729
CA & OP 864 - 864 - - - - 864
Knitting Tailoring 1,046 - 1,046 - - - - 1,046
Garments making 906 162 1,068 - - - - 1,068
Handicraft 1,065 25 1,090 - - - - 1,090
Hand Knitting 1,168 - 1,168 - - - - 1,168 Import & Export Documen-tation 1,175 - 1,175 - - - - 1,175
English Language 1,155 125 1,280 - - - - 1,280
Glass work 1,390 100 1,490 - - - - 1,490
Auto & Farm 2,144 33 2,177 - - - - 2,177
Fabric Painting 2,637 290 2,927 - - - - 2,927
Rural Poultry 3,544 - 3,544 - - - - 3,544
Machine Embroidery 4,613 - 4,613 - - - - 4,613
Leather Work 5,104 120 5,224 - - - - 5,224
Grand Total 307,102 24,683 331,785 33,362 128,856 334,542 496,760 (164,975)
