treatment episode data set discharges (teds-d)...
TRANSCRIPT

Treatment Episode Data Set Discharges (TEDS-D)
2016
Codebook
Center for Behavioral Health Statistics and Quality Substance Abuse and Mental Health Services Administration

ii
AcknowledgmentsThis data file was prepared for the Substance Abuse and Mental Health Services Administration (SAMHSA), U.S. Department of Health and Human Services (HHS).
Terms of UseThese data are distributed under the following terms of use; by continuing past this page, you signify agreement to comply with the requirements below.
Privacy of Study RespondentsAny intentional identification of an individual or organization, or unauthorized disclosure of identifiable information, violates the promise of confidentiality given to the providers of the information. Disclosure of identifiable information may also be punishable under federal law. Therefore, users of data agree to:
Use these datasets solely for research or statistical purposes, and not for investigation or re-identification of specific individuals or organizations.
Make no use of the identity of any individual discovered inadvertently, and report any such discovery to SAMHSA ([email protected]).
Public Domain NoticeAll material appearing in this document is in the public domain and may be reproduced or copied without permission from SAMHSA. Citation of the source is appreciated. This publication may not be reproduced or distributed for a fee without specific, written authorization of the Office of Communications, SAMHSA, U.S. Department of Health and Human Services.
Recommended CitationSubstance Abuse and Mental Health Services Administration, Treatment Episode Data Set (TEDS) Discharges, 2016. Rockville, MD: Substance Abuse and Mental Health Services Administration, 2018.
Authors who use these data are encouraged to send citations of their publications to SAMHSA for inclusion in a database of related work ([email protected]).
DisclaimersData users acknowledge that SAMHSA and Eagle Technologies, Inc., bear no responsibility for use of the data or for interpretations or inferences based upon such uses.
SAMHSA complies with applicable federal civil rights laws and does not discriminate on the basis of race, color, national origin, age, disability, or sex. SAMHSA cumple con las leyes federales de derechos civiles aplicables y no discrimina por motivos de raza, color, nacionalidad, edad, discapacidad o sexo.

iii
ViolationsIf SAMHSA determines this terms of use agreement has been violated, possible sanctions include:
● report of the violation to the Research Integrity Officer, Institutional Review Board, or Human Subjects Review Committee of the user’s institution;
● report of the violation to the Federal Office for Human Research Protections, if the confidentiality of human subjects has been violated;
● report of the violation of federal law to the United States Attorney General for possible prosecution; and
● court-awarded payments of damages to any individual(s) or organization(s) harmed by the breach of confidential data.
1
Treatment Episode Data Set — Discharges (TEDS-D), 2016
Introduction to TEDSThis codebook is for the Treatment Episode Data Set — Discharges (TEDS-D) for discharges from substance use treatment in 2016. TEDS-D provides demographic and substance use characteristics of discharges from alcohol or drug treatment in facilities that report to individual state administrative data systems.
The TEDS system is comprised of two major components, the Admissions Data Set and the Discharges Data Set. The TEDS-Admissions (TEDS-A) file is an established program; data were first reported for TEDS-A in 1992. The TEDS-D began with the first data reported in 2000. TEDS includes treatment data that are routinely collected by states to monitor their individual substance use treatment systems. Selected data items from the individual state data files are converted to a standardized format that is consistent across states. These standardized data constitute TEDS.
AdmissionsTEDS-A provides demographic, clinical, and substance use characteristics of admissions to alcohol or drug treatment in facilities that report to state administrative data systems. The unit of analysis is treatment admissions to state-licensed or certified substance use treatment centers that receive federal public funding.
TEDS-A has two parts: a minimum data set and a supplemental data set. The former is collected by all states; the latter is collected by some.
The minimum data set consists of 19 items that include:
● demographic information;
● primary, secondary, and tertiary substances used by the subject, and their route of administration, frequency of use, and age at first use;
● source of referral to treatment;
● number of prior treatment episodes; and
● service type, including planned use of medication-assisted (i.e., methadone or buprenorphine) opioid therapy.
TEDS-A’s supplemental data set includes 15 psychiatric, social, and economic items.
2
DischargesThe second major component of the TEDS system, TEDS-D (consisting of discharge records), includes the same variables as the admissions (TEDS-A) component, with the addition of:
● type of service at discharge;
● length of stay; and
● reason for discharge or discontinuation of service.
Management of TEDSSince 1992, the Center for Behavioral Health Statistics and Quality, or CBHSQ (known until 2010 as the Office of Applied Studies, or OAS), of the Substance Abuse and Mental Health Services Administration (SAMHSA), U.S. Department of Health and Human Services (DHHS), has funded and been responsible for TEDS. CBHSQ coordinates and manages the collection of TEDS data from U.S. states, territories, and Compact of Free Association (COFA) partners.
CBHSQ also develops descriptive and analytical reports from TEDS to provide national and state-level data on the number and types of clients treated, as well as the characteristics of facilities providing services.
PurposeThis codebook provides background for the TEDS files, as well as descriptive information for the variables, frequencies of their values, and limitations of the data. For detailed documentation regarding data collected in each state as they correspond to the TEDS data elements, including state-by-state descriptions of exceptions or anomalies in reporting practices, refer to the TEDS Crosswalks available from SAMHSA. The crosswalks are frequently updated as new information becomes available.
Contents of This Codebook and Data SetThis codebook corresponds to “Treatment Episode Data Set — Discharges (TEDS-D), 2016.” This data set contains records from TEDS-D discharges from substance use treatment which occurred in 2016. The data set has been published since 2006.
Note that this codebook corresponds to a public use file for TEDS-D, which consists of data characterizing treatment episodes that were recorded at the time of discharge.
A full list of the variables that appear in this data set may be found in the Variable Information and Frequencies section of this codebook. Please note that none of the variables in this data set are weighted, nor are the frequencies for their values as listed in the Variable Information and Frequencies section.
3
UniverseThe universe for this public use file is TEDS discharges in calendar year 2016 that were received and processed through March 16, 2018. These discharges were linked to either new admissions or transfers to treatment in another service type.
Data CollectionFor a complete, detailed description of how states are instructed to process and submit TEDS data, consult the Combined Substance Abuse and Mental Health Treatment Episode Data Set (TEDS) State Instruction Manual and the Data Submission System (DSS) State User Manual, available from the SAMHSA website.
Confidentiality ProtectionSeveral measures are taken to protect the confidentiality of the TEDS records. Variables that potentially identify an individual in their raw form undergo routine top- or bottom-coding in order to prevent high and low values from distinguishing a respondent’s record. For example, age as a continuous variable has the potential to identify both the youngest and oldest participants in a public release file. For this reason, age is recoded into 11 categories for the public use file to reduce disclosure risk. The youngest category for age combines the ages of 12–14. Similarly, ages of 65 and older were top-coded. All the variables recoded are documented in Appendix B.
Disclosure analysis is used to identify records that remained unique after routine measures were taken to protect confidentiality. Disclosure analysis is used to discern combinations of indirect identifiers that potentially link an individual to a record. Records identified are classified as subject to disclosure risk using a combination of between seven and eight socio-demographic variables.
In order to satisfy stringent confidentiality standards, data swapping is applied to the TEDS using an algorithm that matches, in the following order, for:
● records in a different state, but within the same Census region and division; or, if a match is not found;
● records outside the Census division; or, if still no match is found,
● records from outside the Census region.
If a parallel record is still not found, the combination of socio-demographic characteristics against which to match another record is reduced to between six and seven variables, and the process is repeated until a match is found and swap achieved.
The original location of any particular, single record in a TEDS public use file cannot be known for certain due to data swapping. This method has several benefits over other disclosure protection options: (1) the overall impact to the data is typically small; (2) nearly all of the data are left intact; (3) data for special populations (e.g., minorities, pregnant women) are no more impacted than other data; (4) the procedures typically do not affect any analytic uses of the file; and (5) the procedures allow greater detail to remain on the public use file (e.g., the original ethnicity codes).

4
The statistical disclosure control (SDC) method employed for TEDS manages disclosure risk below a tolerable risk threshold while ensuring high-utility, high-quality statistical data.
CoverageThe TEDS attempts to include all admissions to providers receiving public funding. Because each state or jurisdiction decides the TEDS eligibility of a provider, there is no independent check on the actual sources of funding. Although SAMHSA requests that states submit data on all admissions to any publicly funded treatment facility, reporting in some state agencies is structured so that only clients treated with public funds are included in the TEDS. The number and characteristics of clients in these facilities whose treatment is not publicly funded is unknown.
Data LimitationsThe TEDS, while comprising a significant proportion of all admissions to substance use treatment, does not include all such admissions. The TEDS is a compilation of facility data from state administrative systems. The scope of facilities included in the TEDS is affected by differences in state licensure, certification, accreditation, and disbursement of public funds.
For example, some state substance abuse agencies regulate private facilities and individual practitioners, while others do not. In some states, hospital-based substance use treatment facilities are not licensed through the state substance abuse agency. Some state substance abuse agencies track treatment in correctional facilities (state prisons and local jails), while others do not.
In general, facilities reporting TEDS data receive state alcohol and/or drug agency funds (including federal block grant funds) for the provision of alcohol and/or drug treatment services. Most states are able to report all admissions to all eligible facilities, although some report only admissions financed by public funds. States may report data from facilities that do not receive public funds, but generally do not because of the difficulty in obtaining data from these facilities. The TEDS generally does not include data on facilities operated by federal agencies, including the Bureau of Prisons, the Department of Defense, and the Department of Veterans Affairs. However, some facilities operated by the Indian Health Service are included.
The primary goal of TEDS is to monitor the characteristics of treatment episodes for substance users. Implicit in the concept of treatment is a planned, continuing treatment regimen. Thus, the TEDS does not include early intervention programs; these are considered to be prevention programs. Crisis intervention facilities such as sobering-up stations and hospital emergency departments are not included in the TEDS.
The TEDS is a large and powerful data set. Like all data sets, however, care must be taken that interpretation does not extend beyond the limitations of the data. Limitations fall into two broad categories: those related to the scope of the data collection system, and those related to the difficulties of aggregating data from highly diverse state data collection systems.

5
Limitations to be kept in mind while analyzing TEDS data include:
● The number and client mix of TEDS records depends, to some extent, on external factors, including the availability of public funds. In states with higher funding levels, a larger percentage of the substance-using population may be admitted to treatment, including the less severely impaired and the less economically disadvantaged.
● The primary, secondary, and tertiary substances of use reported to the TEDS are those substances that led to the treatment episode, and not necessarily a complete enumeration of all drugs used at the time of admission.
● The way an admission is defined may vary from state to state such that the absolute number of admissions is not a valid measure for comparing states.
● States continually review the quality of their data processing. As systematic errors are identified, revisions may be enacted in historical TEDS data files. While this system improves the data set over time, reported historical statistics may change slightly from year to year.
● States vary in the extent to which coercion plays a role in referral to treatment. This variation derives from criminal justice practices and differing concentrations of user subpopulations.
● Public funding constraints may direct states to selectively target special populations, for example, pregnant women or adolescents.
● Many states submit records that include multiple admissions for the same client. Therefore, any statistics derived from the data will represent admissions, not clients. It is possible for clients to have multiple initial admissions within a state — and even within providers that have multiple treatment sites within the state. A few states uniquely identify clients at the state-level; several more are attempting to achieve this level of client identification. The TEDS provides a good national snapshot of what is seen at admission to treatment, but is currently unable to follow individual clients through a sequence of treatment episodes.
● The TEDS distinguishes between transfer admissions and initial admissions. Transfers are admissions of clients transferred for distinct services within an episode of treatment. Only initial admissions are included in the public use files.
● Some states have no opioid treatment programs (OTPs) that provide medication-assisted therapy using methadone and/or buprenorphine. Consult the TEDS state crosswalks for information regarding data collected by each state.
6
Created VariablesThe TEDS files contain several variables created from the original variables submitted by the states. For example, a variable was created to indicate whether a given drug was recorded as an admission’s primary, secondary, or tertiary drug of use. These are called flag variables. Their names and labels reflect the drug in question: alcflg for alcohol flag variable, cokeflg for cocaine flag, etc.
Some variables in the TEDS reports are created by combining or recoding original variables submitted by states. A Technical Note is provided in Appendix C detailing how these variables are derived.
Formats Available for This Public Use FileThe TEDS public use files are provided in SAS, SPSS, Stata, R, and ASCII comma-delimited formats.

STATE EXCLUSIONS
The following states did not report sufficient data and are excluded from the given year.
Year States
2016 Georgia, Oregon, West Virginia
7

Variable Descriptions and Frequencies
8
CASEID: CASE IDENTIFICATION NUMBER
Program generated case (record) identifier. This variable does not have a frequency; each case has a unique value generated for identification purposes.
Width: 11; Decimal: 0 Variable type: Numeric
9

DISYR: YEAR OF DISCHARGE
Year of client's discharge from substance use treatment.
Value Label Frequency % 2016 2016 1,458,045 100%
Total 1,458,045 100%
Width: 4; Decimal: 0 Variable type: Numeric
10

AGE: AGE (RECODED)
Calculated from date of birth and date of admission and categorized.
Value Label Frequency % 1 12-14 9,858 0.7% 2 15-17 51,311 3.5% 3 18-20 56,734 3.9% 4 21-24 155,887 10.7% 5 25-29 265,169 18.2% 6 30-34 236,050 16.2% 7 35-39 179,903 12.3% 8 40-44 128,761 8.8% 9 45-49 130,976 9.0% 10 50-54 119,886 8.2% 11 55-64 109,042 7.5% 12 65 and older 14,468 1.0%
Total 1,458,045 100%
• Minimum: 1 • Maximum: 12
Width: 2; Decimal: 0 Variable type: Numeric
11

GENDER: SEX
This field identifies the client's biologic sex.
Value Label Frequency % 1 MALE 951,949 65.3% 2 FEMALE 505,611 34.7% -9 MISSING/UNKNOWN/NOT COLLECTED/INVALID 485 0.0%
Total 1,458,045 100%
• Minimum: 1 • Maximum: 2
Width: 2; Decimal: 0 Variable type: Numeric
12
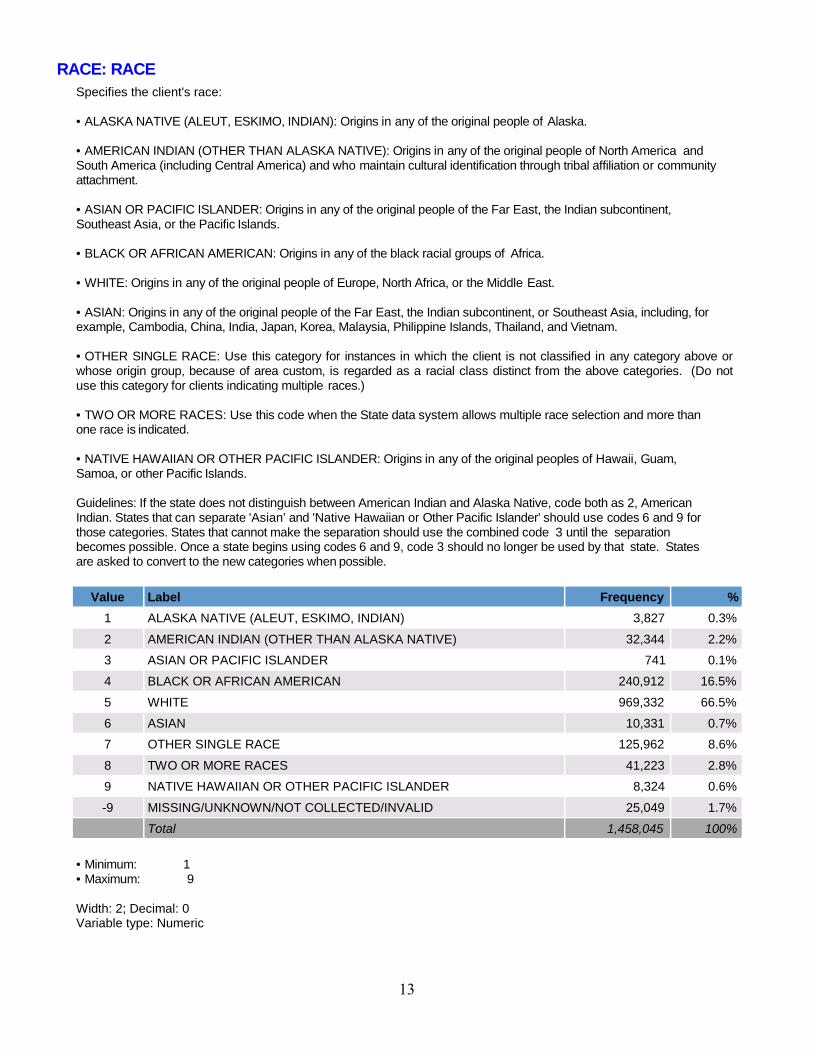
RACE: RACE Specifies the client's race:
• ALASKA NATIVE (ALEUT, ESKIMO, INDIAN): Origins in any of the original people of Alaska.
• AMERICAN INDIAN (OTHER THAN ALASKA NATIVE): Origins in any of the original people of North America andSouth America (including Central America) and who maintain cultural identification through tribal affiliation or communityattachment.
• ASIAN OR PACIFIC ISLANDER: Origins in any of the original people of the Far East, the Indian subcontinent,Southeast Asia, or the Pacific Islands.
• BLACK OR AFRICAN AMERICAN: Origins in any of the black racial groups of Africa.
• WHITE: Origins in any of the original people of Europe, North Africa, or the Middle East.
• ASIAN: Origins in any of the original people of the Far East, the Indian subcontinent, or Southeast Asia, including, forexample, Cambodia, China, India, Japan, Korea, Malaysia, Philippine Islands, Thailand, and Vietnam.
• OTHER SINGLE RACE: Use this category for instances in which the client is not classified in any category above orwhose origin group, because of area custom, is regarded as a racial class distinct from the above categories. (Do notuse this category for clients indicating multiple races.)
• TWO OR MORE RACES: Use this code when the State data system allows multiple race selection and more thanone race is indicated.
• NATIVE HAWAIIAN OR OTHER PACIFIC ISLANDER: Origins in any of the original peoples of Hawaii, Guam,Samoa, or other Pacific Islands.
Guidelines: If the state does not distinguish between American Indian and Alaska Native, code both as 2, American Indian. States that can separate 'Asian' and 'Native Hawaiian or Other Pacific Islander' should use codes 6 and 9 for those categories. States that cannot make the separation should use the combined code 3 until the separation becomes possible. Once a state begins using codes 6 and 9, code 3 should no longer be used by that state. States are asked to convert to the new categories when possible.
Value Label Frequency % 1 ALASKA NATIVE (ALEUT, ESKIMO, INDIAN) 3,827 0.3% 2 AMERICAN INDIAN (OTHER THAN ALASKA NATIVE) 32,344 2.2% 3 ASIAN OR PACIFIC ISLANDER 741 0.1% 4 BLACK OR AFRICAN AMERICAN 240,912 16.5% 5 WHITE 969,332 66.5% 6 ASIAN 10,331 0.7% 7 OTHER SINGLE RACE 125,962 8.6% 8 TWO OR MORE RACES 41,223 2.8% 9 NATIVE HAWAIIAN OR OTHER PACIFIC ISLANDER 8,324 0.6% -9 MISSING/UNKNOWN/NOT COLLECTED/INVALID 25,049 1.7%
Total 1,458,045 100%
• Minimum: 1 • Maximum: 9
Width: 2; Decimal: 0 Variable type: Numeric
13
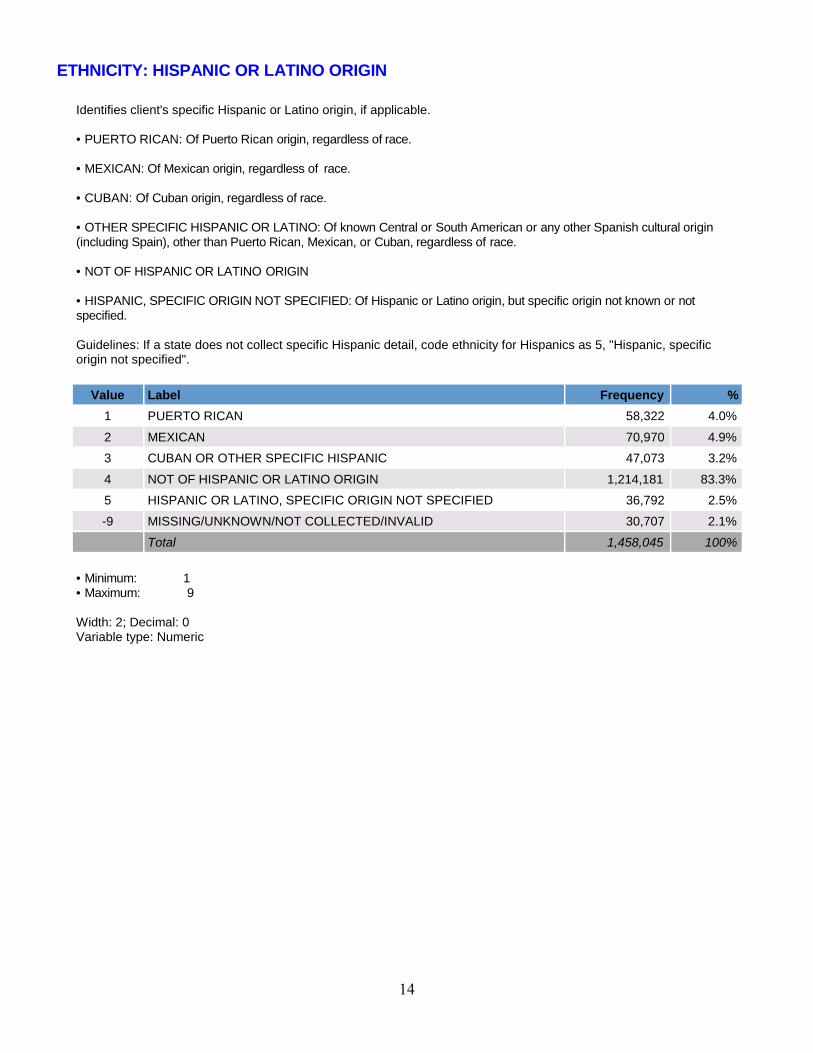
ETHNICITY: HISPANIC OR LATINO ORIGIN
Identifies client's specific Hispanic or Latino origin, if applicable.
• PUERTO RICAN: Of Puerto Rican origin, regardless of race.
• MEXICAN: Of Mexican origin, regardless of race.
• CUBAN: Of Cuban origin, regardless of race.
• OTHER SPECIFIC HISPANIC OR LATINO: Of known Central or South American or any other Spanish cultural origin (including Spain), other than Puerto Rican, Mexican, or Cuban, regardless of race.
• NOT OF HISPANIC OR LATINO ORIGIN
• HISPANIC, SPECIFIC ORIGIN NOT SPECIFIED: Of Hispanic or Latino origin, but specific origin not known or not specified.
Guidelines: If a state does not collect specific Hispanic detail, code ethnicity for Hispanics as 5, "Hispanic, specific origin not specified".
Value Label Frequency %
1 PUERTO RICAN 58,322 4.0% 2 MEXICAN 70,970 4.9% 3 CUBAN OR OTHER SPECIFIC HISPANIC 47,073 3.2% 4 NOT OF HISPANIC OR LATINO ORIGIN 1,214,181 83.3% 5 HISPANIC OR LATINO, SPECIFIC ORIGIN NOT SPECIFIED 36,792 2.5% -9 MISSING/UNKNOWN/NOT COLLECTED/INVALID 30,707 2.1%
Total 1,458,045 100%
• Minimum: 1 • Maximum: 9
Width: 2; Decimal: 0 Variable type: Numeric
14

MARSTAT: MARITAL STATUS
Describes the client's marital status.
• NEVER MARRIED: Includes clients who are single or whose only marriage was annulled.
• NOW MARRIED: Includes married couples, those living together as married, living with partners or cohabitating.
• SEPARATED: Includes those separated legally or otherwise absent from spouse because of marital discord.
• DIVORCED, WIDOWED
Value Label Frequency % 1 NEVER MARRIED 734,282 50.4% 2 NOW MARRIED 151,876 10.4% 3 SEPARATED 65,722 4.5% 4 DIVORCED, WIDOWED 174,043 11.9% -9 MISSING/UNKNOWN/NOT COLLECTED/INVALID 332,122 22.8%
Total 1,458,045 100%
• Minimum: 1 • Maximum: 4
Width: 2; Decimal: 0 Variable type: Numeric
15
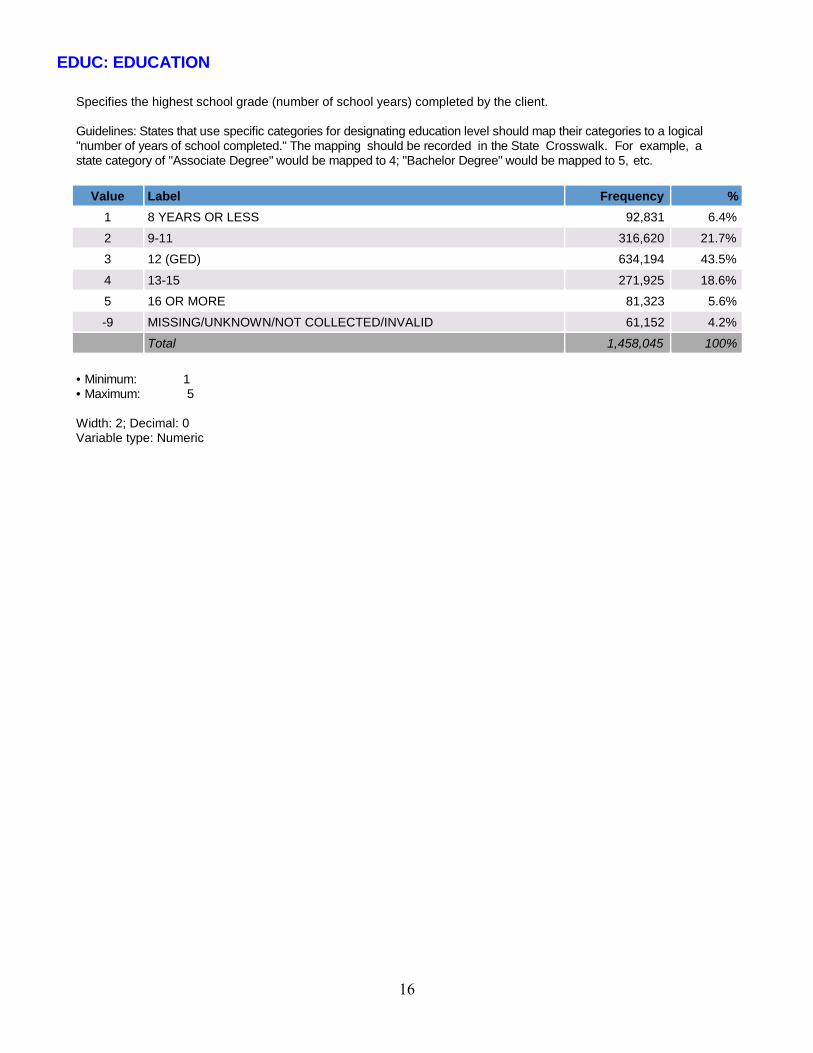
EDUC: EDUCATION
Specifies the highest school grade (number of school years) completed by the client.
Guidelines: States that use specific categories for designating education level should map their categories to a logical "number of years of school completed." The mapping should be recorded in the State Crosswalk. For example, a state category of "Associate Degree" would be mapped to 4; "Bachelor Degree" would be mapped to 5, etc.
Value Label Frequency %
1 8 YEARS OR LESS 92,831 6.4% 2 9-11 316,620 21.7% 3 12 (GED) 634,194 43.5% 4 13-15 271,925 18.6% 5 16 OR MORE 81,323 5.6% -9 MISSING/UNKNOWN/NOT COLLECTED/INVALID 61,152 4.2%
Total 1,458,045 100%
• Minimum: 1 • Maximum: 5
Width: 2; Decimal: 0 Variable type: Numeric
16

EMPLOY: EMPLOYMENT STATUS AT ADMISSION
Designates the client's employment status at the time of admission.
• FULL TIME: Working 35 hours or more each week; including active duty members of the uniformed services.
• PART TIME: Working fewer than 35 hours each week.
• UNEMPLOYED: Looking for work during the past 30 days or on layoff from a job.
• NOT IN LABOR FORCE: Not looking for work during the past 30 days or a student, homemaker, disabled, retired, or an resident of an institution. Clients in this category are further defined in the supplemental data set item "Detailed Not in Labor Force" (DETNLF).
Guidelines: Seasonal workers are coded in this category based on their employment status at time of admission. For example, if they are employed full time at the time of admission, they are coded as 01. If they are not in labor force at time of admission, they are coded 04.
Value Label Frequency %
1 FULL TIME 236,031 16.2% 2 PART TIME 104,350 7.2% 3 UNEMPLOYED 531,253 36.4% 4 NOT IN LABOR FORCE 545,899 37.4% -9 MISSING/UNKNOWN/NOT COLLECTED/INVALID 40,512 2.8%
Total 1,458,045 100%
• Minimum: 1 • Maximum: 4
Width: 2; Decimal: 0 Variable type: Numeric
17

EMPLOY_D: EMPLOYMENT STATUS AT DISCHARGE
Designates the client's employment status at the time of discharge.
• FULL TIME: Working 35 hours or more each week; including active duty members of the uniformed services.
• PART TIME: Working fewer than 35 hours each week.
• UNEMPLOYED: Looking for work during the past 30 days or on layoff from a job.
• NOT IN LABOR FORCE: Not looking for work during the past 30 days or a student, homemaker, disabled, retired, or an resident of an institution. Clients in this category are further defined in the Supplemental Data Set item "Detailed Not in Labor Force" (DETNLF).
Guidelines: Seasonal workers are coded in this category based on their employment status at time of discharge. For example, if they are employed full time at the time of discharge, they are coded as 01. If they are not in labor force at time of discharge, they are coded 04.
Value Label Frequency %
1 FULL TIME 248,556 17.0% 2 PART TIME 101,920 7.0% 3 UNEMPLOYED 464,179 31.8% 4 NOT IN LABOR FORCE 409,873 28.1% -9 MISSING/UNKNOWN/NOT COLLECTED/INVALID 233,517 16.0%
Total 1,458,045 100%
• Minimum: 1 • Maximum: 4
Width: 2; Decimal: 0 Variable type: Numeric
18
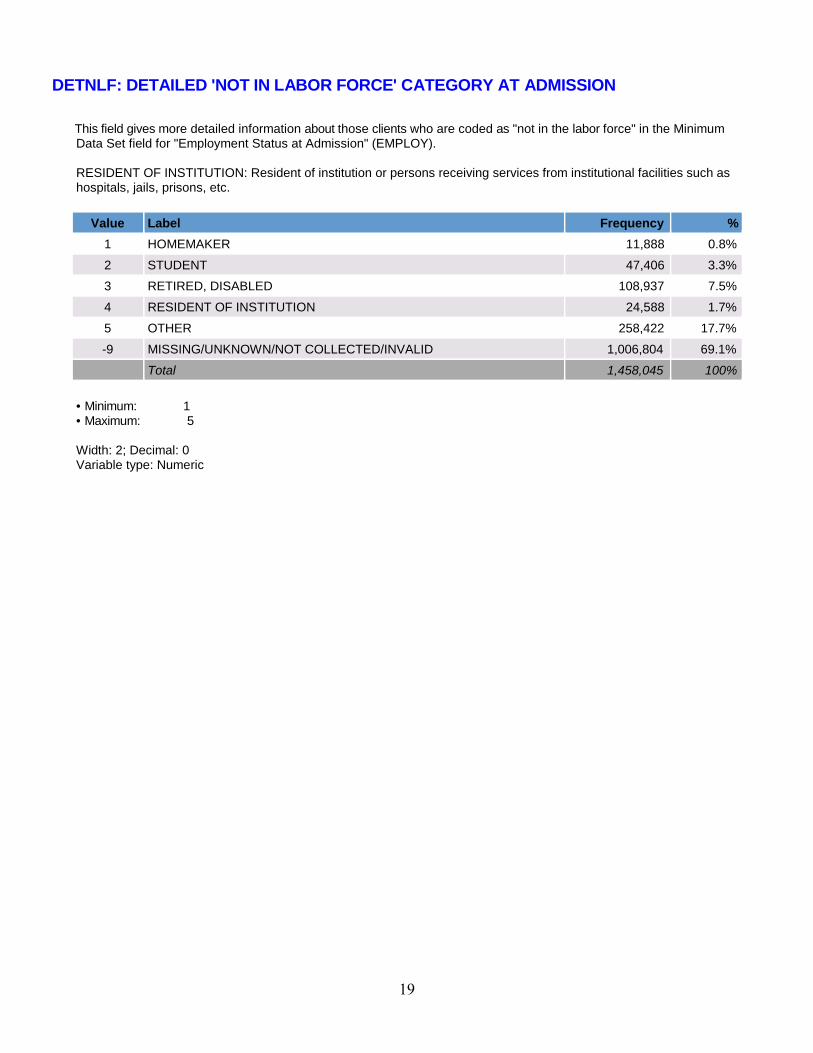
DETNLF: DETAILED 'NOT IN LABOR FORCE' CATEGORY AT ADMISSION This field gives more detailed information about those clients who are coded as "not in the labor force" in the Minimum Data Set field for "Employment Status at Admission" (EMPLOY).
RESIDENT OF INSTITUTION: Resident of institution or persons receiving services from institutional facilities such as hospitals, jails, prisons, etc.
Value Label Frequency %
1 HOMEMAKER 11,888 0.8% 2 STUDENT 47,406 3.3% 3 RETIRED, DISABLED 108,937 7.5% 4 RESIDENT OF INSTITUTION 24,588 1.7% 5 OTHER 258,422 17.7% -9 MISSING/UNKNOWN/NOT COLLECTED/INVALID 1,006,804 69.1%
Total 1,458,045 100%
• Minimum: 1 • Maximum: 5
Width: 2; Decimal: 0 Variable type: Numeric
19

DETNLF_D: DETAILED 'NOT IN LABOR FORCE' CATEGORY AT DISCHARGE This field gives more detailed information about those clients who are coded as "not in the labor force" in the Minimum Data Set field for "Employment Status at Discharge" (EMPLOY_D).
RESIDENT OF INSTITUTION: Resident of institution or persons receiving services from institutional facilities such as hospitals, jails, prisons, etc.
Value Label Frequency %
1 HOMEMAKER 11,326 0.8% 2 STUDENT 43,229 3.0% 3 RETIRED, DISABLED 92,129 6.3% 4 RESIDENT OF INSTITUTION 24,421 1.7% 5 OTHER 182,244 12.5% -9 MISSING/UNKNOWN/NOT COLLECTED/INVALID 1,104,696 75.8%
Total 1,458,045 100%
• Minimum: 1 • Maximum: 5
Width: 2; Decimal: 0 Variable type: Numeric
20

PREG: PREGNANT AT TIME OF ADMISSION Specifies whether the client was pregnant at the time of admission.
Guidelines: All male respondents were recoded to missing for this variable due to the item being not applicable.
Value Label Frequency % 1 YES 19,489 1.3% 2 NO 447,937 30.7% -9 MISSING/UNKNOWN/NOT COLLECTED/INVALID 990,619 67.9%
Total 1,458,045 100%
• Minimum: 1 • Maximum: 2
Width: 2; Decimal: 0 Variable type: Numeric
21

VET: VETERAN STATUS Specifies whether the client has served in the uniformed services (Army, Navy, Air Force, Marines, Coast Guard, Public Health Service Commissioned Corps, Coast and Geodetic Survey, etc.).
Guidelines: A veteran is a person 16 years or over who has served (even for a short time), but is not currently serving, on active duty in the US Army, Navy, Marine Corps, Coast Guard, or Commissioned Corps of the US Public Health Service or National Oceanic and Atmospheric Administration, or who served as a Merchant Marine seaman during World War II. Persons who served in the National Guard or Military Reserves are classified as veterans only if they were ever called or ordered to active duty, not counting the 4-6 months for initial training or yearly summer camps.
Value Label Frequency %
1 YES 38,716 2.7% 2 NO 1,315,678 90.2% -9 MISSING/UNKNOWN/NOT COLLECTED/INVALID 103,651 7.1%
Total 1,458,045 100%
• Minimum: 1 • Maximum: 2
Width: 2; Decimal: 0 Variable type: Numeric
22

LIVARAG: LIVING ARRANGEMENTS AT ADMISSION Identifies whether the client is homeless, a dependent (living with parents or in a supervised setting), or living independently on his or her own.
• HOMELESS: Clients with no fixed address; includes shelters.
• DEPENDENT LIVING: Clients living in a supervised setting, such as a residential institution, halfway house or group
home, and children (under age 18) living with parents, relatives, or guardians, or in foster care.
• INDEPENDENT LIVING: Clients living alone or with others without supervision. Includes adult children (age 18 and over) living with parents.
Value Label Frequency %
1 HOMELESS 216,338 14.8% 2 DEPENDENT LIVING 262,492 18.0% 3 INDEPENDENT LIVING 929,891 63.8% -9 MISSING/UNKNOWN/NOT COLLECTED/INVALID 49,324 3.4%
Total 1,458,045 100%
• Minimum: 1 • Maximum: 3
Width: 2; Decimal: 0 Variable type: Numeric
23

LIVARAG_D: LIVING ARRANGEMENTS AT DISCHARGE Identifies whether the client is homeless, a dependent (living with parents or in a supervised setting), or living independently on his or her own.
• HOMELESS: Clients with no fixed address; includes shelters.
• DEPENDENT LIVING: Clients living in a supervised setting, such as a residential institution, halfway house or group
home, and children (under age 18) living with parents, relatives, or guardians, or in foster care.
• INDEPENDENT LIVING: Clients living alone or with others without supervision. Includes adult children (age 18 and over) living with parents.
Value Label Frequency %
1 HOMELESS 141,959 9.7% 2 DEPENDENT LIVING 251,720 17.3% 3 INDEPENDENT LIVING 826,967 56.7% -9 MISSING/UNKNOWN/NOT COLLECTED/INVALID 237,399 16.3%
Total 1,458,045 100%
• Minimum: 1 • Maximum: 3
Width: 2; Decimal: 0 Variable type: Numeric
24

PRIMINC: SOURCE OF INCOME/SUPPORT Identifies the client's principal source of financial support. For children under 18, this field indicates the parent's primary source of income/support.
Value Label Frequency %
1 WAGES/SALARY 258,340 17.7% 2 PUBLIC ASSISTANCE 78,911 5.4% 3 RETIREMENT/PENSION, DISABILITY 61,479 4.2% 4 OTHER 175,306 12.0% 5 NONE 347,004 23.8% -9 MISSING/UNKNOWN/NOT COLLECTED/INVALID 537,005 36.8%
Total 1,458,045 100%
• Minimum: 1 • Maximum: 5
Width: 2; Decimal: 0 Variable type: Numeric
25

ARRESTS: NUMBER OF ARRESTS IN 30 DAYS PRIOR TO ADMISSION
The number of arrests in the 30 days preceding the date of admission to treatment services. Guidelines: This item is intended to capture the number of times the client was arrested for any cause during the 30 days preceding the date of admission to treatment. Any formal arrest is to be counted regardless of whether incarceration or conviction resulted and regardless of the status of proceedings incident to the arrest at the time of admission.
Value Label Frequency %
0 NONE 1,226,317 84.1% 1 ONCE 91,233 6.3% 2 TWO OR MORE TIMES 14,222 1.0% -9 MISSING/UNKNOWN/NOT COLLECTED/INVALID 126,273 8.7%
Total 1,458,045 100%
• Minimum: 0 • Maximum: 2
Width: 2; Decimal: 0 Variable type: Numeric
26

ARRESTS_D: NUMBER OF ARRESTS IN 30 DAYS PRIOR TO DISCHARGE
The number of arrests in the 30 days preceding the date of discharge.
Guidelines: This item is intended to capture the number of times the client was arrested for any cause during the 30 days preceding the date of discharge from treatment. Any formal arrest is to be counted regardless of whether incarceration or conviction resulted and regardless of the status of proceedings incident to the arrest at the time of discharge.
Value Label Frequency %
0 NONE 1,138,097 78.1% 1 ONCE 55,902 3.8% 2 TWO OR MORE TIMES 14,650 1.0% -9 MISSING/UNKNOWN/NOT COLLECTED/INVALID 249,396 17.1%
Total 1,458,045 100%
• Minimum: 0 • Maximum: 2
Width: 2; Decimal: 0 Variable type: Numeric
27

STFIPS: CENSUS STATE FIPS CODE
State FIPS codes consistent with those used by the U.S. Bureau of the Census.
Value Label Frequency % 1 ALABAMA 6,088 0.4% 2 ALASKA 6,999 0.5% 4 ARIZONA 22,053 1.5% 5 ARKANSAS 9,485 0.7% 6 CALIFORNIA 157,470 10.8% 8 COLORADO 52,352 3.6% 9 CONNECTICUT 61,853 4.2% 10 DELAWARE 5,253 0.4% 11 DISTRICT OF COLUMBIA 4,123 0.3% 12 FLORIDA 28,852 2.0% 15 HAWAII 8,776 0.6% 16 IDAHO 6,915 0.5% 17 ILLINOIS 16,407 1.1% 18 INDIANA 18,432 1.3% 19 IOWA 24,810 1.7% 20 KANSAS 11,692 0.8% 21 KENTUCKY 49,712 3.4% 22 LOUISIANA 10,957 0.8% 23 MAINE 8,549 0.6% 24 MARYLAND 25,948 1.8% 25 MASSACHUSETTS 69,498 4.8% 26 MICHIGAN 57,002 3.9% 27 MINNESOTA 48,816 3.3% 28 MISSISSIPPI 7,136 0.5% 29 MISSOURI 48,793 3.3% 30 MONTANA 6,479 0.4% 31 NEBRASKA 13,198 0.9% 32 NEVADA 7,977 0.5% 33 NEW HAMPSHIRE 4,890 0.3% 34 NEW JERSEY 68,093 4.7% 35 NEW MEXICO 889 0.1% 36 NEW YORK 268,602 18.4% 37 NORTH CAROLINA 57,902 4.0% 38 NORTH DAKOTA 2,255 0.2% 39 OHIO 29,412 2.0% 40 OKLAHOMA 13,331 0.9% 42 PENNSYLVANIA 23,402 1.6% 44 RHODE ISLAND 12,751 0.9% 45 SOUTH CAROLINA 30,832 2.1% 46 SOUTH DAKOTA 12,680 0.9% 28

STFIPS: CENSUS STATE FIPS CODE
State FIPS codes consistent with those used by the U.S. Bureau of the Census.
Value Label Frequency % 47 TENNESSEE 14,354 1.0% 48 TEXAS 30,086 2.1% 49 UTAH 13,844 0.9% 50 VERMONT 9,820 0.7% 51 VIRGINIA 18,985 1.3% 53 WASHINGTON 37,992 2.6% 55 WISCONSIN 5,986 0.4% 56 WYOMING 4,710 0.3% 72 PUERTO RICO 1,604 0.1%
Total 1,458,045 100%
• Minimum: 1 • Maximum: 72
Width: 2; Decimal: 0 Variable type: Numeric
29

CBSA: FIPS 2010 CBSA CODE The term "Core Based Statistical Area" (CBSA) is a collective term for both metro and micro areas. Metropolitan and micropolitan statistical areas (metro and micro areas) are geographic entities defined by the U.S. Office of Management and Budget (OMB) for use by federal statistical agencies in collecting, tabulating, and publishing federal statistics. A metro area contains a core urban area of 50,000 or more population, and a micro area contains an urban core of at least 10,000 (but less than 50,000) population. Each metro or micro area consists of one or more counties and includes the counties containing the core urban area, as well as any adjacent counties that have a high degree of social and economic integration (as measured by commuting to work) with the urban core.
Value Label Frequency % 10180 ABILENE, TX METRO 758 0.1% 10380 AGUADILLA-ISABELA-SAN SEBASTIAN, PR METRO 133 0.0% 10420 AKRON, OH METRO 477 0.0% 10580 ALBANY-SCHENECTADY-TROY, NY METRO 16,375 1.1% 10740 ALBUQUERQUE, NM METRO 96 0.0% 10780 ALEXANDRIA, LA METRO 157 0.0% 10900 ALLENTOWN-BETHLEHEM-EASTON, PA-NJ METRO 1,223 0.1% 11020 ALTOONA, PA METRO 1,900 0.1% 11100 AMARILLO, TX METRO 172 0.0% 11260 ANCHORAGE, AK METRO 2,301 0.2% 11640 ARECIBO, PR METRO 114 0.0% 11700 ASHEVILLE, NC METRO 4,440 0.3% 11780 ASHTABULA, OH MICRO 58 0.0% 12100 ATLANTIC CITY, NJ METRO 3,166 0.2% 12260 AUGUSTA-RICHMOND COUNTY, GA-SC METRO 864 0.1% 12300 AUGUSTA-WATERVILLE, ME MICRO 937 0.1% 12420 AUSTIN-ROUND ROCK, TX METRO 1,247 0.1% 12540 BAKERSFIELD, CA METRO 1,889 0.1% 12620 BANGOR, ME METRO 644 0.0% 12700 BARNSTABLE TOWN, MA METRO 3,326 0.2% 12940 BATON ROUGE, LA METRO 25 0.0% 13140 BEAUMONT-PORT ARTHUR, TX METRO 827 0.1% 13380 BELLINGHAM, WA METRO 1,233 0.1% 13740 BILLINGS, MT METRO 1,241 0.1% 13780 BINGHAMTON, NY METRO 3,070 0.2% 13820 BIRMINGHAM-HOOVER, AL METRO 149 0.0%
X OTHER FIPS 2000 CBSA CODES NOT PRINTED HERE 941,765 64.6% -9 UNDESIGNATED AREA/MISSING/UNKNOWN/NOT
COLLECTED/INVALID 469,458 32.2%
30
CBSA: FIPS 2010 CBSA CODE
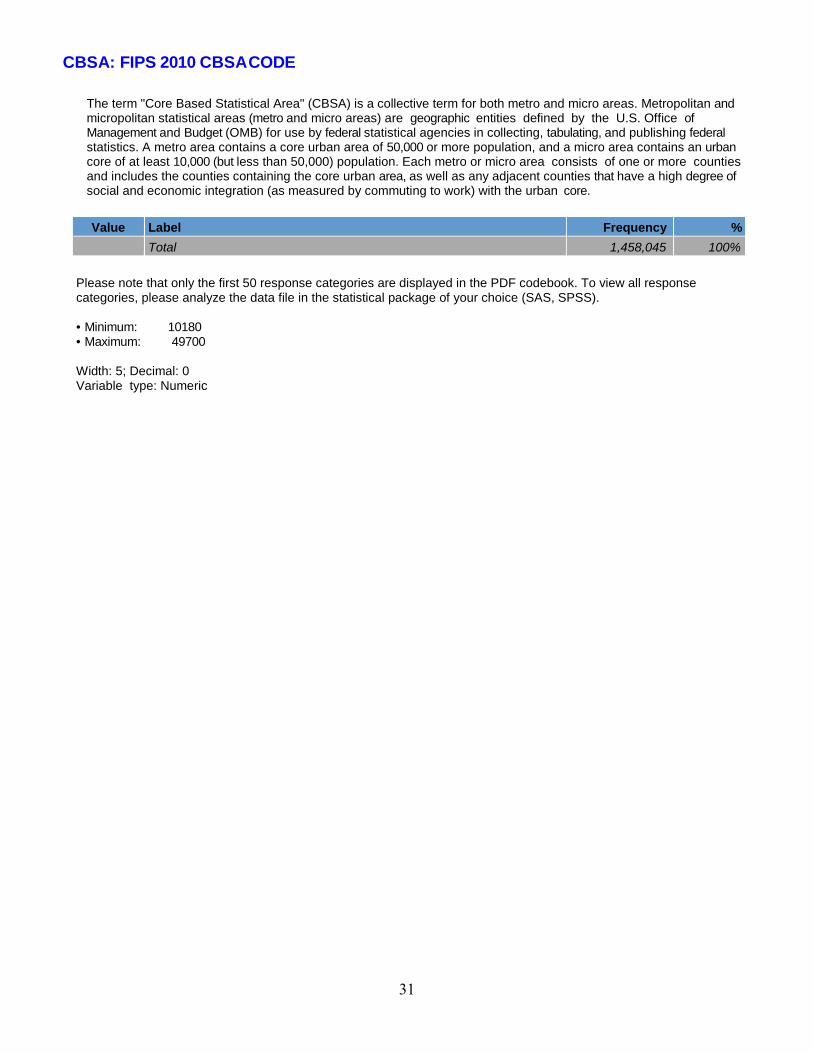
The term "Core Based Statistical Area" (CBSA) is a collective term for both metro and micro areas. Metropolitan and micropolitan statistical areas (metro and micro areas) are geographic entities defined by the U.S. Office of Management and Budget (OMB) for use by federal statistical agencies in collecting, tabulating, and publishing federal statistics. A metro area contains a core urban area of 50,000 or more population, and a micro area contains an urban core of at least 10,000 (but less than 50,000) population. Each metro or micro area consists of one or more counties and includes the counties containing the core urban area, as well as any adjacent counties that have a high degree of social and economic integration (as measured by commuting to work) with the urban core.
Value Label Frequency %
Total 1,458,045 100%
Please note that only the first 50 response categories are displayed in the PDF codebook. To view all response categories, please analyze the data file in the statistical package of your choice (SAS, SPSS).
• Minimum: 10180 • Maximum: 49700
Width: 5; Decimal: 0 Variable type: Numeric
31

REGION: CENSUS REGION Geographic regions used are based on divisions used by the U.S. Bureau of Census, with the addition of US territories, which are not included in any Census region. They are comprised of the following states and territories:
• U.S. TERRITORIES: Puerto Rico
• NORTHEAST: New England Division (Connecticut, Maine, Massachusetts, New Hampshire, Rhode Island, Vermont) and Middle Atlantic Division (New Jersey, New York, Pennsylvania).
• MIDWEST: East North Central Division (Illinois, Indiana, Michigan, Ohio, Wisconsin) and West North Central Division (Iowa, Kansas, Minnesota, Missouri, Nebraska, North Dakota, South Dakota).
• SOUTH: South Atlantic Division (Delaware, District of Columbia, Florida, Georgia, Maryland, North Carolina, South Carolina, Virginia, West Virginia), East South Central Division (Alabama, Kentucky, Mississippi, Tennessee), and West South Central Division (Arkansas, Louisiana, Oklahoma, Texas).
• WEST: Mountain Division (Arizona, Colorado, Idaho, Montana, Nevada, New Mexico, Utah, Wyoming) and Pacific Division (Alaska, California, Hawaii, Oregon, Washington).
Value Label Frequency %
0 US JURISDICTION/TERRITORY 1,604 0.1% 1 NORTHEAST 527,458 36.2% 2 MIDWEST 289,483 19.9% 3 SOUTH 313,044 21.5% 4 WEST 326,456 22.4%
Total 1,458,045 100%
• Minimum: 0 • Maximum: 4
Width: 2; Decimal: 0 Variable type: Numeric
32

DIVISION: CENSUS DIVISION Census divisions are groupings of states that are subdivisions of the four census regions. There are nine divisions, which the Census Bureau adopted in 1910 for the presentation of data. The divisions and the states included in them are:
• U.S. TERRITORIES: Puerto Rico
• NEW ENGLAND: Connecticut, Maine, Massachusetts, New Hampshire, Rhode Island, and Vermont.
• MIDDLE ATLANTIC: New Jersey, New York, and Pennsylvania.
• EAST NORTH CENTRAL: Illinois, Indiana, Michigan, Ohio, and Wisconsin.
• WEST NORTH CENTRAL: Iowa, Kansas, Minnesota, Missouri, Nebraska, North Dakota, and South Dakota.
• SOUTH ATLANTIC: Delaware, District of Columbia, Florida, Georgia, Maryland, North Carolina, South Carolina, Virginia, and West Virginia.
• EAST SOUTH CENTRAL: Alabama, Kentucky, Mississippi, and Tennessee.
• WEST SOUTH CENTRAL: Arkansas, Louisiana, Oklahoma, and Texas.
• MOUNTAIN: Arizona, Colorado, Idaho, Montana, Nevada, New Mexico, Utah, and Wyoming.
• PACIFIC: Alaska, California, Hawaii, Oregon, and Washington.
Value Label Frequency %
0 US JURISDICTION/TERRITORY 1,604 0.1% 1 NEW ENGLAND 167,361 11.5% 2 MID-ATLANTIC 360,097 24.7% 3 EAST NORTH CENTRAL 127,239 8.7% 4 WEST NORTH CENTRAL 162,244 11.1% 5 SOUTH ATLANTIC 171,895 11.8% 6 EAST SOUTH CENTRAL 77,290 5.3% 7 WEST SOUTH CENTRAL 63,859 4.4% 8 MOUNTAIN 115,219 7.9% 9 PACIFIC 211,237 14.5%
Total 1,458,045 100%
• Minimum: 0 • Maximum: 9
Width: 2; Decimal: 0 Variable type: Numeric
33

SERVICES_D: SERVICE SETTING AT DISCHARGE
Describes the type of service the client was receiving prior to discharge.
• DETOXIFICATION, 24-HOUR SERVICE, HOSPITAL INPATIENT:24 hour per day medical acute care services in hospital setting for detoxification of persons with severe medicalcomplications associated with withdrawal.
• DETOXIFICATION, 24-HOUR SERVICE, FREE-STANDING RESIDENTIAL:24 hour per day services in non-hospital setting providing for safe withdrawal and transition to ongoing treatment.
• REHABILITATION/RESIDENTIAL - HOSPITAL (OTHER THAN DETOX):24 hour per day medical care in a hospital facility in conjunction with treatment services for alcohol and other drug useand dependency.
• REHABILITATION/RESIDENTIAL - SHORT TERM (30 DAYS OR FEWER):Typically, 30 days or less of non-acute care in a setting with treatment services for alcohol and other drug use anddependency.
• REHABILITATION/RESIDENTIAL - LONG TERM (MORE THAN 30 DAYS):Typically, more than 30 days of non-acute care in a setting with treatment services for alcohol and other drug use anddependency; this may include transitional living arrangements such as halfway houses.
• AMBULATORY - INTENSIVE OUTPATIENT:As a minimum, the client receives treatment lasting two or more hours per day for three or more days per week.
• AMBULATORY - NON-INTENSIVE OUTPATIENT:Ambulatory treatment services including individual, family, and/or group services, and may include pharmacologicaltherapies.
• AMBULATORY - DETOXIFICATION:Outpatient treatment services providing for safe withdrawal in an ambulatory setting (pharmacological ornon-pharmacological).
See next page for frequency table.
34

SERVICES_D: SERVICE SETTING AT DISCHARGE
Value Label Frequency % 1 DETOX, 24 HR, HOSPITAL INPATIENT 45,245 3.1% 2 DETOX, 24 HR, FREE-STANDING RESIDENTIAL 247,216 17.0% 3 REHAB/RES, HOSPITAL (NON-DETOX) 3,876 0.3% 4 REHAB/RES, SHORT TERM (30 DAYS OR FEWER) 161,457 11.1% 5 REHAB/RES, LONG TERM (MORE THAN 30 DAYS) 117,508 8.1% 6 AMBULATORY, INTENSIVE OUTPATIENT 195,551 13.4% 7 AMBULATORY, NON-INTENSIVE OUTPATIENT 671,639 46.1% 8 AMBULATORY, DETOXIFICATION 15,553 1.1%
Total 1,458,045 100%
• Minimum: 1 • Maximum: 8
Width: 2; Decimal: 0 Variable type: Numeric
35
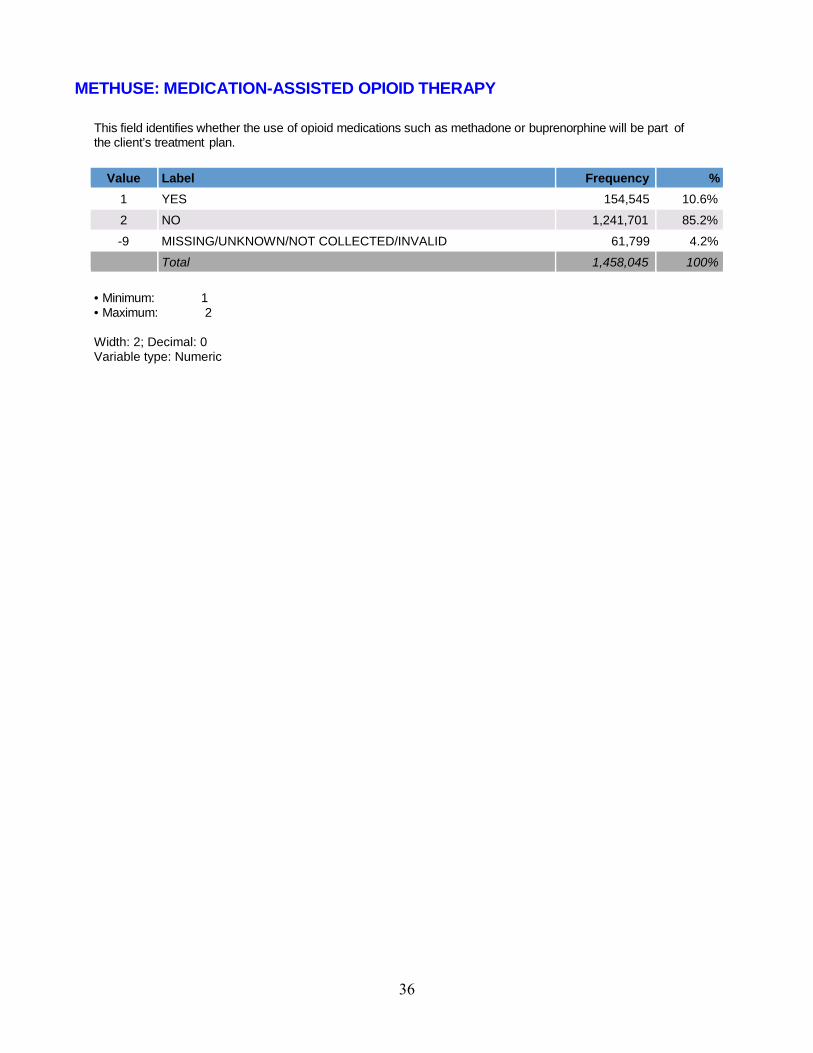
METHUSE: MEDICATION-ASSISTED OPIOID THERAPY
This field identifies whether the use of opioid medications such as methadone or buprenorphine will be part of the client’s treatment plan.
Value Label Frequency %
1 YES 154,545 10.6% 2 NO 1,241,701 85.2% -9 MISSING/UNKNOWN/NOT COLLECTED/INVALID 61,799 4.2%
Total 1,458,045 100%
• Minimum: 1 • Maximum: 2
Width: 2; Decimal: 0 Variable type: Numeric
36
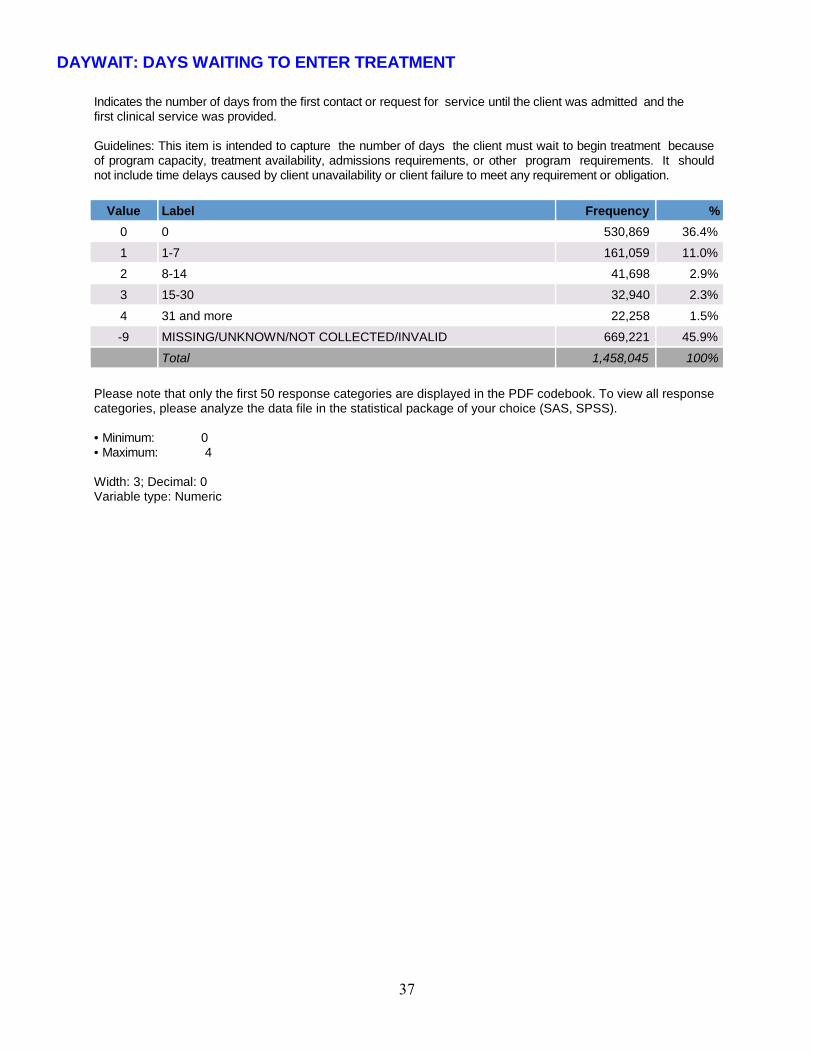
DAYWAIT: DAYS WAITING TO ENTER TREATMENT
Indicates the number of days from the first contact or request for service until the client was admitted and the first clinical service was provided.
Guidelines: This item is intended to capture the number of days the client must wait to begin treatment because of program capacity, treatment availability, admissions requirements, or other program requirements. It should not include time delays caused by client unavailability or client failure to meet any requirement or obligation.
Value Label Frequency %
0 0 530,869 36.4% 1 1-7 161,059 11.0% 2 8-14 41,698 2.9% 3 15-30 32,940 2.3% 4 31 and more 22,258 1.5% -9 MISSING/UNKNOWN/NOT COLLECTED/INVALID 669,221 45.9%
Total 1,458,045 100%
Please note that only the first 50 response categories are displayed in the PDF codebook. To view all response categories, please analyze the data file in the statistical package of your choice (SAS, SPSS).
• Minimum: 0 • Maximum: 4
Width: 3; Decimal: 0 Variable type: Numeric
37

REASON: REASON FOR DISCHARGE
Indicates the outcome of treatment or the reason for transfer or discontinuance of treatment.
• TREATMENT COMPLETED: All parts of the treatment plan or program were completed.
• LEFT AGAINST PROFESSIONAL ADVICE: Client chose not to complete program, with or without specific advice to continue treatment. Includes clients who "drop out" of treatment for unknown reason and clients who have not received treatment for some time and are discharged for "administrative" reasons.
• TERMINATED BY FACILITY: Treatment terminated by action of facility, generally because of client non-compliance or violation of rules, laws, or procedures (not because client dropped out of treatment, client incarcerated, or other client motivated reason).
• TRANSFERRED TO ANOTHER SUBSTANCE use TREATMENT PROGRAM OR FACILITY: Client was transferred to another substance use treatment program, provider or facility within an episode of treatment.
• INCARCERATED: This code is to be used for all clients whose course of treatment is terminated because the client has been incarcerated. Includes jail, prison, and house confinement.
• DEATH
• OTHER: Moved, illness, hospitalization, or other reason somewhat out of client's control.
• UNKNOWN: Client status at discharge is not known because for example, discharge record is lost or incomplete.
Value Label Frequency %
1 TREATMENT COMPLETED 630,047 43.2% 2 DROPPED OUT OF TREATMENT 402,642 27.6% 3 TERMINATED BY FACILITY 98,744 6.8% 4 TRANSFERRED TO ANOTHER TREATMENT PROGRAM OR
FACILITY 233,809 16.0%
5 INCARCERATED 29,743 2.0% 6 DEATH 3,514 0.2% 7 OTHER 59,546 4.1%
Total 1,458,045 100%
• Minimum: 1 • Maximum: 7
Width: 2; Decimal: 0 Variable type: Numeric
38
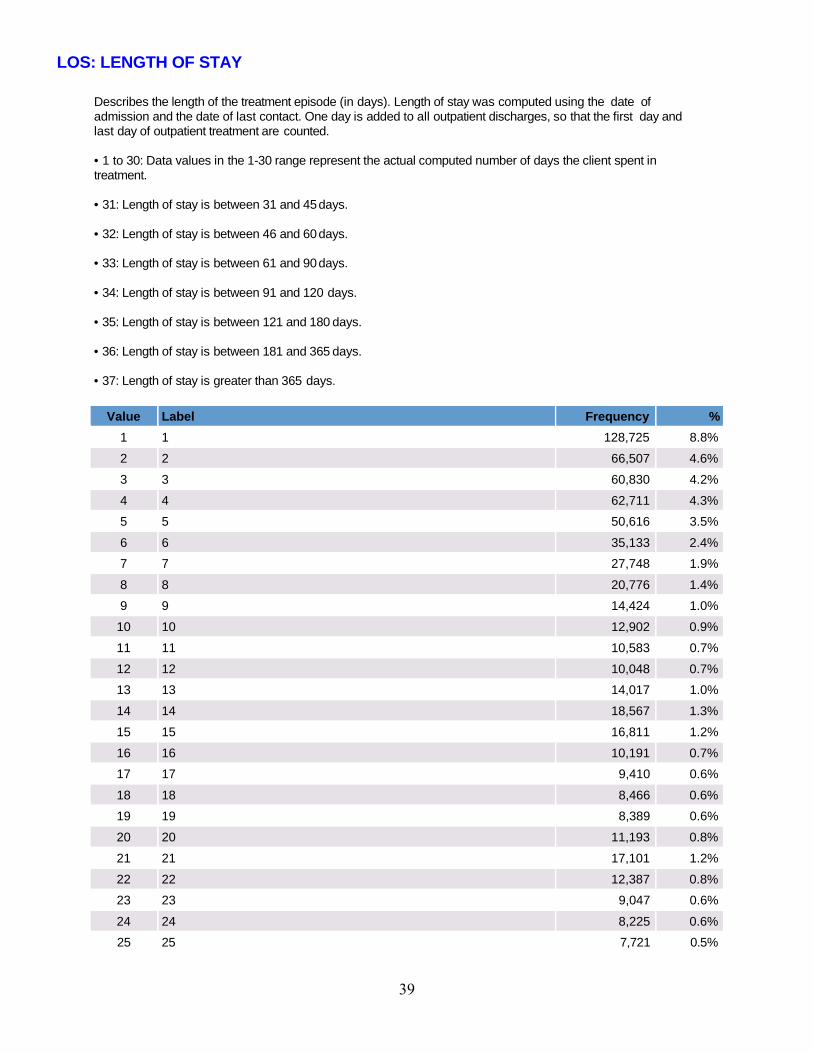
LOS: LENGTH OF STAY
Describes the length of the treatment episode (in days). Length of stay was computed using the date of admission and the date of last contact. One day is added to all outpatient discharges, so that the first day and last day of outpatient treatment are counted.
• 1 to 30: Data values in the 1-30 range represent the actual computed number of days the client spent in treatment.
• 31: Length of stay is between 31 and 45 days.
• 32: Length of stay is between 46 and 60 days.
• 33: Length of stay is between 61 and 90 days.
• 34: Length of stay is between 91 and 120 days.
• 35: Length of stay is between 121 and 180 days.
• 36: Length of stay is between 181 and 365 days.
• 37: Length of stay is greater than 365 days.
Value Label Frequency %
1 1 128,725 8.8% 2 2 66,507 4.6% 3 3 60,830 4.2% 4 4 62,711 4.3% 5 5 50,616 3.5% 6 6 35,133 2.4% 7 7 27,748 1.9% 8 8 20,776 1.4% 9 9 14,424 1.0%
10 10 12,902 0.9% 11 11 10,583 0.7% 12 12 10,048 0.7% 13 13 14,017 1.0% 14 14 18,567 1.3% 15 15 16,811 1.2% 16 16 10,191 0.7% 17 17 9,410 0.6% 18 18 8,466 0.6% 19 19 8,389 0.6% 20 20 11,193 0.8% 21 21 17,101 1.2% 22 22 12,387 0.8% 23 23 9,047 0.6% 24 24 8,225 0.6% 25 25 7,721 0.5%
39

LOS: LENGTH OF STAY
Describes the length of the treatment episode (in days). Length of stay was computed using the date of admission and the date of last contact. One day is added to all outpatient discharges, so that the first day and last day of outpatient treatment are counted.
• 1 to 30: Data values in the 1-30 range represent the actual computed number of days the client spent in treatment.
• 31: Length of stay is between 31 and 45 days.
• 32: Length of stay is between 46 and 60 days.
• 33: Length of stay is between 61 and 90 days.
• 34: Length of stay is between 91 and 120 days.
• 35: Length of stay is between 121 and 180 days.
• 36: Length of stay is between 181 and 365 days.
• 37: Length of stay is greater than 365 days.
Value Label Frequency %
26 26 7,837 0.5% 27 27 11,435 0.8% 28 28 22,414 1.5% 29 29 16,486 1.1% 30 30 13,490 0.9% 31 31 TO 45 DAYS 102,645 7.0% 32 46 TO 60 DAYS 77,385 5.3% 33 61 TO 90 DAYS 129,413 8.9% 34 91 TO 120 DAYS 104,344 7.2% 35 121 TO 180 DAYS 119,462 8.2% 36 181 TO 365 DAYS 129,606 8.9% 37 MORE THAN A YEAR 70,997 4.9% -9 MISSING/UNKNOWN/NOT COLLECTED/INVALID 3 0.0%
Total 1,458,045 100%
• Minimum: 1 • Maximum: 37
Width: 3; Decimal: 0 Variable type: Numeric
40

PSOURCE: REFERRAL SOURCE
Describes the person or agency referring the client to the alcohol or drug use treatment program:
• INDIVIDUAL (INCLUDES SELF-REFERRAL): Includes the client, a family member, friend, or any other individual who would not be included in any of the following categories. Includes self-referral due to pending DWI/DUI.
• ALCOHOL/DRUG USE CARE PROVIDER: Any program, clinic, or other health care provider whose principal objective is treating clients with substance of use, or a program whose activities are related to alcohol or other drug use prevention, education, or treatment.
• OTHER HEALTH CARE PROVIDER: A physician, psychiatrist, or other licensed health care professional; or general hospital, psychiatric hospital, mental health program, or nursing home.
• SCHOOL (EDUCATIONAL): A school principal, counselor, or teacher; or a student assistance program (SAP), the school system, or an educational agency.
• EMPLOYER/EAP: A supervisor or an employee counselor.
• OTHER COMMUNITY REFERRAL: Community or religious organization or any federal, state, or local agency that provides aid in the areas of poverty relief, unemployment, shelter, or social welfare. Self-help groups such as Alcoholics Anonymous (AA), Al-Anon, and Narcotics Anonymous (NA) are also included in this category. Defense attorneys are also included in this category.
• COURT/CRIMINAL JUSTICE REFERRAL/DUI/DWI: Any police official, judge, prosecutor, probation officer, or other person affiliated with a federal, state, or county judicial system. Includes referral by a court for DWI/DUI, clients referred in lieu of or for deferred prosecution, or during pretrial release, or before or after official adjudication. Includes clients on pre-parole, pre-release, work or home furlough, or TASC. Client need not be officially designated as "on parole". Includes clients referred through civil commitment. Client referrals in this category are further defined in the Supplemental Data Set item "Detailed Criminal Justice Referral (DETCRIM)".
Value Label Frequency %
1 INDIVIDUAL (INCLUDES SELF-REFERRAL) 580,072 39.8% 2 ALCOHOL/DRUG USE CARE PROVIDER 151,149 10.4% 3 OTHER HEALTH CARE PROVIDER 96,475 6.6% 4 SCHOOL (EDUCATIONAL) 9,500 0.7% 5 EMPLOYER/EAP 6,040 0.4% 6 OTHER COMMUNITY REFERRAL 156,656 10.7% 7 COURT/CRIMINAL JUSTICE REFERRAL / DUI / DWI 428,608 29.4% -9 MISSING/UNKNOWN/NOT COLLECTED/INVALID 29,545 2.0%
Total 1,458,045 100%
• Minimum: 1 • Maximum: 7
Width: 2; Decimal: 0 Variable type: Numeric
41

DETCRIM: DETAILED CRIMINAL JUSTICE REFERRAL
This field gives more detailed information about those clients who are coded as "Criminal Justice Referral" in the Minimum Data Set field for "Principal Source of Referral" (PSOURCE).
• STATE/FEDERAL COURT, OTHER COURT
• PROBATION/PAROLE
• DIVERSIONARY PROGRAM (e.g., TASC)
• PRISON
• DUI/DWI
• OTHER RECOGNIZED LEGAL ENTITY
• OTHER: Other recognized legal entities includes local law enforcement agency, corrections agency, youth services, review board/agency
Guidelines: This field is to be used only if Principal Source of Referral in the Minimum Data Set field is coded 07, "Criminal Justice Referral". For all other Principal Source of Referral codes (01 to 06 and missing), this field should be coded as Missing.
Value Label Frequency %
1 STATE/FEDERAL COURT 61,488 4.2% 2 FORMAL ADJUDICATION PROCESS 36,414 2.5% 3 PROBATION/PAROLE 117,479 8.1% 4 OTHER RECOGNIZED LEGAL ENTITY 25,728 1.8% 5 DIVERSIONARY PROGRAM 11,525 0.8% 6 PRISON 7,701 0.5% 7 DUI/DWI 30,236 2.1% 8 OTHER 41,466 2.8% -9 MISSING/UNKNOWN/NOT COLLECTED/INVALID 1,126,008 77.2%
Total 1,458,045 100%
• Minimum: 1 • Maximum: 8
Width: 2; Decimal: 0 Variable type: Numeric
42

NOPRIOR: PREVIOUS SUBSTANCE USE TREATMENT EPISODES
Indicates the number of previous treatment episodes the client has received in any drug or alcohol program. Changes in service for the same episode (transfers) should not be counted as separate prior episodes.
Guidelines: This field measures the substance use treatment history of the client only. This does not include or pertain to the client’s mental health treatment history. It is preferred that the number of prior treatments be a self-reported field collected at the time of client intake. However, this data item may be derived from the state data system, if the system has that capability, and episodes can be counted for at least several years.
Value Label Frequency %
0 NO PRIOR TREATMENT EPISODE 470,530 32.3% 1 ONE AND MORE PRIOR TREATMENT EPISODES 840,975 57.7% -9 MISSING/UNKNOWN/NOT COLLECTED/INVALID 146,540 10.1%
Total 1,458,045 100%
• Minimum: 0 • Maximum: 1
Width: 2; Decimal: 0 Variable type: Numeric
43

SUB1: SUBSTANCE USE AT ADMISSION OR DISCHARGE (PRIMARY)
This field identifies the client's primary substance use at admission or discharge.
(1) NONE
(2) ALCOHOL
(3) COCAINE/CRACK
(4) MARIJUANA/HASHISH: Includes THC and any other cannabis sativa preparations.
(5) HEROIN
(6) NON-PRESCRIPTION METHADONE
(7) OTHER OPIATES AND SYNTHETICS: Includes buprenorphine, codeine, hydrocodone, hydromorphone,meperidine, morphine, opium, oxycodone, pentazocine, propoxyphene, tramadol, and any other drug withmorphine-like effects.
(8) PCP: Phencyclidine
(9) OTHER HALLUCINOGENS: Includes LSD, DMT, STP, hallucinogens, mescaline, peyote, psilocybin, etc.
(10) METHAMPHETAMINE
(11) OTHER AMPHETAMINES: Includes amphetamines, MDMA, phenmetrazine, and other unspecified amines andrelated drugs.
(12) OTHER STIMULANTS: Includes methylphenidate and any other stimulants.
(13) BENZODIAZEPINES: Includes alprazolam, chlordiazepoxide, clonazepam, clorazepate, diazepam, flunitrazepam,flurazepam, halazepam, lorazepam, oxazepam, prazepam, temazepam, triazolam, and other unspecifiedbenzodiazepines.
(14) OTHER NON-BENZODIAZEPINE TRANQUILIZERS: Includes meprobamate, tranquilizers, etc.
(15) BARBITURATES: Includes amobarbital, pentobarbital, phenobarbital, secobarbital, etc.
(16) OTHER NON-BARBITURATE SEDATIVES OR HYPNOTICS: Includes chloral hydrate, ethchlorvynol,glutethimide, methaqualone, sedatives/hypnotics, etc.
(17) INHALANTS: Includes chloroform, ether, gasoline, glue, nitrous oxide, paint thinner, etc.
(18) OVER-THE-COUNTER MEDICATIONS: Includes aspirin, cough syrup, diphenhydramine and otheranti-histamines, sleep aids, and any other legally obtained non-prescription medication.
(19) OTHER: Includes diphenylhydantoin/phenytoin, GHB/GBL, ketamine, etc.
See next page for frequency table.
44
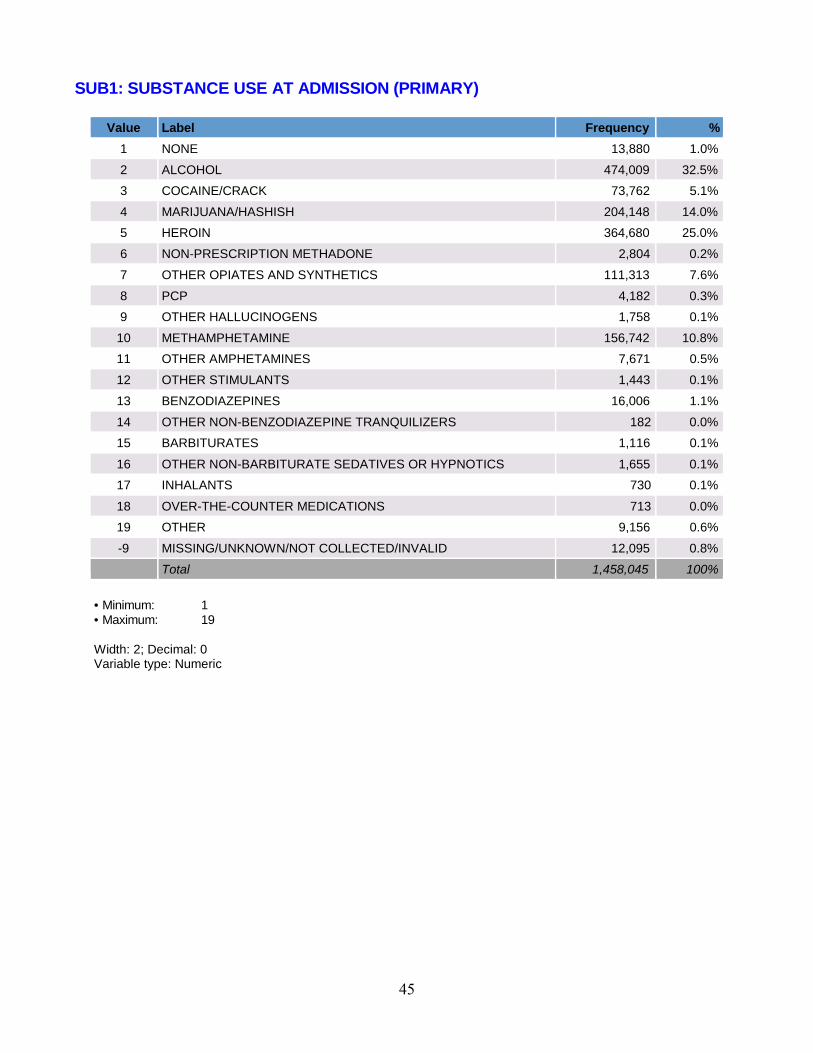
SUB1: SUBSTANCE USE AT ADMISSION (PRIMARY)
Value Label Frequency % 1 NONE 13,880 1.0% 2 ALCOHOL 474,009 32.5% 3 COCAINE/CRACK 73,762 5.1% 4 MARIJUANA/HASHISH 204,148 14.0% 5 HEROIN 364,680 25.0% 6 NON-PRESCRIPTION METHADONE 2,804 0.2% 7 OTHER OPIATES AND SYNTHETICS 111,313 7.6% 8 PCP 4,182 0.3% 9 OTHER HALLUCINOGENS 1,758 0.1%
10 METHAMPHETAMINE 156,742 10.8% 11 OTHER AMPHETAMINES 7,671 0.5% 12 OTHER STIMULANTS 1,443 0.1% 13 BENZODIAZEPINES 16,006 1.1% 14 OTHER NON-BENZODIAZEPINE TRANQUILIZERS 182 0.0% 15 BARBITURATES 1,116 0.1% 16 OTHER NON-BARBITURATE SEDATIVES OR HYPNOTICS 1,655 0.1% 17 INHALANTS 730 0.1% 18 OVER-THE-COUNTER MEDICATIONS 713 0.0% 19 OTHER 9,156 0.6% -9 MISSING/UNKNOWN/NOT COLLECTED/INVALID 12,095 0.8%
Total 1,458,045 100%
• Minimum: 1 • Maximum: 19
Width: 2; Decimal: 0 Variable type: Numeric
45

SUB1_D: SUBSTANCE USE AT DISCHARGE (PRIMARY)
Value Label Frequency % 1 NONE 73,986 5.1% 2 ALCOHOL 413,656 28.4% 3 COCAINE/CRACK 67,281 4.6% 4 MARIJUANA/HASHISH 187,994 12.9% 5 HEROIN 301,121 20.7% 6 NON-PRESCRIPTION METHADONE 2,423 0.2% 7 OTHER OPIATES AND SYNTHETICS 102,231 7.0% 8 PCP 3,664 0.3% 9 OTHER HALLUCINOGENS 1,574 0.1%
10 METHAMPHETAMINE 150,246 10.3% 11 OTHER AMPHETAMINES 7,622 0.5% 12 OTHER STIMULANTS 1,558 0.1% 13 BENZODIAZEPINES 13,536 0.9% 14 OTHER NON-BENZODIAZEPINE TRANQUILIZERS 167 0.0% 15 BARBITURATES 787 0.1% 16 OTHER NON-BARBITURATE SEDATIVES OR HYPNOTICS 1,702 0.1% 17 INHALANTS 598 0.0% 18 OVER-THE-COUNTER MEDICATIONS 670 0.0% 19 OTHER 6,772 0.5% -9 MISSING/UNKNOWN/NOT COLLECTED/INVALID 120,457 8.3%
Total 1,458,045 100%
• Minimum: 1 • Maximum: 19
Width: 2; Decimal: 0 Variable type: Numeric
46

ROUTE1: USUAL ROUTE OF ADMINISTRATION (PRIMARY)
This field identifies the usual route of administration of the primary substance (SUB1).
Value Label Frequency % 1 ORAL 573,737 39.3% 2 SMOKING 369,366 25.3% 3 INHALATION 144,407 9.9% 4 INJECTION (IV OR INTRAMUSCULAR) 324,487 22.3% 5 OTHER 12,106 0.8% -9 MISSING/UNKNOWN/NOT COLLECTED/INVALID 33,942 2.3%
Total 1,458,045 100%
• Minimum: 1 • Maximum: 5
Width: 2; Decimal: 0 Variable type: Numeric
47
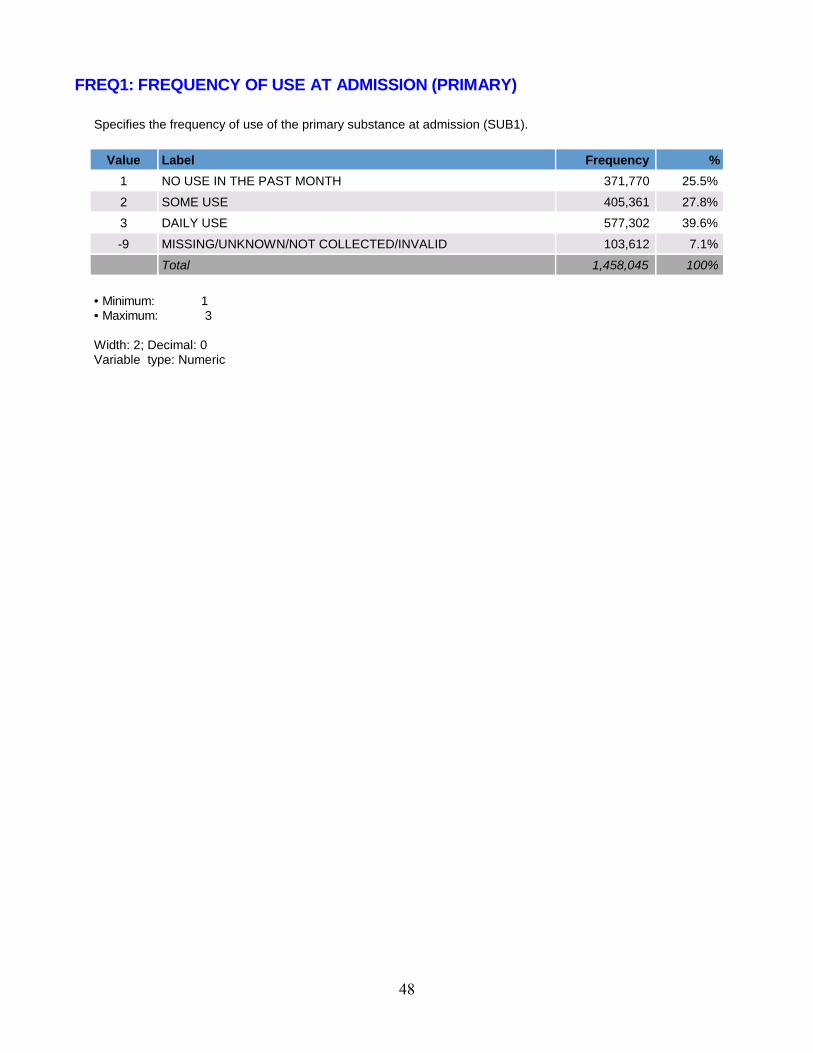
FREQ1: FREQUENCY OF USE AT ADMISSION (PRIMARY)
Specifies the frequency of use of the primary substance at admission (SUB1).
Value Label Frequency % 1 NO USE IN THE PAST MONTH 371,770 25.5% 2 SOME USE 405,361 27.8% 3 DAILY USE 577,302 39.6% -9 MISSING/UNKNOWN/NOT COLLECTED/INVALID 103,612 7.1%
Total 1,458,045 100%
• Minimum: 1 • Maximum: 3
Width: 2; Decimal: 0 Variable type: Numeric
48

FREQ1_D: FREQUENCY OF USE AT DISCHARGE (PRIMARY) Specifies the frequency of use of the primary substance at discharge (SUB1_d).
Value Label Frequency %
1 NO USE IN THE PAST MONTH 572,664 39.3% 2 SOME USE 278,369 19.1% 3 DAILY USE 230,698 15.8% -9 MISSING/UNKNOWN/NOT COLLECTED/INVALID 376,314 25.8%
Total 1,458,045 100%
• Minimum: 1 • Maximum: 3
Width: 2; Decimal: 0 Variable type: Numeric
49
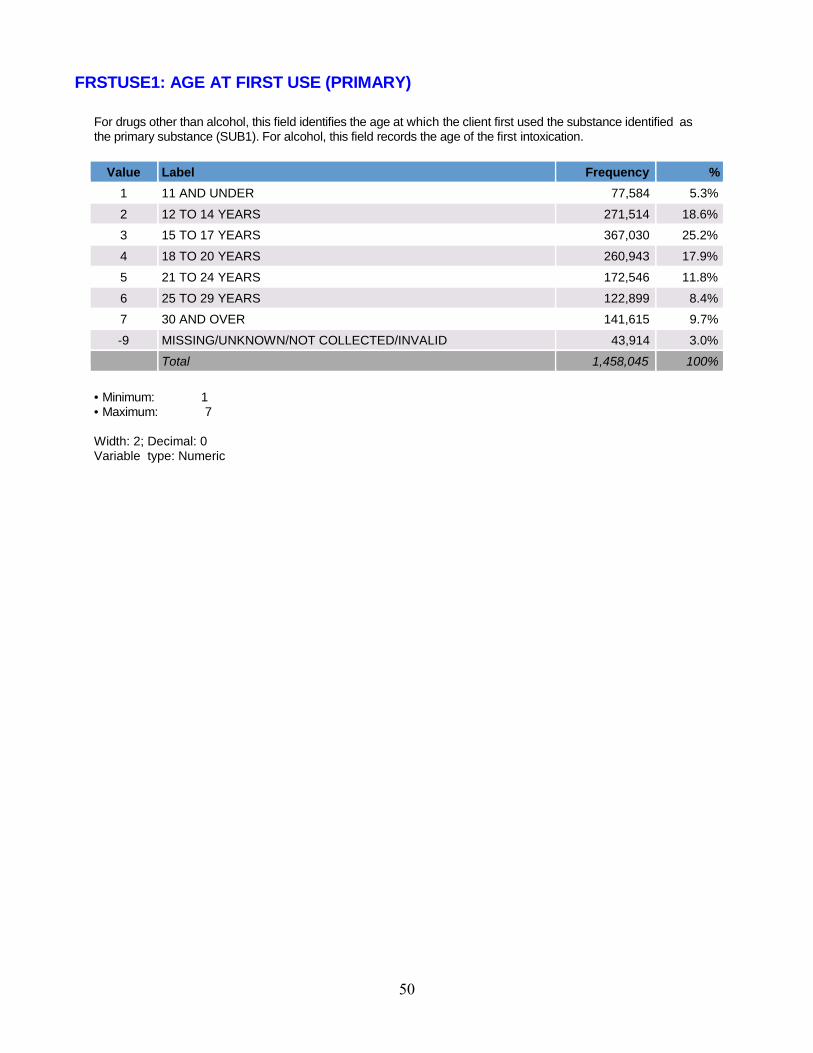
FRSTUSE1: AGE AT FIRST USE (PRIMARY)
For drugs other than alcohol, this field identifies the age at which the client first used the substance identified as the primary substance (SUB1). For alcohol, this field records the age of the first intoxication.
Value Label Frequency %
1 11 AND UNDER 77,584 5.3% 2 12 TO 14 YEARS 271,514 18.6% 3 15 TO 17 YEARS 367,030 25.2% 4 18 TO 20 YEARS 260,943 17.9% 5 21 TO 24 YEARS 172,546 11.8% 6 25 TO 29 YEARS 122,899 8.4% 7 30 AND OVER 141,615 9.7% -9 MISSING/UNKNOWN/NOT COLLECTED/INVALID 43,914 3.0%
Total 1,458,045 100%
• Minimum: 1 • Maximum: 7
Width: 2; Decimal: 0 Variable type: Numeric
50

SUB2: SUBSTANCE USE AT ADMISSION OR DISCHARGE (SECONDARY)
This field identifies the client's secondary substance use at admission or discharge.
(1) NONE
(2) ALCOHOL
(3) COCAINE/CRACK
(4) MARIJUANA/HASHISH: Includes THC and any other cannabis sativa preparations.
(5) HEROIN
(6) NON-PRESCRIPTION METHADONE
(7) OTHER OPIATES AND SYNTHETICS: Includes buprenorphine, codeine, hydrocodone, hydromorphone,meperidine, morphine, opium, oxycodone, pentazocine, propoxyphene, tramadol, and any other drug withmorphine-like effects.
(8) PCP: Phencyclidine
(9) OTHER HALLUCINOGENS: Includes LSD, DMT, STP, hallucinogens, mescaline, peyote, psilocybin, etc.
(10) METHAMPHETAMINE
(11) OTHER AMPHETAMINES: Includes amphetamines, MDMA, phenmetrazine, and other unspecified amines andrelated drugs.
(12) OTHER STIMULANTS: Includes methylphenidate and any other stimulants.
(13) BENZODIAZEPINES: Includes alprazolam, chlordiazepoxide, clonazepam, clorazepate, diazepam, flunitrazepam,flurazepam, halazepam, lorazepam, oxazepam, prazepam, temazepam, triazolam, and other unspecifiedbenzodiazepines.
(14) OTHER NON-BENZODIAZEPINE TRANQUILIZERS: Includes meprobamate, tranquilizers, etc.
(15) BARBITURATES: Includes amobarbital, pentobarbital, phenobarbital, secobarbital, etc.
(16) OTHER NON-BARBITURATE SEDATIVES OR HYPNOTICS: Includes chloral hydrate, ethchlorvynol,glutethimide, methaqualone, sedatives/hypnotics, etc.
(17) INHALANTS: Includes chloroform, ether, gasoline, glue, nitrous oxide, paint thinner, etc.
(18) OVER-THE-COUNTER MEDICATIONS: Includes aspirin, cough syrup, diphenhydramine and otheranti-histamines, sleep aids, and any other legally obtained non-prescription medication.
(19) OTHER: Includes diphenylhydantoin/phenytoin, GHB/GBL, ketamine, etc.
See next page for frequency table.
51

SUB2: SUBSTANCE USE AT ADMISSION (SECONDARY)
Value Label Frequency % 1 NONE 582,836 40.0% 2 ALCOHOL 160,257 11.0% 3 COCAINE/CRACK 141,420 9.7% 4 MARIJUANA/HASHISH 218,937 15.0% 5 HEROIN 47,901 3.3% 6 NON-PRESCRIPTION METHADONE 2,857 0.2% 7 OTHER OPIATES AND SYNTHETICS 68,466 4.7% 8 PCP 2,652 0.2% 9 OTHER HALLUCINOGENS 3,084 0.2%
10 METHAMPHETAMINE 77,072 5.3% 11 OTHER AMPHETAMINES 7,277 0.5% 12 OTHER STIMULANTS 1,825 0.1% 13 BENZODIAZEPINES 54,036 3.7% 14 OTHER NON-BENZODIAZEPINE TRANQUILIZERS 395 0.0% 15 BARBITURATES 737 0.1% 16 OTHER NON-BARBITURATE SEDATIVES OR HYPNOTICS 3,909 0.3% 17 INHALANTS 845 0.1% 18 OVER-THE-COUNTER MEDICATIONS 969 0.1% 19 OTHER 24,919 1.7% -9 MISSING/UNKNOWN/NOT COLLECTED/INVALID 57,651 4.0%
Total 1,458,045 100%
• Minimum: 1 • Maximum: 19
Width: 2; Decimal: 0 Variable type: Numeric
52

SUB2_D: SUBSTANCE USE AT DISCHARGE (SECONDARY)
Value Label Frequency % 1 NONE 573,604 39.3% 2 ALCOHOL 133,283 9.1% 3 COCAINE/CRACK 112,635 7.7% 4 MARIJUANA/HASHISH 185,202 12.7% 5 HEROIN 37,291 2.6% 6 NON-PRESCRIPTION METHADONE 2,088 0.1% 7 OTHER OPIATES AND SYNTHETICS 57,838 4.0% 8 PCP 2,056 0.1% 9 OTHER HALLUCINOGENS 2,688 0.2%
10 METHAMPHETAMINE 64,366 4.4% 11 OTHER AMPHETAMINES 6,646 0.5% 12 OTHER STIMULANTS 1,756 0.1% 13 BENZODIAZEPINES 41,942 2.9% 14 OTHER NON-BENZODIAZEPINE TRANQUILIZERS 342 0.0% 15 BARBITURATES 657 0.0% 16 OTHER NON-BARBITURATE SEDATIVES OR HYPNOTICS 3,671 0.3% 17 INHALANTS 772 0.1% 18 OVER-THE-COUNTER MEDICATIONS 851 0.1% 19 OTHER 23,074 1.6% -9 MISSING/UNKNOWN/NOT COLLECTED/INVALID 207,283 14.2%
Total 1,458,045 100%
• Minimum: 1 • Maximum: 19
Width: 2; Decimal: 0 Variable type: Numeric
53

ROUTE2: USUAL ROUTE OF ADMINISTRATION (SECONDARY)
This field identifies the usual route of administration of the secondary substance (SUB2).
Value Label Frequency % 1 ORAL 278,028 19.1% 2 SMOKING 350,570 24.0% 3 INHALATION 93,344 6.4% 4 INJECTION (IV OR INTRAMUSCULAR) 89,383 6.1% 5 OTHER 5,501 0.4% -9 MISSING/UNKNOWN/NOT COLLECTED/INVALID 641,219 44.0%
Total 1,458,045 100%
• Minimum: 1 • Maximum: 5
Width: 2; Decimal: 0 Variable type: Numeric
54
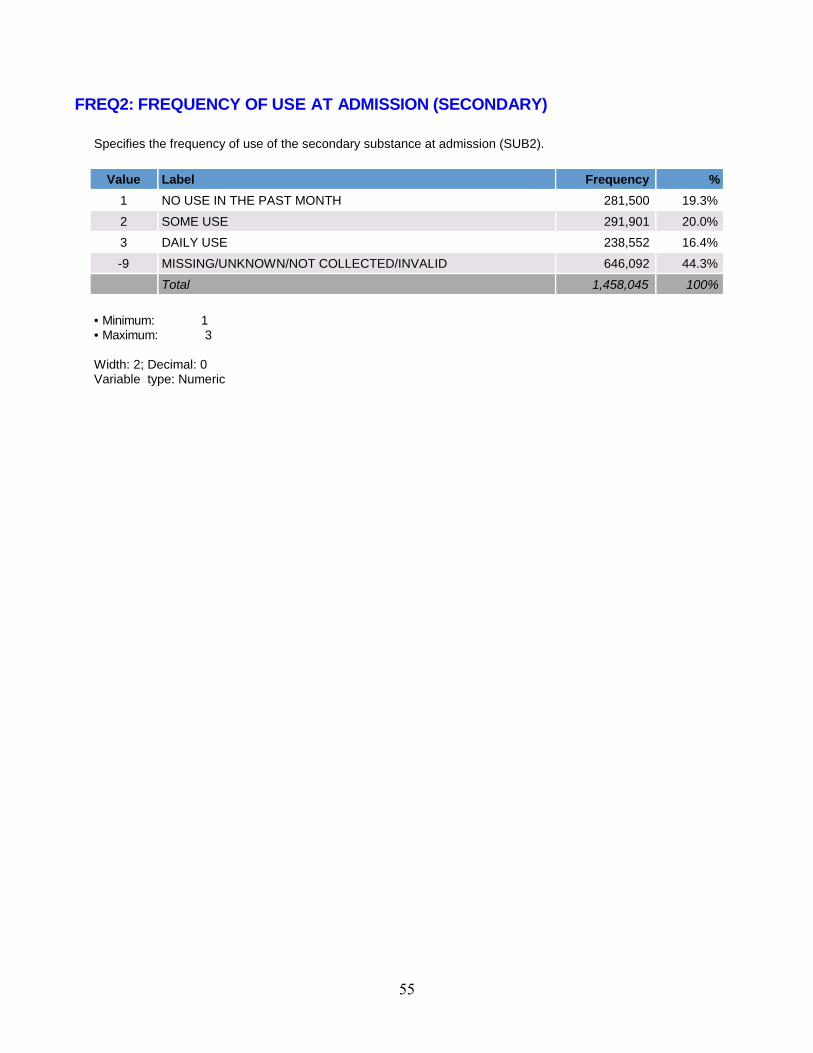
FREQ2: FREQUENCY OF USE AT ADMISSION (SECONDARY)
Specifies the frequency of use of the secondary substance at admission (SUB2).
Value Label Frequency % 1 NO USE IN THE PAST MONTH 281,500 19.3% 2 SOME USE 291,901 20.0% 3 DAILY USE 238,552 16.4% -9 MISSING/UNKNOWN/NOT COLLECTED/INVALID 646,092 44.3%
Total 1,458,045 100%
• Minimum: 1 • Maximum: 3
Width: 2; Decimal: 0 Variable type: Numeric
55

FREQ2_D: FREQUENCY OF USE AT DISCHARGE (SECONDARY)
Specifies the frequency of use of the secondary substance at discharge (SUB2_d).
Value Label Frequency % 1 NO USE IN THE PAST MONTH 677 0.0% 2 SOME USE 431,735 29.6% 3 DAILY USE 37,398 2.6% -9 MISSING/UNKNOWN/NOT COLLECTED/INVALID 988,235 67.8%
Total 1,458,045 100%
• Minimum: 1 • Maximum: 3
Width: 2; Decimal: 0 Variable type: Numeric
56

FRSTUSE2: AGE AT FIRST USE (SECONDARY)
For drugs other than alcohol, this field identifies the age at which the client first used the substance identified as the secondary substance (SUB2). For alcohol, this field records the age of the first intoxication.
Value Label Frequency %
1 11 AND UNDER 49,101 3.4% 2 12 TO 14 YEARS 176,246 12.1% 3 15 TO 17 YEARS 222,889 15.3% 4 18 TO 20 YEARS 140,243 9.6% 5 21 TO 24 YEARS 83,963 5.8% 6 25 TO 29 YEARS 63,972 4.4% 7 30 AND OVER 80,856 5.5% -9 MISSING/UNKNOWN/NOT COLLECTED/INVALID 640,775 43.9%
Total 1,458,045 100%
• Minimum: 1 • Maximum: 7
Width: 2; Decimal: 0 Variable type: Numeric
57

SUB3: SUBSTANCE USE AT ADMISSION OR DISCHARGE (TERTIARY)
This field identifies the client's tertiary substance of use at admission or discharge.
(1) NONE
(2) ALCOHOL
(3) COCAINE/CRACK
(4) MARIJUANA/HASHISH: Includes THC and any other cannabis sativa preparations.
(5) HEROIN
(6) NON-PRESCRIPTION METHADONE
(7) OTHER OPIATES AND SYNTHETICS: Includes buprenorphine, codeine, hydrocodone, hydromorphone,meperidine, morphine, opium, oxycodone, pentazocine, propoxyphene, tramadol, and any other drug withmorphine-like effects.
(8) PCP: Phencyclidine
(9) OTHER HALLUCINOGENS: Includes LSD, DMT, STP, hallucinogens, mescaline, peyote, psilocybin, etc.
(10) METHAMPHETAMINE
(11) OTHER AMPHETAMINES: Includes amphetamines, MDMA, phenmetrazine, and other unspecified amines andrelated drugs.
(12) OTHER STIMULANTS: Includes methylphenidate and any other stimulants.
(13) BENZODIAZEPINES: Includes alprazolam, chlordiazepoxide, clonazepam, clorazepate, diazepam, flunitrazepam,flurazepam, halazepam, lorazepam, oxazepam, prazepam, temazepam, triazolam, and other unspecifiedbenzodiazepines.
(14) OTHER NON-BENZODIAZEPINE TRANQUILIZERS: Includes meprobamate, tranquilizers, etc.
(15) BARBITURATES: Includes amobarbital, pentobarbital, phenobarbital, secobarbital, etc.
(16) OTHER NON-BARBITURATE SEDATIVES OR HYPNOTICS: Includes chloral hydrate, ethchlorvynol,glutethimide, methaqualone, sedatives/hypnotics, etc.
(17) INHALANTS: Includes chloroform, ether, gasoline, glue, nitrous oxide, paint thinner, etc.
(18) OVER-THE-COUNTER MEDICATIONS: Includes aspirin, cough syrup, diphenhydramine and otheranti-histamines, sleep aids, and any other legally obtained non-prescription medication.
(19) OTHER: Includes diphenylhydantoin/phenytoin, GHB/GBL, ketamine, etc.
See next page for frequency table.58

SUB3: SUBSTANCE USE AT ADMISSION (TERTIARY)
Value Label Frequency % 1 NONE 888,263 60.9% 2 ALCOHOL 60,047 4.1% 3 COCAINE/CRACK 49,155 3.4% 4 MARIJUANA/HASHISH 81,546 5.6% 5 HEROIN 13,438 0.9% 6 NON-PRESCRIPTION METHADONE 1,454 0.1% 7 OTHER OPIATES AND SYNTHETICS 24,472 1.7% 8 PCP 1,590 0.1% 9 OTHER HALLUCINOGENS 3,599 0.2%
10 METHAMPHETAMINE 19,867 1.4% 11 OTHER AMPHETAMINES 5,306 0.4% 12 OTHER STIMULANTS 1,389 0.1% 13 BENZODIAZEPINES 30,375 2.1% 14 OTHER NON-BENZODIAZEPINE TRANQUILIZERS 205 0.0% 15 BARBITURATES 471 0.0% 16 OTHER NON-BARBITURATE SEDATIVES OR HYPNOTICS 2,362 0.2% 17 INHALANTS 560 0.0% 18 OVER-THE-COUNTER MEDICATIONS 719 0.0% 19 OTHER 19,068 1.3% -9 MISSING/UNKNOWN/NOT COLLECTED/INVALID 254,159 17.4%
Total 1,458,045 100%
• Minimum: 1 • Maximum: 19
Width: 2; Decimal: 0 Variable type: Numeric
59

SUB3_D: SUBSTANCE USE AT DISCHARGE (TERTIARY)
Value Label Frequency % 1 NONE 876,135 60.1% 2 ALCOHOL 49,733 3.4% 3 COCAINE/CRACK 37,790 2.6% 4 MARIJUANA/HASHISH 67,032 4.6% 5 HEROIN 10,669 0.7% 6 NON-PRESCRIPTION METHADONE 947 0.1% 7 OTHER OPIATES AND SYNTHETICS 20,540 1.4% 8 PCP 1,228 0.1% 9 OTHER HALLUCINOGENS 3,033 0.2%
10 METHAMPHETAMINE 18,037 1.2% 11 OTHER AMPHETAMINES 4,606 0.3% 12 OTHER STIMULANTS 1,290 0.1% 13 BENZODIAZEPINES 23,532 1.6% 14 OTHER NON-BENZODIAZEPINE TRANQUILIZERS 182 0.0% 15 BARBITURATES 452 0.0% 16 OTHER NON-BARBITURATE SEDATIVES OR HYPNOTICS 2,088 0.1% 17 INHALANTS 519 0.0% 18 OVER-THE-COUNTER MEDICATIONS 599 0.0% 19 OTHER 16,989 1.2% -9 MISSING/UNKNOWN/NOT COLLECTED/INVALID 322,644 22.1%
Total 1,458,045 100%
• Minimum: 1 • Maximum: 19
Width: 2; Decimal: 0 Variable type: Numeric
60

ROUTE3: USUAL ROUTE OF ADMINISTRATION (TERTIARY)
This field identifies the usual route of administration of the tertiary substance (SUB3).
Value Label Frequency % 1 ORAL 123,554 8.5% 2 SMOKING 132,292 9.1% 3 INHALATION 40,250 2.8% 4 INJECTION (IV OR INTRAMUSCULAR) 25,696 1.8% 5 OTHER 2,605 0.2% -9 MISSING/UNKNOWN/NOT COLLECTED/INVALID 1,133,648 77.8%
Total 1,458,045 100%
• Minimum: 1 • Maximum: 5
Width: 2; Decimal: 0 Variable type: Numeric
61
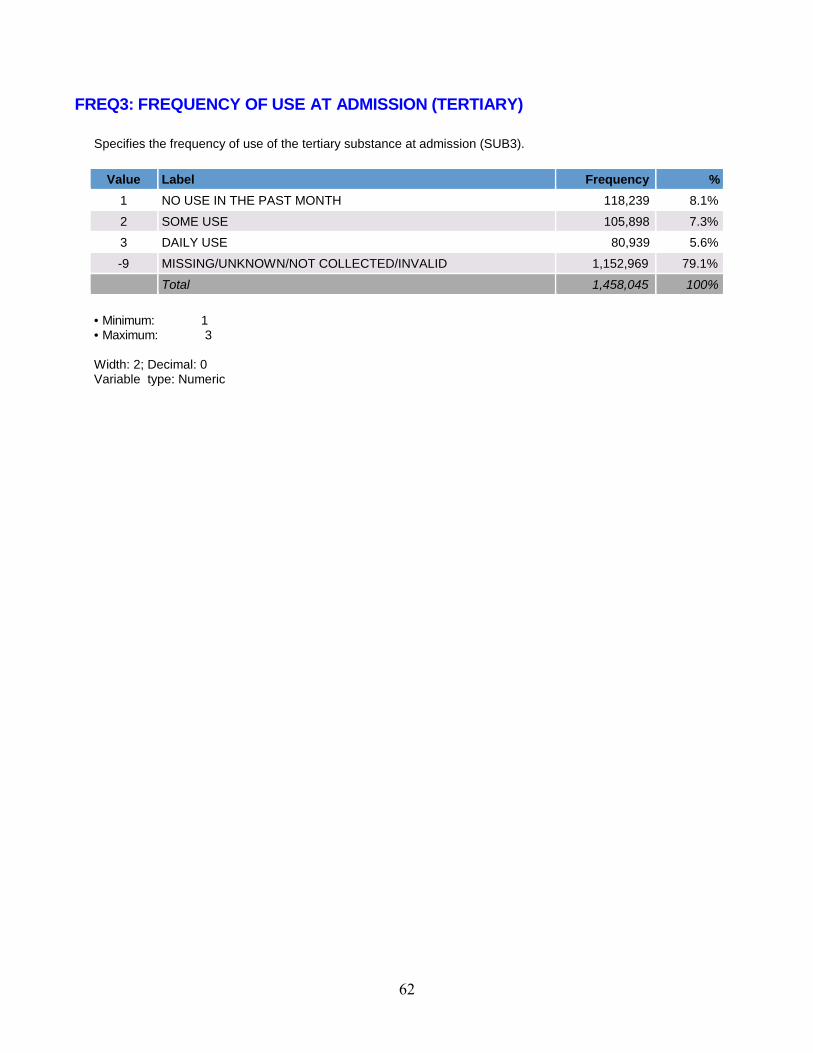
FREQ3: FREQUENCY OF USE AT ADMISSION (TERTIARY)
Specifies the frequency of use of the tertiary substance at admission (SUB3).
Value Label Frequency % 1 NO USE IN THE PAST MONTH 118,239 8.1% 2 SOME USE 105,898 7.3% 3 DAILY USE 80,939 5.6% -9 MISSING/UNKNOWN/NOT COLLECTED/INVALID 1,152,969 79.1%
Total 1,458,045 100%
• Minimum: 1 • Maximum: 3
Width: 2; Decimal: 0 Variable type: Numeric
62

FREQ3_D: FREQUENCY OF USE AT DISCHARGE (TERTIARY)
Specifies the frequency of use of the tertiary substance at discharge (SUB3_D).
Value Label Frequency % 1 NO USE IN THE PAST MONTH 143,702 9.9% 2 SOME USE 55,378 3.8% 3 DAILY USE 31,919 2.2% -9 MISSING/UNKNOWN/NOT COLLECTED/INVALID 1,227,046 84.2%
Total 1,458,045 100%
• Minimum: 1 • Maximum: 3
Width: 2; Decimal: 0 Variable type: Numeric
63

FRSTUSE3: AGE AT FIRST USE (TERTIARY)
For drugs other than alcohol, this field identifies the age at which the client first used the substance identified as the tertiary substance (SUB3). For alcohol, this field records the age of the first intoxication.
Value Label Frequency %
1 11 AND UNDER 23,642 1.6% 2 12 TO 14 YEARS 76,314 5.2% 3 15 TO 17 YEARS 90,967 6.2% 4 18 TO 20 YEARS 53,831 3.7% 5 21 TO 24 YEARS 30,636 2.1% 6 25 TO 29 YEARS 23,286 1.6% 7 30 AND OVER 29,415 2.0% -9 MISSING/UNKNOWN/NOT COLLECTED/INVALID 1,129,954 77.5%
Total 1,458,045 100%
• Minimum: 1 • Maximum: 7
Width: 2; Decimal: 0 Variable type: Numeric
64

NUMSUBS: NUMBER OF SUBSTANCES REPORTED AT ADMISSION
Calculates the number of substances (maximum of 3) reported at admission from primary, secondary, and tertiary substances of use (SUB1, SUB2 and SUB3).
Value Label Frequency %
0 0 25,975 1.8% 1 1 614,512 42.1% 2 2 501,935 34.4% 3 3 315,623 21.6%
Total 1,458,045 100%
• Minimum: 0 • Maximum: 3
Width: 2; Decimal: 0 Variable type: Numeric
65
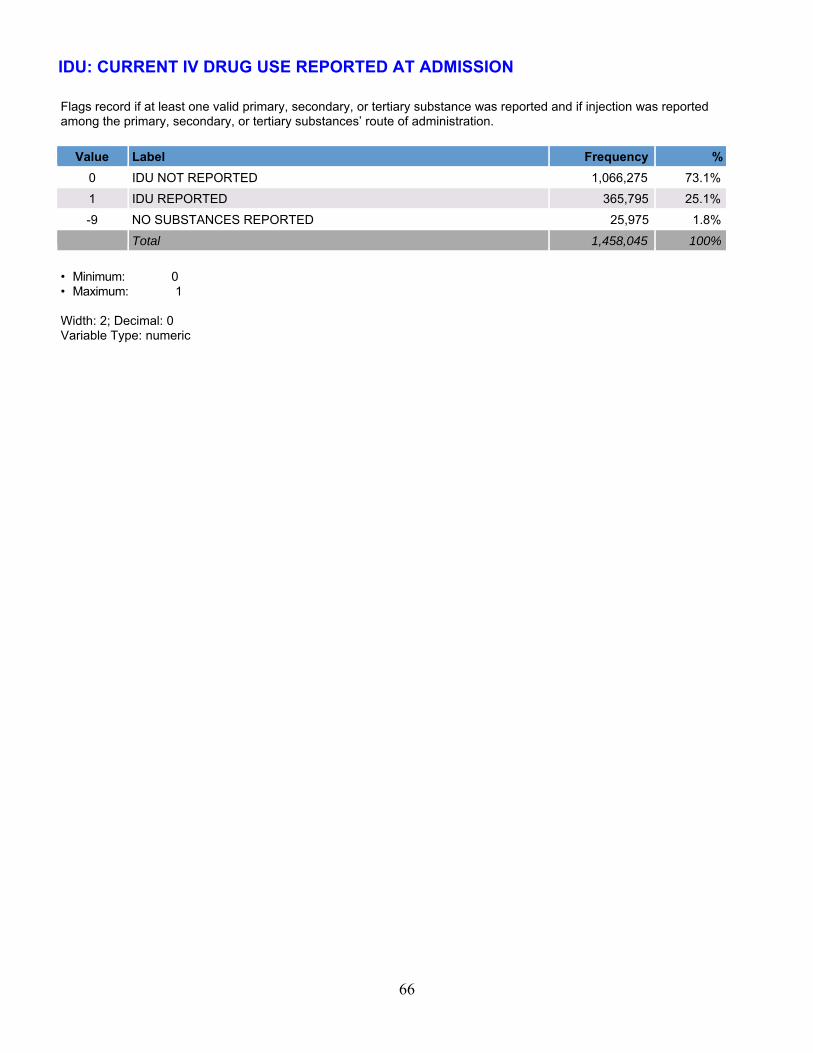
IDU: CURRENT IV DRUG USE REPORTED AT ADMISSION
Flags record if at least one valid primary, secondary, or tertiary substance was reported and if injection was reported among the primary, secondary, or tertiary substances’ route of administration.
Value Label Frequency %
0 IDU NOT REPORTED 1,066,275 73.1% 1 IDU REPORTED 365,795 25.1% -9 NO SUBSTANCES REPORTED 25,975 1.8%
Total 1,458,045 100%
• Minimum: 0 • Maximum: 1
Width: 2; Decimal: 0 Variable Type: numeric
66

ALCFLG: ALCOHOL REPORTED AT ADMISSION
Flags record if alcohol was reported as the primary, secondary, or tertiary substance of use at the time of admission.
Value Label Frequency %
0 SUBSTANCE NOT REPORTED 763,732 52.4% 1 SUBSTANCE REPORTED 694,313 47.6%
Total 1,458,045 100%
• Minimum: 0 • Maximum: 1
Width: 1; Decimal: 0 Variable type: Numeric
67

COKEFLG: COCAINE/CRACK REPORTED AT ADMISSION
Flags record if cocaine or crack was reported as the primary, secondary, or tertiary substance of use at the time of admission.
Value Label Frequency %
0 SUBSTANCE NOT REPORTED 1,193,708 81.9% 1 SUBSTANCE REPORTED 264,337 18.1%
Total 1,458,045 100%
• Minimum: 0 • Maximum: 1
Width: 1; Decimal: 0 Variable type: Numeric
68

MARFLG: MARIJUANA/HASHISH REPORTED AT ADMISSION
Flags record if marijuana or hashish were reported as the primary, secondary, or tertiary substance of use at the time of admission.
Value Label Frequency %
0 SUBSTANCE NOT REPORTED 953,414 65.4% 1 SUBSTANCE REPORTED 504,631 34.6%
Total 1,458,045 100%
• Minimum: 0 • Maximum: 1
Width: 1; Decimal: 0 Variable type: Numeric
69
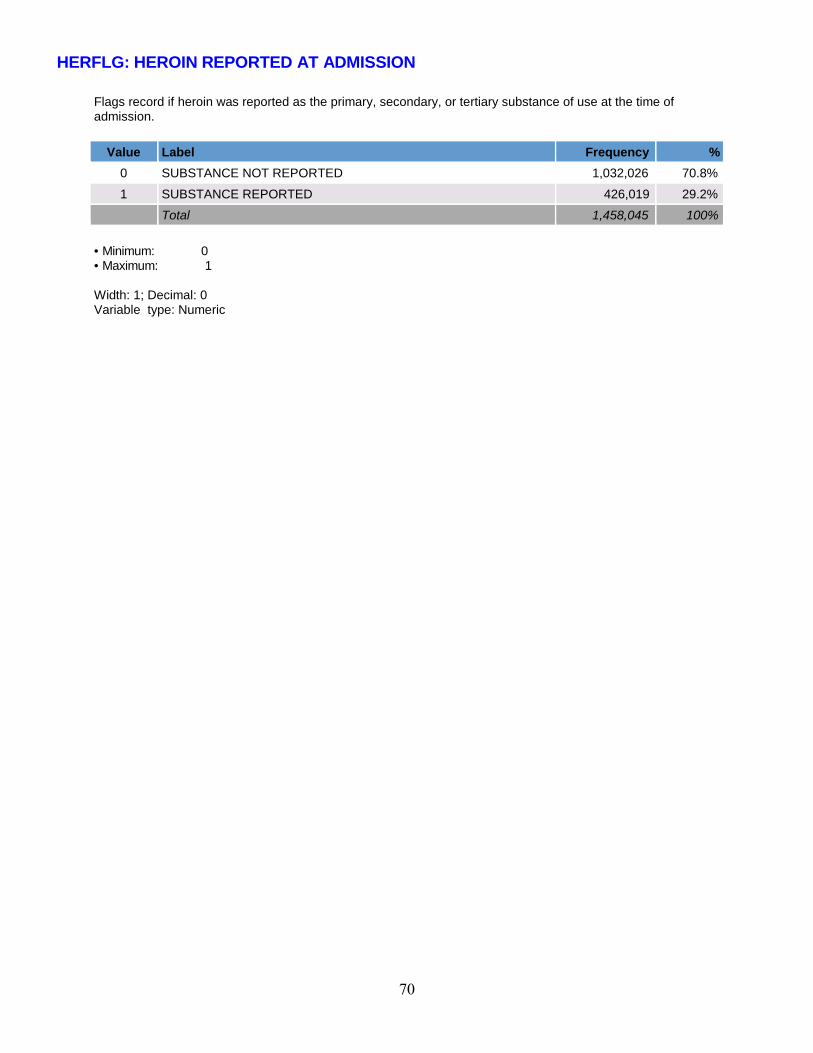
HERFLG: HEROIN REPORTED AT ADMISSION
Flags record if heroin was reported as the primary, secondary, or tertiary substance of use at the time of admission.
Value Label Frequency %
0 SUBSTANCE NOT REPORTED 1,032,026 70.8% 1 SUBSTANCE REPORTED 426,019 29.2%
Total 1,458,045 100%
• Minimum: 0 • Maximum: 1
Width: 1; Decimal: 0 Variable type: Numeric
70

METHFLG: NON-RX METHADONE REPORTED AT ADMISSION Flags record if non-prescription methadone was reported as the primary, secondary, or tertiary substance of use at the time of admission.
Value Label Frequency %
0 SUBSTANCE NOT REPORTED 1,450,930 99.5% 1 SUBSTANCE REPORTED 7,115 0.5%
Total 1,458,045 100%
• Minimum: 0 • Maximum: 1
Width: 1; Decimal: 0 Variable type: Numeric
71

OPSYNFLG: OTHER OPIATES/SYNTHETICS REPORTED AT ADMISSION
Flags record if other opiates or synthetics were reported as the primary, secondary, or tertiary substance of use at the time of admission.
Value Label Frequency %
0 SUBSTANCE NOT REPORTED 1,253,794 86.0% 1 SUBSTANCE REPORTED 204,251 14.0%
Total 1,458,045 100%
• Minimum: 0 • Maximum: 1
Width: 1; Decimal: 0 Variable type: Numeric
72

PCPFLG: PCP REPORTED AT ADMISSION Flags record if PCP was reported as the primary, secondary, or tertiary substance of use at the time of admission.
Value Label Frequency %
0 SUBSTANCE NOT REPORTED 1,449,621 99.4% 1 SUBSTANCE REPORTED 8,424 0.6%
Total 1,458,045 100%
• Minimum: 0 • Maximum: 1
Width: 1; Decimal: 0 Variable type: Numeric
73
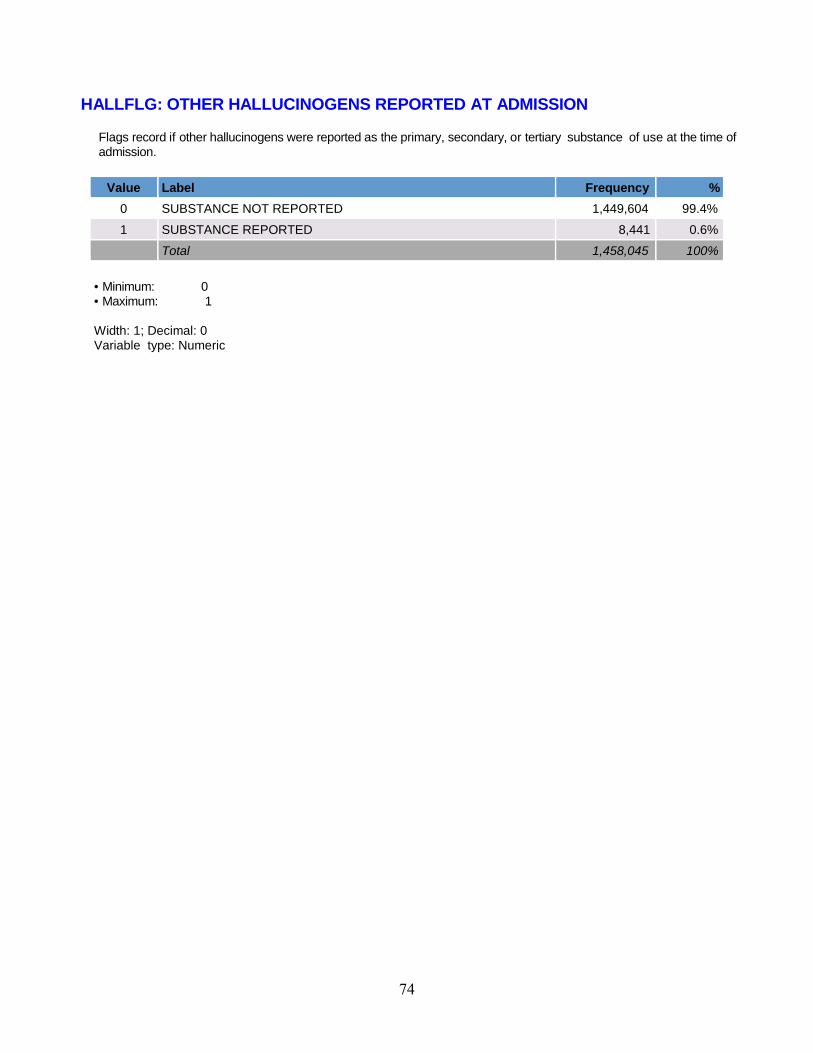
HALLFLG: OTHER HALLUCINOGENS REPORTED AT ADMISSION
Flags record if other hallucinogens were reported as the primary, secondary, or tertiary substance of use at the time of admission.
Value Label Frequency %
0 SUBSTANCE NOT REPORTED 1,449,604 99.4% 1 SUBSTANCE REPORTED 8,441 0.6%
Total 1,458,045 100%
• Minimum: 0 • Maximum: 1
Width: 1; Decimal: 0 Variable type: Numeric
74

MTHAMFLG: METHAMPHETAMINE REPORTED AT ADMISSION
Flags record if methamphetamines were reported as the primary, secondary, or tertiary substance of use at the time of admission.
Value Label Frequency %
0 SUBSTANCE NOT REPORTED 1,204,364 82.6% 1 SUBSTANCE REPORTED 253,681 17.4%
Total 1,458,045 100%
• Minimum: 0 • Maximum: 1
Width: 1; Decimal: 0 Variable type: Numeric
75

AMPHFLG: OTHER AMPHETAMINES REPORTED AT ADMISSION
Flags record if other amphetamines were reported as the primary, secondary, or tertiary substance of use at the time of admission.
Value Label Frequency %
0 SUBSTANCE NOT REPORTED 1,437,791 98.6% 1 SUBSTANCE REPORTED 20,254 1.4%
Total 1,458,045 100%
• Minimum: 0 • Maximum: 1
Width: 1; Decimal: 0 Variable type: Numeric
76

STIMFLG: OTHER STIMULANTS REPORTED AT ADMISSION
Flags record if other stimulants were reported as the primary, secondary, or tertiary substance of use at the time of admission.
Value Label Frequency % 0 SUBSTANCE NOT REPORTED 1,453,388 99.7% 1 SUBSTANCE REPORTED 4,657 0.3%
Total 1,458,045 100%
• Minimum: 0 • Maximum: 1
Width: 1; Decimal: 0 Variable type: Numeric
77
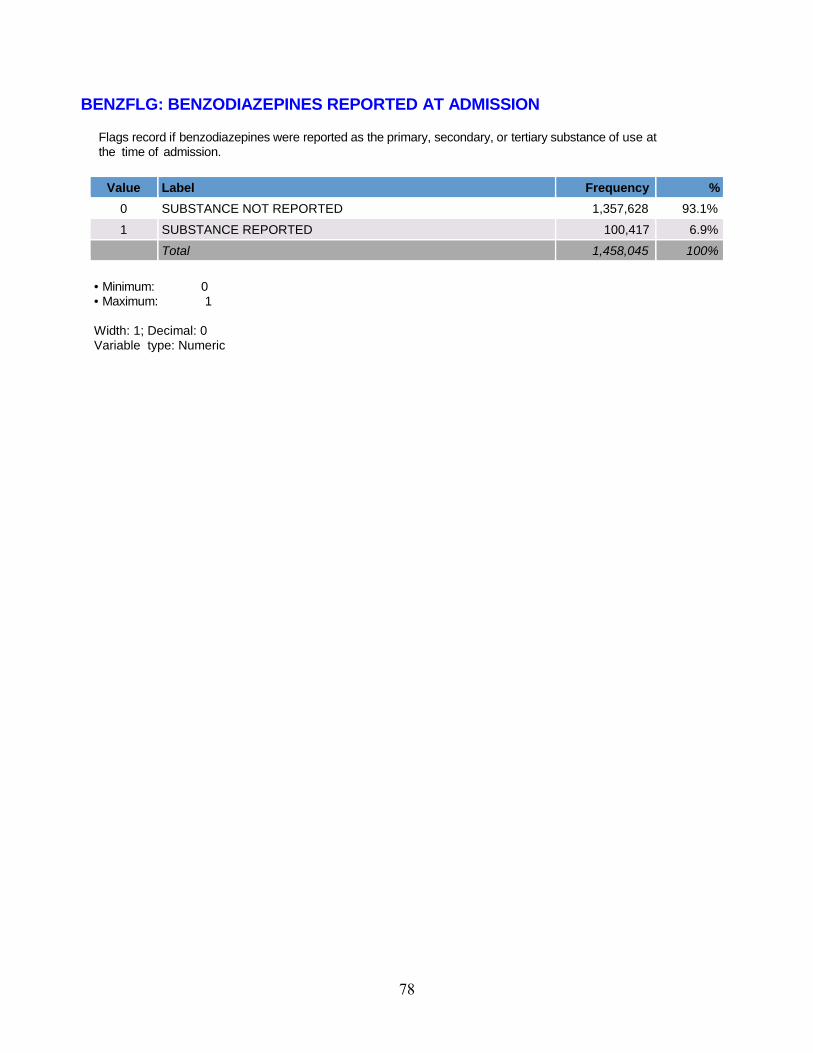
BENZFLG: BENZODIAZEPINES REPORTED AT ADMISSION
Flags record if benzodiazepines were reported as the primary, secondary, or tertiary substance of use at the time of admission.
Value Label Frequency %
0 SUBSTANCE NOT REPORTED 1,357,628 93.1% 1 SUBSTANCE REPORTED 100,417 6.9%
Total 1,458,045 100%
• Minimum: 0 • Maximum: 1
Width: 1; Decimal: 0 Variable type: Numeric
78

TRNQFLG: OTHER NON-BENZODIAZEPINE TRANQUILIZERS REPORTED AT ADMISSION
Flags record if other non-benzodiazepine tranquilizers were reported as the primary, secondary, or tertiary substance of use at the time of admission.
Value Label Frequency %
0 SUBSTANCE NOT REPORTED 1,457,263 99.9% 1 SUBSTANCE REPORTED 782 0.1%
Total 1,458,045 100%
• Minimum: 0 • Maximum: 1
Width: 1; Decimal: 0 Variable type: Numeric
79

BARBFLG: BARBITURATES REPORTED AT ADMISSION
Flags record if barbiturates were reported as the primary, secondary, or tertiary substance of use at the time of admission.
Value Label Frequency %
0 SUBSTANCE NOT REPORTED 1,455,721 99.8% 1 SUBSTANCE REPORTED 2,324 0.2%
Total 1,458,045 100%
• Minimum: 0 • Maximum: 1
Width: 1; Decimal: 0 Variable type: Numeric
80

SEDHPFLG: OTHER NON-BARBITURATE SEDATIVES/HYPNOTICS REPORTED AT ADMISSION
Flags record if other non-barbiturate sedatives or hypnotics were reported as the primary, secondary, or tertiary substance of use at the time of admission.
Value Label Frequency %
0 SUBSTANCE NOT REPORTED 1,450,119 99.5% 1 SUBSTANCE REPORTED 7,926 0.5%
Total 1,458,045 100%
• Minimum: 0 • Maximum: 1
Width: 1; Decimal: 0 Variable type: Numeric
81

INHFLG: INHALANTS REPORTED AT ADMISSION
Flags record if inhalants were reported as the primary, secondary, or tertiary substance of use at the time of admission.
Value Label Frequency %
0 SUBSTANCE NOT REPORTED 1,455,910 99.9% 1 SUBSTANCE REPORTED 2,135 0.1%
Total 1,458,045 100%
• Minimum: 0 • Maximum: 1
Width: 1; Decimal: 0 Variable type: Numeric
82

OTCFLG: OVER-THE-COUNTER MEDICATION REPORTED AT ADMISSION
Flags record if over-the-counter medications were reported as the primary, secondary, or tertiary substance of use at the time of admission.
Value Label Frequency %
0 SUBSTANCE NOT REPORTED 1,455,644 99.8% 1 SUBSTANCE REPORTED 2,401 0.2%
Total 1,458,045 100%
• Minimum: 0 • Maximum: 1
Width: 1; Decimal: 0 Variable type: Numeric
83

OTHERFLG: OTHER DRUG REPORTED AT ADMISSION
Flags record if other substances were reported as the primary, secondary, or tertiary substance of use at the time of admission.
Value Label Frequency %
0 SUBSTANCE NOT REPORTED 1,404,902 96.4% 1 SUBSTANCE REPORTED 53,143 3.6%
Total 1,458,045 100%
• Minimum: 0 • Maximum: 1
Width: 1; Decimal: 0 Variable type: Numeric
84
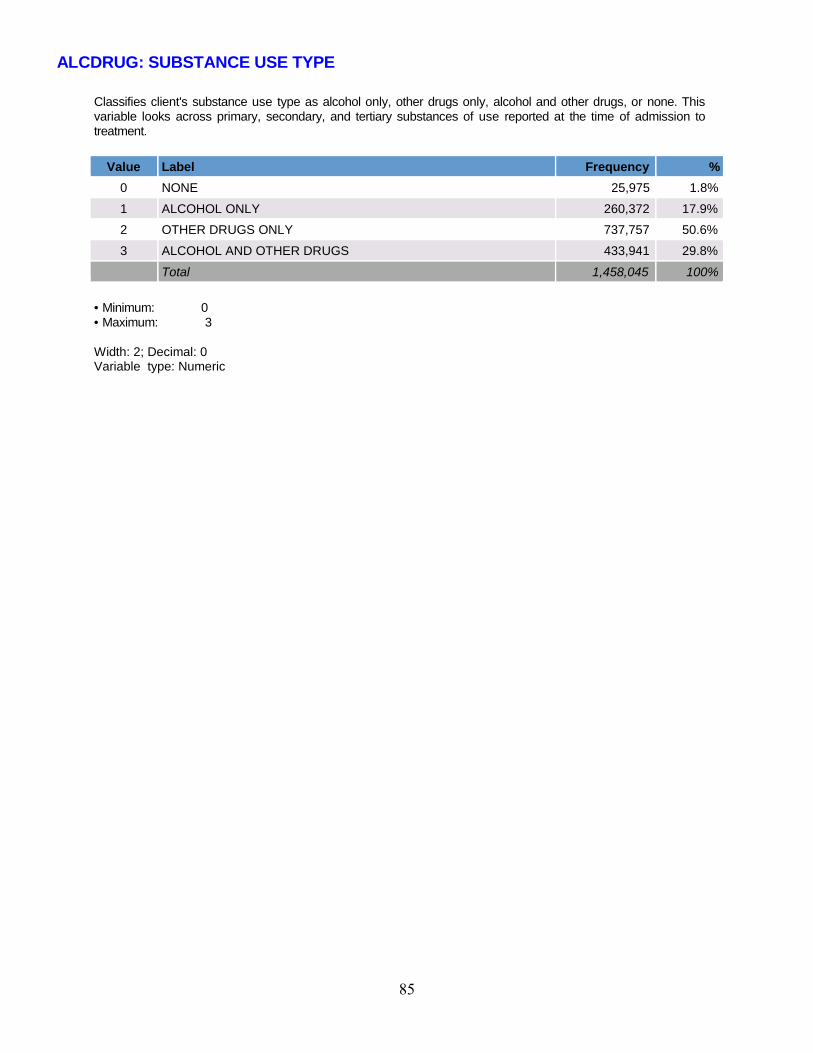
ALCDRUG: SUBSTANCE USE TYPE
Classifies client's substance use type as alcohol only, other drugs only, alcohol and other drugs, or none. This variable looks across primary, secondary, and tertiary substances of use reported at the time of admission to treatment.
Value Label Frequency %
0 NONE 25,975 1.8% 1 ALCOHOL ONLY 260,372 17.9% 2 OTHER DRUGS ONLY 737,757 50.6% 3 ALCOHOL AND OTHER DRUGS 433,941 29.8%
Total 1,458,045 100%
• Minimum: 0 • Maximum: 3
Width: 2; Decimal: 0 Variable type: Numeric
85

DSMCRIT: DSM DIAGNOSIS
Client’s diagnosis is used to identify the substance of use that provides the reason for client encounter or treatment. This can be reported by using either the Diagnostic and Statistical Manual of Mental Disorders (DSM) from the American Psychiatric Association or the International Classification of Diseases (ICD), from the World Health Organization.
The discrete diagnosis codes have been recoded into categories related to use of and dependence on specific substances, mental health conditions, and other conditions.
Value Label Frequency %
1 ALCOHOL-INDUCED DISORDER 2,391 0.2% 2 SUBSTANCE-INDUCED DISORDER 3,625 0.2% 3 ALCOHOL INTOXICATION 547 0.0% 4 ALCOHOL DEPENDENCE 25,613 1.8% 5 OPIOID DEPENDENCE 26,273 1.8% 6 COCAINE DEPENDENCE 3,385 0.2% 7 CANNABIS DEPENDENCE 9,055 0.6% 8 OTHER SUBSTANCE DEPENDENCE 16,429 1.1% 9 ALCOHOL ABUSE 6,081 0.4%
10 CANNABIS ABUSE 5,878 0.4% 11 OTHER SUBSTANCE ABUSE 2,579 0.2% 12 OPIOID ABUSE 2,067 0.1% 13 COCAINE ABUSE 829 0.1% 14 ANXIETY DISORDERS 665 0.0% 15 DEPRESSIVE DISORDERS 1,832 0.1% 16 SCHIZOPHRENIA/OTHER PSYCHOTIC DISORDERS 454 0.0% 17 BIPOLAR DISORDERS 1,112 0.1% 18 ATTENTION DEFICIT/DISRUPTIVE BEHAVIOR DISORDERS 97 0.0% 19 OTHER MENTAL HEALTH CONDITION 1,290 0.1% -9 MISSING/UNKNOWN/NOT COLLECTED/INVALID/NO OR
DEFERRED DIAGNOSIS 1,347,843 92.4%
Total 1,458,045 100%
• Minimum: 1 • Maximum: 19
Width: 2; Decimal: 0 Variable type: Numeric
86

PSYPROB: PSYCHIATRIC PROBLEM IN ADDITION TO ALCOHOL/DRUG PROBLEM
Indicates whether the client has a psychiatric problem in addition to his or her alcohol or drug use problem.
Value Label Frequency % 1 YES 484,315 33.2% 2 NO 719,617 49.4% -9 MISSING/UNKNOWN/NOT COLLECTED/INVALID 254,113 17.4%
Total 1,458,045 100%
• Minimum: 1 • Maximum: 2
Width: 2; Decimal: 0 Variable type: Numeric
87

HLTHINS: HEALTH INSURANCE
This field specifies the client’s health insurance at admission. The insurance may or may not cover behavioral health treatment. Reporting of this field is optional for both substance use and mental health clients. States are encouraged to report data for all categories in the list of valid entries, but reporting a subset of the categories is acceptable. Health Insurance should be reported, if collected, whether or not it covers behavioral health treatment.
Value Label Frequency %
1 PRIVATE INSURANCE, BLUE CROSS/BLUE SHIELD, HMO 65,330 4.5% 2 MEDICAID 224,601 15.4% 3 MEDICARE, OTHER (E.G. TRICARE, CHAMPUS) 55,481 3.8% 4 NONE 253,474 17.4% -9 MISSING/UNKNOWN/NOT COLLECTED/INVALID 859,159 58.9%
Total 1,458,045 100%
• Minimum: 1 • Maximum: 4
Width: 2; Decimal: 0 Variable type: Numeric
88

PRIMPAY: EXPECTED/ACTUAL PRIMARY SOURCE OF PAYMENT
This field identifies the primary source of payment for this treatment episode anticipated at the time of admission.
Guidelines: States operating under a split payment fee arrangement between multiple payment sources are to default to the payment source with the largest percentage. When payment percentages are equal, the state can select either source. Reporting of this field is optional for both substance use and mental health treatment clients. States are encouraged to report data for all categories in the list of valid entries, but reporting a subset of the categories is acceptable.
Value Label Frequency %
1 SELF-PAY 54,261 3.7% 2 PRIVATE INSURANCE (BLUE CROSS/BLUE SHIELD, OTHER
HEALTH INSURANCE, WORKERS COMPENSATION) 44,914 3.1%
3 MEDICARE 8,025 0.6% 4 MEDICAID 191,330 13.1% 5 OTHER GOVERNMENT PAYMENTS 178,327 12.2% 6 NO CHARGE (FREE, CHARITY, SPECIAL RESEARCH, TEACHING) 20,229 1.4% 7 OTHER 46,718 3.2% -9 MISSING/UNKNOWN/NOT COLLECTED/INVALID 914,241 62.7%
Total 1,458,045 100%
• Minimum: 1 • Maximum: 7
Width: 2; Decimal: 0 Variable type: Numeric
89

FREQ_ATND_SELF_HELP: ATTENDANCE AT SUBSTANCE USE SELF-HELP GROUPS IN PAST 30 DAYS PRIOR TO ADMISSION
This field indicates the frequency of attendance at a substance use self-help group in the 30 days prior to the reference date (the date of admission). It includes attendance at Alcoholics Anonymous (AA), Narcotics Anonymous (NA), and other self-help/mutual support groups focused on recovery from substance use and dependence.
Guidelines: For admission records, the reference period is the 30 days prior to admission. Use 5 Some attendance only if it is known that the client attended a self-help program during the reference period, but there is insufficient information to assign a specific frequency.
Value Label Frequency %
1 NO ATTENDANCE 805,308 55.2% 2 1-3 TIMES IN THE PAST MONTH 68,163 4.7% 3 4-7 TIMES IN THE PAST MONTH 46,824 3.2% 4 8-30 TIMES IN THE PAST MONTH 105,910 7.3% 5 SOME ATTENDANCE, FREQUENCY IS UNKNOWN 66,188 4.5% -9 MISSING/UNKNOWN/NOT COLLECTED/INVALID 365,652 25.1%
Total 1,458,045 100%
• Minimum: 1 • Maximum: 5
Width: 2; Decimal: 0 Variable Type: numeric
90

FREQ_ATND_SELF_HELP_D: ATTENDANCE AT SUBSTANCE USE SELF-HELP GROUPS IN PAST 30 DAYS PRIOR TO DISCHARGE
This field indicates the frequency of attendance at a substance use self-help group in the 30 days prior to the reference date (the date of discharge). It includes attendance at Alcoholics Anonymous (AA), Narcotics Anonymous (NA), and other self-help/mutual support groups focused on recovery from substance use and dependence.
Guidelines: For discharge records, the reference period is the 30 days prior to discharge. Use 5 Some attendance only if it is known that the client attended a self-help program during the reference period, but there is insufficient information to assign a specific frequency.
Value Label Frequency %
1 NO ATTENDANCE 686,791 47.1% 2 1-3 TIMES IN THE PAST MONTH 82,842 5.7% 3 4-7 TIMES IN THE PAST MONTH 66,609 4.6% 4 8-30 TIMES IN THE PAST MONTH 166,853 11.4% 5 SOME ATTENDANCE, FREQUENCY IS UNKNOWN 125,093 8.6% -9 MISSING/UNKNOWN/NOT COLLECTED/INVALID 329,857 22.6%
Total 1,458,045 100%
• Minimum: 1 • Maximum: 5
Width: 2; Decimal: 0 Variable Type: numeric
91

92
Appendices

Variable Source Type Length Label
AGE Minimum data set Numeric 8 Age (recoded)
ALCDRUG Computed variable Numeric 8 Substance use type
ALCFLG Computed variable Numeric 8 Alcohol reported at admission
AMPHFLG Computed variable Numeric 8 Other amphetamines reported at admission
ARRESTS Supplemental data set Numeric 8 Number of arrests in 30 days prior to admission
ARRESTS_D Supplemental data set Numeric 8 Number of arrests in 30 days prior to discharge
BARBFLG Computed variable Numeric 8 Barbiturates reported at admission
BENZFLG Computed variable Numeric 8 Benzodiazepines reported at admission
CASEID Computed variable Numeric 8 Case identification number
CBSA Computed variable Numeric 8 FIPS 2010 CBSA code
COKEFLG Computed variable Numeric 8 Cocaine/crack reported at admission
DAYWAIT Supplemental data set Numeric 8 Days waiting to enter treatment
DETCRIM Supplemental data set Numeric 8 Detailed criminal justice referral
DETNLF Supplemental data set Numeric 8 Detailed 'not in labor force' category at admission
DETNLF_D Supplemental data set Numeric 8 Detailed 'not in labor force' category at discharge
DISYR Computed variable Numeric 8 Year of discharge
DIVISION Computed variable Numeric 8 Census division
DSMCRIT Supplemental data set Numeric 8 DSM diagnosis
EDUC Minimum data set Numeric 8 Education
EMPLOY Minimum data set Numeric 8 Employment status at admission
EMPLOY_D Minimum data set Numeric 8 Employment status at discharge
ETHNIC Minimum data set Numeric 8 Hispanic or Latino Origin
FREQ1 Minimum data set Numeric 8 Frequency of use at admission (primary)
FREQ2 Minimum data set Numeric 8 Frequency of use at admission (secondary)
FREQ3 Minimum data set Numeric 8 Frequency of use at admission (tertiary)
FREQ1_D Minimum data set Numeric 8 Frequency of use at discharge (primary)
FREQ2_D Minimum data set Numeric 8 Frequency of use at discharge (secondary)
FREQ3_D Minimum data set Numeric 8 Frequency of use at discharge (tertiary)
FREQ_ATND_SELF_HELP Supplemental data set Numeric 8
Attendance at substance use self-help groups in the past 30 days prior to admission
FREQ_ATND_SELF_HELP_D Supplemental data set Numeric 8
Attendance at substance use self-help groups in past 30 days prior to discharge
FRSTUSE1 Minimum data set Numeric 8 Age at first use (primary)
FRSTUSE2 Minimum data set Numeric 8 Age at first use (secondary)
FRSTUSE3 Minimum data set Numeric 8 Age at first use (tertiary)
GENDER Minimum data set Numeric 8 Identifies client's biological sex
HALLFLG Computed variable Numeric 8 Other hallucinogens reported at admission
HERFLG Computed variable Numeric 8 Heroin reported at admission
HLTHINS Supplemental data set Numeric 8 Health insurance
IDU Computed variable Numeric 8 Current IV drug use reported at admission
INHFLG Computed variable Numeric 8 Inhalants reported at admission
LIVARAG Supplemental data set Numeric 8 Living arrangements at admission
LIVARAG_D Supplemental data set Numeric 8 Living arrangements at discharge
LOS Computed variable Numeric 8 Length of stay
TEDS-D Variable Information (alphabetical order)Appendix A.
93

Variable Source Type Length Label
MARFLG Computed variable Numeric 8 Marijuana/hashish reported at admission
MARSTAT Supplemental data set Numeric 8 Marital status
METHFLG Computed variable Numeric 8 Non-rx methadone reported at admission
METHUSE Minimum data set Numeric 8 Medication-assisted opioid therapy
MTHAMFLG Computed variable Numeric 8 Methamphetamine reported at admission
NOPRIOR Minimum data set Numeric 8 Previous substance use treatment episodes
NUMSUBS Computed variable Numeric 8 Number of substances reported at admission
OPSYNFLG Computed variable Numeric 8 Other opiates/synthetics reported at admission
OTCFLG Computed variable Numeric 8 Over-the-counter medication reported at admission
OTHERFLG Computed variable Numeric 8 Other drug reported at admission
PCPFLG Computed variable Numeric 8 PCP reported at admission
PREG Supplemental data set Numeric 8 Pregnant at time of admission
PRIMINC Supplemental data set Numeric 8 Source of income/support
PRIMPAY Supplemental data set Numeric 8 Expected/actual primary source of payment
PSOURCE Minimum data set Numeric 8 Referral source
PSYPROB Supplemental data set Numeric 8 Psychiatric problem in addition to alcohol/drug problem
RACE Minimum data set Numeric 8 Race
REASON Discharge data set Numeric 8 Reason for discharge
REGION Computed variable Numeric 8 Census region
ROUTE1 Minimum data set Numeric 8 Usual route of administration (primary)
ROUTE2 Minimum data set Numeric 8 Usual route of administration (secondary)
ROUTE3 Minimum data set Numeric 8 Usual route of administration (tertiary)
SEDHPFLG Computed variable Numeric 8 Other non-barbiturate sedatives/hypnotics reported at admission
SERVICES_D Minimum data set Numeric 8 Service setting at discharge
STFIPS Computed variable Numeric 8 Census state FIPS code
STIMFLG Computed variable Numeric 8 Other stimulants reported at admission
SUB1 Minimum data set Numeric 8 Substance use at admission (primary)
SUB2 Minimum data set Numeric 8 Substance use at admission (secondary)
SUB3 Minimum data set Numeric 8 Substance use at admission (tertiary)
SUB1_D Minimum data set Numeric 8 Substance use at discharge (primary)
SUB2_D Minimum data set Numeric 8 Substance use at discharge (secondary)
SUB3_D Minimum data set Numeric 8 Substance use at discharge (tertiary)
TRNQFLG Computed variable Numeric 8 Other non-benzodiazepine tranquilizers reported at admission
VET Supplemental data set Numeric 8 Veteran status
Appendix A.TEDS-D Variable Information (alphabetical order, continued)
94

Variable Original codes RecodesAGEAge at admission
Continuous (0-95) 1 12-14 years old2 15-17 years old3 18-20 years old4 21-24 years old5 25-29 years old6 30-34 years old7 35-39 years old8 40-44 years old9 45-49 years old10 50-54 years old11 55-64 years old11 65 and older
ARRESTSNumber of arrests prior to admission or discharge
Continuous (0-96) 0 None1 Once2 Two or more times
MARSTATMarital status
1 Never married2 Now married3 Separated4 Divorced5 Widowed
1 Never married2 Now married3 Separated4 Divorced, widowed
EDUCEducation
Continuous (0-25) 1 8 years or less2 9-11 years3 12 years4 13-15 years5 16 or more years
DETNLFDetailed ‘not in labor’ force
1 Homemaker2 Student3 Retired4 Disabled5 Resident of institution 6 Other
1 Homemaker2 Student3 Retired, disabled4 Resident of institution 5 Other
PRIMINCSource of income/support
1 Wages/salary2 Public assistance3 Retirement/pension4 Disability20 Other21 None
1 Wages/salary2 Public assistance3 Retirement/pension, disability4 Other5 None
CBSA10FIPS 2010 CBSA code
Census CBSA geographic codes Codes for "undesignated area" and "missing data" combined into a single value. When either PMSA or CBSA describes a population of less than 100,000, or when one of the codes falls into the combined missing category, records are recoded as: “Undesignated area/missing/unknown/not collected/invalid”
DETCRIMDetailed criminal justice referral
1 State/federal court2 Other court3 Probation/parole4 Other recognized legal entity5 Diversionary program6 Prison7 DUI/DWI8 Other
1 State/federal court2 Formal adjudication process3 Probation/parole4 Other recognized legal entity5 Diversionary program6 Prison7 DUI/DWI8 Other
Appendix B. Variable recode table
95

Variable Original codes Recodes
Appendix B. Variable recode table (continued)
HLTHINSHealth insurance
1 Private insurance (other than BC/BS or HMO)2 Blue Cross/Blue Shield (BC/BS)3 Medicare4 Medicaid6 Health maintenance organization (HMO)20 Other (e.g. TriCare, Champus)21 None
1 Private insurance, Blue Cross/Blue Shield, HMO2 Medicaid3 Medicare/other (e.g. Tricare, Champus) 4 None
PRIMPAYExpected/actual payment source
1 Self-pay2 Blue Cross/Blue Shield3 Medicare4 Medicaid5 Other government payments6 Worker’s compensation7 Other health insurance companies8 No charge (free, charity, special research, orteaching)9 Other
1 Self-pay2 Private Insurance (Blue Cross/Blue Shield,other health insurance, worker’s compensation)3 Medicare4 Medicaid5 Other government payments6 No charge (free, charity, special research, orteaching)7 Other
FRSTUSE1Age at first use (primary)FRSTUSE2Age at first use (secondary)FRSTUSE3Age at first use (tertiary)
Continuous (0-95) 1 11 and under2 12-143 15-174 18-205 21-246 25-297 30 and over
291.00 – 291.99 1 Alcohol-induced disorder
292.00 – 292.99 2 Substance-induced disorder
303.00 – 303.89 3 Alcohol intoxication
303.90 – 303.99 4 Alcohol dependence
304.00 – 304.09 5 Opioid dependence
304.20 – 304.29 6 Cocaine dependence
304.30 – 304.39 7 Cannabis dependence
304.10 – 304.19, 304.40 – 304.99,305.10 – 305.19
8 Other substance abuse dependence
305.00 – 305.09 9 Alcohol abuse
305.20 – 305.29 10 Cannabis abuse
305.30 – 305.49, 305.70 – 305.99 11 Other substance abuse
305.50 – 305.59 12 Opioid abuse
305.60 – 305.69 13 Cocaine abuse
293.89, 300.00 – 300.02, 300.21 – 300.23,300.29 – 300.39, 308.30 – 308.39, 309.81
14 Anxiety disorders
296.20 – 296.39, 300.40 – 300.49,311.00 – 311.09
15 Depressive disorders
293.81 – 293.82, 295.00 – 295.99,297.10 – 297.19, 297.30 – 297.39,298.80 – 298.89, 298.90 – 298.99
16 Schizophrenic/other psychotic disorders
296.00 – 296.09, 296.40 – 296.79,296.80, 296.89, 301.13
17 Bipolar disorders
DSMCRITDSM diagnosis
96
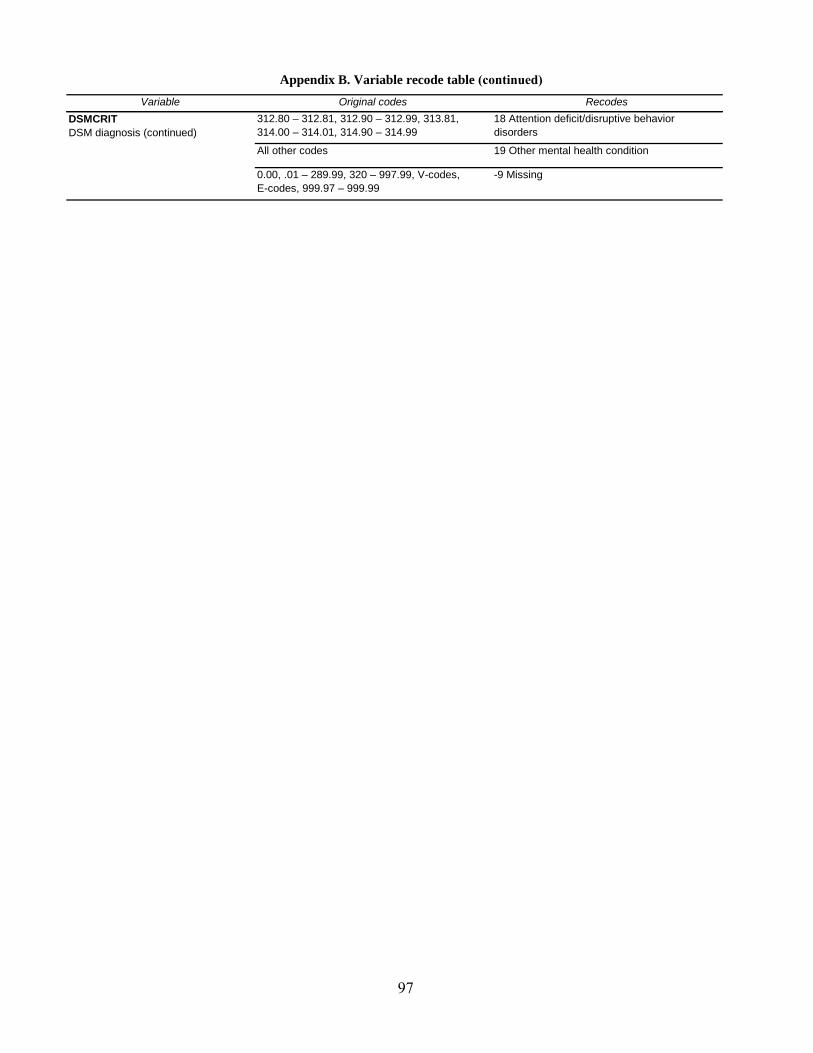
Variable Original codes Recodes
Appendix B. Variable recode table (continued)
312.80 – 312.81, 312.90 – 312.99, 313.81,314.00 – 314.01, 314.90 – 314.99
18 Attention deficit/disruptive behavior disorders
All other codes 19 Other mental health condition
0.00, .01 – 289.99, 320 – 997.99, V-codes, E-codes, 999.97 – 999.99
-9 Missing
DSMCRITDSM diagnosis (continued)
97

98
Appendix C. Technical Notes
The TEDS report tables contain several variables created by combining or recoding original variables submitted by states. The following notes describe how these variables are created or recoded.
Create a new variable that combines race and ethnicity:
● If race is 5 White and ethnicity is 4 not of Hispanic or Latino origin or -9 missing/unknown/not collected/invalid, then change new variable to 1 non-Hispanic White;
● if race is 4 Black or African American and ethnicity is 4 not of Hispanic or Latino origin or -9 missing/unknown/not collected/invalid, then change new variable to 2 non-Hispanic Black;
● if ethnicity is 1, 2, 3, or 5 Hispanic or Latino origin and race is 4 Black, 5 White, 7 other single race, or -9 missing/unknown/not collected/invalid, then change new variable to 3 Hispanic;
● if race is 1 Alaska Native, Aleut, Eskimo, 2 American Indian/Alaskan Native, 3 Asian or Pacific Islander, 6 Asian, or 9 Native Hawaiian or Other Pacific Islander and ethnicity is 4 not of Hispanic or Latino origin, then change new variable to 4 other;
● if race is 7 other single race, or 8 two or more races and ethnicity is 4 not of Hispanic or Latino origin, then change new variable to 4 other;
● if race is 1 Alaskan Native, Aleut, Eskimo, 2 American Indian/Alaskan Native, 3 Asian or Pacific Islander, 6 Asian, 8 two or more races, or 9 Native Hawaiian or Other Pacific Islander and ethnicity is 4 not of Hispanic or Latino origin, then change new variable to 4 other.
Recoding for primary substance use at admission:
● If primary substance use at admission is 2 alcohol, then change primary substance use to 1 alcohol;
● if primary substance use at admission is 5 heroin, 6 non-prescription methadone, or 7 other opiates, then change primary substance use to 2 opiates;
● if primary substance use at admission is 4 marijuana/hashish, then change primary substance use to 3 marijuana/hashish;
● if primary substance use at admission is 3 cocaine/crack, then change primary substance use to 4 cocaine;
● if primary substance use at admission is 10 methamphetamine, or 11 other amphetamines, or 12 other stimulants, then change primary substance use to 5 stimulants;
● else if primary substance use at admission assumes any other value, then change primary substance use to -9 none/other/unknown.
Recoding for primary substance use at discharge, as well as recoding for secondary and tertiary substance use at admission and discharge, follow the same logic as above.

99
Recoding service type at discharge:
● If service type at discharge is 7 non-intensive outpatient, then service type is 10 outpatient;
● if service type at discharge is 6 intensive outpatient, then service type is 11 intensive outpatient;
● if service type at discharge is 4 short-term residential, then service type is 20 short-term residential;
● if service type at discharge is 5 long-term residential, then service type is 21 long-term residential;
● if service type at discharge is 3 hospital residential, then service type is 22 hospital residential;
● if service type at discharge is 1 hospital detoxification, 2 free-standing detoxification, or 8 detoxification, then service type is 30 detoxification;
● if service type at discharge is 6 intensive outpatient or 7 non-intensive outpatient and medication-assisted therapy is planned, then new service type is 40 outpatient medication-assisted opioid therapy;
● if service type at discharge is 1 hospital detoxification, 2 free-standing detoxification, or 8 detoxification and medication-assisted therapy is planned, then new service type is 41 medication-assisted opioid detoxification;
● else new service type is other.