treatment episode data set (teds) 2012 - samhsa · treatment episode data set (teds) ... 31....
TRANSCRIPT

Treatment Episode Data Set (TEDS) 2012
Discharges from Substance Abuse Treatment Services
DEPARTMENT OF HEALTH AND HUMAN SERVICESSubstance Abuse and Mental Health Services Administration
Center for Behavioral Health Statistics and Quality

ii
AcknowledgmentsThis report was prepared for the Substance Abuse and Mental Health Services Administration (SAMHSA), Center for Behavioral Health Statistics and Quality (CBHSQ), by Synectics for Man-agement Decisions, Inc., Arlington, Virginia. Work by Synectics was performed under Task Order HHSS283200700048I/HHSS28342001T, Reference No. 283-07-4803 (Cathie Alderks, Task Order Officer). See Appendix C of this report for the List of Contributors.
Public domAin noticeAll material appearing in this report is in the public domain and may be reproduced or copied without permission from SAMHSA. Citation of the source is appreciated. However, this publication may not be reproduced or distributed for a fee without the specific, written authorization of the Office of Communications, SAMHSA, U.S. Department of Health and Human Services.
Recommended citAtionSubstance Abuse and Mental Health Services Administration, Treatment Episode Data Set (TEDS): 2012. Discharges from Substance Abuse Treatment Services. BHSIS Series S-81, HHS Publication No. (SMA) 16-4976. Rockville, MD: Substance Abuse and Mental Health Services Administration, 2015.
electRonic Access to PublicAtion
This publication may be downloaded or ordered at store.samhsa.gov.Or call SAMHSA at 1-877-SAMHSA-7 (1-877-726-4727)
(English and Español).
oRiginAting office
Center for Behavioral Health Statistics and QualitySubstance Abuse and Mental Health Services Administration
5600 Fishers Lane, Room 15SEH03Rockville, Maryland 20857
January 2016

iii
tAble of contents
List of Tables ...................................................................................................................................v
List of Figures .................................................................................................................................x
Highlights ........................................................................................................................................1
Chapter 1. Discharge Data Description and Data Overview for All Types of Service: 2012 ...................................................................................................................................3
Data Definitions .........................................................................................................................4Data Overview ...........................................................................................................................6Reason for Discharge by Type of Service .................................................................................8Median Length of Stay (LOS) by Type of Service and Reason for Discharge .........................9Socio-Demographic and Substance Use Related Characteristics at Time of Admission ................................................................................................................................10Comparison of Selected Characteristics at Admission and Discharge ....................................10Treatment Completion or Transfer to Further Treatment .........................................................11
Chapter 2. Outpatient Treatment Discharges Aged 12 and Older: 2012 ................................13
Chapter 3. Intensive Outpatient Treatment Discharges Aged 12 and Older: 2012................................................................................................................................................19
Chapter 4. Short-Term Residential Treatment Discharges Aged 12 and Older: 2012................................................................................................................................................25
Chapter 5. Long-Term Residential Treatment Discharges Aged 12 and Older: 2012................................................................................................................................................31
Chapter 6. Hospital Residential Treatment Discharges Aged 12 and Older: 2012 ................37
Chapter 7. Detoxification Discharges Aged 12 and Older: 2012 .............................................43
Chapter 8. Outpatient Medication-Assisted Opioid Therapy Discharges Aged 12 and Older: 2012 .......................................................................................................................49
Chapter 9. Medication-Assisted Opioid Detoxification Discharges Aged 12 and Older: 2012 ...................................................................................................................................55
Tables ............................................................................................................................................61
Appendix A. About the Treatment Episode Data Set (TEDS) ...............................................127Introduction ............................................................................................................................127History....................................................................................................................................128

iv
tAble of contents (continued)
State Data Collection Systems ..............................................................................................128Report-Specific Considerations .............................................................................................130
Appendix B. TEDS Data Elements ...........................................................................................137TEDS Minimum Data Set ......................................................................................................137TEDS Linked Data Set ..........................................................................................................145
Appendix C. List of Contributors.............................................................................................149

v
list of tAbles
Discharge Data Description and Data Overview for All Types of Service 1.1a. Total and linked discharges aged 12 and older, by state or jurisdiction:
Number, 2012 .....................................................................................................................63
1.1b. Total and linked discharges aged 12 and older, by state and jurisdiction: Percent distribution, 2012 ..................................................................................................64
1.2a. Discharges aged 12 and older, by type of service and state or jurisdiction: Number, 2012 .....................................................................................................................65
1.2b. Discharges aged 12 and older, by type of service and state or jurisdiction: Percent distribution, 2012 ..................................................................................................66
1.3a. Discharges aged 12 and older, by reason for discharge and state or jurisdiction: Number, 2012 .....................................................................................................................67
1.3b. Discharges aged 12 and older, by reason for discharge and state or jurisdiction: Percent distribution, 2012 ..................................................................................................68
1.4. Discharges aged 12 and older, by reason for discharge and type of service: Number, percent distribution, and median length of stay (LOS), 2012 .............................69
1.5. Discharges aged 12 and older, by type of service and characteristics at admission: Number, 2012 ..................................................................................................70
1.6a. Discharges aged 12 and older, by type of service and selected characteristics at admission: Number, 2012 ..............................................................................................71
1.6b. Discharges aged 12 and older, by type of service and selected characteristics at discharge: Number, 2012 ...............................................................................................72
1.7. Discharges aged 12 and older, by type of service and characteristics at admission: Percent distribution, 2012 ................................................................................73
1.8a. Discharges aged 12 and older, by type of service and selected characteristics at admission: Percent distribution, 2012 ............................................................................74
1.8b. Discharges aged 12 and older, by type of service and selected characteristics at discharge: Percent distribution, 2012 .............................................................................75
1.9. Discharges aged 12 and older completing treatment or transferring to further treatment, by type of service and characteristics at admission: Percent, 2012 ..................76
1.10a. Discharges aged 12 and older completing treatment or transferring to further treatment, by type of service and selected characteristics at admission: Percent, 2012 ......................................................................................................................77

vi
list of tAbles (continued)
1.10b. Discharges aged 12 and older completing treatment or transferring to further treatment, by type of service and selected characteristics at discharge: Percent, 2012 ......................................................................................................................78
Outpatient Treatment2.1. Outpatient treatment discharges aged 12 and older, by reason for discharge
and state or jurisdiction: Number and percent distribution, 2012 ......................................79
2.2. Outpatient treatment discharges aged 12 and older, by reason for discharge, treatment completion/transfer, median length of stay (LOS), and characteristics at admission: Number, percent distribution, and rate, 2012 ..............................................80
2.3. Outpatient treatment discharges aged 12 and older, by reason for discharge and selected characteristics at admission and discharge: Number, 2012 .................................81
2.4. Outpatient treatment discharges aged 12 and older, by treatment completion/transfer, median length of stay (LOS), and selected characteristics at admission and discharge: Number, percent distribution, and rate, 2012 ...........................................83
Intensive Outpatient Treatment3.1. Intensive outpatient treatment discharges aged 12 and older, by reason for
discharge and state or jurisdiction: Number and percent distribution, 2012 .....................85
3.2. Intensive outpatient treatment discharges aged 12 and older, by reason for discharge, treatment completion/transfer, median length of stay (LOS), and characteristics at admission: Number, percent distribution, and rate, 2012.......................86
3.3. Intensive outpatient treatment discharges aged 12 and older, by reason for discharge and selected characteristics at admission and discharge: Number, 2012 ...................................................................................................................................87
3.4. Intensive outpatient treatment discharges aged 12 and older, by treatment completion/transfer, median length of stay (LOS), and selected characteristics at admission and discharge: Number, percent distribution, and rate, 2012 ......................89
Short-Term Residential Treatment4.1. Short-term residential treatment discharges aged 12 and older, by reason for
discharge and state or jurisdiction: Number and percent distribution, 2012 .....................91
4.2. Short-term residential treatment discharges aged 12 and older, by reason for discharge, treatment completion/transfer, median length of stay (LOS), and characteristics at admission: Number, percent distribution, and rate, 2012.......................92

vii
list of tAbles (continued)
4.3. Short-term residential treatment discharges aged 12 and older, by reason for discharge and selected characteristics at admission and discharge: Number, 2012 ...................................................................................................................................93
4.4. Short-term residential treatment discharges aged 12 and older, by treatment completion/transfer, median length of stay (LOS), and selected characteristics at admission and discharge: Number, percent distribution, and rate, 2012 ......................95
Long-Term Residential Treatment5.1. Long-term residential treatment discharges aged 12 and older, by reason for
discharge and state or jurisdiction: Number and percent distribution, 2012 .....................97
5.2. Long-term residential treatment discharges aged 12 and older, by reason for discharge, treatment completion/transfer, median length of stay (LOS), and characteristics at admission: Number, percent distribution, and rate, 2012.......................98
5.3. Long-term residential treatment discharges aged 12 and older, by reason for discharge and selected characteristics at admission and discharge: Number, 2012 ...................................................................................................................................99
5.4. Long-term residential treatment discharges aged 12 and older, by treatment completion/transfer, median length of stay (LOS), and selected characteristics at admission and discharge: Number, percent distribution, and rate, 2012 ....................101
Hospital Residential Treatment6.1. Hospital residential treatment discharges aged 12 and older, by reason for
discharge and state or jurisdiction: Number and percent distribution, 2012 ...................103
6.2. Hospital residential treatment discharges aged 12 and older, by reason for discharge, treatment completion/transfer, median length of stay (LOS), and characteristics at admission: Number, percent distribution, and rate, 2012.....................104
6.3. Hospital residential treatment discharges aged 12 and older, by reason for discharge and selected characteristics at admission and discharge: Number, 2012 .................................................................................................................................105
6.4. Hospital residential treatment discharges aged 12 and older, by treatment completion/transfer, median length of stay (LOS), and selected characteristics at admission and discharge: Number, percent distribution, and rate, 2012 ....................107
viii
list of tAbles (continued)
Detoxification7.1. Detoxification discharges aged 12 and older, by reason for discharge and
state or jurisdiction: Number and percent distribution, 2012 ..........................................109
7.2. Detoxification discharges aged 12 and older, by reason for discharge, treatment completion/transfer, median length of stay (LOS), and characteristics at admission: Number, percent distribution, and rate, 2012 ................................................110
7.3. Detoxification discharges aged 12 and older, by reason for discharge and selected characteristics at admission and discharge: Number, 2012 ...............................111
7.4. Detoxification discharges aged 12 and older, by treatment completion/transfer, median length of stay (LOS), and selected characteristics at admission and discharge: Number, percent distribution, and rate, 2012 ................................................113
Outpatient Medication-Assisted Opioid Therapy8.1. Outpatient medication-assisted opioid therapy discharges aged 12 and older, by
reason for discharge and state or jurisdiction: Number and percent distribution, 2012..................................................................................................................................115
8.2. Outpatient medication-assisted opioid therapy discharges aged 12 and older, by reason for discharge, treatment completion/transfer, median length of stay (LOS), and characteristics at admission: Number, percent distribution, and rate, 2012..................................................................................................................................116
8.3. Outpatient medication-assisted opioid therapy discharges aged 12 and older, by reason for discharge and selected characteristics at admission and discharge: Number, 2012 ..................................................................................................................117
8.4. Outpatient medication-assisted opioid therapy discharges aged 12 and older, by treatment completion/transfer, median length of stay (LOS), and selected characteristics at admission and discharge: Number, percent distribution, and rate, 2012 .........................................................................................................................119
Medication-Assisted Opioid Detoxification9.1. Medication-assisted opioid detoxification discharges aged 12 and older, by
reason for discharge and state or jurisdiction: Number and percent distribution, 2012 ..121
9.2. Medication-assisted opioid detoxification discharges aged 12 and older, by reason for discharge, treatment completion/transfer, median length of stay (LOS), and characteristics at admission: Number, percent distribution, and rate, 2012..122
ix
list of tAbles (continued)
9.3. Medication-assisted opioid detoxification discharges aged 12 and older, by reason for discharge and selected characteristics at admission and discharge: Number, 2012 ..................................................................................................................123
9.4. Medication-assisted opioid detoxification discharges aged 12 and older, by treatment completion/transfer, median length of stay (LOS), and selected characteristics at admission and discharge: Number, percent distribution, and rate, 2012 ..................................................................................................................125
Appendix A. About the Treatment Episode Data Set (TEDS)Appendix Table 1. State data system reporting characteristics: 2012 ....................................132Appendix Table 2. Item percentage response rate: Linked Data Set, 2012 ...........................136

x
list of figuRes
Discharge Data Description and Data Overview for All Types of Service 1.1. Type of service at discharge: 2012 .......................................................................................6
1.2. Reason for discharge: 2012 ..................................................................................................7
1.3. Reason for discharge, by type of service: 2012 ...................................................................8
1.4. Median length of stay (LOS), by reason for discharge and type of service: 2012...............9
Outpatient Treatment2.1. Reason for discharge from outpatient treatment: 2012 ......................................................13
2.2. Median length of stay (LOS) in outpatient treatment, by reason for discharge: 2012....................................................................................................................................14
Intensive Outpatient Treatment3.1. Reason for discharge from intensive outpatient treatment: 2012 ......................................19
3.2. Median length of stay (LOS) in intensive outpatient treatment, by reason for discharge: 2012 ..................................................................................................................20
Short-Term Residential Treatment4.1. Reason for discharge from short-term residential treatment: 2012....................................25
4.2. Median length of stay (LOS) in short-term residential treatment, by reason for discharge: 2012 ..................................................................................................................26
Long-Term Residential Treatment5.1. Reason for discharge from long-term residential treatment: 2012 ....................................31
5.2. Median length of stay (LOS) in long-term residential treatment, by reason for discharge: 2012 ..................................................................................................................32
Hospital Residential Treatment6.1. Reason for discharge from hospital residential treatment: 2012........................................37
6.2. Median length of stay (LOS) in hospital residential treatment, by reason for discharge: 2012 ..................................................................................................................38
Detoxification7.1. Reason for discharge from detoxification: 2012 ................................................................43
7.2. Median length of stay (LOS) in detoxification, by reason for discharge: 2012 .................44

xi
list of figuRes (continued)
Outpatient Medication-Assisted Opioid Therapy8.1. Reason for discharge from outpatient medication-assisted opioid therapy: 2012 .............49
8.2. Median length of stay (LOS) in outpatient medication-assisted opioid therapy, by reason for discharge: 2012 ............................................................................................50
Medication-Assisted Opioid Detoxification9.1. Reason for discharge from medication-assisted opioid detoxification: 2012 ....................55
9.2. Median length of stay (LOS) in medication-assisted opioid detoxification, by reason for discharge: 2012 .................................................................................................56

xii
1
HigHligHts
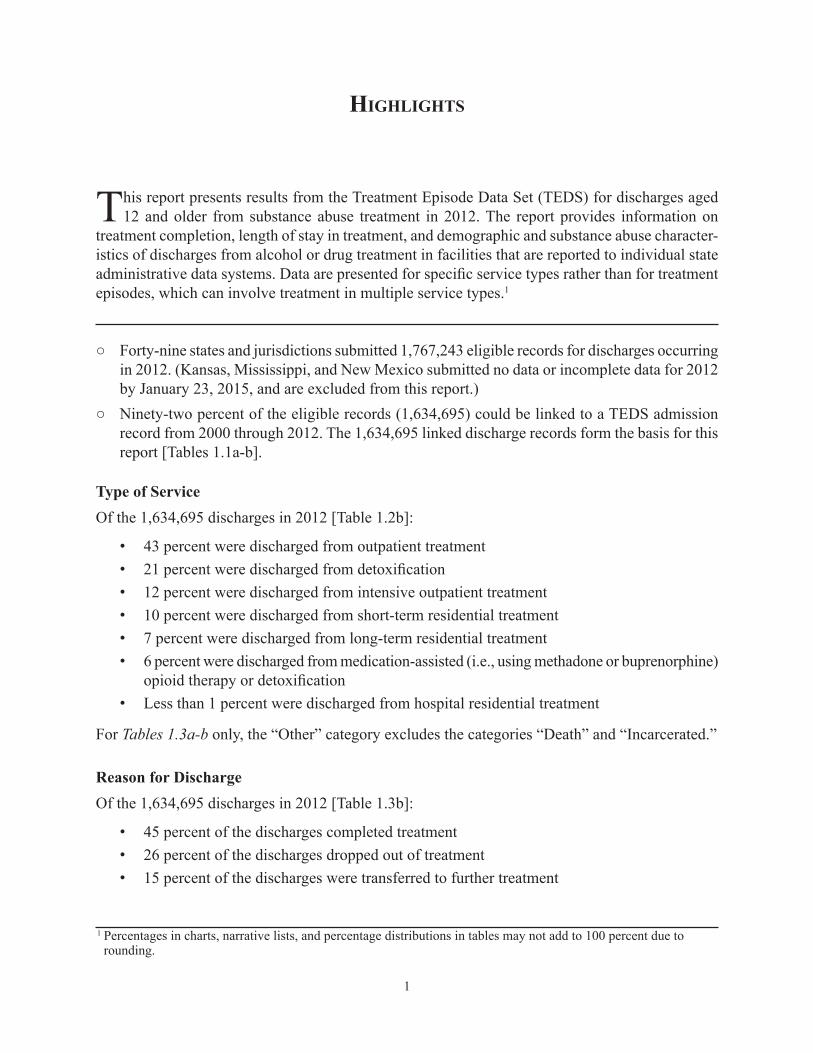
This report presents results from the Treatment Episode Data Set (TEDS) for discharges aged 12 and older from substance abuse treatment in 2012. The report provides information on
treatment completion, length of stay in treatment, and demographic and substance abuse character-istics of discharges from alcohol or drug treatment in facilities that are reported to individual state administrative data systems. Data are presented for specific service types rather than for treatment episodes, which can involve treatment in multiple service types.1
○ Forty-nine states and jurisdictions submitted 1,767,243 eligible records for discharges occurring in 2012. (Kansas, Mississippi, and New Mexico submitted no data or incomplete data for 2012 by January 23, 2015, and are excluded from this report.)
○ Ninety-two percent of the eligible records (1,634,695) could be linked to a TEDS admission record from 2000 through 2012. The 1,634,695 linked discharge records form the basis for this report [Tables 1.1a-b].
Type of Service Of the 1,634,695 discharges in 2012 [Table 1.2b]:
• 43 percent were discharged from outpatient treatment • 21 percent were discharged from detoxification • 12 percent were discharged from intensive outpatient treatment • 10 percent were discharged from short-term residential treatment • 7 percent were discharged from long-term residential treatment • 6 percent were discharged from medication-assisted (i.e., using methadone or buprenorphine)
opioid therapy or detoxification • Less than 1 percent were discharged from hospital residential treatment
For Tables 1.3a-b only, the “Other” category excludes the categories “Death” and “Incarcerated.”
Reason for DischargeOf the 1,634,695 discharges in 2012 [Table 1.3b]:
• 45 percent of the discharges completed treatment • 26 percent of the discharges dropped out of treatment • 15 percent of the discharges were transferred to further treatment
1 Percentages in charts, narrative lists, and percentage distributions in tables may not add to 100 percent due to rounding.

2
• 7 percent of the discharges had treatment terminated by the facility• 2 percent of the discharges were incarcerated• Less than 1 percent of the discharges failed to complete treatment because they died • 5 percent of the discharges failed to complete treatment for other reasons
Treatment Completion by Service TypeThe treatment completion rate was 45 percent for discharges from all service types combined. For the individual service types, treatment was completed by [Table 1.4]:
• 69 percent of discharges from detoxification • 55 percent of discharges from short-term residential treatment • 54 percent of discharges from hospital residential treatment• 47 percent of discharges from medication-assisted opioid detoxification• 45 percent of discharges from long-term residential treatment• 37 percent of discharges from outpatient treatment• 33 percent of discharges from intensive outpatient treatment• 12 percent of discharges from outpatient medication-assisted opioid therapy
Median Length of Stay (LOS)The median LOS in treatment by type of service was [Table 1.4]:
• 153 days for discharges from outpatient medication-assisted opioid therapy• 90 days for discharges from outpatient treatment• 56 days for discharges from long-term residential treatment• 56 days for discharges from intensive outpatient treatment• 21 days for discharges from short-term residential treatment • 7 days for discharges from hospital residential treatment • 7 days for discharges from medication-assisted opioid detoxification • 4 days for discharges from detoxification
The median LOS by type of service, limited to only those who completed treatment, was [Table 1.4]:
• 201 days for discharges completing outpatient medication-assisted opioid therapy• 129 days for discharges completing outpatient treatment• 90 days for discharges completing long-term residential treatment• 84 days for discharges completing intensive outpatient treatment • 27 days for discharges completing short-term residential treatment • 14 days for discharges completing hospital residential treatment • 6 days for discharges completing medication-assisted opioid detoxification • 4 days for discharges completing detoxification
3
Chapter 1
DisCharge Data DesCription anD Data overview for all types of serviCe: 2012
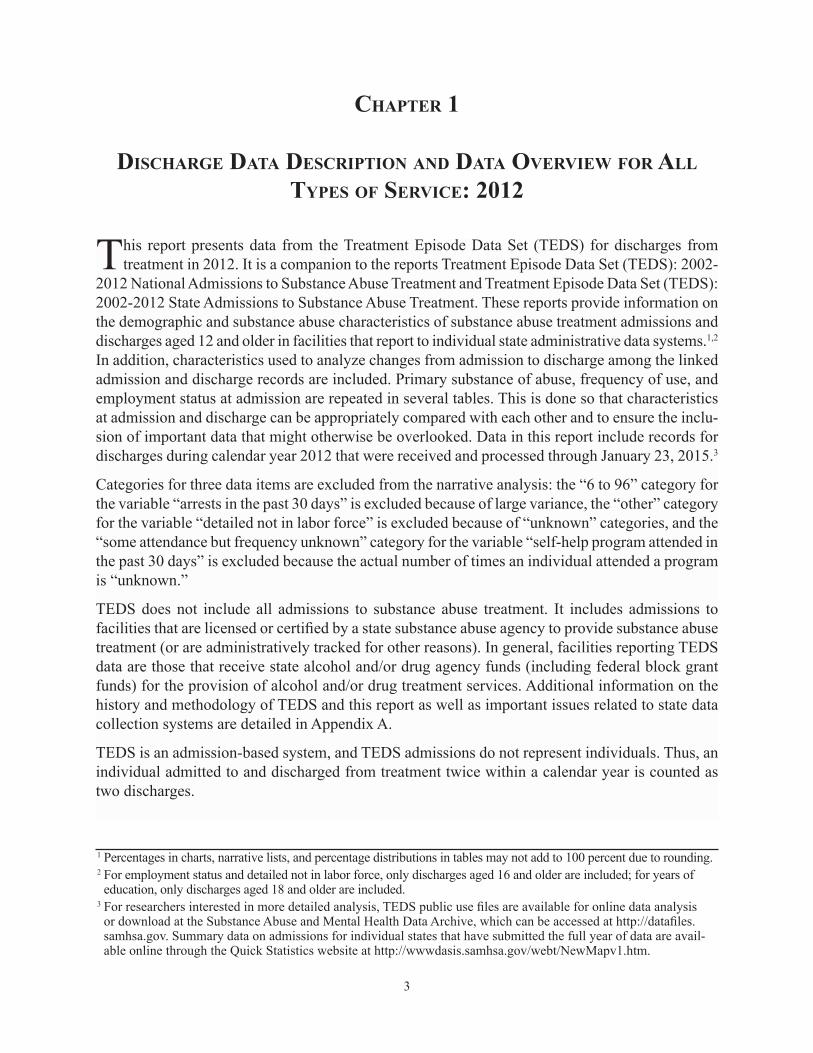
2012 National This report presents data from the Treatment Episode Data Set (TEDS) for discharges from
treatment in 2012. It is a companion to the reports Treatment Episode Data Set (TEDS): 2002-Admissions to Substance Abuse Treatment and Treatment Episode Data Set (TEDS):
2002-2012 State Admissions to Substance Abuse Treatment. These reports provide information on the demographic and substance abuse characteristics of substance abuse treatment admissions and discharges aged 12 and older in facilities that report to individual state administrative data systems.1,2 In addition, characteristics used to analyze changes from admission to discharge among the linked admission and discharge records are included. Primary substance of abuse, frequency of use, and employment status at admission are repeated in several tables. This is done so that characteristics at admission and discharge can be appropriately compared with each other and to ensure the inclu-sion of important data that might otherwise be overlooked. Data in this report include records for discharges during calendar year 2012 that were received and processed through January 23, 2015.3
Categories for three data items are excluded from the narrative analysis: the “6 to 96” category for the variable “arrests in the past 30 days” is excluded because of large variance, the “other” category for the variable “detailed not in labor force” is excluded because of “unknown” categories, and the “some attendance but frequency unknown” category for the variable “self-help program attended in the past 30 days” is excluded because the actual number of times an individual attended a program is “unknown.”
TEDS does not include all admissions to substance abuse treatment. It includes admissions to facilities that are licensed or certified by a state substance abuse agency to provide substance abuse treatment (or are administratively tracked for other reasons). In general, facilities reporting TEDS data are those that receive state alcohol and/or drug agency funds (including federal block grant funds) for the provision of alcohol and/or drug treatment services. Additional information on the history and methodology of TEDS and this report as well as important issues related to state data collection systems are detailed in Appendix A.
TEDS is an admission-based system, and TEDS admissions do not represent individuals. Thus, an individual admitted to and discharged from treatment twice within a calendar year is counted as two discharges.
1 Percentages in charts, narrative lists, and percentage distributions in tables may not add to 100 percent due to rounding.2 For employment status and detailed not in labor force, only discharges aged 16 and older are included; for years of education, only discharges aged 18 and older are included.
3 For researchers interested in more detailed analysis, TEDS public use files are available for online data analysis or download at the Substance Abuse and Mental Health Data Archive, which can be accessed at http://datafiles.samhsa.gov. Summary data on admissions for individual states that have submitted the full year of data are avail-able online through the Quick Statistics website at http://wwwdasis.samhsa.gov/webt/NewMapv1.htm.
4
Data in this report are presented for specific service types rather than for treatment episodes, which can involve treatment in multiple service types. States are asked to submit a record for each initial admission to a treatment service, for each transfer from one service to another, and for a discharge corresponding to each admission or transfer. The linked pairs of admission/transfer and discharge records enable analyses of treatment completion and length of stay (LOS) in treatment in specific service types.
This chapter describes the discharge data and provides an overview of the linked admission/discharge records for discharges in 2012. Some tables in this report present data by state or jurisdiction. It is important to note that comparisons between and across states and jurisdictions should be made with caution. There are many factors (e.g., facilities included, clients included, ability to track multi-service episodes, services offered, and completeness and timeliness of reporting) that can affect comparability. See Appendix A for a full discussion.
Data Definitions
Type of ServiceData are presented for each of the eight different types of services (listed below). The following types of services exclude records where medication-assisted (with methadone or buprenorphine) opioid therapy or detoxification was planned as part of treatment:
○ Outpatient treatment (less than 24-hours per day case)—Includes individual, family, and/or group services and may include pharmacological therapies other than methadone or buprenorphine
○ Intensive outpatient treatment (less than 24-hours per day case)—A minimum of 2 or more hours per day for 3 or more days per week
○ Short-term residential treatment—Typically, 30 days or fewer of non-acute care in a setting with treatment services for substance abuse and dependency
○ Long-term residential treatment—Typically, more than 30 days of non-acute care in a setting with treatment services for substance abuse and dependence; may include transitional living arrangements such as halfway houses
○ Hospital residential treatment—24-hour per day medical care in a hospital facility in con-junction with treatment services for substance abuse and dependence; excludes detoxification
○ Detoxification—Includes free-standing residential detoxification (81 percent of detoxification discharges), hospital detoxification (16 percent), and outpatient detoxification (3 percent)• Free-standing residential detoxification—24-hour per day services in a non-hospital setting
providing for safe withdrawal and transition to ongoing treatment• Hospital detoxification—24-hour per day acute medical care services in a hospital setting
for persons with severe medical complications associated with withdrawal• Outpatient detoxification—Treatment services providing for safe withdrawal in an outpa-
tient settingThe following include only medication-assisted opioid therapy or detoxification records:
5
○ Outpatient medication-assisted opioid therapy—Outpatient or intensive outpatient treatment services (94 percent and 6 percent of outpatient medication-assisted opioid therapy discharges, respectively) where medication-assisted therapy with methadone or buprenorphine was planned
○ Medication-assisted opioid detoxification—Outpatient detoxification, free-standing residential detoxification, and hospital detoxification (46 percent, 43 percent, and 11 percent of medication-assisted opioid detoxification discharges, respectively) where medication-assisted therapy with methadone or buprenorphine was planned
Medication-assisted opioid therapy discharges from short- and long-term residential treatment and hospital residential treatment represented less than 1 percent of all records. They are excluded from this report.
Reason for DischargeThe reasons for discharge from substance abuse treatment tabulated in this report include:
○ Completed treatment—Client completed all parts of the treatment plan or program○ Transferred to another substance abuse program or facility—Client was transferred to
another substance abuse treatment service type, program, provider, or facility; except when it is known that the client did not report to the next program
○ Dropped out—Client chose not to complete the treatment program, with or without specific advice to continue treatment; includes clients who dropped out for unknown reasons and clients who had not received treatment for some time and received administrative discharges
○ Terminated by facility—Treatment was terminated by the action of the facility, generally because of client non-compliance or violation of rules, laws, or procedures; excludes client drop-out, incarceration, or client-motivated reason for discontinuance
○ Incarcerated—Treatment was terminated because the client was incarcerated (jail, prison, house confinement)
○ Death—Treatment was terminated because the client died○ Other—Client left treatment for other specified reasons (e.g., client moved, became ill, was
hospitalized, or other reason somewhat out of client’s control)Because both treatment completion and transfer to further treatment represent positive conclusions to a treatment episode or component of a treatment episode, their rates are combined in some of the analyses.
Length of Stay (LOS) in TreatmentThe length of stay (LOS) in days was calculated for each record by subtracting the date of admis-sion from the date of last contact. For all outpatient service types, one day was added so that both the day of admission and the day of last contact were counted as days on which services were delivered. For hospital and residential service types, this was not done, and records where the date of admission and the date of last contact were the same (LOS = 0 days) were excluded from the analysis. The measure of LOS used in this report is the median—the number of days at which half of all discharges had taken place.
6
Linking discharge records from 2012 to admission records from 2000 to 2012 means that the maxi-mum LOS in treatment included in this report is 13 years. However, outpatient medication assisted opioid therapy can have a much longer duration. Indeed, some admissions may receive this form of treatment indefinitely. Because this report includes data only on discharges, it will underestimate LOS in treatment for those receiving outpatient medication-assisted opioid therapy. Similarly, the number and proportion of treatment completers will reflect only those who have been discharged because treatment is complete and not those who successfully remain in long-term outpatient medication-assisted opioid therapy. In addition, the characteristics at admission of those admitted to and discharged from outpatient medication-assisted opioid therapy within 13 years may differ from those of admissions who remain in outpatient medication-assisted opioid therapy for longer than 13 years.
Data OverviewForty-nine states and jurisdictions submitted 1,767,243 eligible records for clients discharged in 2012. (Kansas, Mississippi, and New Mexico submitted no data or incomplete data for 2012 by January 23, 2015, and are excluded from this report.)
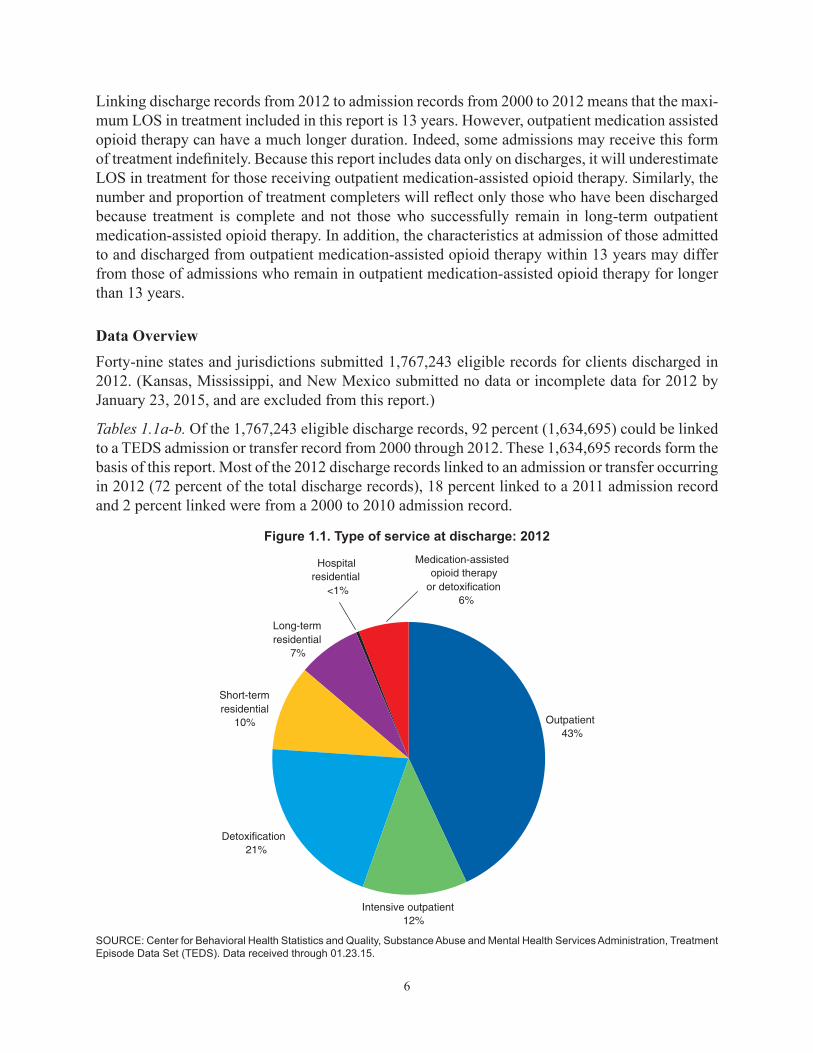
Tables 1.1a-b. Of the 1,767,243 eligible discharge records, 92 percent (1,634,695) could be linked to a TEDS admission or transfer record from 2000 through 2012. These 1,634,695 records form the basis of this report. Most of the 2012 discharge records linked to an admission or transfer occurring in 2012 (72 percent of the total discharge records), 18 percent linked to a 2011 admission record and 2 percent linked were from a 2000 to 2010 admission record.
Figure 1.1. Type of service at discharge: 2012
Outpatient43%
Intensive outpatient12%
Short-termresidential
10%
Long-termresidential
7%
Detoxification21%
Medication-assistedopioid therapy
or detoxification6%
Hospitalresidential
<1%
SOURCE: Center for Behavioral Health Statistics and Quality, Substance Abuse and Mental Health Services Administration, Treatment Episode Data Set (TEDS). Data received through 01.23.15.

7
Type of ServiceTables 1.2a-b. These tables present type of service at discharge by state for 2012 discharges. There was considerable state-to-state variability in the combination of service types available and in the proportions discharged from each of these service types.
Figure 1.1 illustrates the overall distribution of service type among all 2012 discharges: the majority were discharged from an outpatient service type—43 percent from outpatient treatment and 12 percent from intensive outpatient treatment—in addition, 21 percent were discharged from detoxification, 10 percent from short-term residential treatment, 7 percent from long-term residential treatment, 6 percent from medication-assisted opioid therapy or detoxification, and less than 1 percent from hospital residential treatment.
Reason for Discharge Tables 1.3a-b. These tables present reason for discharge by state or jurisdiction. However, the “Other” category does not include data for “Death” and “Incarcerated.”
Figure 1.2 illustrates the overall distribution of reason for discharge among 2012 discharges. Almost half (45 percent) of all discharges completed treatment. Another 15 percent were transferred to further substance abuse treatment. Twenty-six percent dropped out of treatment, 7 percent had their treatment terminated at the facility’s request, 2 percent were incarcerated during treatment, less than 1 percent died before being discharged, and 5 percent failed to complete treatment for other reasons.
Figure 1.2. Reason for discharge: 2012
Other5%
Terminated7%
Dropped out26%
Transferred 15%
Completed45%
Incarcerated2%
Death<1%
SOURCE: Center for Behavioral Health Statistics and Quality, Substance Abuse and Mental Health Services Administration, Treatment Episode Data Set (TEDS). Data received through 01.23.15.

8
Reason for Discharge by Type of ServiceTable 1.4 and Figure 1.3 present reason for discharge by type of service.
○ The treatment completion rate was highest among discharges from detoxification (69 percent). ○ The treatment completion rate for medication-assisted opioid treatment was 47 percent. ○ The completion rates for residential treatment (55 percent for short-term residential treatment, 54
percent for hospital residential treatment, and 45 percent for long-term residential treatment) were higher than those in the less structured outpatient settings (37 percent for outpatient treatment, 33 percent for intensive outpatient treatment, and 12 percent for outpatient medication-assisted opioid therapy treatment).
○ Transfer to further substance abuse treatment was most common among discharges from inten-sive outpatient treatment (23 percent), followed by medication-assisted opioid detoxification and outpatient medication-assisted opioid therapy (20 percent each), and short-term residential treatment (17 percent).
○ Treatment dropout was highest among discharges from outpatient medication-assisted opioid therapy (41 percent) and outpatient treatment (31 percent).
Figure 1.3. Reason for discharge, by type of service: 2012
All Detox Med-asstdetox
Long-termresidential
Outpatientonly
Intensiveoutpatient
Outpatientmed-asst
opioid therapy
Per
cent
0
25
50
75
100
Hospitalresidential
Treatment completed
Transferred to further substance abuse treatment
Dropped out
Terminated by facility
Other
Short-termresidential
SOURCE: Center for Behavioral Health Statistics and Quality, Substance Abuse and Mental Health Services Administration, Treatment Episode Data Set (TEDS). Data received through 01.23.15.

9
Median Length of Stay (LOS) by Type of Service and Reason for DischargeTable 1.4.
○ The median LOS was longest for all discharges from outpatient medication-assisted opioid therapy (153 days), followed by outpatient treatment (90 days) and long-term residential treat-ment and intensive outpatient treatment (both 56 days).
○ The median LOS for all discharges from short-term residential treatment was 21 days; from hospital residential treatment and medication-assisted opioid detoxification, 7 days each; and from detoxification, 4 days.
Figure 1.4.
○ The median LOS for discharges who completed treatment was longer than or equal to those who transferred to further treatment or who did not complete treatment in all service types except medication-assisted opioid detoxification.
○ Among discharges completing treatment, the median LOS was longest for outpatient medication-assisted opioid therapy (201 days), followed by outpatient treatment (129 days), long-term residential treatment (90 days), intensive outpatient treatment (84 days), short-term residential treatment (27 days), hospital residential treatment (14 days), medication-assisted opioid detoxi-fication (6 days), and detoxification (4 days).
Figure 1.4. Median length of stay (LOS), by reason for discharge and type of service: 2012
SOURCE: Center for Behavioral Health Statistics and Quality, Substance Abuse and Mental Health Services Administration, Treatment Episode Data Set (TEDS). Data received through 01.23.15.
Med
ian
LOS
(da
ys)
0
30
60
90
120
150
180
210
240
Outpatientmed-asst
opioid therapy
Outpatient Long-termresidential
Intensiveoutpatient
Short-termresidential
Hospitalresidential
Med-asstopioiddetox
Detox
Treatment completed Transferred to further treatment Treatment not completed(dropped out, terminated, other)
10
Socio-Demographic and Substance Use Related Characteristics at Time of AdmissionTables 1.5 and 1.7 summarize the number and percent distribution of characteristics at admission, by service type for all discharges. Summary findings of the admission characteristics of all discharges combined include:
○ 66 percent of all discharges were male ○ 31 percent of all discharges were 21 to 30 years of age at the time of admission and 22 and 21
percent, respectively, were 31 to 40 years of age or 41 to 50 years of age, while 13 percent each were 12 to 20 or over age 50
○ 61 percent of all discharges were non-Hispanic White ○ 60 percent of all discharges had been in treatment at least once prior to the current episode ○ 36 percent of all discharges were self- or individual referrals and 33 percent were referred to
treatment through a criminal justice/DUI source ○ 71 percent of all discharges, aged 18 and older reported completing 12 or more years of education
Comparison of Selected Characteristics at Admission and Discharge Tables 1.6a-b and 1.8a-b summarize the number and percent distribution of selected characteristics at admission and at discharge, by service type for all discharges. Summary findings for all discharges combined include:
○ Of all discharges aged 16 and older, 40 percent were unemployed and 38 percent were not in the labor force at admission, while 40 percent were unemployed and 34 percent were not in the labor force at discharge
○ At admission, among all those not in the labor force, 54 percent reported being in a category “other than homemaker, student, retired, disabled, or institutional inmate” and 23 percent reported being “disabled”; among all those not in the labor force at discharge, 48 percent reported being in a category “other than homemaker, student, retired, disabled, or institutional inmate” and 25 percent reported being “disabled”
○ At admission, 65 percent of all discharges reported living independently, and 67 percent reported living independently at discharge
○ At admission, 92 percent of all discharges had not been arrested in the past 30, and 95 percent had not been arrested in the past 30 days at discharge
○ At admission, 40 percent reported daily use of the primary substance in the month before treat-ment entry and 29 percent reported no use in the past month; at discharge, 20 percent reported daily use and 55 percent reported no use in the past month
○ At admission, 19 percent of all discharges reported attending at least one self-help program in the 30 days, and 26 percent of all discharges reported attending at least one such program in the 30 days before discharge
Characteristics at Admission by Type of ServiceTable 1.7. Although the characteristics at admission of discharges varied by service type, some general observations can be made.
11
○ Discharges from outpatient and intensive outpatient treatment, compared with discharges from other service types, were generally younger, reported one or more previous treatment episodes less frequently, and reported being employed more frequently. In regards to primary substance, these discharges reported marijuana more frequently and opiates less frequently. These discharges were more frequently referred to treatment by a criminal justice/DUI source and also reported using the primary substance less than daily in the month before treatment entry.
○ Discharges from detoxification, outpatient medication-assisted opioid therapy, and medication-assisted opioid detoxification, compared with discharges from other service types, were generally older and reported being of Hispanic origin more frequently. These discharges reported being self- or individual referrals to treatment more frequently, but reported being referred by a criminal justice/DUI source less frequently. These discharges reported opiates as the primary substance more frequently (a high proportion of discharges from detoxification also reported alcohol). These discharges reported daily use of the primary substance in the month before treatment entry as well as one or more prior treatment episode more frequently than other discharges.
○ Discharges from short-term and long-term residential treatment, compared with discharges from other service types, reported cocaine as the primary substance and being unemployed or not in the labor force more frequently. These discharges generally reported having one or more prior treatment episodes and being referred to treatment through a health care or community provider more frequently.
○ Discharges from hospital residential treatment, compared with discharges from other service types, were generally older, non-Hispanic White with more than 12 years of education. These discharges also more frequently reported alcohol as the primary substance.
Treatment Completion or Transfer to Further Treatment
Completion/Transfer RatesIn this section, “completion/transfer rate” refers to the number of treatment completions or transfers per 100 discharges. To illustrate, the overall rate is calculated as the sum of all treatment completions and transfers divided by all discharges (which includes those who dropped out, were terminated by facility, or did not complete treatment for other reasons) and the resulting number (fraction) is multiplied by 100. Of all treatment discharges aged 12 and older in 2012, the overall percentage that completed treatment or transferred to further treatment (i.e., completion/transfer rate) was 60 percent.
Table 1.9 and Table 1.3b present the percentage of all discharges either completing treatment or transferring to further treatment by service type and characteristics at admission. For all service types combined, the treatment completion/transfer rate was 60 percent (45 percent completed treat-ment, 15 percent transferred).
Completion/transfer rates showed some variation both by admission characteristics and by service type. The largest variation in treatment completion/transfer rates by admission characteristic for all discharges for all service types was for primary substance, ranging from 52 percent for marijuana to 67 percent for alcohol. For service type, the rates ranged from 32 percent among discharges from outpatient medication-assisted opioid therapy to 79 percent among discharges from detoxification.
12
Some general observations can be made about the completion/transfer rate for all discharges com-bined:
○ The treatment completion/transfer rate increased with education ○ For known primary substance of abuse, the treatment completion/transfer rates were highest for
alcohol (67 percent), followed by stimulants and cocaine (62 percent and 56 percent, respectively) ○ The treatment completion/transfer rate was higher among those who were employed than among
those who were unemployed or not in the labor force ○ The treatment completion/transfer rate was lower among non-Hispanic Blacks and those of
Hispanic origin (56 percent and 58 percent, respectively) than among non-Hispanic Whites (61 percent)

13
CHapter 2
outpatient treatment DisCHarges ageD 12 anD olDer: 2012
Chapter 2 presents data on the reason for discharge, median length of stay (LOS) in treatment, and socio-demographic and substance use characteristics of the 703,290 outpatient treatment
discharges aged 12 and older in 2012.1,2 Each of the 49 reporting states and jurisdictions, reported discharges from outpatient treatment [Table 2.1]. Outpatient treatment in this chapter excludes intensive outpatient treatment (covered in Chapter 3), outpatient detoxification (covered in Chapter 7), and outpatient medication-assisted opioid therapy (covered in Chapter 8).
Reason for DischargeTable 2.1 and Figure 2.1. For the 703,290 discharges from outpatient treatment, the reasons for discharge were:
○ Completed treatment: 37 percent (262,270) ○ Transferred to further treatment: 14 percent (96,182) ○ Dropped out of treatment: 31 percent (216,925) ○ Treatment terminated by the facility: 8 percent (58,636) ○ Failed to complete treatment for other reasons: 10 percent (69,277)
Completed37%
Transferred14%
Dropped out31%
Terminated8%
Other10%
Figure 2.1. Reason for discharge from outpatient treatment: 2012
SOURCE: Center for Behavioral Health Statistics and Quality, Substance Abuse and Mental Health Services Administration, Treatment Episode Data Set (TEDS). Data received through 01.23.15.1 Percentages in charts, narrative lists, and percentage distributions in tables may not add to 100 percent due to rounding.2 For employment status and detailed not in labor force, only discharges aged 16 and older are included; for years of education, only discharges aged 18 and older are included.

14
Median Length of Stay (LOS)Table 1.4 and Figure 2.2. The median length of stay (LOS) for outpatient treatment discharges aged 12 and older in 2012 was 90 days. By reason for discharge, the median LOS for outpatient treatment discharges was:
○ Completed treatment: 129 days ○ Transferred to further treatment: 42 days ○ Dropped out of treatment: 61 days ○ Treatment terminated by the facility: 79 days ○ Failed to complete treatment for other reasons: 79 days
Figure 2.2. Median length of stay (LOS) in outpatient treatment, by reason for discharge: 2012
SOURCE: Center for Behavioral Health Statistics and Quality, Substance Abuse and Mental Health Services Administration, Treatment Episode Data Set (TEDS). Data received through 01.23.15.
Socio-Demographic and Substance Use Characteristics at Time of Admission Table 1.7. Summary findings of characteristics at time of admission of outpatient treatment discharges aged 12 and older include:
○ Gender: 66 percent of outpatient discharges were male○ Age at admission: 18 percent of outpatient discharges were 12 to 20 years of age, 32 percent
were 21 to 30 years of age, 22 percent were 31 to 40 years of age, 18 percent were 41 to 50 years of age, and 11 percent were over 50 years of age
○ Race/ethnicity: 60 percent of outpatient discharges were non-Hispanic White, 20 percent were non-Hispanic Black, 14 percent were Hispanic, and 6 percent were a race/ethnicity other than non-Hispanic White, non-Hispanic Black, or Hispanic
Reason for discharge
All Completed Transferred Dropped out Terminated Other
Med
ian
LOS
(da
ys)
0
25
50
75
100
125
150
15
○ Primary substance: Alcohol was the most commonly reported primary substance of abuse at time of admission among outpatient discharges (40 percent), followed by marijuana (27 percent), opiates (14 percent), stimulants (8 percent), cocaine (7 percent), and other or unknown substances (3 percent)
○ Frequency of use: 43 percent of outpatient discharges reported no substance use in the month before treatment entry
○ Number of prior treatment episodes: Half (50 percent) of outpatient discharges had one or more prior treatment episodes
○ Treatment referral source: 49 percent of outpatient discharges were referred to treatment by criminal justice/DUI sources, 28 percent were health care or community referrals, and 23 percent were self- or individual referrals
○ Employment status: Of all discharges aged 16 and older, 39 percent were unemployed and 30 percent were not in the labor force at time of admission
○ Years of education: 44 percent of outpatient discharges aged 18 and older had 12 years of education or a GED
Comparison of Outpatient Discharges to All Discharges on Characteristics at AdmissionTables 1.7 and 1.8a. There were some notable differences in the characteristics at admission of discharges from outpatient treatment compared to the characteristics at admission of all discharges combined.
○ Number of prior treatment episodes: 50 percent of outpatient discharges vs. 40 percent of all discharges had no prior treatment episodes
○ Treatment referral source: • 49 percent of outpatient discharges were criminal justice/DUI referrals vs. 33 percent of
all discharges • 23 percent of outpatient discharges were self- or individual referrals vs. 36 percent of all
discharges ○ Detailed not in labor force: Among outpatient discharges aged 16 and older not in the labor
force at admission, 21 percent were students vs. 12 percent of all discharges ○ Employment status: 31 percent of outpatient discharges aged 16 and older were employed vs.
22 percent of all discharges ○ Primary substance:
• 27 percent of outpatient discharges reported marijuana as their primary substance of abuse vs. 17 percent of all discharges
• 14 percent of outpatient discharges reported opiates as their primary substance of abuse vs. 26 percent of all discharges
○ Frequency of use: • 19 percent of outpatient discharges reported daily substance use in the month before treat-
ment entry vs. 40 percent of all discharges

16
• 43 percent of outpatient discharges reported no substance use in the month before treatment entry vs. 29 percent of all discharges
○ Living arrangements: 5 percent of outpatient discharges were homeless vs. 14 percent of all discharges
Comparison of Selected Characteristics at Admission and at Discharge for Outpatient DischargesTables 1.8a-b. Certain socio-demographic and substance use characteristics were collected at both time of admission and time of discharge. Differences (changes) in status between admission and discharge for outpatient discharges include:
○ Arrests in past 30 days: 92 percent of outpatient discharges reported no arrests in past 30 days at admission vs. 95 percent at discharge
○ Detailed not in labor force: Among outpatient discharges aged 16 and older not in the labor force, 27 percent reported being disabled at admission and 21 percent were students at admis-sion; at discharge, 28 percent reported being disabled and 20 percent were students
○ Employment status: 31 percent of outpatient discharges aged 16 and older were employed at admission vs. 36 percent at discharge
○ Frequency of use: 43 percent of outpatient discharges reported no substance use in the month before treatment vs. 62 percent at discharge
○ Living arrangements: 73 percent of outpatient discharges reported living independently at admission vs. 75 percent at discharge
○ Self-help programs attended in past 30 days: 23 percent of outpatient discharges reported attending at least one self-help program in the past 30 days at admission vs. 27 percent at discharge
Treatment Completion or Transfer to Further Treatment
Completion/Transfer RatesIn this section, “completion/transfer rate” refers to the number of treatment completions or transfers per 100 discharges. To illustrate, the overall rate is calculated as the sum of all treatment completions and transfers divided by all discharges (which includes those who dropped out, were terminated by facility, or did not complete treatment for other reasons) and the resulting number (fraction) is multiplied by 100. Of outpatient treatment discharges aged 12 and older in 2012, the overall percentage that completed treatment or transferred to further treatment (i.e., completion/transfer rate) was 51 percent. Up to three top rates for each characteristic are presented below.
Completion/Transfer Rates for Characteristics at AdmissionTable 2.2. For outpatient discharges in 2012, the completion/transfer rates according to character-istics at admission include:
○ Gender: The completion/transfer rate was 51 percent for male discharges and 50 percent for female discharges
17
○ Age at admission: The completion/transfer rate was 55 percent for discharges over 50 years of age, 51 percent for discharges 31 to 50 years of age, and 50 percent for discharges 12 to 30 years of age
○ Race/ethnicity: The completion/transfer rate was 53 percent each for non-Hispanic White and “other” discharges, 50 percent for Hispanic discharges, and 45 percent for non-Hispanic Black discharges
○ Number of prior treatment episodes: The completion/transfer rate was 55 percent for discharges with no prior treatment episodes, and 48 percent for discharges with one or more prior treatment episodes
○ Treatment referral source: The completion/transfer rate was 59 percent for discharges with criminal justice/DUI referrals, 46 percent for discharges from health care or community refer-rals, 41 percent for discharges with self- or individual referrals
○ Years of education: The completion/transfer rate for ages 18 and older was 54 percent for discharges with more than 12 years of education; 52 percent for those with 12 years of educa-tion; and 47 percent for those with fewer than 12 years of education
Completion/Transfer Rates for Selected Characteristics at Discharge
Table 2.4. For outpatient discharges in 2012, the completion/transfer rates according to characteristics at discharge include:
○ Arrests in past 30 days: The completion/transfer rate was 56 percent for discharges with no arrests in the 30 days before discharge, 42 percent for discharges with 4 arrests in the 30 days before discharge, and 41 percent for those with 3 arrests in the 30 days before discharge
○ Detailed not in labor force: The completion/transfer rate for ages 16 and older was 64 percent for discharges who were retired, 54 percent for students, and 52 percent for homemakers
○ Employment status: The completion/transfer rate for ages 16 and older was 64 percent for discharges who were employed and 49 percent for those who were unemployed or not in the labor force
○ Frequency of use: The completion/transfer rate was 65 percent for discharges with no substance use in the 30 days before discharge and 42 percent each for those with daily or some substance use in the 30 days before discharge
○ Living arrangements: The completion/transfer rate was 61 percent for discharges with depend-ent living status, 53 percent with independent living status, and 46 percent for the discharges who were homeless
○ Self-help programs attended in past 30 days: The completion/transfer rate was 69 percent for discharges who attended self-help programs 8-15 times in the 30 days before discharge, 67 percent for those who attended self-help programs 16-30 times in the 30 days before discharge, and 62 percent for those who attended 4-7 times in the 30 days before discharge

18
Median Length of Stay (LOS) of Discharges Completing TreatmentTables 2.2 and 2.4. The overall median LOS among those completing outpatient treatment (exclud-ing those who were transferred to further treatment) was 129 days. Median LOS for characteristics at admission and at discharge for outpatient discharges that completed treatment include:
At admission:
From Table 2.2, ○ The median LOS was longest for discharges of Hispanic origin (148 days) ○ The median LOS was shortest for discharges aged 12 to 20 years (120 days)
From Table 2.4, ○ The median LOS was longest among discharges not in the labor force that reported being
disabled (148 days) ○ The median LOS was shortest among discharges not in the labor force that reported being
institutional inmates (84 days)
At discharge:
From Table 2.4, ○ The median LOS was longest among discharges not in the labor force that reported being
disabled (156 days) ○ The median LOS was shortest among discharges that reported daily use of the primary substance
in the past month (51 days)

19
CHapter 3
intensive outpatient treatment DisCHarges ageD 12 anD olDer: 2012
Chapter 3 presents data on the reason for discharge, median length of stay (LOS) in treatment, and socio-demographic and substance use characteristics of the 203,127 intensive outpatient
treatment discharges aged 12 and older in 2012.1,2 Of the 49 reporting states and jurisdictions, 46 states and 2 jurisdictions had discharges from intensive outpatient treatment [Table 3.1].
Reason for DischargeTable 3.1 and Figure 3.1. For the 203,127 discharges from intensive outpatient treatment, the reasons for discharge were:
○ Completed treatment: 33 percent (67,411) ○ Transferred to further treatment: 23 percent (45,708) ○ Dropped out of treatment: 26 percent (53,407) ○ Treatment terminated by the facility: 9 percent (18,372) ○ Failed to complete treatment for other reasons: 9 percent (18,229)
Figure 3.1. Reason for discharge from intensive outpatient treatment: 2012
Completed33%
Transferred23%
Dropped out26%
Terminated9%
Other9%
SOURCE: Center for Behavioral Health Statistics and Quality, Substance Abuse and Mental Health Services Administration, Treatment Episode Data Set (TEDS). Data received through 01.23.15.1 Percentages in charts, narrative lists, and percentage distributions in tables may not add to 100 percent due to rounding.2 For employment status and detailed not in labor force, only discharges aged 16 and older are included; for years of education, only discharges aged 18 and older are included.
20
Reason for discharge
All Completed Transferred Dropped out Terminated Other
Med
ian
LOS
(da
ys)
0
20
40
60
80
100
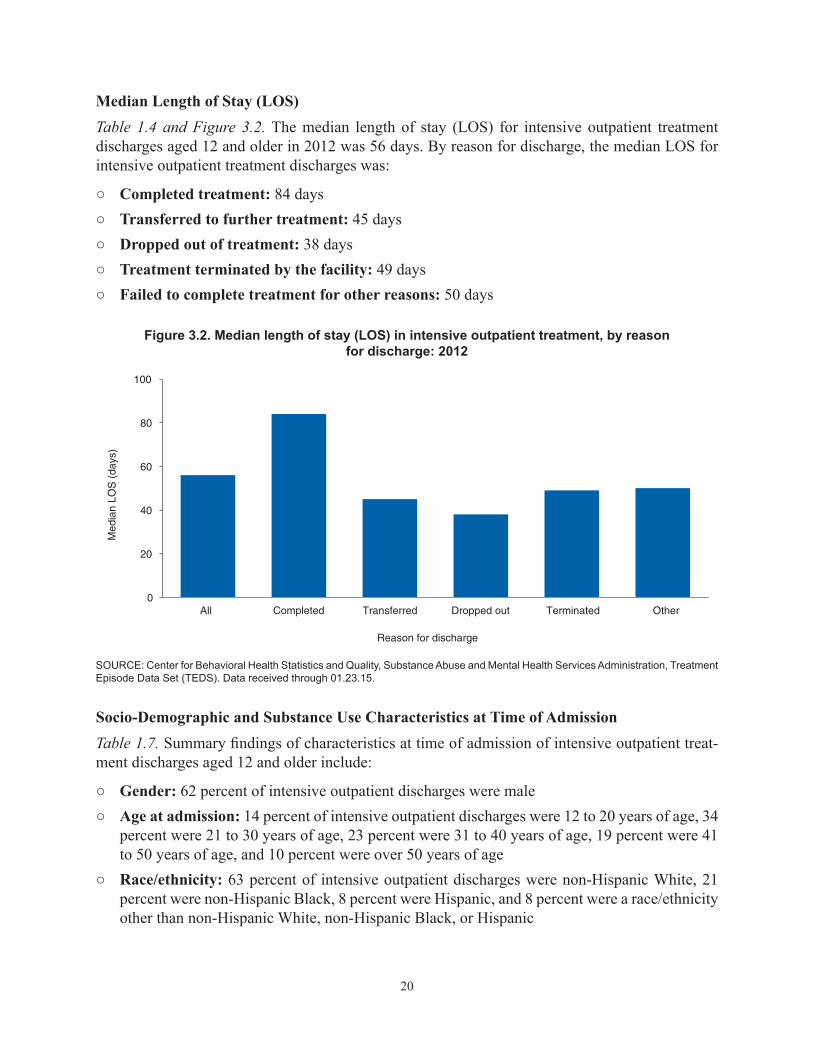
Median Length of Stay (LOS)Table 1.4 and Figure 3.2. The median length of stay (LOS) for intensive outpatient treatment discharges aged 12 and older in 2012 was 56 days. By reason for discharge, the median LOS for intensive outpatient treatment discharges was:
○ Completed treatment: 84 days ○ Transferred to further treatment: 45 days ○ Dropped out of treatment: 38 days ○ Treatment terminated by the facility: 49 days ○ Failed to complete treatment for other reasons: 50 days
Figure 3.2. Median length of stay (LOS) in intensive outpatient treatment, by reason for discharge: 2012
SOURCE: Center for Behavioral Health Statistics and Quality, Substance Abuse and Mental Health Services Administration, Treatment Episode Data Set (TEDS). Data received through 01.23.15.
Socio-Demographic and Substance Use Characteristics at Time of Admission Table 1.7. Summary findings of characteristics at time of admission of intensive outpatient treat-ment discharges aged 12 and older include:
○ Gender: 62 percent of intensive outpatient discharges were male○ Age at admission: 14 percent of intensive outpatient discharges were 12 to 20 years of age, 34
percent were 21 to 30 years of age, 23 percent were 31 to 40 years of age, 19 percent were 41 to 50 years of age, and 10 percent were over 50 years of age
○ Race/ethnicity: 63 percent of intensive outpatient discharges were non-Hispanic White, 21 percent were non-Hispanic Black, 8 percent were Hispanic, and 8 percent were a race/ethnicity other than non-Hispanic White, non-Hispanic Black, or Hispanic
21
○ Primary substance: Alcohol was the most commonly reported primary substance of abuse at time of admission among intensive outpatient discharges (37 percent), followed by marijuana (23 percent), opiates (19 percent), stimulants (10 percent), cocaine (8 percent), and other or unknown substances (3 percent)
○ Frequency of use: 39 percent of intensive outpatient discharges reported no substance use in the month before treatment entry
○ Number of prior treatment episodes: 63 percent of intensive outpatient discharges had one or more prior treatment episodes, and 37 percent had no prior treatment episodes
○ Treatment referral source: 44 percent of intensive outpatient discharges were referred to treat-ment from criminal justice/DUI referrals, 31 percent were health care or community referrals, and 25 percent were self- or individual referrals
○ Employment status: Of all discharges aged 16 and older, 44 percent were unemployed and 33 percent were not in the labor force at time of admission
○ Years of education: 43 percent of intensive outpatient discharges aged 18 and older had 12 years of education or a GED
Comparison of Intensive Outpatient Discharges to All Discharges on Characteristics at AdmissionTables 1.7 and 1.8a. There were some notable differences in the characteristics at admission of discharges from intensive outpatient treatment compared to the characteristics of all discharges combined.
○ Treatment referral source: • 44 percent of intensive outpatient discharges were criminal justice/DUI referrals vs. 33
percent of all discharges • 25 percent of intensive outpatient discharges were self- or individual referrals vs. 36 percent
of all discharges ○ Detailed not in labor force: Among intensive outpatient discharges aged 16 and older not in
the labor force at admission, 13 percent were institutional inmates vs. 6 percent of all discharges ○ Primary substance:
• 23 percent of intensive outpatient discharges reported marijuana as their primary substance of abuse vs. 17 percent of all discharges
• 19 percent of intensive outpatient discharges reported opiates as their primary substance of abuse vs. 26 percent of all discharges
○ Frequency of use: • 25 percent of intensive outpatient discharges reported daily substance use in the month
before treatment entry vs. 40 percent of all discharges • 39 percent of intensive outpatient discharges reported no substance use in the month before
treatment entry vs. 29 percent of all discharges

22
○ Living arrangements: 7 percent of intensive outpatient discharges were homeless vs. 14 percent of all discharges
Comparison of Selected Characteristics at Admission and at Discharge for Intensive Outpatient DischargesTables 1.8a-b. Certain socio-demographic and substance use characteristics were collected at both time of admission and time of discharge. Differences (changes) in status between admission and discharge for intensive outpatient discharges include:
○ Arrests in past 30 days: 91 percent of intensive outpatient discharges reported no arrests in past 30 days at admission vs. 94 percent at discharge
○ Detailed not in labor force: Among intensive outpatient discharges aged 16 and older not in the labor force, 25 percent reported being disabled at admission and 15 percent were students at admission; at discharge, 24 percent reported being disabled and 14 percent were students
○ Employment status: 22 percent of intensive outpatient discharges aged 16 and older were employed at admission vs. 27 percent at discharge
○ Frequency of use: 39 percent of intensive outpatient discharges reported no substance use in the month before treatment vs. 61 percent at discharge
○ Living arrangements: 67 percent of intensive outpatient discharges reported living indepen-dently at admission vs. 68 percent at discharge
○ Self-help programs attended in past 30 days: 31 percent of intensive outpatient discharges reported attending at least one self-help program in the past month at admission vs. 44 percent at discharge
Treatment Completion or Transfer to Further Treatment
Completion/Transfer RatesIn this section, “completion/transfer rate” refers to the number of treatment completions or transfers per 100 discharges. To illustrate, the overall rate is calculated as the sum of all treatment completions and transfers divided by all discharges (which includes those who dropped out, were terminated by facility, or did not complete treatment for other reasons) and the resulting number (fraction) is multiplied by 100. Of intensive outpatient treatment discharges aged 12 and older in 2012, the overall percentage that completed treatment or transferred to further treatment (i.e., completion/transfer rate) was 56 percent. Up to three top rates for each characteristic are presented below.
Completion/Transfer Rates for Characteristics at AdmissionTable 3.2. For intensive outpatient discharges in 2012, the completion/transfer rates according to characteristics at admission include:
○ Gender: The completion/transfer rate was 56 percent for male discharges and 54 percent for female discharges
23
○ Age at admission: The completion/transfer rate was 61 percent for discharges over 50 years of age, 57 percent for discharges 31 to 50 years of age, and 55 percent for discharges 21 to 30 years of age
○ Race/ethnicity: The completion/transfer rate was 58 percent for non-Hispanic White and “other” discharges, 53 percent for Hispanic discharges, and 49 percent for non-Hispanic Black discharges
○ Number of prior treatment episodes: The completion/transfer rate was 58 percent for discharges with no prior treatment episodes and 55 percent for discharges with one or more prior treatment episodes
○ Treatment referral source: The completion/transfer rate was 61 percent for discharges from criminal justice/DUI referrals, 53 percent for discharges from health care/community referrals, and 50 percent for discharges from self- or individual referrals
○ Years of education: The completion/transfer rate for ages 18 and older was 60 percent for discharges with more than 12 years of education, 57 percent for those with 12 years of educa-tion, and 51 percent for those with fewer than 12 years of education
Completion/Transfer Rates for Characteristics at Discharge
Table 3.4. For intensive outpatient discharges in 2012, the completion/transfer rates according to characteristics at discharge include:
Arrests in past 30 days: The completion/transfer rate was 60 percent for discharges with no arrests in the 30 days before discharge, 48 percent for discharges with 4 arrests in the 30 days before discharge, and 44 percent for those with 3 arrests in the 30 days before discharge
○ Detailed not in labor force: The completion/transfer rate for ages 16 and older was 69 percent for discharges who were retired, 64 percent for institutional inmates and homemakers, and 60 percent for students
○ Employment status: The completion/transfer rate for ages 16 and older was 67 percent for discharges who were employed and 55 percent for those who were unemployed
○ Frequency of use: The completion/transfer rate was 72 percent for discharges with no sub-stance use in the 30 days before discharge, 48 percent for those with daily substance use in the 30 days before discharge, and 47 percent for those with some substance use in the 30 days before discharge
○ Living arrangements: The completion/transfer rate was 62 percent for discharges with depend-ent living status, 58 percent with independent living status, and 47 percent for the discharges who were homeless
○ Self-help programs attended in past 30 days: The completion/transfer rate was 81 percent for discharges who attended self-help programs 16-30 times in the 30 days before discharge, 80 percent for those who attended self-help programs 8-15 times in the 30 days before discharge, and 74 percent for those who attended such programs 4-7 times in the 30 days before discharge
Median Length of Stay (LOS) of Discharges Completing TreatmentTables 3.2 and 3.4. The overall median LOS among those completing intensive outpatient treat-ment (excluding those who were transferred to further treatment) was 84 days. Median LOS for
24
characteristics at admission and at discharge for intensive outpatient discharges that completed treatment include:
At admission:
From Table 3.2, ○ The median LOS was longest for discharges from criminal justice/DUI referrals (93 days) ○ The median LOS was shortest for discharges from self- or individual referrals (68 days)
From Table 3.4, ○ The median LOS was longest among discharges that were arrested 5 times in past 30 days (107
days) ○ The median LOS was shortest among discharges that reported daily use of the primary substance
in the past month and discharges that attended self-help programs 16-30 times in the 30 days before admission (59 days each)
At discharge:
From Table 3.4, ○ The median LOS was longest among discharges not in the labor force that reported being disa-
bled (106 days) ○ The median LOS was shortest among discharges that reported daily use of the primary substance
in the past month (36 days)
25
CHapter 4
sHort-term resiDential treatment DisCHarges ageD 12 anD olDer: 2012
Chapter 4 presents data on the reason for discharge, median length of stay (LOS) in treatment, and socio-demographic and substance use characteristics of the 165,609 short-term residential
treatment discharges aged 12 and older in 2012.1,2 Of the 49 reporting states and jurisdictions, 43 states and 1 jurisdiction had discharges from short-term residential treatment [Table 4.1].
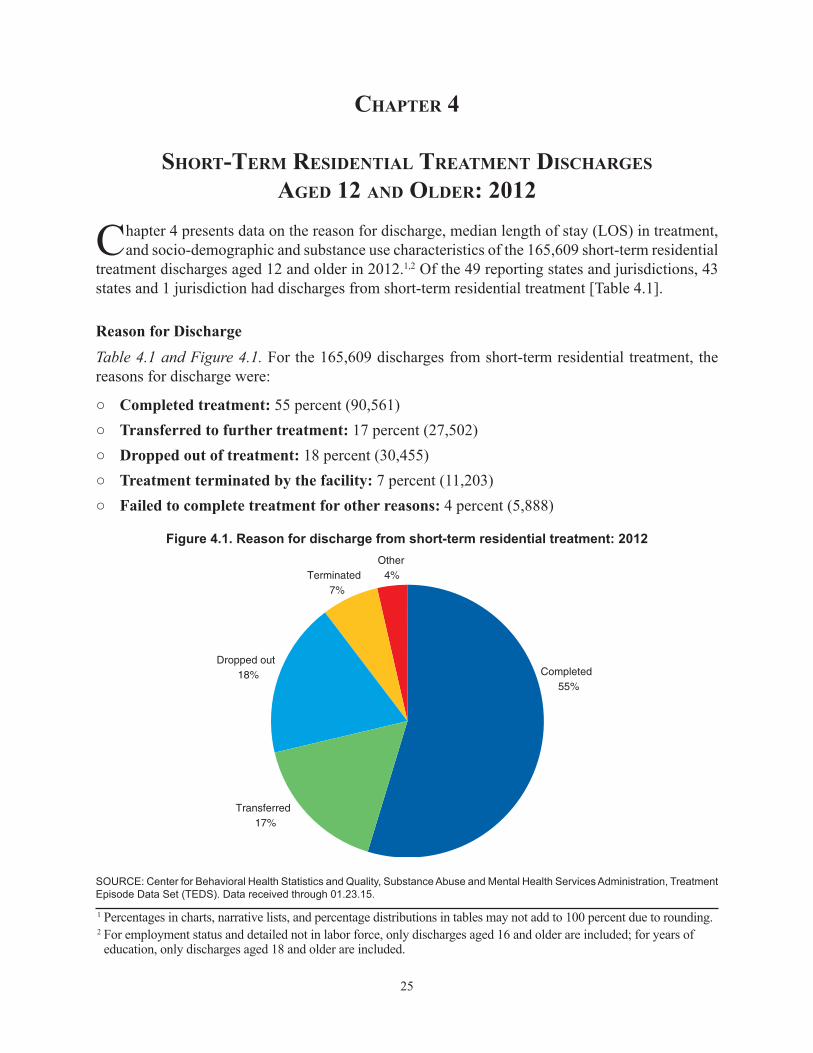
Reason for DischargeTable 4.1 and Figure 4.1. For the 165,609 discharges from short-term residential treatment, the reasons for discharge were:
○ Completed treatment: 55 percent (90,561) ○ Transferred to further treatment: 17 percent (27,502) ○ Dropped out of treatment: 18 percent (30,455) ○ Treatment terminated by the facility: 7 percent (11,203) ○ Failed to complete treatment for other reasons: 4 percent (5,888)
Figure 4.1. Reason for discharge from short-term residential treatment: 2012
Completed55%
Transferred17%
Dropped out18%
Terminated7%
Other4%
SOURCE: Center for Behavioral Health Statistics and Quality, Substance Abuse and Mental Health Services Administration, Treatment Episode Data Set (TEDS). Data received through 01.23.15.
1 Percentages in charts, narrative lists, and percentage distributions in tables may not add to 100 percent due to rounding.2 For employment status and detailed not in labor force, only discharges aged 16 and older are included; for years of education, only discharges aged 18 and older are included.

26
Reason for discharge
All Completed Transferred Dropped out Terminated Other
Med
ian
LOS
(da
ys)
0
5
10
15
20
25
30
Median Length of Stay (LOS)Table 1.4 and Figure 4.2. The median length of stay (LOS) for short-term residential treatment discharges aged 12 and older in 2012 was 21 days. By reason for discharge, the median LOS for short-term residential treatment discharges was:
○ Completed treatment: 27 days ○ Transferred to further treatment: 21 days ○ Dropped out of treatment: 7 days ○ Treatment terminated by the facility: 13 days ○ Failed to complete treatment for other reasons: 13 days
Figure 4.2. Median length of stay (LOS) in short-term residential treatment, by reason for discharge: 2012
SOURCE: Center for Behavioral Health Statistics and Quality, Substance Abuse and Mental Health Services Administration, Treatment Episode Data Set (TEDS). Data received through 01.23.15.
Socio-Demographic and Substance Use Characteristics at Time of Admission Table 1.7. Summary findings of characteristics at time of admission of short-term residential treat-ment discharges aged 12 and older include:
○ Gender: 65 percent of short-term residential discharges were male○ Age at admission: 11 percent of short-term residential discharges were 12 to 20 years of age,
32 percent were 21 to 30 years of age, 22 percent were 31 to 40 years of age, 22 percent were 41 to 50 years of age, and 13 percent were over 50 years of age
○ Race/ethnicity: 68 percent of short-term residential discharges were non-Hispanic White, 19 percent were non-Hispanic Black, 9 percent were Hispanic, and 4 percent were a race/ethnicity other than non-Hispanic White, non-Hispanic Black, or Hispanic

27
○ Primary substance: Alcohol was the most commonly reported primary substance of abuse at admission among short-term residential discharges (37 percent), followed by opiates (30 percent), marijuana and cocaine (11 percent each), stimulants (8 percent), and other substances (4 percent)
○ Frequency of use: 57 percent of short-term residential discharges reported daily substance use in the month before treatment entry
○ Number of prior treatment episodes: 72 percent of short-term residential discharges had one or more prior treatment episodes, 28 percent had no prior treatment episodes
○ Treatment referral source: 47 percent of short-term residential discharges were referred to treatment from health care/community referrals, 34 percent were self- or individual referrals, and 18 percent were criminal justice/DUI referrals
○ Employment status: Of all short-term residential discharges aged 16 and older, 43 percent were unemployed and 45 percent were not in the labor force at time of admission
○ Years of education: 43 percent of short-term residential discharges aged 18 and older had 12 years of education or a GED
Comparison of Short-term Residential Discharges to All Discharges on Characteristics at AdmissionTables 1.7 and 1.8a. There were some notable differences in the characteristics at admission of discharges from short-term residential treatment compared to the characteristics of all discharges combined.
○ Number of prior treatment episodes: 28 percent of short-term residential discharges vs. 40 percent of all discharges had no prior treatment episodes
○ Treatment referral source: • 47 percent of short-term residential discharges were health care/community referrals vs. 31
percent of all discharges • 18 percent of short-term residential discharges were criminal justice/DUI referrals vs. 33
percent of all discharges ○ Detailed not in labor force: Among short-term residential discharges aged 16 and older not in
the labor force at admission, 7 percent were students vs. 12 percent of all discharges ○ Employment status: 12 percent of short-term residential discharges aged 16 and older were
employed vs. 22 percent of all discharges ○ Primary substance:
• 11 percent of short-term residential discharges reported marijuana as their primary substance of abuse vs. 17 percent of all discharges
○ Frequency of use: • 57 percent of short-term residential discharges reported daily substance use in the month
before treatment entry vs. 40 percent of all discharges • 12 percent of short-term residential discharges reported no substance use in the month before
treatment entry vs. 29 percent of all discharges

28
○ Living arrangements: 60 percent of short-term residential discharges were living independently vs. 65 percent of all discharges
Comparison of Selected Characteristics at Admission and at Discharge for Short-Term Residential DischargesTables 1.8a-b. Certain socio-demographic and substance use characteristics were collected at both time of admission and time of discharge. Differences (changes) in status between admission and discharge for short-term residential discharges include:
○ Arrests in past 30 days: 88 percent of short-term residential discharges reported no arrests in past 30 days at admission vs. 95 percent at discharge
○ Detailed not in labor force: Among short-term residential discharges aged 16 and older not in the labor force, 21 percent reported being disabled at admission vs. 22 percent at discharge
○ Frequency of use: 12 percent of short-term residential discharges reported no substance use in the month before treatment entry vs. 64 percent at discharge
○ Living arrangements: 22 percent of short-term residential discharges reported living depend-ently at admission vs. 30 percent at discharge
○ Self-help programs attended in past 30 days: 69 percent of short-term residential discharges reported attending no self-help programs in the past 30 days at admission vs. 33 percent at discharge
Treatment Completion or Transfer to Further Treatment
Completion/Transfer RatesIn this section, “completion/transfer rate” refers to the number of treatment completions or transfers per 100 discharges. To illustrate, the overall rate is calculated as the sum of all treatment completions and transfers divided by all discharges (which includes those who dropped out, were terminated by facility, or did not complete treatment for other reasons) and the resulting number (fraction) is multiplied by 100. Of short-term residential treatment discharges aged 12 and older in 2012, the overall percentage that completed treatment or transferred to further treatment (i.e., completion/transfer rate) was 71 percent. Up to three top rates for each characteristic are presented below.
Completion/Transfer Rates for Characteristics at AdmissionTable 4.2. For short-term residential discharges in 2012, the completion/transfer rates according to characteristics at admission include:
○ Gender: The completion/transfer rate was 72 percent for male discharges and 70 percent for female discharges
○ Age at admission: The completion/transfer rate was 78 percent for discharges over 50 years of age, 74 percent for discharges 41 to 50 years of age, and 71 percent for discharges 31 to 40 years of age

29
○ Race/ethnicity: The completion/transfer rate was 72 percent for non-Hispanic White discharges, 70 percent for discharges of a race/ethnicity other than non-Hispanic White, non-Hispanic Black, or Hispanic, and 69 percent each for non-Hispanic Black discharges and Hispanic discharges
○ Number of prior treatment episodes: The completion/transfer rate was 72 percent for discharges with one or more prior treatment episodes and 71 percent for discharges with no prior treatment episodes
○ Treatment referral source: The completion/transfer rate was 77 percent for discharges from criminal justice/DUI referrals, 72 percent for discharges from health care/community referrals, and 67 percent for discharges from self- or individual referrals
○ Years of education: The completion/transfer rate for ages 18 and older was 75 percent for dis-charges with more than 12 years of education, 71 percent for those with 12 years of education, and 68 percent for those with fewer than 12 years of education
Completion/Transfer Rates for Characteristics at Discharge
Table 4.4. For short-term residential discharges in 2012, the completion/transfer rates according to characteristics at discharge include:
○ Arrests in past 30 days: The completion/transfer rate was 73 percent for discharges with no arrests in the 30 days before discharge, 64 percent for discharges with 1 arrest in the 30 days before discharge, and 62 percent for those with 3 arrests in the 30 days before discharge
○ Detailed not in labor force: The completion/transfer rate for ages 16 and older was 82 percent for discharges who were retired, 72 percent for homemakers, and 71 percent for discharges who were disabled
○ Employment status: The completion/transfer rate for ages 16 and older was 80 percent for discharges who were employed and 71 percent for those who were unemployed
○ Frequency of use: The completion/transfer rate was 80 percent for discharges with no substance use in the 30 days before discharge, 61 percent for those with some use of a substance in the 30 days before discharge, and 55 percent for those with daily use of a substance in the 30 days before discharge
○ Living arrangements: The completion/transfer rate was 77 percent for discharges with depend-ent living status, 72 percent with independent living status, and 61 percent for the discharges who were homeless
○ Self-help programs attended in past 30 days: The completion/transfer rate was 84 percent for discharges who attended self-help programs 16-30 times in the 30 days before discharge, 76 percent for those who attended self-help programs 8-15 times in the 30 days before discharge, and 65 percent for those who attended 4-7 times in the 30 days before discharge
Median Length of Stay (LOS) of Discharges Completing TreatmentTables 4.2 and 4.4. The overall median LOS among those completing short-term residential treat-ment (excluding those who were transferred to further treatment) was 27 days. Median LOS for characteristics at admission and at discharge for short-term residential discharges that completed treatment include:

30
At admission:
From Table 4.2, ○ The median LOS was longest for discharges aged 12 to 20 years and discharges who were
referred to treatment through a criminal justice/DUI source (28 days each) ○ The median LOS was shortest for discharges from self- or individual referrals (24 days)
From Table 4.4, ○ The median LOS was longest among discharges not in the labor force that reported being
students (33 days) ○ The median LOS was shortest among discharges not in the labor force that reported being
retired (22 days)
At discharge:
From Table 4.4, ○ The median LOS was longest among discharges not in the labor force that reported being
students (32 days) ○ The median LOS was shortest among discharges that reported some use of the primary substance
in the past month (20 days)

31
CHapter 5
long-term resiDential treatment DisCHarges ageD 12 anD olDer: 2012
Chapter 5 presents data on the reason for discharge, median length of stay (LOS) in treatment, and socio-demographic and substance use characteristics of the 122,467 long-term residential
treatment discharges aged 12 and older in 2012.1,2 Of the 49 reporting states and jurisdictions, 44 states and 2 jurisdictions had discharges from long-term residential treatment [Table 5.1].
Reason for DischargeTable 5.1 and Figure 5.1. For the 122,467 discharges from long-term residential treatment, the reasons for discharge were:
○ Completed treatment: 45 percent (54,632) ○ Transferred to further treatment: 16 percent (19,655) ○ Dropped out of treatment: 25 percent (30,947) ○ Treatment terminated by the facility: 10 percent (12,598) ○ Failed to complete treatment for other reasons: 4 percent (4,635)
Figure 5.1. Reason for discharge from long-term residential treatment: 2012
Completed45%
Transferred16%
Dropped out25%
Terminated10%
Other4%
SOURCE: Center for Behavioral Health Statistics and Quality, Substance Abuse and Mental Health Services Administration, Treatment Episode Data Set (TEDS). Data received through 01.23.15.1 Percentages in charts, narrative lists, and percentage distributions in tables may not add to 100 percent due to rounding.2 For employment status and detailed not in labor force, only discharges aged 16 and older are included; for years of education, only discharges aged 18 and older are included.

32
Reason for discharge
All Completed Transferred Dropped out Terminated Other
Med
ian
LOS
(da
ys)
0
20
40
60
80
100
Median Length of Stay (LOS)Table 1.4 and Figure 5.2. The median length of stay (LOS) for long-term residential treatment discharges aged 12 and older in 2012 was 56 days. By reason for discharge, the median LOS for long-term residential treatment discharges was:
○ Completed treatment: 90 days ○ Transferred to further treatment: 29 days ○ Dropped out of treatment: 26 days ○ Treatment terminated by the facility: 49 days ○ Failed to complete treatment for other reasons: 49 days
Figure 5.2. Median length of stay (LOS) in long-term residential treatment, by reason for discharge: 2012
SOURCE: Center for Behavioral Health Statistics and Quality, Substance Abuse and Mental Health Services Administration, Treatment Episode Data Set (TEDS). Data received through 01.23.15.
Socio-Demographic and Substance Use Characteristics at Time of Admission Table 1.7. Summary findings of characteristics at time of admission of long-term residential treat-ment discharges aged 12 and older include:
○ Gender: 64 percent of long-term residential discharges were male○ Age at admission: 12 percent of long-term residential discharges were 12 to 20 years of age,
33 percent were 21 to 30 years of age, 23 percent were 31 to 40 years of age, 21 percent were 41 to 50 years of age, and 11 percent were over 50 years of age
○ Race/ethnicity: 56 percent of long-term residential discharges were non-Hispanic White, 20 percent were non-Hispanic Black, 14 percent were Hispanic, and 9 percent were a race/ethnicity other than non-Hispanic White, non-Hispanic Black, or Hispanic
33
○ Primary substance: Alcohol was the most commonly reported primary substance of abuse at the time of admission among long-term residential discharges (30 percent), followed by opiates (26 percent), stimulants (16 percent), marijuana (13 percent), cocaine (12 percent), and other substances (3 percent)
○ Frequency of use: 34 percent each of long-term residential discharges who reported daily substance use in the month before treatment entry, and discharges who reported no substance use in the month before treatment entry
○ Number of prior treatment episodes: 74 percent of long-term residential discharges had one or more prior treatment episodes, and 26 percent had no prior treatment episodes
○ Treatment referral source: 37 percent of long-term residential discharges were referred to treatment by health care/community referrals, 35 percent were criminal justice/DUI referrals, and 28 percent were self- or individual referrals
○ Employment status: Of all long-term residential discharges aged 16 and older, 35 percent were unemployed and 59 percent were not in the labor force at time of admission
○ Years of education: 43 percent of long-term residential discharges aged 18 and older had 12 years of education or a GED
Comparison of Long-Term Residential Discharges to All Discharges on Characteristics at AdmissionTables 1.7 and 1.8a. There were some notable differences in the characteristics at admission of discharges from long-term residential treatment compared to the characteristics of all discharges combined.
○ Number of prior treatment episodes: 26 percent of long-term residential discharges had no prior treatment episodes vs. 40 percent of all discharges
○ Treatment referral source: • 37 percent of long-term residential discharges were health care/community referrals vs. 31
percent of all discharges • 28 percent of long-term residential discharges were self- or individual referrals vs. 36 percent
of all discharges ○ Detailed not in labor force: Among long-term residential discharges aged 16 and older not in
the labor force at admission, 12 percent were disabled vs. 23 percent of all discharges ○ Employment status: 6 percent of long-term residential discharges aged 16 and older were
employed vs. 22 percent of all discharges ○ Primary substance:
• 30 percent of long-term residential discharges reported alcohol as their primary substance of abuse vs. 39 percent of all discharges
• 16 percent of long-term residential discharges reported stimulants as their primary substance of abuse vs. 8 percent of all discharges

34
○ Frequency of use: • 34 percent of long-term residential discharges reported daily substance use in the month
before treatment entry vs. 40 percent of all discharges • 34 percent of long-term residential discharges reported no substance use in the month before
treatment entry vs. 29 percent of all discharges ○ Living arrangements: 37 percent of long-term residential discharges were living independently
vs. 65 percent of all discharges
Comparison of Selected Characteristics at Admission and at Discharge for Long-Term Residential DischargesTables 1.8a-b. Certain socio-demographic and substance use characteristics were collected at both time of admission and time of discharge. Differences (changes) in status between admission and discharge for long-term residential discharges include:
○ Arrests in past 30 days: 89 percent of long-term residential discharges reported no arrests in past 30 days at admission vs. 96 percent at discharge
○ Detailed not in labor force: Among long-term residential discharges aged 16 and older not in the labor force, 11 percent reported being students at admission vs. 17 percent at discharge
○ Employment status: 6 percent of long-term residential discharges aged 16 and older were employed at admission vs. 16 percent at discharge
○ Frequency of use: 34 percent of long-term residential discharges reported no substance use in the month before treatment vs. 76 percent at discharge
○ Living arrangements: 26 percent of long-term residential discharges reported being homeless at admission vs. 16 percent at discharge
○ Self-help programs attended in past 30 days: 58 percent of long-term residential discharges reported attending no self-help programs in past 30 days at admission vs. 31 percent at discharge
Treatment Completion or Transfer to Further Treatment
Completion/Transfer RatesIn this section, “completion/transfer rate” refers to the number of treatment completions or transfers per 100 discharges. To illustrate, the overall rate is calculated as the sum of all treatment completions and transfers divided by all discharges (which includes those who dropped out, were terminated by facility, or did not complete treatment for other reasons) and the resulting number (fraction) is multiplied by 100. Of long-term residential treatment discharges aged 12 and older in 2012, the overall percentage that completed treatment or transferred to further treatment (i.e., completion/transfer rate) was 61 percent. Up to three top rates for each characteristic are presented below.
Completion/Transfer Rates for Characteristics at AdmissionTable 5.2. For long-term residential discharges in 2012, the completion/transfer rates according to characteristics at admission include:
35
○ Gender: The completion/transfer rate was 62 percent for female discharges and 60 percent for male discharges
○ Age at admission: The completion/transfer rate was 68 percent for discharges over 50 years of age, 63 percent for discharges 41 to 50 years of age, and 61 percent for discharges 31 to 40 years of age
○ Race/ethnicity: The completion/transfer rate was 63 percent for non-Hispanic White discharges, 59 percent for Hispanic discharges, and 54 percent for non-Hispanic Black discharges
○ Number of prior treatment episodes: The completion/transfer rate was 67 percent for discharges with no prior treatment episodes, and 58 percent for discharges with one or more prior treatment episodes
○ Treatment referral source: The completion/transfer rate was 65 percent for discharges who were referred to treatment by a criminal justice/DUI source, 61 percent for discharges who were self- or individual referrals, and 57 percent for discharges who were health care or community referrals
○ Years of education: The completion/transfer rate for ages 18 and older was 65 percent for dis-charges with more than 12 years of education, 61 percent for those with 12 years of education, and 57 percent for those with fewer than 12 years of education
Completion/Transfer Rates for Characteristics at Discharge
Table 5.4. For long-term residential discharges in 2012, the completion/transfer rates according to characteristics at discharge include:
○ Arrests in past 30 days: The completion/transfer rate was 65 percent for discharges with no arrests in the 30 days before discharge, 65 percent for discharges with 5 arrests in the 30 days before discharge, and 63 percent for those with 3 arrests in the 30 days before discharge
○ Detailed not in labor force: The completion/transfer rate for ages 16 and older was 76 percent for discharges who were retired, 66 percent for homemakers, and 62 percent for students
○ Employment status: The completion/transfer rate for ages 16 and older was 78 percent for discharges who were employed and 63 percent for those who were unemployed
○ Frequency of use: The completion/transfer rate was 71 percent for discharges with no substance use in the 30 days before discharge, 54 percent for those with daily substance use in the 30 days before discharge, and 53 percent for those with some substance use in the 30 days before discharge
○ Living arrangements: The completion/transfer rate was 67 percent for discharges with depend-ent living status, 65 percent for those with independent living status, and 63 percent for those who were homeless
○ Self-help programs attended in past 30 days: The completion/transfer rate was 68 percent for discharges who attended self-help programs 16-30 times in the 30 days before discharge, 65 percent for those who attended self-help programs 8-15 times in the 30 days before discharge, and 62 percent for those who attended such programs 4-7 times in the 30 days before discharge

36
Median Length of Stay (LOS) of Discharges Completing TreatmentTables 5.2 and 5.4. The overall median LOS among those completing long-term residential treat-ment (excluding those who were transferred to further treatment) was 90 days. Median LOS for characteristics at admission and at discharge for long-term residential discharges that completed treatment include:
At admission:
From Table 5.2, ○ The median LOS was longest for non-Hispanic Black discharges (111 days) ○ The median LOS was shortest for discharges that were a race/ethnicity other than non-Hispanic
White, non-Hispanic Black or Hispanic (65 days)
From Table 5.4, ○ The median LOS was longest among discharges not in the labor force that reported being
institutional inmates (141 days) ○ The median LOS was shortest among discharges not in the labor force that reported being
retired (43 days)
At discharge:
From Table 5.4, ○ The median LOS was longest among discharges arrested 4 times in the 30 days prior to
discharge (166 days) ○ The median LOS was shortest among discharges that reported some use of the primary substance
in the past month (28 days)

37
CHapter 6
Hospital resiDential treatment DisCHarges ageD 12 anD olDer: 2012
Chapter 6 presents data on the reason for discharge, median length of stay (LOS) in treatment, and socio-demographic and substance use characteristics of the 5,637 discharges from hospital
residential treatment aged 12 and older in 2012.1,2 Of the 49 reporting states and jurisdictions, 16 states had discharges from hospital residential treatment [Table 6.1].
Reason for DischargeTable 6.1 and Figure 6.1. For the 5,637 discharges from hospital residential treatment, the reasons for discharge were:
○ Completed treatment: 54 percent (3,037) ○ Transferred to further treatment: 16 percent (929) ○ Dropped out of treatment: 23 percent (1,299) ○ Treatment terminated by the facility: 3 percent (178) ○ Failed to complete treatment for other reasons: 3 percent (194)
Figure 6.1. Reason for discharge from hospital residential treatment: 2012
Completed54%
Transferred16%
Dropped out23%
Terminated3%
Other3%
SOURCE: Center for Behavioral Health Statistics and Quality, Substance Abuse and Mental Health Services Administration, Treatment Episode Data Set (TEDS). Data received through 01.23.15.1 Percentages in charts, narrative lists, and percentage distributions in tables may not add to 100 percent due to rounding.2 For employment status and detailed not in labor force, only discharges aged 16 and older are included; for years of education, only discharges aged 18 and older are included.

38
Reason for discharge
All Completed Transferred Dropped out Terminated Other
Med
ian
LOS
(da
ys)
0
5
10
15
20
Median Length of Stay (LOS)Table 1.4 and Figure 6.2. The median length of stay (LOS) for hospital residential treatment discharges aged 12 and older in 2012 was 14 days. By reason for discharge, the median LOS for hospital residential treatment discharges was:
○ Completed treatment: 14 days ○ Transferred to further treatment: 5 days ○ Dropped out of treatment: 5 days ○ Treatment terminated by the facility: 12 days ○ Failed to complete treatment for other reasons: 4 days
Figure 6.2. Median length of stay (LOS) in hospital residential treatment, by reason for discharge: 2012
SOURCE: Center for Behavioral Health Statistics and Quality, Substance Abuse and Mental Health Services Administration, Treatment Episode Data Set (TEDS). Data received through 01.23.15.
Socio-Demographic and Substance Use Characteristics at Time of Admission Table 1.7. Summary findings of characteristics at time of admission of hospital residential treatment discharges aged 12 and older include:
○ Gender: 64 percent of hospital residential treatment discharges were male○ Age at admission: 5 percent were 12 to 20 years of age, 27 percent were 21 to 30 years of age,
23 percent were 31 to 40 years of age, 28 percent were 41 to 50 years of age, and 18 percent were over 50 years of age
○ Race/ethnicity: 77 percent were non-Hispanic White, 13 percent were non-Hispanic Black, 6 percent were Hispanic, and 4 percent were a race/ethnicity other than non-Hispanic White, non-Hispanic Black, or Hispanic

39
○ Primary substance: Alcohol was reported most frequently (55 percent), followed by opiates (23 percent), cocaine (8 percent), other or unkown substances (6 percent), marijuana/hashish (4 percent), and stimulants (4 percent)
○ Frequency of use: 65 percent reported daily substance use, and 11 percent reported no subatance use in the month before treatment entry
○ Number of prior treatment episodes: 63 percent of hospital residential treatment discharges had one or more prior treatment episodes, and 37 percent had no prior treatment episodes
○ Treatment referral source: 54 percent of hospital residential treatment discharges were self- or individual referrals, 39 percent were health care or community referrals, and 7 percent were referred to treatment by criminal justice/DUI sources
○ Employment status: Of all hospital residential treatment discharges aged 16 and older, 56 percent were unemployed and 28 percent were not in the labor force at time of admission
○ Years of education: 47 percent of hospital residential treatment discharges aged 18 and older had 12 years of education or a GED
Comparison of Hospital Residential Treatment Discharges to All Discharges on Characteristics at AdmissionTables 1.7 and 1.8a. There were some notable differences in the characteristics at admission of discharges from hospital residential treatment compared to the characteristics of all discharges combined.
○ Treatment referral source: • 54 percent of hospital residential treatment discharges were self- or individual referrals vs.
36 percent of all discharges • 7 percent of hospital residential treatment discharges were criminal justice/DUI referrals
vs. 33 percent of all discharges ○ Detailed not in labor force: 5 percent of hospital residential treatment discharges aged 16 and
older were students vs. 12 percent of all discharges ○ Employment status: 16 percent of hospital residential treatment discharges aged 16 and older
were employed vs. 22 percent of all discharges ○ Primary substance:
• 4 percent of hospital residential treatment discharges reported marijuana as their primary substance of abuse vs. 17 percent of all discharges
○ Frequency of use: • 65 percent of hospital residential treatment discharges reported daily substance use in the
month before treatment entry vs. 40 percent of all discharges • 11 percent of hospital residential treatment discharges reported no substance use in the
month before treatment entry vs. 29 percent of all discharges

40
○ Living arrangements: 6 percent of hospital residential treatment discharges were living dependently vs. 21 percent of all discharges
Comparison of Selected Characteristics at Admission and at Discharge for Hospital Residential Treatment DischargesTables 1.8a-b. Certain socio-demographic and substance use characteristics were collected at both time of admission and time of discharge. Differences (changes) in status between admission and discharge for hospital residential treatment discharges include:
○ Arrests in past 30 days: 94 percent of hospital residential treatment discharges reported no arrests in past 30 days at admission vs. 98 percent at discharge
○ Detailed not in labor force: Among hospital residential treatment discharges aged 16 and older not in the labor force, 9 percent reported being institutional inmates at admission vs. 12 percent at discharge
○ Frequency of use: 65 percent of hospital residential treatment discharges reported daily sub-stance use in the month before treatment entry vs. 34 percent at discharge
○ Living arrangements: 16 percent of hospital residential treatment discharges reported being homeless at admission vs. 13 percent at discharge
○ Self-help programs attended in past 30 days: 81 percent of hospital residential treatment discharges reported not attending self-help programs in the past 30 days at admission vs. 61 percent at discharge
Treatment Completion or Transfer to Further Treatment
Completion/Transfer RatesIn this section, “completion/transfer rate” refers to the number of treatment completions or transfers per 100 discharges. To illustrate, the overall rate is calculated as the sum of all treatment completions and transfers divided by all discharges (which includes those who dropped out, were terminated by facility, or did not complete treatment for other reasons) and the resulting number (fraction) is multiplied by 100. Of hospital residential treatment discharges aged 12 and older in 2012, the overall percentage that completed treatment or transferred to further treatment (i.e., completion/transfer rate) was 70 percent. Up to three top rates for each characteristic are presented below.
Completion/Transfer Rates for Characteristics at AdmissionTable 6.2. For hospital residential treatment discharges in 2012, the completion/transfer rates according to characteristics at admission include:
○ Gender: The completion/transfer rate was 72 percent for male discharges and 68 percent for female discharges
○ Age at admission: The completion/transfer rate was 77 percent for discharges over 50 years of age, 71 percent for discharges 41 to 50 years of age, and 69 percent for discharges 31 to 40 years of age

41
○ Race/ethnicity: The completion/transfer rate was 74 for Hispanics, 71 percent for non-Hispanic White discharges, and 69 percent for discharges that were of a race/ethnicity other than non-Hispanic Black, non-Hispanic White, or Hispanic
○ Number of prior treatment episodes: The completion/transfer rate was 68 percent for discharges with one or more prior treatment episodes and 66 percent for those with no prior treatment episodes
○ Treatment referral source: The completion/transfer rate was 78 percent for discharges who were referred to treatment by a criminal justice/DUI source, 75 percent for self- or individual referrals, and 61 percent for health care or community referrals
○ Years of education: The completion/transfer rate for ages 18 and older was 73 percent for discharges with more than 12 years of education, 69 percent for those with 12 years of education or a GED, and 65 percent for those with fewer than 12 years of education
Completion/Transfer Rates for Characteristics at Discharge
Table 6.4. For hospital residential treatment discharges in 2012, the completion/transfer rates according to characteristics at discharge include:
○ Arrests in past 30 days: The completion/transfer rate was 86 percent for those with 2 arrests in the 30 days prior to discharge, 71 percent for those with no arrests, and 59 percent for those who were arrested once
○ Detailed not in labor force: The completion/transfer rate for ages 16 and older was 87 percent for students, 84 percent for those who were retired, and 81 percent for institutional inmates
○ Employment status: The completion/transfer rate for ages 16 and older was 76 percent for discharges who were employed, 64 percent for the unemployed, and 78 percent for those who were not in the labor force
○ Frequency of use: The completion/transfer rate was 81 percent for those with no substance use in the 30 days prior to discharge, 73 percent for those with some substance use, and 56 percent with daily substance use
○ Living arrangements: The completion/transfer rate was 75 percent for those who were living dependently, 71 percent for those living independently, and 67 percent for those who were homeless
○ Self-help programs attended in past 30 days: The completion/transfer rate was 91 percent for those who attended self-help programs 16-30 times in the 30 days prior to discharge, 87 percent for those who attended self-help programs 4-7 times, and 85 percent for those who at-tended such programs 8-15 times
Median Length of Stay (LOS) of Discharges Completing TreatmentTables 6.2 and 6.4. The overall median LOS among those completing hospital residential treat-ment (excluding those who were transferred to further treatment) was 14 days. Median LOS for selected characteristics at admission and at discharge for hospital residential treatment discharges that completed treatment include:

42
At admission:
From Table 6.2, ○ The median LOS was longest for discharges that were referred to treatment by a criminal justice/
DUI source (28 days). ○ The median LOS was shortest for those who had no prior treatment episodes (9 days).
From Table 6.4, ○ The median LOS was longest for those who were arrested 3 times in the 30 days prior to
admission (41 days). ○ The median LOS shortest for those who attended self-help programs 4-7 times in the 30 days
prior to admission (5 days).
At discharge:
From Table 6.4, ○ The median LOS was longest for discharges who were arrested 2-3 times in the 30 days prior
to discharge or those who did not use a substance in the past month (30 days). ○ The median LOS was shortest for those who reported daily substance use (5 days).
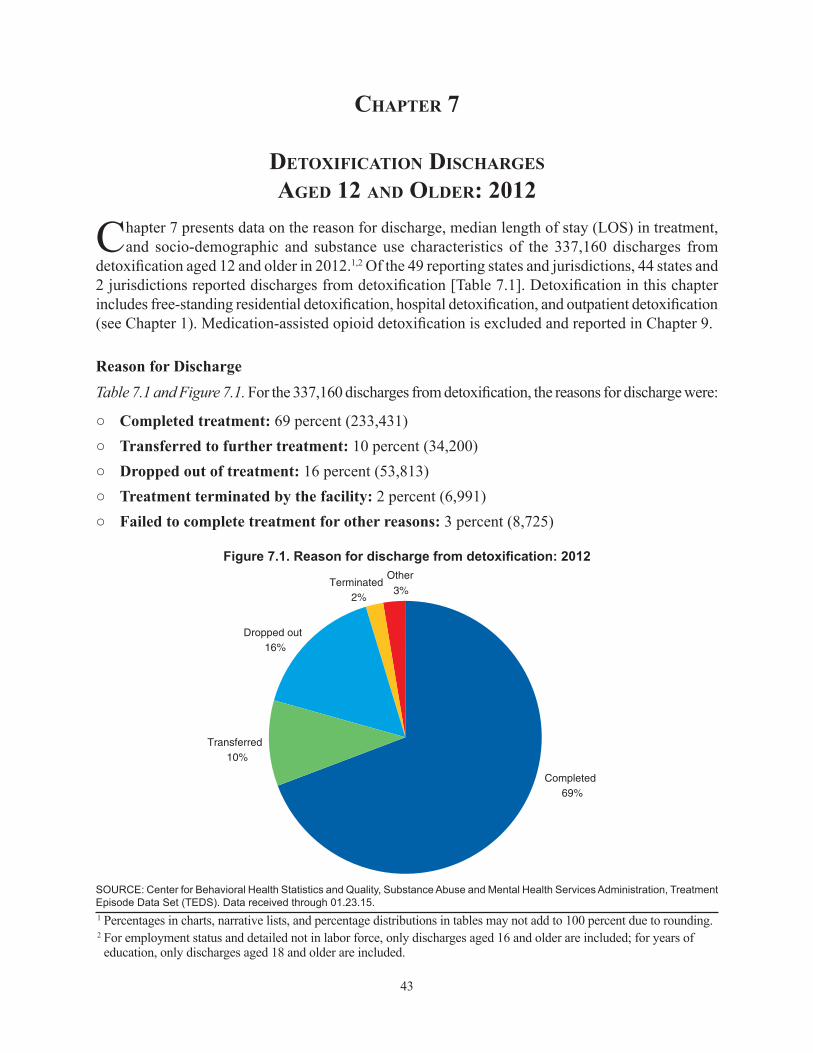
43
CHapter 7
DetoxifiCation DisCHarges ageD 12 anD olDer: 2012
Chapter 7 presents data on the reason for discharge, median length of stay (LOS) in treatment, and socio-demographic and substance use characteristics of the 337,160 discharges from
detoxification aged 12 and older in 2012.1,2 Of the 49 reporting states and jurisdictions, 44 states and 2 jurisdictions reported discharges from detoxification [Table 7.1]. Detoxification in this chapter includes free-standing residential detoxification, hospital detoxification, and outpatient detoxification (see Chapter 1). Medication-assisted opioid detoxification is excluded and reported in Chapter 9.
Reason for DischargeTable 7.1 and Figure 7.1. For the 337,160 discharges from detoxification, the reasons for discharge were:
○ Completed treatment: 69 percent (233,431) ○ Transferred to further treatment: 10 percent (34,200) ○ Dropped out of treatment: 16 percent (53,813) ○ Treatment terminated by the facility: 2 percent (6,991) ○ Failed to complete treatment for other reasons: 3 percent (8,725)
Figure 7.1. Reason for discharge from detoxification: 2012
Completed69%
Transferred10%
Dropped out16%
Terminated2%
Other3%
SOURCE: Center for Behavioral Health Statistics and Quality, Substance Abuse and Mental Health Services Administration, Treatment Episode Data Set (TEDS). Data received through 01.23.15.1 Percentages in charts, narrative lists, and percentage distributions in tables may not add to 100 percent due to rounding.2 For employment status and detailed not in labor force, only discharges aged 16 and older are included; for years of education, only discharges aged 18 and older are included.

44
Reason for discharge
All Completed Transferred Dropped out Terminated Other
Med
ian
LOS
(da
ys)
0
1
2
3
4
5
Median Length of Stay (LOS)Table 1.4 and Figure 7.2. The median length of stay (LOS) for detoxification discharges aged 12 and older in 2012 was 4 days. By reason for discharge, the median LOS for detoxification discharges was:
○ Completed treatment: 4 days ○ Transferred to further treatment: 4 days ○ Dropped out of treatment: 2 days ○ Treatment terminated by the facility: 3 days ○ Failed to complete treatment for other reasons: 2 days
Figure 7.2. Median length of stay (LOS) in detoxification, by reason for discharge: 2012
SOURCE: Center for Behavioral Health Statistics and Quality, Substance Abuse and Mental Health Services Administration, Treatment Episode Data Set (TEDS). Data received through 01.23.15.
Socio-Demographic and Substance Use Characteristics at Time of Admission Table 1.7. Summary findings of characteristics at time of admission of detoxification discharges aged 12 and older include:
○ Gender: 73 percent of detoxification discharges were male○ Age at admission: 4 percent were 12 to 20 years of age, 26 percent were 21 to 30 years of age,
22 percent were 31 to 40 years of age, 28 percent were 41 to 50 years of age, and 20 percent were over 50 years of age
○ Race/ethnicity: 62 percent were non-Hispanic White, 18 percent were non-Hispanic Black, 14 percent were Hispanic, and 6 percent were a race/ethnicity other than non-Hispanic White, non-Hispanic Black, or Hispanic
○ Primary substance: Alcohol was reported most frequently (50 percent), followed by opiates (36 percent), cocaine (5 percent), stimulants (4 percent), other or unknown substances (3 percent), and marijuana/hashish (2 percent)
45
○ Frequency of use: 76 percent reported daily subatance use, and 3 percent reported no substance use in the month before treatment entry
○ Number of prior treatment episodes: 66 percent of detoxification discharges had one or more prior treatment episodes, and 34 percent had no prior treatment episodes
○ Treatment referral source: 61 percent of detoxification discharges were self- or individual referrals, 28 percent were health care or community referrals, and 10 percent were referred to treatment by criminal justice/DUI sources
○ Employment status: Of all detoxification discharges aged 16 and older, 40 percent were unemployed and 47 percent were not in the labor force at time of admission
○ Years of education: 46 percent of detoxification discharges aged 18 and older had 12 years of education or a GED
Comparison of Detoxification Discharges to All Discharges on Characteristics at AdmissionTables 1.7 and 1.8a. There were some notable differences in the characteristics at admission of discharges from detoxification treatment compared to the characteristics of all discharges combined.
○ Number of prior treatment episodes: 34 percent of detoxification discharges had no prior treatment episodes vs. 40 percent of all discharges had no prior treatment episodes
○ Treatment referral source: • 61 percent of detoxification discharges were self- or individual referrals vs. 36 percent of
all discharges • 10 percent of detoxification discharges were criminal justice/DUI referrals vs. 33 percent
of all discharges ○ Detailed not in labor force: 2 percent of detoxification discharges aged 16 and older were
students vs. 12 percent of all discharges ○ Employment status: 13 percent of detoxification discharges aged 16 and older were employed
vs. 22 percent of all discharges ○ Primary substance:
• 2 percent of detoxification discharges reported marijuana as their primary substance of abuse vs. 17 percent of all discharges
• 36 percent of detoxification discharges reported opiates as their primary substance of abuse vs. 26 percent of all discharges
○ Frequency of use: • 76 percent of detoxification discharges reported daily substance use in the month before
treatment entry vs. 40 percent of all discharges • 3 percent of detoxification discharges reported no substance use in the month before treat-
ment entry vs. 29 percent of all discharges ○ Living arrangements: 31 percent of detoxification discharges were homeless vs. 14 percent
of all discharges
46
Comparison of Selected Characteristics at Admission and at Discharge for Detoxification DischargesTables 1.8a-b. Certain socio-demographic and substance use characteristics were collected at both time of admission and time of discharge. Differences (changes) in status between admission and discharge for detoxification discharges include:
○ Arrests in past 30 days: 94 percent of detoxification discharges reported no arrests in past 30 days at admission vs. 96 percent at discharge
○ Detailed not in labor force: Among detoxification discharges aged 16 and older not in the labor force, 21 percent reported being disabled at admission vs. 26 percent at discharge
○ Employment status: 13 percent of detoxification discharges aged 16 and older were employed at admission vs. 14 percent at discharge
○ Frequency of use: 76 percent of detoxification discharges reported daily substance use in the month before treatment entry vs. 45 percent at discharge
○ Living arrangements: 31 percent of detoxification discharges reported being homeless at admission vs. 25 percent at discharge
○ Self-help programs attended in past 30 days: 82 percent of detoxification discharges reported not attending self-help programs in the past 30 days at admission vs. 69 percent at discharge
Treatment Completion or Transfer to Further Treatment
Completion/Transfer RatesIn this section, “completion/transfer rate” refers to the number of treatment completions or transfers per 100 discharges. To illustrate, the overall rate is calculated as the sum of all treatment completions and transfers divided by all discharges (which includes those who dropped out, were terminated by facility, or did not complete treatment for other reasons) and the resulting number (fraction) is multiplied by 100. Of detoxification treatment discharges aged 12 and older in 2012, the overall percentage that completed treatment or transferred to further treatment (i.e., completion/transfer rate) was 79 percent. Up to three top rates for each characteristic are presented below.
Completion/Transfer Rates for Characteristics at AdmissionTable 7.2. For detoxification discharges in 2012, the completion/transfer rates according to characteristics at admission include:
○ Gender: The completion/transfer rate was 80 percent for male discharges and 79 percent for female discharges
○ Age at admission: The completion/transfer rate was 85 percent for discharges over 50 years of age, 82 percent for discharges 41 to 50 years of age, and 80 percent of discharges 12 to 20 years of age
○ Race/ethnicity: The completion/transfer was 82 percent for non-Hispanic Black discharges and 81 percent each for Hispanic discharges and discharges who were of a race other than non-Hispanic White, non-Hispanic Black, or Hispanic

47
○ Number of prior treatment episodes: The completion/transfer rate was 80 percent for discharges with one or more prior treatment episodes and 77 percent for those with no prior treatment episodes
○ Treatment referral source: The completion/transfer rate was 85 percent each for discharges who were health care or community referrals and criminal justice/DUI referrals, and 76 percent for discharges with self- or individual referrals
○ Years of education: The completion/transfer rate for ages 18 and older was 81 percent for those with more than 12 years of education, 79 percent for those 12 years of education or a GED, and 78 percent for those with fewer than 12 years of education
Completion/Transfer Rates for Characteristics at Discharge
Table 7.4. For detoxification discharges in 2012, the completion/transfer rates according to characteristics at discharge include:
○ Arrests in past 30 days: The completion/transfer rate was 84 percent for those with 2 arrests in the 30 days before discharge, 82 percent for those who were arrested once, and 80 percent for those with no arrests
○ Detailed not in labor force: The completion/transfer rate for ages 16 and older was 89 percent for the retired, 87 percent for inmates of an institution, and 85 percent for students
○ Employment status: The completion/transfer rate for ages 16 and older was 83 percent for discharges who were employed, 80 percent for the unemployed, and 81 percent for those who were not in the labor force
○ Frequency of use: The completion/transfer rate was 87 percent for those who reported some substance use in the 30 days before discharge, 78 percent for those who reported no substance use, and 76 percent who reported daily substance use
○ Living arrangements: The completion/transfer rate was 87 percent for those who were living dependently, 82 percent for the homeless, and 79 percent for those living independently
○ Self-help programs attended in past 30 days: The completion/transfer rate was 86 percent for those who attended self-help programs 16-30 times in the 30 days before discharge, 81 percent for those who attended self-help programs 4-7 times, and 79 percent for those who attended such programs 8-15 times
Median Length of Stay (LOS) of Discharges Completing TreatmentTables 7.2 and 7.4. The overall median LOS among those completing detoxification treatment (excluding those who were transferred to further treatment) was 4 days. Median LOS for selected characteristics at admission and at discharge for detoxification discharges that completed treatment include:
At admission:
From Table 7.2, ○ The median LOS was longest for discharges aged 12-30 years and those who were self or
individually referred to treatment (5 days each).
48
○ The median LOS was shortest for discharges who were referred to treatment by a criminal justice/DUI source and discharges who were of a race/ethnicity other than non-Hispanic White, non-Hispanic Black, or Hispanic (3 days each).
From Table 7.4, ○ The median LOS was longest for discharges who were inmates of institutions (60 days). ○ The median LOS shortest for discharges arrested 5 times in past 30 days and those reported
some substance use in the 30 days prior to admission (3 days each).
At discharge:
From Table 7.4, ○ The median LOS was longest among discharges who attended self-help programs 16-30 times
in the 30 days prior to discharge (9 days). ○ The median LOS was shortest (3 days) among the following categories—those arrested 5
times in past 30 days, those not in labor force who were retired or disabled, those who were employed, those who reported some substance use in the month before discharge, those who were homeless, and those whose primary substance of abuse was alcohol.

49
CHapter 8
outpatient meDiCation-assisteD opioiD tHerapy DisCHarges ageD 12 anD olDer: 2012
Chapter 8 presents data on the reason for discharge, median length of stay (LOS) in treatment, and socio-demographic and substance use characteristics for the 72,071 discharges aged
12 and older from outpatient medication-assisted opioid therapy (i.e., therapy with methadone or buprenorphine) in 2012.1,2 Of the 49 states and jurisdictions, 40 states and 2 jurisdictions had discharges from outpatient medication-assisted opioid therapy [Table 8.1]. Discharges from outpa-tient medication-assisted opioid therapy were from outpatient treatment (94 percent) and intensive outpatient treatment (6 percent) (see Chapter 1).
Reason for DischargeTable 8.1 and Figure 8.1. For the 72,071 outpatient medication-assisted opioid therapy discharges, the reasons for discharge were:
○ Completed treatment: 12 percent (8,656)○ Transferred to further treatment: 20 percent (14,417)○ Dropped out of treatment: 41 percent (29,667)○ Treatment terminated by the facility: 11 percent (8,229)○ Failed to complete treatment for other reasons: 15 percent (11,102)
Figure 8.1. Reason for discharge from outpatient medication-assisted opioid therapy: 2012Completed
12%
Transferred20%
Dropped out41%
Terminated11%
Other15%
SOURCE: Center for Behavioral Health Statistics and Quality, Substance Abuse and Mental Health Services Administration, Treatment Episode Data Set (TEDS). Data received through 01.23.15.1 Percentages in charts, narrative lists, and percentage distributions in tables may not add to 100 percent due to rounding.2 For employment status and detailed not in labor force, only discharges aged 16 and older are included; for years of education, only discharges aged 18 and older are included.

50
SOURCE: Center for Behavioral Health Statistics and Quality, Substance Abuse and Mental Health Services Administration, Treatment Episode Data Set (TEDS). Data received through 01.23.15.
Socio-Demographic and Substance Use Characteristics at Time of AdmissionTable 1.7. Summary findings of characteristics at time of admission of outpatient medication-assisted opioid therapy discharges aged 12 and older include:
○ Gender: 57 percent of outpatient medication-assisted opioid therapy discharges were male○ Age at admission: 3 percent were 12 to 20 years of age, 33 percent were 21 to 30 years of age,
25 percent were 31 to 40 years of age, 22 percent were 41 to 50 years of age, and 17 percent were over 50 years of age
○ Race/ethnicity: 63 percent were non-Hispanic White, 17 percent were Hispanic, 15 percent were non-Hispanic Black, and 5 percent were of a race/ethnicity other than non-Hispanic White, non-Hispanic Black, or Hispanic
Reason for discharge
All Completed Transferred Dropped out Terminated Other
Med
ian
LOS
(da
ys)
0
50
100
150
200
250
Median Length of Stay (LOS)Table 1.4 and Figure 8.2. The median length of stay (LOS) for outpatient medication-assisted opioid therapy treatment discharges aged 12 and older in 2012 was 201 days. By reason for discharge, the median LOS for outpatient medication-assisted opioid therapy treatment discharges was:
○ Completed treatment: 201 days○ Transferred to further treatment: 129 days○ Dropped out of treatment: 114 days○ Treatment terminated by the facility: 239 days○ Failed to complete treatment for other reasons: 215 days
Figure 8.2. Median length of stay (LOS) in outpatient medication-assisted opioid therapy, by reason for discharge: 2012

51
○ Primary substance: Opiates (95 percent) were the most commonly reported primary substance of abuse at the time of admission, followed by alcohol (2 percent), cocaine and marijuana/ hashish (1 percent each), and stimulants (less than 1 percent)
○ Frequency of use: 66 percent reported daily substance use in the month before treatment entry and 18 percent reported no substance use
○ Number of prior treatment episodes: 78 percent of outpatient medication-assisted opioid therapy discharges had one or more prior treatment episodes, and 22 percent had no prior treat-ment episodes
○ Treatment referral source: 74 percent of outpatient medication-assisted opioid therapy discharges were self- or individual referrals, 21 percent were health care or community referrals, and 5 percent were referred to treatment by a criminal justice/DUI source
○ Employment status: Of all outpatient medication-assisted opioid therapy discharges aged 16 and older, 39 percent were unemployed and 40 percent were not in the labor force at time of admission
○ Years of education: 44 percent of outpatient medication-assisted opioid therapy discharges aged 18 and older had 12 years of education or a GED
Comparison of Outpatient Medication-Assisted Opioid Therapy Discharges to All Discharges on Characteristics at AdmissionTables 1.7 and 1.8a. There were some notable differences in the characteristics at admission of discharges from outpatient medication-assisted opioid therapy treatment compared to the charac-teristics of all discharges combined.
○ Number of prior treatment episodes: 22 percent of outpatient medication-assisted opioid therapy discharges had no prior treatment episodes vs. 40 percent of all discharges
○ Treatment referral source: • 5 percent of outpatient medication-assisted opioid therapy discharges were criminal justice/
DUI referrals vs. 33 percent of all discharges • 74 percent of outpatient medication-assisted opioid therapy discharges were self- or
individual referrals vs. 36 percent of all discharges ○ Detailed not in labor force: 3 percent of outpatient medication-assisted opioid therapy
discharges aged 16 and older were students vs. 12 percent of all discharges ○ Primary substance:
• 1 percent of outpatient medication-assisted opioid therapy discharges reported marijuana as their primary substance of abuse vs. 17 percent of all discharges
• 95 percent of outpatient medication-assisted opioid therapy discharges reported opiates as their primary substance of abuse vs. 26 percent of all discharges
○ Frequency of use: • 66 percent of outpatient medication-assisted opioid therapy discharges reported daily
substance use in the month before treatment entry vs. 40 percent of all discharges
52
• 18 percent of outpatient medication-assisted opioid therapy discharges reported no substance use in the month before treatment entry vs. 29 percent of all discharges
○ Living arrangements: 7 percent of outpatient medication-assisted opioid therapy discharges were homeless vs. 14 percent of all discharges
Comparison of Selected Characteristics at Admission and at Discharge for Outpatient Medication-Assisted Opioid Therapy DischargesTables 1.8a-b. Certain socio-demographic and substance use characteristics were collected at both time of admission and time of discharge. Differences (changes) in status between admission and discharge for outpatient medication-assisted opioid therapy discharges include:
○ Arrests in past 30 days: 95 percent of outpatient medication-assisted opioid therapy discharges reported no arrests in past 30 days at admission vs. 93 percent at discharge
○ Detailed not in labor force: Among outpatient medication-assisted opioid therapy discharges aged 16 and older not in the labor force, 36 percent reported being disabled at admission vs. 35 percent at discharge
○ Employment status: 21 percent of outpatient medication-assisted opioid therapy discharges aged 16 and older were employed at admission vs. 23 percent at discharge
○ Frequency of use: 66 percent of outpatient medication-assisted opioid therapy discharges reported daily substance use in the month before treatment entry vs. 33 percent at discharge
○ Living arrangements: 7 percent of outpatient medication-assisted opioid therapy discharges reported being homeless at admission vs. 6 percent at discharge
○ Self-help programs attended in past 30 days: 79 percent of outpatient medication-assisted opioid therapy discharges reported not attending self-help programs in the past 30 days at admission vs. 80 percent at discharge
Treatment Completion or Transfer to Further Treatment
Completion/Transfer RatesIn this section, “completion/transfer rate” refers to the number of treatment completions or transfers per 100 discharges. To illustrate, the overall rate is calculated as the sum of all treatment completions and transfers divided by all discharges (which includes those who dropped out, were terminated by facility, or did not complete treatment for other reasons) and the resulting number (fraction) is multiplied by 100. Of outpatient medication-assisted opioid therapy treatment discharges aged 12 and older in 2012, the overall percentage that completed treatment or transferred to further treatment (i.e., completion/transfer rate) was 32 percent. Up to three top rates for each characteristic are presented below.
Completion/Transfer Rates for Characteristics at AdmissionTable 8.2. For outpatient medication-assisted opioid therapy discharges in 2012, the completion/transfer rates according to characteristics at admission include:

53
○ Gender: The completion/transfer rate was 36 percent for female discharges and 29 percent for male discharges
○ Age at admission: The completion/transfer rate was 34 percent for discharges 21 to 30 years of age, 33 percent for discharges 31 to 40 years of age, and 32 percent of discharges 12 to 20 years of age
○ Race/ethnicity: The completion/transfer rate was 34 percent for non-Hispanic White discharges; 32 percent for discharges of a race/ethnicity other than non-Hispanic White, non-Hispanic Black, or Hispanic; and 30 percent for non-Hispanic Blacks
○ Number of prior treatment episodes: The completion/transfer rate was 36 percent for those with no prior treatment episodes and 31 percent for discharges with one or more prior treatment episodes
○ Treatment referral source: The completion/transfer rate was 46 percent for discharges who were referred to treatment by a criminal justice/DUI source, 40 percent for health care/ community referrals, and 29 percent for self- or individual referrals
○ Years of education: The completion/transfer rate for ages 18 and older was 36 percent for those with more than 12 years of education, 32 percent for those 12 years of education or a GED, and 29 percent for those with fewer than 12 years of education
Completion/Transfer Rates for Characteristics at Discharge
Table 8.4. For outpatient medication-assisted opioid therapy discharges in 2012, the completion/transfer rates according to characteristics at discharge include:
○ Arrests in past 30 days: The completion/transfer rate was 43 percent for those with 5 arrests in the 30 days before discharge, 39 percent for those who had no arrests in the 30 days before discharge, and 18 percent for those with 2 arrests in the 30 days before discharge
○ Detailed not in labor force: The completion/transfer rate for ages 16 and older was 41 percent for homemakers, 39 percent for students, and 33 percent for inmates of institutions
○ Employment status: The completion/transfer rate for ages 16 and older was 42 percent for discharges who were employed, 36 percent for the unemployed, and 35 percent for those who were not in the labor force
○ Frequency of use: The completion/transfer rate was 50 percent for those who reported no substance use in the 30 days before discharge, 35 percent for those who reported daily substance use, and 33 percent who reported some substance use in the 30 days before discharge
○ Living arrangements: The completion/transfer rate was 48 percent for those who were living dependently, 36 percent for those living independently, and 33 percent for the homeless
○ Primary substance: The completion/transfer rate was 48 percent for those who abused alcohol, 44 percent for those who abused stimulants, and 37 percent for those who abused marijuana/hashish
○ Self-help programs attended in past 30 days: The completion/transfer rate was 65 percent for those who attended self-help programs 16-30 times in the 30 days before discharge, 59 percent for those who attended self-help programs 8-15 times in the 30 days before discharge, and 53 percent for those who attended self-help programs 4-7 times in the 30 days before discharge
54
Median Length of Stay (LOS) of Discharges Completing TreatmentTables 8.2 and 8.4. The overall median LOS among those completing outpatient medication-assisted opioid therapy treatment (excluding those who were transferred to further treatment) was 201 days. Median LOS for selected characteristics at admission and at discharge for outpatient medication-assisted opioid therapy discharges that completed treatment include:
At admission:
From Table 8.2, ○ The median LOS was longest for discharges aged over 50 years (310 days). ○ The median LOS was shortest for who were referred to treatment by a health care or community
source (121 days).
From Table 8.4, ○ The median LOS was longest for those arrested 5 times in the 30 days prior to admissions (343
days). ○ The median LOS shortest for those arrested 4 times in the 30 days prior to admission (40 days).
At discharge:
From Table 8.4, ○ The median LOS was longest for those arrested 5 times in the 30 days prior to discharge (363
days). ○ The median LOS was shortest for those arrested 3 times in the 30 days prior to discharge (36
days).
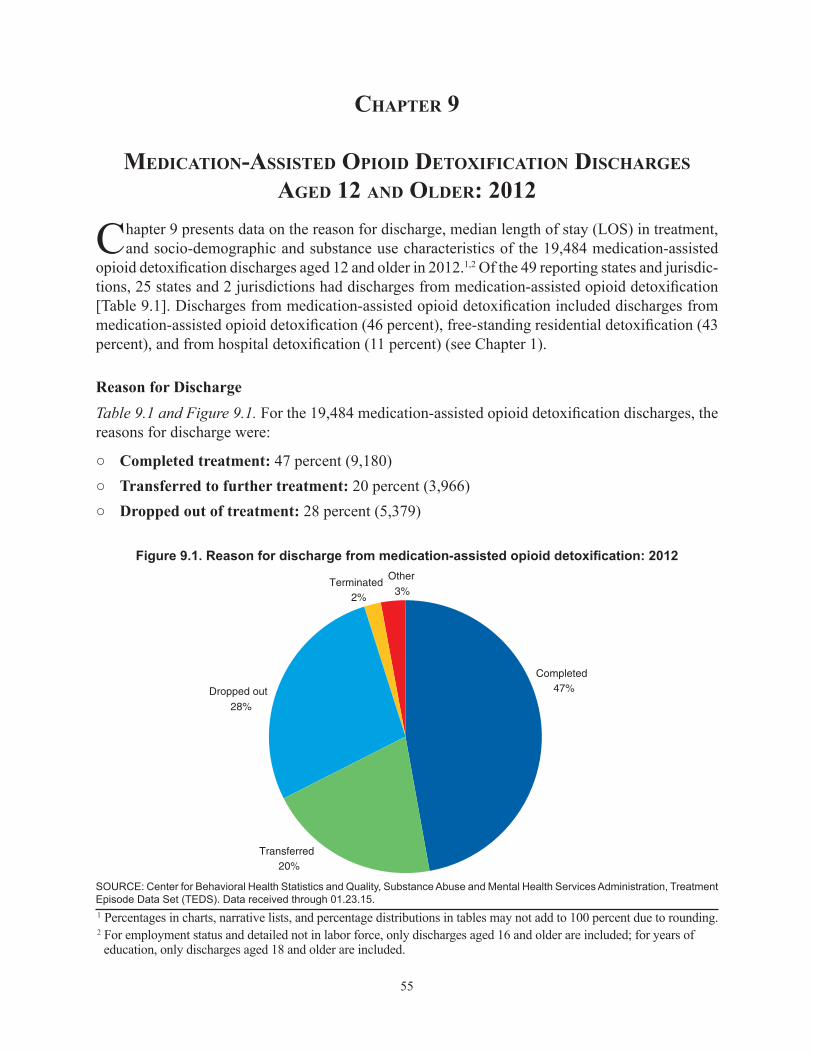
55
CHapter 9
meDiCation-assisteD opioiD DetoxifiCation DisCHarges ageD 12 anD olDer: 2012
Chapter 9 presents data on the reason for discharge, median length of stay (LOS) in treatment, and socio-demographic and substance use characteristics of the 19,484 medication-assisted
opioid detoxification discharges aged 12 and older in 2012.1,2 Of the 49 reporting states and jurisdic-tions, 25 states and 2 jurisdictions had discharges from medication-assisted opioid detoxification [Table 9.1]. Discharges from medication-assisted opioid detoxification included discharges from medication-assisted opioid detoxification (46 percent), free-standing residential detoxification (43 percent), and from hospital detoxification (11 percent) (see Chapter 1).
Reason for DischargeTable 9.1 and Figure 9.1. For the 19,484 medication-assisted opioid detoxification discharges, the reasons for discharge were:
○ Completed treatment: 47 percent (9,180) ○ Transferred to further treatment: 20 percent (3,966) ○ Dropped out of treatment: 28 percent (5,379)
Figure 9.1. Reason for discharge from medication-assisted opioid detoxification: 2012
Completed47%
Transferred20%
Dropped out28%
Terminated2%
Other3%
SOURCE: Center for Behavioral Health Statistics and Quality, Substance Abuse and Mental Health Services Administration, Treatment Episode Data Set (TEDS). Data received through 01.23.15.1 Percentages in charts, narrative lists, and percentage distributions in tables may not add to 100 percent due to rounding.2 For employment status and detailed not in labor force, only discharges aged 16 and older are included; for years of education, only discharges aged 18 and older are included.

56
Reason for discharge
All Completed Transferred Dropped out Terminated Other
Med
ian
LOS
(da
ys)
0
5
10
15
20
○ Treatment terminated by the facility: 2 percent (388) ○ Failed to complete treatment for other reasons: 3 percent (571)
Median Length of Stay (LOS)Table 1.4 and Figure 9.2. The median length of stay (LOS) for medication-assisted opioid detoxification treatment discharges aged 12 and older in 2012 was 6 days. By reason for discharge, the median LOS for medication-assisted opioid detoxification treatment discharges was:
○ Completed treatment: 6 days ○ Transferred to further treatment: 7 days ○ Dropped out of treatment: 11 days ○ Treatment terminated by the facility: 5 days ○ Failed to complete treatment for other reasons: 7 days
Figure 9.2. Median length of stay (LOS) in medication-assisted opioid detoxification, by reason for discharge: 2012
SOURCE: Center for Behavioral Health Statistics and Quality, Substance Abuse and Mental Health Services Administration, Treatment Episode Data Set (TEDS). Data received through 01.23.15.
Socio-Demographic and Substance Use Characteristics at Time of Admission Table 1.7. Summary findings of characteristics at time of admission of medication-assisted opioid detoxification discharges aged 12 and older include:
○ Gender: 67 percent of medication-assisted opioid detoxification discharges were male○ Age at admission: 5 percent were 12 to 20 years of age, 37 percent were 21 to 30 years of age,
23 percent were 31 to 40 years of age, 20 percent were 41 to 50 years of age, and 15 percent were over 50 years of age

57
○ Race/ethnicity: 66 percent were non-Hispanic White, 17 percent were Hispanic, 13 percent were non-Hispanic Black, and 4 percent were of a race/ethnicity other than non-Hispanic White, non-Hispanic Black, or Hispanic
○ Primary substance: Opiates were the most commonly reported primary substance of abuse (89 percent), followed by alcohol (7 percent), other substances (2 percent), cocaine (1 percent), and marijuana/hashish and stimulants (less than 1 percent each)
○ Frequency of use: 87 percent of discharges reported daily substance use, and 2 percent reported no substance use in the month before treatment entry
○ Number of prior treatment episodes: 68 percent of medication-assisted opioid detoxification discharges had one or more prior treatment episodes, and 32 percent had no prior treatment episodes
○ Treatment referral source: 81 percent of discharges were self- or individual referrals, 17 percent were health care or community referrals, and 2 percent were referred to treatment from criminal justice/DUI sources
○ Employment status: Of all medication-assisted opioid detoxification discharges aged 16 and older, 46 percent were unemployed and 36 percent were not in the labor force at time of admission
○ Years of education: 49 percent of medication-assisted opioid detoxification discharges aged 18 and older had 12 years of education or a GED
Comparison of Medication-Assisted Opioid Detoxification Discharges to All Discharges on Characteristics at AdmissionTables 1.7 and 1.8a. There were some notable differences in the characteristics at admission of discharges from medication-assisted opioid detoxification treatment compared to the characteristics of all discharges combined.
○ Number of prior treatment episodes: 32 percent of medication-assisted opioid detoxification discharges had no prior treatment episodes vs. 40 percent of all discharges
○ Treatment referral source: • 2 percent of medication-assisted opioid detoxification discharges were criminal justice/DUI
referrals vs. 33 percent of all discharges • 81 percent of medication-assisted opioid detoxification discharges were self- or individual
referrals vs. 36 percent of all discharges ○ Detailed not in labor force: 3 percent of medication-assisted opioid detoxification discharges
aged 16 and older were students vs. 12 percent of all discharges ○ Employment status: 18 percent of medication-assisted opioid detoxification discharges aged
16 and older were employed vs. 22 percent of all discharges ○ Primary substance:
• Less than 1 percent of medication-assisted opioid detoxification discharges reported mari-juana/hashish as their primary substance of abuse vs. 17 percent of all discharges
58
• 89 percent of medication-assisted opioid detoxification discharges reported opiates as their primary substance of abuse vs. 26 percent of all discharges
○ Frequency of use: • 87 percent of medication-assisted opioid detoxification discharges reported daily substance
use in the month before treatment entry vs. 40 percent of all discharges • 2 percent of medication-assisted opioid detoxification discharges reported no substance use
in the month before treatment entry vs. 29 percent of all discharges
Comparison of Selected Characteristics at Admission and at Discharge for Medication-Assisted Opioid Detoxification DischargesTables 1.8a-b. Certain socio-demographic and substance use characteristics were collected at both time of admission and time of discharge. Differences (changes) in status between admission and discharge for medication-assisted opioid detoxification discharges include:
○ Arrests in past 30 days: 95 percent of medication-assisted opioid detoxification discharges reported no arrests in the past 30 days at admission vs. 97 percent at discharge
○ Detailed not in labor force: Among medication-assisted opioid detoxification discharges aged 16 and older not in labor force, 19 percent reported being disabled at admission vs. 15 percent at discharge
○ Frequency of use: 87 percent of medication-assisted opioid detoxification discharges reported daily substance use in the the past 30 days at admission vs. 26 percent at discharge
○ Living arrangements: 15 percent of medication-assisted opioid detoxification discharges reported being homeless at admission vs. 10 percent at discharge
○ Self-help programs attended in past 30 days: 84 percent of medication-assisted opioid detoxi-fication discharges reported not attending self-help programs in the past 30 days at admission vs. 62 percent at discharge
Treatment Completion or Transfer to Further Treatment
Completion/Transfer RatesIn this section, “completion/transfer rate” refers to the number of treatment completions or transfers per 100 discharges. To illustrate, the overall rate is calculated as the sum of all treatment completions and transfers divided by all discharges (which includes those who dropped out, were terminated by facility, or did not complete treatment for other reasons) and the resulting number (fraction) is multiplied by 100. Of medication-assisted opioid detoxification treatment discharges aged 12 and older in 2012, the overall percentage that completed treatment or transferred to further treatment (i.e., completion/transfer rate) was 67 percent. Up to three top rates for each characteristic are presented below.
Completion/Transfer Rates for Characteristics at AdmissionTable 9.2. For medication-assisted opioid detoxification discharges in 2012, the completion/transfer rates according to characteristics at admission include:

59
○ Gender: The completion/transfer rate was 70 percent for discharges who were male and 66 percent for discharges who were female
○ Age at admission: The completion/transfer rate was 74 percent for discharges 12 to 20 years of age, 68 percent for discharges 21 to 30 years of age, and 67 percent for discharges over 50 years of age
○ Race/ethnicity: The completion/transfer was 79 percent for non-Hispanic Black discharges, 68 percent for non-Hispanic Whites, and 65 percent for discharges of a race/ethnicity other than non-Hispanic White, non-Hispanic Black, or Hispanic
○ Number of prior treatment episodes: The completion/transfer rate was 68 percent for dis-charges with one or more prior treatment episodes and 66 percent for those with no prior treatment episodes
○ Treatment referral source: The completion/transfer rate was 87 percent or discharges who were referred to treatment by a criminal justice/DUI source, 83 percent for health care or community referrals, and 63 percent for discharges with self- or individual referrals
○ Years of education: The completion/transfer rate for ages 18 and older was 73 percent for those with more than 12 years of education, 68 percent for those 12 years of education or a GED, and 60 percent for those with fewer than 12 years of education
Completion/Transfer Rates for Characteristics at Discharge
Table 9.4. For medication-assisted opioid detoxification discharges in 2012, the completion/transfer rates according to characteristics at discharge include:
○ Arrests in past 30 days: The completion/transfer rate was 100 percent for those with 4 arrests in the 30 days before discharge, 86 percent for those who had 3 arrests, and 85 percent for those with no arrests
○ Detailed not in labor force: The completion/transfer rate for ages 16 and older was 91 percent for inmates of institutions, 88 percent for the retired, and 78 percent for students
○ Employment status: The completion/transfer rate for ages 16 and older was 84 percent for discharges who were employed, 82 percent for the unemployed, and 83 percent for those who were not in the labor force
○ Frequency of use: The completion/transfer rate was 94 percent for those who reported some substance use in the 30 days prior to discharge, 82 percent for those who reported daily substance use, and 81 percent for those who reported no substance use
○ Living arrangements: The completion/transfer rate was 93 percent for those who were living dependently, 81 percent for those living independently, and 80 percent for the discharges who were homeless
○ Self-help programs attended in past 30 days: The completion/transfer rate was 89 percent for those who attended self-help programs 8-30 times in the 30 days prior to discharge; 71 percent for those who did not attend any such programs, and 69 percent for those who attended such programs 4-7 times

60
Median Length of Stay (LOS) of Discharges Completing TreatmentTables 9.2 and 9.4. The overall median LOS among those completing medication-assisted opioid detoxification treatment (excluding those who were transferred to further treatment) was 6 days. Median LOS for selected characteristics at admission and at discharge for medication-assisted opioid detoxification discharges that completed treatment include:
At admission:
From Table 9.2, ○ The median LOS was longest for discharges that were of a race/ethnicity other than non-Hispanic
White, non-Hispanic Black, or Hispanic (13 days) ○ The median LOS was shortest for those aged 31 to 50, non-Hispanic Blacks, those who had
one or more prior treatment episodes, those who were self- or individual referrals, or those that had fewer than 12 years of education (5 days each).
From Table 9.4, ○ The median LOS was longest for those who reported no substance use in the month before
treatment entry (20 days). ○ The median LOS was shortest for those arrested 4 times in past 30 days (4 days).
At discharge:
From Table 9.4, ○ The median LOS was longest among discharges arrested 5 times in the 30 days before discharge
(20 days). ○ The median LOS was shortest among discharges arrested 4 times in the 30 days before discharge
(3 days).

61
Tables

62
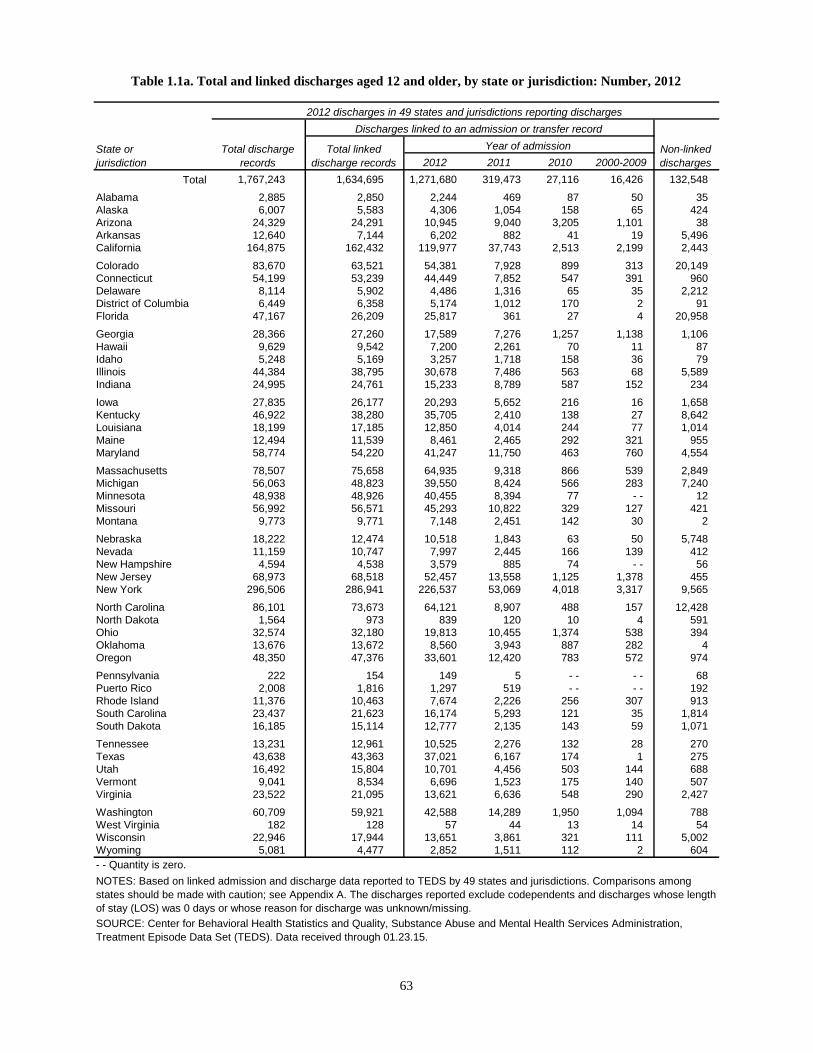
2012 2011 2010 2000-2009
Total 1,767,243 1,634,695 1,271,680 319,473 27,116 16,426 132,548
Alabama 2,885 2,850 2,244 469 87 50 35
Alaska 6,007 5,583 4,306 1,054 158 65 424
Arizona 24,329 24,291 10,945 9,040 3,205 1,101 38
Arkansas 12,640 7,144 6,202 882 41 19 5,496
California 164,875 162,432 119,977 37,743 2,513 2,199 2,443
Colorado 83,670 63,521 54,381 7,928 899 313 20,149
Connecticut 54,199 53,239 44,449 7,852 547 391 960
Delaware 8,114 5,902 4,486 1,316 65 35 2,212
District of Columbia 6,449 6,358 5,174 1,012 170 2 91
Florida 47,167 26,209 25,817 361 27 4 20,958
Georgia 28,366 27,260 17,589 7,276 1,257 1,138 1,106
Hawaii 9,629 9,542 7,200 2,261 70 11 87
Idaho 5,248 5,169 3,257 1,718 158 36 79
Illinois 44,384 38,795 30,678 7,486 563 68 5,589
Indiana 24,995 24,761 15,233 8,789 587 152 234
Iowa 27,835 26,177 20,293 5,652 216 16 1,658
Kentucky 46,922 38,280 35,705 2,410 138 27 8,642
Louisiana 18,199 17,185 12,850 4,014 244 77 1,014
Maine 12,494 11,539 8,461 2,465 292 321 955
Maryland 58,774 54,220 41,247 11,750 463 760 4,554
Massachusetts 78,507 75,658 64,935 9,318 866 539 2,849
Michigan 56,063 48,823 39,550 8,424 566 283 7,240
Minnesota 48,938 48,926 40,455 8,394 77 - - 12
Missouri 56,992 56,571 45,293 10,822 329 127 421
Montana 9,773 9,771 7,148 2,451 142 30 2
Nebraska 18,222 12,474 10,518 1,843 63 50 5,748
Nevada 11,159 10,747 7,997 2,445 166 139 412
New Hampshire 4,594 4,538 3,579 885 74 - - 56
New Jersey 68,973 68,518 52,457 13,558 1,125 1,378 455
New York 296,506 286,941 226,537 53,069 4,018 3,317 9,565
North Carolina 86,101 73,673 64,121 8,907 488 157 12,428
North Dakota 1,564 973 839 120 10 4 591
Ohio 32,574 32,180 19,813 10,455 1,374 538 394
Oklahoma 13,676 13,672 8,560 3,943 887 282 4
Oregon 48,350 47,376 33,601 12,420 783 572 974
Pennsylvania 222 154 149 5 - - - - 68
Puerto Rico 2,008 1,816 1,297 519 - - - - 192
Rhode Island 11,376 10,463 7,674 2,226 256 307 913
South Carolina 23,437 21,623 16,174 5,293 121 35 1,814
South Dakota 16,185 15,114 12,777 2,135 143 59 1,071
Tennessee 13,231 12,961 10,525 2,276 132 28 270
Texas 43,638 43,363 37,021 6,167 174 1 275
Utah 16,492 15,804 10,701 4,456 503 144 688
Vermont 9,041 8,534 6,696 1,523 175 140 507
Virginia 23,522 21,095 13,621 6,636 548 290 2,427
Washington 60,709 59,921 42,588 14,289 1,950 1,094 788
West Virginia 182 128 57 44 13 14 54
Wisconsin 22,946 17,944 13,651 3,861 321 111 5,002
Wyoming 5,081 4,477 2,852 1,511 112 2 604
Table 1.1a. Total and linked discharges aged 12 and older, by state or jurisdiction: Number, 2012
- - Quantity is zero.
SOURCE: Center for Behavioral Health Statistics and Quality, Substance Abuse and Mental Health Services Administration,
Treatment Episode Data Set (TEDS). Data received through 01.23.15.
State or
jurisdiction
2012 discharges in 49 states and jurisdictions reporting discharges
Discharges linked to an admission or transfer record
Year of admissionTotal discharge
records
Total linked
discharge records
Non-linked
discharges
NOTES: Based on linked admission and discharge data reported to TEDS by 49 states and jurisdictions. Comparisons among
states should be made with caution; see Appendix A. The discharges reported exclude codependents and discharges whose length
of stay (LOS) was 0 days or whose reason for discharge was unknown/missing.
63

2012 2011 2010 2000-2009
Total 100.0 92.5 72.0 18.1 1.5 0.9 7.5
Alabama 100.0 98.8 77.8 16.3 3.0 1.7 1.2
Alaska 100.0 92.9 71.7 17.5 2.6 1.1 7.1
Arizona 100.0 99.8 45.0 37.2 13.2 4.5 0.2
Arkansas 100.0 56.5 49.1 7.0 0.3 0.2 43.5
California 100.0 98.5 72.8 22.9 1.5 1.3 1.5
Colorado 100.0 75.9 65.0 9.5 1.1 0.4 24.1
Connecticut 100.0 98.2 82.0 14.5 1.0 0.7 1.8
Delaware 100.0 72.7 55.3 16.2 0.8 0.4 27.3
District of Columbia 100.0 98.6 80.2 15.7 2.6 * 1.4
Florida 100.0 55.6 54.7 0.8 0.1 * 44.4
Georgia 100.0 96.1 62.0 25.7 4.4 4.0 3.9
Hawaii 100.0 99.1 74.8 23.5 0.7 0.1 0.9
Idaho 100.0 98.5 62.1 32.7 3.0 0.7 1.5
Illinois 100.0 87.4 69.1 16.9 1.3 0.2 12.6
Indiana 100.0 99.1 60.9 35.2 2.3 0.6 0.9
Iowa 100.0 94.0 72.9 20.3 0.8 0.1 6.0
Kentucky 100.0 81.6 76.1 5.1 0.3 0.1 18.4
Louisiana 100.0 94.4 70.6 22.1 1.3 0.4 5.6
Maine 100.0 92.4 67.7 19.7 2.3 2.6 7.6
Maryland 100.0 92.3 70.2 20.0 0.8 1.3 7.7
Massachusetts 100.0 96.4 82.7 11.9 1.1 0.7 3.6
Michigan 100.0 87.1 70.5 15.0 1.0 0.5 12.9
Minnesota 100.0 100.0 82.7 17.2 0.2 - - *
Missouri 100.0 99.3 79.5 19.0 0.6 0.2 0.7
Montana 100.0 100.0 73.1 25.1 1.5 0.3 *
Nebraska 100.0 68.5 57.7 10.1 0.3 0.3 31.5
Nevada 100.0 96.3 71.7 21.9 1.5 1.2 3.7
New Hampshire 100.0 98.8 77.9 19.3 1.6 - - 1.2
New Jersey 100.0 99.3 76.1 19.7 1.6 2.0 0.7
New York 100.0 96.8 76.4 17.9 1.4 1.1 3.2
North Carolina 100.0 85.6 74.5 10.3 0.6 0.2 14.4
North Dakota 100.0 62.2 53.6 7.7 0.6 0.3 37.8
Ohio 100.0 98.8 60.8 32.1 4.2 1.7 1.2
Oklahoma 100.0 100.0 62.6 28.8 6.5 2.1 *
Oregon 100.0 98.0 69.5 25.7 1.6 1.2 2.0
Pennsylvania 100.0 69.4 67.1 2.3 - - - - 30.6
Puerto Rico 100.0 90.4 64.6 25.8 - - - - 9.6
Rhode Island 100.0 92.0 67.5 19.6 2.3 2.7 8.0
South Carolina 100.0 92.3 69.0 22.6 0.5 0.1 7.7
South Dakota 100.0 93.4 78.9 13.2 0.9 0.4 6.6
Tennessee 100.0 98.0 79.5 17.2 1.0 0.2 2.0
Texas 100.0 99.4 84.8 14.1 0.4 * 0.6
Utah 100.0 95.8 64.9 27.0 3.0 0.9 4.2
Vermont 100.0 94.4 74.1 16.8 1.9 1.5 5.6
Virginia 100.0 89.7 57.9 28.2 2.3 1.2 10.3
Washington 100.0 98.7 70.2 23.5 3.2 1.8 1.3
West Virginia 100.0 70.3 31.3 24.2 7.1 7.7 29.7
Wisconsin 100.0 78.2 59.5 16.8 1.4 0.5 21.8
Wyoming 100.0 88.1 56.1 29.7 2.2 * 11.9
SOURCE: Center for Behavioral Health Statistics and Quality, Substance Abuse and Mental Health Services Administration,
Treatment Episode Data Set (TEDS). Data received through 01.23.15.
Table 1.1b. Total and linked discharges aged 12 and older, by state and jurisdiction: Percent distribution,
2012
State or
jurisdiction
2012 discharges in 49 states and jurisdictions reporting discharges
Discharges linked to an admission or transfer record
Year of admissionTotal discharge
records
Total linked
discharge records
Non-linked
discharges
NOTES: Based on linked admission and discharge data reported to TEDS by 49 states and jurisdictions. Comparisons among
states should be made with caution; see Appendix A. The discharges reported exclude codependents and discharges whose length
of stay (LOS) was 0 days or whose reason for discharge was unknown/missing. Percentages may not add to 100 percent due to
rounding.Percentages are based on all admissions with known and valid values. Admissions for which values were not collected,
unknown, or missing are excluded from the percentage base (denominator).
- - Quantity is zero; * Less than 0.05 percent.
64

Total Outpatient1
Detox2
Intensive
outpatient1
Short-term
residential1
Long-term
residential1
Hospital
residential1
Med.-asst. opi.
ther./detox3
No. of discharges 1,634,695 703,290 337,160 203,127 165,609 122,467 5,637 97,405
Alabama 2,850 188 32 1,458 539 543 - - 90
Alaska 5,583 2,591 1,663 424 135 678 - - 92
Arizona 24,291 22,247 207 58 848 35 79 817
Arkansas 7,144 2,673 1,595 543 1,719 124 - - 490
California 162,432 79,621 20,695 7,708 1,308 30,051 - - 23,049
Colorado 63,521 17,400 35,570 2,881 4,677 1,759 112 1,122
Connecticut 53,239 14,955 14,461 11,292 2,660 5,030 1,299 3,542
Delaware 5,902 2,815 1,782 407 47 372 - - 479
District of Columbia 6,358 1,776 1,241 711 1,774 99 - - 757
Florida 26,209 4,193 20,514 170 62 1,042 - - 228
Georgia 27,260 17,233 6,824 797 - - 2,406 - - - -
Hawaii 9,542 3,677 1,081 3,100 - - 1,660 - - 24
Idaho 5,169 3,610 24 1,330 90 4 - - 111
Illinois 38,795 20,340 3,358 5,231 6,909 706 - - 2,251
Indiana 24,761 20,844 856 1,819 449 292 102 399
Iowa 26,177 17,653 726 4,116 2,556 699 334 93
Kentucky 38,280 21,496 2,795 7,387 2,483 1,657 - - 2,462
Louisiana 17,185 4,780 786 1,900 6,453 2,860 - - 406
Maine 11,539 3,721 1,273 1,167 568 477 - - 4,333
Maryland 54,220 22,476 4,613 11,101 7,031 3,760 - - 5,239
Massachusetts 75,658 16,060 42,505 - - 4,477 6,135 - - 6,481
Michigan 48,823 24,919 6,578 2,572 5,266 3,357 - - 6,131
Minnesota 48,926 20 - - 25,264 10,018 9,616 1,306 2,702
Missouri 56,571 14,734 7,330 21,232 12,558 - - - - 717
Montana 9,771 5,206 2,504 1,317 125 280 339 - -
Nebraska 12,474 4,299 5,350 678 1,262 651 - - 234
Nevada 10,747 5,416 1,878 1,217 1,956 - - - - 280
New Hampshire 4,538 2,191 264 610 1,068 290 1 114
New Jersey 68,518 20,437 7,268 15,813 6,997 5,437 2 12,564
New York 286,941 124,774 85,260 6,782 37,696 21,287 - - 11,142
North Carolina 73,673 47,273 5,851 10,995 5,176 1,793 1,610 975
North Dakota 973 555 - - 247 98 71 2 - -
Ohio 32,180 20,124 2,421 5,526 45 2,251 - - 1,813
Oklahoma 13,672 8,061 2,021 41 3,227 209 113 - -
Oregon 47,376 29,492 4,958 6,866 - - 4,647 - - 1,413
Pennsylvania 154 11 18 1 7 11 - - 106
Puerto Rico 1,816 1,379 97 76 - - 181 - - 83
Rhode Island 10,463 4,132 1,872 886 776 524 291 1,982
South Carolina 21,623 13,928 3,000 4,153 140 402 - - - -
South Dakota 15,114 3,542 4,271 4,382 1,163 1,648 - - 108
Tennessee 12,961 1,859 1,624 3,771 4,479 1,222 - - 6
Texas 43,363 13,510 9,315 6,887 11,328 1,815 - - 508
Utah 15,804 7,133 3,290 3,231 732 1,072 1 345
Vermont 8,534 4,096 1,228 398 1,870 112 - - 830
Virginia 21,095 16,022 129 381 4,471 62 - - 30
Washington 59,921 18,569 12,277 13,878 9,596 2,756 - - 2,845
West Virginia 128 124 - - 4 - - - - - - - -
Wisconsin 17,944 9,246 5,661 1,090 643 1,256 36 12
Wyoming 4,477 1,889 94 1,229 127 1,128 10 - -
SOURCE: Center for Behavioral Health Statistics and Quality, Substance Abuse and Mental Health Services Administration, Treatment
Episode Data Set (TEDS). Data received through 01.23.15.
- - Quantity is zero.
2 Includes free-standing residential detoxification, hospital detoxification, and outpatient detoxification.
Table 1.2a. Discharges aged 12 and older, by type of service and state or jurisdiction: Number, 2012
State or
jurisdiction
Type of service
1 Excludes discharges where medication-assisted opioid therapy or detoxification was planned.
3 Includes only discharges where medication-assisted opioid therapy or detoxification was planned. May include any service type.
NOTE: Based on linked admission and discharge data reported to TEDS by 49 states and jurisdictions. Comparisons among states
should be made with caution; see Appendix A.
65
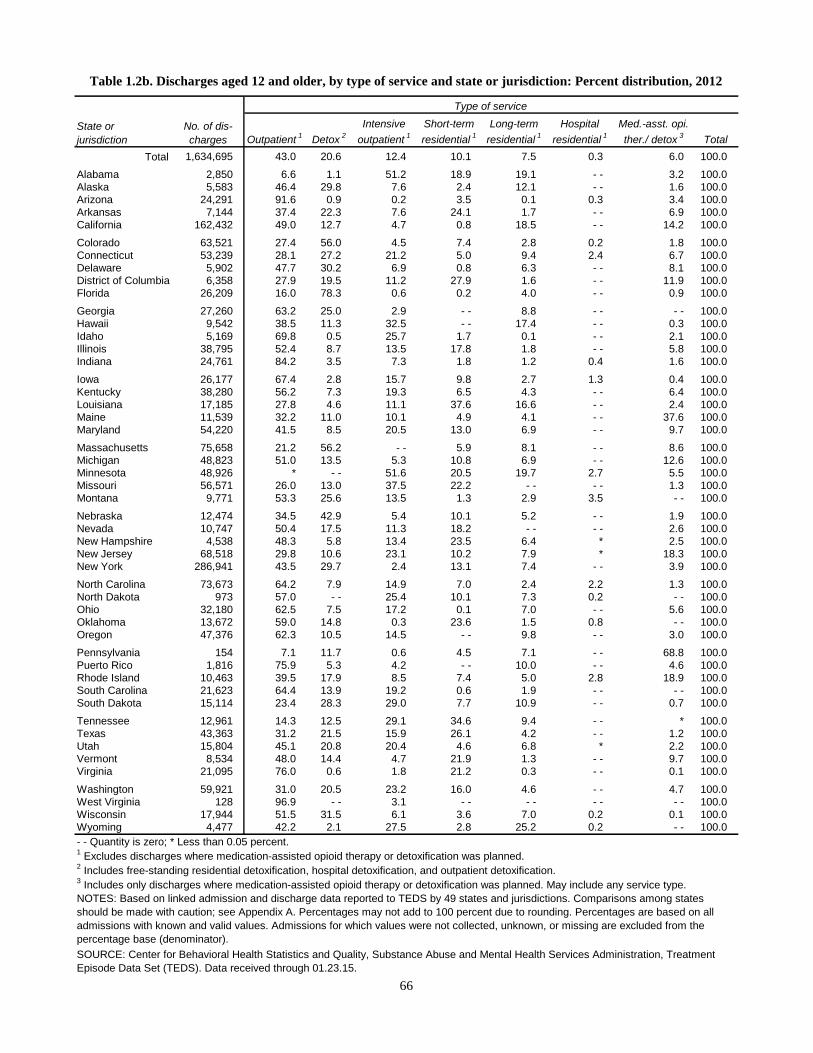
Outpatient1
Detox2
Intensive
outpatient1
Short-term
residential1
Long-term
residential1
Hospital
residential1
Med.-asst. opi.
ther./ detox3
Total
Total 1,634,695 43.0 20.6 12.4 10.1 7.5 0.3 6.0 100.0
Alabama 2,850 6.6 1.1 51.2 18.9 19.1 - - 3.2 100.0
Alaska 5,583 46.4 29.8 7.6 2.4 12.1 - - 1.6 100.0
Arizona 24,291 91.6 0.9 0.2 3.5 0.1 0.3 3.4 100.0
Arkansas 7,144 37.4 22.3 7.6 24.1 1.7 - - 6.9 100.0
California 162,432 49.0 12.7 4.7 0.8 18.5 - - 14.2 100.0
Colorado 63,521 27.4 56.0 4.5 7.4 2.8 0.2 1.8 100.0
Connecticut 53,239 28.1 27.2 21.2 5.0 9.4 2.4 6.7 100.0
Delaware 5,902 47.7 30.2 6.9 0.8 6.3 - - 8.1 100.0
District of Columbia 6,358 27.9 19.5 11.2 27.9 1.6 - - 11.9 100.0
Florida 26,209 16.0 78.3 0.6 0.2 4.0 - - 0.9 100.0
Georgia 27,260 63.2 25.0 2.9 - - 8.8 - - - - 100.0
Hawaii 9,542 38.5 11.3 32.5 - - 17.4 - - 0.3 100.0
Idaho 5,169 69.8 0.5 25.7 1.7 0.1 - - 2.1 100.0
Illinois 38,795 52.4 8.7 13.5 17.8 1.8 - - 5.8 100.0
Indiana 24,761 84.2 3.5 7.3 1.8 1.2 0.4 1.6 100.0
Iowa 26,177 67.4 2.8 15.7 9.8 2.7 1.3 0.4 100.0
Kentucky 38,280 56.2 7.3 19.3 6.5 4.3 - - 6.4 100.0
Louisiana 17,185 27.8 4.6 11.1 37.6 16.6 - - 2.4 100.0
Maine 11,539 32.2 11.0 10.1 4.9 4.1 - - 37.6 100.0
Maryland 54,220 41.5 8.5 20.5 13.0 6.9 - - 9.7 100.0
Massachusetts 75,658 21.2 56.2 - - 5.9 8.1 - - 8.6 100.0
Michigan 48,823 51.0 13.5 5.3 10.8 6.9 - - 12.6 100.0
Minnesota 48,926 * - - 51.6 20.5 19.7 2.7 5.5 100.0
Missouri 56,571 26.0 13.0 37.5 22.2 - - - - 1.3 100.0
Montana 9,771 53.3 25.6 13.5 1.3 2.9 3.5 - - 100.0
Nebraska 12,474 34.5 42.9 5.4 10.1 5.2 - - 1.9 100.0
Nevada 10,747 50.4 17.5 11.3 18.2 - - - - 2.6 100.0
New Hampshire 4,538 48.3 5.8 13.4 23.5 6.4 * 2.5 100.0
New Jersey 68,518 29.8 10.6 23.1 10.2 7.9 * 18.3 100.0
New York 286,941 43.5 29.7 2.4 13.1 7.4 - - 3.9 100.0
North Carolina 73,673 64.2 7.9 14.9 7.0 2.4 2.2 1.3 100.0
North Dakota 973 57.0 - - 25.4 10.1 7.3 0.2 - - 100.0
Ohio 32,180 62.5 7.5 17.2 0.1 7.0 - - 5.6 100.0
Oklahoma 13,672 59.0 14.8 0.3 23.6 1.5 0.8 - - 100.0
Oregon 47,376 62.3 10.5 14.5 - - 9.8 - - 3.0 100.0
Pennsylvania 154 7.1 11.7 0.6 4.5 7.1 - - 68.8 100.0
Puerto Rico 1,816 75.9 5.3 4.2 - - 10.0 - - 4.6 100.0
Rhode Island 10,463 39.5 17.9 8.5 7.4 5.0 2.8 18.9 100.0
South Carolina 21,623 64.4 13.9 19.2 0.6 1.9 - - - - 100.0
South Dakota 15,114 23.4 28.3 29.0 7.7 10.9 - - 0.7 100.0
Tennessee 12,961 14.3 12.5 29.1 34.6 9.4 - - * 100.0
Texas 43,363 31.2 21.5 15.9 26.1 4.2 - - 1.2 100.0
Utah 15,804 45.1 20.8 20.4 4.6 6.8 * 2.2 100.0
Vermont 8,534 48.0 14.4 4.7 21.9 1.3 - - 9.7 100.0
Virginia 21,095 76.0 0.6 1.8 21.2 0.3 - - 0.1 100.0
Washington 59,921 31.0 20.5 23.2 16.0 4.6 - - 4.7 100.0
West Virginia 128 96.9 - - 3.1 - - - - - - - - 100.0
Wisconsin 17,944 51.5 31.5 6.1 3.6 7.0 0.2 0.1 100.0
Wyoming 4,477 42.2 2.1 27.5 2.8 25.2 0.2 - - 100.0
Table 1.2b. Discharges aged 12 and older, by type of service and state or jurisdiction: Percent distribution, 2012
Type of service
1 Excludes discharges where medication-assisted opioid therapy or detoxification was planned.
2 Includes free-standing residential detoxification, hospital detoxification, and outpatient detoxification.
- - Quantity is zero; * Less than 0.05 percent.
NOTES: Based on linked admission and discharge data reported to TEDS by 49 states and jurisdictions. Comparisons among states
should be made with caution; see Appendix A. Percentages may not add to 100 percent due to rounding. Percentages are based on all
admissions with known and valid values. Admissions for which values were not collected, unknown, or missing are excluded from the
percentage base (denominator).
No. of dis-
charges
State or
jurisdiction
3 Includes only discharges where medication-assisted opioid therapy or detoxification was planned. May include any service type.
SOURCE: Center for Behavioral Health Statistics and Quality, Substance Abuse and Mental Health Services Administration, Treatment
Episode Data Set (TEDS). Data received through 01.23.15.
66

Total
Com-
pleted
Trans-
ferred
Dropped
out
Termi-
nated
Incar-
cerated Death Other
No. of discharges 1,634,695 731,573 243,528 423,357 117,355 36,070 3,018 79,794
Alabama 2,850 1,286 170 678 321 53 9 333
Alaska 5,583 2,850 345 1,108 715 163 5 397
Arizona 24,291 6,576 154 13,531 - - 645 151 3,234
Arkansas 7,144 3,694 786 1,633 844 84 6 97
California 162,432 62,363 40,749 55,716 - - 3,199 405 - -
Colorado 63,521 48,370 3,086 4,285 3,642 1,657 56 2,425
Connecticut 53,239 27,809 7,640 10,034 3,513 1,044 76 3,123
Delaware 5,902 2,733 460 855 1,140 203 10 501
District of Columbia 6,358 3,628 573 - - 608 86 23 1,440
Florida 26,209 17,838 2,873 4,911 225 140 8 214
Georgia 27,260 9,436 2,018 8,142 2,118 582 122 4,842
Hawaii 9,542 3,118 3,575 1,638 1,028 180 3 - -
Idaho 5,169 2,329 8 1,380 391 520 13 528
Illinois 38,795 13,796 8,076 12,915 3,246 713 49 - -
Indiana 24,761 8,712 372 10,129 3,943 571 54 980
Iowa 26,177 14,254 1,266 7,829 1,399 965 35 429
Kentucky 38,280 6,140 26,894 3,001 510 172 60 1,503
Louisiana 17,185 3,447 6,419 5,271 1,232 155 3 658
Maine 11,539 5,444 - - 3,532 1,429 390 27 717
Maryland 54,220 23,791 8,281 15,815 4,643 1,340 127 223
Massachusetts 75,658 45,763 1,490 16,962 4,750 511 113 6,069
Michigan 48,823 14,363 11,153 14,029 2,577 1,167 93 5,441
Minnesota 48,926 27,456 3,476 10,778 4,163 676 51 2,326
Missouri 56,571 15,185 25,315 10,783 3,657 863 76 692
Montana 9,771 4,981 1,606 2,187 400 - - - - 597
Nebraska 12,474 7,074 459 3,054 413 186 15 1,273
Nevada 10,747 3,548 713 1,903 1,095 413 12 3,063
New Hampshire 4,538 2,044 429 87 405 85 - - 1,488
New Jersey 68,518 36,445 475 16,896 3,726 1,710 155 9,111
New York 286,941 142,086 16,267 86,199 27,693 8,091 634 5,971
North Carolina 73,673 18,402 28,077 23,050 200 - - 52 3,892
North Dakota 973 409 36 295 115 28 1 89
Ohio 32,180 11,926 2,344 7,533 6,475 987 88 2,827
Oklahoma 13,672 7,080 1,057 4,127 675 338 20 375
Oregon 47,376 23,760 4,987 10,943 4,470 868 93 2,255
Pennsylvania 154 51 31 33 24 10 3 2
Puerto Rico 1,816 1,269 68 288 42 33 8 108
Rhode Island 10,463 4,229 1,724 2,594 1,626 241 49 - -
South Carolina 21,623 10,651 2,922 4,527 2,792 333 27 371
South Dakota 15,114 9,728 2,381 1,400 640 487 14 464
Tennessee 12,961 7,200 359 3,127 1,792 174 3 306
Texas 43,363 24,846 2,944 7,017 4,974 693 8 2,881
Utah 15,804 6,329 3,208 3,773 2,087 383 24 - -
Vermont 8,534 2,725 1,720 2,693 567 202 20 607
Virginia 21,095 3 70 9,831 4,167 3,064 4 3,956
Washington 59,921 23,694 13,789 12,266 5,637 1,007 138 3,390
West Virginia 128 - - - - 102 23 1 1 1
Wisconsin 17,944 10,977 2,323 2,730 1,024 449 62 379
Wyoming 4,477 1,735 360 1,747 199 208 12 216
Table 1.3a. Discharges aged 12 and older, by reason for discharge and state or jurisdiction: Number, 2012
SOURCE: Center for Behavioral Health Statistics and Quality, Substance Abuse and Mental Health Services Administration,
Treatment Episode Data Set (TEDS). Data received through 01.23.15.
- - Quantity is zero.
State or
jurisdiction
Reason for discharge
NOTE: Based on linked admission and discharge data reported to TEDS by 49 states and jurisdictions. Comparisons among
states should be made with caution; see Appendix A.
67

Com-
pleted
Trans-
ferred
Dropped
out
Termi-
nated
Incar-
cerated Death Other Total
Total 1,634,695 44.8 14.9 25.9 7.2 2.2 0.2 4.9 100.0
Alabama 2,850 45.1 6.0 23.8 11.3 1.9 0.3 11.7 100.0
Alaska 5,583 51.0 6.2 19.8 12.8 2.9 0.1 7.1 100.0
Arizona 24,291 27.1 0.6 55.7 - - 2.7 0.6 13.3 100.0
Arkansas 7,144 51.7 11.0 22.9 11.8 1.2 0.1 1.4 100.0
California 162,432 38.4 25.1 34.3 - - 2.0 0.2 - - 100.0
Colorado 63,521 76.1 4.9 6.7 5.7 2.6 0.1 3.8 100.0
Connecticut 53,239 52.2 14.4 18.8 6.6 2.0 0.1 5.9 100.0
Delaware 5,902 46.3 7.8 14.5 19.3 3.4 0.2 8.5 100.0
District of Columbia 6,358 57.1 9.0 - - 9.6 1.4 0.4 22.6 100.0
Florida 26,209 68.1 11.0 18.7 0.9 0.5 * 0.8 100.0
Georgia 27,260 34.6 7.4 29.9 7.8 2.1 0.4 17.8 100.0
Hawaii 9,542 32.7 37.5 17.2 10.8 1.9 * - - 100.0
Idaho 5,169 45.1 0.2 26.7 7.6 10.1 0.3 10.2 100.0
Illinois 38,795 35.6 20.8 33.3 8.4 1.8 0.1 - - 100.0
Indiana 24,761 35.2 1.5 40.9 15.9 2.3 0.2 4.0 100.0
Iowa 26,177 54.5 4.8 29.9 5.3 3.7 0.1 1.6 100.0
Kentucky 38,280 16.0 70.3 7.8 1.3 0.4 0.2 3.9 100.0
Louisiana 17,185 20.1 37.4 30.7 7.2 0.9 * 3.8 100.0
Maine 11,539 47.2 - - 30.6 12.4 3.4 0.2 6.2 100.0
Maryland 54,220 43.9 15.3 29.2 8.6 2.5 0.2 0.4 100.0
Massachusetts 75,658 60.5 2.0 22.4 6.3 0.7 0.1 8.0 100.0
Michigan 48,823 29.4 22.8 28.7 5.3 2.4 0.2 11.1 100.0
Minnesota 48,926 56.1 7.1 22.0 8.5 1.4 0.1 4.8 100.0
Missouri 56,571 26.8 44.7 19.1 6.5 1.5 0.1 1.2 100.0
Montana 9,771 51.0 16.4 22.4 4.1 - - - - 6.1 100.0
Nebraska 12,474 56.7 3.7 24.5 3.3 1.5 0.1 10.2 100.0
Nevada 10,747 33.0 6.6 17.7 10.2 3.8 0.1 28.5 100.0
New Hampshire 4,538 45.0 9.5 1.9 8.9 1.9 - - 32.8 100.0
New Jersey 68,518 53.2 0.7 24.7 5.4 2.5 0.2 13.3 100.0
New York 286,941 49.5 5.7 30.0 9.7 2.8 0.2 2.1 100.0
North Carolina 73,673 25.0 38.1 31.3 0.3 - - 0.1 5.3 100.0
North Dakota 973 42.0 3.7 30.3 11.8 2.9 0.1 9.1 100.0
Ohio 32,180 37.1 7.3 23.4 20.1 3.1 0.3 8.8 100.0
Oklahoma 13,672 51.8 7.7 30.2 4.9 2.5 0.1 2.7 100.0
Oregon 47,376 50.2 10.5 23.1 9.4 1.8 0.2 4.8 100.0
Pennsylvania 154 33.1 20.1 21.4 15.6 6.5 1.9 1.3 100.0
Puerto Rico 1,816 69.9 3.7 15.9 2.3 1.8 0.4 5.9 100.0
Rhode Island 10,463 40.4 16.5 24.8 15.5 2.3 0.5 - - 100.0
South Carolina 21,623 49.3 13.5 20.9 12.9 1.5 0.1 1.7 100.0
South Dakota 15,114 64.4 15.8 9.3 4.2 3.2 0.1 3.1 100.0
Tennessee 12,961 55.6 2.8 24.1 13.8 1.3 * 2.4 100.0
Texas 43,363 57.3 6.8 16.2 11.5 1.6 * 6.6 100.0
Utah 15,804 40.0 20.3 23.9 13.2 2.4 0.2 - - 100.0
Vermont 8,534 31.9 20.2 31.6 6.6 2.4 0.2 7.1 100.0
Virginia 21,095 * 0.3 46.6 19.8 14.5 * 18.8 100.0
Washington 59,921 39.5 23.0 20.5 9.4 1.7 0.2 5.7 100.0
West Virginia 128 - - - - 79.7 18.0 0.8 0.8 0.8 100.0
Wisconsin 17,944 61.2 12.9 15.2 5.7 2.5 0.3 2.1 100.0
Wyoming 4,477 38.8 8.0 39.0 4.4 4.6 0.3 4.8 100.0
Table 1.3b. Discharges aged 12 and older, by reason for discharge and state or jurisdiction: Percent
distribution, 2012
SOURCE: Center for Behavioral Health Statistics and Quality, Substance Abuse and Mental Health Services
Administration, Treatment Episode Data Set (TEDS). Data received through 01.23.15.
State or
jurisdiction
Reason for discharge
- - Quantity is zero; * Less than 0.05 percent.
No. of dis-
charges
NOTES: Based on linked admission and discharge data reported to TEDS by 49 states and jurisdictions. Comparisons
among states should be made with caution; see Appendix A. Percentages may not add to 100 percent due to rounding.
Percentages are based on all admissions with known and valid values. Admissions for which values were not collected,
unknown, or missing are excluded from the percentage base (denominator).
68
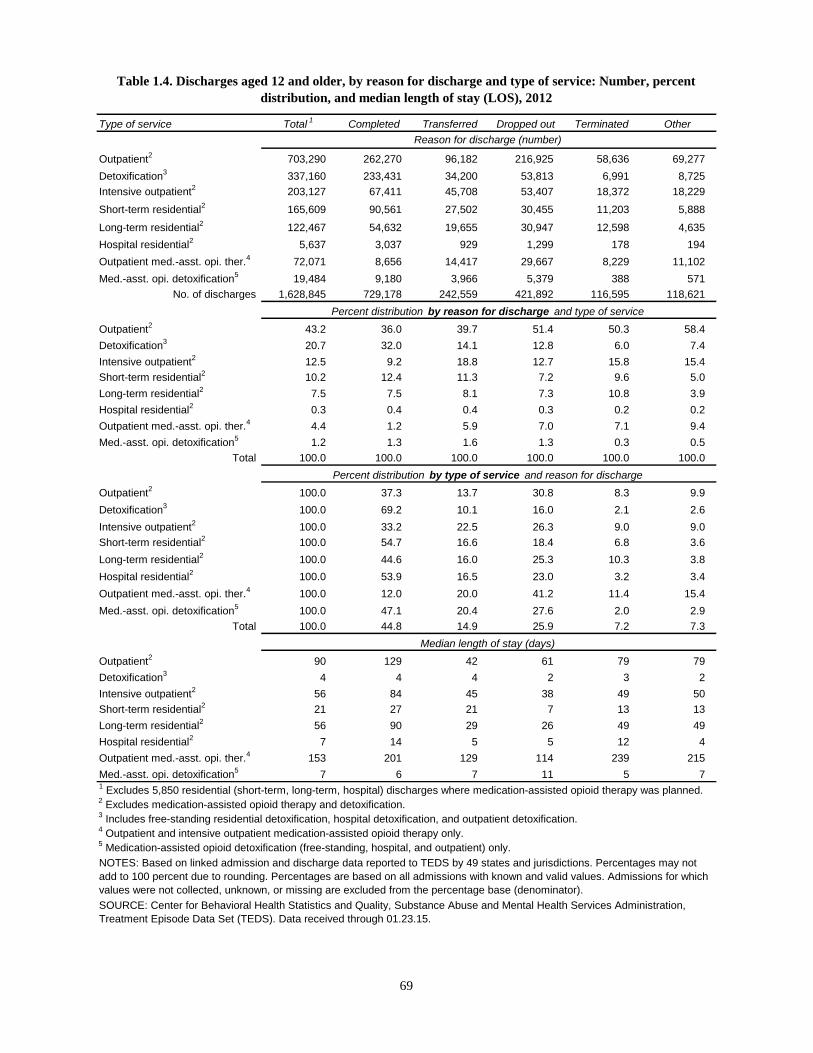
Type of service Total1
Completed Transferred Dropped out Terminated Other
Outpatient2
703,290 262,270 96,182 216,925 58,636 69,277
Detoxification3
337,160 233,431 34,200 53,813 6,991 8,725
Intensive outpatient2
203,127 67,411 45,708 53,407 18,372 18,229
Short-term residential2
165,609 90,561 27,502 30,455 11,203 5,888
Long-term residential2
122,467 54,632 19,655 30,947 12,598 4,635
Hospital residential2
5,637 3,037 929 1,299 178 194
Outpatient med.-asst. opi. ther.4
72,071 8,656 14,417 29,667 8,229 11,102
Med.-asst. opi. detoxification5
19,484 9,180 3,966 5,379 388 571
No. of discharges. 1,628,845 729,178 242,559 421,892 116,595 118,621
Outpatient2
43.2 36.0 39.7 51.4 50.3 58.4
Detoxification3
20.7 32.0 14.1 12.8 6.0 7.4
Intensive outpatient2
12.5 9.2 18.8 12.7 15.8 15.4
Short-term residential2
10.2 12.4 11.3 7.2 9.6 5.0
Long-term residential2
7.5 7.5 8.1 7.3 10.8 3.9
Hospital residential2
0.3 0.4 0.4 0.3 0.2 0.2
Outpatient med.-asst. opi. ther.4
4.4 1.2 5.9 7.0 7.1 9.4
Med.-asst. opi. detoxification5
1.2 1.3 1.6 1.3 0.3 0.5
Total. 100.0 100.0 100.0 100.0 100.0 100.0
Outpatient2
100.0 37.3 13.7 30.8 8.3 9.9
Detoxification3
100.0 69.2 10.1 16.0 2.1 2.6
Intensive outpatient2
100.0 33.2 22.5 26.3 9.0 9.0
Short-term residential2
100.0 54.7 16.6 18.4 6.8 3.6
Long-term residential2
100.0 44.6 16.0 25.3 10.3 3.8
Hospital residential2
100.0 53.9 16.5 23.0 3.2 3.4
Outpatient med.-asst. opi. ther.4
100.0 12.0 20.0 41.2 11.4 15.4
Med.-asst. opi. detoxification5
100.0 47.1 20.4 27.6 2.0 2.9
Total. 100.0 44.8 14.9 25.9 7.2 7.3
Outpatient2
90 129 42 61 79 79
Detoxification3
4 4 4 2 3 2
Intensive outpatient2
56 84 45 38 49 50
Short-term residential2
21 27 21 7 13 13
Long-term residential2
56 90 29 26 49 49
Hospital residential2
7 14 5 5 12 4
Outpatient med.-asst. opi. ther.4
153 201 129 114 239 215
Med.-asst. opi. detoxification5
7 6 7 11 5 7
Table 1.4. Discharges aged 12 and older, by reason for discharge and type of service: Number, percent
distribution, and median length of stay (LOS), 2012
Percent distribution by reason for discharge and type of service
SOURCE: Center for Behavioral Health Statistics and Quality, Substance Abuse and Mental Health Services Administration,
Treatment Episode Data Set (TEDS). Data received through 01.23.15.
Reason for discharge (number)
Percent distribution by type of service and reason for discharge
Median length of stay (days)
2 Excludes medication-assisted opioid therapy and detoxification.
NOTES: Based on linked admission and discharge data reported to TEDS by 49 states and jurisdictions. Percentages may not
add to 100 percent due to rounding. Percentages are based on all admissions with known and valid values. Admissions for which
values were not collected, unknown, or missing are excluded from the percentage base (denominator).
3 Includes free-standing residential detoxification, hospital detoxification, and outpatient detoxification.
5 Medication-assisted opioid detoxification (free-standing, hospital, and outpatient) only.
1 Excludes 5,850 residential (short-term, long-term, hospital) discharges where medication-assisted opioid therapy was planned.
4 Outpatient and intensive outpatient medication-assisted opioid therapy only.
69
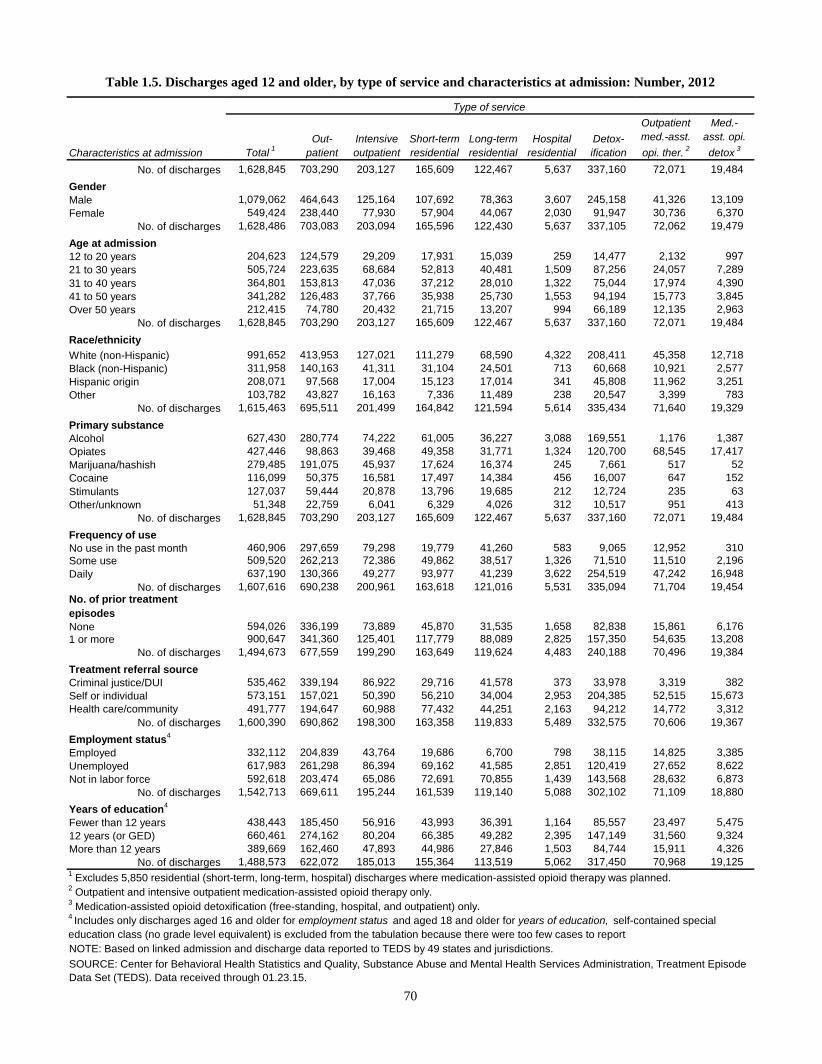
Total1
Out-
patient
Intensive
outpatient
Short-term
residential
Long-term
residential
Hospital
residential
Detox-
ification
Outpatient
med.-asst.
opi. ther.2
Med.-
asst. opi.
detox3
No. of discharges 1,628,845 703,290 203,127 165,609 122,467 5,637 337,160 72,071 19,484
Gender
Male 1,079,062 464,643 125,164 107,692 78,363 3,607 245,158 41,326 13,109
Female 549,424 238,440 77,930 57,904 44,067 2,030 91,947 30,736 6,370
No. of discharges 1,628,486 703,083 203,094 165,596 122,430 5,637 337,105 72,062 19,479
Age at admission
12 to 20 years 204,623 124,579 29,209 17,931 15,039 259 14,477 2,132 997
21 to 30 years 505,724 223,635 68,684 52,813 40,481 1,509 87,256 24,057 7,289
31 to 40 years 364,801 153,813 47,036 37,212 28,010 1,322 75,044 17,974 4,390
41 to 50 years 341,282 126,483 37,766 35,938 25,730 1,553 94,194 15,773 3,845
Over 50 years 212,415 74,780 20,432 21,715 13,207 994 66,189 12,135 2,963
No. of discharges 1,628,845 703,290 203,127 165,609 122,467 5,637 337,160 72,071 19,484
Race/ethnicity
White (non-Hispanic) 991,652 413,953 127,021 111,279 68,590 4,322 208,411 45,358 12,718
Black (non-Hispanic) 311,958 140,163 41,311 31,104 24,501 713 60,668 10,921 2,577
Hispanic origin 208,071 97,568 17,004 15,123 17,014 341 45,808 11,962 3,251
Other 103,782 43,827 16,163 7,336 11,489 238 20,547 3,399 783
No. of discharges 1,615,463 695,511 201,499 164,842 121,594 5,614 335,434 71,640 19,329
Primary substance
Alcohol 627,430 280,774 74,222 61,005 36,227 3,088 169,551 1,176 1,387
Opiates 427,446 98,863 39,468 49,358 31,771 1,324 120,700 68,545 17,417
Marijuana/hashish 279,485 191,075 45,937 17,624 16,374 245 7,661 517 52
Cocaine 116,099 50,375 16,581 17,497 14,384 456 16,007 647 152
Stimulants 127,037 59,444 20,878 13,796 19,685 212 12,724 235 63
Other/unknown 51,348 22,759 6,041 6,329 4,026 312 10,517 951 413
No. of discharges 1,628,845 703,290 203,127 165,609 122,467 5,637 337,160 72,071 19,484
Frequency of use
No use in the past month 460,906 297,659 79,298 19,779 41,260 583 9,065 12,952 310
Some use 509,520 262,213 72,386 49,862 38,517 1,326 71,510 11,510 2,196
Daily 637,190 130,366 49,277 93,977 41,239 3,622 254,519 47,242 16,948
No. of discharges 1,607,616 690,238 200,961 163,618 121,016 5,531 335,094 71,704 19,454No. of prior treatment
episodes
None 594,026 336,199 73,889 45,870 31,535 1,658 82,838 15,861 6,176
1 or more 900,647 341,360 125,401 117,779 88,089 2,825 157,350 54,635 13,208
No. of discharges 1,494,673 677,559 199,290 163,649 119,624 4,483 240,188 70,496 19,384
Treatment referral source
Criminal justice/DUI 535,462 339,194 86,922 29,716 41,578 373 33,978 3,319 382
Self or individual 573,151 157,021 50,390 56,210 34,004 2,953 204,385 52,515 15,673
Health care/community 491,777 194,647 60,988 77,432 44,251 2,163 94,212 14,772 3,312
No. of discharges 1,600,390 690,862 198,300 163,358 119,833 5,489 332,575 70,606 19,367
Employment status4
Employed 332,112 204,839 43,764 19,686 6,700 798 38,115 14,825 3,385
Unemployed 617,983 261,298 86,394 69,162 41,585 2,851 120,419 27,652 8,622
Not in labor force 592,618 203,474 65,086 72,691 70,855 1,439 143,568 28,632 6,873
No. of discharges 1,542,713 669,611 195,244 161,539 119,140 5,088 302,102 71,109 18,880
Years of education4
Fewer than 12 years 438,443 185,450 56,916 43,993 36,391 1,164 85,557 23,497 5,475
12 years (or GED) 660,461 274,162 80,204 66,385 49,282 2,395 147,149 31,560 9,324
More than 12 years 389,669 162,460 47,893 44,986 27,846 1,503 84,744 15,911 4,326
No. of discharges 1,488,573 622,072 185,013 155,364 113,519 5,062 317,450 70,968 19,125
Table 1.5. Discharges aged 12 and older, by type of service and characteristics at admission: Number, 2012
3 Medication-assisted opioid detoxification (free-standing, hospital, and outpatient) only.
SOURCE: Center for Behavioral Health Statistics and Quality, Substance Abuse and Mental Health Services Administration, Treatment Episode
Data Set (TEDS). Data received through 01.23.15.
Type of service
Characteristics at admission
1 Excludes 5,850 residential (short-term, long-term, hospital) discharges where medication-assisted opioid therapy was planned.
2 Outpatient and intensive outpatient medication-assisted opioid therapy only.
4 Includes only discharges aged 16 and older for employment status and aged 18 and older for years of education, self-contained special
education class (no grade level equivalent) is excluded from the tabulation because there were too few cases to report
NOTE: Based on linked admission and discharge data reported to TEDS by 49 states and jurisdictions.
70

Total1
Out-
patient
Intensive
outpatient
Short-term
residential
Long-term
residential
Hospital
residential
Detox-
ification
Outpatient
med.-asst.
opi. ther.2
Med.-
asst. opi.
detox3
No. of discharges 1,628,845 703,290 203,127 165,609 122,467 5,637 337,160 72,071 19,484
Arrests in past 30 days
0 1,384,012 640,901 184,011 141,757 108,035 4,831 222,851 63,171 18,455
1 109,719 49,216 15,791 16,594 12,305 255 11,930 2,802 826
2 8,661 3,316 1,082 1,427 1,068 22 1,407 245 94
3 2,339 1,036 307 311 217 12 366 61 29
4 972 444 140 120 87 5 144 24 8
5 616 270 110 61 50 2 91 22 10
6 to 96 2,809 1,415 508 267 243 8 248 106 14
No. of discharges 1,509,128 696,598 201,949 160,537 122,005 5,135 237,037 66,431 19,436
Detailed not in labor force4
Homemaker 13,496 7,475 2,398 978 564 42 1,071 924 44
Student 57,755 35,227 8,842 5,245 5,187 71 2,528 557 98
Retired 11,397 4,847 1,369 1,364 355 97 3,035 292 38
Disabled 115,552 45,035 14,603 14,964 5,633 522 26,580 7,490 725
Inmate of institution 31,679 10,274 7,944 3,712 7,402 134 1,871 337 5
Other 267,300 61,851 24,400 45,232 28,666 572 92,496 11,211 2,872
No. of discharges 497,179 164,709 59,556 71,495 47,807 1,438 127,581 20,811 3,782
Employment status4
Employed 332,112 204,839 43,764 19,686 6,700 798 38,115 14,825 3,385
Unemployed 617,983 261,298 86,394 69,162 41,585 2,851 120,419 27,652 8,622
Not in labor force 592,618 203,474 65,086 72,691 70,855 1,439 143,568 28,632 6,873
No. of discharges 1,542,713 669,611 195,244 161,539 119,140 5,088 302,102 71,109 18,880
Frequency of use
No use in the past month 460,906 297,659 79,298 19,779 41,260 583 9,065 12,952 310
Some use 509,520 262,213 72,386 49,862 38,517 1,326 71,510 11,510 2,196
Daily use 637,190 130,366 49,277 93,977 41,239 3,622 254,519 47,242 16,948
No. of discharges 1,607,616 690,238 200,961 163,618 121,016 5,531 335,094 71,704 19,454
Living arrangements
Homeless 222,549 37,978 13,658 29,206 31,957 836 101,108 4,817 2,989
Dependent living 332,673 149,874 52,450 35,569 44,897 305 35,827 10,278 3,473
Independent living 1,048,153 507,484 134,649 97,938 44,557 3,987 190,326 56,271 12,941
No. of discharges 1,603,375 695,336 200,757 162,713 121,411 5,128 327,261 71,366 19,403
Primary substance
Alcohol 627,430 280,774 74,222 61,005 36,227 3,088 169,551 1,176 1,387
Opiates 427,446 98,863 39,468 49,358 31,771 1,324 120,700 68,545 17,417
Marijuana/hashish 279,485 191,075 45,937 17,624 16,374 245 7,661 517 52
Cocaine 116,099 50,375 16,581 17,497 14,384 456 16,007 647 152
Stimulants 127,037 59,444 20,878 13,796 19,685 212 12,724 235 63
Other/unknown 51,348 22,759 6,041 6,329 4,026 312 10,517 951 413
No. of discharges 1,628,845 703,290 203,127 165,609 122,467 5,637 337,160 72,071 19,484
Self-help programs attended
in past 30 days
No attend. in the past month 856,444 405,392 109,828 98,865 45,148 3,939 158,306 29,034 5,932
At least 1 time in the past month 293,987 119,582 50,144 45,338 33,277 923 35,827 7,748 1,148
1-3 times in past month 68,900 23,660 13,584 11,191 5,496 339 11,747 2,501 382
4-7 times in past month 51,037 20,005 10,259 7,174 4,514 141 7,281 1,352 311
8-15 times in past month 50,116 19,640 11,087 5,844 5,767 73 6,227 1,267 211
16-30 times in past month 54,249 22,112 9,338 7,305 7,543 265 6,339 1,207 140
Some attendance, but
frequency unknown 69,685 34,165 5,876 13,824 9,957 105 4,233 1,421 104
No. of discharges 1,150,431 524,974 159,972 144,203 78,425 4,862 194,133 36,782 7,080
Table 1.6a. Discharges aged 12 and older, by type of service and selected characteristics at admission: Number, 2012
Selected characteristics at
admission
Type of service
1 Excludes 5,850 residential (short-term, long-term, hospital) discharges where medication-assisted opioid therapy was planned.
2 Outpatient and intensive outpatient medication-assisted opioid therapy only.
3 Medication-assisted opioid detoxification (free-standing, hospital, and outpatient) only.
4 Includes only discharges aged 16 and above for employment status and detailed not in labor force.
NOTE: Based on linked admission and discharge data reported to TEDS by 49 states and jurisdictions.
SOURCE: Center for Behavioral Health Statistics and Quality, Substance Abuse and Mental Health Services Administration,
Treatment Episode Data Set (TEDS). Data received through 01.23.15.
71

Total1
Out-
patient
Intensive
outpatient
Short-term
residential
Long-term
residential
Hospital
residential
Detox-
ification
Outpatient
med.-asst.
opi. ther.2
Med.-
asst. opi.
detox3
No. of discharges 1,628,845 703,290 203,127 165,609 122,467 5,637 337,160 72,071 19,484
Arrests in past 30 days
0 1,354,813 616,261 180,088 150,819 110,093 5,015 223,322 54,621 14,594
1 60,695 29,357 9,550 6,743 3,575 88 7,651 3,360 371
2 4,844 2,105 586 613 311 7 897 296 29
3 1,331 573 165 179 65 2 296 44 7
4 588 274 84 56 33 2 122 14 3
5 349 158 52 43 17 2 59 14 4
6 to 96 2,144 1,127 230 246 121 9 266 128 17
No. of discharges 1,424,764 649,855 190,755 158,699 114,215 5,125 232,613 58,477 15,025
Detailed not in labor force4
Homemaker 12,905 7,297 2,193 910 577 45 880 966 37
Student 54,175 31,922 7,965 4,728 6,784 54 2,091 539 92
Retired 9,812 4,780 1,292 1,309 375 90 1,647 276 43
Disabled 102,210 44,245 13,440 13,875 5,390 566 16,239 7,823 632
Inmate of institution 32,307 13,104 7,703 3,574 3,943 180 2,536 1,005 262
Other 194,994 55,792 23,792 39,933 21,935 618 38,212 11,672 3,040
No. of discharges 406,403 157,140 56,385 64,329 39,004 1,553 61,605 22,281 4,106
Employment status4
Employed 359,223 226,458 49,672 18,292 17,765 830 29,209 14,232 2,765
Unemployed 549,713 217,646 76,347 74,959 39,662 2,635 109,997 21,906 6,561
Not in labor force 466,123 179,995 59,408 65,323 53,045 1,598 75,084 25,303 6,367
No. of discharges 1,375,059 624,099 185,427 158,574 110,472 5,063 214,290 61,441 15,693
Frequency of use
No use in the past month 674,604 336,605 97,761 87,712 75,255 1,264 50,294 20,748 4,965
Some use 314,813 134,517 40,827 27,230 15,393 1,858 80,749 10,950 3,289
Daily use 245,044 67,697 22,388 21,681 7,731 1,613 105,637 15,469 2,828
No. of discharges 1,234,461 538,819 160,976 136,623 98,379 4,735 236,680 47,167 11,082
Living arrangements
Homeless 138,125 28,849 10,684 18,015 18,355 672 56,356 3,692 1,502
Dependent living 333,845 132,558 49,735 48,959 47,235 451 42,328 8,679 3,900
Independent living 940,086 483,282 129,427 93,831 46,933 3,855 126,854 46,262 9,642
No. of discharges 1,412,056 644,689 189,846 160,805 112,523 4,978 225,538 58,633 15,044
Primary substance
Alcohol 547,486 261,826 68,327 58,620 34,981 2,710 118,824 1,249 949
Opiates 363,663 94,292 34,083 45,157 28,627 1,136 87,050 60,607 12,711
Marijuana/hashish 254,919 176,074 40,525 16,793 14,768 211 5,807 692 49
Cocaine 105,074 47,828 14,943 16,902 13,513 332 10,053 1,351 152
Stimulants 124,585 58,215 20,407 13,739 19,140 205 12,536 277 66
Other/unknown 233,118 65,055 24,842 14,398 11,438 1,043 102,890 7,895 5,557
No. of discharges 1,628,845 703,290 203,127 165,609 122,467 5,637 337,160 72,071 19,484
Self-help programs attended
in past 30 days
No attend. in the past month 703,586 338,471 74,952 46,490 23,400 2,308 185,913 28,755 3,297
At least 1 time in the past month 419,530 125,088 57,781 93,166 51,083 1,498 81,682 7,194 2,038
1-3 times in past month 74,202 25,527 13,715 11,162 5,409 394 15,120 2,552 323
4-7 times in past month 68,401 23,629 13,755 9,859 6,218 292 12,810 1,527 311
8-15 times in past month 69,578 21,480 14,295 13,994 10,311 178 7,225 1,096 999
16-30 times in past month 76,343 16,004 8,962 27,276 14,192 383 8,286 901 339
Some attendance, but
frequency unknown 131,006 38,448 7,054 30,875 14,953 251 38,241 1,118 66
No. of discharges 1,123,116 463,559 132,733 139,656 74,483 3,806 267,595 35,949 5,3351 Excludes 5,850 residential (short-term, long-term, hospital) discharges where medication-assisted opioid therapy was planned.
2 Outpatient and intensive outpatient medication-assisted opioid therapy only.
4 Includes only discharges aged 16 and above for employment status and detailed not in labor force.
NOTE: Based on linked admission and discharge data reported to TEDS by 49 states and jurisdictions.
SOURCE: Center for Behavioral Health Statistics and Quality, Substance Abuse and Mental Health Services Administration,
Treatment Episode Data Set (TEDS). Data received through 01.23.15.
Table 1.6b. Discharges aged 12 and older, by type of service and selected characteristics at discharge: Number, 2012
Selected characteristics at
discharge
Type of service
3 Medication-assisted opioid detoxification (free-standing, hospital, and outpatient) only.
72

Total1
Out-
patient
Intensive
outpatient
Short-term
residential
Long-term
residential
Hospital
residential
Detox-
ification
Outpatient
med.-asst.
opi. ther.2
Med.-
asst. opi.
detox3
No. of discharges 1,628,845 703,290 203,127 165,609 122,467 5,637 337,160 72,071 19,484
Gender
Male 66.3 66.1 61.6 65.0 64.0 64.0 72.7 57.3 67.3
Female 33.7 33.9 38.4 35.0 36.0 36.0 27.3 42.7 32.7
Total 100.0 100.0 100.0 100.0 100.0 100.0 100.0 100.0 100.0
Age at admission
12 to 20 years 12.6 17.7 14.4 10.8 12.3 4.6 4.3 3.0 5.1
21 to 30 years 31.0 31.8 33.8 31.9 33.1 26.8 25.9 33.4 37.4
31 to 40 years 22.4 21.9 23.2 22.5 22.9 23.5 22.3 24.9 22.5
41 to 50 years 21.0 18.0 18.6 21.7 21.0 27.6 27.9 21.9 19.7
Over 50 years 13.0 10.6 10.1 13.1 10.8 17.6 19.6 16.8 15.2
Total 100.0 100.0 100.0 100.0 100.0 100.0 100.0 100.0 100.0
Race/ethnicity
White (non-Hispanic) 61.4 59.5 63.0 67.5 56.4 77.0 62.1 63.3 65.8
Black (non-Hispanic) 19.3 20.2 20.5 18.9 20.1 12.7 18.1 15.2 13.3
Hispanic origin 12.9 14.0 8.4 9.2 14.0 6.1 13.7 16.7 16.8
Other 6.4 6.3 8.0 4.5 9.4 4.2 6.1 4.7 4.1
Total 100.0 100.0 100.0 100.0 100.0 100.0 100.0 100.0 100.0
Primary substance
Alcohol 38.5 39.9 36.5 36.8 29.6 54.8 50.3 1.6 7.1
Opiates 26.2 14.1 19.4 29.8 25.9 23.5 35.8 95.1 89.4
Marijuana/hashish 17.2 27.2 22.6 10.6 13.4 4.3 2.3 0.7 0.3
Cocaine 7.1 7.2 8.2 10.6 11.7 8.1 4.7 0.9 0.8
Stimulants 7.8 8.5 10.3 8.3 16.1 3.8 3.8 0.3 0.3
Other/unknown 3.2 3.2 3.0 3.8 3.3 5.5 3.1 1.3 2.1
Total 100.0 100.0 100.0 100.0 100.0 100.0 100.0 100.0 100.0
Frequency of use
No use in the past month 28.7 43.1 39.5 12.1 34.1 10.5 2.7 18.1 1.6
Some use 31.7 38.0 36.0 30.5 31.8 24.0 21.3 16.1 11.3
Daily 39.6 18.9 24.5 57.4 34.1 65.5 76.0 65.9 87.1
Total 100.0 100.0 100.0 100.0 100.0 100.0 100.0 100.0 100.0
No. of prior treatment
episodes
None 39.7 49.6 37.1 28.0 26.4 37.0 34.5 22.5 31.9
1 or more 60.3 50.4 62.9 72.0 73.6 63.0 65.5 77.5 68.1
Total 100.0 100.0 100.0 100.0 100.0 100.0 100.0 100.0 100.0
Treatment referral source
Criminal justice/DUI 33.5 49.1 43.8 18.2 34.7 6.8 10.2 4.7 2.0
Self or individual 35.8 22.7 25.4 34.4 28.4 53.8 61.5 74.4 80.9
Health care/community 30.7 28.2 30.8 47.4 36.9 39.4 28.3 20.9 17.1
Total 100.0 100.0 100.0 100.0 100.0 100.0 100.0 100.0 100.0
Employment status4
Employed 21.5 30.6 22.4 12.2 5.6 15.7 12.6 20.8 17.9
Unemployed 40.1 39.0 44.2 42.8 34.9 56.0 39.9 38.9 45.7
Not in labor force 38.4 30.4 33.3 45.0 59.5 28.3 47.5 40.3 36.4
Total 100.0 100.0 100.0 100.0 100.0 100.0 100.0 100.0 100.0
Years of education4
Fewer than 12 years 29.5 29.8 30.8 28.3 32.1 23.0 27.0 33.1 28.6
12 years (or GED) 44.4 44.1 43.4 42.7 43.4 47.3 46.4 44.5 48.8
More than 12 years 26.2 26.1 25.9 29.0 24.5 29.7 26.7 22.4 22.6
Total 100.0 100.0 100.0 100.0 100.0 100.0 100.0 100.0 100.0
Table 1.7. Discharges aged 12 and older, by type of service and characteristics at admission: Percent distribution, 2012
2 Outpatient and intensive outpatient medication-assisted opioid therapy only.
3 Medication-assisted opioid detoxification (free-standing, hospital, and outpatient) only.
SOURCE: Center for Behavioral Health Statistics and Quality, Substance Abuse and Mental Health Services Administration, Treatment Episode
Data Set (TEDS). Data received through 01.23.15.
Characteristics at admission
Type of service
4 Includes only discharges aged 16 and older for employment status and aged 18 and older for years of education. For years of education , self-
contained special education classes that have no grade level equivalent are excluded from the tabulation because there were too few cases to
report.
1 Excludes 5,850 residential (short-term, long-term, hospital) discharges where medication-assisted opioid therapy was planned.
NOTES: Based on linked admission and discharge data reported to TEDS by 49 states and jurisdictions. Percentages may not add to 100 percent
due to rounding. Percentages are based on all admissions with known and valid values. Admissions for which values were not collected,
unknown, or missing are excluded from the percentage base (denominator).
73

Total1
Out-
patient
Intensive
outpatient
Short-term
residential
Long-term
residential
Hospital
residential
Detox-
ification
Outpatient
med.-asst.
opi. ther.2
Med.-
asst. opi.
detox3
No. of discharges 1,628,845 703,290 203,127 165,609 122,467 5,637 337,160 72,071 19,484
Arrests in past 30 days
0 91.7 92.0 91.1 88.3 88.5 94.1 94.0 95.1 95.0
1 7.3 7.1 7.8 10.3 10.1 5.0 5.0 4.2 4.2
2 0.6 0.5 0.5 0.9 0.9 0.4 0.6 0.4 0.5
3 0.2 0.1 0.2 0.2 0.2 0.2 0.2 0.1 0.1
4 0.1 0.1 0.1 0.1 0.1 0.1 0.1 * *
5 * * 0.1 * * * * * 0.1
6 to 96 0.2 0.2 0.3 0.2 0.2 0.2 0.1 0.2 0.1
Total 100.0 100.0 100.0 100.0 100.0 100.0 100.0 100.0 100.0
Detailed not in labor force4
Homemaker 2.7 4.5 4.0 1.4 1.2 2.9 0.8 4.4 1.2
Student 11.6 21.4 14.8 7.3 10.8 4.9 2.0 2.7 2.6
Retired 2.3 2.9 2.3 1.9 0.7 6.7 2.4 1.4 1.0
Disabled 23.2 27.3 24.5 20.9 11.8 36.3 20.8 36.0 19.2
Inmate of institution 6.4 6.2 13.3 5.2 15.5 9.3 1.5 1.6 0.1
Other 53.8 37.6 41.0 63.3 60.0 39.8 72.5 53.9 75.9
Total 100.0 100.0 100.0 100.0 100.0 100.0 100.0 100.0 100.0
Employment status4
Employed 21.5 30.6 22.4 12.2 5.6 15.7 12.6 20.8 17.9
Unemployed/not in labor force 40.1 39.0 44.2 42.8 34.9 56.0 39.9 38.9 45.7
Not in labor force 38.4 30.4 33.3 45.0 59.5 28.3 47.5 40.3 36.4
Total 100.0 100.0 100.0 100.0 100.0 100.0 100.0 100.0 100.0
Frequency of use
No use in the past month 28.7 43.1 39.5 12.1 34.1 10.5 2.7 18.1 1.6
Some use 31.7 38.0 36.0 30.5 31.8 24.0 21.3 16.1 11.3
Daily use 39.6 18.9 24.5 57.4 34.1 65.5 76.0 65.9 87.1
Total 100.0 100.0 100.0 100.0 100.0 100.0 100.0 100.0 100.0
Living arrangements
Homeless 13.9 5.5 6.8 17.9 26.3 16.3 30.9 6.7 15.4
Dependent living 20.7 21.6 26.1 21.9 37.0 5.9 10.9 14.4 17.9
Independent living 65.4 73.0 67.1 60.2 36.7 77.7 58.2 78.8 66.7
Total 100.0 100.0 100.0 100.0 100.0 100.0 100.0 100.0 100.0
Primary substance
Alcohol 38.5 39.9 36.5 36.8 29.6 54.8 50.3 1.6 7.1
Opiates 26.2 14.1 19.4 29.8 25.9 23.5 35.8 95.1 89.4
Marijuana/hashish 17.2 27.2 22.6 10.6 13.4 4.3 2.3 0.7 0.3
Cocaine 7.1 7.2 8.2 10.6 11.7 8.1 4.7 0.9 0.8
Stimulants 7.8 8.5 10.3 8.3 16.1 3.8 3.8 0.3 0.3
Other/unknown 3.2 3.2 3.0 3.8 3.3 5.5 3.1 1.3 2.1
Total 100.0 100.0 100.0 100.0 100.0 100.0 100.0 100.0 100.0
Self-help programs attended
in past 30 days
No attend. in the past month 74.4 77.2 68.7 68.6 57.6 81.0 81.5 78.9 83.8
At least 1 time in the past month 25.6 22.8 31.3 31.4 42.4 19.0 18.5 21.1 16.2
1-3 times in past month 6.0 4.5 8.5 7.8 7.0 7.0 6.1 6.8 5.4
4-7 times in past month 4.4 3.8 6.4 5.0 5.8 2.9 3.8 3.7 4.4
8-15 times in past month 4.4 3.7 6.9 4.1 7.4 1.5 3.2 3.4 3.0
16-30 times in past month 4.7 4.2 5.8 5.1 9.6 5.5 3.3 3.3 2.0
Some attendance, but
frequency unknown 6.1 6.5 3.7 9.6 12.7 2.2 2.2 3.9 1.5
Total 100.0 100.0 100.0 100.0 100.0 100.0 100.0 100.0 100.0
Table 1.8a. Discharges aged 12 and older, by type of service and selected characteristics at admission: Percent
distribution, 2012
Selected characteristics at
admission
Type of service
* Less than 0.05 percent.1 Excludes 5,850 residential (short-term, long-term, hospital) discharges where medication-assisted opioid therapy was planned.
2 Outpatient and intensive outpatient medication-assisted opioid therapy only.
3 Medication-assisted opioid detoxification (free-standing, hospital, and outpatient) only.
4 Includes only discharges aged 16 and above for employment status and detailed not in labor force.
NOTES: Based on linked admission and discharge data reported to TEDS by 49 states and jurisdictions. Percentages may not add to 100
percent due to rounding. Percentages are based on all admissions with known and valid values. Admissions for which values were not
collected, unknown, or missing are excluded from the percentage base (denominator).
SOURCE: Center for Behavioral Health Statistics and Quality, Substance Abuse and Mental Health Services Administration, Treatment
Episode Data Set (TEDS). Data received through 01.23.15.
74

Total1
Out-
patient
Intensive
outpatient
Short-term
residential
Long-term
residential
Hospital
residential
Detox-
ification
Outpatient
med.-asst.
opi. ther.2
Med.-
asst. opi.
detox3
No. of discharges 1,628,845 703,290 203,127 165,609 122,467 5,637 337,160 72,071 19,484
Arrests in past 30 days
0 95.1 94.8 94.4 95.0 96.4 97.9 96.0 93.4 97.1
1 4.3 4.5 5.0 4.2 3.1 1.7 3.3 5.7 2.5
2 0.3 0.3 0.3 0.4 0.3 0.1 0.4 0.5 0.2
3 0.1 0.1 0.1 0.1 0.1 * 0.1 0.1 *
4 * * * * * * 0.1 * *
5 * * * * * * * * *
6 to 96 0.2 0.2 0.1 0.2 0.1 0.2 0.1 0.2 0.1
Total 100.0 100.0 100.0 100.0 100.0 100.0 100.0 100.0 100.0
Detailed not in labor force4
Homemaker 3.2 4.6 3.9 1.4 1.5 2.9 1.4 4.3 0.9
Student 13.3 20.3 14.1 7.3 17.4 3.5 3.4 2.4 2.2
Retired 2.4 3.0 2.3 2.0 1.0 5.8 2.7 1.2 1.0
Disabled 25.1 28.2 23.8 21.6 13.8 36.4 26.4 35.1 15.4
Inmate of institution 7.9 8.3 13.7 5.6 10.1 11.6 4.1 4.5 6.4
Other 48.0 35.5 42.2 62.1 56.2 39.8 62.0 52.4 74.0
Total 100.0 100.0 100.0 100.0 100.0 100.0 100.0 100.0 100.0
Employment status4
Employed 26.1 36.3 26.8 11.5 16.1 16.4 13.6 23.2 17.6
Unemployed 40.0 34.9 41.2 47.3 35.9 52.0 51.3 35.7 41.8
Not in labor force 33.9 28.8 32.0 41.2 48.0 31.6 35.0 41.2 40.6
Total 100.0 100.0 100.0 100.0 100.0 100.0 100.0 100.0 100.0
Frequency of use
No use in the past month 54.6 62.5 60.7 64.2 76.5 26.7 21.2 44.0 44.8
Some use 25.5 25.0 25.4 19.9 15.6 39.2 34.1 23.2 29.7
Daily use 19.9 12.6 13.9 15.9 7.9 34.1 44.6 32.8 25.5
Total 100.0 100.0 100.0 100.0 100.0 100.0 100.0 100.0 100.0
Living arrangements
Homeless 9.8 4.5 5.6 11.2 16.3 13.5 25.0 6.3 10.0
Dependent living 23.6 20.6 26.2 30.4 42.0 9.1 18.8 14.8 25.9
Independent living 66.6 75.0 68.2 58.4 41.7 77.4 56.2 78.9 64.1
Total 100.0 100.0 100.0 100.0 100.0 100.0 100.0 100.0 100.0
Primary substance
Alcohol 33.6 37.2 33.6 35.4 28.6 48.1 35.2 1.7 4.9
Opiates 22.3 13.4 16.8 27.3 23.4 20.2 25.8 84.1 65.2
Marijuana/hashish 15.7 25.0 20.0 10.1 12.1 3.7 1.7 1.0 0.3
Cocaine 6.5 6.8 7.4 10.2 11.0 5.9 3.0 1.9 0.8
Stimulants 7.6 8.3 10.0 8.3 15.6 3.6 3.7 0.4 0.3
Other/unknown 14.3 9.3 12.2 8.7 9.3 18.5 30.5 11.0 28.5
Total 100.0 100.0 100.0 100.0 100.0 100.0 100.0 100.0 100.0
Self-help programs attended
in past 30 days
No attend. in the past month 62.6 73.0 56.5 33.3 31.4 60.6 69.5 80.0 61.8
At least 1 time in the past month 37.4 27.0 43.5 66.7 68.6 39.4 30.5 20.0 38.2
1-3 times in past month 6.6 5.5 10.3 8.0 7.3 10.4 5.7 7.1 6.1
4-7 times in past month 6.1 5.1 10.4 7.1 8.3 7.7 4.8 4.2 5.8
8-15 times in past month 6.2 4.6 10.8 10.0 13.8 4.7 2.7 3.0 18.7
16-30 times in past month 6.8 3.5 6.8 19.5 19.1 10.1 3.1 2.5 6.4
Some attendance, but
frequency unknown 11.7 8.3 5.3 22.1 20.1 6.6 14.3 3.1 1.2
Total 100.0 100.0 100.0 100.0 100.0 100.0 100.0 100.0 100.0
Table 1.8b. Discharges aged 12 and older, by type of service and selected characteristics at discharge: Percent
distribution, 2012
2 Outpatient and intensive outpatient medication-assisted opioid therapy only.
* Less than 0.05 percent.1 Excludes 5,850 residential (short-term, long-term, hospital) discharges where medication-assisted opioid therapy was planned.
3 Medication-assisted opioid detoxification (free-standing, hospital, and outpatient) only.
4 Includes only discharges aged 16 and above for employment status and detailed not in labor force.
NOTES: Based on linked admission and discharge data reported to TEDS by 49 states and jurisdictions. Percentages may not add to 100
percent due to rounding.Percentages are based on all admissions with known and valid values. Admissions for which values were not
collected, unknown, or missing are excluded from the percentage base (denominator).
SOURCE: Center for Behavioral Health Statistics and Quality, Substance Abuse and Mental Health Services Administration, Treatment
Episode Data Set (TEDS). Data received through 01.23.15.
Selected characteristics at
discharge
Type of service
75

Total
Out-
patient
Intensive
outpatient
Short-term
residential
Long-term
residential
Hospital
residential
Detox-
ification
Outpatient
med.-asst.
opi. ther.2
Med.-
asst. opi.
detox3
1,628,845 59.7 51.0 55.7 71.3 60.7 70.4 79.4 32.0 67.5
Gender
Male 1,079,062 60.4 51.4 56.4 72.2 59.6 71.6 79.5 29.0 66.4
Female 549,424 58.1 50.1 54.5 69.6 62.5 68.2 79.0 36.0 69.7
Total 1,628,486 59.7 51.0 55.7 71.3 60.7 70.4 79.4 32.0 67.5
Age at admission
12 to 20 years 204,623 54.3 50.0 51.1 67.8 57.8 66.8 78.9 32.0 74.3
21 to 30 years 505,724 56.9 49.9 54.7 68.0 58.0 67.8 74.6 34.2 68.3
31 to 40 years 364,801 59.2 50.9 56.8 71.0 60.9 68.8 76.9 32.6 66.3
41 to 50 years 341,282 62.8 51.3 56.9 74.3 62.6 70.6 81.7 28.8 66.1
Over 50 years 212,415 67.1 55.2 60.6 77.8 67.6 76.8 85.3 31.0 66.7
Total 1,628,845 59.7 51.0 55.7 71.3 60.7 70.4 79.4 32.0 67.5
Race/ethnicity
White (non-Hispanic) 991,652 61.2 53.0 57.8 72.5 62.8 71.0 78.2 34.0 68.4
Black (non-Hispanic) 311,958 55.5 44.6 49.4 69.0 54.0 64.0 82.2 30.1 78.7
Hispanic origin 208,071 57.9 50.1 52.9 68.9 59.0 74.2 80.7 26.5 55.7
Other 103,782 61.3 52.6 58.5 70.1 65.0 69.3 81.3 31.7 65.0
Total 1,615,463 59.7 50.9 55.7 71.4 60.7 70.2 79.4 32.1 67.5
Primary substance
Alcohol 627,430 67.0 56.6 60.2 77.0 64.4 73.4 84.0 50.6 80.2
Opiates 427,446 55.0 43.5 51.4 66.8 55.3 68.4 72.2 31.2 66.2
Marijuana/hashish 279,485 51.7 48.3 52.6 69.0 56.1 60.4 83.8 48.0 73.1
Cocaine 116,099 55.8 44.1 52.0 69.5 54.4 64.3 82.6 48.4 80.9
Stimulants 127,037 61.5 53.7 58.3 68.7 71.1 57.1 81.3 48.1 79.4
Other/unknown 51,348 56.6 44.2 52.8 68.3 59.8 74.4 77.5 41.2 71.4
Total 1,628,845 59.7 51.0 55.7 71.3 60.7 70.4 79.4 32.0 67.5
Frequency of use
No use in the past month 460,906 58.7 55.8 61.7 76.4 64.3 71.5 85.3 43.3 67.4
Some use 509,520 58.9 50.1 52.3 74.5 63.6 68.0 87.8 33.5 69.1
Daily 637,190 61.5 43.2 51.8 69.0 54.0 71.1 76.9 28.6 67.3
Total 1,607,616 59.9 51.3 55.9 71.6 60.6 70.4 79.4 32.0 67.5
No. of prior treatment
episodes
None 594,026 59.6 54.6 57.6 70.6 67.2 66.3 77.1 35.6 66.5
1 or more 900,647 58.0 47.8 54.6 72.0 58.5 68.3 80.1 31.1 67.9
Total 1,494,673 58.6 51.2 55.7 71.6 60.8 67.6 79.1 32.1 67.4
Treatment referral source
Criminal justice/DUI 535,462 62.2 58.8 61.0 76.7 64.9 78.3 84.7 46.1 87.4
Self or individual 573,151 57.7 41.2 50.2 67.4 60.5 75.4 75.8 29.1 63.5
Health care/community 491,777 59.8 46.1 52.9 72.4 57.3 61.3 85.4 40.2 83.4
Total 1,600,390 59.9 51.2 55.8 71.5 60.8 70.0 79.4 32.2 67.4
Employment status4
Employed 332,112 62.2 58.4 62.1 78.4 71.3 75.6 82.8 35.2 64.3
Unemployed 617,983 57.5 47.4 52.8 70.4 60.9 63.2 79.6 31.6 63.7
Not in labor force 592,618 60.1 48.1 55.7 70.5 59.6 77.6 79.2 30.6 72.3
Total 1,542,713 59.5 50.9 55.8 71.4 60.7 69.2 79.8 31.9 66.9
Years of education4
Fewer than 12 years 438,443 56.0 47.3 51.4 67.9 57.3 65.1 78.2 28.9 60.4
12 years (or GED) 660,461 60.6 51.9 56.9 71.4 60.8 69.1 79.4 32.1 68.4
More than 12 years 389,669 63.3 53.7 59.8 75.2 64.6 72.5 81.1 36.3 73.1
Total 1,488,573 59.9 51.0 56.0 71.5 60.6 69.2 79.5 32.0 67.2
Table 1.9. Discharges aged 12 and older completing treatment or transferring to further treatment, by type of service and
characteristics at admission: Percent, 2012
2 Outpatient and intensive outpatient medication-assisted opioid therapy only.
3 Medication-assisted opioid detoxification (free-standing, hospital, and outpatient) only.
SOURCE: Center for Behavioral Health Statistics and Quality, Substance Abuse and Mental Health Services Administration, Treatment Episode
Data Set (TEDS). Data received through 01.23.15.
Characteristics at admission
No. of dis-
charges1
Type of service
4 Includes only discharges aged 16 and older for employment status and aged 18 and older for years of education .
NOTES: Based on linked admission and discharge data reported to TEDS by 49 states and jurisdictions.Percentages are based on all admissions
with known and valid values. Admissions for which values were not collected, unknown, or missing are excluded from the percentage base
(denominator).
1 Excludes 5,850 residential (short-term, long-term, hospital) discharges where medication-assisted opioid therapy was planned.
76

Total
Out-
patient
Intensive
outpatient
Short-term
residential
Long-term
residential
Hospital
residential
Detox-
ification
Outpatient
med.-asst.
opi. ther.2
Med.-
asst. opi.
detox3
1,628,845 59.7 51.0 55.7 71.3 60.7 70.4 79.4 32.0 67.5
Arrests in past 30 days
0 1,384,012 58.7 51.4 55.8 71.4 60.4 69.3 79.7 32.6 67.1
1 109,719 58.7 50.3 55.3 72.2 62.9 69.8 80.9 27.6 77.5
2 8,661 57.0 44.3 56.6 68.0 60.9 68.2 78.5 20.8 72.3
3 2,339 55.0 45.0 52.4 68.5 62.2 66.7 73.5 24.6 69.0
4 972 51.4 41.9 45.0 62.5 60.9 60.0 71.5 41.7 87.5
5 616 48.7 40.0 45.5 63.9 52.0 - - 68.1 31.8 80.0
6 to 96 2,809 51.4 46.4 47.2 68.5 62.1 87.5 74.6 17.0 35.7
Total 1,509,128 58.7 51.2 55.8 71.4 60.7 69.3 79.7 32.3 67.6
Detailed not in labor force4
Homemaker 13,496 54.8 49.2 56.7 70.4 61.3 78.6 81.7 41.0 68.2
Student 57,755 55.6 51.3 55.1 68.8 60.9 71.8 83.9 33.9 68.4
Retired 11,397 70.7 60.8 63.3 81.9 72.7 81.4 87.6 31.8 86.8
Disabled 115,552 57.3 45.7 49.4 70.2 56.0 75.3 81.8 28.1 73.2
Inmate of institution 31,679 65.3 56.8 78.0 54.3 64.4 84.3 81.6 65.3 60.0
Other 267,300 60.1 40.7 52.9 71.6 46.9 78.0 76.7 26.5 80.9
Total 497,179 59.3 46.3 56.1 70.4 52.5 77.5 78.2 28.6 79.0
Employment status4
Employed 332,112 62.2 58.4 62.1 78.4 71.3 75.6 82.8 35.2 64.3
Unemployed 617,983 57.5 47.4 52.8 70.4 60.9 63.2 79.6 31.6 63.7
Not in labor force 592,618 60.1 48.1 55.7 70.5 59.6 77.6 79.2 30.6 72.3
Total 1,542,713 59.5 50.9 55.8 71.4 60.7 69.2 79.8 31.9 66.9
Frequency of use
No use in the past month 460,906 58.7 55.8 61.7 76.4 64.3 71.5 85.3 43.3 67.4
Some use 509,520 58.9 50.1 52.3 74.5 63.6 68.0 87.8 33.5 69.1
Daily use 637,190 61.5 43.2 51.8 69.0 54.0 71.1 76.9 28.6 67.3
Total 1,607,616 59.9 51.3 55.9 71.6 60.6 70.4 79.4 32.0 67.5
Living arrangements
Homeless 222,549 65.8 42.9 48.2 68.9 58.7 70.0 79.4 30.8 73.7
Dependent living 332,673 60.9 54.3 59.0 69.8 63.7 66.6 83.6 42.1 68.2
Independent living 1,048,153 58.1 50.8 55.3 73.1 59.1 69.5 79.1 30.2 65.9
Total 1,603,375 59.8 51.2 55.8 71.7 60.7 69.4 79.7 31.9 67.5
Primary substance
Alcohol 627,430 67.0 56.6 60.2 77.0 64.4 73.4 84.0 50.6 80.2
Opiates 427,446 55.0 43.5 51.4 66.8 55.3 68.4 72.2 31.2 66.2
Marijuana/hashish 279,485 51.7 48.3 52.6 69.0 56.1 60.4 83.8 48.0 73.1
Cocaine 116,099 55.8 44.1 52.0 69.5 54.4 64.3 82.6 48.4 80.9
Stimulants 127,037 61.5 53.7 58.3 68.7 71.1 57.1 81.3 48.1 79.4
Other/unknown 51,348 56.6 44.2 52.8 68.3 59.8 74.4 77.5 41.2 71.4
Total 1,628,845 59.7 51.0 55.7 71.3 60.7 70.4 79.4 32.0 67.5
Self-help programs attended
in past 30 days
No attend. in the past month 856,444 58.1 49.5 56.0 70.8 53.1 68.8 79.5 30.3 77.4
At least 1 time in the past month 293,987 59.5 50.5 58.2 73.1 58.7 77.4 78.8 38.5 77.6
1-3 times in past month 68,900 59.3 48.6 56.0 70.1 62.8 73.7 77.4 34.1 74.3
4-7 times in past month 51,037 59.8 49.9 59.5 71.2 62.2 77.3 77.1 39.0 80.1
8-15 times in past month 50,116 62.4 55.8 60.7 74.2 60.3 72.6 79.4 46.2 80.6
16-30 times in past month 54,249 65.7 62.4 61.3 72.9 60.0 90.6 83.0 54.3 77.9
Some attendance, but
frequency unknown 69,685 52.7 41.3 51.3 76.1 52.9 59.0 78.5 25.3 76.0
Total 1,150,431 58.5 49.7 56.7 71.5 55.5 70.4 79.4 32.0 77.4
Table 1.10a. Discharges aged 12 and older completing treatment or transferring to further treatment, by type of service
and selected characteristics at admission: Percent, 2012
Selected characteristics at
admission
No. of dis-
charges1
Type of service
1 Excludes 5,850 residential (short-term, long-term, hospital) discharges where medication-assisted opioid therapy was planned.
2 Outpatient and intensive outpatient medication-assisted opioid therapy only.
3 Medication-assisted opioid detoxification (free-standing, hospital, and outpatient) only.
4 Includes only discharges aged 16 and above for employment status and detailed not in labor force.
NOTES: Based on linked admission and discharge data reported to TEDS by 49 states and jurisdictions. Percentages are based on all admissions
with known and valid values. Admissions for which values were not collected, unknown, or missing are excluded from the percentage base
(denominator).
SOURCE: Center for Behavioral Health Statistics and Quality, Substance Abuse and Mental Health Services Administration, Treatment Episode
Data Set (TEDS). Data received through 01.23.15.
- - Quantity is zero.
77

Total
Out-
patient
Intensive
outpatient
Short-term
residential
Long-term
residential
Hospital
residential
Detox-
ification
Outpatient
med.-asst.
opi. ther.2
Med.-
asst. opi.
detox3
1,628,845 59.7 51.0 55.7 71.3 60.7 70.4 79.4 32.0 67.5
Arrests in past 30 days
0 1,354,813 62.9 56.0 60.1 72.7 65.5 70.8 80.5 39.1 84.5
1 60,695 42.7 31.5 36.5 63.9 46.9 59.1 82.4 15.8 74.4
2 4,844 48.7 34.7 42.5 61.3 54.7 85.7 83.9 17.6 72.4
3 1,331 52.8 40.7 43.6 62.0 63.1 50.0 78.4 15.9 85.7
4 588 51.2 42.3 47.6 58.9 45.5 - - 76.2 7.1 100.0
5 349 45.8 33.5 36.5 58.1 64.7 50.0 72.9 42.9 50.0
6 to 96 2,144 49.5 39.7 40.4 75.2 67.8 77.8 77.1 20.3 94.1
Total 1,424,764 61.9 54.8 58.8 72.2 64.9 70.6 80.5 37.6 84.2
Detailed not in labor force4
Homemaker 12,905 57.1 51.7 64.1 72.3 65.7 75.6 80.0 41.1 56.8
Student 54,175 58.4 53.9 60.4 70.3 62.5 87.0 84.9 39.0 78.3
Retired 9,812 71.2 64.3 69.2 81.5 75.7 84.4 88.8 32.6 88.4
Disabled 102,210 56.1 47.3 51.9 71.0 58.3 78.1 81.3 30.1 70.9
Inmate of institution 32,307 50.7 37.0 64.1 49.5 51.0 81.1 86.8 23.4 90.8
Other 194,994 53.1 37.6 48.4 70.6 39.2 78.2 74.5 24.7 79.2
Total 406,403 54.9 45.1 54.1 69.7 47.8 79.1 77.6 27.7 78.5
Employment status4
Employed 359,223 66.7 63.8 67.3 79.7 77.5 75.8 83.5 42.2 84.3
Unemployed 549,713 59.8 47.6 55.1 72.5 65.4 63.9 80.0 35.6 82.2
Not in labor force 466,123 59.9 50.7 55.6 70.0 61.1 78.3 81.3 35.3 84.8
Total 1,375,059 61.6 54.4 58.5 72.3 65.3 70.4 80.9 37.0 83.6
Frequency of use
No use in the past month 674,604 69.2 65.1 71.9 79.9 70.6 81.5 78.0 49.9 80.6
Some use 314,813 56.8 42.0 47.3 60.5 52.7 73.0 87.1 33.5 94.0
Daily use 245,044 58.8 42.1 48.0 55.0 54.0 56.5 75.8 35.3 82.0
Total 1,234,461 64.0 56.4 62.3 72.1 66.5 69.6 80.1 41.3 84.9
Living arrangements
Homeless 138,125 65.1 46.0 47.0 61.5 62.6 67.0 81.9 33.2 80.0
Dependent living 333,845 67.5 60.7 61.7 77.5 66.8 74.5 86.7 47.7 92.5
Independent living 940,086 59.5 53.5 58.2 72.1 65.0 71.5 79.0 36.1 81.4
Total 1,412,056 61.9 54.6 58.5 72.6 65.4 71.2 81.2 37.7 84.1
Primary substance
Alcohol 547,486 65.9 55.9 61.3 77.0 64.7 72.5 85.2 47.8 76.7
Opiates 363,663 53.5 43.0 52.1 66.6 55.0 67.2 70.5 32.9 65.5
Marijuana/hashish 254,919 51.6 47.8 54.1 69.1 56.6 63.0 86.1 36.8 65.3
Cocaine 105,074 53.9 43.4 51.9 69.4 54.1 59.3 83.5 31.6 77.0
Stimulants 124,585 62.4 54.8 59.3 69.1 71.7 62.0 81.9 44.0 75.8
Other/unknown 233,118 64.6 53.3 47.2 69.5 56.7 75.0 79.1 22.2 70.1
Total 1,628,845 59.7 51.0 55.7 71.3 60.7 70.4 79.4 32.0 67.5
Self-help programs attended
in past 30 days
No attend. in the past month 703,586 55.6 44.9 54.8 63.3 43.5 72.2 78.5 30.0 71.2
At least 1 time in the past month 419,530 70.2 61.9 72.3 76.7 61.5 81.5 80.7 49.6 80.7
1-3 times in past month 74,202 61.3 56.3 65.2 60.6 53.6 68.3 72.8 40.3 68.7
4-7 times in past month 68,401 68.4 62.2 74.1 65.0 61.7 86.6 81.3 52.5 63.3
8-15 times in past month 69,578 73.2 69.0 79.5 75.9 64.8 84.8 79.4 59.5 88.7
16-30 times in past month 76,343 77.1 66.6 80.6 84.2 68.1 91.4 85.7 64.9 89.1
Some attendance, but
frequency unknown 131,006 70.5 59.5 57.4 79.9 55.8 78.9 82.9 44.9 56.1
Total 1,123,116 61.1 49.5 62.4 72.2 55.9 75.9 79.2 33.9 74.8
1 Excludes 5,850 residential (short-term, long-term, hospital) discharges where medication-assisted opioid therapy was planned.
- - Quantity is zero.
3 Medication-assisted opioid detoxification (free-standing, hospital, and outpatient) only.
4 Includes only discharges aged 16 and above for employment status and detailed not in labor force.
NOTES: Based on linked admission and discharge data reported to TEDS by 49 states and jurisdictions. Percentages are based on all admissions
with known and valid values. Admissions for which values were not collected, unknown, or missing are excluded from the percentage base
(denominator).
SOURCE: Center for Behavioral Health Statistics and Quality, Substance Abuse and Mental Health Services Administration, Treatment Episode
Data Set (TEDS). Data received through 01.23.15.
Table 1.10b. Discharges aged 12 and older completing treatment or transferring to further treatment, by type of service
and selected characteristics at discharge: Percent, 2012
Selected characteristics at
discharge
No. of dis-
charges1
Type of service
2 Outpatient and intensive outpatient medication-assisted opioid therapy only.
78

All outpatient
treatment discharges
Com-
pleted
Trans-
ferred
Dropped
out
Termi-
nated Other Total
Com-
pleted
Trans-
ferred
Dropped
out
Termi-
nated Other
Total 703,290 262,270 96,182 216,925 58,636 69,277 100.0 37.3 13.7 30.8 8.3 9.9
Alabama 188 76 16 54 5 37 100.0 40.4 8.5 28.7 2.7 19.7
Alaska 2,591 1,072 182 387 482 468 100.0 41.4 7.0 14.9 18.6 18.1
Arizona 22,247 5,728 134 12,667 - - 3,718 100.0 25.7 0.6 56.9 - - 16.7
Arkansas 2,673 1,564 122 511 373 103 100.0 58.5 4.6 19.1 14.0 3.9
California 79,621 27,110 19,061 31,063 - - 2,387 100.0 34.0 23.9 39.0 - - 3.0
Colorado 17,400 7,699 1,843 2,243 2,490 3,125 100.0 44.2 10.6 12.9 14.3 18.0
Connecticut 14,955 7,117 1,543 3,430 1,432 1,433 100.0 47.6 10.3 22.9 9.6 9.6
Delaware 2,815 981 246 148 876 564 100.0 34.8 8.7 5.3 31.1 20.0
District of Columbia 1,776 538 218 - - 360 660 100.0 30.3 12.3 - - 20.3 37.2
Florida 4,193 1,589 1,903 339 146 216 100.0 37.9 45.4 8.1 3.5 5.2
Georgia 17,233 4,088 496 6,355 1,508 4,786 100.0 23.7 2.9 36.9 8.8 27.8
Hawaii 3,677 1,735 898 695 306 43 100.0 47.2 24.4 18.9 8.3 1.2
Idaho 3,610 1,993 2 702 243 670 100.0 55.2 0.1 19.4 6.7 18.6
Illinois 20,340 7,699 3,162 7,456 1,547 476 100.0 37.9 15.5 36.7 7.6 2.3
Indiana 20,844 7,045 290 8,601 3,454 1,454 100.0 33.8 1.4 41.3 16.6 7.0
Iowa 17,653 10,082 534 5,284 721 1,032 100.0 57.1 3.0 29.9 4.1 5.8
Kentucky 21,496 3,771 13,965 2,138 231 1,391 100.0 17.5 65.0 9.9 1.1 6.5
Louisiana 4,780 1,901 309 1,588 374 608 100.0 39.8 6.5 33.2 7.8 12.7
Maine 3,721 1,577 - - 1,245 388 511 100.0 42.4 - - 33.5 10.4 13.7
Maryland 22,476 10,482 2,071 7,527 1,628 768 100.0 46.6 9.2 33.5 7.2 3.4
Massachusetts 16,060 8,930 430 4,485 818 1,397 100.0 55.6 2.7 27.9 5.1 8.7
Michigan 24,919 8,264 2,249 8,158 1,232 5,016 100.0 33.2 9.0 32.7 4.9 20.1
Minnesota 20 8 3 7 - - 2 100.0 40.0 15.0 35.0 - - 10.0
Missouri 14,734 7,574 3,341 2,378 987 454 100.0 51.4 22.7 16.1 6.7 3.1
Montana 5,206 2,791 464 1,285 155 511 100.0 53.6 8.9 24.7 3.0 9.8
Nebraska 4,299 2,369 246 716 163 805 100.0 55.1 5.7 16.7 3.8 18.7
Nevada 5,416 1,771 376 1,169 769 1,331 100.0 32.7 6.9 21.6 14.2 24.6
New Hampshire 2,191 1,014 159 16 54 948 100.0 46.3 7.3 0.7 2.5 43.3
New Jersey 20,437 10,999 82 4,713 933 3,710 100.0 53.8 0.4 23.1 4.6 18.2
New York 124,774 38,726 9,796 49,342 16,766 10,144 100.0 31.0 7.9 39.5 13.4 8.1
North Carolina 47,273 11,688 17,872 15,368 - - 2,345 100.0 24.7 37.8 32.5 - - 5.0
North Dakota 555 295 19 116 57 68 100.0 53.2 3.4 20.9 10.3 12.3
Ohio 20,124 8,007 1,221 4,314 3,920 2,662 100.0 39.8 6.1 21.4 19.5 13.2
Oklahoma 8,061 3,669 489 3,019 271 613 100.0 45.5 6.1 37.5 3.4 7.6
Oregon 29,492 15,580 3,525 5,642 2,547 2,198 100.0 52.8 12.0 19.1 8.6 7.5
Pennsylvania 11 - - 4 3 3 1 100.0 - - 36.4 27.3 27.3 9.1
Puerto Rico 1,379 1,140 50 95 6 88 100.0 82.7 3.6 6.9 0.4 6.4
Rhode Island 4,132 1,678 335 1,438 569 112 100.0 40.6 8.1 34.8 13.8 2.7
South Carolina 13,928 7,849 1,004 2,528 1,972 575 100.0 56.4 7.2 18.2 14.2 4.1
South Dakota 3,542 1,600 427 724 180 611 100.0 45.2 12.1 20.4 5.1 17.3
Tennessee 1,859 650 59 711 357 82 100.0 35.0 3.2 38.2 19.2 4.4
Texas 13,510 6,691 726 1,650 3,029 1,414 100.0 49.5 5.4 12.2 22.4 10.5
Utah 7,133 3,380 1,178 1,191 1,147 237 100.0 47.4 16.5 16.7 16.1 3.3
Vermont 4,096 1,142 440 1,637 232 645 100.0 27.9 10.7 40.0 5.7 15.7
Virginia 16,022 3 60 6,726 3,470 5,763 100.0 * 0.4 42.0 21.7 36.0
Washington 18,569 7,223 3,229 4,182 1,717 2,218 100.0 38.9 17.4 22.5 9.2 11.9
West Virginia 124 - - - - 99 22 3 100.0 - - - - 79.8 17.7 2.4
Wisconsin 9,246 4,631 1,285 2,008 652 670 100.0 50.1 13.9 21.7 7.1 7.2
Wyoming 1,889 751 118 772 44 204 100.0 39.8 6.2 40.9 2.3 10.8
SOURCE: Center for Behavioral Health Statistics and Quality, Substance Abuse and Mental Health Services Administration, Treatment Episode Data
Set (TEDS). Data received through 01.23.15.
- - Quantity is zero; * Less than 0.05 percent.
NOTES: Based on linked admission and discharge data reported to TEDS by the 49 states and jurisdictions that offered outpatient substance
abuse treatment and reported these data to TEDS. Comparisons among states should be made with caution. Percentages may not add to 100
percent due to rounding. The reason for discharge "other" category includes clients who were discharged because they were incarcerated, died,
moved, became ill, were hospitalized, or another reason somewhat out of client's control, or if the client status at discharge was not known.
Percentages are based on all admissions with known and valid values. Admissions for which values were not collected, unknown, or missing are
excluded from the percentage base (denominator).
Table 2.1. Outpatient treatment discharges aged 12 and older, by reason for discharge and state or jurisdiction: Number and
percent distribution, 2012
State or jurisdiction
Reason for discharge (number) Reason for discharge (percent distribution)
79

Total Completed
Transferred to
further treatment
Dropped
out
Terminated
by facility Other
Completed
treatment
or transferred
to further treatment
Did not complete
treatment or
transfer
to further treatment
All outpatient treatment discharges 703,290 262,270 96,182 216,925 58,636 69,277 51.0 129
Gender
Male 464,643 182,052 56,817 140,147 38,850 46,777 66.7 65.5 51.4 126
Female 238,440 80,166 39,323 76,691 19,780 22,480 33.3 34.5 50.1 138
No. of discharges 703,083 262,218 96,140 216,838 58,630 69,257 100.0 100.0 51.0 129
Age at admission
12 to 20 years 124,579 44,787 17,494 39,780 10,110 12,408 17.4 18.1 50.0 120
21 to 30 years 223,635 81,579 30,029 69,206 20,449 22,372 31.1 32.5 49.9 127
31 to 40 years 153,813 56,632 21,702 47,159 13,008 15,312 21.9 21.9 50.9 131
41 to 50 years 126,483 47,365 17,553 39,324 9,946 12,295 18.1 17.9 51.3 136
Over 50 years 74,780 31,907 9,404 21,456 5,123 6,890 11.5 9.7 55.2 135
No. of discharges 703,290 262,270 96,182 216,925 58,636 69,277 100.0 100.0 51.0 129
Race/ethnicity
White (non-Hispanic) 413,953 160,441 59,068 120,609 33,480 40,355 62.0 56.9 53.0 123
Black (non-Hispanic) 140,163 44,626 17,878 47,489 14,088 16,082 17.7 22.7 44.6 135
Hispanic origin 97,568 36,634 12,237 33,486 7,237 7,974 13.8 14.3 50.1 148
Other 43,827 16,746 6,312 13,596 3,080 4,093 6.5 6.1 52.6 141
No. of discharges 695,511 258,447 95,495 215,180 57,885 68,504 100.0 100.0 50.9 129
No. of prior treatment episodes
None 336,199 137,119 46,310 99,488 23,722 29,560 52.9 46.2 54.6 124
1 or more 341,360 115,622 47,685 110,307 32,004 35,742 47.1 53.8 47.8 138
No. of discharges 677,559 252,741 93,995 209,795 55,726 65,302 100.0 100.0 51.2 129
Treatment referral source
Criminal justice/DUI 339,194 159,321 40,071 80,076 27,034 32,692 56.3 41.5 58.8 128
Self or individual 157,021 39,826 24,875 64,247 13,024 15,049 18.3 27.4 41.2 133Health care/community 194,647 59,619 30,174 68,402 17,249 19,203 25.4 31.1 46.1 133
No. of discharges 690,862 258,766 95,120 212,725 57,307 66,944 100.0 100.0 51.2 129
Years of education1
Fewer than 12 years 185,450 60,683 26,983 62,160 17,575 18,049 27.6 32.1 47.3 138
12 years (or GED) 274,162 105,418 36,790 82,325 23,009 26,620 44.8 43.3 51.9 128
More than 12 years 162,460 67,060 20,242 46,687 12,461 16,010 27.5 24.7 53.7 127
No. of discharges 622,072 233,161 84,015 191,172 53,045 60,679 100.0 100.0 51.0 130
SOURCE: Center for Behavioral Health Statistics and Quality, Substance Abuse and Mental Health Services Administration, Treatment Episode Data Set (TEDS). Data received through 01.23.15.
Percent distribution
Rate of treatment
completion or
transfer to further
treatment
Median LOS
(days) among
treatment
completers
Table 2.2. Outpatient treatment discharges aged 12 and older, by reason for discharge, treatment completion/transfer, median length of stay (LOS), and
characteristics at admission: Number, percent distribution, and rate, 2012
1 Includes only discharges aged 18 and older for years of education. Self-contained special education classes that have no grade level equivalent are excluded from the tabulation because there were too few
cases to report.
Characteristics at admission
Reason for discharge
NOTES: Based on linked admission and discharge data reported by the 49 states and jurisdictions that offered outpatient substance abuse treatment and reported these data to TEDS. The reason for discharge
"other" category includes clients who were discharged because they were incarcerated, died, moved, became ill, were hospitalized, or another reason somewhat out of client's control, or if the client status at
discharge was not known.Percentages are based on all admissions with known and valid values. Admissions for which values were not collected, unknown, or missing are excluded from the percentage base
(denominator).
80
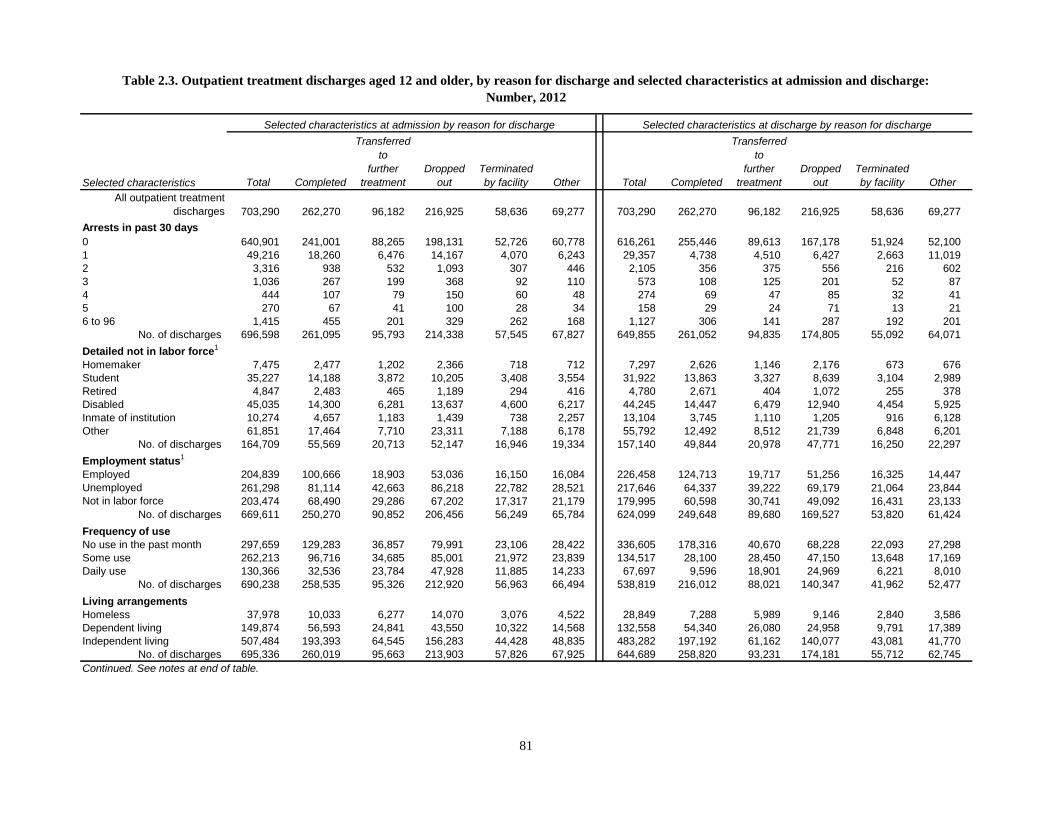
Total Completed
Transferred
to
further
treatment
Dropped
out
Terminated
by facility Other Total Completed
Transferred
to
further
treatment
Dropped
out
Terminated
by facility Other
All outpatient treatment
discharges 703,290 262,270 96,182 216,925 58,636 69,277 703,290 262,270 96,182 216,925 58,636 69,277
Arrests in past 30 days
0 640,901 241,001 88,265 198,131 52,726 60,778 616,261 255,446 89,613 167,178 51,924 52,100
1 49,216 18,260 6,476 14,167 4,070 6,243 29,357 4,738 4,510 6,427 2,663 11,019
2 3,316 938 532 1,093 307 446 2,105 356 375 556 216 602
3 1,036 267 199 368 92 110 573 108 125 201 52 87
4 444 107 79 150 60 48 274 69 47 85 32 41
5 270 67 41 100 28 34 158 29 24 71 13 21
6 to 96 1,415 455 201 329 262 168 1,127 306 141 287 192 201
No. of discharges 696,598 261,095 95,793 214,338 57,545 67,827 649,855 261,052 94,835 174,805 55,092 64,071
Detailed not in labor force1
Homemaker 7,475 2,477 1,202 2,366 718 712 7,297 2,626 1,146 2,176 673 676
Student 35,227 14,188 3,872 10,205 3,408 3,554 31,922 13,863 3,327 8,639 3,104 2,989
Retired 4,847 2,483 465 1,189 294 416 4,780 2,671 404 1,072 255 378
Disabled 45,035 14,300 6,281 13,637 4,600 6,217 44,245 14,447 6,479 12,940 4,454 5,925
Inmate of institution 10,274 4,657 1,183 1,439 738 2,257 13,104 3,745 1,110 1,205 916 6,128
Other 61,851 17,464 7,710 23,311 7,188 6,178 55,792 12,492 8,512 21,739 6,848 6,201
No. of discharges 164,709 55,569 20,713 52,147 16,946 19,334 157,140 49,844 20,978 47,771 16,250 22,297
Employment status1
Employed 204,839 100,666 18,903 53,036 16,150 16,084 226,458 124,713 19,717 51,256 16,325 14,447
Unemployed 261,298 81,114 42,663 86,218 22,782 28,521 217,646 64,337 39,222 69,179 21,064 23,844
Not in labor force 203,474 68,490 29,286 67,202 17,317 21,179 179,995 60,598 30,741 49,092 16,431 23,133
No. of discharges 669,611 250,270 90,852 206,456 56,249 65,784 624,099 249,648 89,680 169,527 53,820 61,424
Frequency of use
No use in the past month 297,659 129,283 36,857 79,991 23,106 28,422 336,605 178,316 40,670 68,228 22,093 27,298
Some use 262,213 96,716 34,685 85,001 21,972 23,839 134,517 28,100 28,450 47,150 13,648 17,169
Daily use 130,366 32,536 23,784 47,928 11,885 14,233 67,697 9,596 18,901 24,969 6,221 8,010
No. of discharges 690,238 258,535 95,326 212,920 56,963 66,494 538,819 216,012 88,021 140,347 41,962 52,477
Living arrangements
Homeless 37,978 10,033 6,277 14,070 3,076 4,522 28,849 7,288 5,989 9,146 2,840 3,586
Dependent living 149,874 56,593 24,841 43,550 10,322 14,568 132,558 54,340 26,080 24,958 9,791 17,389
Independent living 507,484 193,393 64,545 156,283 44,428 48,835 483,282 197,192 61,162 140,077 43,081 41,770
No. of discharges 695,336 260,019 95,663 213,903 57,826 67,925 644,689 258,820 93,231 174,181 55,712 62,745
Selected characteristics at discharge by reason for discharge
Table 2.3. Outpatient treatment discharges aged 12 and older, by reason for discharge and selected characteristics at admission and discharge:
Number, 2012
Selected characteristics
Selected characteristics at admission by reason for discharge
Continued. See notes at end of table.
81

Total Completed
Transferred
to
further
treatment
Dropped
out
Terminated
by facility Other Total Completed
Transferred
to
further
treatment
Dropped
out
Terminated
by facility Other
Primary substance
Alcohol 280,774 129,543 29,443 75,370 21,062 25,356 261,826 117,575 28,835 70,837 20,508 24,071
Opiates 98,863 22,685 20,353 34,961 9,975 10,889 94,292 20,279 20,250 33,614 9,732 10,417
Marijuana/hashish 191,075 68,162 24,075 62,047 17,541 19,250 176,074 60,604 23,601 57,068 16,970 17,831
Cocaine 50,375 14,502 7,712 17,797 4,774 5,590 47,828 13,142 7,592 17,007 4,662 5,425
Stimulants 59,444 20,282 11,635 19,314 3,246 4,967 58,215 20,158 11,743 18,186 3,253 4,875
Other/unknown 22,759 7,096 2,964 7,436 2,038 3,225 65,055 30,512 4,161 20,213 3,511 6,658
No. of discharges 703,290 262,270 96,182 216,925 58,636 69,277 703,290 262,270 96,182 216,925 58,636 69,277
Self-help programs
attended in past 30 days
No attendance in the past
month 405,392 150,927 49,615 123,850 39,082 41,918 338,471 114,536 37,473 111,371 37,621 37,470At least 1 time in the past
month 119,582 42,768 17,575 34,439 10,873 13,927 125,088 61,682 15,739 26,977 8,140 12,550
1-3 times in past month 23,660 8,667 2,823 6,687 2,249 3,234 25,527 11,735 2,646 5,860 1,774 3,512
4-7 times in past month 20,005 7,544 2,443 5,423 1,697 2,898 23,629 12,195 2,497 4,892 1,309 2,736
8-15 times in past month 19,640 7,933 3,022 4,509 1,658 2,518 21,480 11,758 3,056 3,552 1,091 2,023
16-30 times in past month 22,112 8,294 5,505 4,539 1,451 2,323 16,004 6,739 3,915 2,863 839 1,648Some attendance, but
frequency unknown 34,165 10,330 3,782 13,281 3,818 2,954 38,448 19,255 3,625 9,810 3,127 2,631
No. of discharges 524,974 193,695 67,190 158,289 49,955 55,845 463,559 176,218 53,212 138,348 45,761 50,020
NOTES: Based on linked admission and discharge data reported by the 49 states and jurisdictions that offered outpatient substance abuse treatment and reported these data to TEDS.
The reason for discharge "other" category includes clients who were discharged because they were incarcerated, died, moved, became ill, were hospitalized, or another reason somewhat
out of client's control, or if the client status at discharge was not known.
SOURCE: Center for Behavioral Health Statistics and Quality, Substance Abuse and Mental Health Services Administration, Treatment Episode Data Set (TEDS). Data received through
01.23.15.
Table 2.3. Outpatient treatment discharges aged 12 and older, by reason for discharge and selected characteristics at admission and discharge:
Number, 2012 (continued)
Selected characteristics
Selected characteristics at admission by reason for discharge Selected characteristics at discharge by reason for discharge
1 Includes only discharges aged 16 and above for employment status and detailed not in labor force.
82
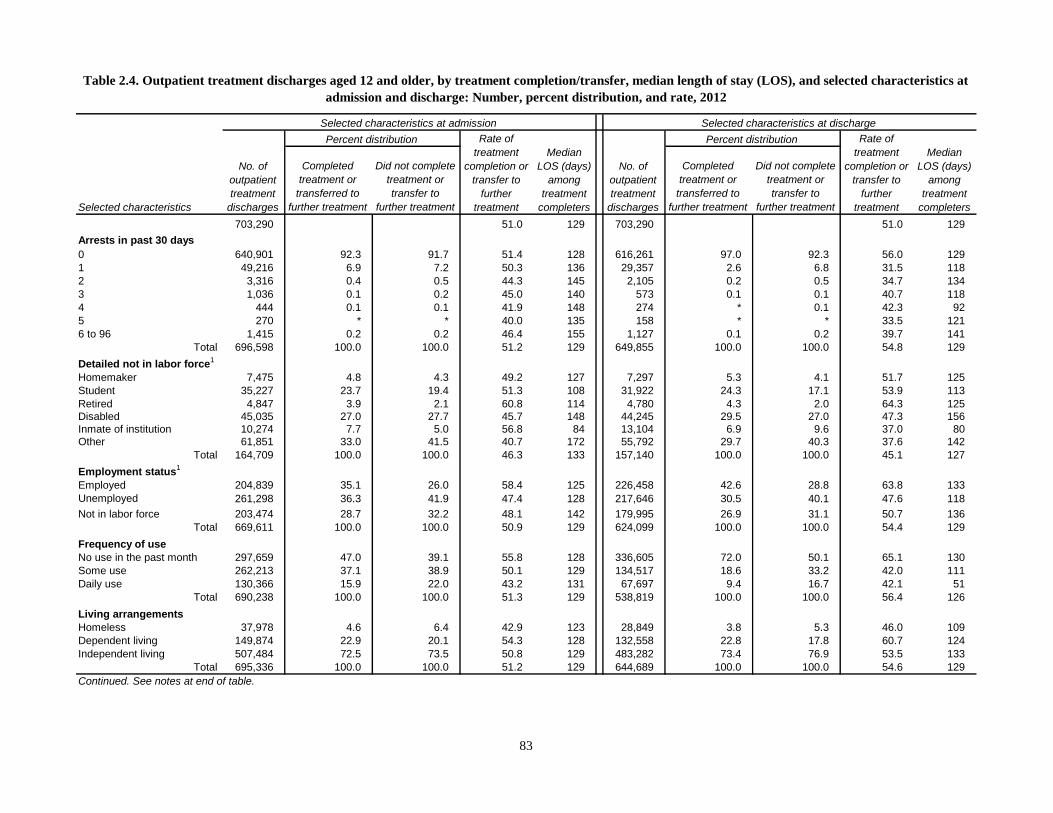
Completed
treatment or
transferred to
further treatment
Did not complete
treatment or
transfer to
further treatment
Completed
treatment or
transferred to
further treatment
Did not complete
treatment or
transfer to
further treatment
703,290 51.0 129 703,290 51.0 129
Arrests in past 30 days
0 640,901 92.3 91.7 51.4 128 616,261 97.0 92.3 56.0 129
1 49,216 6.9 7.2 50.3 136 29,357 2.6 6.8 31.5 118
2 3,316 0.4 0.5 44.3 145 2,105 0.2 0.5 34.7 134
3 1,036 0.1 0.2 45.0 140 573 0.1 0.1 40.7 118
4 444 0.1 0.1 41.9 148 274 * 0.1 42.3 92
5 270 * * 40.0 135 158 * * 33.5 121
6 to 96 1,415 0.2 0.2 46.4 155 1,127 0.1 0.2 39.7 141
Total 696,598 100.0 100.0 51.2 129 649,855 100.0 100.0 54.8 129
Detailed not in labor force1
Homemaker 7,475 4.8 4.3 49.2 127 7,297 5.3 4.1 51.7 125
Student 35,227 23.7 19.4 51.3 108 31,922 24.3 17.1 53.9 113
Retired 4,847 3.9 2.1 60.8 114 4,780 4.3 2.0 64.3 125
Disabled 45,035 27.0 27.7 45.7 148 44,245 29.5 27.0 47.3 156
Inmate of institution 10,274 7.7 5.0 56.8 84 13,104 6.9 9.6 37.0 80
Other 61,851 33.0 41.5 40.7 172 55,792 29.7 40.3 37.6 142
Total 164,709 100.0 100.0 46.3 133 157,140 100.0 100.0 45.1 127
Employment status1
Employed 204,839 35.1 26.0 58.4 125 226,458 42.6 28.8 63.8 133
Unemployed 261,298 36.3 41.9 47.4 128 217,646 30.5 40.1 47.6 118
Not in labor force 203,474 28.7 32.2 48.1 142 179,995 26.9 31.1 50.7 136
Total 669,611 100.0 100.0 50.9 129 624,099 100.0 100.0 54.4 129
Frequency of use
No use in the past month 297,659 47.0 39.1 55.8 128 336,605 72.0 50.1 65.1 130
Some use 262,213 37.1 38.9 50.1 129 134,517 18.6 33.2 42.0 111
Daily use 130,366 15.9 22.0 43.2 131 67,697 9.4 16.7 42.1 51
Total 690,238 100.0 100.0 51.3 129 538,819 100.0 100.0 56.4 126
Living arrangements
Homeless 37,978 4.6 6.4 42.9 123 28,849 3.8 5.3 46.0 109
Dependent living 149,874 22.9 20.1 54.3 128 132,558 22.8 17.8 60.7 124
Independent living 507,484 72.5 73.5 50.8 129 483,282 73.4 76.9 53.5 133
Total 695,336 100.0 100.0 51.2 129 644,689 100.0 100.0 54.6 129
Continued. See notes at end of table.
Selected characteristics at admission Selected characteristics at discharge
Table 2.4. Outpatient treatment discharges aged 12 and older, by treatment completion/transfer, median length of stay (LOS), and selected characteristics at
admission and discharge: Number, percent distribution, and rate, 2012
Percent distribution Percent distribution
No. of
outpatient
treatment
discharges
Rate of
treatment
completion or
transfer to
further
treatment
Median
LOS (days)
among
treatment
completers
No. of
outpatient
treatment
discharges
Rate of
treatment
completion or
transfer to
further
treatment
Median
LOS (days)
among
treatment
completersSelected characteristics
83

Completed
treatment or
transferred to
further treatment
Did not complete
treatment or
transfer to
further treatment
Completed
treatment or
transferred to
further treatment
Did not complete
treatment or
transfer to
further treatment
Primary substance
Alcohol 280,774 44.4 35.3 56.6 126 261,826 40.8 33.5 55.9 125
Opiates 98,863 12.0 16.2 43.5 135 94,292 11.3 15.6 43.0 135
Marijuana/hashish 191,075 25.7 28.7 48.3 126 176,074 23.5 26.6 47.8 127
Cocaine 50,375 6.2 8.2 44.1 150 47,828 5.8 7.9 43.4 152
Stimulants 59,444 8.9 8.0 53.7 152 58,215 8.9 7.6 54.8 154
Other/unknown 22,759 2.8 3.7 44.2 137 65,055 9.7 8.8 53.3 127
Total 703,290 100.0 100.0 51.0 129 703,290 100.0 100.0 51.0 129
Self-help programs
attended in past 30 days No attendance in the past
month 405,392 76.9 77.6 49.5 120 338,471 66.3 79.6 44.9 119At least 1 time in the past
month 119,582 23.1 22.4 50.5 131 125,088 33.7 20.4 61.9 140
1-3 times in past month 23,660 4.4 4.6 48.6 122 25,527 6.3 4.8 56.3 107
4-7 times in past month 20,005 3.8 3.8 49.9 121 23,629 6.4 3.8 62.2 119
8-15 times in past month 19,640 4.2 3.3 55.8 124 21,480 6.5 2.8 69.0 131
16-30 times in past month 22,112 5.3 3.1 62.4 85 16,004 4.6 2.3 66.6 110Some attendance, but
frequency unknown 34,165 5.4 7.6 41.3 190 38,448 10.0 6.6 59.5 193
Total 524,974 100.0 100.0 49.7 121 463,559 100.0 100.0 49.5 126
* Less than 0.05 percent.
No. of
outpatient
treatment
discharges
Rate of
treatment
completion or
transfer to
further
treatment
Median
LOS (days)
among
treatment
completers
1 Includes only discharges aged 16 and above for employment status and detailed not in labor force.
NOTES: Based on linked admission and discharge data reported by the 49 states and jurisdictions that offered outpatient substance abuse treatment and reported these data to TEDS.
Percentages may not add to 100 percent due to rounding. In LOS calculations, missing values of the associated variables were excluded. Percentages are based on all admissions with
known and valid values. Admissions for which values were not collected, unknown, or missing are excluded from the percentage base (denominator).
SOURCE: Center for Behavioral Health Statistics and Quality, Substance Abuse and Mental Health Services Administration, Treatment Episode Data Set (TEDS). Data received through
01.23.15.
Table 2.4. Outpatient treatment discharges aged 12 and older, by treatment completion/transfer, median length of stay (LOS), and selected characteristics at
admission and discharge: Number, percent distribution, and rate, 2012 (continued)
Selected characteristics at admission Selected characteristics at discharge
Selected characteristics
No. of
outpatient
treatment
discharges
Rate of
treatment
completion or
transfer to
further
treatment
Median
LOS (days)
among
treatment
completers
Percent distribution Percent distribution
84

All intensive outpatient
treatment discharges
Com-
pleted
Trans-
ferred
Dropped
out
Termi-
nated Other Total
Com-
pleted
Trans-
ferred
Dropped
out
Termi-
nated Other
Total 203,127 67,411 45,708 53,407 18,372 18,229 100.0 33.2 22.5 26.3 9.0 9.0
Alabama 1,458 509 127 444 104 274 100.0 34.9 8.7 30.5 7.1 18.8Alaska 424 105 47 95 118 59 100.0 24.8 11.1 22.4 27.8 13.9Arizona 58 35 - - 15 - - 8 100.0 60.3 - - 25.9 - - 13.8Arkansas 543 375 49 44 71 4 100.0 69.1 9.0 8.1 13.1 0.7California 7,708 2,395 1,639 3,482 - - 192 100.0 31.1 21.3 45.2 - - 2.5
Colorado 2,881 1,415 398 404 359 305 100.0 49.1 13.8 14.0 12.5 10.6Connecticut 11,292 5,353 2,209 1,977 1,048 705 100.0 47.4 19.6 17.5 9.3 6.2Delaware 407 133 20 139 16 99 100.0 32.7 4.9 34.2 3.9 24.3District of Columbia 711 217 149 - - 140 205 100.0 30.5 21.0 - - 19.7 28.8Florida 170 94 41 18 4 13 100.0 55.3 24.1 10.6 2.4 7.6
Georgia 797 125 227 109 90 246 100.0 15.7 28.5 13.7 11.3 30.9Hawaii 3,100 409 1,568 485 541 97 100.0 13.2 50.6 15.6 17.5 3.1Idaho 1,330 295 6 564 120 345 100.0 22.2 0.5 42.4 9.0 25.9Illinois 5,231 1,320 1,156 2,132 443 180 100.0 25.2 22.1 40.8 8.5 3.4Indiana 1,819 733 13 740 255 78 100.0 40.3 0.7 40.7 14.0 4.3
Iowa 4,116 1,540 373 1,589 333 281 100.0 37.4 9.1 38.6 8.1 6.8Kentucky 7,387 343 6,671 190 30 153 100.0 4.6 90.3 2.6 0.4 2.1Louisiana 1,900 263 280 939 247 171 100.0 13.8 14.7 49.4 13.0 9.0Maine 1,167 587 - - 367 115 98 100.0 50.3 - - 31.4 9.9 8.4Maryland 11,101 3,528 2,508 3,706 1,009 350 100.0 31.8 22.6 33.4 9.1 3.2
Massachusetts - - - - - - - - - - - - - - - - - - - - - - - -Michigan 2,572 551 663 892 197 269 100.0 21.4 25.8 34.7 7.7 10.5Minnesota 25,264 13,153 2,126 6,073 1,886 2,026 100.0 52.1 8.4 24.0 7.5 8.0Missouri 21,232 3,391 9,795 5,344 1,797 905 100.0 16.0 46.1 25.2 8.5 4.3Montana 1,317 151 601 435 58 72 100.0 11.5 45.6 33.0 4.4 5.5
Nebraska 678 333 52 156 50 87 100.0 49.1 7.7 23.0 7.4 12.8Nevada 1,217 109 147 163 128 670 100.0 9.0 12.1 13.4 10.5 55.1New Hampshire 610 164 78 8 73 287 100.0 26.9 12.8 1.3 12.0 47.0New Jersey 15,813 5,981 99 4,781 1,090 3,862 100.0 37.8 0.6 30.2 6.9 24.4New York 6,782 2,242 729 2,340 1,020 451 100.0 33.1 10.7 34.5 15.0 6.6
North Carolina 10,995 1,341 4,705 3,933 - - 1,016 100.0 12.2 42.8 35.8 - - 9.2North Dakota 247 57 8 110 38 34 100.0 23.1 3.2 44.5 15.4 13.8Ohio 5,526 1,952 280 1,231 1,363 700 100.0 35.3 5.1 22.3 24.7 12.7Oklahoma 41 25 2 5 2 7 100.0 61.0 4.9 12.2 4.9 17.1Oregon 6,866 2,315 996 2,195 780 580 100.0 33.7 14.5 32.0 11.4 8.4
Pennsylvania 1 - - - - - - - - 1 100.0 - - - - - - - - 100.0Puerto Rico 76 25 3 42 1 5 100.0 32.9 3.9 55.3 1.3 6.6Rhode Island 886 231 375 151 112 17 100.0 26.1 42.3 17.0 12.6 1.9South Carolina 4,153 541 1,463 1,332 666 151 100.0 13.0 35.2 32.1 16.0 3.6South Dakota 4,382 2,656 995 322 242 167 100.0 60.6 22.7 7.3 5.5 3.8
Tennessee 3,771 1,826 211 1,079 476 179 100.0 48.4 5.6 28.6 12.6 4.7Texas 6,887 4,382 241 807 874 583 100.0 63.6 3.5 11.7 12.7 8.5Utah 3,231 1,086 1,243 345 448 109 100.0 33.6 38.5 10.7 13.9 3.4Vermont 398 99 55 169 10 65 100.0 24.9 13.8 42.5 2.5 16.3Virginia 381 - - 1 121 42 217 100.0 - - 0.3 31.8 11.0 57.0
Washington 13,878 4,233 3,010 3,181 1,795 1,659 100.0 30.5 21.7 22.9 12.9 12.0West Virginia 4 - - - - 3 1 - - 100.0 - - - - 75.0 25.0 - -Wisconsin 1,090 421 241 201 135 92 100.0 38.6 22.1 18.4 12.4 8.4Wyoming 1,229 372 108 549 45 155 100.0 30.3 8.8 44.7 3.7 12.6
SOURCE: Center for Behavioral Health Statistics and Quality, Substance Abuse and Mental Health Services Administration, Treatment Episode Data
Set (TEDS). Data received through 01.23.15.
Table 3.1. Intensive outpatient treatment discharges aged 12 and older, by reason for discharge and state or jurisdiction:
Number and percent distribution, 2012
State or jurisdiction
Reason for discharge (number) Reason for discharge (percent distribution)
- - Quantity is zero.
NOTES: Based on linked admission and discharge data reported to TEDS by the 48 states and jurisdictions that offered intensive outpatient
substance abuse treatment and reported these data to TEDS. Comparisons among states should be made with caution. Percentages may not add to
100 percent due to rounding. The reason for discharge "other" category includes clients who were discharged because they were incarcerated, died,
moved, became ill, were hospitalized, or another reason somewhat out of client's control, or if the client status at discharge was not known.
Percentages are based on all admissions with known and valid values. Admissions for which values were not collected, unknown, or missing are
excluded from the percentage base (denominator).
85
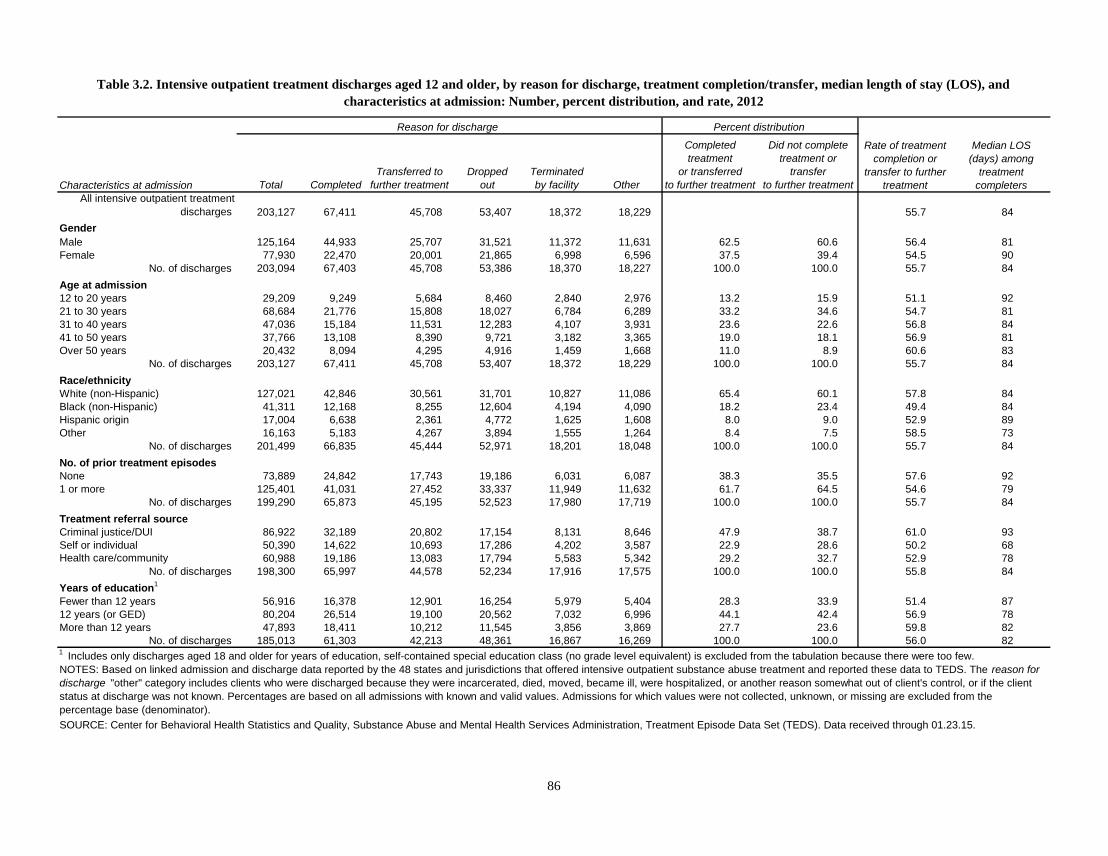
Total Completed
Transferred to
further treatment
Dropped
out
Terminated
by facility Other
Completed
treatment
or transferred
to further treatment
Did not complete
treatment or
transfer
to further treatment
All intensive outpatient treatment
discharges. 203,127 67,411 45,708 53,407 18,372 18,229 55.7 84
Gender
Male 125,164 44,933 25,707 31,521 11,372 11,631 62.5 60.6 56.4 81
Female 77,930 22,470 20,001 21,865 6,998 6,596 37.5 39.4 54.5 90
No. of discharges 203,094 67,403 45,708 53,386 18,370 18,227 100.0 100.0 55.7 84
Age at admission
12 to 20 years 29,209 9,249 5,684 8,460 2,840 2,976 13.2 15.9 51.1 92
21 to 30 years 68,684 21,776 15,808 18,027 6,784 6,289 33.2 34.6 54.7 81
31 to 40 years 47,036 15,184 11,531 12,283 4,107 3,931 23.6 22.6 56.8 84
41 to 50 years 37,766 13,108 8,390 9,721 3,182 3,365 19.0 18.1 56.9 81
Over 50 years 20,432 8,094 4,295 4,916 1,459 1,668 11.0 8.9 60.6 83
No. of discharges 203,127 67,411 45,708 53,407 18,372 18,229 100.0 100.0 55.7 84
Race/ethnicity
White (non-Hispanic) 127,021 42,846 30,561 31,701 10,827 11,086 65.4 60.1 57.8 84
Black (non-Hispanic) 41,311 12,168 8,255 12,604 4,194 4,090 18.2 23.4 49.4 84
Hispanic origin 17,004 6,638 2,361 4,772 1,625 1,608 8.0 9.0 52.9 89
Other 16,163 5,183 4,267 3,894 1,555 1,264 8.4 7.5 58.5 73
No. of discharges 201,499 66,835 45,444 52,971 18,201 18,048 100.0 100.0 55.7 84
No. of prior treatment episodes
None 73,889 24,842 17,743 19,186 6,031 6,087 38.3 35.5 57.6 92
1 or more 125,401 41,031 27,452 33,337 11,949 11,632 61.7 64.5 54.6 79
No. of discharges 199,290 65,873 45,195 52,523 17,980 17,719 100.0 100.0 55.7 84
Treatment referral source
Criminal justice/DUI 86,922 32,189 20,802 17,154 8,131 8,646 47.9 38.7 61.0 93
Self or individual 50,390 14,622 10,693 17,286 4,202 3,587 22.9 28.6 50.2 68
Health care/community 60,988 19,186 13,083 17,794 5,583 5,342 29.2 32.7 52.9 78
No. of discharges 198,300 65,997 44,578 52,234 17,916 17,575 100.0 100.0 55.8 84
Years of education1
Fewer than 12 years 56,916 16,378 12,901 16,254 5,979 5,404 28.3 33.9 51.4 87
12 years (or GED) 80,204 26,514 19,100 20,562 7,032 6,996 44.1 42.4 56.9 78
More than 12 years 47,893 18,411 10,212 11,545 3,856 3,869 27.7 23.6 59.8 82
No. of discharges 185,013 61,303 42,213 48,361 16,867 16,269 100.0 100.0 56.0 821 Includes only discharges aged 18 and older for years of education, self-contained special education class (no grade level equivalent) is excluded from the tabulation because there were too few.
NOTES: Based on linked admission and discharge data reported by the 48 states and jurisdictions that offered intensive outpatient substance abuse treatment and reported these data to TEDS. The reason for
discharge "other" category includes clients who were discharged because they were incarcerated, died, moved, became ill, were hospitalized, or another reason somewhat out of client's control, or if the client
status at discharge was not known. Percentages are based on all admissions with known and valid values. Admissions for which values were not collected, unknown, or missing are excluded from the
percentage base (denominator).
SOURCE: Center for Behavioral Health Statistics and Quality, Substance Abuse and Mental Health Services Administration, Treatment Episode Data Set (TEDS). Data received through 01.23.15.
Table 3.2. Intensive outpatient treatment discharges aged 12 and older, by reason for discharge, treatment completion/transfer, median length of stay (LOS), and
characteristics at admission: Number, percent distribution, and rate, 2012
Characteristics at admission
Reason for discharge Percent distribution
Rate of treatment
completion or
transfer to further
treatment
Median LOS
(days) among
treatment
completers
86
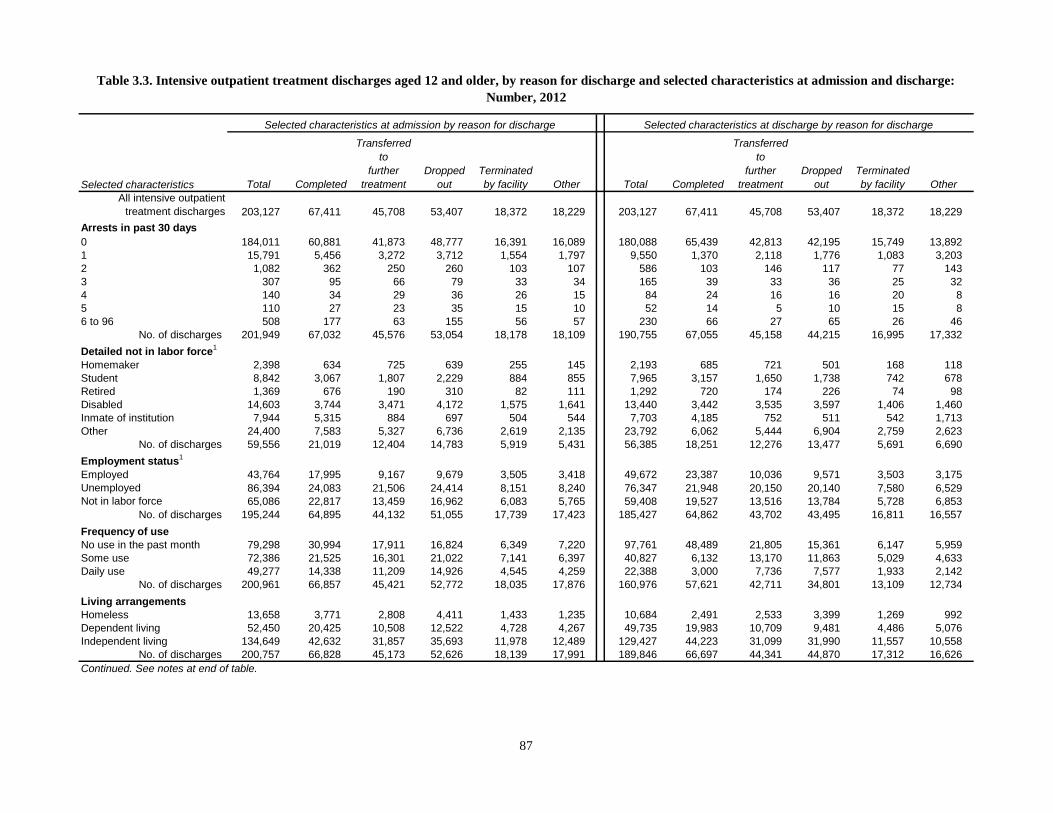
Total Completed
Transferred
to
further
treatment
Dropped
out
Terminated
by facility Other Total Completed
Transferred
to
further
treatment
Dropped
out
Terminated
by facility Other
All intensive outpatient
treatment discharges 203,127 67,411 45,708 53,407 18,372 18,229 203,127 67,411 45,708 53,407 18,372 18,229
Arrests in past 30 days
0 184,011 60,881 41,873 48,777 16,391 16,089 180,088 65,439 42,813 42,195 15,749 13,892
1 15,791 5,456 3,272 3,712 1,554 1,797 9,550 1,370 2,118 1,776 1,083 3,203
2 1,082 362 250 260 103 107 586 103 146 117 77 143
3 307 95 66 79 33 34 165 39 33 36 25 32
4 140 34 29 36 26 15 84 24 16 16 20 8
5 110 27 23 35 15 10 52 14 5 10 15 8
6 to 96 508 177 63 155 56 57 230 66 27 65 26 46
No. of discharges 201,949 67,032 45,576 53,054 18,178 18,109 190,755 67,055 45,158 44,215 16,995 17,332
Detailed not in labor force1
Homemaker 2,398 634 725 639 255 145 2,193 685 721 501 168 118
Student 8,842 3,067 1,807 2,229 884 855 7,965 3,157 1,650 1,738 742 678
Retired 1,369 676 190 310 82 111 1,292 720 174 226 74 98
Disabled 14,603 3,744 3,471 4,172 1,575 1,641 13,440 3,442 3,535 3,597 1,406 1,460
Inmate of institution 7,944 5,315 884 697 504 544 7,703 4,185 752 511 542 1,713
Other 24,400 7,583 5,327 6,736 2,619 2,135 23,792 6,062 5,444 6,904 2,759 2,623
No. of discharges 59,556 21,019 12,404 14,783 5,919 5,431 56,385 18,251 12,276 13,477 5,691 6,690
Employment status1
Employed 43,764 17,995 9,167 9,679 3,505 3,418 49,672 23,387 10,036 9,571 3,503 3,175
Unemployed 86,394 24,083 21,506 24,414 8,151 8,240 76,347 21,948 20,150 20,140 7,580 6,529
Not in labor force 65,086 22,817 13,459 16,962 6,083 5,765 59,408 19,527 13,516 13,784 5,728 6,853
No. of discharges 195,244 64,895 44,132 51,055 17,739 17,423 185,427 64,862 43,702 43,495 16,811 16,557
Frequency of use
No use in the past month 79,298 30,994 17,911 16,824 6,349 7,220 97,761 48,489 21,805 15,361 6,147 5,959
Some use 72,386 21,525 16,301 21,022 7,141 6,397 40,827 6,132 13,170 11,863 5,029 4,633
Daily use 49,277 14,338 11,209 14,926 4,545 4,259 22,388 3,000 7,736 7,577 1,933 2,142
No. of discharges 200,961 66,857 45,421 52,772 18,035 17,876 160,976 57,621 42,711 34,801 13,109 12,734
Living arrangements
Homeless 13,658 3,771 2,808 4,411 1,433 1,235 10,684 2,491 2,533 3,399 1,269 992
Dependent living 52,450 20,425 10,508 12,522 4,728 4,267 49,735 19,983 10,709 9,481 4,486 5,076
Independent living 134,649 42,632 31,857 35,693 11,978 12,489 129,427 44,223 31,099 31,990 11,557 10,558
No. of discharges 200,757 66,828 45,173 52,626 18,139 17,991 189,846 66,697 44,341 44,870 17,312 16,626
Continued. See notes at end of table.
Table 3.3. Intensive outpatient treatment discharges aged 12 and older, by reason for discharge and selected characteristics at admission and discharge:
Number, 2012
Selected characteristics
Selected characteristics at admission by reason for discharge Selected characteristics at discharge by reason for discharge
87

Total Completed
Transferred
to
further
treatment
Dropped
out
Terminated
by facility Other Total Completed
Transferred
to
further
treatment
Dropped
out
Terminated
by facility Other
Primary substance
Alcohol 74,222 30,281 14,413 17,775 5,848 5,905 68,327 27,807 14,063 15,770 5,515 5,172
Opiates 39,468 10,332 9,969 11,275 3,863 4,029 34,083 8,207 9,556 9,606 3,556 3,158
Marijuana/hashish 45,937 14,541 9,617 12,712 4,516 4,551 40,525 12,571 9,344 10,767 4,135 3,708
Cocaine 16,581 4,834 3,780 4,770 1,615 1,582 14,943 4,102 3,660 4,268 1,525 1,388
Stimulants 20,878 5,614 6,550 5,186 1,935 1,593 20,407 5,580 6,513 4,833 1,933 1,548
Other/unknown 6,041 1,809 1,379 1,689 595 569 24,842 9,144 2,572 8,163 1,708 3,255
No. of discharges 203,127 67,411 45,708 53,407 18,372 18,229 203,127 67,411 45,708 53,407 18,372 18,229
Self-help programs
attended in past 30 days
No attendance in the past
month 109,828 34,110 27,444 28,176 10,652 9,446 74,952 19,668 21,402 19,342 8,256 6,284At least 1 time in the past
month 50,144 18,423 10,758 11,195 4,541 5,227 57,781 28,751 13,025 8,165 4,193 3,647
1-3 times in past month 13,584 4,847 2,763 3,244 1,284 1,446 13,715 5,871 3,071 2,541 1,193 1,039
4-7 times in past month 10,259 3,774 2,332 2,132 956 1,065 13,755 7,306 2,893 1,802 973 781
8-15 times in past month 11,087 4,060 2,670 2,144 947 1,266 14,295 7,505 3,865 1,377 800 748
16-30 times in past month 9,338 3,483 2,240 1,883 735 997 8,962 4,828 2,391 749 421 573Some attendance, but
frequency unknown 5,876 2,259 753 1,792 619 453 7,054 3,241 805 1,696 806 506
No. of discharges 159,972 52,533 38,202 39,371 15,193 14,673 132,733 48,419 34,427 27,507 12,449 9,931
NOTES: Based on linked admission and discharge data reported by the 48 states and jurisdictions that offered intensive outpatient substance abuse treatment and reported these data to
TEDS. The reason for discharge "other" category includes clients who were discharged because they were incarcerated, died, moved, became ill, were hospitalized, or another reason
somewhat out of client's control, or if the client status at discharge was not known. Percentages are based on all admissions with known and valid values. Admissions for which values were
not collected, unknown, or missing are excluded from the percentage base (denominator).
SOURCE: Center for Behavioral Health Statistics and Quality, Substance Abuse and Mental Health Services Administration, Treatment Episode Data Set (TEDS). Data received through
01.23.15.
Table 3.3. Intensive outpatient treatment discharges aged 12 and older, by reason for discharge and selected characteristics at admission and discharge:
Number, 2012 (continued)
Selected characteristics
Selected characteristics at admission by reason for discharge Selected characteristics at discharge by reason for discharge
1 Includes only discharges aged 16 and above for employment status and detailed not in labor force.
88

Completed
treatment or
transferred to
further treatment
Did not complete
treatment or
transfer to
further treatment
Completed
treatment or
transferred to
further treatment
Did not complete
treatment or
transfer to
further treatment
203,127 55.7 84 203,127 55.7 84
Arrests in past 30 days
0 184,011 91.2 91.0 55.8 84 180,088 96.5 91.5 60.1 84
1 15,791 7.8 7.9 55.3 80 9,550 3.1 7.7 36.5 77
2 1,082 0.5 0.5 56.6 74 586 0.2 0.4 42.5 76
3 307 0.1 0.2 52.4 85 165 0.1 0.1 43.6 104
4 140 0.1 0.1 45.0 92 84 * 0.1 47.6 90
5 110 * 0.1 45.5 107 52 * * 36.5 80
6 to 96 508 0.2 0.3 47.2 156 230 0.1 0.2 40.4 55
Total 201,949 100.0 100.0 55.8 84 190,755 100.0 100.0 58.8 84
Detailed not in labor force1
Homemaker 2,398 4.1 4.0 56.7 89 2,193 4.6 3.0 64.1 98
Student 8,842 14.6 15.2 55.1 85 7,965 15.7 12.2 60.4 90
Retired 1,369 2.6 1.9 63.3 89 1,292 2.9 1.5 69.2 86
Disabled 14,603 21.6 28.3 49.4 101 13,440 22.9 25.0 51.9 106
Inmate of institution 7,944 18.5 6.7 78.0 70 7,703 16.2 10.7 64.1 71
Other 24,400 38.6 44.0 52.9 75 23,792 37.7 47.5 48.4 65
Total 59,556 100.0 100.0 56.1 78 56,385 100.0 100.0 54.1 79
Employment status1
Employed 43,764 24.9 19.3 62.1 87 49,672 30.8 21.1 67.3 95
Unemployed 86,394 41.8 47.3 52.8 79 76,347 38.8 44.6 55.1 68
Not in labor force 65,086 33.3 33.4 55.7 82 59,408 30.4 34.3 55.6 81
Total 195,244 100.0 100.0 55.8 83 185,427 100.0 100.0 58.5 83
Frequency of use
No use in the past month 79,298 43.6 34.3 61.7 92 97,761 70.1 45.3 71.9 87
Some use 72,386 33.7 39.0 52.3 85 40,827 19.2 35.5 47.3 52
Daily use 49,277 22.8 26.8 51.8 59 22,388 10.7 19.2 48.0 36
Total 200,961 100.0 100.0 55.9 84 160,976 100.0 100.0 62.3 81
Living arrangements
Homeless 13,658 5.9 8.0 48.2 85 10,684 4.5 7.2 47.0 88
Dependent living 52,450 27.6 24.2 59.0 79 49,735 27.6 24.2 61.7 74
Independent living 134,649 66.5 67.8 55.3 86 129,427 67.8 68.7 58.2 88
Total 200,757 100.0 100.0 55.8 84 189,846 100.0 100.0 58.5 84
Table 3.4. Intensive outpatient treatment discharges aged 12 and older, by treatment completion/transfer, median length of stay (LOS), and selected
characteristics at admission and discharge: Number, percent distribution, and rate, 2012
Selected characteristics at admission Selected characteristics at discharge
Percent distribution Rate of
treatment
completion or
transfer to
further
treatment
Median
LOS (days)
among
treatment
completers
Continued. See notes at end of table.
Selected characteristics
No. of
intensive
outpatient
treatment
discharges
Percent distribution Rate of
treatment
completion or
transfer to
further
treatment
Median
LOS (days)
among
treatment
completers
No. of
intensive
outpatient
treatment
discharges
89

Completed
treatment or
transferred to
further treatment
Did not complete
treatment or
transfer to
further treatment
Completed
treatment or
transferred to
further treatment
Did not complete
treatment or
transfer to
further treatment
Primary substance
Alcohol 74,222 39.5 32.8 60.2 84 68,327 37.0 29.4 61.3 82
Opiates 39,468 17.9 21.3 51.4 64 34,083 15.7 18.1 52.1 58
Marijuana/hashish 45,937 21.4 24.2 52.6 92 40,525 19.4 20.7 54.1 90
Cocaine 16,581 7.6 8.9 52.0 72 14,943 6.9 8.0 51.9 68
Stimulants 20,878 10.8 9.7 58.3 105 20,407 10.7 9.2 59.3 104
Other/unknown 6,041 2.8 3.2 52.8 70 24,842 10.4 14.6 47.2 92
Total 203,127 100.0 100.0 55.7 84 203,127 100.0 100.0 55.7 84
Self-help programs
attended in past 30 days No attendance in the past
month 109,828 67.8 69.7 56.0 78 74,952 49.6 67.9 54.8 74At least 1 time in the past
month 50,144 32.2 30.3 58.2 78 57,781 50.4 32.1 72.3 82
1-3 times in past month 13,584 8.4 8.6 56.0 79 13,715 10.8 9.6 65.2 88
4-7 times in past month 10,259 6.7 6.0 59.5 79 13,755 12.3 7.1 74.1 87
8-15 times in past month 11,087 7.4 6.3 60.7 71 14,295 13.7 5.9 79.5 81
16-30 times in past month 9,338 6.3 5.2 61.3 59 8,962 8.7 3.5 80.6 51Some attendance, but
frequency unknown 5,876 3.3 4.1 51.3 102 7,054 4.9 6.0 57.4 102
Total 159,972 100.0 100.0 56.7 78 132,733 100.0 100.0 62.4 79
SOURCE: Center for Behavioral Health Statistics and Quality, Substance Abuse and Mental Health Services Administration, Treatment Episode Data Set (TEDS). Data received through
01.23.15.
Percent distribution Rate of
treatment
completion or
transfer to
further
treatment
Median
LOS (days)
among
treatment
completers
* Less than 0.05 percent.1
Includes only discharges aged 16 and above for employment status and detailed not in labor force.
NOTES: Based on linked admission and discharge data reported by the 48 states and jurisdictions that offered intensive outpatient substance abuse treatment and reported these data to
TEDS. Percentages may not add to 100 percent due to rounding. In LOS calculations, missing values of the associated variables were excluded.Percentages are based on all admissions
with known and valid values. Admissions for which values were not collected, unknown, or missing are excluded from the percentage base (denominator).
Selected characteristics
No. of
intensive
outpatient
treatment
discharges
Percent distribution Rate of
treatment
completion or
transfer to
further
treatment
Median
LOS (days)
among
treatment
completers
No. of
intensive
outpatient
treatment
discharges
Selected characteristics at admission Selected characteristics at discharge
Table 3.4. Intensive outpatient treatment discharges aged 12 and older, by treatment completion/transfer, median length of stay (LOS), and selected
characteristics at admission and discharge: Number, percent distribution, and rate, 2012 (continued)
90

All short-term
residential treat-
ment discharges
Com-
pleted
Trans-
ferred
Dropped
out
Termi-
nated Other Total
Com-
pleted
Trans-
ferred
Dropped
out
Termi-
nated Other
Total 165,609 90,561 27,502 30,455 11,203 5,888 100.0 54.7 16.6 18.4 6.8 3.6Alabama 539 393 6 70 57 13 100.0 72.9 1.1 13.0 10.6 2.4Alaska 135 95 7 24 8 1 100.0 70.4 5.2 17.8 5.9 0.7Arizona 848 433 - - 357 - - 58 100.0 51.1 - - 42.1 - - 6.8Arkansas 1,719 858 153 454 222 32 100.0 49.9 8.9 26.4 12.9 1.9California 1,308 865 287 151 - - 5 100.0 66.1 21.9 11.5 - - 0.4
Colorado 4,677 3,789 123 391 264 110 100.0 81.0 2.6 8.4 5.6 2.4Connecticut 2,660 1,860 232 406 126 36 100.0 69.9 8.7 15.3 4.7 1.4Delaware 47 17 11 10 3 6 100.0 36.2 23.4 21.3 6.4 12.8District of Columbia 1,774 1,215 43 - - 55 461 100.0 68.5 2.4 - - 3.1 26.0Florida 62 33 17 9 1 2 100.0 53.2 27.4 14.5 1.6 3.2
Georgia - - - - - - - - - - - - - - - - - - - - - - - -Hawaii - - - - - - - - - - - - - - - - - - - - - - - -Idaho 90 13 - - 47 16 14 100.0 14.4 - - 52.2 17.8 15.6Illinois 6,909 2,726 1,928 1,546 684 25 100.0 39.5 27.9 22.4 9.9 0.4Indiana 449 229 17 139 56 8 100.0 51.0 3.8 31.0 12.5 1.8
Iowa 2,556 1,620 75 573 221 67 100.0 63.4 2.9 22.4 8.6 2.6Kentucky 2,483 468 1,801 80 89 45 100.0 18.8 72.5 3.2 3.6 1.8Louisiana 6,453 628 3,982 1,619 207 17 100.0 9.7 61.7 25.1 3.2 0.3Maine 568 398 - - 68 85 17 100.0 70.1 - - 12.0 15.0 3.0Maryland 7,031 5,110 479 832 585 25 100.0 72.7 6.8 11.8 8.3 0.4
Massachusetts 4,477 2,994 41 916 440 86 100.0 66.9 0.9 20.5 9.8 1.9Michigan 5,266 1,277 2,326 1,116 225 322 100.0 24.2 44.2 21.2 4.3 6.1Minnesota 10,018 7,045 338 1,732 644 259 100.0 70.3 3.4 17.3 6.4 2.6Missouri 12,558 2,866 6,922 1,872 732 166 100.0 22.8 55.1 14.9 5.8 1.3Montana 125 53 37 27 7 1 100.0 42.4 29.6 21.6 5.6 0.8
Nebraska 1,262 869 24 226 52 91 100.0 68.9 1.9 17.9 4.1 7.2Nevada 1,956 763 95 344 167 587 100.0 39.0 4.9 17.6 8.5 30.0New Hampshire 1,068 632 76 32 152 176 100.0 59.2 7.1 3.0 14.2 16.5New Jersey 6,997 5,125 94 1,052 263 463 100.0 73.2 1.3 15.0 3.8 6.6New York 37,696 26,007 1,978 7,085 2,354 272 100.0 69.0 5.2 18.8 6.2 0.7
North Carolina 5,176 3,197 619 974 200 186 100.0 61.8 12.0 18.8 3.9 3.6North Dakota 98 41 7 31 13 6 100.0 41.8 7.1 31.6 13.3 6.1Ohio 45 20 1 12 6 6 100.0 44.4 2.2 26.7 13.3 13.3Oklahoma 3,227 2,064 221 603 275 64 100.0 64.0 6.8 18.7 8.5 2.0Oregon - - - - - - - - - - - - - - - - - - - - - - - -
Pennsylvania 7 5 - - 1 - - 1 100.0 71.4 - - 14.3 - - 14.3Puerto Rico - - - - - - - - - - - - - - - - - - - - - - - -Rhode Island 776 381 128 145 117 5 100.0 49.1 16.5 18.7 15.1 0.6South Carolina 140 96 11 21 10 2 100.0 68.6 7.9 15.0 7.1 1.4South Dakota 1,163 860 159 90 40 14 100.0 73.9 13.7 7.7 3.4 1.2
Tennessee 4,479 3,239 46 624 492 78 100.0 72.3 1.0 13.9 11.0 1.7Texas 11,328 6,292 1,200 2,239 672 925 100.0 55.5 10.6 19.8 5.9 8.2Utah 732 169 356 146 37 24 100.0 23.1 48.6 19.9 5.1 3.3Vermont 1,870 1,268 103 322 153 24 100.0 67.8 5.5 17.2 8.2 1.3Virginia 4,471 - - 6 2,890 641 934 100.0 - - 0.1 64.6 14.3 20.9
Washington 9,596 4,147 3,427 1,036 759 227 100.0 43.2 35.7 10.8 7.9 2.4West Virginia - - - - - - - - - - - - - - - - - - - - - - - -Wisconsin 643 370 95 98 68 12 100.0 57.5 14.8 15.2 10.6 1.9Wyoming 127 31 31 45 5 15 100.0 24.4 24.4 35.4 3.9 11.8
SOURCE: Center for Behavioral Health Statistics and Quality, Substance Abuse and Mental Health Services Administration, Treatment Episode
Data Set (TEDS). Data received through 01.23.15.
Table 4.1. Short-term residential treatment discharges aged 12 and older, by reason for discharge and state or jurisdiction:
Number and percent distribution, 2012
State or jurisdiction
Reason for discharge (number) Reason for discharge (percent distribution)
- - Quantity is zero.
NOTES: Based on linked admission and discharge data reported to TEDS by the 44 states and jurisdiction that offered short-term residential
substance abuse treatment and reported these data to TEDS. Comparisons among states should be made with caution. Percentages may not add to
100 percent due to rounding. The reason for discharge "other" category includes clients who were discharged because they were incarcerated, died,
moved, became ill, were hospitalized, or another reason somewhat out of client's control, or if the client status at discharge was not
known.Percentages are based on all admissions with known and valid values. Admissions for which values were not collected, unknown, or missing
are excluded from the percentage base (denominator).
91

Total Completed
Transferred to
further treatment
Dropped
out
Terminated
by facility Other
Completed
treatment
or transferred
to further treatment
Did not complete
treatment or
transfer
to further treatment
All short-term residential
treatment discharges 165,609 90,561 27,502 30,455 11,203 5,888 71.3 27
Gender
Male 107,692 60,671 17,104 19,017 7,290 3,610 65.9 62.9 72.2 27
Female 57,904 29,886 10,398 11,432 3,913 2,275 34.1 37.1 69.6 27
No. of discharges 165,596 90,557 27,502 30,449 11,203 5,885 100.0 100.0 71.3 27
Age at admission
12 to 20 years 17,931 8,796 3,361 2,949 2,121 704 10.3 12.1 67.8 28
21 to 30 years 52,813 26,775 9,143 10,532 4,396 1,967 30.4 35.5 68.0 26
31 to 40 years 37,212 19,779 6,623 7,227 2,312 1,271 22.4 22.7 71.0 27
41 to 50 years 35,938 21,408 5,287 6,413 1,627 1,203 22.6 19.4 74.3 26
Over 50 years 21,715 13,803 3,088 3,334 747 743 14.3 10.1 77.8 25
No. of discharges 165,609 90,561 27,502 30,455 11,203 5,888 100.0 100.0 71.3 27
Race/ethnicity
White (non-Hispanic) 111,279 60,735 19,894 19,595 7,382 3,673 68.5 65.0 72.5 26
Black (non-Hispanic) 31,104 16,615 4,854 6,281 2,104 1,250 18.2 20.4 69.0 27
Hispanic origin 15,123 9,034 1,387 3,040 1,037 625 8.9 10.0 68.9 27
Other 7,336 3,852 1,287 1,334 574 289 4.4 4.7 70.1 28
No. of discharges 164,842 90,236 27,422 30,250 11,097 5,837 100.0 100.0 71.4 27
No. of prior treatment episodes
None 45,870 23,659 8,722 8,257 3,094 2,138 27.6 29.0 70.6 27
1 or more 117,779 66,176 18,575 21,535 7,881 3,612 72.4 71.0 72.0 26
No. of discharges 163,649 89,835 27,297 29,792 10,975 5,750 100.0 100.0 71.6 27
Treatment referral source
Criminal justice/DUI 29,716 16,809 5,996 3,034 2,567 1,310 19.5 14.8 76.7 28
Self or individual 56,210 27,412 10,486 12,886 3,432 1,994 32.4 39.3 67.4 24
Health care/community 77,432 45,475 10,624 13,957 5,002 2,374 48.0 45.8 72.4 27
No. of discharges 163,358 89,696 27,106 29,877 11,001 5,678 100.0 100.0 71.5 27
Years of education1
Fewer than 12 years 43,993 21,837 8,013 9,383 3,182 1,578 26.9 31.9 67.9 27
12 years (or GED) 66,385 36,708 10,680 12,342 4,230 2,425 42.7 42.9 71.4 26
More than 12 years 44,986 27,049 6,788 7,256 2,513 1,380 30.5 25.2 75.2 26
No. of discharges 155,364 85,594 25,481 28,981 9,925 5,383 100.0 100.0 71.5 261 Includes only discharges aged 18 and older for years of education, self-contained special education class (no grade level equivalent) is excluded from the tabulation because there were too few.
NOTES: Based on linked admission and discharge data reported by the 44 states and jurisdiction that offered short-term residential substance abuse treatment and reported these data to TEDS. The reason for
discharge "other" category includes clients who were discharged because they were incarcerated, died, moved, became ill, were hospitalized, or another reason somewhat out of client's control, or if the client
status at discharge was not known. Percentages are based on all admissions with known and valid values. Admissions for which values were not collected, unknown, or missing are excluded from the
percentage base (denominator).
SOURCE: Center for Behavioral Health Statistics and Quality, Substance Abuse and Mental Health Services Administration, Treatment Episode Data Set (TEDS). Data received through 01.23.15.
Table 4.2. Short-term residential treatment discharges aged 12 and older, by reason for discharge, treatment completion/transfer, median length of stay (LOS), and
characteristics at admission: Number, percent distribution, and rate, 2012
Characteristics at admission
Reason for discharge Percent distribution
Rate of treatment
completion or
transfer to further
treatment
Median LOS
(days) among
treatment
completers
92

Total Completed
Transferred
to
further
treatment
Dropped
out
Terminated
by facility Other Total Completed
Transferred
to
further
treatment
Dropped
out
Terminated
by facility Other
All short-term residential
treatment discharges 165,609 90,561 27,502 30,455 11,203 5,888 165,609 90,561 27,502 30,455 11,203 5,888
Arrests in past 30 days
0 141,757 77,177 24,051 26,440 9,205 4,884 150,819 84,226 25,378 26,490 9,653 5,072
1 16,594 8,846 3,128 2,678 1,333 609 6,743 2,464 1,848 1,381 658 392
2 1,427 782 188 266 133 58 613 273 103 135 67 35
3 311 177 36 50 26 22 179 94 17 35 17 16
4 120 62 13 27 14 4 56 25 8 16 5 2
5 61 35 4 13 6 3 43 24 1 12 6 - -
6 to 96 267 146 37 37 18 29 246 157 28 24 19 18
No. of discharges 160,537 87,225 27,457 29,511 10,735 5,609 158,699 87,263 27,383 28,093 10,425 5,535
Detailed not in labor force1
Homemaker 978 456 233 195 58 36 910 441 217 159 59 34
Student 5,245 2,733 876 724 731 181 4,728 2,482 841 612 681 112
Retired 1,364 994 123 179 25 43 1,309 946 121 171 29 42
Disabled 14,964 7,993 2,517 3,027 950 477 13,875 7,617 2,241 2,743 838 436
Inmate of institution 3,712 1,697 320 1,145 318 232 3,574 1,536 233 1,156 351 298
Other 45,232 26,121 6,258 8,659 3,329 865 39,933 22,354 5,819 7,849 3,123 788
No. of discharges 71,495 39,994 10,327 13,929 5,411 1,834 64,329 35,376 9,472 12,690 5,081 1,710
Employment status1
Employed 19,686 13,213 2,213 2,800 824 636 18,292 12,472 2,101 2,401 687 631
Unemployed 69,162 34,919 13,782 12,929 4,403 3,129 74,959 39,767 14,559 12,950 4,536 3,147
Not in labor force 72,691 40,661 10,602 14,088 5,448 1,892 65,323 35,955 9,774 12,759 5,094 1,741
No. of discharges 88,848 48,132 15,995 15,729 5,227 3,765 158,574 88,194 26,434 28,110 10,317 5,519
Frequency of use
No use in the past month 19,779 10,860 4,244 2,270 1,626 779 87,712 53,931 16,114 10,896 4,759 2,012
Some use 49,862 27,120 10,028 8,059 3,190 1,465 27,230 9,731 6,754 6,942 2,541 1,262
Daily use 93,977 51,714 13,122 19,565 6,099 3,477 21,681 8,353 3,578 6,414 1,670 1,666
No. of discharges 163,618 89,694 27,394 29,894 10,915 5,721 136,623 72,015 26,446 24,252 8,970 4,940
Living arrangements
Homeless 29,206 15,978 4,153 5,748 2,142 1,185 18,015 8,104 2,971 4,451 1,648 841
Dependent living 35,569 17,737 7,097 6,289 2,912 1,534 48,959 29,986 7,944 5,943 3,127 1,959
Independent living 97,938 55,609 16,015 17,578 5,870 2,866 93,831 51,417 16,249 17,738 5,636 2,791
No. of discharges 162,713 89,324 27,265 29,615 10,924 5,585 160,805 89,507 27,164 28,132 10,411 5,591
Continued. See notes at end of table.
Table 4.3. Short-term residential treatment discharges aged 12 and older, by reason for discharge and selected characteristics at admission and discharge:
Number, 2012
Selected characteristics
Selected characteristics at admission by reason for discharge Selected characteristics at discharge by reason for discharge
93

Total Completed
Transferred
to
further
treatment
Dropped
out
Terminated
by facility Other Total Completed
Transferred
to
further
treatment
Dropped
out
Terminated
by facility Other
Primary substance
Alcohol 61,005 38,226 8,725 9,403 2,672 1,979 58,620 36,490 8,639 9,031 2,617 1,843
Opiates 49,358 24,333 8,660 10,741 4,032 1,592 45,157 21,554 8,542 9,902 3,826 1,333
Marijuana/hashish 17,624 8,715 3,439 2,870 1,905 695 16,793 8,182 3,421 2,719 1,825 646
Cocaine 17,497 9,498 2,665 3,487 1,147 700 16,902 9,109 2,617 3,378 1,120 678
Stimulants 13,796 6,533 2,947 2,715 989 612 13,739 6,568 2,931 2,633 986 621
Other/unknown 6,329 3,256 1,066 1,239 458 310 14,398 8,658 1,352 2,792 829 767
No. of discharges 165,609 90,561 27,502 30,455 11,203 5,888 165,609 90,561 27,502 30,455 11,203 5,888
Self-help programs
attended in past 30 days
No attendance in the past
month 98,865 51,815 18,134 19,110 6,526 3,280 46,490 17,959 11,485 12,132 3,224 1,690At least 1 time in the past
month 45,338 25,198 7,930 7,551 2,880 1,779 93,166 57,351 14,083 12,873 5,758 3,101
1-3 times in past month 11,191 5,491 2,355 2,036 717 592 11,162 5,077 1,685 2,733 1,003 664
4-7 times in past month 7,174 3,764 1,341 1,213 457 399 9,859 4,600 1,811 1,939 1,000 509
8-15 times in past month 5,844 3,048 1,287 850 355 304 13,994 7,896 2,723 1,813 969 593
16-30 times in past month 7,305 3,342 1,986 1,193 428 356 27,276 16,848 6,120 2,104 1,098 1,106Some attendance, but
frequency unknown 13,824 9,553 961 2,259 923 128 30,875 22,930 1,744 4,284 1,688 229
No. of discharges 144,203 77,013 26,064 26,661 9,406 5,059 139,656 75,310 25,568 25,005 8,982 4,791
- - Quantity is zero.
NOTES: Based on linked admission and discharge data reported by the 44 states and jurisdiction that offered short-term residential substance abuse treatment and reported these data to
TEDS. The reason for discharge "other" category includes clients who were discharged because they were incarcerated, died, moved, became ill, were hospitalized, or another reason
somewhat out of client's control, or if the client status at discharge was not known. Percentages are based on all admissions with known and valid values. Admissions for which values were
not collected, unknown, or missing are excluded from the percentage base (denominator).
SOURCE: Center for Behavioral Health Statistics and Quality, Substance Abuse and Mental Health Services Administration, Treatment Episode Data Set (TEDS). Data received through
01.23.15.
Table 4.3. Short-term residential treatment discharges aged 12 and older, by reason for discharge and selected characteristics at admission and discharge:
Number, 2012 (continued)
Selected characteristics
Selected characteristics at admission by reason for discharge Selected characteristics at discharge by reason for discharge
1 Includes only discharges aged 16 and above for employment status and detailed not in labor force.
94

Completed
treatment or
transferred to
further treatment
Did not complete
treatment or
transfer to
further treatment
Completed
treatment or
transferred to
further treatment
Did not complete
treatment or
transfer to
further treatment
165,609 71.3 27 165,609 71.3 27
Arrests in past 30 days
0 141,757 88.3 88.4 71.4 27 150,819 95.6 93.6 72.7 27
1 16,594 10.4 10.1 72.2 28 6,743 3.8 5.5 63.9 22
2 1,427 0.8 1.0 68.0 28 613 0.3 0.5 61.3 23
3 311 0.2 0.2 68.5 27 179 0.1 0.2 62.0 26
4 120 0.1 0.1 62.5 26 56 * 0.1 58.9 26
5 61 * * 63.9 24 43 * * 58.1 27
6 to 96 267 0.2 0.2 68.5 28 246 0.2 0.1 75.2 27
Total 160,537 100.0 100.0 71.4 27 158,699 100.0 100.0 72.2 27
Detailed not in labor force1
Homemaker 978 1.4 1.4 70.4 28 910 1.5 1.3 72.3 28
Student 5,245 7.2 7.7 68.8 33 4,728 7.4 7.2 70.3 32
Retired 1,364 2.2 1.2 81.9 22 1,309 2.4 1.2 81.5 22
Disabled 14,964 20.9 21.0 70.2 24 13,875 22.0 20.6 71.0 23
Inmate of institution 3,712 4.0 8.0 54.3 30 3,574 3.9 9.3 49.5 29
Other 45,232 64.3 60.7 71.6 27 39,933 62.8 60.4 70.6 27
Total 71,495 100.0 100.0 70.4 27 64,329 100.0 100.0 69.7 27
Employment status1
Employed 19,686 24.1 17.2 78.4 24 18,292 12.7 8.5 79.7 23
Unemployed 69,162 75.9 82.8 70.4 27 74,959 47.4 47.0 72.5 27
Not in labor force 72,691 79.9 86.7 70.5 27 65,323 39.9 44.6 70.0 27
Total 88,848 100.0 100.0 72.2 27 158,574 100.0 100.0 72.3 27
Frequency of use
No use in the past month 19,779 12.9 10.0 76.4 28 87,712 71.1 46.3 79.9 28
Some use 49,862 31.7 27.3 74.5 27 27,230 16.7 28.2 60.5 20
Daily use 93,977 55.4 62.6 69.0 25 21,681 12.1 25.5 55.0 21
Total 163,618 100.0 100.0 71.6 27 136,623 100.0 100.0 72.1 27
Living arrangements
Homeless 29,206 17.3 19.7 68.9 28 18,015 9.5 15.7 61.5 27
Dependent living 35,569 21.3 23.3 69.8 28 48,959 32.5 25.0 77.5 28
Independent living 97,938 61.4 57.1 73.1 24 93,831 58.0 59.3 72.1 23
Total 162,713 100.0 100.0 71.7 27 160,805 100.0 100.0 72.6 27
Table 4.4. Short-term residential treatment discharges aged 12 and older, by treatment completion/transfer, median length of stay (LOS), and selected
characteristics at admission and discharge: Number, percent distribution, and rate, 2012
Selected characteristics at admission Selected characteristics at discharge
Percent distribution Rate of
treatment
completion or
transfer to
further
treatment
Median
LOS (days)
among
treatment
completers
Continued. See notes at end of table.
Selected characteristics
No. of
short-term
residential
treatment
discharges
Percent distribution Rate of
treatment
completion or
transfer to
further
treatment
Median
LOS (days)
among
treatment
completers
No. of
short-term
residential
treatment
discharges
95

Completed
treatment or
transferred to
further treatment
Did not complete
treatment or
transfer to
further treatment
Completed
treatment or
transferred to
further treatment
Did not complete
treatment or
transfer to
further treatment
Primary substance
Alcohol 61,005 39.8 29.6 77.0 26 58,620 38.2 28.4 77.0 26
Opiates 49,358 27.9 34.4 66.8 24 45,157 25.5 31.7 66.6 25
Marijuana/hashish 17,624 10.3 11.5 69.0 28 16,793 9.8 10.9 69.1 28
Cocaine 17,497 10.3 11.2 69.5 27 16,902 9.9 10.9 69.4 27
Stimulants 13,796 8.0 9.1 68.7 28 13,739 8.0 8.9 69.1 28
Other/unknown 6,329 3.7 4.2 68.3 25 14,398 8.5 9.2 69.5 24
Total 165,609 100.0 100.0 71.3 27 165,609 100.0 100.0 71.3 27
Self-help programs
attended in past 30 days No attendance in the past
month 98,865 67.9 70.3 70.8 27 46,490 29.2 44.0 63.3 23At least 1 time in the past
month 45,338 32.1 29.7 73.1 27 93,166 70.8 56.0 76.7 28
1-3 times in past month 11,191 7.6 8.1 70.1 28 11,162 6.7 11.3 60.6 28
4-7 times in past month 7,174 5.0 5.0 71.2 28 9,859 6.4 8.9 65.0 28
8-15 times in past month 5,844 4.2 3.7 74.2 28 13,994 10.5 8.7 75.9 28
16-30 times in past month 7,305 5.2 4.8 72.9 26 27,276 22.8 11.1 84.2 28Some attendance, but
frequency unknown 13,824 10.2 8.0 76.1 25 30,875 24.5 16.0 79.9 25
Total 144,203 100.0 100.0 71.5 27 139,656 100.0 100.0 72.2 27
SOURCE: Center for Behavioral Health Statistics and Quality, Substance Abuse and Mental Health Services Administration, Treatment Episode Data Set (TEDS). Data received through
01.23.15.
Percent distribution Rate of
treatment
completion or
transfer to
further
treatment
Median
LOS (days)
among
treatment
completers
* Less than 0.05 percent.1
Includes only discharges aged 16 and above for employment status and detailed not in labor force.
NOTES: Based on linked admission and discharge data reported by the 44 states and jurisdiction that offered short-term residential substance abuse treatment and reported these data to
TEDS. Percentages may not add to 100 percent due to rounding. In LOS calculations, missing values of the associated variables were excluded. Percentages are based on all admissions
with known and valid values. Admissions for which values were not collected, unknown, or missing are excluded from the percentage base (denominator).
Selected characteristics
No. of
short-term
residential
treatment
discharges
Percent distribution Rate of
treatment
completion or
transfer to
further
treatment
Median
LOS (days)
among
treatment
completers
No. of
short-term
residential
treatment
discharges
Selected characteristics at admission Selected characteristics at discharge
Table 4.4. Short-term residential treatment discharges aged 12 and older, by treatment completion/transfer, median length of stay (LOS), and selected
characteristics at admission and discharge: Number, percent distribution, and rate, 2012 (continued)
96

All long-term
residential
treatment discharges
Com-
pleted
Trans-
ferred
Dropped
out
Termi-
nated Other Total
Com-
pleted
Trans-
ferred
Dropped
out
Termi-
nated Other
Total 122,467 54,632 19,655 30,947 12,598 4,635 100.0 44.6 16.0 25.3 10.3 3.8
Alabama 543 300 13 67 147 16 100.0 55.2 2.4 12.3 27.1 2.9Alaska 678 335 55 185 80 23 100.0 49.4 8.1 27.3 11.8 3.4Arizona 35 14 1 10 - - 10 100.0 40.0 2.9 28.6 - - 28.6Arkansas 124 78 37 8 - - 1 100.0 62.9 29.8 6.5 - - 0.8California 30,051 13,945 8,733 7,208 - - 165 100.0 46.4 29.1 24.0 - - 0.5
Colorado 1,759 1,014 70 305 272 98 100.0 57.6 4.0 17.3 15.5 5.6Connecticut 5,030 3,174 239 783 520 314 100.0 63.1 4.8 15.6 10.3 6.2Delaware 372 232 2 64 48 26 100.0 62.4 0.5 17.2 12.9 7.0District of Columbia 99 84 6 - - 4 5 100.0 84.8 6.1 - - 4.0 5.1Florida 1,042 530 301 119 43 49 100.0 50.9 28.9 11.4 4.1 4.7
Georgia 2,406 770 163 792 385 296 100.0 32.0 6.8 32.9 16.0 12.3Hawaii 1,660 334 793 327 166 40 100.0 20.1 47.8 19.7 10.0 2.4Idaho 4 2 - - 2 - - - - 100.0 50.0 - - 50.0 - - - -Illinois 706 202 111 216 164 13 100.0 28.6 15.7 30.6 23.2 1.8Indiana 292 218 19 36 17 2 100.0 74.7 6.5 12.3 5.8 0.7
Iowa 699 428 15 167 66 23 100.0 61.2 2.1 23.9 9.4 3.3Kentucky 1,657 196 1,315 81 29 36 100.0 11.8 79.4 4.9 1.8 2.2Louisiana 2,860 464 1,263 755 369 9 100.0 16.2 44.2 26.4 12.9 0.3Maine 477 242 - - 94 105 36 100.0 50.7 - - 19.7 22.0 7.5Maryland 3,760 1,882 334 837 634 73 100.0 50.1 8.9 22.3 16.9 1.9
Massachusetts 6,135 2,368 170 2,312 970 315 100.0 38.6 2.8 37.7 15.8 5.1Michigan 3,357 1,138 681 1,030 296 212 100.0 33.9 20.3 30.7 8.8 6.3Minnesota 9,616 5,570 440 1,838 1,347 421 100.0 57.9 4.6 19.1 14.0 4.4Missouri - - - - - - - - - - - - - - - - - - - - - - - -Montana 280 67 116 62 26 9 100.0 23.9 41.4 22.1 9.3 3.2
Nebraska 651 262 3 219 112 55 100.0 40.2 0.5 33.6 17.2 8.4Nevada - - - - - - - - - - - - - - - - - - - - - - - -New Hampshire 290 117 6 18 79 70 100.0 40.3 2.1 6.2 27.2 24.1New Jersey 5,437 3,060 61 1,306 657 353 100.0 56.3 1.1 24.0 12.1 6.5New York 21,287 7,833 1,214 7,941 3,391 908 100.0 36.8 5.7 37.3 15.9 4.3
North Carolina 1,793 314 824 559 - - 96 100.0 17.5 46.0 31.2 - - 5.4North Dakota 71 16 2 37 7 9 100.0 22.5 2.8 52.1 9.9 12.7Ohio 2,251 858 228 555 421 189 100.0 38.1 10.1 24.7 18.7 8.4Oklahoma 209 88 7 72 28 14 100.0 42.1 3.3 34.4 13.4 6.7Oregon 4,647 2,563 213 984 723 164 100.0 55.2 4.6 21.2 15.6 3.5
Pennsylvania 11 - - 6 2 3 - - 100.0 - - 54.5 18.2 27.3 - -Puerto Rico 181 38 6 73 34 30 100.0 21.0 3.3 40.3 18.8 16.6Rhode Island 524 222 60 142 94 6 100.0 42.4 11.5 27.1 17.9 1.1South Carolina 402 136 95 101 68 2 100.0 33.8 23.6 25.1 16.9 0.5South Dakota 1,648 731 478 197 127 115 100.0 44.4 29.0 12.0 7.7 7.0
Tennessee 1,222 570 25 200 344 83 100.0 46.6 2.0 16.4 28.2 6.8Texas 1,815 1,299 118 158 108 132 100.0 71.6 6.5 8.7 6.0 7.3Utah 1,072 503 307 84 164 14 100.0 46.9 28.6 7.8 15.3 1.3Vermont 112 21 - - 44 44 3 100.0 18.8 - - 39.3 39.3 2.7Virginia 62 - - - - 34 4 24 100.0 - - - - 54.8 6.5 38.7
Washington 2,756 1,437 693 305 254 67 100.0 52.1 25.1 11.1 9.2 2.4West Virginia - - - - - - - - - - - - - - - - - - - - - - - -Wisconsin 1,256 449 340 262 152 53 100.0 35.7 27.1 20.9 12.1 4.2Wyoming 1,128 528 92 356 96 56 100.0 46.8 8.2 31.6 8.5 5.0
SOURCE: Center for Behavioral Health Statistics and Quality, Substance Abuse and Mental Health Services Administration, Treatment Episode Data
Set (TEDS). Data received through 01.23.15.
Table 5.1. Long-term residential treatment discharges aged 12 and older, by reason for discharge and state or jurisdiction:
Number and percent distribution, 2012
State or
jurisdiction
Reason for discharge (number) Reason for discharge (percent distribution)
- - Quantity is zero.
NOTES: Based on linked admission and discharge data reported to TEDS by the 46 states and jurisdictions that offered long-term residential
substance abuse treatment and reported these data to TEDS. Comparisons among states should be made with caution. Percentages may not add to
100 percent due to rounding. The reason for discharge "other" category includes clients who were discharged because they were incarcerated, died,
moved, became ill, were hospitalized, or another reason somewhat out of client's control, or if the client status at discharge was not known.
Percentages are based on all admissions with known and valid values. Admissions for which values were not collected, unknown, or missing are
excluded from the percentage base (denominator).
97

Total Completed
Transferred to
further treatment
Dropped
out
Terminated
by facility Other
Completed
treatment
or transferred
to further treatment
Did not complete
treatment or
transfer
to further treatment
All long-term residential
treatment discharges. 122,467 54,632 19,655 30,947 12,598 4,635 60.7 90
Gender
Male 78,363 35,597 11,133 19,931 8,604 3,098 62.9 65.7 59.6 90
Female 44,067 19,020 8,511 11,009 3,993 1,534 37.1 34.3 62.5 89
No. of discharges 122,430 54,617 19,644 30,940 12,597 4,632 100.0 100.0 60.7 90
Age at admission
12 to 20 years 15,039 6,650 2,049 3,480 2,173 687 11.7 13.2 57.8 73
21 to 30 years 40,481 16,468 7,026 10,695 4,731 1,561 31.6 35.3 58.0 90
31 to 40 years 28,010 12,369 4,679 7,302 2,674 986 22.9 22.8 60.9 90
41 to 50 years 25,730 12,194 3,921 6,575 2,139 901 21.7 20.0 62.6 90
Over 50 years 13,207 6,951 1,980 2,895 881 500 12.0 8.9 67.6 90
No. of discharges 122,467 54,632 19,655 30,947 12,598 4,635 100.0 100.0 60.7 90
Race/ethnicity
White (non-Hispanic) 68,590 32,155 10,887 15,569 7,465 2,514 58.3 53.5 62.8 89
Black (non-Hispanic) 24,501 9,660 3,582 7,424 2,756 1,079 17.9 23.6 54.0 111
Hispanic origin 17,014 7,269 2,772 5,095 1,299 579 13.6 14.6 59.0 90
Other 11,489 5,109 2,364 2,659 951 406 10.1 8.4 65.0 65
No. of discharges 121,594 54,193 19,605 30,747 12,471 4,578 100.0 100.0 60.7 90
No. of prior treatment episodes
None 31,535 14,184 7,005 7,061 2,307 978 29.1 22.0 67.2 87
1 or more 88,089 39,309 12,199 23,283 9,922 3,376 70.9 78.0 58.5 90
No. of discharges 119,624 53,493 19,204 30,344 12,229 4,354 100.0 100.0 60.8 90
Treatment referral source
Criminal justice/DUI 41,578 19,791 7,183 8,284 4,407 1,913 37.0 31.1 64.9 93
Self or individual 34,004 14,163 6,411 10,149 2,422 859 28.2 28.6 60.5 75
Health care/community 44,251 19,447 5,912 11,874 5,362 1,656 34.8 40.3 57.3 90
No. of discharges 119,833 53,401 19,506 30,307 12,191 4,428 100.0 100.0 60.8 90
Years of education1
Fewer than 12 years 36,391 14,431 6,428 10,416 3,639 1,477 30.3 34.7 57.3 90
12 years (or GED) 49,282 21,865 8,099 12,530 4,937 1,851 43.6 43.2 60.8 90
More than 12 years 27,846 13,945 4,032 6,211 2,729 929 26.1 22.1 64.6 89
No. of discharges 113,519 50,241 18,559 29,157 11,305 4,257 100.0 100.0 60.6 901 Includes only discharges aged 18 and older for years of education, self-contained special education class (no grade level equivalent) is excluded from the tabulation because there were too few.
NOTES: Based on linked admission and discharge data reported by the 46 states and jurisdictions that offered long-term residential substance abuse treatment and reported these data to TEDS. The reason for
discharge "other" category includes clients who were discharged because they were incarcerated, died, moved, became ill, were hospitalized, or another reason somewhat out of client's control, or if the client
status at discharge was not known. Percentages are based on all admissions with known and valid values. Admissions for which values were not collected, unknown, or missing are excluded from the
percentage base (denominator).
SOURCE: Center for Behavioral Health Statistics and Quality, Substance Abuse and Mental Health Services Administration, Treatment Episode Data Set (TEDS). Data received through 01.23.15.
Table 5.2. Long-term residential treatment discharges aged 12 and older, by reason for discharge, treatment completion/transfer, median length of stay (LOS), and
characteristics at admission: Number, percent distribution, and rate, 2012
Characteristics at admission
Reason for discharge Percent distribution
Rate of treatment
completion or
transfer to further
treatment
Median LOS
(days) among
treatment
completers
98
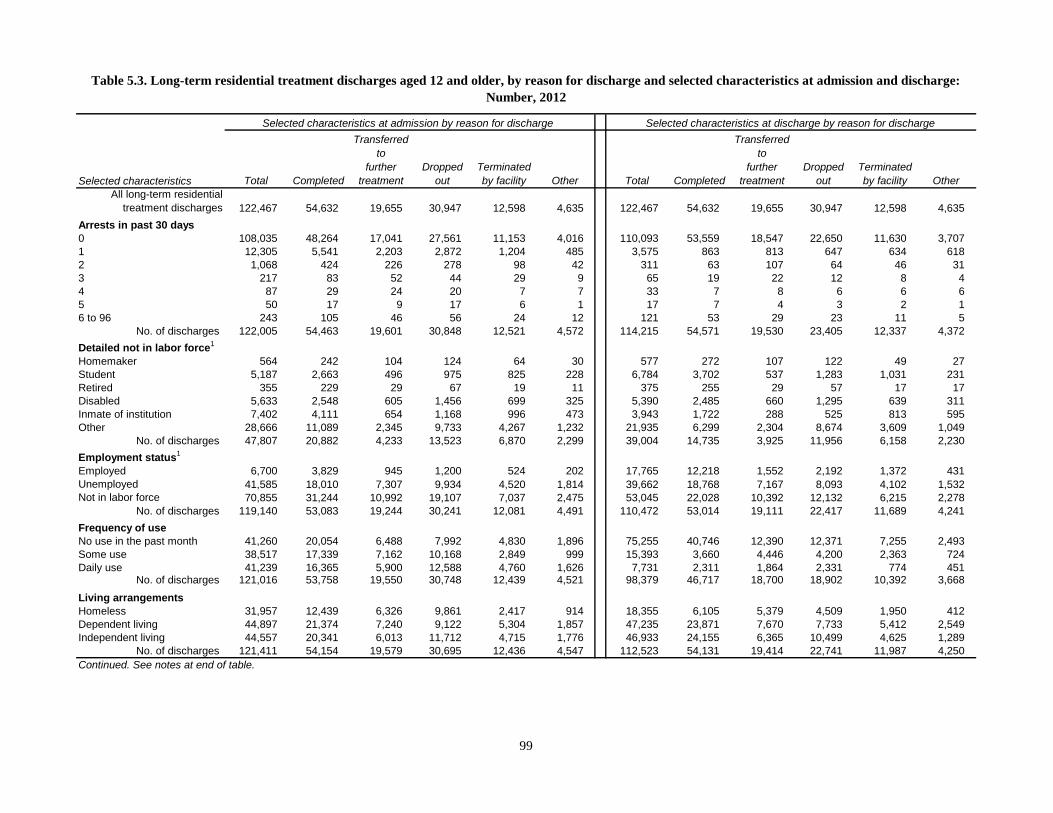
Total Completed
Transferred
to
further
treatment
Dropped
out
Terminated
by facility Other Total Completed
Transferred
to
further
treatment
Dropped
out
Terminated
by facility Other
All long-term residential
treatment discharges 122,467 54,632 19,655 30,947 12,598 4,635 122,467 54,632 19,655 30,947 12,598 4,635
Arrests in past 30 days
0 108,035 48,264 17,041 27,561 11,153 4,016 110,093 53,559 18,547 22,650 11,630 3,707
1 12,305 5,541 2,203 2,872 1,204 485 3,575 863 813 647 634 618
2 1,068 424 226 278 98 42 311 63 107 64 46 31
3 217 83 52 44 29 9 65 19 22 12 8 4
4 87 29 24 20 7 7 33 7 8 6 6 6
5 50 17 9 17 6 1 17 7 4 3 2 1
6 to 96 243 105 46 56 24 12 121 53 29 23 11 5
No. of discharges 122,005 54,463 19,601 30,848 12,521 4,572 114,215 54,571 19,530 23,405 12,337 4,372
Detailed not in labor force1
Homemaker 564 242 104 124 64 30 577 272 107 122 49 27
Student 5,187 2,663 496 975 825 228 6,784 3,702 537 1,283 1,031 231
Retired 355 229 29 67 19 11 375 255 29 57 17 17
Disabled 5,633 2,548 605 1,456 699 325 5,390 2,485 660 1,295 639 311
Inmate of institution 7,402 4,111 654 1,168 996 473 3,943 1,722 288 525 813 595
Other 28,666 11,089 2,345 9,733 4,267 1,232 21,935 6,299 2,304 8,674 3,609 1,049
No. of discharges 47,807 20,882 4,233 13,523 6,870 2,299 39,004 14,735 3,925 11,956 6,158 2,230
Employment status1
Employed 6,700 3,829 945 1,200 524 202 17,765 12,218 1,552 2,192 1,372 431
Unemployed 41,585 18,010 7,307 9,934 4,520 1,814 39,662 18,768 7,167 8,093 4,102 1,532
Not in labor force 70,855 31,244 10,992 19,107 7,037 2,475 53,045 22,028 10,392 12,132 6,215 2,278
No. of discharges 119,140 53,083 19,244 30,241 12,081 4,491 110,472 53,014 19,111 22,417 11,689 4,241
Frequency of use
No use in the past month 41,260 20,054 6,488 7,992 4,830 1,896 75,255 40,746 12,390 12,371 7,255 2,493
Some use 38,517 17,339 7,162 10,168 2,849 999 15,393 3,660 4,446 4,200 2,363 724
Daily use 41,239 16,365 5,900 12,588 4,760 1,626 7,731 2,311 1,864 2,331 774 451No. of discharges 121,016 53,758 19,550 30,748 12,439 4,521 98,379 46,717 18,700 18,902 10,392 3,668
Living arrangements
Homeless 31,957 12,439 6,326 9,861 2,417 914 18,355 6,105 5,379 4,509 1,950 412
Dependent living 44,897 21,374 7,240 9,122 5,304 1,857 47,235 23,871 7,670 7,733 5,412 2,549
Independent living 44,557 20,341 6,013 11,712 4,715 1,776 46,933 24,155 6,365 10,499 4,625 1,289
No. of discharges 121,411 54,154 19,579 30,695 12,436 4,547 112,523 54,131 19,414 22,741 11,987 4,250
Continued. See notes at end of table.
Table 5.3. Long-term residential treatment discharges aged 12 and older, by reason for discharge and selected characteristics at admission and discharge:
Number, 2012
Selected characteristics
Selected characteristics at admission by reason for discharge Selected characteristics at discharge by reason for discharge
99
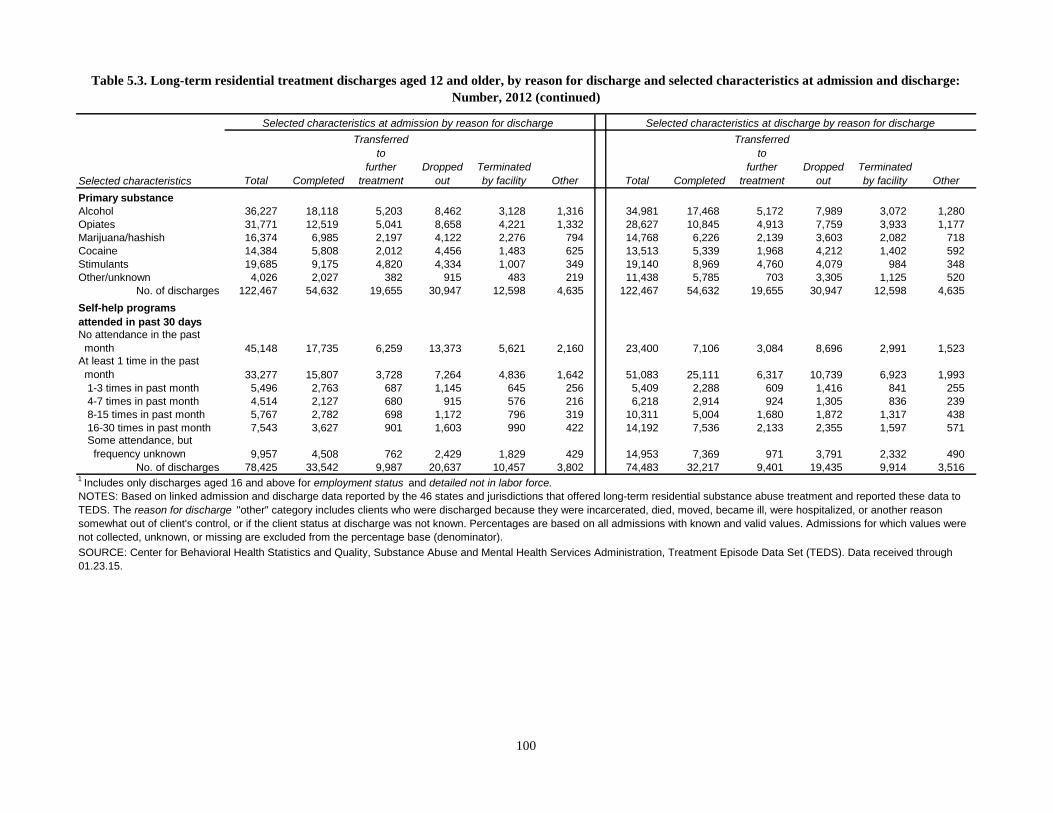
Total Completed
Transferred
to
further
treatment
Dropped
out
Terminated
by facility Other Total Completed
Transferred
to
further
treatment
Dropped
out
Terminated
by facility Other
Primary substance
Alcohol 36,227 18,118 5,203 8,462 3,128 1,316 34,981 17,468 5,172 7,989 3,072 1,280
Opiates 31,771 12,519 5,041 8,658 4,221 1,332 28,627 10,845 4,913 7,759 3,933 1,177
Marijuana/hashish 16,374 6,985 2,197 4,122 2,276 794 14,768 6,226 2,139 3,603 2,082 718
Cocaine 14,384 5,808 2,012 4,456 1,483 625 13,513 5,339 1,968 4,212 1,402 592
Stimulants 19,685 9,175 4,820 4,334 1,007 349 19,140 8,969 4,760 4,079 984 348
Other/unknown 4,026 2,027 382 915 483 219 11,438 5,785 703 3,305 1,125 520
No. of discharges 122,467 54,632 19,655 30,947 12,598 4,635 122,467 54,632 19,655 30,947 12,598 4,635
Self-help programs
attended in past 30 days
No attendance in the past
month 45,148 17,735 6,259 13,373 5,621 2,160 23,400 7,106 3,084 8,696 2,991 1,523At least 1 time in the past
month 33,277 15,807 3,728 7,264 4,836 1,642 51,083 25,111 6,317 10,739 6,923 1,993
1-3 times in past month 5,496 2,763 687 1,145 645 256 5,409 2,288 609 1,416 841 255
4-7 times in past month 4,514 2,127 680 915 576 216 6,218 2,914 924 1,305 836 239
8-15 times in past month 5,767 2,782 698 1,172 796 319 10,311 5,004 1,680 1,872 1,317 438
16-30 times in past month 7,543 3,627 901 1,603 990 422 14,192 7,536 2,133 2,355 1,597 571Some attendance, but
frequency unknown 9,957 4,508 762 2,429 1,829 429 14,953 7,369 971 3,791 2,332 490
No. of discharges 78,425 33,542 9,987 20,637 10,457 3,802 74,483 32,217 9,401 19,435 9,914 3,516
NOTES: Based on linked admission and discharge data reported by the 46 states and jurisdictions that offered long-term residential substance abuse treatment and reported these data to
TEDS. The reason for discharge "other" category includes clients who were discharged because they were incarcerated, died, moved, became ill, were hospitalized, or another reason
somewhat out of client's control, or if the client status at discharge was not known. Percentages are based on all admissions with known and valid values. Admissions for which values were
not collected, unknown, or missing are excluded from the percentage base (denominator).
SOURCE: Center for Behavioral Health Statistics and Quality, Substance Abuse and Mental Health Services Administration, Treatment Episode Data Set (TEDS). Data received through
01.23.15.
Table 5.3. Long-term residential treatment discharges aged 12 and older, by reason for discharge and selected characteristics at admission and discharge:
Number, 2012 (continued)
Selected characteristics
Selected characteristics at admission by reason for discharge Selected characteristics at discharge by reason for discharge
1 Includes only discharges aged 16 and above for employment status and detailed not in labor force.
100
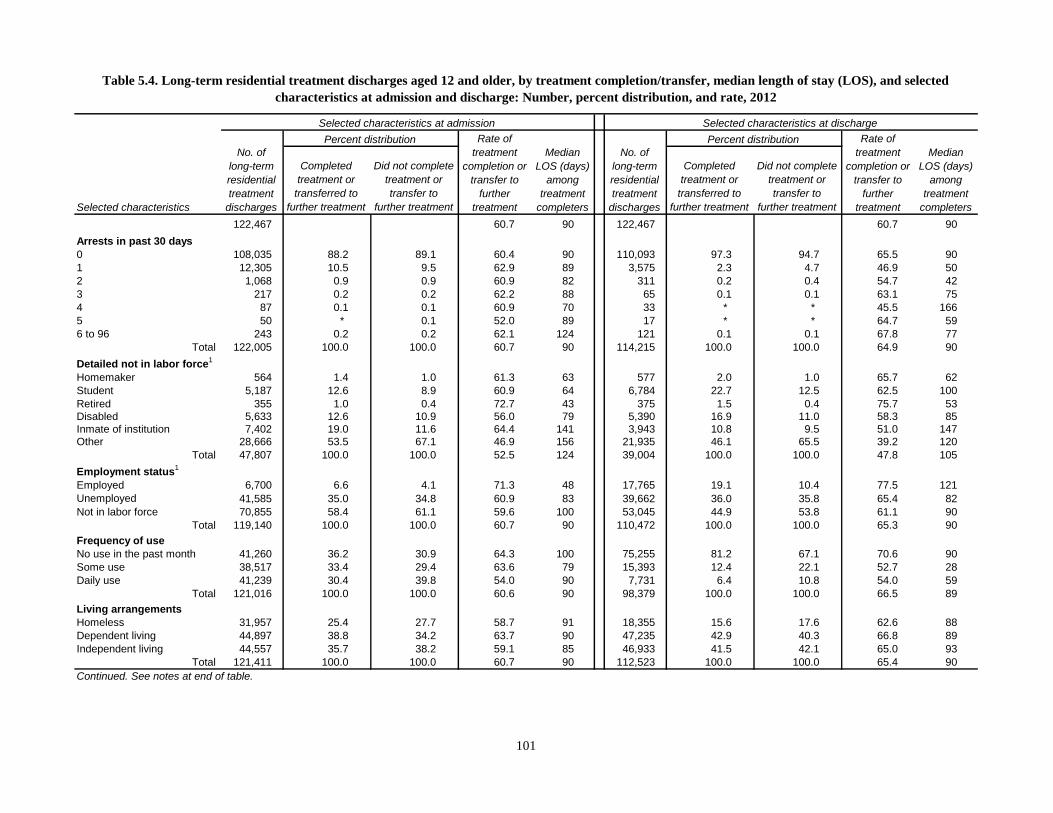
Completed
treatment or
transferred to
further treatment
Did not complete
treatment or
transfer to
further treatment
Completed
treatment or
transferred to
further treatment
Did not complete
treatment or
transfer to
further treatment
122,467 60.7 90 122,467 60.7 90
Arrests in past 30 days
0 108,035 88.2 89.1 60.4 90 110,093 97.3 94.7 65.5 90
1 12,305 10.5 9.5 62.9 89 3,575 2.3 4.7 46.9 50
2 1,068 0.9 0.9 60.9 82 311 0.2 0.4 54.7 42
3 217 0.2 0.2 62.2 88 65 0.1 0.1 63.1 75
4 87 0.1 0.1 60.9 70 33 * * 45.5 166
5 50 * 0.1 52.0 89 17 * * 64.7 59
6 to 96 243 0.2 0.2 62.1 124 121 0.1 0.1 67.8 77
Total 122,005 100.0 100.0 60.7 90 114,215 100.0 100.0 64.9 90
Detailed not in labor force1
Homemaker 564 1.4 1.0 61.3 63 577 2.0 1.0 65.7 62
Student 5,187 12.6 8.9 60.9 64 6,784 22.7 12.5 62.5 100
Retired 355 1.0 0.4 72.7 43 375 1.5 0.4 75.7 53
Disabled 5,633 12.6 10.9 56.0 79 5,390 16.9 11.0 58.3 85
Inmate of institution 7,402 19.0 11.6 64.4 141 3,943 10.8 9.5 51.0 147
Other 28,666 53.5 67.1 46.9 156 21,935 46.1 65.5 39.2 120
Total 47,807 100.0 100.0 52.5 124 39,004 100.0 100.0 47.8 105
Employment status1
Employed 6,700 6.6 4.1 71.3 48 17,765 19.1 10.4 77.5 121
Unemployed 41,585 35.0 34.8 60.9 83 39,662 36.0 35.8 65.4 82
Not in labor force 70,855 58.4 61.1 59.6 100 53,045 44.9 53.8 61.1 90
Total 119,140 100.0 100.0 60.7 90 110,472 100.0 100.0 65.3 90
Frequency of use
No use in the past month 41,260 36.2 30.9 64.3 100 75,255 81.2 67.1 70.6 90
Some use 38,517 33.4 29.4 63.6 79 15,393 12.4 22.1 52.7 28
Daily use 41,239 30.4 39.8 54.0 90 7,731 6.4 10.8 54.0 59
Total 121,016 100.0 100.0 60.6 90 98,379 100.0 100.0 66.5 89
Living arrangements
Homeless 31,957 25.4 27.7 58.7 91 18,355 15.6 17.6 62.6 88
Dependent living 44,897 38.8 34.2 63.7 90 47,235 42.9 40.3 66.8 89
Independent living 44,557 35.7 38.2 59.1 85 46,933 41.5 42.1 65.0 93
Total 121,411 100.0 100.0 60.7 90 112,523 100.0 100.0 65.4 90
Table 5.4. Long-term residential treatment discharges aged 12 and older, by treatment completion/transfer, median length of stay (LOS), and selected
characteristics at admission and discharge: Number, percent distribution, and rate, 2012
Selected characteristics at admission Selected characteristics at discharge
Percent distribution Rate of
treatment
completion or
transfer to
further
treatment
Median
LOS (days)
among
treatment
completers
Continued. See notes at end of table.
Selected characteristics
No. of
long-term
residential
treatment
discharges
Percent distribution Rate of
treatment
completion or
transfer to
further
treatment
Median
LOS (days)
among
treatment
completers
No. of
long-term
residential
treatment
discharges
101

Completed
treatment or
transferred to
further treatment
Did not complete
treatment or
transfer to
further treatment
Completed
treatment or
transferred to
further treatment
Did not complete
treatment or
transfer to
further treatment
Primary substance
Alcohol 36,227 31.4 26.8 64.4 88 34,981 30.5 25.6 64.7 85
Opiates 31,771 23.6 29.5 55.3 104 28,627 21.2 26.7 55.0 93
Marijuana/hashish 16,374 12.4 14.9 56.1 89 14,768 11.3 13.3 56.6 86
Cocaine 14,384 10.5 13.6 54.4 107 13,513 9.8 12.9 54.1 101
Stimulants 19,685 18.8 11.8 71.1 89 19,140 18.5 11.2 71.7 89
Other/unknown 4,026 3.2 3.4 59.8 74 11,438 8.7 10.3 56.7 120
Total 122,467 100.0 100.0 60.7 90 122,467 100.0 100.0 60.7 90
Self-help programs
attended in past 30 days No attendance in the past
month 45,148 55.1 60.6 53.1 89 23,400 24.5 40.2 43.5 80At least 1 time in the past
month 33,277 44.9 39.4 58.7 92 51,083 75.5 59.8 61.5 91
1-3 times in past month 5,496 7.9 5.9 62.8 79 5,409 7.0 7.6 53.6 66
4-7 times in past month 4,514 6.4 4.9 62.2 87 6,218 9.2 7.2 61.7 68
8-15 times in past month 5,767 8.0 6.6 60.3 87 10,311 16.1 11.0 64.8 80
16-30 times in past month 7,543 10.4 8.6 60.0 88 14,192 23.2 13.8 68.1 82Some attendance, but
frequency unknown 9,957 12.1 13.4 52.9 149 14,953 20.0 20.1 55.8 177
Total 78,425 100.0 100.0 55.5 91 74,483 175.5 100.0 105.1 90
SOURCE: Center for Behavioral Health Statistics and Quality, Substance Abuse and Mental Health Services Administration, Treatment Episode Data Set (TEDS). Data received through
01.23.15.
Percent distribution Rate of
treatment
completion or
transfer to
further
treatment
Median
LOS (days)
among
treatment
completers
* Less than 0.05 percent.1
Includes only discharges aged 16 and above for employment status and detailed not in labor force.
NOTES: Based on linked admission and discharge data reported by the 46 states and jurisdictions that offered long-term residential substance abuse treatment and reported these data to
TEDS. Percentages may not add to 100 percent due to rounding. In LOS calculations, missing values of the associated variables were excluded.Percentages are based on all admissions
with known and valid values. Admissions for which values were not collected, unknown, or missing are excluded from the percentage base (denominator).
Selected characteristics
No. of
long-term
residential
treatment
discharges
Percent distribution Rate of
treatment
completion or
transfer to
further
treatment
Median
LOS (days)
among
treatment
completers
No. of
long-term
residential
treatment
discharges
Selected characteristics at admission Selected characteristics at discharge
Table 5.4. Long-term residential treatment discharges aged 12 and older, by treatment completion/transfer, median length of stay (LOS), and selected
characteristics at admission and discharge: Number, percent distribution, and rate, 2012 (continued)
102

All hospital residential
treatment discharges
Com-
pleted
Trans-
ferred
Dropped
out
Termi-
nated Other Total
Com-
pleted
Trans-
ferred
Dropped
out
Termi-
nated Other
Total 5,637 3,037 929 1,299 178 194 100.0 53.9 16.5 23.0 3.2 3.4
Alabama - - - - - - - - - - - - - - - - - - - - - - - -Alaska - - - - - - - - - - - - - - - - - - - - - - - -Arizona 79 36 2 35 - - 6 100.0 45.6 2.5 44.3 - - 7.6Arkansas - - - - - - - - - - - - - - - - - - - - - - - -California - - - - - - - - - - - - - - - - - - - - - - - -
Colorado 112 78 5 16 8 5 100.0 69.6 4.5 14.3 7.1 4.5Connecticut 1,299 1,049 6 220 10 14 100.0 80.8 0.5 16.9 0.8 1.1Delaware - - - - - - - - - - - - - - - - - - - - - - - -District of Columbia - - - - - - - - - - - - - - - - - - - - - - - -Florida - - - - - - - - - - - - - - - - - - - - - - - -
Georgia - - - - - - - - - - - - - - - - - - - - - - - -Hawaii - - - - - - - - - - - - - - - - - - - - - - - -Idaho - - - - - - - - - - - - - - - - - - - - - - - -Illinois - - - - - - - - - - - - - - - - - - - - - - - -Indiana 102 30 2 42 18 10 100.0 29.4 2.0 41.2 17.6 9.8
Iowa 334 57 164 59 45 9 100.0 17.1 49.1 17.7 13.5 2.7Kentucky - - - - - - - - - - - - - - - - - - - - - - - -Louisiana - - - - - - - - - - - - - - - - - - - - - - - -Maine - - - - - - - - - - - - - - - - - - - - - - - -Maryland - - - - - - - - - - - - - - - - - - - - - - - -
Massachusetts - - - - - - - - - - - - - - - - - - - - - - - -Michigan - - - - - - - - - - - - - - - - - - - - - - - -Minnesota 1,306 978 84 140 60 44 100.0 74.9 6.4 10.7 4.6 3.4Missouri - - - - - - - - - - - - - - - - - - - - - - - -Montana 339 210 19 99 10 1 100.0 61.9 5.6 29.2 2.9 0.3
Nebraska - - - - - - - - - - - - - - - - - - - - - - - -Nevada - - - - - - - - - - - - - - - - - - - - - - - -New Hampshire 1 - - - - 1 - - - - 100.0 - - - - 100.0 - - - -New Jersey 2 1 - - - - 1 - - 100.0 50.0 - - - - 50.0 - -New York - - - - - - - - - - - - - - - - - - - - - - - -
North Carolina 1,610 336 526 649 - - 99 100.0 20.9 32.7 40.3 - - 6.1North Dakota 2 - - - - 1 - - 1 100.0 - - - - 50.0 - - 50.0Ohio - - - - - - - - - - - - - - - - - - - - - - - -Oklahoma 113 55 56 1 - - 1 100.0 48.7 49.6 0.9 - - 0.9Oregon - - - - - - - - - - - - - - - - - - - - - - - -
Pennsylvania - - - - - - - - - - - - - - - - - - - - - - - -Puerto Rico - - - - - - - - - - - - - - - - - - - - - - - -Rhode Island 291 196 46 24 23 2 100.0 67.4 15.8 8.2 7.9 0.7South Carolina - - - - - - - - - - - - - - - - - - - - - - - -South Dakota - - - - - - - - - - - - - - - - - - - - - - - -
Tennessee - - - - - - - - - - - - - - - - - - - - - - - -Texas - - - - - - - - - - - - - - - - - - - - - - - -Utah 1 - - - - - - 1 - - 100.0 - - - - - - 100.0 - -Vermont - - - - - - - - - - - - - - - - - - - - - - - -Virginia - - - - - - - - - - - - - - - - - - - - - - - -
Washington - - - - - - - - - - - - - - - - - - - - - - - -West Virginia - - - - - - - - - - - - - - - - - - - - - - - -Wisconsin 36 10 18 6 2 - - 100.0 27.8 50.0 16.7 5.6 - -Wyoming 10 1 1 6 - - 2 100.0 10.0 10.0 60.0 - - 20.0
SOURCE: Center for Behavioral Health Statistics and Quality, Substance Abuse and Mental Health Services Administration, Treatment Episode Data
Set (TEDS). Data received through 01.23.15.
Table 6.1. Hospital residential treatment discharges aged 12 and older, by reason for discharge and state or jurisdiction:
Number and percent distribution, 2012
State or
jurisdiction
Reason for discharge (number) Reason for discharge (percent distribution)
- - Quantity is zero.
NOTES: Based on linked admission and discharge data reported to TEDS by the 16 states that offered hospital residential substance abuse
treatment and reported these data to TEDS. Comparisons among states should be made with caution. Percentages may not add to 100 percent due
to rounding. The reason for discharge "other" category includes clients who were discharged because they were incarcerated, died, moved, became
ill, were hospitalized, or another reason somewhat out of client's control, or if the client status at discharge was not known. Percentages are based on
all admissions with known and valid values. Admissions for which values were not collected, unknown, or missing are excluded from the percentage
base (denominator).
103

Total Completed
Transferred to
further treatment
Dropped
out
Terminated
by facility Other
Completed
treatment
or transferred
to further treatment
Did not complete
treatment or
transfer
to further treatment
All hospital residential
treatment discharges. 5,637 3,037 929 1,299 178 194 70.4 14Gender
Male 3,607 1,978 603 793 98 135 65.1 61.4 71.6 14
Female 2,030 1,059 326 506 80 59 34.9 38.6 68.2 17
No. of discharges 5,637 3,037 929 1,299 178 194 100.0 100.0 70.4 14
Age at admission
12 to 20 years 259 121 52 51 24 11 4.4 5.1 66.8 19
21 to 30 years 1,509 790 233 368 65 53 25.8 29.1 67.8 12
31 to 40 years 1,322 659 251 330 35 47 22.9 24.7 68.8 15
41 to 50 years 1,553 861 236 367 33 56 27.7 27.3 70.6 14
Over 50 years 994 606 157 183 21 27 19.2 13.8 76.8 16
No. of discharges 5,637 3,037 929 1,299 178 194 100.0 100.0 70.4 14
Race/ethnicity
White (non-Hispanic) 4,322 2,307 762 964 140 149 77.8 75.0 71.0 12
Black (non-Hispanic) 713 349 107 206 22 29 11.6 15.4 64.0 21
Hispanic origin 341 231 22 80 4 4 6.4 5.3 74.2 24
Other 238 130 35 49 12 12 4.2 4.4 69.3 22
No. of discharges 5,614 3,017 926 1,299 178 194 100.0 100.0 70.2 15
No. of prior treatment episodes
None 1,658 707 393 442 42 74 36.3 38.4 66.3 9
1 or more 2,825 1,415 514 659 125 112 63.7 61.6 68.3 10
No. of discharges 4,483 2,122 907 1,101 167 186 100.0 100.0 67.6 10
Treatment referral source
Criminal justice/DUI 373 217 75 51 15 15 7.6 4.9 78.3 28
Self or individual 2,953 1,906 321 553 73 100 57.9 44.2 75.4 13
Health care/community 2,163 795 531 673 88 76 34.5 50.9 61.3 12
No. of discharges 5,489 2,918 927 1,277 176 191 100.0 100.0 70.0 14
Years of education1
Fewer than 12 years 1,164 592 166 318 47 41 21.6 26.1 65.1 10
12 years (or GED) 2,395 1,203 453 572 68 99 47.3 47.4 69.1 10
More than 12 years 1,503 810 280 312 53 48 31.1 26.5 72.5 14
No. of discharges 5,062 2,605 899 1,202 168 188 100.0 100.0 69.2 111 Includes only discharges aged 18 and older for years of education, self-contained special education class (no grade level equivalent) is excluded from the tabulation because there were too few.
NOTES: Based on linked admission and discharge data reported by the 16 states that offered hospital residential substance abuse treatment and reported these data to TEDS. The reason for discharge "other"
category includes clients who were discharged because they were incarcerated, died, moved, became ill, were hospitalized, or another reason somewhat out of client's control, or if the client status at discharge
was not known. Percentages are based on all admissions with known and valid values. Admissions for which values were not collected, unknown, or missing are excluded from the percentage base
(denominator).
SOURCE: Center for Behavioral Health Statistics and Quality, Substance Abuse and Mental Health Services Administration, Treatment Episode Data Set (TEDS). Data received through 01.23.15.
Table 6.2. Hospital residential treatment discharges aged 12 and older, by reason for discharge, treatment completion/transfer, median length of stay (LOS), and
characteristics at admission: Number, percent distribution, and rate, 2012
Characteristics at admission
Reason for discharge Percent distribution
Rate of treatment
completion or
transfer to further
treatment
Median LOS
(days) among
treatment
completers
104

Total Completed
Transferred
to
further
treatment
Dropped
out
Terminated
by facility Other Total Completed
Transferred
to
further
treatment
Dropped
out
Terminated
by facility Other
All hospital residential
treatment discharges 5,637 3,037 929 1,299 178 194 5,637 3,037 929 1,299 178 194
Arrests in past 30 days
0 4,831 2,492 854 1,161 147 177 5,015 2,656 895 1,126 160 178
1 255 124 54 48 17 12 88 41 11 24 4 8
2 22 9 6 5 1 1 7 5 1 1 - - - -
3 12 8 - - 3 1 - - 2 1 - - 1 - - - -
4 5 3 - - 1 1 - - 2 - - - - 1 1 - -
5 2 - - - - 2 - - - - 2 1 - - 1 - - - -
6 to 96 8 6 1 - - 1 - - 9 6 1 1 - - 1
No. of discharges 5,135 2,642 915 1,220 168 190 5,125 2,710 908 1,155 165 187
Detailed not in labor force1
Homemaker 42 24 9 6 3 - - 45 27 7 8 3 - -
Student 71 33 18 13 3 4 54 31 16 2 3 2
Retired 97 66 13 12 1 5 90 63 13 8 1 5
Disabled 522 324 69 82 29 18 566 373 69 79 30 15
Inmate of institution 134 111 2 15 1 5 180 141 5 25 2 7
Other 572 408 38 108 11 7 618 420 63 116 9 10
No. of discharges 1,438 966 149 236 48 39 1,553 1,055 173 238 48 39
Employment status1
Employed 798 450 153 134 31 30 830 475 154 137 30 34
Unemployed 2,851 1,191 612 841 87 120 2,635 1,128 557 751 90 109
Not in labor force 1,439 967 149 236 48 39 1,598 1,063 189 256 48 42
No. of discharges 5,088 2,608 914 1,211 166 189 5,063 2,666 900 1,144 168 185
Frequency of use
No use in the past month 583 324 93 123 21 22 1,264 894 136 171 34 29
Some use 1,326 660 242 316 53 55 1,858 1,116 240 364 76 62
Daily use 3,622 1,987 588 838 93 116 1,613 417 494 568 43 91
No. of discharges 5,531 2,971 923 1,277 167 193 4,735 2,427 870 1,103 153 182
Living arrangements
Homeless 836 460 125 191 33 27 672 339 111 175 29 18
Dependent living 305 138 65 63 24 15 451 230 106 70 30 15
Independent living 3,987 2,036 733 959 111 148 3,855 2,090 666 876 112 111
No. of discharges 5,128 2,634 923 1,213 168 190 4,978 2,659 883 1,121 171 144
Continued. See notes at end of table.
Table 6.3. Hospital residential treatment discharges aged 12 and older, by reason for discharge and selected characteristics at admission and discharge:
Number, 2012
Selected characteristics
Selected characteristics at admission by reason for discharge Selected characteristics at discharge by reason for discharge
105
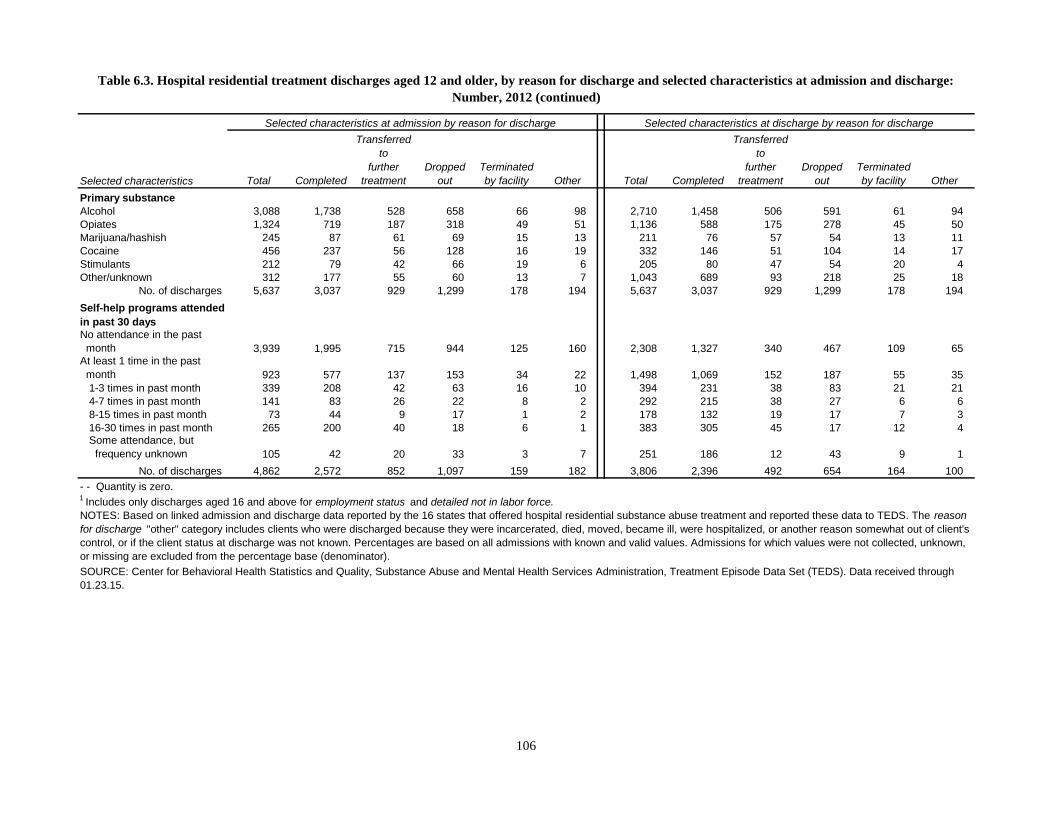
Total Completed
Transferred
to
further
treatment
Dropped
out
Terminated
by facility Other Total Completed
Transferred
to
further
treatment
Dropped
out
Terminated
by facility Other
Primary substance
Alcohol 3,088 1,738 528 658 66 98 2,710 1,458 506 591 61 94
Opiates 1,324 719 187 318 49 51 1,136 588 175 278 45 50
Marijuana/hashish 245 87 61 69 15 13 211 76 57 54 13 11
Cocaine 456 237 56 128 16 19 332 146 51 104 14 17
Stimulants 212 79 42 66 19 6 205 80 47 54 20 4
Other/unknown 312 177 55 60 13 7 1,043 689 93 218 25 18
No. of discharges 5,637 3,037 929 1,299 178 194 5,637 3,037 929 1,299 178 194
Self-help programs attended
in past 30 days
No attendance in the past
month 3,939 1,995 715 944 125 160 2,308 1,327 340 467 109 65At least 1 time in the past
month 923 577 137 153 34 22 1,498 1,069 152 187 55 35
1-3 times in past month 339 208 42 63 16 10 394 231 38 83 21 21
4-7 times in past month 141 83 26 22 8 2 292 215 38 27 6 6
8-15 times in past month 73 44 9 17 1 2 178 132 19 17 7 3
16-30 times in past month 265 200 40 18 6 1 383 305 45 17 12 4Some attendance, but
frequency unknown 105 42 20 33 3 7 251 186 12 43 9 1
No. of discharges 4,862 2,572 852 1,097 159 182 3,806 2,396 492 654 164 100
1 Includes only discharges aged 16 and above for employment status and detailed not in labor force.
NOTES: Based on linked admission and discharge data reported by the 16 states that offered hospital residential substance abuse treatment and reported these data to TEDS. The reason
for discharge "other" category includes clients who were discharged because they were incarcerated, died, moved, became ill, were hospitalized, or another reason somewhat out of client's
control, or if the client status at discharge was not known. Percentages are based on all admissions with known and valid values. Admissions for which values were not collected, unknown,
or missing are excluded from the percentage base (denominator).
SOURCE: Center for Behavioral Health Statistics and Quality, Substance Abuse and Mental Health Services Administration, Treatment Episode Data Set (TEDS). Data received through
01.23.15.
Table 6.3. Hospital residential treatment discharges aged 12 and older, by reason for discharge and selected characteristics at admission and discharge:
Number, 2012 (continued)
Selected characteristics
Selected characteristics at admission by reason for discharge Selected characteristics at discharge by reason for discharge
- - Quantity is zero.
106

Completed
treatment or
transferred to
further treatment
Did not complete
treatment or
transfer to
further treatment
Completed
treatment or
transferred to
further treatment
Did not complete
treatment or
transfer to
further treatment
5,637 70.4 14 5,637 70.4 14
Arrests in past 30 days
0 4,831 94.1 94.1 69.3 10 5,015 98.1 97.1 70.8 11
1 255 5.0 4.9 69.8 24 88 1.4 2.4 59.1 14
2 22 0.4 0.4 68.2 40 7 0.2 0.1 85.7 30
3 12 0.2 0.3 66.7 41 2 * 0.1 50.0 30
4 5 0.1 0.1 60.0 38 2 - - 0.1 - - - -
5 2 - - 0.1 - - - - 2 * 0.1 50.0 9
6 to 96 8 0.2 0.1 87.5 36 9 0.2 0.1 77.8 31
Total 5,135 100.0 100.0 69.3 11 5,125 100.0 100.0 70.6 11
Detailed not in labor force1
Homemaker 42 3.0 2.8 78.6 10 45 2.8 3.4 75.6 10
Student 71 4.6 6.2 71.8 9 54 3.8 2.2 87.0 11
Retired 97 7.1 5.6 81.4 14 90 6.2 4.3 84.4 14
Disabled 522 35.2 39.9 75.3 15 566 36.0 38.2 78.1 15
Inmate of institution 134 10.1 6.5 84.3 20 180 11.9 10.5 81.1 21
Other 572 40.0 39.0 78.0 31 618 39.3 41.5 78.2 26
Total 1,438 100.0 100.0 77.5 20 1,553 100.0 100.0 79.1 19
Employment status1
Employed 798 17.1 12.5 75.6 8 830 17.6 13.4 75.8 8
Unemployed 2,851 51.2 66.9 63.2 10 2,635 47.3 63.5 63.9 9
Not in labor force 1,439 31.7 20.6 77.6 20 1,598 35.1 23.1 78.3 18
Total 5,088 100.0 100.0 69.2 11 5,063 100.0 100.0 70.4 11
Frequency of use
No use in the past month 583 10.7 10.1 71.5 15 1,264 31.2 16.3 81.5 30
Some use 1,326 23.2 25.9 68.0 19 1,858 41.1 34.9 73.0 7
Daily use 3,622 66.1 64.0 71.1 12 1,613 27.6 48.8 56.5 5
Total 5,531 100.0 100.0 70.4 14 4,735 100.0 100.0 69.6 11
Living arrangements
Homeless 836 16.4 16.0 70.0 10 672 12.7 15.5 67.0 9
Dependent living 305 5.7 6.5 66.6 25 451 9.5 8.0 74.5 21
Independent living 3,987 77.8 77.5 69.5 11 3,855 77.8 76.5 71.5 11
Total 5,128 100.0 100.0 69.4 11 4,978 100.0 100.0 71.2 11
Table 6.4. Hospital residential treatment discharges aged 12 and older, by treatment completion/transfer, median length of stay (LOS), and selected
characteristics at admission and discharge: Number, percent distribution, and rate, 2012
Selected characteristics at admission Selected characteristics at discharge
Percent distribution Rate of
treatment
completion or
transfer to
further
treatment
Median
LOS (days)
among
treatment
completers
Continued. See notes at end of table.
Selected characteristics
No. of
hospital
residential
treatment
discharges
Percent distribution Rate of
treatment
completion or
transfer to
further
treatment
Median
LOS (days)
among
treatment
completers
No. of
hospital
residential
treatment
discharges
107

Completed
treatment or
transferred to
further treatment
Did not complete
treatment or
transfer to
further treatment
Completed
treatment or
transferred to
further treatment
Did not complete
treatment or
transfer to
further treatment
Primary substance
Alcohol 3,088 57.1 49.2 73.4 15 2,710 49.5 44.6 72.5 11
Opiates 1,324 22.8 25.0 68.4 10 1,136 19.2 22.3 67.2 9
Marijuana/hashish 245 3.7 5.8 60.4 20 211 3.4 4.7 63.0 20
Cocaine 456 7.4 9.8 64.3 21 332 5.0 8.1 59.3 14
Stimulants 212 3.1 5.4 57.1 23 205 3.2 4.7 62.0 22
Other/unknown 312 5.8 4.8 74.4 29 1,043 19.7 15.6 75.0 32
Total 5,637 100.0 100.0 70.4 14 5,637 100.0 100.0 70.4 14
Self-help programs
attended in past 30 days No attendance in the past
month 3,939 79.1 85.5 68.8 12 2,308 57.7 69.8 72.2 10At least 1 time in the past
month 923 20.9 14.5 77.4 10 1,498 42.3 30.2 81.5 21
1-3 times in past month 339 7.3 6.2 73.7 20 394 9.3 13.6 68.3 19
4-7 times in past month 141 3.2 2.2 77.3 5 292 8.8 4.2 86.6 20
8-15 times in past month 73 1.5 1.4 72.6 12 178 5.2 2.9 84.8 24
16-30 times in past month 265 7.0 1.7 90.6 6 383 12.1 3.6 91.4 13Some attendance, but
frequency unknown 105 1.8 3.0 59.0 22 251 6.9 5.8 78.9 31
Total 4,862 100.0 100.0 70.4 11 3,806 100.0 100.0 75.9 15
SOURCE: Center for Behavioral Health Statistics and Quality, Substance Abuse and Mental Health Services Administration, Treatment Episode Data Set (TEDS). Data received through
01.23.15.
Percent distribution Rate of
treatment
completion or
transfer to
further
treatment
Median
LOS (days)
among
treatment
completers
- - Quantity is zero; * Less than 0.05 percent.1
Includes only discharges aged 16 and above for employment status and detailed not in labor force.
NOTES: Based on linked admission and discharge data reported by the 16 states that offered hospital residential substance abuse treatment and reported these data to TEDS. Percentages
may not add to 100 percent due to rounding. In LOS calculations, missing values of the associated variables were excluded. Percentages are based on all admissions with known and valid
values. Admissions for which values were not collected, unknown, or missing are excluded from the percentage base (denominator).
Selected characteristics
No. of
hospital
residential
treatment
discharges
Percent distribution Rate of
treatment
completion or
transfer to
further
treatment
Median
LOS (days)
among
treatment
completers
No. of
hospital
residential
treatment
discharges
Selected characteristics at admission Selected characteristics at discharge
Table 6.4. Hospital residential treatment discharges aged 12 and older, by treatment completion/transfer, median length of stay (LOS), and selected
characteristics at admission and discharge: Number, percent distribution, and rate, 2012 (continued)
108
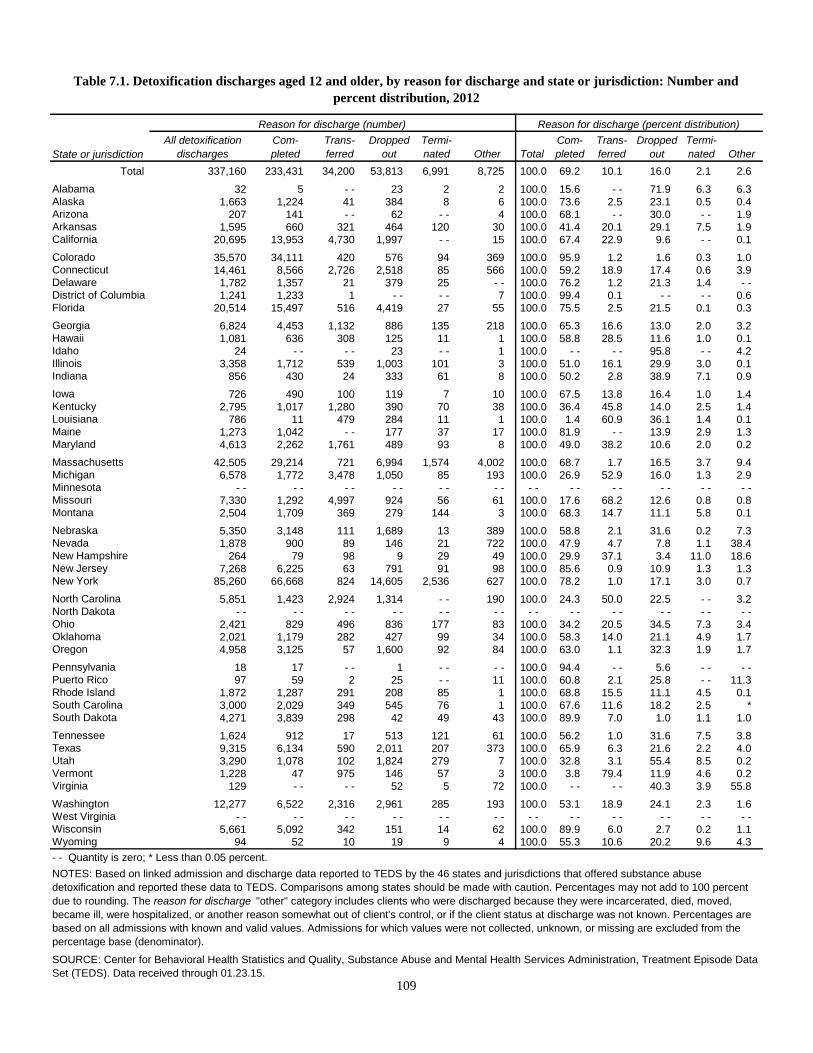
All detoxification
discharges
Com-
pleted
Trans-
ferred
Dropped
out
Termi-
nated Other Total
Com-
pleted
Trans-
ferred
Dropped
out
Termi-
nated Other
Total 337,160 233,431 34,200 53,813 6,991 8,725 100.0 69.2 10.1 16.0 2.1 2.6
Alabama 32 5 - - 23 2 2 100.0 15.6 - - 71.9 6.3 6.3Alaska 1,663 1,224 41 384 8 6 100.0 73.6 2.5 23.1 0.5 0.4Arizona 207 141 - - 62 - - 4 100.0 68.1 - - 30.0 - - 1.9Arkansas 1,595 660 321 464 120 30 100.0 41.4 20.1 29.1 7.5 1.9California 20,695 13,953 4,730 1,997 - - 15 100.0 67.4 22.9 9.6 - - 0.1
Colorado 35,570 34,111 420 576 94 369 100.0 95.9 1.2 1.6 0.3 1.0Connecticut 14,461 8,566 2,726 2,518 85 566 100.0 59.2 18.9 17.4 0.6 3.9Delaware 1,782 1,357 21 379 25 - - 100.0 76.2 1.2 21.3 1.4 - -District of Columbia 1,241 1,233 1 - - - - 7 100.0 99.4 0.1 - - - - 0.6Florida 20,514 15,497 516 4,419 27 55 100.0 75.5 2.5 21.5 0.1 0.3
Georgia 6,824 4,453 1,132 886 135 218 100.0 65.3 16.6 13.0 2.0 3.2Hawaii 1,081 636 308 125 11 1 100.0 58.8 28.5 11.6 1.0 0.1Idaho 24 - - - - 23 - - 1 100.0 - - - - 95.8 - - 4.2Illinois 3,358 1,712 539 1,003 101 3 100.0 51.0 16.1 29.9 3.0 0.1Indiana 856 430 24 333 61 8 100.0 50.2 2.8 38.9 7.1 0.9
Iowa 726 490 100 119 7 10 100.0 67.5 13.8 16.4 1.0 1.4Kentucky 2,795 1,017 1,280 390 70 38 100.0 36.4 45.8 14.0 2.5 1.4Louisiana 786 11 479 284 11 1 100.0 1.4 60.9 36.1 1.4 0.1Maine 1,273 1,042 - - 177 37 17 100.0 81.9 - - 13.9 2.9 1.3Maryland 4,613 2,262 1,761 489 93 8 100.0 49.0 38.2 10.6 2.0 0.2
Massachusetts 42,505 29,214 721 6,994 1,574 4,002 100.0 68.7 1.7 16.5 3.7 9.4Michigan 6,578 1,772 3,478 1,050 85 193 100.0 26.9 52.9 16.0 1.3 2.9Minnesota - - - - - - - - - - - - - - - - - - - - - - - -Missouri 7,330 1,292 4,997 924 56 61 100.0 17.6 68.2 12.6 0.8 0.8Montana 2,504 1,709 369 279 144 3 100.0 68.3 14.7 11.1 5.8 0.1
Nebraska 5,350 3,148 111 1,689 13 389 100.0 58.8 2.1 31.6 0.2 7.3Nevada 1,878 900 89 146 21 722 100.0 47.9 4.7 7.8 1.1 38.4New Hampshire 264 79 98 9 29 49 100.0 29.9 37.1 3.4 11.0 18.6New Jersey 7,268 6,225 63 791 91 98 100.0 85.6 0.9 10.9 1.3 1.3New York 85,260 66,668 824 14,605 2,536 627 100.0 78.2 1.0 17.1 3.0 0.7
North Carolina 5,851 1,423 2,924 1,314 - - 190 100.0 24.3 50.0 22.5 - - 3.2North Dakota - - - - - - - - - - - - - - - - - - - - - - - -Ohio 2,421 829 496 836 177 83 100.0 34.2 20.5 34.5 7.3 3.4Oklahoma 2,021 1,179 282 427 99 34 100.0 58.3 14.0 21.1 4.9 1.7Oregon 4,958 3,125 57 1,600 92 84 100.0 63.0 1.1 32.3 1.9 1.7
Pennsylvania 18 17 - - 1 - - - - 100.0 94.4 - - 5.6 - - - -Puerto Rico 97 59 2 25 - - 11 100.0 60.8 2.1 25.8 - - 11.3Rhode Island 1,872 1,287 291 208 85 1 100.0 68.8 15.5 11.1 4.5 0.1South Carolina 3,000 2,029 349 545 76 1 100.0 67.6 11.6 18.2 2.5 *South Dakota 4,271 3,839 298 42 49 43 100.0 89.9 7.0 1.0 1.1 1.0
Tennessee 1,624 912 17 513 121 61 100.0 56.2 1.0 31.6 7.5 3.8Texas 9,315 6,134 590 2,011 207 373 100.0 65.9 6.3 21.6 2.2 4.0Utah 3,290 1,078 102 1,824 279 7 100.0 32.8 3.1 55.4 8.5 0.2Vermont 1,228 47 975 146 57 3 100.0 3.8 79.4 11.9 4.6 0.2Virginia 129 - - - - 52 5 72 100.0 - - - - 40.3 3.9 55.8
Washington 12,277 6,522 2,316 2,961 285 193 100.0 53.1 18.9 24.1 2.3 1.6West Virginia - - - - - - - - - - - - - - - - - - - - - - - -Wisconsin 5,661 5,092 342 151 14 62 100.0 89.9 6.0 2.7 0.2 1.1Wyoming 94 52 10 19 9 4 100.0 55.3 10.6 20.2 9.6 4.3
SOURCE: Center for Behavioral Health Statistics and Quality, Substance Abuse and Mental Health Services Administration, Treatment Episode Data
Set (TEDS). Data received through 01.23.15.
Table 7.1. Detoxification discharges aged 12 and older, by reason for discharge and state or jurisdiction: Number and
percent distribution, 2012
State or jurisdiction
Reason for discharge (number) Reason for discharge (percent distribution)
- - Quantity is zero; * Less than 0.05 percent.
NOTES: Based on linked admission and discharge data reported to TEDS by the 46 states and jurisdictions that offered substance abuse
detoxification and reported these data to TEDS. Comparisons among states should be made with caution. Percentages may not add to 100 percent
due to rounding. The reason for discharge "other" category includes clients who were discharged because they were incarcerated, died, moved,
became ill, were hospitalized, or another reason somewhat out of client's control, or if the client status at discharge was not known. Percentages are
based on all admissions with known and valid values. Admissions for which values were not collected, unknown, or missing are excluded from the
percentage base (denominator).
109
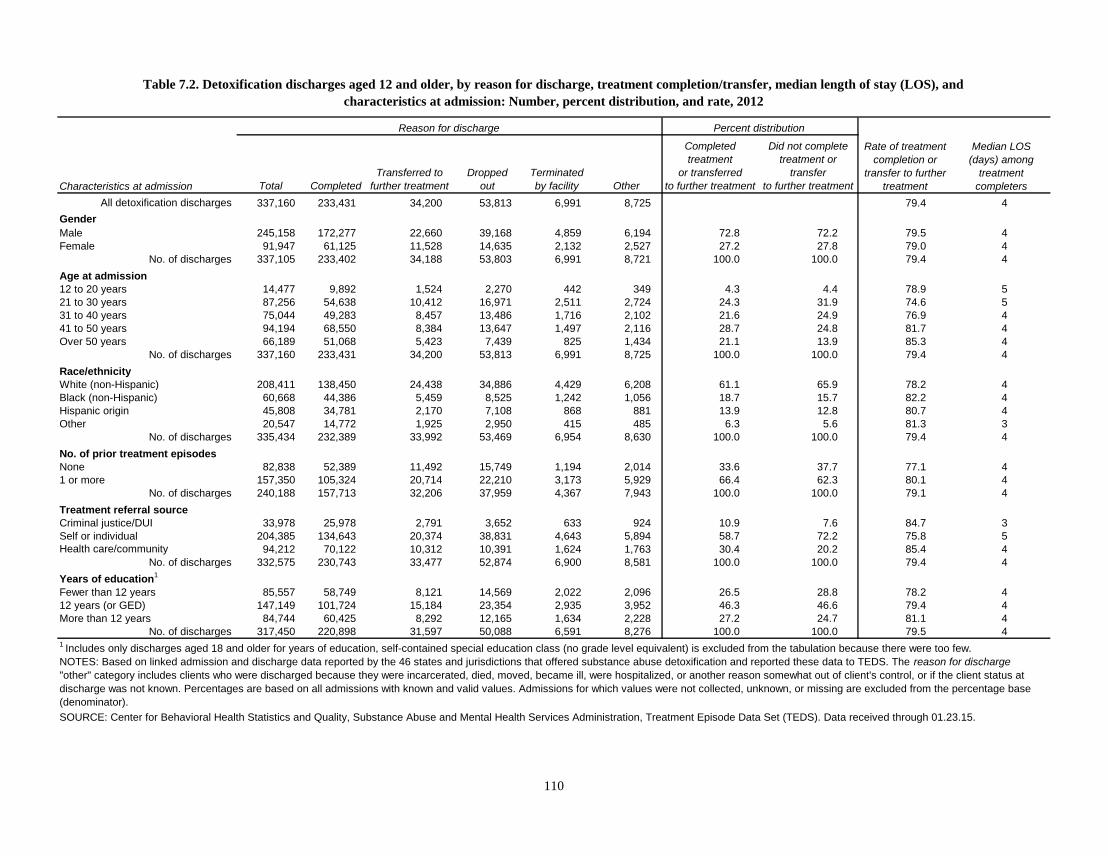
Total Completed
Transferred to
further treatment
Dropped
out
Terminated
by facility Other
Completed
treatment
or transferred
to further treatment
Did not complete
treatment or
transfer
to further treatment
All detoxification discharges. 337,160 233,431 34,200 53,813 6,991 8,725 79.4 4
Gender
Male 245,158 172,277 22,660 39,168 4,859 6,194 72.8 72.2 79.5 4
Female 91,947 61,125 11,528 14,635 2,132 2,527 27.2 27.8 79.0 4
No. of discharges 337,105 233,402 34,188 53,803 6,991 8,721 100.0 100.0 79.4 4
Age at admission
12 to 20 years 14,477 9,892 1,524 2,270 442 349 4.3 4.4 78.9 5
21 to 30 years 87,256 54,638 10,412 16,971 2,511 2,724 24.3 31.9 74.6 5
31 to 40 years 75,044 49,283 8,457 13,486 1,716 2,102 21.6 24.9 76.9 4
41 to 50 years 94,194 68,550 8,384 13,647 1,497 2,116 28.7 24.8 81.7 4
Over 50 years 66,189 51,068 5,423 7,439 825 1,434 21.1 13.9 85.3 4
No. of discharges 337,160 233,431 34,200 53,813 6,991 8,725 100.0 100.0 79.4 4
Race/ethnicity
White (non-Hispanic) 208,411 138,450 24,438 34,886 4,429 6,208 61.1 65.9 78.2 4
Black (non-Hispanic) 60,668 44,386 5,459 8,525 1,242 1,056 18.7 15.7 82.2 4
Hispanic origin 45,808 34,781 2,170 7,108 868 881 13.9 12.8 80.7 4
Other 20,547 14,772 1,925 2,950 415 485 6.3 5.6 81.3 3
No. of discharges 335,434 232,389 33,992 53,469 6,954 8,630 100.0 100.0 79.4 4
No. of prior treatment episodes
None 82,838 52,389 11,492 15,749 1,194 2,014 33.6 37.7 77.1 4
1 or more 157,350 105,324 20,714 22,210 3,173 5,929 66.4 62.3 80.1 4
No. of discharges 240,188 157,713 32,206 37,959 4,367 7,943 100.0 100.0 79.1 4
Treatment referral source
Criminal justice/DUI 33,978 25,978 2,791 3,652 633 924 10.9 7.6 84.7 3
Self or individual 204,385 134,643 20,374 38,831 4,643 5,894 58.7 72.2 75.8 5
Health care/community 94,212 70,122 10,312 10,391 1,624 1,763 30.4 20.2 85.4 4
No. of discharges 332,575 230,743 33,477 52,874 6,900 8,581 100.0 100.0 79.4 4
Years of education1
Fewer than 12 years 85,557 58,749 8,121 14,569 2,022 2,096 26.5 28.8 78.2 4
12 years (or GED) 147,149 101,724 15,184 23,354 2,935 3,952 46.3 46.6 79.4 4
More than 12 years 84,744 60,425 8,292 12,165 1,634 2,228 27.2 24.7 81.1 4
No. of discharges 317,450 220,898 31,597 50,088 6,591 8,276 100.0 100.0 79.5 41 Includes only discharges aged 18 and older for years of education, self-contained special education class (no grade level equivalent) is excluded from the tabulation because there were too few.
NOTES: Based on linked admission and discharge data reported by the 46 states and jurisdictions that offered substance abuse detoxification and reported these data to TEDS. The reason for discharge
"other" category includes clients who were discharged because they were incarcerated, died, moved, became ill, were hospitalized, or another reason somewhat out of client's control, or if the client status at
discharge was not known. Percentages are based on all admissions with known and valid values. Admissions for which values were not collected, unknown, or missing are excluded from the percentage base
(denominator).
SOURCE: Center for Behavioral Health Statistics and Quality, Substance Abuse and Mental Health Services Administration, Treatment Episode Data Set (TEDS). Data received through 01.23.15.
Table 7.2. Detoxification discharges aged 12 and older, by reason for discharge, treatment completion/transfer, median length of stay (LOS), and
characteristics at admission: Number, percent distribution, and rate, 2012
Characteristics at admission
Reason for discharge Percent distribution
Rate of treatment
completion or
transfer to further
treatment
Median LOS
(days) among
treatment
completers
110

Total Completed
Transferred
to
further
treatment
Dropped
out
Terminated
by facility Other Total Completed
Transferred
to
further
treatment
Dropped
out
Terminated
by facility Other
All detoxification discharges 337,160 233,431 34,200 53,813 6,991 8,725 337,160 233,431 34,200 53,813 6,991 8,725
Arrests in past 30 days
0 222,851 148,722 28,908 34,152 3,776 7,293 223,322 150,435 29,275 32,427 3,849 7,336
1 11,930 7,830 1,817 1,487 289 507 7,651 4,956 1,349 801 147 398
2 1,407 861 244 229 37 36 897 556 197 99 19 26
3 366 213 56 74 14 9 296 184 48 49 9 6
4 144 87 16 29 9 3 122 75 18 22 5 2
5 91 58 4 20 6 3 59 41 2 11 4 1
6 to 96 248 156 29 43 15 5 266 172 33 42 15 4
No. of discharges 237,037 157,927 31,074 36,034 4,146 7,856 232,613 156,419 30,922 33,451 4,048 7,773
Detailed not in labor force1
Homemaker 1,071 681 194 157 13 26 880 513 191 145 11 20
Student 2,528 1,969 152 272 67 68 2,091 1,653 122 194 52 70
Retired 3,035 2,477 181 253 39 85 1,647 1,297 165 120 5 60
Disabled 26,580 19,750 1,980 3,480 489 881 16,239 11,336 1,866 2,029 260 748
Inmate of institution 1,871 1,430 96 234 92 19 2,536 2,104 98 225 86 23
Other 92,496 65,711 5,198 16,032 2,810 2,745 38,212 23,767 4,719 6,624 978 2,124
No. of discharges 127,581 92,018 7,801 20,428 3,510 3,824 61,605 40,670 7,161 9,337 1,392 3,045
Employment status1
Employed 38,115 28,035 3,529 5,107 527 917 29,209 21,105 3,277 3,619 350 858
Unemployed 120,419 78,989 16,896 18,512 2,511 3,511 109,997 71,451 16,572 15,952 2,273 3,749
Not in labor force 143,568 102,943 10,821 22,343 3,584 3,877 75,084 50,657 10,405 9,520 1,417 3,085
No. of discharges 302,102 209,967 31,246 45,962 6,622 8,305 214,290 143,213 30,254 29,091 4,040 7,692
Frequency of use
No use in the past month 9,065 6,840 888 793 261 283 50,294 33,163 6,062 6,173 1,506 3,390
Some use 71,510 54,280 8,503 6,576 907 1,244 80,749 59,227 11,139 8,198 973 1,212
Daily use 254,519 170,947 24,682 46,011 5,794 7,085 105,637 64,551 15,527 20,721 1,643 3,195No. of discharges 335,094 232,067 34,073 53,380 6,962 8,612 236,680 156,941 32,728 35,092 4,122 7,797
Living arrangements
Homeless 101,108 71,490 8,827 15,924 2,332 2,535 56,356 39,080 7,098 7,384 1,062 1,732
Dependent living 35,827 26,172 3,782 4,699 591 583 42,328 31,895 4,811 3,999 560 1,063
Independent living 190,326 130,628 19,876 30,677 3,826 5,319 126,854 81,633 18,550 19,714 2,248 4,709
No. of discharges 327,261 228,290 32,485 51,300 6,749 8,437 225,538 152,608 30,459 31,097 3,870 7,504
Continued. See notes at end of table.
Table 7.3. Detoxification discharges aged 12 and older, by reason for discharge and selected characteristics at admission and discharge: Number, 2012
Selected characteristics
Selected characteristics at admission by reason for discharge Selected characteristics at discharge by reason for discharge
111
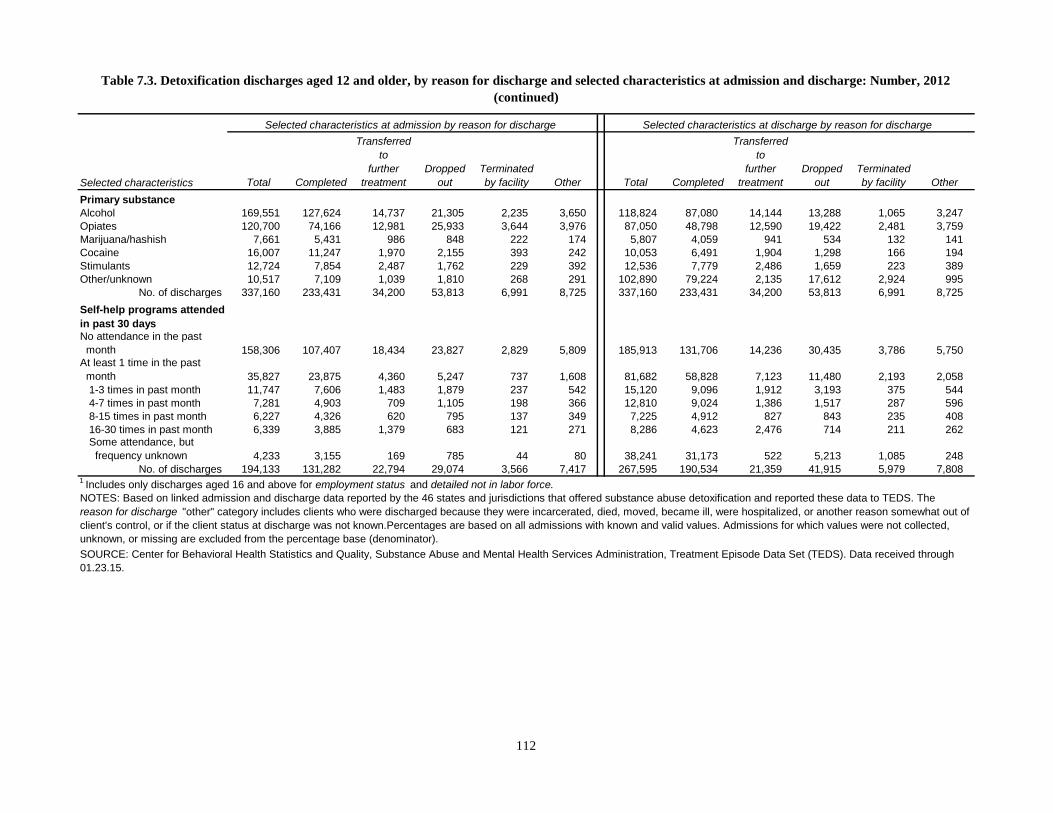
Total Completed
Transferred
to
further
treatment
Dropped
out
Terminated
by facility Other Total Completed
Transferred
to
further
treatment
Dropped
out
Terminated
by facility Other
Primary substance
Alcohol 169,551 127,624 14,737 21,305 2,235 3,650 118,824 87,080 14,144 13,288 1,065 3,247
Opiates 120,700 74,166 12,981 25,933 3,644 3,976 87,050 48,798 12,590 19,422 2,481 3,759
Marijuana/hashish 7,661 5,431 986 848 222 174 5,807 4,059 941 534 132 141
Cocaine 16,007 11,247 1,970 2,155 393 242 10,053 6,491 1,904 1,298 166 194
Stimulants 12,724 7,854 2,487 1,762 229 392 12,536 7,779 2,486 1,659 223 389
Other/unknown 10,517 7,109 1,039 1,810 268 291 102,890 79,224 2,135 17,612 2,924 995
No. of discharges 337,160 233,431 34,200 53,813 6,991 8,725 337,160 233,431 34,200 53,813 6,991 8,725
Self-help programs attended
in past 30 days
No attendance in the past
month 158,306 107,407 18,434 23,827 2,829 5,809 185,913 131,706 14,236 30,435 3,786 5,750At least 1 time in the past
month 35,827 23,875 4,360 5,247 737 1,608 81,682 58,828 7,123 11,480 2,193 2,058
1-3 times in past month 11,747 7,606 1,483 1,879 237 542 15,120 9,096 1,912 3,193 375 544
4-7 times in past month 7,281 4,903 709 1,105 198 366 12,810 9,024 1,386 1,517 287 596
8-15 times in past month 6,227 4,326 620 795 137 349 7,225 4,912 827 843 235 408
16-30 times in past month 6,339 3,885 1,379 683 121 271 8,286 4,623 2,476 714 211 262Some attendance, but
frequency unknown 4,233 3,155 169 785 44 80 38,241 31,173 522 5,213 1,085 248
No. of discharges 194,133 131,282 22,794 29,074 3,566 7,417 267,595 190,534 21,359 41,915 5,979 7,808
NOTES: Based on linked admission and discharge data reported by the 46 states and jurisdictions that offered substance abuse detoxification and reported these data to TEDS. The
reason for discharge "other" category includes clients who were discharged because they were incarcerated, died, moved, became ill, were hospitalized, or another reason somewhat out of
client's control, or if the client status at discharge was not known.Percentages are based on all admissions with known and valid values. Admissions for which values were not collected,
unknown, or missing are excluded from the percentage base (denominator).
SOURCE: Center for Behavioral Health Statistics and Quality, Substance Abuse and Mental Health Services Administration, Treatment Episode Data Set (TEDS). Data received through
01.23.15.
Table 7.3. Detoxification discharges aged 12 and older, by reason for discharge and selected characteristics at admission and discharge: Number, 2012
(continued)
Selected characteristics
Selected characteristics at admission by reason for discharge Selected characteristics at discharge by reason for discharge
1 Includes only discharges aged 16 and above for employment status and detailed not in labor force.
112

Completed
treatment or
transferred to
further treatment
Did not complete
treatment or
transfer to
further treatment
Completed
treatment or
transferred to
further treatment
Did not complete
treatment or
transfer to
further treatment
337,160 79.4 4 337,160 79.4 4
Arrests in past 30 days
0 222,851 94.0 94.1 79.7 4 223,322 95.9 96.3 80.5 4
1 11,930 5.1 4.8 80.9 5 7,651 3.4 3.0 82.4 4
2 1,407 0.6 0.6 78.5 5 897 0.4 0.3 83.9 4
3 366 0.1 0.2 73.5 4 296 0.1 0.1 78.4 4
4 144 0.1 0.1 71.5 4 122 * 0.1 76.2 4
5 91 * 0.1 68.1 3 59 * * 72.9 3
6 to 96 248 0.1 0.1 74.6 3 266 0.1 0.1 77.1 3
Total 237,037 100.0 100.0 79.7 4 232,613 100.0 100.0 80.5 4
Detailed not in labor force1
Homemaker 1,071 0.9 0.7 81.7 4 880 1.5 1.3 80.0 4
Student 2,528 2.1 1.5 83.9 5 2,091 3.7 2.3 84.9 5
Retired 3,035 2.7 1.4 87.6 4 1,647 3.1 1.3 88.8 3
Disabled 26,580 21.8 17.5 81.8 4 16,239 27.6 22.0 81.3 3
Inmate of institution 1,871 1.5 1.2 81.6 60 2,536 4.6 2.4 86.8 6
Other 92,496 71.0 77.8 76.7 5 38,212 59.6 70.6 74.5 5
Total 127,581 100.0 100.0 78.2 5 61,605 100.0 100.0 77.6 5
Employment status1
Employed 38,115 13.1 10.8 82.8 4 29,209 14.1 11.8 83.5 3
Unemployed 120,419 39.8 40.3 79.6 4 109,997 50.7 53.8 80.0 4
Not in labor force 143,568 47.2 48.9 79.2 5 75,084 35.2 34.3 81.3 5
Total 302,102 100.0 100.0 79.8 4 214,290 100.0 100.0 80.9 4
Frequency of use
No use in the past month 9,065 2.9 1.9 85.3 5 50,294 20.7 23.5 78.0 6
Some use 71,510 23.6 12.7 87.8 3 80,749 37.1 22.1 87.1 3
Daily use 254,519 73.5 85.4 76.9 5 105,637 42.2 54.4 75.8 4
Total 335,094 100.0 100.0 79.4 4 236,680 100.0 100.0 80.1 4
Living arrangements
Homeless 101,108 30.8 31.3 79.4 4 56,356 25.2 24.0 81.9 3
Dependent living 35,827 11.5 8.8 83.6 4 42,328 20.1 13.2 86.7 5
Independent living 190,326 57.7 59.9 79.1 4 126,854 54.7 62.8 79.0 4
Total 327,261 100.0 100.0 79.7 4 225,538 100.0 100.0 81.2 4
Table 7.4. Detoxification discharges aged 12 and older, by treatment completion/transfer, median length of stay (LOS), and selected characteristics at admission
and discharge: Number, percent distribution, and rate, 2012
Selected characteristics at admission Selected characteristics at discharge
Percent distribution Rate of
treatment
completion or
transfer to
further
treatment
Median
LOS (days)
among
treatment
completers
Continued. See notes at end of table.
Selected characteristics
No. of
detoxification
discharges
Percent distribution Rate of
treatment
completion or
transfer to
further
treatment
Median
LOS (days)
among
treatment
completers
No. of
detoxification
discharges
113

Completed
treatment or
transferred to
further treatment
Did not complete
treatment or
transfer to
further treatment
Completed
treatment or
transferred to
further treatment
Did not complete
treatment or
transfer to
further treatment
Primary substance
Alcohol 169,551 53.2 39.1 84.0 4 118,824 37.8 25.3 85.2 3
Opiates 120,700 32.6 48.3 72.2 5 87,050 22.9 36.9 70.5 5
Marijuana/hashish 7,661 2.4 1.8 83.8 5 5,807 1.9 1.2 86.1 5
Cocaine 16,007 4.9 4.0 82.6 4 10,053 3.1 2.4 83.5 4
Stimulants 12,724 3.9 3.4 81.3 4 12,536 3.8 3.3 81.9 4
Other/unknown 10,517 3.0 3.4 77.5 5 102,890 30.4 31.0 79.1 5
Total 337,160 100.0 100.0 79.4 4 337,160 100.0 100.0 79.4 4
Self-help programs
attended in past 30 days No attendance in the past
month 158,306 81.7 81.0 79.5 4 185,913 68.9 71.8 78.5 4At least 1 time in the past
month 35,827 18.3 19.0 78.8 5 81,682 31.1 28.2 80.7 5
1-3 times in past month 11,747 5.9 6.6 77.4 4 15,120 5.2 7.4 72.8 4
4-7 times in past month 7,281 3.6 4.2 77.1 5 12,810 4.9 4.3 81.3 5
8-15 times in past month 6,227 3.2 3.2 79.4 5 7,225 2.7 2.7 79.4 6
16-30 times in past month 6,339 3.4 2.7 83.0 5 8,286 3.4 2.1 85.7 9Some attendance, but
frequency unknown 4,233 2.2 2.3 78.5 5 38,241 15.0 11.8 82.9 5
Total 194,133 100.0 100.0 79.4 4 267,595 100.0 100.0 79.2 4
SOURCE: Center for Behavioral Health Statistics and Quality, Substance Abuse and Mental Health Services Administration, Treatment Episode Data Set (TEDS). Data received through
01.23.15.
Percent distribution Rate of
treatment
completion or
transfer to
further
treatment
Median
LOS (days)
among
treatment
completers
* Less than 0.05 percent.1
Includes only discharges aged 16 and above for employment status and detailed not in labor force.
NOTES: Based on linked admission and discharge data reported by the 46 states and jurisdictions that offered substance abuse detoxification and reported these data to TEDS. Percentages
may not add to 100 percent due to rounding. In LOS calculations, missing values of the associated variables were excluded.Percentages are based on all admissions with known and valid
values. Admissions for which values were not collected, unknown, or missing are excluded from the percentage base (denominator).
Selected characteristics
No. of
detoxification
discharges
Percent distribution Rate of
treatment
completion or
transfer to
further
treatment
Median
LOS (days)
among
treatment
completers
No. of
detoxification
discharges
Selected characteristics at admission Selected characteristics at discharge
Table 7.4. Detoxification discharges aged 12 and older, by treatment completion/transfer, median length of stay (LOS), and selected characteristics at admission
and discharge: Number, percent distribution, and rate, 2012 (continued)
114
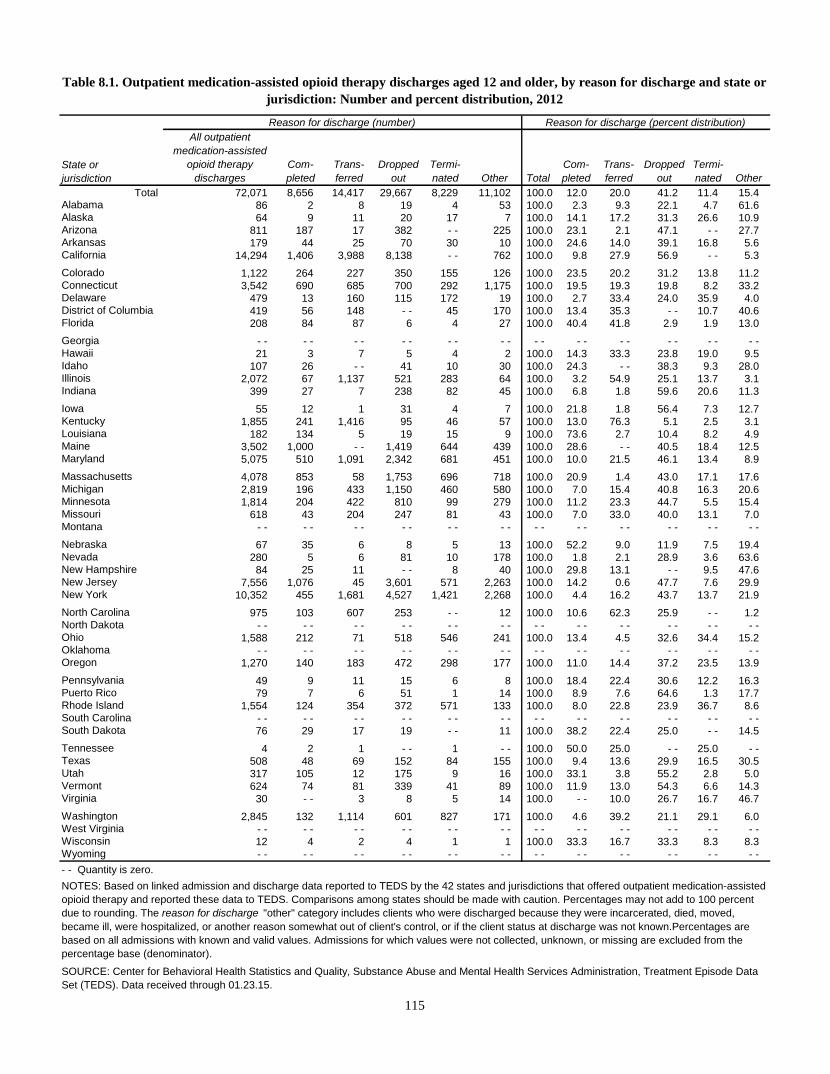
All outpatient
medication-assisted
opioid therapy
discharges
Com-
pleted
Trans-
ferred
Dropped
out
Termi-
nated Other Total
Com-
pleted
Trans-
ferred
Dropped
out
Termi-
nated Other
Total 72,071 8,656 14,417 29,667 8,229 11,102 100.0 12.0 20.0 41.2 11.4 15.4Alabama 86 2 8 19 4 53 100.0 2.3 9.3 22.1 4.7 61.6Alaska 64 9 11 20 17 7 100.0 14.1 17.2 31.3 26.6 10.9Arizona 811 187 17 382 - - 225 100.0 23.1 2.1 47.1 - - 27.7Arkansas 179 44 25 70 30 10 100.0 24.6 14.0 39.1 16.8 5.6California 14,294 1,406 3,988 8,138 - - 762 100.0 9.8 27.9 56.9 - - 5.3
Colorado 1,122 264 227 350 155 126 100.0 23.5 20.2 31.2 13.8 11.2Connecticut 3,542 690 685 700 292 1,175 100.0 19.5 19.3 19.8 8.2 33.2Delaware 479 13 160 115 172 19 100.0 2.7 33.4 24.0 35.9 4.0District of Columbia 419 56 148 - - 45 170 100.0 13.4 35.3 - - 10.7 40.6Florida 208 84 87 6 4 27 100.0 40.4 41.8 2.9 1.9 13.0
Georgia - - - - - - - - - - - - - - - - - - - - - - - -Hawaii 21 3 7 5 4 2 100.0 14.3 33.3 23.8 19.0 9.5Idaho 107 26 - - 41 10 30 100.0 24.3 - - 38.3 9.3 28.0Illinois 2,072 67 1,137 521 283 64 100.0 3.2 54.9 25.1 13.7 3.1Indiana 399 27 7 238 82 45 100.0 6.8 1.8 59.6 20.6 11.3
Iowa 55 12 1 31 4 7 100.0 21.8 1.8 56.4 7.3 12.7Kentucky 1,855 241 1,416 95 46 57 100.0 13.0 76.3 5.1 2.5 3.1Louisiana 182 134 5 19 15 9 100.0 73.6 2.7 10.4 8.2 4.9Maine 3,502 1,000 - - 1,419 644 439 100.0 28.6 - - 40.5 18.4 12.5Maryland 5,075 510 1,091 2,342 681 451 100.0 10.0 21.5 46.1 13.4 8.9
Massachusetts 4,078 853 58 1,753 696 718 100.0 20.9 1.4 43.0 17.1 17.6Michigan 2,819 196 433 1,150 460 580 100.0 7.0 15.4 40.8 16.3 20.6Minnesota 1,814 204 422 810 99 279 100.0 11.2 23.3 44.7 5.5 15.4Missouri 618 43 204 247 81 43 100.0 7.0 33.0 40.0 13.1 7.0Montana - - - - - - - - - - - - - - - - - - - - - - - -
Nebraska 67 35 6 8 5 13 100.0 52.2 9.0 11.9 7.5 19.4Nevada 280 5 6 81 10 178 100.0 1.8 2.1 28.9 3.6 63.6New Hampshire 84 25 11 - - 8 40 100.0 29.8 13.1 - - 9.5 47.6New Jersey 7,556 1,076 45 3,601 571 2,263 100.0 14.2 0.6 47.7 7.6 29.9New York 10,352 455 1,681 4,527 1,421 2,268 100.0 4.4 16.2 43.7 13.7 21.9
North Carolina 975 103 607 253 - - 12 100.0 10.6 62.3 25.9 - - 1.2North Dakota - - - - - - - - - - - - - - - - - - - - - - - -Ohio 1,588 212 71 518 546 241 100.0 13.4 4.5 32.6 34.4 15.2Oklahoma - - - - - - - - - - - - - - - - - - - - - - - -Oregon 1,270 140 183 472 298 177 100.0 11.0 14.4 37.2 23.5 13.9
Pennsylvania 49 9 11 15 6 8 100.0 18.4 22.4 30.6 12.2 16.3Puerto Rico 79 7 6 51 1 14 100.0 8.9 7.6 64.6 1.3 17.7Rhode Island 1,554 124 354 372 571 133 100.0 8.0 22.8 23.9 36.7 8.6South Carolina - - - - - - - - - - - - - - - - - - - - - - - -South Dakota 76 29 17 19 - - 11 100.0 38.2 22.4 25.0 - - 14.5
Tennessee 4 2 1 - - 1 - - 100.0 50.0 25.0 - - 25.0 - -Texas 508 48 69 152 84 155 100.0 9.4 13.6 29.9 16.5 30.5Utah 317 105 12 175 9 16 100.0 33.1 3.8 55.2 2.8 5.0Vermont 624 74 81 339 41 89 100.0 11.9 13.0 54.3 6.6 14.3Virginia 30 - - 3 8 5 14 100.0 - - 10.0 26.7 16.7 46.7
Washington 2,845 132 1,114 601 827 171 100.0 4.6 39.2 21.1 29.1 6.0West Virginia - - - - - - - - - - - - - - - - - - - - - - - -Wisconsin 12 4 2 4 1 1 100.0 33.3 16.7 33.3 8.3 8.3Wyoming - - - - - - - - - - - - - - - - - - - - - - - -
SOURCE: Center for Behavioral Health Statistics and Quality, Substance Abuse and Mental Health Services Administration, Treatment Episode Data
Set (TEDS). Data received through 01.23.15.
Table 8.1. Outpatient medication-assisted opioid therapy discharges aged 12 and older, by reason for discharge and state or
jurisdiction: Number and percent distribution, 2012
State or
jurisdiction
Reason for discharge (number) Reason for discharge (percent distribution)
- - Quantity is zero.
NOTES: Based on linked admission and discharge data reported to TEDS by the 42 states and jurisdictions that offered outpatient medication-assisted
opioid therapy and reported these data to TEDS. Comparisons among states should be made with caution. Percentages may not add to 100 percent
due to rounding. The reason for discharge "other" category includes clients who were discharged because they were incarcerated, died, moved,
became ill, were hospitalized, or another reason somewhat out of client's control, or if the client status at discharge was not known.Percentages are
based on all admissions with known and valid values. Admissions for which values were not collected, unknown, or missing are excluded from the
percentage base (denominator).
115

Total Completed
Transferred to
further treatment
Dropped
out
Terminated
by facility Other
Completed
treatment
or transferred
to further treatment
Did not complete
treatment or
transfer
to further treatment
All outpatient medication-assisted
opioid therapy discharges 72,071 8,656 14,417 29,667 8,229 11,102 32.0 201
Gender
Male 41,326 4,683 7,307 17,920 4,614 6,802 52.0 59.9 29.0 204
Female 30,736 3,973 7,107 11,742 3,615 4,299 48.0 40.1 36.0 197
No. of discharges 72,062 8,656 14,414 29,662 8,229 11,101 100.0 100.0 32.0 201
Age at admission
12 to 20 years 2,132 319 364 925 246 278 3.0 3.0 32.0 181
21 to 30 years 24,057 3,502 4,732 9,511 2,908 3,404 35.7 32.3 34.2 178
31 to 40 years 17,974 2,138 3,713 7,169 2,162 2,792 25.4 24.7 32.6 173
41 to 50 years 15,773 1,521 3,022 6,874 1,766 2,590 19.7 22.9 28.8 250
Over 50 years 12,135 1,176 2,586 5,188 1,147 2,038 16.3 17.1 31.0 310
No. of discharges 72,071 8,656 14,417 29,667 8,229 11,102 100.0 100.0 32.0 201
Race/ethnicity
White (non-Hispanic) 45,358 6,314 9,120 17,737 5,593 6,594 67.2 61.5 34.0 180
Black (non-Hispanic) 10,921 905 2,380 4,579 1,141 1,916 14.3 15.7 30.1 272
Hispanic origin 11,962 1,045 2,128 5,642 1,069 2,078 13.8 18.1 26.5 276
Other 3,399 342 734 1,556 317 450 4.7 4.8 31.7 215
No. of discharges 71,640 8,606 14,362 29,514 8,120 11,038 100.0 100.0 32.1 200
No. of prior treatment episodes
None 15,861 2,170 3,481 6,468 1,787 1,955 25.0 21.3 35.6 181
1 or more 54,635 6,371 10,609 22,750 6,153 8,752 75.0 78.7 31.1 204
No. of discharges 70,496 8,541 14,090 29,218 7,940 10,707 100.0 100.0 32.1 198
Treatment referral source
Criminal justice/DUI 3,319 693 836 950 281 559 6.7 3.7 46.1 127
Self or individual 52,515 5,731 9,530 23,543 5,751 7,960 67.1 77.8 29.1 262
Health care/community 14,772 2,097 3,842 4,612 1,982 2,239 26.1 18.4 40.2 121
No. of discharges 70,606 8,521 14,208 29,105 8,014 10,758 100.0 100.0 32.2 201
Years of education1
Fewer than 12 years 23,497 2,197 4,601 10,117 2,787 3,795 30.0 34.6 28.9 188
12 years (or GED) 31,560 4,091 6,028 13,153 3,435 4,853 44.6 44.4 32.1 206
More than 12 years 15,911 2,210 3,558 6,088 1,782 2,273 25.4 21.0 36.3 203
No. of discharges 70,968 8,498 14,187 29,358 8,004 10,921 100.0 100.0 32.0 2021 Includes only discharges aged 18 and older for years of education, self-contained special education class (no grade level equivalent) is excluded from the tabulation because there were too few.
NOTES: Based on linked admission and discharge data reported by the 42 states and jurisdictions that offered outpatient medication-assisted opioid therapy and reported these data to TEDS. The reason for
discharge "other" category includes clients who were discharged because they were incarcerated, died, moved, became ill, were hospitalized, or another reason somewhat out of client's control, or if the client
status at discharge was not known. Percentages are based on all admissions with known and valid values. Admissions for which values were not collected, unknown, or missing are excluded from the
percentage base (denominator).
SOURCE: Center for Behavioral Health Statistics and Quality, Substance Abuse and Mental Health Services Administration, Treatment Episode Data Set (TEDS). Data received through 01.23.15.
Table 8.2. Outpatient medication-assisted opioid therapy discharges aged 12 and older, by reason for discharge, treatment completion/transfer, median length of stay (LOS),
and characteristics at admission: Number, percent distribution, and rate, 2012
Characteristics at admission
Reason for discharge Percent distribution
Rate of treatment
completion or
transfer to further
treatment
Median LOS
(days) among
treatment
completers
116

Total Completed
Transferred
to
further
treatment
Dropped
out
Terminated
by facility Other Total Completed
Transferred
to
further
treatment
Dropped
out
Terminated
by facility Other
All outpatient medication-
assisted opioid therapy
discharges 72,071 8,656 14,417 29,667 8,229 11,102 72,071 8,656 14,417 29,667 8,229 11,102
Arrests in past 30 days
0 63,171 7,313 13,295 26,433 6,849 9,281 54,621 7,645 13,725 18,799 6,905 7,547
1 2,802 264 510 1,104 312 612 3,360 158 374 696 300 1,832
2 245 16 35 106 21 67 296 19 33 96 31 117
3 61 5 10 26 6 14 44 1 6 14 7 16
4 24 7 3 7 2 5 14 - - 1 6 1 6
5 22 5 2 8 4 3 14 4 2 4 - - 4
6 to 96 106 4 14 57 7 24 128 9 17 47 14 41
No. of discharges 66,431 7,614 13,869 27,741 7,201 10,006 58,477 7,836 14,158 19,662 7,258 9,563
Detailed not in labor force1
Homemaker 924 165 214 295 125 125 966 182 215 310 132 127
Student 557 84 105 205 71 92 539 100 110 186 66 77
Retired 292 41 52 104 41 54 276 41 49 93 28 65
Disabled 7,490 647 1,458 2,754 1,177 1,454 7,823 728 1,624 2,690 1,234 1,547
Inmate of institution 337 173 47 45 13 59 1,005 161 74 51 16 703
Other 11,211 995 1,973 4,452 1,552 2,239 11,672 894 1,994 4,791 1,606 2,387
No. of discharges 20,811 2,105 3,849 7,855 2,979 4,023 22,281 2,106 4,066 8,121 3,082 4,906
Employment status1
Employed 14,825 2,379 2,832 6,022 1,676 1,916 14,232 2,980 3,019 4,725 1,765 1,743
Unemployed 27,652 3,137 5,614 11,292 3,339 4,270 21,906 2,733 5,072 7,797 3,014 3,290
Not in labor force 28,632 2,871 5,884 12,088 3,115 4,674 25,303 2,788 6,132 8,276 3,137 4,970
No. of discharges 71,109 8,387 14,330 29,402 8,130 10,860 61,441 8,501 14,223 20,798 7,916 10,003
Frequency of use
No use in the past month 12,952 2,381 3,223 3,949 1,194 2,205 20,748 4,518 5,830 5,146 2,229 3,025
Some use 11,510 1,374 2,484 4,707 1,147 1,798 10,950 981 2,686 3,814 1,683 1,786
Daily use 47,242 4,855 8,647 20,891 5,829 7,020 15,469 867 4,598 6,005 2,068 1,931No. of discharges 71,704 8,610 14,354 29,547 8,170 11,023 47,167 6,366 13,114 14,965 5,980 6,742
Living arrangements
Homeless 4,817 437 1,048 1,955 543 834 3,692 239 987 1,310 523 633
Dependent living 10,278 1,146 3,185 3,722 1,009 1,216 8,679 1,095 3,047 1,801 945 1,791
Independent living 56,271 6,901 10,076 23,806 6,606 8,882 46,262 6,468 10,243 16,576 5,949 7,026
No. of discharges 71,366 8,484 14,309 29,483 8,158 10,932 58,633 7,802 14,277 19,687 7,417 9,450
Continued. See notes at end of table.
Table 8.3. Outpatient medication-assisted opioid therapy discharges aged 12 and older, by reason for discharge and selected characteristics at admission and
discharge: Number, 2012
Selected characteristics
Selected characteristics at admission by reason for discharge Selected characteristics at discharge by reason for discharge
117
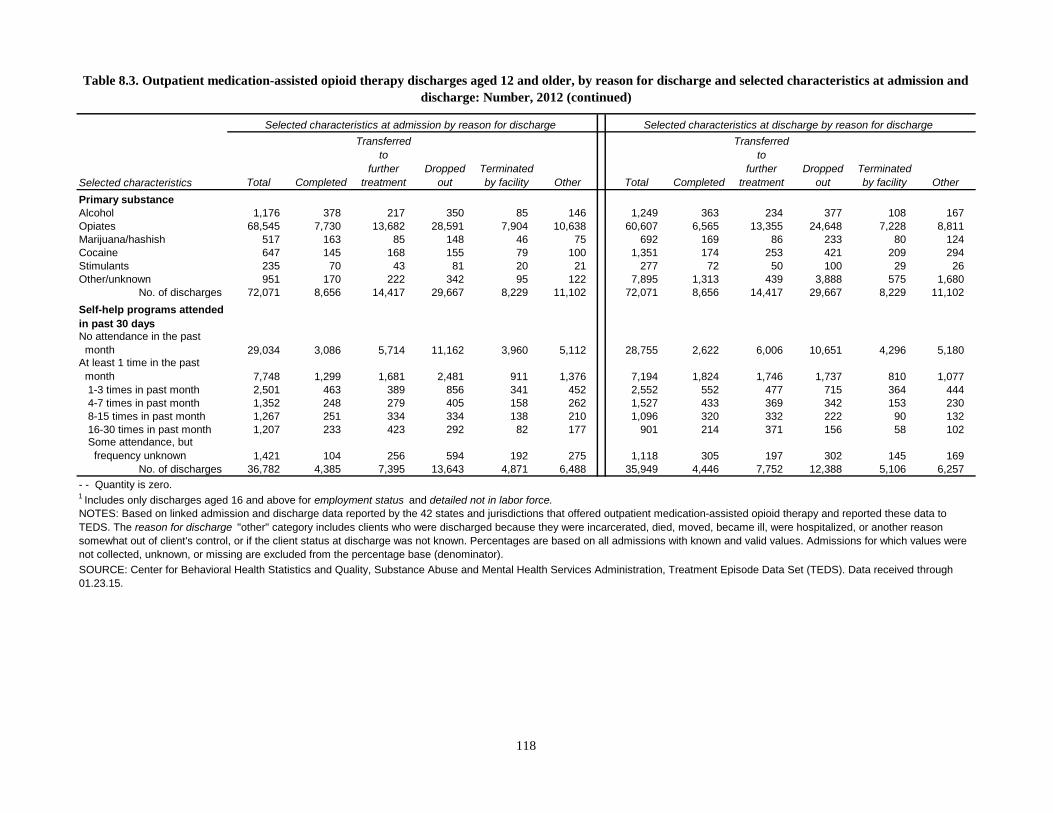
Total Completed
Transferred
to
further
treatment
Dropped
out
Terminated
by facility Other Total Completed
Transferred
to
further
treatment
Dropped
out
Terminated
by facility Other
Primary substance
Alcohol 1,176 378 217 350 85 146 1,249 363 234 377 108 167
Opiates 68,545 7,730 13,682 28,591 7,904 10,638 60,607 6,565 13,355 24,648 7,228 8,811
Marijuana/hashish 517 163 85 148 46 75 692 169 86 233 80 124
Cocaine 647 145 168 155 79 100 1,351 174 253 421 209 294
Stimulants 235 70 43 81 20 21 277 72 50 100 29 26
Other/unknown 951 170 222 342 95 122 7,895 1,313 439 3,888 575 1,680
No. of discharges 72,071 8,656 14,417 29,667 8,229 11,102 72,071 8,656 14,417 29,667 8,229 11,102
Self-help programs attended
in past 30 days
No attendance in the past
month 29,034 3,086 5,714 11,162 3,960 5,112 28,755 2,622 6,006 10,651 4,296 5,180At least 1 time in the past
month 7,748 1,299 1,681 2,481 911 1,376 7,194 1,824 1,746 1,737 810 1,077
1-3 times in past month 2,501 463 389 856 341 452 2,552 552 477 715 364 444
4-7 times in past month 1,352 248 279 405 158 262 1,527 433 369 342 153 230
8-15 times in past month 1,267 251 334 334 138 210 1,096 320 332 222 90 132
16-30 times in past month 1,207 233 423 292 82 177 901 214 371 156 58 102Some attendance, but
frequency unknown 1,421 104 256 594 192 275 1,118 305 197 302 145 169
No. of discharges 36,782 4,385 7,395 13,643 4,871 6,488 35,949 4,446 7,752 12,388 5,106 6,257
1 Includes only discharges aged 16 and above for employment status and detailed not in labor force.
NOTES: Based on linked admission and discharge data reported by the 42 states and jurisdictions that offered outpatient medication-assisted opioid therapy and reported these data to
TEDS. The reason for discharge "other" category includes clients who were discharged because they were incarcerated, died, moved, became ill, were hospitalized, or another reason
somewhat out of client's control, or if the client status at discharge was not known. Percentages are based on all admissions with known and valid values. Admissions for which values were
not collected, unknown, or missing are excluded from the percentage base (denominator).
SOURCE: Center for Behavioral Health Statistics and Quality, Substance Abuse and Mental Health Services Administration, Treatment Episode Data Set (TEDS). Data received through
01.23.15.
Table 8.3. Outpatient medication-assisted opioid therapy discharges aged 12 and older, by reason for discharge and selected characteristics at admission and
discharge: Number, 2012 (continued)
Selected characteristics
Selected characteristics at admission by reason for discharge Selected characteristics at discharge by reason for discharge
- - Quantity is zero.
118
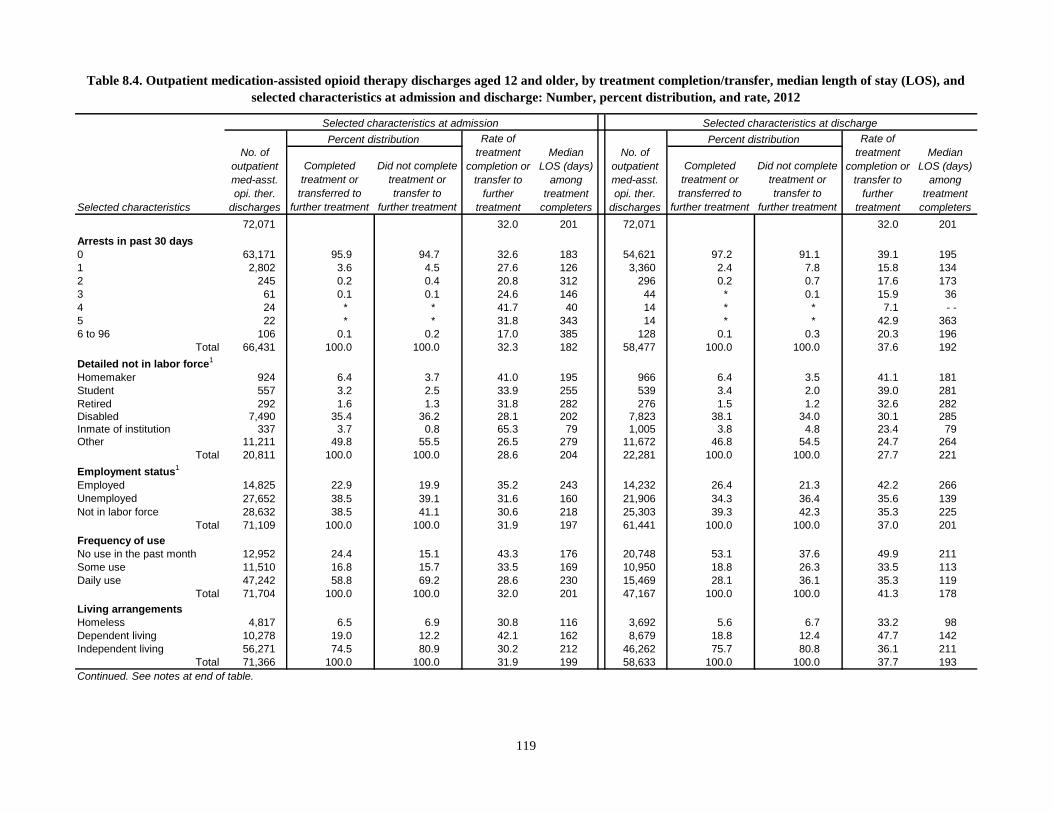
Completed
treatment or
transferred to
further treatment
Did not complete
treatment or
transfer to
further treatment
Completed
treatment or
transferred to
further treatment
Did not complete
treatment or
transfer to
further treatment
72,071 32.0 201 72,071 32.0 201
Arrests in past 30 days
0 63,171 95.9 94.7 32.6 183 54,621 97.2 91.1 39.1 195
1 2,802 3.6 4.5 27.6 126 3,360 2.4 7.8 15.8 134
2 245 0.2 0.4 20.8 312 296 0.2 0.7 17.6 173
3 61 0.1 0.1 24.6 146 44 * 0.1 15.9 36
4 24 * * 41.7 40 14 * * 7.1 - -
5 22 * * 31.8 343 14 * * 42.9 363
6 to 96 106 0.1 0.2 17.0 385 128 0.1 0.3 20.3 196
Total 66,431 100.0 100.0 32.3 182 58,477 100.0 100.0 37.6 192
Detailed not in labor force1
Homemaker 924 6.4 3.7 41.0 195 966 6.4 3.5 41.1 181
Student 557 3.2 2.5 33.9 255 539 3.4 2.0 39.0 281
Retired 292 1.6 1.3 31.8 282 276 1.5 1.2 32.6 282
Disabled 7,490 35.4 36.2 28.1 202 7,823 38.1 34.0 30.1 285
Inmate of institution 337 3.7 0.8 65.3 79 1,005 3.8 4.8 23.4 79
Other 11,211 49.8 55.5 26.5 279 11,672 46.8 54.5 24.7 264
Total 20,811 100.0 100.0 28.6 204 22,281 100.0 100.0 27.7 221
Employment status1
Employed 14,825 22.9 19.9 35.2 243 14,232 26.4 21.3 42.2 266
Unemployed 27,652 38.5 39.1 31.6 160 21,906 34.3 36.4 35.6 139
Not in labor force 28,632 38.5 41.1 30.6 218 25,303 39.3 42.3 35.3 225
Total 71,109 100.0 100.0 31.9 197 61,441 100.0 100.0 37.0 201
Frequency of use
No use in the past month 12,952 24.4 15.1 43.3 176 20,748 53.1 37.6 49.9 211
Some use 11,510 16.8 15.7 33.5 169 10,950 18.8 26.3 33.5 113
Daily use 47,242 58.8 69.2 28.6 230 15,469 28.1 36.1 35.3 119
Total 71,704 100.0 100.0 32.0 201 47,167 100.0 100.0 41.3 178
Living arrangements
Homeless 4,817 6.5 6.9 30.8 116 3,692 5.6 6.7 33.2 98
Dependent living 10,278 19.0 12.2 42.1 162 8,679 18.8 12.4 47.7 142
Independent living 56,271 74.5 80.9 30.2 212 46,262 75.7 80.8 36.1 211
Total 71,366 100.0 100.0 31.9 199 58,633 100.0 100.0 37.7 193
Table 8.4. Outpatient medication-assisted opioid therapy discharges aged 12 and older, by treatment completion/transfer, median length of stay (LOS), and
selected characteristics at admission and discharge: Number, percent distribution, and rate, 2012
Selected characteristics at admission Selected characteristics at discharge
Percent distribution Rate of
treatment
completion or
transfer to
further
treatment
Median
LOS (days)
among
treatment
completers
Continued. See notes at end of table.
Selected characteristics
No. of
outpatient
med-asst.
opi. ther.
discharges
Percent distribution Rate of
treatment
completion or
transfer to
further
treatment
Median
LOS (days)
among
treatment
completers
No. of
outpatient
med-asst.
opi. ther.
discharges
119

Completed
treatment or
transferred to
further treatment
Did not complete
treatment or
transfer to
further treatment
Completed
treatment or
transferred to
further treatment
Did not complete
treatment or
transfer to
further treatment
Primary substance
Alcohol 1,176 2.6 1.2 50.6 92 1,249 2.6 1.3 47.8 91
Opiates 68,545 92.8 96.2 31.2 227 60,607 86.3 83.0 32.9 220
Marijuana/hashish 517 1.1 0.5 48.0 91 692 1.1 0.9 36.8 103
Cocaine 647 1.4 0.7 48.4 85 1,351 1.9 1.9 31.6 120
Stimulants 235 0.5 0.2 48.1 97 277 0.5 0.3 44.0 109
Other/unknown 951 1.7 1.1 41.2 80 7,895 7.6 12.5 22.2 206
Total 72,071 100.0 100.0 32.0 201 72,071 100.0 100.0 32.0 201
Self-help programs attended
in past 30 days No attendance in the past
month 29,034 74.7 80.9 30.3 137 28,755 70.7 84.7 30.0 251At least 1 time in the past
month 7,748 25.3 19.1 38.5 102 7,194 29.3 15.3 49.6 98
1-3 times in past month 2,501 7.2 6.6 34.1 119 2,552 8.4 6.4 40.3 127
4-7 times in past month 1,352 4.5 3.3 39.0 119 1,527 6.6 3.1 52.5 108
8-15 times in past month 1,267 5.0 2.7 46.2 99 1,096 5.3 1.9 59.5 87
16-30 times in past month 1,207 5.6 2.2 54.3 87 901 4.8 1.3 64.9 79Some attendance, but
frequency unknown 1,421 3.1 4.2 25.3 83 1,118 4.1 2.6 44.9 81
Total 36,782 100.0 100.0 32.0 125 35,949 100.0 100.0 33.9 176
SOURCE: Center for Behavioral Health Statistics and Quality, Substance Abuse and Mental Health Services Administration, Treatment Episode Data Set (TEDS). Data received through
01.23.15.
Percent distribution Rate of
treatment
completion or
transfer to
further
treatment
Median
LOS (days)
among
treatment
completers
- - Quantity is zero; * Less than 0.05 percent.1
Includes only discharges aged 16 and above for employment status and detailed not in labor force.
NOTES: Based on linked admission and discharge data reported by the 42 states and jurisdictions that offered outpatient medication-assisted opioid therapy and reported these data to
TEDS. Percentages may not add to 100 percent due to rounding. In LOS calculations, missing values of the associated variables were excluded. Percentages are based on all admissions
with known and valid values. Admissions for which values were not collected, unknown, or missing are excluded from the percentage base (denominator).
Selected characteristics
No. of
outpatient
med-asst.
opi. ther.
discharges
Percent distribution Rate of
treatment
completion or
transfer to
further
treatment
Median
LOS (days)
among
treatment
completers
No. of
outpatient
med-asst.
opi. ther.
discharges
Selected characteristics at admission Selected characteristics at discharge
Table 8.4. Outpatient medication-assisted opioid therapy discharges aged 12 and older, by treatment completion/transfer, median length of stay (LOS), and
selected characteristics at admission and discharge: Number, percent distribution, and rate, 2012 (continued)
120
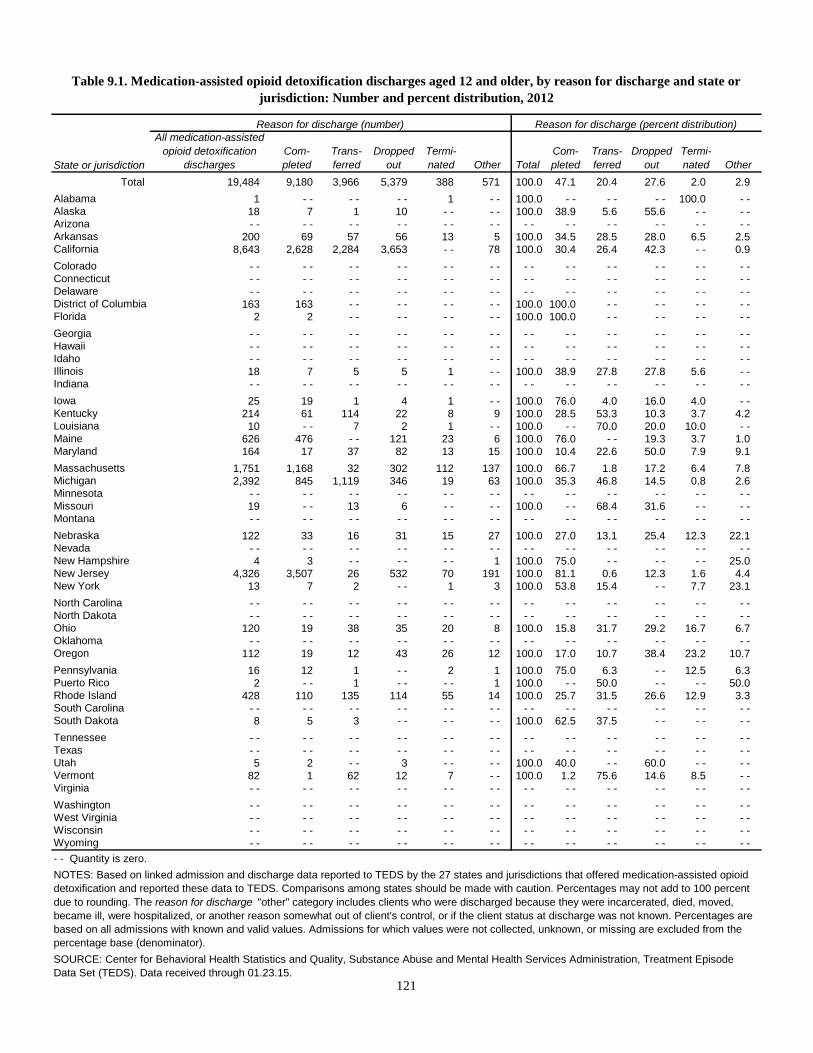
All medication-assisted
opioid detoxification
discharges
Com-
pleted
Trans-
ferred
Dropped
out
Termi-
nated Other Total
Com-
pleted
Trans-
ferred
Dropped
out
Termi-
nated Other
Total 19,484 9,180 3,966 5,379 388 571 100.0 47.1 20.4 27.6 2.0 2.9
Alabama 1 - - - - - - 1 - - 100.0 - - - - - - 100.0 - -Alaska 18 7 1 10 - - - - 100.0 38.9 5.6 55.6 - - - -Arizona - - - - - - - - - - - - - - - - - - - - - - - -Arkansas 200 69 57 56 13 5 100.0 34.5 28.5 28.0 6.5 2.5California 8,643 2,628 2,284 3,653 - - 78 100.0 30.4 26.4 42.3 - - 0.9
Colorado - - - - - - - - - - - - - - - - - - - - - - - -Connecticut - - - - - - - - - - - - - - - - - - - - - - - -Delaware - - - - - - - - - - - - - - - - - - - - - - - -District of Columbia 163 163 - - - - - - - - 100.0 100.0 - - - - - - - -Florida 2 2 - - - - - - - - 100.0 100.0 - - - - - - - -
Georgia - - - - - - - - - - - - - - - - - - - - - - - -Hawaii - - - - - - - - - - - - - - - - - - - - - - - -Idaho - - - - - - - - - - - - - - - - - - - - - - - -Illinois 18 7 5 5 1 - - 100.0 38.9 27.8 27.8 5.6 - -Indiana - - - - - - - - - - - - - - - - - - - - - - - -
Iowa 25 19 1 4 1 - - 100.0 76.0 4.0 16.0 4.0 - -Kentucky 214 61 114 22 8 9 100.0 28.5 53.3 10.3 3.7 4.2Louisiana 10 - - 7 2 1 - - 100.0 - - 70.0 20.0 10.0 - -Maine 626 476 - - 121 23 6 100.0 76.0 - - 19.3 3.7 1.0Maryland 164 17 37 82 13 15 100.0 10.4 22.6 50.0 7.9 9.1
Massachusetts 1,751 1,168 32 302 112 137 100.0 66.7 1.8 17.2 6.4 7.8Michigan 2,392 845 1,119 346 19 63 100.0 35.3 46.8 14.5 0.8 2.6Minnesota - - - - - - - - - - - - - - - - - - - - - - - -Missouri 19 - - 13 6 - - - - 100.0 - - 68.4 31.6 - - - -Montana - - - - - - - - - - - - - - - - - - - - - - - -
Nebraska 122 33 16 31 15 27 100.0 27.0 13.1 25.4 12.3 22.1Nevada - - - - - - - - - - - - - - - - - - - - - - - -New Hampshire 4 3 - - - - - - 1 100.0 75.0 - - - - - - 25.0New Jersey 4,326 3,507 26 532 70 191 100.0 81.1 0.6 12.3 1.6 4.4New York 13 7 2 - - 1 3 100.0 53.8 15.4 - - 7.7 23.1
North Carolina - - - - - - - - - - - - - - - - - - - - - - - -North Dakota - - - - - - - - - - - - - - - - - - - - - - - -Ohio 120 19 38 35 20 8 100.0 15.8 31.7 29.2 16.7 6.7Oklahoma - - - - - - - - - - - - - - - - - - - - - - - -Oregon 112 19 12 43 26 12 100.0 17.0 10.7 38.4 23.2 10.7
Pennsylvania 16 12 1 - - 2 1 100.0 75.0 6.3 - - 12.5 6.3Puerto Rico 2 - - 1 - - - - 1 100.0 - - 50.0 - - - - 50.0Rhode Island 428 110 135 114 55 14 100.0 25.7 31.5 26.6 12.9 3.3South Carolina - - - - - - - - - - - - - - - - - - - - - - - -South Dakota 8 5 3 - - - - - - 100.0 62.5 37.5 - - - - - -
Tennessee - - - - - - - - - - - - - - - - - - - - - - - -Texas - - - - - - - - - - - - - - - - - - - - - - - -Utah 5 2 - - 3 - - - - 100.0 40.0 - - 60.0 - - - -Vermont 82 1 62 12 7 - - 100.0 1.2 75.6 14.6 8.5 - -Virginia - - - - - - - - - - - - - - - - - - - - - - - -
Washington - - - - - - - - - - - - - - - - - - - - - - - -West Virginia - - - - - - - - - - - - - - - - - - - - - - - -Wisconsin - - - - - - - - - - - - - - - - - - - - - - - -Wyoming - - - - - - - - - - - - - - - - - - - - - - - -
SOURCE: Center for Behavioral Health Statistics and Quality, Substance Abuse and Mental Health Services Administration, Treatment Episode
Data Set (TEDS). Data received through 01.23.15.
Table 9.1. Medication-assisted opioid detoxification discharges aged 12 and older, by reason for discharge and state or
jurisdiction: Number and percent distribution, 2012
State or jurisdiction
Reason for discharge (number) Reason for discharge (percent distribution)
- - Quantity is zero.
NOTES: Based on linked admission and discharge data reported to TEDS by the 27 states and jurisdictions that offered medication-assisted opioid
detoxification and reported these data to TEDS. Comparisons among states should be made with caution. Percentages may not add to 100 percent
due to rounding. The reason for discharge "other" category includes clients who were discharged because they were incarcerated, died, moved,
became ill, were hospitalized, or another reason somewhat out of client's control, or if the client status at discharge was not known. Percentages are
based on all admissions with known and valid values. Admissions for which values were not collected, unknown, or missing are excluded from the
percentage base (denominator).
121
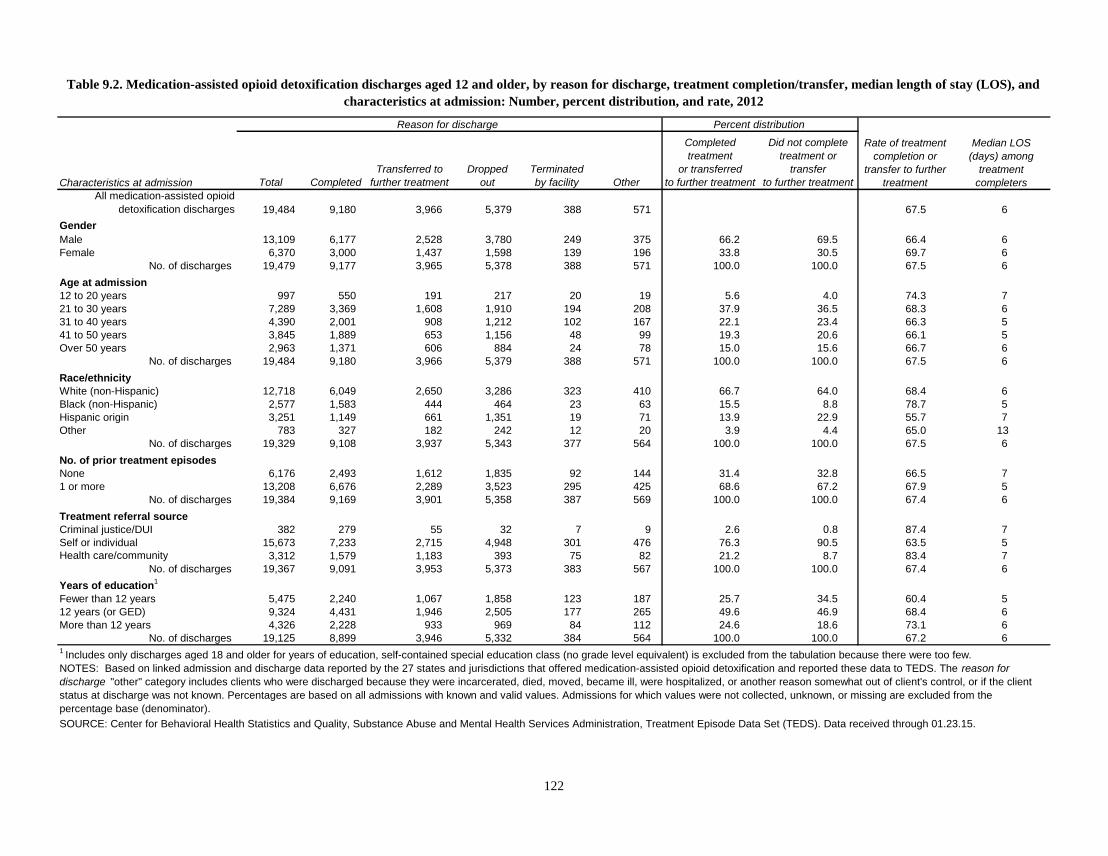
Total Completed
Transferred to
further treatment
Dropped
out
Terminated
by facility Other
Completed
treatment
or transferred
to further treatment
Did not complete
treatment or
transfer
to further treatment
All medication-assisted opioid
detoxification discharges 19,484 9,180 3,966 5,379 388 571 67.5 6
Gender
Male 13,109 6,177 2,528 3,780 249 375 66.2 69.5 66.4 6
Female 6,370 3,000 1,437 1,598 139 196 33.8 30.5 69.7 6
No. of discharges 19,479 9,177 3,965 5,378 388 571 100.0 100.0 67.5 6
Age at admission
12 to 20 years 997 550 191 217 20 19 5.6 4.0 74.3 7
21 to 30 years 7,289 3,369 1,608 1,910 194 208 37.9 36.5 68.3 6
31 to 40 years 4,390 2,001 908 1,212 102 167 22.1 23.4 66.3 5
41 to 50 years 3,845 1,889 653 1,156 48 99 19.3 20.6 66.1 5
Over 50 years 2,963 1,371 606 884 24 78 15.0 15.6 66.7 6
No. of discharges 19,484 9,180 3,966 5,379 388 571 100.0 100.0 67.5 6
Race/ethnicity
White (non-Hispanic) 12,718 6,049 2,650 3,286 323 410 66.7 64.0 68.4 6
Black (non-Hispanic) 2,577 1,583 444 464 23 63 15.5 8.8 78.7 5
Hispanic origin 3,251 1,149 661 1,351 19 71 13.9 22.9 55.7 7
Other 783 327 182 242 12 20 3.9 4.4 65.0 13
No. of discharges 19,329 9,108 3,937 5,343 377 564 100.0 100.0 67.5 6
No. of prior treatment episodes
None 6,176 2,493 1,612 1,835 92 144 31.4 32.8 66.5 7
1 or more 13,208 6,676 2,289 3,523 295 425 68.6 67.2 67.9 5
No. of discharges 19,384 9,169 3,901 5,358 387 569 100.0 100.0 67.4 6
Treatment referral source
Criminal justice/DUI 382 279 55 32 7 9 2.6 0.8 87.4 7
Self or individual 15,673 7,233 2,715 4,948 301 476 76.3 90.5 63.5 5
Health care/community 3,312 1,579 1,183 393 75 82 21.2 8.7 83.4 7
No. of discharges 19,367 9,091 3,953 5,373 383 567 100.0 100.0 67.4 6
Years of education1
Fewer than 12 years 5,475 2,240 1,067 1,858 123 187 25.7 34.5 60.4 5
12 years (or GED) 9,324 4,431 1,946 2,505 177 265 49.6 46.9 68.4 6
More than 12 years 4,326 2,228 933 969 84 112 24.6 18.6 73.1 6
No. of discharges 19,125 8,899 3,946 5,332 384 564 100.0 100.0 67.2 61 Includes only discharges aged 18 and older for years of education, self-contained special education class (no grade level equivalent) is excluded from the tabulation because there were too few.
NOTES: Based on linked admission and discharge data reported by the 27 states and jurisdictions that offered medication-assisted opioid detoxification and reported these data to TEDS. The reason for
discharge "other" category includes clients who were discharged because they were incarcerated, died, moved, became ill, were hospitalized, or another reason somewhat out of client's control, or if the client
status at discharge was not known. Percentages are based on all admissions with known and valid values. Admissions for which values were not collected, unknown, or missing are excluded from the
percentage base (denominator).
SOURCE: Center for Behavioral Health Statistics and Quality, Substance Abuse and Mental Health Services Administration, Treatment Episode Data Set (TEDS). Data received through 01.23.15.
Table 9.2. Medication-assisted opioid detoxification discharges aged 12 and older, by reason for discharge, treatment completion/transfer, median length of stay (LOS), and
characteristics at admission: Number, percent distribution, and rate, 2012
Characteristics at admission
Reason for discharge Percent distribution
Rate of treatment
completion or
transfer to further
treatment
Median LOS
(days) among
treatment
completers
122
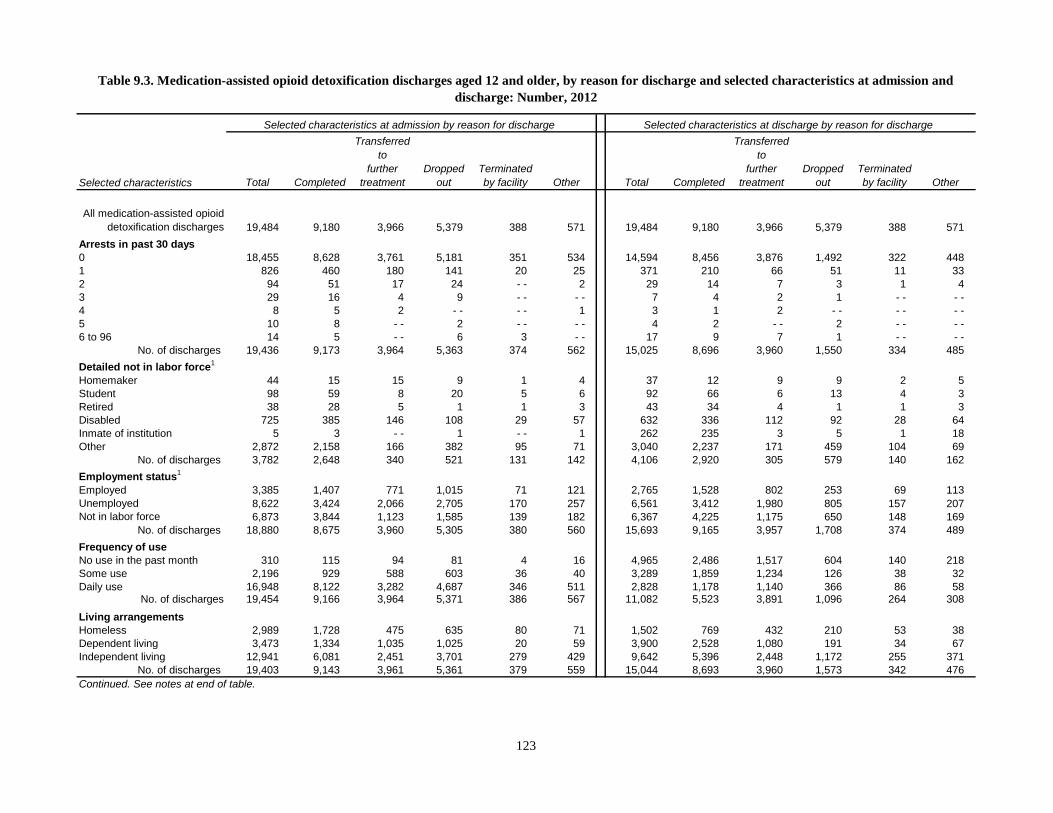
Total Completed
Transferred
to
further
treatment
Dropped
out
Terminated
by facility Other Total Completed
Transferred
to
further
treatment
Dropped
out
Terminated
by facility Other
All medication-assisted opioid
detoxification discharges 19,484 9,180 3,966 5,379 388 571 19,484 9,180 3,966 5,379 388 571
Arrests in past 30 days
0 18,455 8,628 3,761 5,181 351 534 14,594 8,456 3,876 1,492 322 448
1 826 460 180 141 20 25 371 210 66 51 11 33
2 94 51 17 24 - - 2 29 14 7 3 1 4
3 29 16 4 9 - - - - 7 4 2 1 - - - -
4 8 5 2 - - - - 1 3 1 2 - - - - - -
5 10 8 - - 2 - - - - 4 2 - - 2 - - - -
6 to 96 14 5 - - 6 3 - - 17 9 7 1 - - - -
No. of discharges 19,436 9,173 3,964 5,363 374 562 15,025 8,696 3,960 1,550 334 485
Detailed not in labor force1
Homemaker 44 15 15 9 1 4 37 12 9 9 2 5
Student 98 59 8 20 5 6 92 66 6 13 4 3
Retired 38 28 5 1 1 3 43 34 4 1 1 3
Disabled 725 385 146 108 29 57 632 336 112 92 28 64
Inmate of institution 5 3 - - 1 - - 1 262 235 3 5 1 18
Other 2,872 2,158 166 382 95 71 3,040 2,237 171 459 104 69
No. of discharges 3,782 2,648 340 521 131 142 4,106 2,920 305 579 140 162
Employment status1
Employed 3,385 1,407 771 1,015 71 121 2,765 1,528 802 253 69 113
Unemployed 8,622 3,424 2,066 2,705 170 257 6,561 3,412 1,980 805 157 207
Not in labor force 6,873 3,844 1,123 1,585 139 182 6,367 4,225 1,175 650 148 169
No. of discharges 18,880 8,675 3,960 5,305 380 560 15,693 9,165 3,957 1,708 374 489
Frequency of use
No use in the past month 310 115 94 81 4 16 4,965 2,486 1,517 604 140 218
Some use 2,196 929 588 603 36 40 3,289 1,859 1,234 126 38 32
Daily use 16,948 8,122 3,282 4,687 346 511 2,828 1,178 1,140 366 86 58No. of discharges 19,454 9,166 3,964 5,371 386 567 11,082 5,523 3,891 1,096 264 308
Living arrangements
Homeless 2,989 1,728 475 635 80 71 1,502 769 432 210 53 38
Dependent living 3,473 1,334 1,035 1,025 20 59 3,900 2,528 1,080 191 34 67
Independent living 12,941 6,081 2,451 3,701 279 429 9,642 5,396 2,448 1,172 255 371
No. of discharges 19,403 9,143 3,961 5,361 379 559 15,044 8,693 3,960 1,573 342 476
Continued. See notes at end of table.
Table 9.3. Medication-assisted opioid detoxification discharges aged 12 and older, by reason for discharge and selected characteristics at admission and
discharge: Number, 2012
Selected characteristics
Selected characteristics at admission by reason for discharge Selected characteristics at discharge by reason for discharge
123
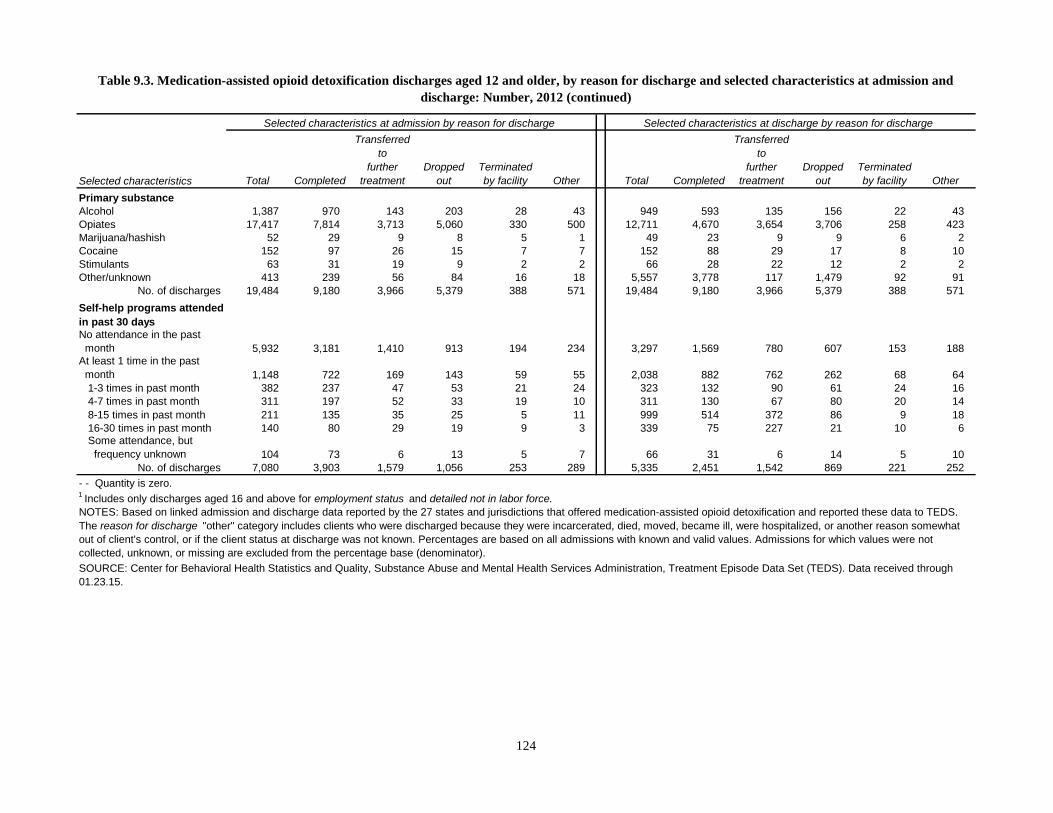
Total Completed
Transferred
to
further
treatment
Dropped
out
Terminated
by facility Other Total Completed
Transferred
to
further
treatment
Dropped
out
Terminated
by facility Other
Primary substance
Alcohol 1,387 970 143 203 28 43 949 593 135 156 22 43
Opiates 17,417 7,814 3,713 5,060 330 500 12,711 4,670 3,654 3,706 258 423
Marijuana/hashish 52 29 9 8 5 1 49 23 9 9 6 2
Cocaine 152 97 26 15 7 7 152 88 29 17 8 10
Stimulants 63 31 19 9 2 2 66 28 22 12 2 2
Other/unknown 413 239 56 84 16 18 5,557 3,778 117 1,479 92 91
No. of discharges 19,484 9,180 3,966 5,379 388 571 19,484 9,180 3,966 5,379 388 571
Self-help programs attended
in past 30 days
No attendance in the past
month 5,932 3,181 1,410 913 194 234 3,297 1,569 780 607 153 188At least 1 time in the past
month 1,148 722 169 143 59 55 2,038 882 762 262 68 64
1-3 times in past month 382 237 47 53 21 24 323 132 90 61 24 16
4-7 times in past month 311 197 52 33 19 10 311 130 67 80 20 14
8-15 times in past month 211 135 35 25 5 11 999 514 372 86 9 18
16-30 times in past month 140 80 29 19 9 3 339 75 227 21 10 6Some attendance, but
frequency unknown 104 73 6 13 5 7 66 31 6 14 5 10
No. of discharges 7,080 3,903 1,579 1,056 253 289 5,335 2,451 1,542 869 221 252
- - Quantity is zero.
NOTES: Based on linked admission and discharge data reported by the 27 states and jurisdictions that offered medication-assisted opioid detoxification and reported these data to TEDS.
The reason for discharge "other" category includes clients who were discharged because they were incarcerated, died, moved, became ill, were hospitalized, or another reason somewhat
out of client's control, or if the client status at discharge was not known. Percentages are based on all admissions with known and valid values. Admissions for which values were not
collected, unknown, or missing are excluded from the percentage base (denominator).
SOURCE: Center for Behavioral Health Statistics and Quality, Substance Abuse and Mental Health Services Administration, Treatment Episode Data Set (TEDS). Data received through
01.23.15.
Table 9.3. Medication-assisted opioid detoxification discharges aged 12 and older, by reason for discharge and selected characteristics at admission and
discharge: Number, 2012 (continued)
Selected characteristics
Selected characteristics at admission by reason for discharge Selected characteristics at discharge by reason for discharge
1 Includes only discharges aged 16 and above for employment status and detailed not in labor force.
124
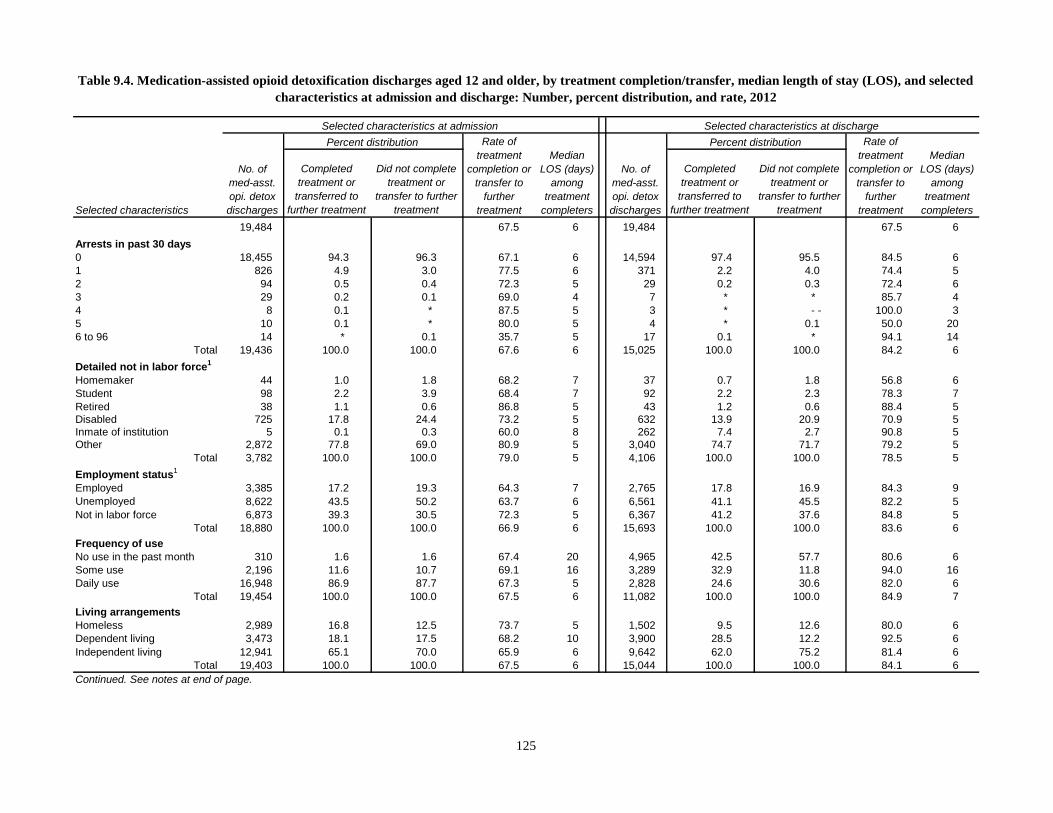
Completed
treatment or
transferred to
further treatment
Did not complete
treatment or
transfer to further
treatment
Completed
treatment or
transferred to
further treatment
Did not complete
treatment or
transfer to further
treatment
19,484 67.5 6 19,484 67.5 6
Arrests in past 30 days
0 18,455 94.3 96.3 67.1 6 14,594 97.4 95.5 84.5 6
1 826 4.9 3.0 77.5 6 371 2.2 4.0 74.4 5
2 94 0.5 0.4 72.3 5 29 0.2 0.3 72.4 6
3 29 0.2 0.1 69.0 4 7 * * 85.7 4
4 8 0.1 * 87.5 5 3 * - - 100.0 3
5 10 0.1 * 80.0 5 4 * 0.1 50.0 20
6 to 96 14 * 0.1 35.7 5 17 0.1 * 94.1 14
Total 19,436 100.0 100.0 67.6 6 15,025 100.0 100.0 84.2 6
Detailed not in labor force1
Homemaker 44 1.0 1.8 68.2 7 37 0.7 1.8 56.8 6
Student 98 2.2 3.9 68.4 7 92 2.2 2.3 78.3 7
Retired 38 1.1 0.6 86.8 5 43 1.2 0.6 88.4 5
Disabled 725 17.8 24.4 73.2 5 632 13.9 20.9 70.9 5
Inmate of institution 5 0.1 0.3 60.0 8 262 7.4 2.7 90.8 5
Other 2,872 77.8 69.0 80.9 5 3,040 74.7 71.7 79.2 5
Total 3,782 100.0 100.0 79.0 5 4,106 100.0 100.0 78.5 5
Employment status1
Employed 3,385 17.2 19.3 64.3 7 2,765 17.8 16.9 84.3 9
Unemployed 8,622 43.5 50.2 63.7 6 6,561 41.1 45.5 82.2 5
Not in labor force 6,873 39.3 30.5 72.3 5 6,367 41.2 37.6 84.8 5
Total 18,880 100.0 100.0 66.9 6 15,693 100.0 100.0 83.6 6
Frequency of use
No use in the past month 310 1.6 1.6 67.4 20 4,965 42.5 57.7 80.6 6
Some use 2,196 11.6 10.7 69.1 16 3,289 32.9 11.8 94.0 16
Daily use 16,948 86.9 87.7 67.3 5 2,828 24.6 30.6 82.0 6
Total 19,454 100.0 100.0 67.5 6 11,082 100.0 100.0 84.9 7
Living arrangements
Homeless 2,989 16.8 12.5 73.7 5 1,502 9.5 12.6 80.0 6
Dependent living 3,473 18.1 17.5 68.2 10 3,900 28.5 12.2 92.5 6
Independent living 12,941 65.1 70.0 65.9 6 9,642 62.0 75.2 81.4 6
Total 19,403 100.0 100.0 67.5 6 15,044 100.0 100.0 84.1 6
Table 9.4. Medication-assisted opioid detoxification discharges aged 12 and older, by treatment completion/transfer, median length of stay (LOS), and selected
characteristics at admission and discharge: Number, percent distribution, and rate, 2012
Selected characteristics at admission Selected characteristics at discharge
Percent distribution Rate of
treatment
completion or
transfer to
further
treatment
Median
LOS (days)
among
treatment
completers
Continued. See notes at end of page.
Selected characteristics
No. of
med-asst.
opi. detox
discharges
Percent distribution Rate of
treatment
completion or
transfer to
further
treatment
Median
LOS (days)
among
treatment
completers
No. of
med-asst.
opi. detox
discharges
125

Completed
treatment or
transferred to
further treatment
Did not complete
treatment or
transfer to further
treatment
Completed
treatment or
transferred to
further treatment
Did not complete
treatment or
transfer to further
treatment
Primary substance
Alcohol 1,387 8.5 4.3 80.2 5 949 5.5 3.5 76.7 5
Opiates 17,417 87.7 92.9 66.2 6 12,711 63.3 69.2 65.5 8
Marijuana/hashish 52 0.3 0.2 73.1 6 49 0.2 0.3 65.3 9
Cocaine 152 0.9 0.5 80.9 13 152 0.9 0.6 77.0 19
Stimulants 63 0.4 0.2 79.4 6 66 0.4 0.3 75.8 7
Other/unknown 413 2.2 1.9 71.4 6 5,557 29.6 26.2 70.1 5
Total 19,484 100.0 100.0 67.5 6 19,484 100.0 100.0 67.5 6
Self-help programs attended
in past 30 days No attendance in the past
month 5,932 83.7 83.9 77.4 5 3,297 58.8 70.6 71.2 5At least 1 time in the past
month 382 16.3 16.1 74.3 5 323 41.2 29.4 509.0 5
1-3 times in past month 382 5.2 6.1 74.3 5 323 5.6 7.5 68.7 6
4-7 times in past month 311 4.5 3.9 80.1 5 311 4.9 8.5 63.3 6
8-15 times in past month 211 3.1 2.6 80.6 5 999 22.2 8.4 88.7 5
16-30 times in past month 140 2.0 1.9 77.9 6 339 7.6 2.8 89.1 7Some attendance, but
frequency unknown 104 1.4 1.6 76.0 5 66 0.9 2.2 56.1 5
Total 7,080 100.0 100.0 77.4 5 5,335 100.0 100.0 74.8 5
SOURCE: Center for Behavioral Health Statistics and Quality, Substance Abuse and Mental Health Services Administration, Treatment Episode Data Set (TEDS). Data received through
01.23.15.
Percent distribution Rate of
treatment
completion or
transfer to
further
treatment
Median
LOS (days)
among
treatment
completers
- - Quantity is zero; * Less than 0.05 percent.1
Includes only discharges aged 16 and above for employment status and detailed not in labor force.
NOTES: Based on linked admission and discharge data reported by the 27 states and jurisdictions that offered medication-assisted opioid detoxification and reported these data to TEDS.
Percentages may not add to 100 percent due to rounding. In LOS calculations, missing values of the associated variables were excluded. Percentages are based on all admissions with
known and valid values. Admissions for which values were not collected, unknown, or missing are excluded from the percentage base (denominator).
Selected characteristics
No. of
med-asst.
opi. detox
discharges
Percent distribution Rate of
treatment
completion or
transfer to
further
treatment
Median
LOS (days)
among
treatment
completers
No. of
med-asst.
opi. detox
discharges
Selected characteristics at admission Selected characteristics at discharge
Table 9.4. Medication-assisted opioid detoxification discharges aged 12 and older, by treatment completion/transfer, median length of stay (LOS), and selected
characteristics at admission and discharge: Number, percent distribution, and rate, 2012 (continued)
126

127
Appendix A
About the treAtment episode dAtA set (teds)
IntroductionThis report presents results from the Treatment Episode Data Set (TEDS) for discharges from substance abuse treatment. The Center for Behavioral Health Statistics and Quality (CBHSQ), Substance Abuse and Mental Health Services Administration (SAMHSA), coordinates and manages collection of TEDS data from the states.
TEDS is a compilation of client-level data routinely collected by the individual state administra-tive data systems to monitor their substance abuse treatment systems. Generally, facilities that are required to report to the state substance abuse agency (SSA) are those that receive public funds and/or are licensed or certified by the SSA to provide substance abuse treatment (or are administratively tracked for other reasons).
TEDS is one of the four components of SAMHSA’s Behavioral Health Services Infor mation System (BHSIS) (formerly known as the Drug and Alcohol Services Information System [DASIS]), the primary source of national data on substance and mental health abuse treatment. The other three components are:
○ The Inventory of Behavioral Health Services (I-BHS), a continuously-updated comprehen sive listing of all known public and private substance abuse treatment facilities
○ The National Survey of Substance Abuse Treatment Services (N-SSATS), an annual survey of the location, characteristics, services offered, and utilization of alcohol and drug abuse treat-ment facilities in I-BHS
○ The National Mental Health Services Survey (N-MHSS), an annual survey of the location, characteristics, services offered, and utilization of mental health treatment facilities in I-BHS
The TEDS system comprises two major components, the Admissions Data Set and the Linked Data Set. The TEDS Admission Data Set includes client-level data on substance abuse treatment admis-sions from 1992 through the present. The TEDS Linked Data Set includes discharges that can be linked at record level to admissions; it includes information from clients discharged in 2000 and later. For both data sets, selected data items from the individual state data files are converted to a standardized format consistent across states. These standardized data constitute TEDS.
The TEDS Admission Data Set consists of a Minimum Data Set of items collected by all states, and a Supplemental Data Set where individual data items are reported at the state’s option. The Minimum Data Set consists of 19 items that include:
○ Demographic information○ Primary, secondary, and tertiary substances and their route of administration, frequency of use,
and age at first use○ Source of referral to treatment

128
○ Number of prior treatment episodes ○ Service type, including planned use of medication-assisted opioid therapy
The Supplemental Data Set (not presented in this report) items include psychiatric, social, and economic measures.
The TEDS Linked Data Set was designed to enable TEDS to collect information on entire treatment episodes. Discharge data, when linked to admission data, represent treatment episodes that enable analyses of questions that cannot be answered with admission data alone. Examples are the propor-tion of discharges that completed treatment and the average length of stay of treatment completers.
HistoryNational-level data collection on admissions to substance abuse treatment was first mandated in 1972 under the Drug Abuse Office and Treatment Act, P.L. 92-255. This act initiated federal funding for drug treatment and rehabilitation, and required reporting on clients entering drug (but not alcohol) abuse treatment. The Client-Oriented Data Acquisition Process (CODAP) was developed to collect admission and discharge data directly from federally-funded drug treatment programs. (Programs for treatment of alcohol abuse were not included.) Reporting was manda-tory for all such programs, and data were collected using a standard form. CODAP included all clients in federally-funded programs regardless of individual funding source. Reports were issued from 1973 to 1981 based on data from 1,800 to 2,000 programs, including some 200,000 annual admissions.
In 1981, collection of national-level data on admissions to substance abuse treatment was discontin-ued because of the introduction of the Alcohol, Drug Abuse, and Mental Health Services (ADMS) Block Grant. The block grant trans ferred federal funding from individual programs to the states for distribution, and it included no data reporting requirement. Participation in CODAP became voluntary; although several states submitted data through 1984, the data were in no way nationally representative.
In 1988, the Comprehensive Alcohol Abuse, Drug Abuse, and Mental Health Amendments (P.L. 100-690) established a revised Substance Abuse Prevention and Treatment (SAPT) Block Grant and mandated federal data collection on clients receiving treatment for either alcohol or drug abuse. The Treatment Episode Data Set (TEDS) data collection effort represents the federal response to this mandate. TEDS began in 1989 with the issue of 3-year development grants to states.
State Data Collection SystemsTEDS is an exceptionally large and powerful data set that covers a significant proportion of all admissions to substance abuse treatment. TEDS is a compilation of data collected through the individual data collection systems of the state substance abuse agencies (SSAs) for substance abuse treatment. States have cooperated with the federal government in the data collection process, and substantial progress has been made toward developing a standardized data set. However, because each state system is unique and each state has u nique powers and mandates, significant differences exist among state data collection systems. These differences are compounded by evolving health care payment systems, and state-to-state comparisons must be made with extreme caution.

129
The number and client mix of TEDS admissions do not represent the total national demand for substance abuse treatment or the prevalence of substance abuse in the general population.
States differ wide ly in the amount of public funding available for substance abuse treatment and in the constraints placed on the use of funds. States may be directed to target special populations such as pregnant women or adolescents. Where funds are limited, states may be compelled to exercise triage in admitting persons to treatment, admitting only those with the most “severe” problems. In states with high er funding levels, a larger proportion of the population in need of treatment may be admitted, including the less severely impaired.
States may include or exclude reporting by certain sectors of the treatment population, and these sectors may change over time. For example, treat ment programs based in the criminal justice system may or may not be administered through the SSA. Detoxification facilities, which can gen-erate large num bers of admissions, are not uniformly considered treatment facilities and are not uniformly reported by all states.
Appendix Table 1 presents key characteristics of state data collection systems for 2012. However, these characteristics can change as state substance abuse treatment systems change, and thus may be responsible for some year-to-year variation within states.
○ Facilities included. The scope of facilities included in TEDS is affected by differences in state licensure, certification, and accreditation practices, and disbursement of public funds. Most SSAs require facilities that receive state/public funding (including federal block grant funds) for the provision of alcohol and/or drug treatment services to report data to the SSA. Generally this funding is distributed by the SSA but may be distributed by another public agency. Some SSAs regulate private facilities, methadone clinics, and/or individual practitioners and require them to report TEDS data. Others do not because of the difficulty in obtaining data from these facilities, although these facilities may report voluntarily. Facilities operated by federal agencies (e.g., the Bureau of Prisons, the Department of Defense, and the Department of Veterans Affairs) generally do not report TEDS data to the SSA, although some facilities operated by the Indian Health Service are included. Hospital-based substance abuse treatment facilities are frequently not licensed through the SSA and do not report TEDS data. Correctional facilities (state prisons and local jails) are monitored by the SSA and report TEDS data in some states but not in others.
The primary goal of TEDS is to monitor the characteristics of clients admitted to planned, continuing treatment regimens. Thus early intervention and crisis intervention programs that do not lead to enrollment in continued treatment are excluded from TEDS.
○ Clients included. About 60 percent of states reported data on all admissions to all eligible facilities, although some reported only, or largely, admissions financed by public funds. TEDS is an admission-based system; therefore, TEDS admissions do not represent individuals. For example, an individual admitted to treatment twice within a calendar year is counted as two admissions.
○ Ability to track multi-service episodes. The goal for the TEDS system is to enumerate treatment episodes by distinguishing the initial admission of a client from his/her subsequent transfer to a different service type (e.g., from residential treatment to outpatient) within a single continu-

130
ous treatment episode. Thus TEDS records are ideally coded as admissions if they represent the initial treatment service in a treatment episode and as transfers if they represent a change in service type or a change in provider without an interruption in treatment. This requires, however, that clients be assigned unique IDs that can be linked across provid-ers; not all states are legally and/or technologically able to do this. Most states can identify as transfers a change in service type within the structure of a given provider, however, fewer can also identify a transfer involving a change of provider. Several states do not track transfers, but instead report as transfers those clients who are discharged and readmitted with in a specified (state-specific) time period.
Because some admission records in fact may represent transfers, the number of admissions reported probably overestimates the number of treatment episodes. Some states reported a lim-ited data set on codependents of substance abusers entering treatment. On average, from 2000 through 2012, 91 percent of all records submitted were client admissions, 9 percent were client transfers, and 1 percent were codependents of substance abusers.
○ Services offered. A state’s mix of service types (e.g., outpatient, detoxification, residential, opioid therapy) can have a significant effect on its admission rate. There is higher client turnover and therefore more admissions in short-stay services such as detoxification than in long-stay services such as outpatient or long-term residential treatment. Admission rates for individual substances of abuse may be affected as well (e.g., detoxification is more closely associated with alcohol or heroin use than with use of other substances).1
○ Completeness and timeliness of reporting. SAMHSA, in reporting national-level TEDS data, must balance timeliness of reporting and completeness of the data set. There may be a time lag in the publication of SAMHSA’s annual report because preparation cannot begin until states have completed their data submission for that year. States in turn rely on individual facilities to report in a timely manner so they can submit TEDS data to SAMHSA at regular intervals.
Appendix Table 2 indicates the proportions of records for which valid discharge data were received for 2012. States are expected to report all variables in the Minimum Data Set.
Report-Specific Considerations ○ The report focuses on treatment for substance abusers according to service type. Thus, admis-
sions for treatment as a codependent of a substance abuser are excluded. Records for identifiable transfers within a single treatment episode are included.
○ Records with partially complete data have been retained. Where records include missing or invalid data for a specific variable other than primary, secondary, or tertiary substance, those records are excluded from tabulations of that variable. For substance variables, missing or unknown responses were included in the category “Other.” The total number of discharges on which a percentage distribution is based is reported in each table.
○ States that did not collect a specific variable are excluded from tabulations of that variable. The total number of records on which a percentage distribution is based is reported in each table.
1 See: Substance Abuse and Mental Health Services Administration, Center for Behavioral Health Statistics and Quality. Treatment Episode Data Set (TEDS). 2000 - 2012. National Admissions to Substance Abuse Treatment Services, BHSIS Series: S-71, HHS Publication No. (SMA) 14-4850, Rockville, MD, 2014.

131
○ The primary, secondary, and tertiary substances of abuse reported to TEDS are those substances that led to the treatment episode and not necessarily a complete enumeration of all drugs used at the time of admission.
○ Stimulant admissions include methamphetamine, amphetamines, and other stimulants. How-ever, 98 to 99 percent of these admissions were for methamphetamine or amphetamine abuse.
○ The data presented in this report focus on treatment for substance abusers within service type. They do not represent complete treatment episodes, as a single episode may involve stays in more than one service type. States are asked to submit a record for each initial admission to a treatment service, for each transfer from one service to another, and for a discharge correspond-ing to each admission or transfer.
○ The number of states included in each of the service type chapters varies because not all states reported discharges for every service type. The first table for each chapter details the states reporting discharges of that service type.
○ Linkage of discharge records from 2012 to admission records from 2000 to 2012 means that the maximum length of stay (LOS) in treatment included in this report is 13 years. However, outpatient medication-assisted opioid therapy can have a much longer duration. Indeed, some admissions may receive this form of treatment indefinitely. Because this report includes data only on discharges, it will underestimate LOS in treatment for those receiving outpatient medication-assisted opioid therapy. Similarly, the number and proportion of treatment com-pleters will reflect only those who have been discharged because treatment is complete and not those who successfully remain in long-term outpatient medication-assisted opioid therapy. In addition, the characteristics at admission of those admitted to and discharged from outpatient medication-assisted opioid therapy within 13 years may differ from those of admissions who remain in outpatient medication-assisted opioid therapy for longer than 13 years.
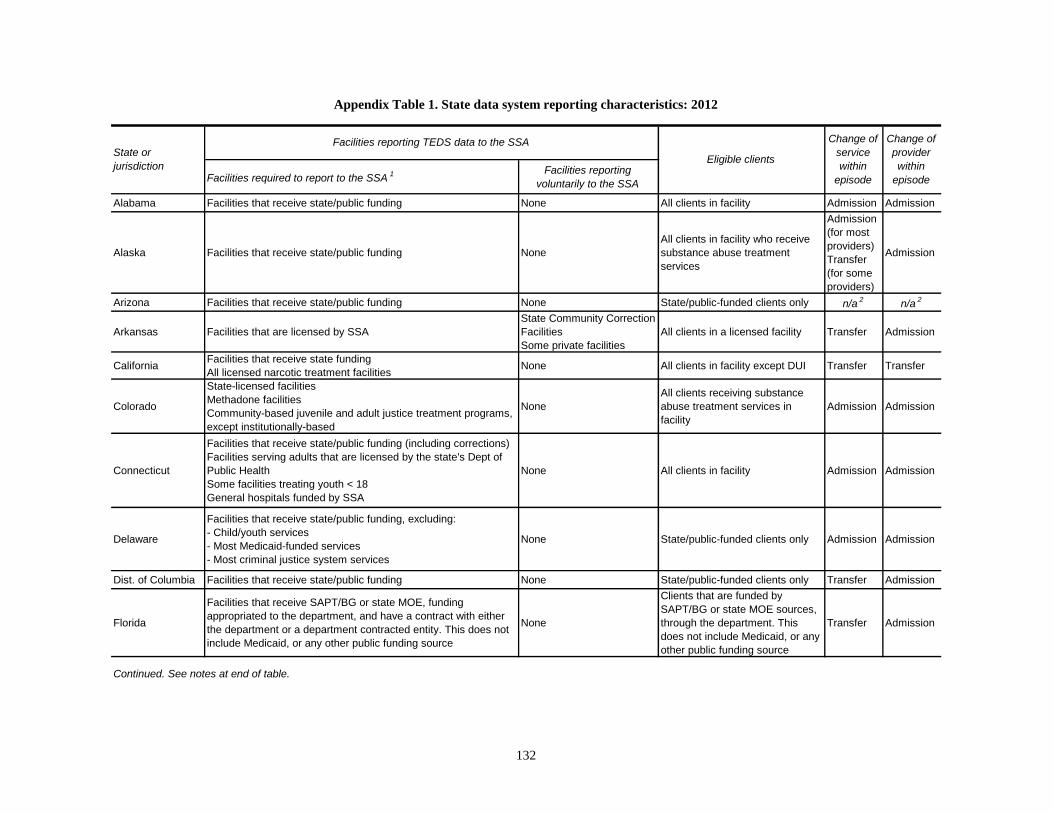
Facilities required to report to the SSA1 Facilities reporting
voluntarily to the SSA
Alabama Facilities that receive state/public funding None All clients in facility Admission Admission
Alaska Facilities that receive state/public funding None
All clients in facility who receive
substance abuse treatment
services
Admission
(for most
providers)
Transfer
(for some
providers)
Admission
Arizona Facilities that receive state/public funding None State/public-funded clients only n/a2
n/a2
Arkansas Facilities that are licensed by SSA
State Community Correction
Facilities
Some private facilities
All clients in a licensed facility Transfer Admission
CaliforniaFacilities that receive state funding
All licensed narcotic treatment facilitiesNone All clients in facility except DUI Transfer Transfer
Colorado
State-licensed facilities
Methadone facilities
Community-based juvenile and adult justice treatment programs,
except institutionally-based
None
All clients receiving substance
abuse treatment services in
facility
Admission Admission
Connecticut
Facilities that receive state/public funding (including corrections)
Facilities serving adults that are licensed by the state's Dept of
Public Health
Some facilities treating youth < 18
General hospitals funded by SSA
None All clients in facility Admission Admission
Delaware
Facilities that receive state/public funding, excluding:
- Child/youth services
- Most Medicaid-funded services
- Most criminal justice system services
None State/public-funded clients only Admission Admission
Dist. of Columbia Facilities that receive state/public funding None State/public-funded clients only Transfer Admission
Florida
Facilities that receive SAPT/BG or state MOE, funding
appropriated to the department, and have a contract with either
the department or a department contracted entity. This does not
include Medicaid, or any other public funding source
None
Clients that are funded by
SAPT/BG or state MOE sources,
through the department. This
does not include Medicaid, or any
other public funding source
Transfer Admission
Continued. See notes at end of table.
Appendix Table 1. State data system reporting characteristics: 2012
State or
jurisdiction
Facilities reporting TEDS data to the SSA
Eligible clients
Change of
service
within
episode
Change of
provider
within
episode
132
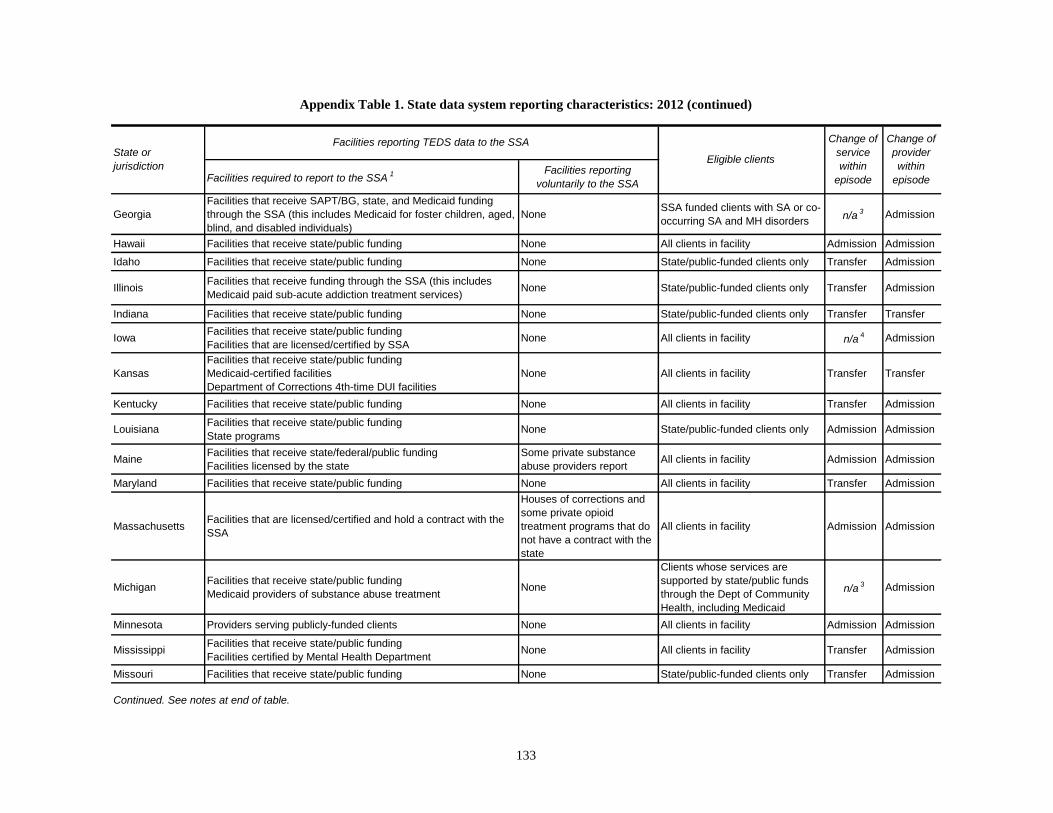
Facilities required to report to the SSA1 Facilities reporting
voluntarily to the SSA
Georgia
Facilities that receive SAPT/BG, state, and Medicaid funding
through the SSA (this includes Medicaid for foster children, aged,
blind, and disabled individuals)
NoneSSA funded clients with SA or co-
occurring SA and MH disordersn/a
3 Admission
Hawaii Facilities that receive state/public funding None All clients in facility Admission Admission
Idaho Facilities that receive state/public funding None State/public-funded clients only Transfer Admission
IllinoisFacilities that receive funding through the SSA (this includes
Medicaid paid sub-acute addiction treatment services)None State/public-funded clients only Transfer Admission
Indiana Facilities that receive state/public funding None State/public-funded clients only Transfer Transfer
IowaFacilities that receive state/public funding
Facilities that are licensed/certified by SSANone All clients in facility n/a
4 Admission
Kansas
Facilities that receive state/public funding
Medicaid-certified facilities
Department of Corrections 4th-time DUI facilities
None All clients in facility Transfer Transfer
Kentucky Facilities that receive state/public funding None All clients in facility Transfer Admission
LouisianaFacilities that receive state/public funding
State programsNone State/public-funded clients only Admission Admission
MaineFacilities that receive state/federal/public funding
Facilities licensed by the state
Some private substance
abuse providers reportAll clients in facility Admission Admission
Maryland Facilities that receive state/public funding None All clients in facility Transfer Admission
MassachusettsFacilities that are licensed/certified and hold a contract with the
SSA
Houses of corrections and
some private opioid
treatment programs that do
not have a contract with the
state
All clients in facility Admission Admission
MichiganFacilities that receive state/public funding
Medicaid providers of substance abuse treatmentNone
Clients whose services are
supported by state/public funds
through the Dept of Community
Health, including Medicaid
n/a3 Admission
Minnesota Providers serving publicly-funded clients None All clients in facility Admission Admission
MississippiFacilities that receive state/public funding
Facilities certified by Mental Health DepartmentNone All clients in facility Transfer Admission
Missouri Facilities that receive state/public funding None State/public-funded clients only Transfer Admission
Continued. See notes at end of table.
Appendix Table 1. State data system reporting characteristics: 2012 (continued)
State or
jurisdiction
Facilities reporting TEDS data to the SSA
Eligible clients
Change of
service
within
episode
Change of
provider
within
episode
133

Facilities required to report to the SSA1 Facilities reporting
voluntarily to the SSA
MontanaFacilities that receive state/public funding
Facilities that are licensed/certified by SSANone
All clients in facility except DUI
clientsTransfer Admission
Nebraska Facilities that receive SSA-administered state/public funding None State/public-funded clients only Admission Admission
Nevada Facilities that receive state/public funding NoneState/public funded clients and
many other clients in the facilityTransfer Transfer
New HampshireFacilities that receive state/public funding
Methadone maintenance facilitiesNone State/public-funded clients only Transfer Admission
New Jersey
Facilities that receive state/public funding
Facilities that are licensed/certified by SSA
Facilities in state intoxicated driver program
Some private facilities and
solo practitionersAll clients in facility Admission Admission
New Mexico Facilities that receive SSA substance abuse funding NoneSSA funded clients with SA or co-
occurring SA and MH disordersTransfer Transfer
New YorkFacilities that receive state/public funding
Facilities that are licensed/certified by SSANone All clients in facility Admission Admission
North Carolina Facilities that receive state/public funding None All clients in facility Transfer Transfer
North Dakota
Eight state divisional service centers and other facilities receiving
SAPT block grant funds
One state hospital
Some private facilities
All clients in state hospital and
regional human services centers
Small privates report only SAPT-
funded clients
n/a3 Admission
Ohio Facilities that receive state/public funding None State/public-funded clients only Admission Admission
Oklahoma Facilities that receive state/public funding None State/public-funded clients only Transfer Admission
OregonFacilities that receive state/public funding or are required
because they provide DUI or methadone treatmentNone All clients in facility Admission Admission
Pennsylvania
Licensed drug and alcohol treatment providers in Pennsylvania
that receive federal, state, or local funds from the Department of
Drug and Alcohol Programs are required to report the treatment
services they provide to the department's Data System.
Providers not receiving federal, state, or local funds from the
department are not required to report to the department, although
some do so voluntarily. Therefore, the statistics generated from
the department should not be interpreted as a complete
representation of all drug and alcohol treatment services in
Pennsylvania
Some, but not all, county
prisons, hospitals, and
private providers and solo
practitioners
State/public-funded clients only
are required; data on all clients
are requested and received from
some facilities
Admission Admission
Change of
provider
within
episode
Change of
service
within
episode
Continued. See notes at end of table.
Eligible clients
Appendix Table 1. State data system reporting characteristics: 2012 (continued)
State or
jurisdiction
Facilities reporting TEDS data to the SSA
134

Facilities required to report to the SSA1 Facilities reporting
voluntarily to the SSA
Puerto Rico Facilities that receive state/public funding None All clients in facility Admission Admission
Rhode IslandFacilities that receive state/public funding
Facilities that are licensed/certified by SSANone All clients in facility Admission Admission
South Carolina Facilities that receive state/public funding None All clients in facility Transfer Admission
South Dakota
Facilities that receive state/public funding
Facilities that are licensed/certified by SSA Medicare-certified
facilities
None All clients in facility Transfer Admission
Tennessee Facilities that receive state/public funding None State/public-funded clients only Transfer Admission
Texas Facilities that receive state/public funding None State/public-funded clients only Admission Admission
Utah Facilities that receive state/public funding None All clients in facility Transfer Transfer
Vermont Facilities that receive state/public funding None All clients in facility Transfer Admission
Virginia Facilities that receive state/public funding None All clients in facility n/a3 Admission
WashingtonFacilities that receive state/public funding
Medicare-certified facilities
State-certified privately
funded methadone
treatment programs
State/public-funded clients only
are required; data on all clients
are requested and received from
some facilities
Transfer Transfer
West Virginia Facilities that receive state/public funding None All clients in facility Transfer Transfer
Wisconsin Facilities that receive state/public funding None
State/county/public-funded clients
are required; data on other county-
authorized clients such as clients
having private payers are
requested and received from
some facilities.
Admission Admission
Wyoming Facilities that receive state/public funding None All clients in a facility Admission Admission
State or
jurisdiction
Facilities reporting TEDS data to the SSA
Eligible clients
Change of
service
within
episode
Appendix Table 1. State data system reporting characteristics: 2012 (continued)
Change of
provider
within
episode
SOURCE: State Substance Abuse Agencies, February 2014.
1 "State/public funding" generally refers to funding by the state Substance Abuse Agency but may also include funding by another public agency.
2 Neither an admission nor transfer record results from a change in service or provider.
3 Neither an admission nor transfer record results from a change in service within a provider.
4 Not reporting as of July 1, 2012.
n/a Not applicable.
135

Item description Response rate (%)
Discharge codependent status 100.0
Discharge service setting 100.0
Date of last contact 100.0
Admission year 100.0
Discharge year 100.0
Reason for discharge 100.0
Admission codependent status 100.0
Admissions service setting 100.0
Sex 100.0
Race 100.0
Ethnicity 100.0
Date of birth 100.0
Substance problem at admission, primary 100.0
Substance problem at admission, secondary 100.0
Substance problem at admission, tertiary 100.0
Frequency of use at admission, primary 100.0
Frequency of use at admission, secondary 100.0
Frequency of use at admission, tertiary 100.0
Living arrangements at admission 100.0
Employment status at admission 100.0
Detailed not in labor force at admission 100.0
Number of arrests in 30 days prior to
admission 99.5
Frequency of attendance at self-help
programs in 30 days prior to admission 99.3
Substance problem at discharge, primary 100.0
Substance problem at discharge, secondary 100.0
Substance problem at discharge, tertiary 100.0
Frequency of use at discharge, primary 100.0
Frequency of use at discharge, secondary 100.0
Frequency of use at discharge, tertiary 100.0
Living arrangements at discharge 100.0
Employment status at discharge 100.0
Detailed not in labor force at discharge 100.0
Number of arrests in 30 days prior to
discharge 100.0
Frequency of attendance at self-help
programs in 30 days prior to discharge 99.9
Appendix Table 2. Item percentage response rate: Linked Data Set 2012
SOURCE: Center for Behavioral Health Statistics and Quality, Substance Abuse and
Mental Health Services Administration, Treatment Episode Data Set (TEDS). Data
received through 01.23.15.
NOTE: The item response rate is based on all valid responses (i.e., including
responses such as missing and not collected that are excluded from the analysis).
136

137
Appendix B
TedS dATA elemenTS
TedS minimum dATA SeT
AGE OF FIRST USE (OF PRIMARY, SECONDARY, AND TERTIARY SUBSTANCE)
For drugs other than alcohol, these fields identify the age at which the client first used the respective substance. For alcohol, these fields record the age of first intoxication.
• 0—Indicates a newborn with a substance dependency problem
• 1-95—Indicates the age at first use
CLIENT OR CODEPENDENT/COLLATERAL
Specifies whether the admission record is for a substance abuse treatment client, or a person being treated for his/her codependency or collateral relationship with a substance abuser.
• Client—Must meet all of the following criteria:
• Has an alcohol or drug related problem
• Has completed the screening and intake process
• Has been formally admitted for treatment or recovery service in an alcohol or drug treatment unit
• Has his or her own client record
A person is not a client if he or she has completed only a screening or intake process or has been placed on a waiting list.
• Codependent/collateral—Must meet all of the following criteria:
• Has no alcohol or drug related problem
• Is seeking services because of problems arising from his or her relationship with an alcohol or drug user
• Has been formally admitted for service to a treatment unit
• Has his or her own client record or has a record within a primary client record

138
GUIDELINES: Reporting of data for Codependent/collaterals is optional. If the state opts to report codependent/collateral clients, the mandatory fields are State code, Provider identifier, Client identifier, Client transaction type, Codependent/collateral, and Date of admission. Reporting of the remaining fields in the TEDS Minimum and Supplemental Data Sets is optional. For all items not reported, the data field should be coded with the appropriate “Not collected” or “Not applicable” code.
If a substance abuse client with an existing record in TEDS becomes a codependent, a new client record should be submitted indicating that the client has been admitted as a codependent, and vice versa.
If a record does not include a value for this field, it is assumed to be a substance abuse client record.
DATE OF ADMISSION
The day when the client receives his or her first direct treatment or recovery service. For transfers, this is the date when client receives his or her first direct treatment after the transfer has occurred.
DEMOGRAPHICS
AGE
Identifies client’s age at admission. Derived from client’s date of birth and date of admission.
• 0—Indicates a newborn with a substance dependency problem
• 1-95—Indicates the age at admission
EDUCATION
Specifies the highest school grade (number of school years) completed by the client.
• 0—Less than one grade completed
• 1-25—Years of school (highest grade) completed. For General Equivalency Degree, use 12.
GUIDELINES: States that use specific categories for designating education level should map their codes to a logical number of years of school completed. For Associate’s Degree, use 14. For Bachelor’s Degree, use 16.
EMPLOYMENT STATUS
Identifies the client’s employment status at the time of admission or transfer.
• Full time—Working 35 hours or more each week, including active duty members of the uni-formed services
• Part time—Working fewer than 35 hours each week
• Unemployed—Looking for work during the past 30 days, or on layoff from a job

139
• Not in labor force—Not looking for work during the past 30 days, or a student, homemaker, disabled, retired, or an inmate of an institution. Clients in this category are further defined in the TEDS Supplemental Data Set item Detailed not-in-labor-force.
GUIDELINES: Seasonal workers are coded in this category based on their employment status at admission.
ETHNICITY
Identifies client’s specific Hispanic origin.
• Cuban—Of Cuban origin, regardless of race
• Hispanic(specificoriginnotspecified)—Of Hispanic origin, but specific origin not known or not specified
• Mexican—Of Mexican origin, regardless of race
• NotofHispanicorigin
• OtherspecificHispanic—Of known Central or South American or any other Spanish cultural origin (including Spain), other than Puerto Rican, Mexican, or Cuban, regardless of race
• Puerto Rican—Of Puerto Rican origin, regardless of race
GUIDELINES: If a state does not collect specific Hispanic detail, code Ethnicity for Hispanics as Hispanic (specific origin not specified).
RACE
Specifies the client’s race.
• Alaska Native (Aleut, Eskimo, Indian)—Origins in any of the original people of Alaska
• American Indian (other than Alaska Native)—Origins in any of the original people of North America and South America (including Central America) and who maintain cultural identification through tribal affiliation or community attachment
• AsianorPacificIslander—Origins in any of the original people of the Far East, the Indian subcontinent, Southeast Asia, or the Pacific Islands
• Asian—Origins in any of the original people of the Far East, the Indian subcontinent, or Southeast Asia, including, for example, Cambodia, China, India, Japan, Korea, Malaysia, Philippine Islands, Thailand, and Vietnam
• NativeHawaiianorotherPacificIslander—Origins in any of the original people of Hawaii, Guam, Samoa, or other Pacific Islands
• Black or African American—Origins in any of the black racial groups of Africa
• White—Origins in any of the original people of Europe, North Africa, or the Middle East
140
• Othersinglerace—Client is not classified in any category above or whose origin group, be-cause of area custom, is regarded as a racial class distinct from the above categories
• Two or more races—For use when the state data system allows multiple race selection and more than one race is indicated
GUIDELINES: If a state does not distinguish between American Indian and Alaska Native, both should be coded as American Indian. If a state does not distinguish between Asian and Native Hawaiian or other Pacific Islander, both should be coded as Asian or Pacific Islander. For states that collect multiple races: a) when a single race is designated, the specific race code should be used; b) if the state collects a primary or preferred race along with additional races, the code for the primary/preferred race should be used; c) if the state uses a system such as an algorithm to select a single race when multiple races have been designated, the same system may be used to determine the race code for TEDS. When two or more races have been designated and neither (b) nor (c) above apply, the TEDS code for Two or more races should be used.
SEX
Identifies client’s gender.
• Male
• Female
FREQUENCY OF USE (OF PRIMARY, SECONDARY, AND TERTIARY SUBSTANCES)
These fields identify the frequency of use of the respective Substance problems.
• No use in the past month
• 1-3 times in the past month
• 1-2 times in the past week
• 3-6 times in the past week
• Daily
MEDICATION-ASSISTED OPIOID THERAPY
Identifies whether the use of methadone or buprenorphine is part of the client’s treatment plan.
• Yes
• No
NUMBER OF PRIOR TREATMENT EPISODES
Indicates the number of previous treatment episodes the client has received in any drug or alcohol program. Changes in service for the same episode (transfers) should not be counted as separate prior episodes.
141
• 0 previous episodes
• 1 previous episode
• 2 previous episodes
• 3 previous episodes
• 4 previous episodes
• 5 or more previous episodes
GUIDELINES: It is preferred that the number of prior treatments be a self-reporting field collected at the time of client intake. However, this data item may be derived from the state data system if the system has that capability and episodes can be counted for at least several years.
PRINCIPAL SOURCE OF REFERRAL
Describes the person or agency referring the client to the alcohol or drug abuse treatment program.
• Alcohol/drugabusecareprovider—Any program, clinic, or other health care provider whose principal objective is treating clients with substance abuse problems, or a program whose activi-ties are related to alcohol or other drug abuse prevention, education, or treatment
• Court/criminal justice referral/DUI/DWI—Any police official, judge, prosecutor, probation officer, or other person affiliated with a Federal, State, or county judicial system. Includes referral by a court for DWI/DUI, clients referred in lieu of or for deferred prosecution, or during pretrial release, or before or after official adjudication. Includes clients on pre-parole, pre-release, work or home furlough, or TASC. Client need not be officially designated as “on parole.” Includes clients referred through civil commitment. Client referrals on this category are further defined in the TEDS Supplemental Data Set item Detailed criminal justice referral.
• Employer/EAP—A supervisor or an employee counselor
• Individual (includes self-referral)—Includes the client, a family member, friend, or any other individual who would not be included in any of the following categories; includes self-referral due to pending DWI/DUI
• Other community referral—Community or religious organization or any federal, state, or local agency that provides aid in the areas of poverty relief, unemployment, shelter, or social welfare. Self-help groups such as Alcoholics Anonymous (AA), Al-Anon, and Narcotics Anonymous (NA) are also included in this category. Defense attorneys are included in this category.
• Other health care provider—A physician, psychiatrist, or other licensed health care profes-sional; or a general hospital, psychiatric hospital, mental health program, or nursing home
• School (educational)—A school principal, counselor, or teacher; or a student assistance program (SAP), the school system, or an educational agency

142
SUBSTANCE PROBLEM (PRIMARY, SECONDARY, OR TERTIARY)
These fields identify the client’s primary, secondary, and tertiary substance problems. Each Sub-stance problem (primary, secondary, and tertiary) has associated fields for Route of administration, Frequency of use, Age at first use, and the TEDS Supplemental Data Set item Detailed drug code.
• Alcohol
• Barbiturates—Amobarbital, pentobarbital, phenobarbital, secobarbital, etc.
• Benzodiazepines—Includes alprazolam, chlordiazepoxide, clonazepam, clorazepate, diazepam, flunitrazepam, flurazepam, halazepam, lorazepam, oxazepam, prazepam, temazepam, triazolam, and other unspecified benzodiazepines
• Cocaine/crack
• Heroin
• Inhalants—Includes chloroform, ether, gasoline, glue, nitrous oxide, paint thinner, etc.
• Marijuana/hashish—Includes THC and any other cannabis sativa preparations
• Methamphetamine
• Non-prescription methadone
• Other amphetamines—Includes amphetamines, MDMA, phenmetrazine, and other unspeci-fied amines and related drugs
• Otherhallucinogens—Includes LSD, DMT, STP, hallucinogens, mescaline, peyote, psilocybin, etc.
• Other non-barbiturate sedatives or hypnotics—Includes chloral hydrate, ethchlorvynol, glutethimide, methaqualone, and other non-barbiturate sedatives or hypnotics
• Other non-benzodiazepine tranquilizers—Includes meprobamate and other non-benzodiaz-epine tranquilizers
• Other opiates and synthetics—Includes buprenorphine, codeine, hydrocodone, hydromorphone, meperidine, morphine, opium, oxycodone, pentazocine, propoxyphene, tramadol, and any other drug with morphine-like effects
• Other stimulants—Includes methylphenidate and any other stimulants
• Over-the-counter medications—Includes aspirin, cough syrup, diphenhydramine and other antihistamines, sleep aids, and any other legally obtained nonprescription medication
• PCP—Phencyclidine
• Other—Includes diphenylhydantoin/phenytoin, GHB/GBL, ketamine, etc.
• None
143
GUIDELINES: Substance problems are further defined in the TEDS Supplemental Data Set item Detailed drug code. For guidance on which specific substances to include in the substance catego-ries, please refer to the detailed drug categories listed for Detailed drug code.
• Substance problem and Route of administration:
• For states that do collect Detailed drug code—Records may have duplicate Substance problems and identical Route of administration IF the corresponding Detailed drug codes are different or are ‘‘multiple’’ drug codes
• For states that do not collect Detailed drug code—A record may not have duplicate Substance problems with identical Routes of administration
TRANSACTION TYPE
Identifies whether a record is for an initial admission or a transfer/change in service. Note: Some states may use other terminology such as “initial admission” and “transfer admission” in place of “admission” and “transfer.”
• A—Admission
• T—Transfer/change in service
GUIDELINES: For TEDS, a treatment episode is defined as that period of service between the beginning of treatment for a drug or alcohol problem and the termination of services for the pre-scribed treatment plan. The episode includes one admission (when services begin) and at least one discharge (when services end). Within a treatment episode, a client may transfer to a different service, facility, provider, program, or location. Each admission and transfer record should have an associated discharge record.
When it is feasible for the state to identify transfers, they should be reported as transfers in admis-sions data submissions. When admissions and transfers cannot be differentiated in a state data system, such changes in service or facility should be reported to TEDS as admissions.
Data set considerations for transfers:
• All fields from the transfer record should be updated to reflect values at the time of transfer except the following fields, which must have the same values as in the associated (preceding) admission record: Client ID, Codependent/collateral, Date of birth, Sex, Race, and Ethnicity. If a field cannot be updated, it should be transmitted to TEDS with its value from the associated (preceding) admission record.
• Date of admission is defined as the date services begin after the transfer to another service or facility.
TYPE OF SERVICES
Describes the type of service and treatment setting in which the client is placed at the time of admission or transfer.
144
• Ambulatory,detoxification—Outpatient treatment services providing for safe withdrawal in an ambulatory setting (pharmacological or non-pharmacological)
• Ambulatory, intensive outpatient—As a minimum, the client must receive treatment lasting two or more hours per day for three or more days per week
• Ambulatory, non-intensive outpatient—Ambulatory treatment services including individual, family, and/or group services, and may include pharmacological therapies
• Detoxification,24-hour service, free-standingresidential—24-hour per day services in a non-hospital setting providing for safe withdrawal and transition to ongoing treatment
• Detoxification, 24-hour service,hospital inpatient—24-hour per day medical acute care services in a hospital setting for detoxification of persons with severe medical complications associated with withdrawal
• Rehabilitation/residential,hospital(otherthandetoxification)—24-hour per day medical care in a hospital facility in conjunction with treatment services for alcohol and other drug abuse and dependency
• Rehabilitation/residential, short-term (30 days or fewer)—Typical ly, 30 days or less of non-acute care in a setting with treatment services for alcohol and other drug abuse and dependency
• Rehabilitation/residential,long-term(morethan30days)—Typically, more than 30 days of non-acute care in a setting with treatment services for alcohol and other drug abuse and depen-dency; this may include transitional living arrangements such as halfway houses
USUAL ROUTE OF ADMINISTRATION (OF PRIMARY, SECONDARY, AND TERTIARY SUBSTANCES)
These fields identify the usual route of administration of the respective Substance problems.
• Inhalation
• Injection (IV or intramuscular)
• Oral
• Smoking
• Other

145
TedS linked dATA SeT
DATE OF DISCHARGE
The date when the client was formally discharged from the treatment facility or service. The date may be the same as the date of last contact. In the event of a change of service or provider within an episode of treatment, it is the date the service terminated or the date the treatment ended at a particular provider.
DATE OF LAST CONTACT
The date when the client was last seen for a treatment. The date may be the same as the date of discharge. In the event of a change of service or provider within an episode of treatment, it is the date the client transferred to another service or provider.
DETAILED NOT IN LABOR FORCE AT ADMISSION/DISCHARGE
These fields record more detailed information about those clients who are coded as Not in labor force in the TEDS Minimum Dataset item Employment Status.
• Disabled
• Homemaker
• Inmate of institution (prison or institution that keeps a person, otherwise able, from entering the labor force)
• Other
• Retired
• Student
EMPLOYMENT STATUS AT DISCHARGE
See TEDS Minimum Data Set item Employment status for definitions.
FREQUENCY OF ATTENDANCE AT SELF-HELP PROGRAMS IN 30 DAYS PRIOR TO ADMISSION/DISCHARGE
These fields record the number of times the client has attended a self-help program in the 30 days preceding the date of admission to and discharge from treatment services.
• No attendance in the past month

146
• 1-3 times in the past month
• 4-7 times in the past month
• 8-15 times in the past month
• 16-30 times in the past month
• Some attendance in the past month, but frequency unknown
FREQUENCY OF USE AT DISCHARGE (OF PRIMARY, SECONDARY, AND TERTIARY SUBSTANCES)
See TEDS Minimum Data Set item Frequency of use for definitions.
LIVING ARRANGEMENTS AT ADMISSION/DISCHARGE
These fields record whether the client is homeless, living with parents, in a supervised setting, or living on his or her own at the time of admission and discharge.
• Dependentliving—Clients living in a supervised setting such as a residential institution, halfway house, or group home, and children (under age 18) living with parents, relatives, or guardians or in foster care.
• Homeless—Clients with no fixed address; includes shelters.
• Independentliving—Clients living alone or with others without supervision.
NUMBER OF ARRESTS IN 30 DAYS PRIOR TO DISCHARGE
Records the number of arrests in the 30 days preceding the date of admission to and discharge from treatment services.
• 00-96—Number of arrests
REASON FOR DISCHARGE, TRANSFER, OR DISCONTINUANCE OF TREATMENT
Indicates the outcome of treatment or the reason for transfer or discontinuance of treatment.
• Death
• Incarcerated—Jail, prison, house confinement
• Left againstprofessional advice (droppedout)—Client chose not to complete treatment program, with or without specific advice to continue treatment; includes clients who dropped out for unknown reasons and clients who did not receive a treatment service for some time and were discharged for administrative reasons
• Other—Client moved, became ill, was hospitalized, or other reason somewhat out of client’s control
147
• Terminated by facility—Treatment terminated by action of facility, generally because of client non-compliance or violation of rules, laws, or procedures (excludes client drop-out, incarcera-tion, or client-motivated reason for discontinuance)
• Transferredtoanothersubstanceabuseprogramorfacility—Client was transferred to an-other substance abuse treatment service type, program, provider, or facility; client may or may not have reported to the new program or facility
• Treatment completed—All parts of the treatment plan or program were completed
• Unknown—Client status at discharge not known (e.g., record incomplete or lost); not to be used for clients who dropped out of treatment
SUBSTANCE PROBLEM AT DISCHARGE (PRIMARY, SECONDARY, OR TERTIARY)
See TEDS Minimum Data Set item Substance problem for definitions.
TYPE OF SERVICE AT DISCHARGE
See TEDS Minimum Data Set item Type of service for definitions.

148

149
Appendix C
List of Contributors
This report was prepared by Synectics for Management Decisions, Inc. (SMDI), and by the Center for Behavioral Health Statistics and Quality (CBHSQ), Substance Abuse and Mental Health Services Administration, U.S. Department of Health and Human Services (HHS). Work by SMDI was performed under Contract No. HHSS283200700048I/HHSS28342001T.
The report was written by Sarbajit Sinha and Anand Borse under the direction of Doren Walker (Project Director) and Hongwei Zhang (Director of Data Analysis and Reports) at SMDI.
Production of the report at SAMHSA was managed by Cathie Alderks. SAMHSA contributors and reviewers, listed alphabetically, include: Cathie Alderks, Herman Alvarado, Jamie Teufel, and Nichele Waller.