transportation asset management plan - alaskadot.alaska.gov/stwddes/asset_mgmt/assets/tamp.pdftamp...
TRANSCRIPT

Transportation Asset Management Plan
Alaska Department of
Transportation & Public Facilities
June 2019


TAMP June 2019
2
Table of Contents
Executive Summary ...................................................................................................... 4 Section 1 Introduction .................................................................................................... 5
1.1 Asset Management Mission, Vision and Goals .............................................. 6 1.2 Penalties and Reporting ................................................................................. 7 1.3 TAM Implementation and Organizational Structure ........................................ 8 1.4 Federal Performance Management ................................................................ 9
Section 2 Pavement & Bridge Assets .......................................................................... 14 2.1 Pavement Inventory ...................................................................................... 14 2.2 Pavement Condition Data ............................................................................. 14 2.3 Bridge Inventory ........................................................................................... 18 2.4 Bridge Condition ........................................................................................... 18
Section 3 Performance Management .......................................................................... 22 3.1 Performance Gap Identification .................................................................... 22 3.2 Performance Gap Analysis ........................................................................... 23 3.3 Life Cycle Planning: Analysis and Management ........................................... 25 3.4 Asset Management Implementation ............................................................. 30 3.5 Risk Management ......................................................................................... 31
Section 4 Financial Plan .............................................................................................. 32 4.1 Current and Future Funding Needs .............................................................. 32
4.1.1 Pavement and Bridge Needs .............................................................. 32 4.1.2 Addressing Other Needs ..................................................................... 33
4.2 Funding Asset Management ......................................................................... 34 4.2.1 Federal Funds ..................................................................................... 34 4.2.2 State Funds ......................................................................................... 35
4.3 Funding Gaps ............................................................................................... 35 4.4 Value of Assets............................................................................................. 38
Section 5 Asset Management Investment Strategies .................................................. 39 5.1 Supporting Long-Term Objectives ................................................................ 39 5.2 Investment Plan for 2019–2028 .................................................................... 40
Section 6 Improvement Plan ....................................................................................... 42 6.1 Cross Asset Allocation .................................................................................. 42 6.2 Single Asset Analysis and Future Improvements ......................................... 43

TAMP June 2019
3
Executive Summary
The risk-based, Transportation Asset Management Plan (TAMP) is one of a series of state plans required by federal rulemaking to achieve the Nation’s transportation goals. TAM keeps Alaska moving through service and infrastructure by making good infrastructure cost less. TAM provides a long term, systematic approach to cost-effectively sustain our infrastructure. The TAMP provides a 10-year financial plan that provides the connection between the Long Range Transportation Plan (LRTP) which covers a span of more than 20 years and the State Transportation Improvement Program (STIP), with its scope of four years.
TAM supports the overall department vision by strengthening Alaska Department of Transportation and Public Facilities (DOT&PF) efficiency and effectiveness at planning, designing, constructing, operating and maintaining transportation systems. This vision strengthens transparency and accountability; encourages innovation and quality of services.
The TAMP includes National Highway System (NHS) bridges and pavements only. As of July 2018, Alaska has 1,160 and miles of Interstate and 925 miles of non-Interstate roads. All except for about 23 miles are owned and operated by DOT&PF. Alaska has 415 bridges on the NHS, all owned and operated by DOT&PF.
States are required by 23 CFR 490.105 to set pavement condition targets for NHS that include its Interstate and non-Interstate inventory. Alaska’s targets for Interstate pavement are 10% poor and 20% good; for non- Interstate NHS the target is 15% poor and 15% good. For bridges, the targets are 10% poor and 40% good. The cost to keep Alaska infrastructure in a state of good repair meeting those targets is estimated at an average of $135 million annually over the next 10 years. This does not include funding need for mobility, safety and economic development projects.
DOT&PF staff have led the coordination with Alaska’s two Metropolitian Planning Organizations (MPOs) to evaluate the performance targets the MPOs plan to use for NHS pavements and bridges and to incorporate these targets into their transportation plans. DOT&PF staff have also worked on a process for prioritization of projects for the NHS system to help meet these targets.
The greatest risk DOT&PF faces is in obtaining the quality data necessary to forecast efficient infrastructure maintenance needs. Some other risks identified include inadequate funding, seismic activity, flooding, coastal erosion, permafrost, aufeis impacts, providing vital lifelines to small communities, and quality control of construction projects. There is not enough funding to meet Alaska’s transportation needs. We aim to preserve our assets at a state of good repair while building new facilities, modernizing existing ones and supporting our ferry system.
This is DOT&PF’s first TAMP with all federally required elements. It is expected that Performance Management and Asset Management practices will continue to be refined.
TAMP June 2019
4
Section 1 Introduction
The purpose of this Transportation Asset Management Plan (TAMP) is to describe how the Alaska Department of Transportation and Public Facilities (DOT&PF) will manage NHS roads in a state of good repair by achieving national goals and state-set targets while managing risks in a financially responsible manner. This plan documents the development of a long-term systematic approach for sustaining the NHS Interstate pavements and bridges owned and maintained by DOT&PF. Transportation Asset Management, a cost-effective program of continuous, collaborative improvement, to “ Keep Alaska Moving through service and infrastructure,” by making good infrastructure cost less.
The TAMP is one of a series of state plans required by federal rulemaking to achieve the Nation’s transportation goals. In addition to this Transporation Asset Management Plan, State DOTs are required to develop plans for highway safety, freight and congestion. Alaska’s Strategic Highway Safety Plan was completed and approved February 28 2019. Alaska’s Highway Safety Improvement Program handbook was updated February 21, 2018 and plan to update May 2019. Alaska’s Freight Plan was completed in February 2018. Regulations do not require that Alaska have a congestion plan at this time but will need one by 2020. All these plans will influence the DOT&PF’s LRTP and the short term STIP.
The TAMP identifies DOT&PF methods for assessing the asset conditions, analyzing future conditions and asset management practices. Using a risk based approach, DOT&PF performed a gap analysis between desired state of good repair condition and available funding. Finally, these steps define Alaska DOT&PF investment strategies for meeting the demands of ensuring the successful management of Alaska’s transportation assets.
The DOT&PF’s mission and vision for Transportation Asset Management (TAM) is to support Alaska’s surface transportation program through the Fixing America’s Surface Transportation (FAST Act). FAST Act is the first long-term highway authorization enacted since 2005 and through the Moving Ahead for Progress in the 21st Century (MAP 21). In 2012, MAP 21 created a streamlined and performance-based surface transportation program for the nation (https://www.fhwa.dot.gov/map21/). The FAST Act continued and strengthened the performance-based transportation program https://www.fhwa.dot.gov/fastact/.
MAP 21 defines asset management as follows:
The term asset management means a strategic and systematic process of operating, maintaining and improving physical assets, with the focus of both engineering and economic analysis based on quality information, to identify a structured sequence of maintenance, preservation, repair, rehabilitation, and replacement actions that will achieve and sustain a desired good repair over the life cycle of the assets at a minimum practical cost. [23 USC, Sec. 101(a)(2)]
1.1 Asset Management Mission, Vision and Goals DOT&PF will manage highway assets using asset management mission, vision and goals. In this section, the TAM mission, vision and its respective goals are described

TAMP June 2019
5
including a detailed discussion of pavement and bridge assets. Keeping with the DOT&PF TAM motto, “Start simple, grow smart, and show continuous improvement”, only the required NHS bridges and pavement assets are included.
Mission: TAM keeps Alaska moving through service and infrastructure by making good infrastructure cost less.
Vision: TAM provides a long term, systematic approach to cost-effectively sustain our infrastructure.
TAM supports the overall “One DOT&PF” vision by strengthening the efficiency and effectiveness at planning, designing, constructing, operating and maintaining transportation; by strengthening our transparency and accountability; by encouraging innovation and quality of our service.
TAM depends on quality data for more effective planning, designing, constructing, operating and maintaining all modes of transportation for informed decision-making to keep infrastructure in a state of good repair over the lifecycle of the asset.
The principles and goals by which we support the DOT&PF mission are as follows:
1. Integration of information systems – using a common language 2. Informed decision-making 3. Simple, achievable goals 4. Measurement of what matters
GOAL #1: Predictive Models to “Tell the Future”
TAM promotes performance of state-owned transportation assets and facilities through performance metrics, risk management, and evaluation of progress. We collect and analyze historical data to predict the future condition.
GOAL #2: Wise Investment Resources
TAM provides for better access to quality data and for better planning in the design, construction, operation, and maintenance of all modes of transportation.
GOAL #3: A Long-term Comprehensive Network that generates actionable information
TAM will support One DOT&PF, by maintaining strong, healthy communications internally and externally. TAM supports collaboration through our TAM structure and provides information for stakeholders and decision-makers. System integration is essential to combine data from disparate business systems into information to support decisions.
GOAL #4: Credibility
TAM will maximize the impact of every public dollar spent. We will serve the needs of Alaskans through the National Performance Measures.

TAMP June 2019
6
GOAL #5: Transparency
TAM will improve transparency by making information readily available and accessible for stakeholders and decision makers. TAM holds DOT&PF accountable through monitoring performance metrics and evaluating progress. TAM supports innovation through alternatives analysis and trade-off analysis.
1.2 Penalties and Reporting The federal funding participation is normally around 90% of project costs. If a state has not developed and implemented a TAMP by October 2019, the federal funding participation may not exceed 65% (23 CFR 515.15). If a State DOT has not developed and implemented an Asset Management Plan and has not established bridge and pavement targets on the National Highway System, Federal Highways Administration (FHWA) will not approve any further projects using National Highway Performance Program (NHPP) funding. FHWA may extend the deadline if states are making a good faith effort.
The National Performance Rule Making requires FHWA to assess biennially whether each state is showing significant progress in achieving targets the state has established for the NHPP. State progress would be considered significant if the actual condition is either equal to or better than the established target, or better than the baseline condition. No later that August 31, 2019 and not later than July 31 in each year thereafter, FHWA will determine whether the State DOT has developed and implemented an asset management plan consistent with the federal rules.
Under the Final Rule for pavement condition, failure to meet the minimum level for two consecutive calendar years would subject a state to the following penalties:
• The State must obligate NHPP funds in an amount at least equal to the State’s federal fiscal year (FFY) 2009 Interstate Maintenance apportionment - $31.7M. For each year after FFY 2013, the amount required to be obligated shall increase by 2 percent over the amount required to be obligated in the previous federal fiscal year, and
• The State must transfer Surface Transportaion Program (STP) funds that are not sub-allocated based on population to the NHPP in an amount equal to 10 percent of the amount of the State’s FFY 2009 Interstate Maintenance apportionment, estimated at $3.1 million.
Under the Final Rule for bridge condition, failure to meet the minimum level for three consecutive calendar years would subject a state to the following penalties:
• The state must obligate and set aside in an amount equal to 50 percent of funds apportioned to such State for fiscal year 2009, estimated at $13,753,843 only for eligible projects on bridges on the NHS. The requirement will remain until less than 10 percent of the total deck area bridges in the state on the NHS have been classified as Structurally Deficient.
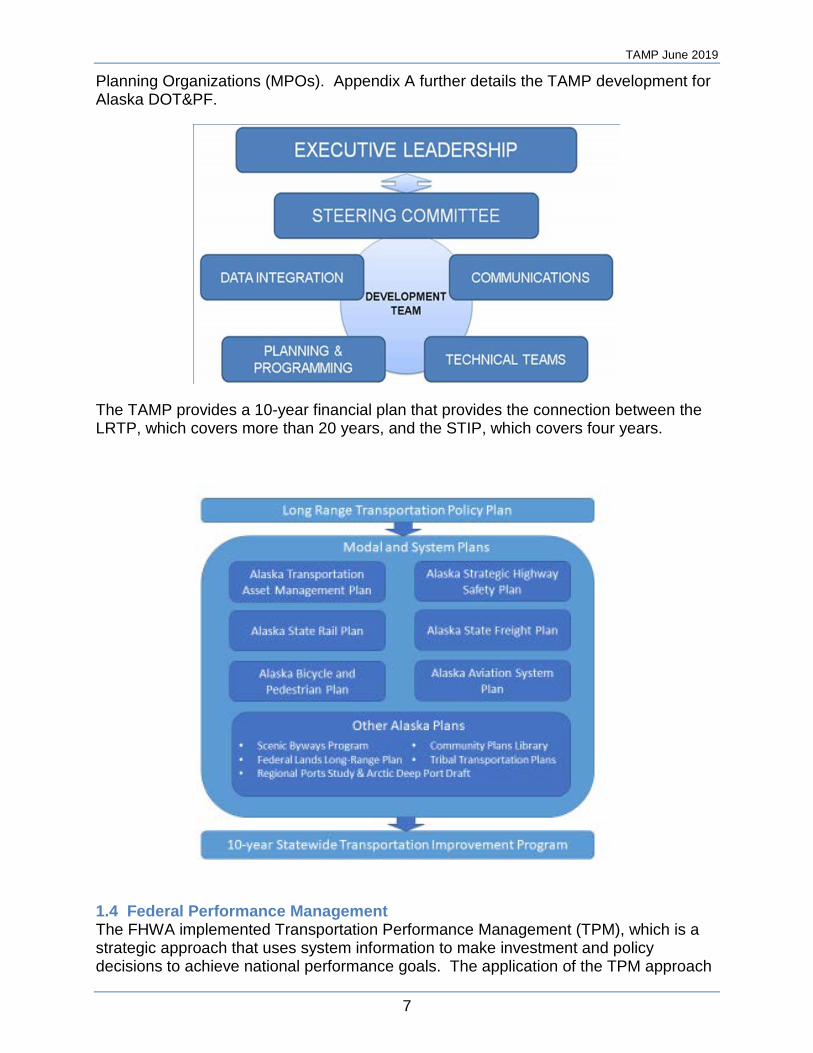
1.3 TAM Implementation and Organizational Structure The TAM Leadership Structure, as shown below and which is further described in Appendix A, describes how TAM is organized within the DOT&PF and Metropolitan
TAMP June 2019
7
Planning Organizations (MPOs). Appendix A further details the TAMP development for Alaska DOT&PF.
The TAMP provides a 10-year financial plan that provides the connection between the LRTP, which covers more than 20 years, and the STIP, which covers four years.
1.4 Federal Performance Management The FHWA implemented Transportation Performance Management (TPM), which is a strategic approach that uses system information to make investment and policy decisions to achieve national performance goals. The application of the TPM approach

TAMP June 2019
8
ensures that investments are performance-driven and outcome based. See Appendix B for more information on Performance Management and state set targets.
TPM encompasses the following programs:
1. Transportation Asset Management (National Highway System Bridges and Pavements)
2. Congestion Mitigation Air Quality Improvement Program (CMAQ) 3. Safety Performance Measures 4. Travel Time Reliability 5. Freight Movement
The Federal Final Rule and supporting regulations include national goals for infrastructure condition and have penalties if not achieved. Targets for infrastructure and the other four programs are set by the federal DOT in coordination with partnering agencies. The first performance period for TPM begins January 1, 2018 and ends on December 31, 2021 with the exception of CMAQ emissions reduction measure. For that measure the first performance period begins on October 1, 2107 and ends on September 31, 2021.
National Goals for Pavement and Bridges 23 CFR 315(b) requires that the percentage of Poor IRI on Alaska’s interstate not exceed 10%. Section 2 includes more details on current conditions, but the State of Alaska meets the 90% fair or better national goal at this time.
23 CFR 490.411(a) requires that the state maintain bridges so that the percentage of the deck area of bridges classified as structurally deficient does not exceed 10.0%. The deck area percentage for the last five years has improved from 9.5% deficient to 6.5%, a trend of -0.8%. The State of Alaska meets the national goal of less than 10% poor.
Infrastructure Targets Federal rulemaking 23 CFR 490.105 requires that performance targets be set for both Interstate and non-Interstate NHS.
Performance Measures 2-year Target
4-year Target
10-year Target
Poor Pavement Condition on the Interstate 10% 10% 10%
Good Pavement Condition on the Interstate 20% 20% 20% Poor Pavement Condition on the NHS (excluding the Interstate) 15% 15% 15%
Good Pavement Condition on the NHS (excluding the Interstate) 15% 15% 15%
Performance Measures 2-year Target
4-year Target
10-year Target
Poor Condition of Bridges on the NHS 10% 10% 10%
Good Condition of Bridges on the NHS 40% 40% 40%

TAMP June 2019
9
Having an upper limit on “good” pavements and bridges may seem counter-intuitive, but the purpose of this upper limit is to manage the road system cost effectively. The upper limit for good pavements should not be more than 20%, and 40% for bridges.
Federal rulemaking 23 CFR 490.105 requires performance targets set for bridges on the NHS. Since bridges are complex structures and require time for project development and design, the State of Alaska will strive to keep poor bridges below 7.5%. The official taret will remain 10%.
These targets will be the state of good repair for NHS bridge and pavement assets for the entire ten year performance period 2018 to 2027. The targets will be reviewed in two years during the mid performance period reporting.
Other Federally Required Performance Measures Federal rulemaking also requires states to set targets for the following programs
• Safety Performance Measures (Safety) • Congestion Mitigation Air Quality Improvement Program (CMAQ) • Travel Time Reliability • Freight Movement
State of Alaska has a vision of zero fatalities and serious injuries, but is required by federal law to set “targets” for these metrics. Obviously this is not a metric the State is trying to meet but one it is required to forecast - namely the accident rate that will most likely occur based on historical data and trends. The performance measures are included in the Highway Safety Improvement Plan (HSIP), Highway Safety Plan (HSP) or both.
Targets are set annually by June 30 for the following calendar year
Metrics 2020 2019 2018 HSIP HSP Date target set 3/1/19 3/14/18 3/9/17
Fatalities ≤ 80 ≤ 75 ≤ 75 √ √ Fatality Rate ≤1.5 ≤1.5 ≤1.5 √ √ Serious Injuries ≤ 400 ≤ 350 ≤ 375 √ √ Serious Injury Rate ≤7.5 ≤6.5 ≤7.5 √ Non-motorized fatalities and serious injuries (combined)
≤70 ≤55 ≤55 √

TAMP June 2019
10
The CMAQ program provides a flexible funding source to the State for projects and programs to help meet the requirements of the Clean Air Act. The goal for these projects is to reduce congestion and improve air quality for areas that do not meet the National Ambient Air Quality Standards for ozone, carbon monoxide or particulate matter (nonattainment areas) and for former nonattainment areas that are not in compliance (maintenance areas).
The following CMAQ targets were set on May 15, 2018:
Performance Measures Baseline 2-year Target
4-year Target
Total Emissions:PM 2.5 400.600 0.050 0.050
Total Emissions:NOx 4663.000 0.050 0.050
Total Emissions:VOC None None None
Total Emissions:PM 10 1943.000 2.000 4.000
Total Emissions:CO 5023.000 20.000 40.000 All units are daily kilograms.
Travel time reliability measures the extent of unexpected delay. A formal definition for travel time reliability is: the consistency or dependability in travel times, as measured from day-to-day and/or across different times of the day. Travel time covers all vehicles and the freight is a subset that shows only freight travel times.
Freight and travel time reliability targets below were set in May 2018:
Performance Measures 2-year Target
4-year Target
Travel Time Reliability
Interstate (LOTTR) 92% 92%
Non-Interstate NHS N/A 70%
Freight Travel Time Reliability
Interstate Travel Time Reliablity Index 2.0 2.0

TAMP June 2019
11
Section 2 Pavement & Bridge Assets
The following section summarizes only those pavement and bridge assets that are on the NHS. All Alaska roads and bridges are important to consider for overall management of the transportation system, but for the purposes of this document only NHS pavement and bridges will be included. More detailed information on pavement is included in Appendix C and more information on bridges in Appendix D.
2.1 Pavement Inventory The following summarizes Alaska’s Interstate and non-Interstate NHS in centerline mile collected in summer 2018.
Centerline Miles Interstate (paved) 1,159.700 Paved non interstate NHS 924.943 Unpaved non interstate NHS 262.814
Total 2,347.457 The entire 1,159.7 miles of Interstate is owned and operated by Alaska DOT&PF. Condition data is collected annually by a third party contractor. Of the 924.943 miles of non Interstate NHS, 22.6 miles are owned and operated by entities other than Alaska DOT&PF. Over 19.1 miles of the 22.6 miles are owned and operated by Municipality of Anchorage (MOA). The rest (3.5 miles) are intermodal links between the state system and a ferry, port or airport. Non Interstate NHS data should be collected at least once every two years, but in practice most segments are collected annually by a contractor. DOT&PF will continue to coordinate with Municipality of Anchorage as needed and notes that at only 1% of the overall system, the non-DOT&PF owned NHS is unlikely to affect national goals and state targets.
The State collects pavement and other federally required Highway Performance Monitoring System data elements for the entire NHS regardless of ownership therefore does not require any special agreements to be put in place for data collection to comply with 23 CFR 515.7(f). DOT&PF and MPOs developed a MOU and Performance Measure Target Setting Procedures document to facilitate coordination between two entities related to sharing data, setting targets, and selecting projects in support of targets.
2.2 Pavement Condition Data This performance measure uses the following metrics for asphalt pavements: International Roughness Index (IRI), cracking, and rutting. The table below lists the thresholds in the final rulemaking. The ‘Pavement Three Metrics’ table outlines the values for each metric as good, fair and poor. The second table shows how to combine the three metrics to define an overall all condition for each HPMS section (~0.1 miles).
Pavement Three Metrics IRI
In/mile %Cracking
Rutting
(in) Good <95 <5% <0.2 Fair 95-170 5-20% 0.2-0.4 Poor >170 >20% 0.40

TAMP June 2019
12
Section Overall Asphalt Condition
Overall 3 Metric Ratings (IRI, Cracking, Rutting)
Good All three metrics are good Poor 2 or more metrics rated poor Fair All other combinations
The final federal rule allows but does not require the use of Pavement Serviceablity Rate (PSR) for roads less than 40 mph; this calculation does not include cracking. The State of Alaska is not using PSR at this time on the NHS. DOT&PF may use it on remote non-NHS routes when normal pavement data collection equipment can not be deployed.
Pavement Condition using all three metrics Based on data collected in the summer 2018, Alaska had 1,160 centerline miles of Interstate, all paved. Figure C.4 below shows Alaska’s Interstate Overall Asphalt Condition in 2018. In 2018, 1.4% of the Interstate Overall Pavement Condition was poor, 65.8% was in fair condition, and 32.8% was in good condition.

TAMP June 2019
13
Alaska has 1,191.303 centerline miles of Non-Interstate NHS in 2018. Most of these miles (924.9 miles) are paved. Figure C.5 shows Alaska’s non-Interstate NHS Overall Asphalt Condition in 2018. In 2018, 8.1% of the Non-Interstate NHS Overall Pavement Condition was poor, 69.3% was fair, and 22.6% was in good condition.
27.0% 23.6% 23.8% 15.8%
32.8%
64.3% 71.3% 72.4% 79.5%
65.8%
8.7% 5.1% 3.5% 4.7% 1.4%
0%
10%
20%
30%
40%
50%
60%
70%
80%
90%
100%
2014 2015 2016 2017 2018
INTERSTATE PAVEMENT - OVERALL %
Good Fair Poor
Average 4.7% Poor and The Trend is +1.8%
Average 24.6% Good and The Trend is +1.5%

TAMP June 2019
14
Pavement Condition for IRI only on Interstate Figure C.6 shows that the percent of the Interstate IRI condition in poor condition was 8% in 2015 and 9.7% in 2018.
Pavement Management Objectives:
• Treat pavements in good and fair condition before they deteriorate to save money over the pavement’s life cycle.
• Provide information to allow effective selection and design of future surface treatments, rehabilitation, and reconstruction projects.
52.1% 59.7% 57.6% 63.0% 55.1%
37.3% 32.4% 32.6% 25.8% 35.2%
10.6% 8.0% 9.8% 11.2% 9.7%
0%10%20%30%40%50%60%70%80%90%
100%
2014 2015 2016 2017 2018
INTERSTATE ONLY IRI CONDITIONS - %
Good Fair Poor
Average 9.9% Poor and the Trend is +0.2%
Average 57.5% Good and The Trend is +0.75%
Average 17.4% Good and The Trend is +2.1%
13.6% 16.3% 17.0% 13.8% [VALUE]
47.3%
68.1% 66.5% 69.8% 69.3%
16.9%
15.6% 16.5% 16.4% 8.1%
0%
10%
20%
30%
40%
50%
60%
70%
80%
90%
100%
2014 2015 2016 2017 2018
NON-INTERSTATE NHS PAVEMENT - OVERALL %
Good Fair Poor
Missing Data
22.2%
Average 14.2% Poor and The Trend is +2.5%

TAMP June 2019
15
• Accurately estimate future conditions versus funding scenarios to evaluate current pavement funding strategies.
• Display analysis results in understandable formats.
2.3 Bridge Inventory In Alaska, the NHS included 408 bridges in 2014, 399 bridges in 2015, 394 bridges in 2016, 411 bridges in 2017 and 415 bridges in 2018. Engineers biennually inspect bridges, and these inspections are subject to requirements established by FHWA. Bridges inventory changes year-to-year with bridge closures, bridge replacements or changes in road functional class.
2.4 Bridge Condition The bridge performance measure uses the following metrics for bridges: Deck Rating, Superstructure Rating and Substructure Rating. The table below lists the thresholds in the final rulemaking. The lowest rating of all three metrics becomes the overall bridge condition.
Bridge Metrics Deck Super Sub Good 9-7 9-7 9-7 Fair 6-5 6-5 6-5 Poor <5 <5 <5
During these biennial inspections, Department bridge inspectors assigned a condition rating in accordance with the National Bridge Inspection Standards (NBIS). The condition rating describes the existing, in-place status of a bridge component compared to the bridge’s original, or as-new, condition using a 0-9 scale, with 9 as excellent and 0 as failed.
A bridge is structurally deficient if inspection reveals that primary load-carrying elements are in poor (or worse) condition due to deterioration and/or damage. Primary load-carrying elements include the deck (driving surface), superstructure (the components supporting the deck such as the girders), and substructure (abutments and piers). While the term “structurally deficient” can imply unsafe conditions, bridges with this classification are in safe operating condition to meet the required level of service, or the bridges are weight-restricted or lane-restricted (reduced to a single lane) to assure safe operation. When weight restrictions fall below 3 tons, the bridge is closed to traffic in accordance with federal regulations. Closed bridges are not considered part of the performance measure. There are no “closed“ bridges on the NHS.
The DOT&PF measures bridge performance by calculating the ratio (percentage) of deck area of a given condition state (good, fair, or poor/structurally deficient) compared to the total bridge deck area on the NHS. The percentage of structurally deficient deck area on the NHS became a congressionally-mandated performance measure with the enactment of MAP-21. Data from 2016, 2017 and 2018 includes bridges. Previously, culverts of 20 feet in diameter or larger have not been counted in the NBI bridge deficient deck area. MAP-21 rulemaking required these culverts be included in the NBI bridge deficient deck area calculation.

TAMP June 2019
16
Condition Rating Performance Target Description
Good Maintenance Candidate Fair Preservation Candidate NBI Standard = 5 or 6 Poor Rehabilitation or Replacement Candidate
The chart below shows bridge condition data in 2018 from data collected in 2017:
MAP-21 contains a performance measure limiting poor bridge deck area to no more than 10% of all bridges on the NHS. Over the most recent three years, Alaska has met this criteria and has an improving downward trend of 0.8% annually.
The following figure depicts the percentage of bridges in good, fair, and poor condition over the past three years. Bridge deck area in poor condition decreased from 9.5% to 6.4% consistent with the structurally deficient bridge data presented above. While this decrease in bridges in poor condition is encouraging, it is somewhat offset by the decrease in bridges in good condition and the overall increase in bridges in fair condition. This trend could be an indication of the need for more investment in preservation treatments aimed at maintaining bridges in fair or better condition.
Data for bridge condition by deck area for the last five years is shown below:
The following table shows the last five years of bridge condition data for the non NHS.
39.8% Good
54.2% Fair
6.4% Poor
2018 NHS DECK AREA CONDITION
6.4% Structurally Deficient
30%
40%
50%
60%
70%
80%
90%
100%
2014 2015 2016 2017 2018
% NHS Bridges - Bridge Condition by Deck Area
Poor
Fair
Good
Poor Trend
Goal
Good Trend
Average 7.6% Poor and the Trend is +0.8%
55.1%
6.4% 6.5% 7.1%
39.4% 39.4% 37.8%
54.2% 54.1%
40.7% 40.8%
9.5% 8.4%
49.8% 50.8%
Average 39.6% Good and the Trend is -0.4%

TAMP June 2019
17
Bridge Management Objectives:
• Design and construct bridges to last with minimal maintenance. • Seal decks and expansion joints to protect bridges from road-salt laden
runoff. • Perform maintenance such as cleaning gutters and deck drains, removing
debris from bottom chords and bearing seats, and removing drift from piers.
• Invest in preservative treatments for bridges in good and fair condition to slow deterioration. Preservative treatments might include deck seals, joint seals, and repainting structural steel elements.
• Provide information to allow effective selection and design of future maintenance, preservation (i.e. deck treatments), rehabilitation, and reconstruction projects.
• Accurately estimate future conditions versus funding scenarios to evaluate current bridge funding strategies.
• Display analysis results in understandable format.
30%
40%
50%
60%
70%
80%
90%
100%
2014 2015 2016 2017 2018
% non-NHS Bridges - Bridge Condition by Deck Area
Poor
Fair
Good
Poor Trend
Good Trend
Average 9.6% Poor and the Trend is +0.9%
51.2%
8.2% 8.7% 8.5%
41.0% 40.3% 40.4%
50.8% 51.0% 45.5% 43.6%
43.3% 44.9%
11.2% 11.5%
Average 42.0% Good and the Trend is -1.1%

TAMP June 2019
18
Section 3 Performance Management
This section includes the DOT&PF process for assessing the asset conditions, and analyzing future conditions. DOT&PF, based on asset condition, calculates the funding needed by conducting Life Cycle Planning using several scenerios. Using a risk based approach, a Gap analysis is performed between desired state of good repair condition and available funding. The amount of funding available is evaluated by developing a financial plan in Section 4. Finally, these steps define investment strategies in Section 5 for meeting the demands of ensuring the successful management of transportation assets. This section also describes some of the implementation activities at DOT&PF.
Appendix E contains more details on the Gap analysis process required by 23 CFR 515.7(a).
3.1 Performance Gap Identification DOT&PF monitors and manages the performance of the NHS in regards to all seven Transportation Performance Management (TPM) National Goal areas: 1) safety, 2) infrastructure condition, 3) congestion reduction, 4) system reliability, 5) freight movement and economic vitality, 6) environmental sustainability, and 7) project delivery.
Each of these performance areas contribute to the development of DOT&PF’s capital program, in support of the agency’s LRTP. Several internal processes allow DOT&PF staff to manage delivery of the program to ensure the expected performance is delivered on time and within budget. These internal processes are connected to the TAMP development process to ensure that the TAMP is developed in full awareness of any gaps in the performance of NHS assets and that the gaps are considered in the development of TAMP investment strategies are included in more detail in Appendix E.
DOT&PF is meeting its pavement and bridge targets and expects to be able to continue to do so; however, there are trade-offs related to funding availability and remaining performance gaps both on and off the NHS. For example, as funding is focused on preservation and rehabilitation of pavement and bridges, it will be more difficult to fund modernization focused improvements that the public desires to see (both on and off the NHS). This gap is discussed in the LRTP 2036. Additionally, funding is needed for the non-NHS routes, Alaska Marine Highway System ferry purchases, high cost mobility improvement projects such as Sterling Highway: Sunrise to Skilak (aka Cooper Landing Bypass), Dalton Highway gravel road preservation, geo-technical assets, culverts and other highway related appurtenances, and other improvements that will not contribute toward meeting targets. DOT&PF considers alternatives and trade-offs when making funding decisions related to meeting targets and closing or minimizing these performance gaps.
The DOT&PF’s Long Range Transportation Plan called Let’s Keep Moving 2036 (updated in 2016) predicts increases in both population and travel demand that will lead to customer service expectations for new and expanded facilities. The risk analysis indicates that user expectations will increase over time, outpacing forecasts of financial resources, including assessments of what the public is willing to fund. As user expectations increase over time, DOT&PF faces a growing backlog of unfunded expenditures that are necessary to maintain and modernize the system to meet

TAMP June 2019
19
transportation needs; according to the LRTP, this trend has a high risk to the State and the public we serve.
A more urban population has expectations for pedestrian and bicycle facilities and other transportation amenities. These expectations would require unplanned maintenance of the system and higher operating expenditures. The LRTP 2036 describes additional needs and expectations for bicycle and pedestrian facilities. Currently, DOT&PF does not have an inventory program for pedestrian and bicycle facilities similar to the federally mandated Highway Performance Monitoring System for roads in Alaska. These assets are not included in this TAMP but are expected to be included in future publications.
In contrast, population in rural areas is predicted to continue a decline, and the cost of providing services to these areas to increase. Rural transportation projects have high mobilization and materials cost that are often disproportionate in relation to urban area projects. These communities also are in need of transportation in and out of their communities, which is typically by air or ferry. The Alaska Marine Highway System competes with other surface transportation projects for NHPP and STP funds.
3.2 Performance Gap Analysis “Performance Gap” is defined in 23 CFR 515.5 to mean both the gaps between the current asset condition and a state DOT’s target for asset condition, and the gaps in system performance effectiveness that are best addressed by improving the physical assets. The Gap analysis internal processes that were used to develop the TAMP will be used in the future and are further detailed in Appendix E. as well as condition.
To begin to identify performance gaps, the current state of assets was determined by reviewing historical data and trends. External factors that could affect the future state such as a change in volume of heavy truck traffic or safety concern were examined. Looking at historical bridge structural deficiency and pavement IRI revealed that our conditions are relatively stable or hover aroung the 10% structural deficient and 10% poor IRI.

TAMP June 2019
20
Future state needs and visioning will not only address condition targets but will also help identify performance gaps. Asset managers identify items that can improve performance while minimizing cost.
There are other federal performance measures that affect bridges and pavement. Safety targets were set in July 2017 for fatalities, fatality rate, major injuries and major injury rate and non-motorized fatalities. All modernization or expansion projects use safety data for funding prioritization. The Highway Safety Improvement Program (HSIP) for 2018 contains eight safety projects that will also improve pavement or bridge conditions. DOT&PF preservation projects also include a review of any safety deficiencies which can be corrected.
Alaska’s freight transportation system is performing reasonably well today. Alaska’s Freight Plan analysis identified the following performance risks that are expected to increase in coming years: congested truck routes and intermodal connectors; limited route and modal service choices, especially for rural communities; unreliability or unavailability of services due to seasonal effects, aging infrastructure, or other disruptions; overall cost of goods; and missing infrastructure links and facility improvements that are needed to serve new industries and population growth.
Measures for travel time and freight reliability represent a new data source for DOT&PF. State targets have been adopted, but DOT&PF is working to incorporate this data into project selection criteria.
There is a gap between customer expectations and DOT&PF’s ability to fund modernization type projects. This gap needs to be considered while asset management works to preserve the existing system. DOT&PF performs a Gap analysis by forecasting the infrastructure condition based on what the agency can afford while evaluating agency risks.
3.3 Life Cycle Planning: Analysis and Management The process for conducting life-cycle planning (LCP) required by 515.7(b) is decribed in Appendix F.
DOT&PF is just beginning to perform LCP. Staying with the TAM motto to “Start Simple, Grow Smart, and Show Continuous Improvement” our objectives are to:
• Move away from a “worst first” investment strategy and focus on cost effective preservation on the connected road system and, when prudent, for remote, rural communities;
• Determine the funds needed in each work type to meet the established targets of our desired state of good repair (SOGR);
• Use deterioration models to predict future conditions; • Reduce the cost of annual expenditures without negatively impacting asset
condition using management system outputs and professional judgment; • Educate internal and external stakeholders on why LCP is the most efficient use
of public funds and how budget cuts affect asset condition over time; • Once the management systems are fully functional, develop a plan for every
NHS bridge and road segment using age, condition and travel demand as the primary criteria.

TAMP June 2019
21
Implementation of the Bridge Management System (BMS) and the Pavement Management System (PMS) has begun, however, as of January 2019, neither the BMS nor the PMS were fully operational. In place of full-functioning PMS and BMS, DOT&PF opted to perform the LCP analysis using a spreadsheet tool provided by its TAMP consultants (Applied Pavement Technology [APTech]) in order to perform an LCP analysis compliant with the federal requirements for the June 2019 TAMP submission. The spreadsheet-based LCP tool is capable of analyzing various life cycle scenarios and simulating changes in network conditions associated with different levels of investment. The tool was specifically developed to help State DOT’s develop a 10-year TAMP LCP analysis in the absence of a fully operational PMS and/or BMS. Although the spreadsheet tool is not as sophisticated as a PMS or BMS and does not meet the requirements outlined in 23 CFR 515.17, it provides a temporary alternative to DOT&PF as the agency completes the implementation of its PMS and BMS.
Life cycle Management Needs: NHS Paved Roads The deterioration models showed that roadways in the Central and Southcoast regions deteriorated similarly whereas Northern Region roadways with permafrost conditions did not, creating two separate groupings. The deterioration also changed based on traffic volumes greater than 5,000 AADT. Each group was further divided between high volume (>5000 AADT) and low volume (<5000 AADT). The treatment costs for each work type are based on historical costs, in addition to current condition. Several Life cycle planning scenerios were run: 1) zero investment; 2) Invest to have no poor infrastructure in 10 years; 3) meeting a state of good repair. This last scenario was run several times testing different budget inputs and dividing those budgets between work type.

TAMP June 2019
22
The optimized scenario that meets the state of good repair or targets at the lowest cost is $87.98 million in FFY19. This is represented by the yellow line in the graph above -$75M Medium Budget. The increase from $75M to $87.98M was needed to include design costs. The funding is split between Northern Region and the combination of Central and Southcoast regions. That is because Northern Region has more mileage and roads in poor condition. Of the $87.98 million, $10.35 million is needed for preservation, $30.19 million for rehabilitation and $47.44 million for reconstruction. New Construction estimates do not come from these scenarios since there is no initial condition reported for those segments.

TAMP June 2019
23
Life cycle Management Needs: NHS Bridges The deterioration models showed differences between bridges based on the material type, therefore bridges were divided up into concrete, steel and timber. The treatment costs for each work types based on historical costs was used as well as the current condition for one statewide value. Several life cycle planning scenerios were run: 1) zero investment; 2) Invest to have no poor infrastructure in 10 years; 3) meeting a state of good repair. This last scenario was run several times testing different budget inputs and dividing those budgets between work type.

TAMP June 2019
24
The optimized scenario that meets the state of good repair or targets at the lowest cost is $47 million in FFY19. This preferred scenario is represented by the green $65M low budget. This funding scenario included funding for non NHS, which is not part of this TAMP. The total budget for NHS bridges is $47M including design costs. In this scenario, no funding would apply to the few NHS timber bridges since they in good condition. The funding is essentially split between concrete and steel bridges. Of the $47 million, $3.3 million is needed for preservation, $26.2 million for rehabilitation and $15.5 million for replacement. New construction estimates do not come from these scenarios since there is no initial condition reported for new bridges.
3.4 Asset Management Implementation DOT&PF implementation of Asset Management started with a FHWA Asset Management Readiness workshop in May 2010. DOT&PF then held a Kickoff Meeting in March 2013 and hired Cambridge Systematics to review the current state of data and systems. DOT&PF decided to start with Pavement and Bridges first—in the spirit of our motto: Start Simple, Grow Smart and Show Continuous Improvement. Appendix E details the Asset Management implementation process.
Asset Management staff used action items from the 2010 FHWA Report combined with a May 2013 Enterprise Work Plan to create an implementation plan. This implementation plan had several versions but none has been formally adopted by the Executive Team. DOT&PF included these action items into the October 1, 2016 Baseline Report to FHWA.
A team of multi-division staff assisted in developing an RFP to procure a contractor for Pavement and Maintenance Management. DOT&PF selected AgileAssets for the contract, which is managed by Asset Management staff with a technical co-project manager from Information Systems and Services Division. The staff lead for pavement and maintenance is the Statewide Pavement Manager and a Northern Region Maintenance and Operations District Superintendent respectively. The “go live” date for the Pavement Management system is tentatively set for October 2019. DOT&PF hired APTech to develop deterioration and quantitative modeling to be input into the AgileAsset Pavement Management System. Headquarters and regional staff provided input into this model. DOT&PF will start using the testing version to develop 2018 pavement recommendations if there are additional delays in the software launch.
Pavement Management staff are updating the new pavement management system with project cost data to assist in the life cycle planning. This will be used to help program the most cost-effective projects. The process is described in a DOT&PF Policy & Procedure (P&P) on pavement management system use and selecting maintenance, preservation and rehabilitation projects.
Bridge Management staff are updating their Bridge Management System version that complies with federal requirements. The system will contain bridge project costs and deterioration modeling to assist in the life cycle planning. This will be used to help program the most cost effective projects. The process is described in a P&P for bridge management system use and selecting maintenance, preservation and rehabilitation projects.

TAMP June 2019
25
The pavement and the bridge management systems will provide data to track condition and performance of assets against their respective targets and national goals. Both systems will produce the best available data as required by 23 CFR 515.7(g).
The Division of Program Development & Statewide Planning coordinated with the MPOs to evaluate performance targets used for NHS pavements and bridges within the MPOs and incorporate these targets into MPO transportation plans. Planning and Program Development staff have also worked on a process for prioritization of projects for the NHS system.
3.5 Risk Management Risk is the positive or negative effects of uncertainty or variability upon agency objectives. Risk management is the processes and framework for identifying, analyzing, evaluation and addressing risks to the assets and system performance. Using the processes developed in Appendix G as required by 23 CFR 515.7(c), DOT&PF must identify, assess, evaluate and prioritize the asset management risks and summarize how DOT&PF will deal with these risks or opportunities. DOT&PF has established a Risk Management Team to reaffirm agency risks and to develop strategies to mitigate risks. The result of the process described in Appendix G came up with risks that are summarized as follows.
Funding. Funding increase is an opportunity but a decrease is a risk. Decrease in funding would force some projects to be constructed later, delaying the project benefit to the traveling public and Alaska’s economy. This also includes adding more assets than M&O resources can maintain.
Data and IT Systems. Information systems have been difficult to implement. Getting the information to Department staff and the public is labor intensive. Data Governance and information system review will help to make sure no systems are redundant.
Seismic Activity. Alaska is a highly seismic state. The effects of the November 2018 earthquake are still being evaluated. We expect some pavement damage to show an increase in IRI and cracking for the 2019 collection season. Alaska has a seismic retrofit program to mitigate this risk. Even with the program, eliminating this risk is not feasible.
Delivery of the Program. Lack of trained Department staff and other resources can put the delivery of the program at risk. Succession planning and knowledge management are mitigation strategies.
Resilent Infrastructure. Alaska has other natural risks besides seismic events. Permafrost is thawing in many areas of the state. Landslides and rockfall events happen throughout the state. Extreme weather events are increasingly producing flooding, erosion, and avalanches that cause infrastructure damage.
Section 4 Financial Plan
The following financial plan provides an overview of the resources required to meet the needs of pavements and bridges on the NHS, and the resources available to meet those needs. The plan considers:

TAMP June 2019
26
• Funding needs to adequately manage NHS pavements and bridges.
• Funding availablity to address pavement and bridge conditions.
• The quantity and implications of gaps between needed and available funding levels.
• The value of Alaska DOT&PF pavement and bridge assets on the NHS.
The financial plan provides context for identifying and comparing potential investment strategies for the TAMP period, which are described in Section 5. The processes that DOT&PF followed to develop this financial plan are described in greater detail in Appendix H.
4.1 Current and Future Funding Needs As described in Section 3, DOT&PF uses condition and cost data on pavements and bridges to establish long-term strategies for maintaining and improving asset conditions at the lowest practicable costs. These analyses allow the Department to assess the long-term funding needs. The following subsections provide an overview of the level of resources needed over the next 10 years to achieve the Department’s pavement and bridge condition targets and desired state of good repair to deliver the expected system performance, while managing other infrastructure needs and accounting for critical risks.
The connection between system performance and asset condition is discussed in further detail in Section 3.3. Critical risks are explained in Section 3.5, Risk Management, and Appendix G, Risk Management Analysis.
4.1.1 Pavement and Bridge Needs The following graphs shows the average annual funding needed to maintain pavement and bridge conditions on the NHS for the next 10 years. This funding need assumes the Department will continue to apply the life-cycle strategies described in Section 3.3.
$87.98M $89.74M $91.53M $93.37M $95.23M
$97.14M
$99.08M
$101.06
$103.08
$105.14

TAMP June 2019
27
4.1.2 Addressing Other Needs
Pavements and bridges on the NHS are the focus of this TAMP but are not the only assets that the Department manages with highway funding. Likewise, pavement and bridge conditions are not the only factors that contribute to safe and efficient highway operations. The following sections describe how other assets, risks, and overall system performance are considered in establishing funding needs. The balance of investments to achieve the Department’s various objectives are described in further detail in Section 5, which provides information on the Department’s actions to optimize outcomes across asset classes and programs through tradeoff analysis.
4.1.2.1 Other Assets In addition to pavements and bridges, the Department manages many other infrastructure assets that are necessary to keep the highway system safe and operable. The agency also manages non-highway assets. While aviation and transit assets have separate dedicated funding streams, ferries rely heavily on highway funding, primarily NHPP funding. Funding needed to address other infrastructure assets are identified from review of the STIP and highway maintenance budgets. These funds are subtracted from the revenue sources described in Section 4.2 before comparing the funding needs for pavements and bridges to available revenue.
4.1.2.2 Risk Section 3.5 and Appendix G provide details on critical risks that must be managed to minimize threats to system performance and maximize the Department’s ability to take advantage of future opportunities. Addressing some of these risks requires investing in ways that are counter to the life-cycle strategies described in Section 3.3, Lifecycle Planning. An example of this is the Department investing in retrofitting of bridges and other facilities that may be in good condition but are not adequately resilient to damage from potential seismic events. The risk of serious or catastrophic damage from the possible seismic event may be more important than maintaining or improving the condition of other assets.
$45.00M $45.90M $46.82M $47.75M $48.71M $49.68M $50.68M $51.69M $52.72M $53.78M

TAMP June 2019
28
4.1.2.3 System Performance DOT&PF monitors and manages the performance of the NHS in regard to all seven Transportation Performance Management (TPM) National Goal areas outlined in Section 3.1. Each of these performance areas requires investment through capital projects and maintenance activities. The costs of these actions are accounted for by review of the STIP and maintenance budgets. These funds are subtracted from the revenue sources described in Section 4.2 before comparing the funding needs for pavements and bridges to available revenue.
4.2 Funding Asset Management Transportation funding in Alaska is a combination of federal funds, state General Funds, and Alaska Marine Highway System revenues. Of these, the Federal Highway Program funds represent the majority of the available funds for managing pavements and bridges on the NHS. State funds are used as federal match money—which usually constitutes 10 percent of the cost of capital projects—and to support maintenance activities.
4.2.1 Federal Funds The FAST Act provides Alaska with a stable source of funding for transportation infrastructure for the next four years. Table 4.0 shows the estimated funding available for the next 10 years. FAST Act includes only six years of federal funding levels from federal fiscal years 2015 to 2020. DOT&PF used a 2.5% growth rate to estimate federal funding past federal fiscal year 2020.
NHPP NHPP Freight NHPP Exempt Total estimated NHPP available
FFY19 $269,590,935 $13,924,095 $8,365,433 $291,880,463
FFY20 $274,982,753 $14,202,577 $8,532,742 $297,718,073
FFY21 $280,482,409 $14,486,629 $8,703,397 $303,672,434
FFY22 $286,092,057 $14,776,362 $8,877,465 $309,745,883
FFY23 $291,813,898 $15,071,889 $9,055,014 $315,940,800
FFY24 $297,650,176 $15,373,327 $9,236,114 $322,259,616
FFY25 $303,603,179 $15,680,793 $9,420,836 $328,704,809
FFY26 $309,675,243 $15,994,409 $9,609,253 $335,278,905
FFY27 $315,868,748 $16,314,297 $9,801,438 $341,984,483
FFY28 $322,186,123 $16,640,583 $9,997,467 $348,824,173
Table 4.0 Projected Federal Revenue

TAMP June 2019
29
4.2.2 State Funds State funding, relevant to the TAMP, is estimated as the level of funding needed to provide matching funds for the federal funds shown in table 4.1 and the amount in the annual highway maintenance and operations budget.
The highway maintenance and operations budget is expected to remain constant, based on historical performance at a level of $6.7 million per year. This funding is used to manage the routine maintenance and operations of the state highway system and does not improve asset conditions but is required to keep assets in a state of good repair.
4.3 Funding Gaps The DOT&PF is expecting over $3.3 billion in NHPP federal funding for NHS assets over the next 10 years. As shown in figure 4.3, the anticipated levels of funding are lower than those required to meet all identified needs described in Section 4.1. Therefore, developing future capital programs will require making some difficult decisions. Table 4.4 shows the needed level of investment to meet the targets and state of good repair. This information was used to develop the investment strategies described in Section 5.

TAMP June 2019
30
Table 4.1 Funds Available for Managing NHS Assets
Table 4.2 Total Estimated Needs of NHS Assets
Table 4.3 Projected Funding Gap for NHS Assets
Table 4.4 Detailed Needs of NHS Pavements and Bridges to Attain State of Good Repair/Targets by Work Type
NHPP Financial Plan for Transportation Asset Management Plan (TAMP)2019 2020 2021 2022 2023 2024 2025 2026 2027 2028
NHPP 276,582,832 282,114,489 287,756,778 293,511,914 299,382,152 305,369,795 311,477,191 317,706,735 324,060,870 330,542,087 NHPP Freight 16,837,575 17,174,327 17,517,813 17,868,169 18,225,533 18,590,043 18,961,844 19,341,081 19,727,903 20,122,461 NHPP Exempt 8,379,605 8,547,197 8,718,141 8,892,504 9,070,354 9,251,761 9,436,796 9,625,532 9,818,043 10,014,404
NHPP Total Apportionment 301,800,012 307,836,012 313,992,732 320,272,587 326,678,039 333,211,600 339,875,832 346,673,348 353,606,815 360,678,952 State Matching Funds 9.03%* 29,957,724 30,556,878 31,168,016 31,791,376 32,427,203 33,075,747 33,737,262 34,412,008 35,100,248 35,802,253
Contributing Federal Funds - EMRK, SFF26,584,587 17,850,063
Contributing State Funds - OSF, BOND 10,000,000 22,000,000 Total funds available to NHS 368,342,322 378,242,953 345,160,748 352,063,963 359,105,242 366,287,347 373,613,094 381,085,356 388,707,063 396,481,204
*ASSUMPTION: matching funds 9.03% is most common and used for calculations here. *ASSUMPTION: Over a four year period, 100% of NHPP funds will be available regardless of obligation limitation because projects on the NHS are high priority (other funding types would be selected instead for lapsing) and therefore for the TAMP analysis 100% of NHPP funds will be assumed to be available per year. This is a generous assumption because doesn't account for sequestration or rescission.
NHPP Only 2019 2020 2021 2022 2023 2024 2025 2026 2027 2028Reconstruction 165,201,060 221,420,000 226,040,000 334,275,590 281,900,000 184,400,000 121,100,000 36,000,000 116,000,000 25,000,000 System Preservation 91,050,000 110,110,000 93,155,000 257,345,000 178,125,000 94,425,000 75,425,000 75,425,000 75,425,000 75,425,000 Bridge Rehabilitation 5,400,000 5,250,000 5,410,000 16,490,880 67,700,000 5,000,000 5,000,000 5,000,000 5,000,000 5,000,000 Bridge Replacement 2,948,527 200,000 36,820,000 31,000,000 10,750,000 50,000,000 - - - - New Bridge Access - - - - - - - - - - Safety - - - - - - - - - - New Construction 76,641,200 100,198,000 117,400,000 178,800,000 99,500,000 108,100,000 62,500,000 23,000,000 57,000,000 - Planning 7,990,000 8,840,000 6,840,000 6,440,000 5,940,000 5,940,000 5,940,000 5,940,000 5,940,000 5,940,000 Ferry Boats - 238,144,450 - - - - - - - - ITS 4,720,000 4,520,000 4,270,000 4,270,000 3,640,000 3,010,000 2,380,000 2,550,000 3,120,000 3,720,000 Other 4,150,000 4,150,000 4,150,000 4,150,000 4,150,000 4,150,000 4,150,000 4,150,000 4,150,000 4,150,000 Total (sum check) 358,100,787 692,832,450 494,085,000 832,771,470 651,705,000 455,025,000 276,495,000 152,065,000 266,635,000 119,235,000
SUMMARY NHPP 2019 2020 2021 2022 2023 2024 2025 2026 2027 2028Available 368,342,322 378,242,953 345,160,748 352,063,963 359,105,242 366,287,347 373,613,094 381,085,356 388,707,063 396,481,204
Programmed* 358,100,787 692,832,450 494,085,000 832,771,470 651,705,000 455,025,000 276,495,000 152,065,000 266,635,000 119,235,000 Gap 10,241,535 (314,589,497) (148,924,252) (480,707,507) (292,599,758) (88,737,653) 97,118,094 229,020,356 122,072,063 277,246,204

TAMP June 2019
31
4.4 Value of Assets DOT&PF uses straight-line depreciation as the standard method for valuation of infrastructure assets. Many state transportation boards use the Government Accounting Standards Board 34 modified approach, but the Alaska Department of Administration prescribed the straight-line depreciation method for our use.
DOT&PF financial statements dated June 30, 2018 show infrastructure assets valued at $8,948,803,704. The book value after depreciation is $3,326,338,727. The infrastructure assets can be broken down as follows:
• Airports Runways $2,091,567,333; • Bridges $463,294,617; • Marine Structures $120,839,034; and • Roadways $6,273,102,720.

TAMP May 2019
32
Section 5 Asset Management Investment Strategies
This section describes the investment strategies needed to achieve and sustain a state of good repair of NHS bridges and pavements based on life-cycle planning. A state of good repair correlates to preserving the assets and meeting the condition and performance targets and national goals described in Section 3.
The investment strategies described in this chapter will allow Alaska DOT&PF to achive the diesired state of good repair for NHS pavement and bridge assets. These investment strategies were developed using the preferred life-cycle strategy identified in Section 3. Performance Management and the available funding identified in Section 4 Financial Plan. Programming projects that deliver investments within the work types as described in the selected investment strategies will ensure timely treatment is applied at the appropriate level of service to minimize the cost of that asset over its life cycle.
The STIP will be the primary mechanism for programming and tracking investmentments in NHS pavements and bridges. The STIP will identify the asset class and work type of each project to allow each investment to be correlated to the appropriate investment strategy.
The following subsections provide details on the investment plan for NHS pavements and bridges from state fiscal years 2019 to 2028.
5.1 Supporting Long-Term Objectives The policies and goals laid out in LRTP 2036 and the life-cycle planning, risk management, and financial planning processes described in this TAMP document contribute to the investment strategies used to achieve national goals, statewide targets, and a state of good repair.
• Continue to invest at historical funding levels: As described in earlier sections of this document, Alaska’s NHS routes currently meet national goals and statewide targets. This suggests that historical investments have been sufficient and that investment of similar funding levels will continue to keep Alaska’s NHS system in a state of good repair. The Department may have been overinvesting since we are predicting the condition to move closer to Alaska targets. Additionally, the Department will continue to monitor whether this funding level is sufficient or needs adjusting.
• Implement LRTP 2036 goals and policies: The LRTP includes eight policy areas for which investment of limited resources is needed. The Department’s investment strategies will consider all of the following policy areas with an understanding that available funding resources will need to be balanced to target an appropriate level of investment in each area.
• Select projects using a data-informed approach: Asset management systems (such as Pavement and Bridge Management Systems) and processes will primarily be used to select preservation-focused projects, with the intent of achieving the system preservation policies and actions included in the LRTP 2036, as well as the pavement and bridge condition performance measure areas. A more nuanced approach will be used to select projects on the NHS that are intended to achieve

TAMP June 2019
33
the remaining policy areas and actions and performance measure areas, such as modernization and safety. For the 2018-21 STIP, a data-informed approach was used to guide decisions for programming NHS projects. This process is outlined in Appendix I. This process will be further refined and may include multiple sets of criteria and standards related to the various policy areas and/or national performance measures for which a project will primarily contribute.
• Show how projects contribute to performance management in the published STIP document: Project work types (system preservation, reconstruction, etc.) included in the STIP document will also aid in linking programmed projects to both performance management goals and LRTP policy areas.
Appendix I details the process used to develop this investment plan as required by 23 CFR 515.7(e) and (f).
5.2 Investment Plan for 2019–2028 The following investment plan identifies the annual level of investment expected for pavements and bridges on the NHS. These investment levels reflect decisions made according to the life-cycle strategies described in Section 3.3, in consideration of overall system performance and risk, as described in this financial plan.

TAMP May 2019
34
Table 5-1 Selected Investment Strategy for NHS Pavements and Bridges

TAMP May 2019
35
Section 6 Improvement Plan
In 2013, DOT&PF was described as being in the “awakening” stage of Asset Management maturity (AASHTO TAM Guide, 2011), where a basic set of capabilities are in place for a few types of assets, but are not yet integrated into Department-wide decisionmaking. DOT&PF is working toward advancing to the “structured” stage for both bridge and pavement assets. The following section describes activities that DOT&PF is pursuing and hope to have incorporated in a later TAMP.
6.1 Cross Asset Allocation There are generally two major types of asset management functions performed by a state DOT; asset specific or cross asset, i.e., pertaining to two or more assets. DOT&PF is working on completing our asset specific process by establishing a new Pavement Management System and enhancing our current Bridge Management System. The enhanced Bridge Management System will provide modeling and forecasting capabilities instead of solely an inventory and condition database. After these systems are completed and the business processes are developed, we will develop multiple asset evaluation processes and then cross asset evaluation. All these analyses support overall asset management decisions that lead to desired outcomes, promote wise investment of resources, and promote credibility and transparency of investment decisions. The following types of asset management decisions benefit from cross asset processes:
• Programming – Conducting tradeoff analysis in order to allocate funds to program areas, and establish performance targets
• Strategy – Evaluating activities within asset groups (e.g. maintenance)
• Project – Prioritizing assets and/or projects
• Project Development – Designing projects and evaluating project alternatives (e.g., conducting life cycle cost analysis)
• Policy – Evaluating TAM policy issues (e.g., understanding the implications of increasing truck weight limits)
The research project for the TAM Information System identified several specific data queries that would help with asset management decisions. The focus on cross asset processes is intended to provide the ability to use trusted data and analysis tools to quickly run queries and to use the results to make informed decisions (TAM Information System Task 9 page1-7).
6.2 Single Asset Analysis and Future Improvements DOT&PF is developing a Pavement Management System. The Pavement and Maintenance Management Systems estimated “go live” date is October 2019 and March 2020 respectively. Maintenance staff maintain all DOT&PF maintained roadways in support of asset management. Because the pavement deterioration models include the

TAMP June 2019
36
effects of the surface maintenance, it is considered a critical component of a pavement’s life-cycle costs. Maintenance work is shared between contractors and in-house staff and includes crack sealing, patching potholes, and preservation activites such as chip seals. Without this work, the pavement deterioration models would predict a short life expectancy; therefore it is critical to maintain or increase the current level of effort in the maintenance budget. Both systems will make this information sharing easier. DOT&PF uses AASHTOWare Bridge Management System (AASHTO BrM previously know as PONTIS) for their inventory and inspection results. The previous version of the Bridge Management System did not perform bridge deterioration modeling. The newest version the Department is adopting will have this capability. We will be able to compare actual bridge costs to bridge condition to perform life cycle analysis. In the meantime we have used the modeling performed by the LRTP and performed some in-house analysis. Bridge asset management, national goals, and state-established targets are required on the NHS only, but again we still need to keep non-NHS bridges at a condition that our customers expect. Future improvements include:
• Strengthening information systems and improving data
o The Transportation Asset Management Information System (TAMIS) integrates data into established methods for making asset management decisions. Information from 24 different data systems are included in the TAMIS, which will help to identify gaps. TAMIS is a collection of systems and business processes that support decisionmaking. ESRI Road and Highways is the system that can spatially integrate asset data
o The AASHTOWARE software package enables data management for cost estimation, proposal preparation, letting bids, construction and material management. AASHTOWARE will help to standardize project management processes
• Continuing to improve system maturity by linking the capital investments back to the condition data for improved calculation of asset life cycle cost
• Evaluating adding additional assets. The following are staff recommended assets to include next in our program upon executive leadership approval.
o Geotechnical Assets o Culverts less than 20’ and other drainage structures o Tunnels o American Disability Act compliance infrastructure inventories
A-1
Appendix A TAM Leadership Structure
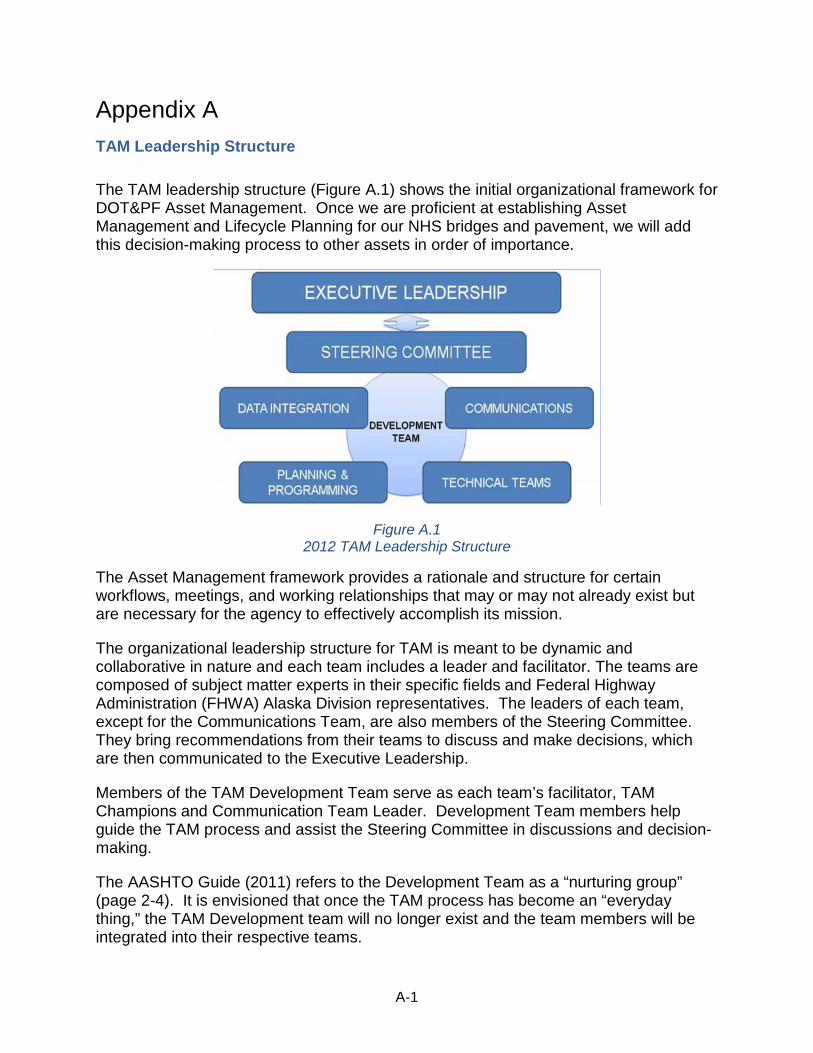
The TAM leadership structure (Figure A.1) shows the initial organizational framework for DOT&PF Asset Management. Once we are proficient at establishing Asset Management and Lifecycle Planning for our NHS bridges and pavement, we will add this decision-making process to other assets in order of importance.
Figure A.1 2012 TAM Leadership Structure
The Asset Management framework provides a rationale and structure for certain workflows, meetings, and working relationships that may or may not already exist but are necessary for the agency to effectively accomplish its mission.
The organizational leadership structure for TAM is meant to be dynamic and collaborative in nature and each team includes a leader and facilitator. The teams are composed of subject matter experts in their specific fields and Federal Highway Administration (FHWA) Alaska Division representatives. The leaders of each team, except for the Communications Team, are also members of the Steering Committee. They bring recommendations from their teams to discuss and make decisions, which are then communicated to the Executive Leadership.
Members of the TAM Development Team serve as each team’s facilitator, TAM Champions and Communication Team Leader. Development Team members help guide the TAM process and assist the Steering Committee in discussions and decision-making.
The AASHTO Guide (2011) refers to the Development Team as a “nurturing group” (page 2-4). It is envisioned that once the TAM process has become an “everyday thing,” the TAM Development team will no longer exist and the team members will be integrated into their respective teams.

A-2
TAM Process
In 2013, the Department’s Transportation Asset Management maturity level was characterized as “awakening” (TAM Guide, 2011), which means that a basic set of capabilities were in place for a few types of assets, but not yet integrated into Department-level decision-making.
Through the process of drafting our TAM Plan we have moved to a maturity level characterized as “structured,” where there is a Department-wide shared understanding, motivation, and coordination in developing processes and tools.
Figure A.2 shows the continuous collaborative improvement process that is a strategic, integrated, and systematic approach to Asset Management.
Figure A.2 TAM Process
TAM Policy Goals & Objectives: These are clearly defined, based on the DOT&PF’s Mission and Strategic Plan.
TAM Data Collection: DOT&PF identifies information and data collection needs and communicates that information with the Data Integration team.
TAM Planning & Programming: DOT&PF optimizes planning and programming processes to improve program delivery and identify gaps and establish investment strategies through a financial plan.
TAM Program Delivery: Measurable performance-based standards and forecasting processes are developed.

A-3
TAM Performance & Progress: DOT&PF monitors performance and reports on progress toward our goals and objectives.
TAMP Development within Alaska DOT&PF
The TAM teams worked together to provide comments on FHWA rulemaking for performance measures and TAMP. The two MPOs were involved as members of the Planning and Programming Team. The review included only the highway mode. The Safety Team was involved in the TAM review. The planning and the financial office for capital programs are in the same office. The Chief Financial Officer has been involved throughout the TAMP drafting.
For the April 2018 TAMP, the TAM Coordinator, with input for the TAM teams, provided the team members with an initial draft TAMP in April 2017. Five workshops were held from April to May 2017 to review the draft TAMP and solicit comments. The TAM Coordinator, Alaska FHWA Division office, two DOT&PF planning staff and MPOs attended training in Phoenix in September 2017.
In November 2017, FHWA released additional guidance on financial plans, risk management and life cycle planning. In January 2018 the TAM Coordinator issued Draft 2 TAMP with Appendices A-I, using the training and new guidance.
The TAM Coordinator held another series of outreach meetings and coordinated comments on Draft 2 with each team facilitator for inclusion in the final report, with a deadline set for February 28, 2018. The TAM Coordinator received comments for the FHWA Division Office with assistance from the FHWA Resource Center.
For the June 2019 TAMP, Applied Pavement Technology (APTech) was hired for research and support. APTech reviewed the Best Practices of other states to help identify practices the Department could adopt for life cycle planning, risk management, gap analysis, financial plans, and cross asset trade-offs.
APTech documented the use of our TAM systems (Agile Assets for pavement and AASHTOWare Bridge Management BRM) for life cycle planning (LCP) analysis and trained staff on how to utilize the process. A Lifecycle Planning tool was created to generate planning Scenarios.
A Risk Management/Financial Plan Training and Workshop was held in November 2018 where APTech helped DOT&PF identify, analyze, evaluate, and mitigate risks to TAM objectives and trained staff on financial plan analysis required under the April 2018 TAMP.
Lifecycle Planning was completed by the asset managers and communicated to the teams March and April, 2019 webinars. The Cross Asset Allocation meeting was also held in April 2019 where other system needs were identified.
A-4
The TAM Coordinator prepared a final draft TAMP and Appendices with the documentation to show TAMP implementation and distributed it to the teams for review and comment. On May 1, Teams participated in a dress rehearsal executive briefing.
The TAM Coordinator and the APTech consultant gave an executive briefing on May 15, 2019 where executive comments were received and addressed. A final version of the TAMP and implementation documentation was signed and approved by the Commissioner and then send the FHWA Division office.
B-1
Appendix B Summary of Transportation Performance Management
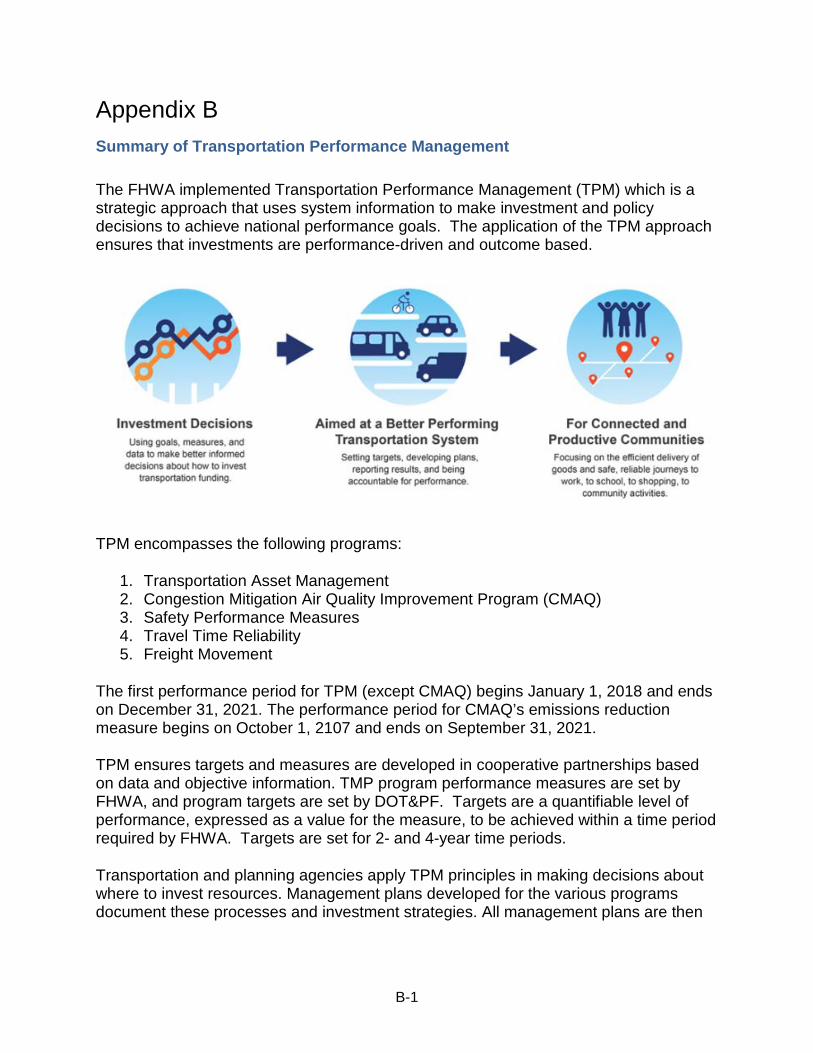
The FHWA implemented Transportation Performance Management (TPM) which is a strategic approach that uses system information to make investment and policy decisions to achieve national performance goals. The application of the TPM approach ensures that investments are performance-driven and outcome based.
TPM encompasses the following programs:
1. Transportation Asset Management 2. Congestion Mitigation Air Quality Improvement Program (CMAQ) 3. Safety Performance Measures 4. Travel Time Reliability 5. Freight Movement
The first performance period for TPM (except CMAQ) begins January 1, 2018 and ends on December 31, 2021. The performance period for CMAQ’s emissions reduction measure begins on October 1, 2107 and ends on September 31, 2021.
TPM ensures targets and measures are developed in cooperative partnerships based on data and objective information. TMP program performance measures are set by FHWA, and program targets are set by DOT&PF. Targets are a quantifiable level of performance, expressed as a value for the measure, to be achieved within a time period required by FHWA. Targets are set for 2- and 4-year time periods.
Transportation and planning agencies apply TPM principles in making decisions about where to invest resources. Management plans developed for the various programs document these processes and investment strategies. All management plans are then

B-2
used in the performance-based planning and programming process to make investment trade-off decisions.
Asset Management – Bridge and Pavement Condition Asset Management is the application of the TPM approach to manage the condition of the infrastructure assets that are needed to provide mobility and safety on the nation’s transportation system.
Asset management plans are the framework for developing the investment strategies to address infrastructure condition targets, as well as addressing risk and managing assets for their whole life at the lowest practicable cost.
See Section 2 and Section 3 of the TAMP for performance measures and targets for pavements and bridges.
The recommendations for pavement and bridge funding levels can be found in Section 4 Financial Plan.
Congestion Mitigation and Air Quality Improvement Program (CMAQ) The CMAQ program provides a flexible funding source to the State for projects and programs to help meet the requirements of the Clean Air Act. The goal for these projects is to reduce congestion and improve air quality for areas that do not meet the National Ambient Air Quality Standards for ozone, carbon monoxide or particulate matter (nonattainment areas) and for former nonattainment areas that are not in compliance (maintenance areas).
CMAQ targets were set in May 15, 2018:
The following table includes CMAQ STIP funding for projects around the state for the next four years:
FFY19 FFY20 FFY21 After 2021 $19.1 million $22.2 million $17.8 million $37.8 million

B-3
Safety Performance Measures The Safety Performance Measures are established for the Highway Safety Improvement Program (HSIP) and are used to assess fatalities and serious injuries on all public roads.
The Safety PM Final Rule establishes five performance measures as the five-year rolling averages to include:
1. Number of Fatalities 2. Rate of Fatalities per 100 million Vehicle Miles Traveled (VMT) 3. Number of Serious Injuries 4. Rate of Serious Injuries per 100 million VMT 5. Number of Non-motorized Fatalities and Non-motorized Serious Injuries
The State of Alaska has a vision of zero fatalities and serious injuries but is required by federal law to set “targets” for these metrics, or put another way, a reasonable forecast of likely accident rates. The performance measures are included in the Highway Safety Improvement Plan (HSIP), Highway Safety Plan (HSP) or both.
Targets are set annually by June 30 for the following calendar year.
Metrics 2020 2019 2018 HSIP HSP Date target set 3/1/19 3/14/18 3/9/17
Fatalities ≤ 80 ≤ 75 ≤ 75 √ √ Fatality Rate ≤1.5 ≤1.5 ≤1.5 √ √ Serious Injuries ≤ 400 ≤ 350 ≤ 375 √ √ Serious Injury Rate ≤7.5 ≤6.5 ≤7.5 √ Non-motorized fatalities and serious injuries (combined)
≤70 ≤55 ≤55 √
The following table includes Safety STIP from Amendment 2 approved January 30, 2109. This is the level of funding for projects around the state for the next four years:
FFY19 FFY20 FFY21 After 2021 $107.9 million $44.7 million $44.7 million $134.4 million
Travel Time Reliability Travel Time Reliability measures the extent of unexpected delay. A formal definition for Travel Time Reliability is: the consistency or dependability in travel times, as measured from day-to-day and/or across different times of the day.
Travel Time Reliability is significant to many transportation system users, whether they are vehicle drivers, transit riders, freight shippers, or even air travelers. Personal and business travelers value reliability because it allows them to make better use of their own time. Shippers and freight carriers require predictable travel times to remain competitive. Reliability is a valuable service that can be provided on privately-financed

B-4
or privately operated highways. Because reliability is so important for transportation system users, transportation planners and decision-makers should consider Travel Time Reliability a key performance measure.
Level of Travel Time Reliability (LOTTR)1 is defined as the ratio of the 80th percentile travel time of a reporting segment to a "normal" travel time (50th percentile), using data from the FHWA National Performance Management Research Data Set (NPMRDS) or equivalent. Data is collected in 15-minute increments during all time periods other than 8 p.m.-6 a.m. local time. The measures are the percent of person-miles traveled on the relevant NHS areas that are reliable.
LOTTR targets were set in May 2018:
LOTTR performance measures are a federal requirement but do not drive Alaska projects. Alaska projects need capacity improvements from areas with a growing population. Reconstruction and other projects support capacity improvements projects.
Freight Movement The FAST Act establishes a new National Highway Freight Program to improve the efficient movement of freight on the National Highway Freight Network (NHFN) and support several goals, including—
• investing in infrastructure and operational improvements that strengthen economic competitiveness, reduce congestion, reduce the cost of freight transportation, improve reliability, and increase productivity;
• improving the safety, security, efficiency, and resiliency of freight transportation in rural and urban areas;
• improving the state of good repair of the NHFN; • using innovation and advanced technology to improve NHFN safety, efficiency,
and reliability; • improving the efficiency and productivity of the NHFN; • improving State flexibility to support multi-State corridor planning and address
highway freight connectivity; and 1 https://www.fhwa.dot.gov/tpm/faq.cfm#trav

B-5
• reducing the environmental impacts of freight movement on the NHFN.
Freight movement is assessed by the Truck Travel Time Reliability (TTTR) Index. Reporting is divided into five periods: morning peak (6-10 a.m.), midday (10 a.m.-4 p.m.) and afternoon peak (4-8 p.m.) Mondays through Fridays; weekends (6 a.m.-8 p.m.); and overnights for all days (8 p.m.-6 a.m.). The TTTR ratio will be generated by dividing the 95th percentile time by the normal time (50th percentile) for each segment. Then, the TTTR Index will be generated by multiplying each segment's largest ratio of the five periods by its length, then dividing the sum of all length-weighted segments by the total length of Interstate.
TTTR targets were set in May 2018:
The following table includes TTTR STIP funding for projects around the state for the next four years which were outlined in the Implementation Guidance:
FFY19 FFY20 FFY21 After 2021 $31.2 million $72.9 million $70.0 million $506.4 million

C-1
Appendix C: Asset Overview – Pavement
The entire 1,159.7 miles of Interstate is owned and operated by Alaska DOT&PF. Condition data is collected annually by a third party contractor. Of the 924.943 miles of non-Interstate NHS, 22.6 miles are owned and operated by entities other than Alaska DOT&PF. Over 19.1 miles of the 22.6 miles are owned and operated by Municipality of Anchorage (MOA). The rest (3.5 miles) are intermodal links between the state system and a ferry, port or airport. Non Interstate NHS is collected at least once every 2 years, but in practice most segments are collected annually by a contractor. Alaska is unique to the rest of the United States because some of the Alaska non-Interstate NHS is unpaved.
NHS Inventory Table C.1 below includes the centerline mileage inventory of Interstate and non-Interstate National Highway System (NHS) roads in the State. The following summarizes Alaska’s Interstate and non-Interstate NHS in centerline miles collected in summer 2018.
All in centerline lines Total Alaska
DOT&PF Municipality
of Anchorage Other
entities Interstate 1159.7 1159.7 0 0 Non Interstate NHS (paved) 924.9 903.8 18.7 3.4
Non Interstate NHS (unpaved) 262.8 262.8 0 0
Table C.1 Centerline Miles Total
Alaska DOT&PF changed data collection contractors in 2018, and now uses Fugro to collect rut, roughness and cracking data on all of our paved roads.
DOT&PF collects pavement condition and other federally required Highway Performance Monitoring System (HPMS) data elements so no cooperation is needed to exchange data with other entities for the NHS. DOT&PF nominate projects for inclusion in the State Transportation Improvement Plan as needed. We are confident that this small number of non-DOT&PF owned NHS centerline mileage will not affect the state’s overall condition.
The spreadsheet below lists the NHS owned/operated by other entities beside DOT&PF as of April 30 2019.

C-2
Federal Performance Measure The Federal performance measure uses the following metrics for asphalt pavements: International Roughness Index (IRI); fatigue cracking; and rutting.
As required by FHWA, DOT&PF collects pavement condition data on NHS paved roads annually for rutting and roughness and for longitudinal, transverse, and fatigue cracking.
Alaska has collected many years of rutting and roughness data but began collecting automated full extent cracking data beginning in 2014. The starting point will be to use the federal overall pavement rating to classify pavement condition until Alaska develops its own index that better represents Alaska pavement conditions and treatment thresholds.
FHWA final rules allow the use of Present Serviceability Rating (PSR) in lieu of IRI for roads with speed limits less than 40 mph. DOT&PF has used PSR for HPMS reporting only for a few
remote locations where automated data collection equipment cannot be transported. DOT&PF does not intend to use PSR on NHS routes.
Tables C.2 and C.3 below lists condition thresholds found in the final federal rulemaking. FHWA final rules allow the use of PSR for roads less than 40 mph; this calculation does not include cracking. DOT&PF is not using Pavement Serviceability at this time but may look into it for the future.

C-3
Pavement’s Three Metrics Condition IRI %Crack Rut (in)
Good <95 <5% <0.2 Fair 95-170 5-20% 0.2-0.4 Poor >170 >20% 0.40
Table C.2 Pavement’s Three Metrics
Section Overall Asphalt Condition Overall 3 Metric Ratings
(IRI, Cracking, Rutting) Good All three metrics are good Poor 2 or more metrics rated poor Fair All other combinations
Table C.3 Section Overall Asphalt Condition
Pavement Condition Using All Three Metrics In 2018, Alaska had 1,160 centerline miles of Interstate, all paved. Figure C.4 below shows Alaska’s Interstate Overall Asphalt Condition in 2018. In 2018, 1.4% of the Interstate Overall Pavement Condition was poor, 65.8% was in fair condition, and 32.8% was in good condition.
Figure C.4 Overall Interstate Pavement Condition
Alaska has 1,191.303 centerline miles of Non-Interstate NHS in 2018. Most of these miles (924.9 miles) are paved. Figure C.5 shows Alaska’s non-Interstate NHS Overall Asphalt Condition in 2018. In 2018, 8.1% of the Non-Interstate NHS Overall Pavement Condition was poor, 69.4% was fair, and 22.5% was in good condition.
27.0% 23.6% 23.8% 15.8% 32.8%
64.3% 71.3% 72.4% 79.5% 65.8%
8.7% 5.1% 3.5% 4.7% 1.4%
0.0%10.0%20.0%30.0%40.0%50.0%60.0%70.0%80.0%90.0%
100.0%
2014 2015 2016 2017 2018
INTERSTATE PAVEMENT - OVERALL %
Good Fair
Average 4.7% Poor and The Trend is +1.8%
Average 24.6% Good and The Trend is +1.5%

C-4
Figure C.5
Non-Interstate NHS Pavement
Pavement Condition for IRI Only on Interstate Figure C.6 shows that the percent of the Interstate IRI condition in poor condition was 8% in 2015 and 9.7% in 2018.
Figure C.6
Interstate Pavement Condition
13.6% 16.3% 17.0% 13.8% [VALUE]
47.3%
68.1% 66.5% 69.8% 69.3%
16.9%
15.6% 16.5% 16.4% 8.1%
0.0%
10.0%
20.0%
30.0%
40.0%
50.0%
60.0%
70.0%
80.0%
90.0%
100.0%
2014 2015 2016 2017 2018
NON-INTERSTATE NHS PAVEMENT - OVERALL %
Good Fair
Missing Data
22.2% Average 14.2% Poor and The Trend is +2.5%
52.1% 59.7% 57.6% 63.0% 55.1%
37.3% 32.4% 32.6% 25.8% 35.2%
10.6% 8.0% 9.8% 11.2% 9.7%
0.0%
20.0%
40.0%
60.0%
80.0%
100.0%
2014 2015 2016 2017 2018
INTERSTATE IRI CONDITIONS - OVERALL %
Good Fair Poor
Average 9.9% Poor and the Trend is +0.2%
Average 57.5% Good and The Trend is +0.75%
Average 17.4% Good and The Trend is +2.1%

C-5
Pavement Management Objectives:
• Treat pavements in good and fair condition before they deteriorate to save money over the pavement’s life cycle
• Provide information to allow effective selection and design of future surface treatments, rehabilitation, and reconstruction projects.
• Accurately estimate future conditions versus funding scenarios to evaluate current pavement funding strategies.
• Display analysis results in understandable formats.
Pavement Management System Implementation
When MAP-21 was signed into law, DOT&PF did not have a pavement management system that could forecast pavement conditions or track where money was historically spent on the road network relative to its condition. We procured the Agile Assets Pavement Management System (PMS) on May 2016 and have been working to implement the system. We are also replacing our Maintenance Management System (MMS) and Equipment Management System (EMS) with the Agile Assets modules. The “go live” date for Pavement and Equipment is tentatively scheduled for October 2019. Maintenance Management System “go live” is tentatively set for March 2020. These systems will provide more accurate data on where we are spending money and which maintenance and preservations treatments are most effective.
DOT&PF is also implementing AASHTOWare Preconstruction and Site Manager Modules. The AASHTOWare system will track construction costs, year completed and pavement details through automatically.
The TAM Technical Team and the Pavement Sub Team have been meeting since 2013 and have been integral in designing a PMS that meets Alaska needs and complies with the federal rulemaking. Our FHWA Division office has provided support in many areas during our PMS implementation and has financially supported the PMS and MMS development, as well as financially supporting and assisting in organizing a Peer Exchange with North Carolina Department of Transportation (NCDOT). NCDOT has many years of experience using Agile Assets for Pavement analysis. A two-day Peer Exchange was held in Anchorage in February 2017.
Based on the Peer Exchange, Alaska should consider the following best practices items:
1) Supply data for overall project selection & Prioritization 2) Optimize Preservation and Reconstruction projects 3) Check out North Carolina Pavement Index to come up with an overall rating 4) Perform a Statewide Analysis then allocate $ to regions to meet needs in a 5-
year plan 5) Evaluate what we need to inventory

C-6
6) Create some Gravel Road Performance Metrics –check out RBA? 7) Archive raw pavement data and not photo logs. NC only maintains photos for
three years due to the storage requirements. 8) Don’t conduct GPS on the bridges repeatedly again-will have “moving” bridges
in the database. 9) Refine the performance of the current three modules (PMS, EMS, MMS) before
adding more. 10) Work on Truth seeking/Tweaking Models 11) Use Jasper reports instead of user access to system. NC tracks what people
are asking for and then with write a JASPER report to get it. 12) Get university involved for modeling and number crunching 13) Use Agile Cross Allocation Model 14) Use “Ride-along” checklists for litter, lighting, smoothness, use to recalibrate
customer service sample 15) Figure out your Organization 16) Go to Agile User Conference 17) Set up and maintain MMS/PMS manual 18) Involve GIS personnel 19) Work on procedures, Work on moving forward. Fix historical when time permits 20) Improve software to better capture data on small auxiliary lanes 21) Add whole typical section 22) Draft line work to GIS for publishing 23) Support is continuously needed, No data is better than bad data.
The DOT&PF Pavement Sub Team developed pavement treatment “decision trees” to input into the Agile System. The team researched and evaluated other states frameworks, using Washington State DOT’s decision tree as an outline. The first model was set up using IRI as the main controlling factor but after discussions with several states including Washington, we decided to change the model using fatigue cracking as the first level of classification. The reasoning here is that fatigue cracking, greater than 20% in the wheel base, could indicate there are some base/embankment failures that preservation techniques will not correct. The next level was IRI since it can also indicate structural issues but can show artificial high values in urban sections. The last item was rutting. Rutting is caused by studded tires and can be improved by resurfacing and is the last “limb” of the tree for pavement treatment options.
A Pavement Preservation workshop and Peer Exchange was held February 21-22, 2019 in Anchorage with representatives from Washington, Idaho, Montana and

C-7
Minnesota. We discussed the pavement decision trees and deterioration modeling as well as preservation techniques.
At this peer exchange we learned that our PMS implementation will be an iterative process, where we update our decision trees and deterioration models annually as the system grows and the recommendations provided to the regions are reviewed and feedback is received.
At the peer exchange we were fortunate enough to have regional experts and the out of state representatives in the same room who were able to review preliminary recommendations from the decision trees and methods being used in our AgileAssets implementation. We learned that additional weighting factors are needed when making recommendations to prioritize our higher functional classification routes over lower ones.
We also learned there are many more preservation techniques that should be evaluated in Alaska. These include ultra-thin bonded overlays, scrub seals and cape sealing. These preservation treatments will be considered for use in the following years.
Due to the permafrost and other embankment conditions, we added Base Stability Index to the decision trees. The index comes from Northern Region Maintenance staff and the rating is classified as A, B, C. Level A indicates a good stable embankment, Level B represents “fair” and Level C is a “poor condition.” Any missing data from M&O defaults to a Level of Service A. DOT&PF will be working on correlating this rating to the Geotechnical Asset Data to see if there are connections. Eventually, the Geotechnical Asset embankment data would be “brought” into the PMS. Any changes to the base from construction projects would be “passed back” to the Geotechnical Asset Management Inventory.
The intent of PMS is to maintain the network at a desirable performance level with a minimum cost. With the exception of unstable foundation areas such as permafrost or soft foundations, PMS uses measured surface condition and pavement performance models to select an appropriate action for each mile of paved roadway. In the areas of unstable foundations there is limited to no accurate performance models, so annual field condition inspections are needed. These annual field inspections primarily identify areas of safety concerns which require repair. Through tracking of annual maintenance costs in the MMS system we will be able to identify high cost maintenance locations and perform benefit costs analysis to verify what repair methods are most efficient for unstable foundation area (Routine annual patching, more frequent low cost short life overlays, or reconstruction). That information will be tracked in the PMS.
As DOT&PF gains more experience with the PMS and use it for decision-making we will continue to improve in this area. DOT&PF will also look at developing our own Pavement Index more reflective of unique Alaska conditions and effective treatment triggers.

C-8
DOT&PF contracted with Applied Pavement Technologies (APTech) to develop Alaska specific pavement deterioration models to input into the AgileAssets Pavement Module. The Pavement Team and Pavement Management Engineer is guiding this deterioration model development. The models will be a work-in-progress as the data improves and as we learn more about how the treatments affect the condition over time.
Alaska Pavement Index (In Development)
Up to 2013, DOT&PF used the Pavement Serviceability Rating (PSR) as an index only to assess pavement health. PSR computations were completed using rutting and IRI only. DOT&PF has developed a new pavement index (Alaska Pavement Condition Index – APCI) to measure pavement using rutting, IRI fatigue cracking and linear cracking data. The APCI will provide insight on Alaska’s pavement health and assist with project selection and maintenance activities. After adopting the APCI DOT&PF will use it to further analyze pavement condition and provide the appropriate condition triggers for maintenance, preservation, rehabilitation and reconstruction. DOT&PF will be developing this as we mature with our new pavement management system and hope to have this completed by the next TAMP revision.
Road condition needs to be determined for the five index categories: IRI, Rut Depth, Fatigue Cracking, Longitudinal Cracking, and Transverse Cracking. Longitudinal and traverse cracking provide additional information on the condition and will help define treatment triggers and options that Fatigue cracking alone cannot define. In the future these triggers may be set within the PMS for Regional sub-regions, i.e. in Northern Region transverse cracking triggers will be different for sub-regions of Valdez and Deadhorse.
The following Table C.7 includes a draft of our framework for Alaska pavement condition. This is not in use currently but in development.
Condition LOS IRI Ruts
(inches) 4* 5* 6* 7* Excellent A <60 <0.2 0 0 0 90 to 100
Good B ≥ 60 to <95
≥0.2 to <0.4 >0 to ≤50 >0 to
<2.5 >0 to ≤100 80 to 89
Fair C ≥ 95 to <120
≥0.4 to <0.5 ≥50 to <150 ≥2.5 to >
7.5 >100 to
≤250 70 to 79
Mediocre D ≥ 120 to <170
≥0.5 to <0.75 ≥150 to <400 ≥7.5 to >
20% >250 to
≤400 60 to 69
Poor F ≥170 ≥0.75 >400 >20% >400 < 60
4*= Fatigue (FAT) Crack SF/0.1 mile 5*=Fatigue (FAT) Crack (%wheel path) 6*= Longitudinal (Long) Crack LF/0.1 mile 7*= Pavement Index (IRI+Rutting+FAT and Long Cracks)
Table C.7 Pavement Condition Framework

C-9
Triggers need to be determined for different treatment categories: Preservation treatments include routine maintenance through minor rehabilitation-everything from crack sealing to mill/fill and thin overlays. Major rehabilitation includes full depth reclamation, base stabilization, and regular structural overlays. It is recommended that reconstruction be triggered upon a road’s reaching or passing end of service life. See Figure C.8.
*Condition formulae: Based upon an assumed trigger for this demonstration but is adjustable for any trigger.
Figure C.8 Condition Index Model
DOT&PF Maintenance and Operations staff have been assessing pavement condition using level of service-A though F. Table C.9 below are illustrations that Alaska DOT&PF Maintenance and Operations uses to correlate pavement condition with Level of Service.

C-10
Level of Service Performance Target Description Illustration
A
(Excellent Pavement condition)
The structure, smoothness, and durability of the pavement surface are excellent. The surface is free of potholes and exhibits little or no cracking. Past repairs like patches and crack seals are in excellent condition. There are small or no drop-offs at pavement edges. Pavement condition has not degraded.
B
(Good Pavement condition)
The pavement is in overall good structural condition and offers a satisfactory ride. Pavement exhibits sound material quality. Occurrences of distress such as cracking, potholes, rutting, and pavement materials problems are infrequent and minor. Past repairs are in good condition with limited need for rework. Pavement edge drop-offs are infrequent.
C
(Fair Pavement Condition)
Pavement shows moderate problems with structural deterioration like cracking, pot-holes and past repairs that are affecting the ride quality. Pavement is showing oxidation of surface, flushing/bleeding, or loss of material through raveling.
D
(Poor Pavement Condition)
Pavement deterioration is significant, with up to half of the pavement area exhibiting one or more types of serious distress: structural deterioration like large numbers of cracks or potholes and or repairs, ride quality from rutting or surface roughness or large sections of pavement edge drop-offs. Surface condition may affect speed and vehicle handling.
F
(Failing Pavement Condition)
Pavement is deteriorated over more than half its area. The integrity of the pavement and the ride quality it offers are degraded by extensive damage like potholes, cracking, rutting or surface roughness from failing pavement or repairs. Extensive edges and drop-offs. Speed and vehicle handling likely affected.
Table C.9 M&O Pavement Condition Level of Service

C-11
DOT&PF is working to correlate the M&O level of service with federal pavement condition data. Table C.10 below reflects the current correlation and will be conducting further analysis to strengthen the relationship with the pavement index.
Federal Overall Condition State Level of
Service Treatment Types Good A&B Maintenance, Preservation
Fair C&D Preservation (minor rehabilitation) and
Rehabilitation Poor F Reconstruction
Table C.10 Pavement Condition
Historical Data for Interstate and Non-Interstate NHS
The pavement trends are flat from 2000 through 2013 for IRI. The graphs below (Figure C.11) illustrate Alaska’s historical data for IRI:
Figure C.11
Pavement Trend IRI Interstate
The general trend for IRI on the Interstate is 11% poor from 2000 through 2013. The general trend for IRI on non-Interstate NHS roads is 21% poor from 2000 through 2013 (Figure C.12).

C-12
Figure C.12
Pavement Trend IRI Non-Interstate
Historical Data for Non-NHS
The non-NHS data is not required to be part of the TAMP and is included in this appendix for information only (Figure C.13). DOT&PF does not plan to officially include non-NHS data in the TAMP submitted to FHWA.
Figure C.13
Non-NHS Pavement IRI

C-13
The general trend for IRI on non-NHS roads is 39% poor from 2000 through 2013 but IRI is not the best indicator for condition of low speed urban roads, which include some of the non-NHS. We analyzed the non-NHS using the same Federal regulations even through non-NHS is not required for inclusion in this TAMP.
We will continue to track the non-NHS since these routes are included in our PMS, which uses the federal performance measures and same modeling and decision trees.
The missing data from 2014 and 2015 make it impractical to calculate the trend for non-NHS overall pavement condition from 2014 through 2016 (Figure C.14).
Figure C.14 Non-NHS Pavement Condition
State Performance Measures for Pavement and Bridge Conditions Alaska has set performance measures for the non NHS for pavement and bridges to use as a guide but is not included in the TAMP.
Non NHS Pavement and Bridges Targets
Performance Measures 2 year Target 4 year Target
Poor Pavement Condition on the non NHS <15% <15%
Good Pavement Condition on the non NHS <15% <15%
Poor Condition of Bridges on the non NHS <10% <10%
Good Condition of Bridges on the non NHS <40% <40%
13.0% 13.9% 25.4% 23.8% 24.9%
54.9% 54.9%
60.3% 62.6% 70.4%
4.1% 3.8%
8.8% 13.7%
4.6%
0.0%10.0%20.0%30.0%40.0%50.0%60.0%70.0%80.0%90.0%
100.0%
2014 2015 2016 2017 2018
NON-NHS PAVEMENT - OVERALL %
Good Fair Poor
Missing Data
27.9%
Average 20.2% Good
Missing Data
27.4%
5.4%

C-14
Performance Gap Identification
Pavement The goal of pavement management is to meet the pavement condition threshold. Implementation of the pavement preservation program will help to improve pavement condition.
Pavement Asset Management Goals As part of the DOT&PF’s asset management approach, maintenance staff actively performs preventative maintenance on all DOT&PF maintained roadways. The pavement deterioration models include the effects of surface maintenance; therefore, maintenance is considered a critical component of a pavement’s life-cycle costs. Maintenance work is performed by contractors and in-house staff and includes crack sealing, patches, and chip seals. Without this work the pavement would have a short life expectancy; therefore it is critical to maintain the current level of effort in the maintenance budget.
Pavement Preservation Pavement preservation is a program of activities aimed at preserving the nation’s highway system, enhancing pavement performance, extending pavement life, and meeting customer needs1. It includes work that is planned and performed to improve or sustain the condition of the transportation facility in a state of good repair. It generally excludes structural improvements (such as an overlay), capacity improvements, major rehabilitation, and reconstruction2.
The DOT&PF’s pavement preservation program includes the following actions:
• Review the road system • Select the road • Determine the cause of the problem • Select the appropriate treatment • Identify the right time to apply the treatment.
DOT&PF is currently in the process of implementing a new PMS, which will be able to provide more accurate inventory and condition information in addition to modeling capabilities. This information will be used to make optimized treatment decisions. In the meantime, a spreadsheet tool developed by Applied Pavement Technology, was used to provide life cycle planning estimates. See Appendix F for more life cycle planning information.
DOT&PF has developed a Pavement Policy and Procedure that requires us to use recommendations from the PMS to make data driven decisions. A pavement preservation work Needs List from the PMS is prepared that determines the optimal 1 https://www.fhwa.dot.gov/infrastructure/asstmgmt/roadmap.pdf

C-15
locations for a resurfacing or minor rehabilitation projects and is sent to the regions for review and validation. Sections of road that are beyond preservation are recommended to planning for major rehabilitation or reconstruction projects. Maintenance preservation activities will be sent from the PMS to a Maintenance Management System for scheduling pavement maintenance activities based on pavement age.
Major Rehabilitation/Reconstruction
Figure C.15 is taken from the current LRTP. The backlog of needs that DOT&PF can improve via preservation is $426 million. In addition to the pavement preservation funds, the backlog over a period of ten years totals an annual need of $253 million.
Figure C.15
Total Lifecycle Management Needs for NHS (Year of Expenditure Dollars)
To combat rutting and optimize life-cycle costs on certain roadways, Alaska DOT&PF began using hard aggregate treatment on various roads in the Central and Southeast regions. As defined in the hard aggregate policy, it must be used in the wearing surface of high-volume roadways (≥ 5,000 AADT/lane) exhibiting studded-tire wear. Therefore, the DOT&PF developed hard aggregate treatment cycles, timing, and costs for high volume roadways (≥ 5,000 AADT/lane) in both the Central and Southcoast region.
The effectiveness of this hard aggregate policy is being reviewed yearly as roadway data is collected for verification of rutting rate reduction. A new life cycle cost analysis will be conducted to consider the additional costs of using the imported hard aggregate once accurate trends are determined.
Figure C.16 below compares the rut conditions using hard aggregate vs standard aggregate for two projects.
$-
$200.00
$400.00
$600.00
$800.00
$1,000.00
$1,200.00
2015
2017
2019
2021
2023
2025
2027
2029
2031
2033
2035
2037
$ (M
illio
ns)
Ideal
Normalized
Backlog needs: $426 million Total 23-year needs:$5.8 billion Average annual needs: $253 million

C-16
Figure C.16 Rut Conditions
• Tudor Road Project Cost with Local Aggregate Asphalt Mix = $7,500,000 provides 11 year life to ½” rut, cost per year = approx. $682,000/ year
• Tudor Road Project Cost with Hard Aggregate Asphalt mix = $9,200,000 provides 18 year to ½” rut, cost per year = approx. $507,000 / year.
External Factors External factors are the outside forces, some which are beyond an agency’s control which can impact the ability to achieve its strategic goals. Each factor impacts the pavement program differently. External factors were identified and considered during pavement target setting.
In summary, we came up with 20 external factors that can influence pavement condition forecasting. We anticipate the pavement condition to remain steady based on no changes in funding.
The external factors that may influence our pavement negatively are poor drainage, water-higher precipitation based on extreme weather events, and changing temperatures that increase the number of freeze thaw cycles. Alaska is experiencing warming temperatures and increased precipitation during events and thawing of permafrost. We know how to design for permafrost, as long as it remains frozen to support our roads. But when the temperatures rise, the permafrost melts and the road base will fail. This is an area that we need to pay close attention to because it is changing rapidly and our treatment selection needs to change to adapt as needed.

C-17
Factors
Expected Condition Outcome
with factor increase
Current Experience with Factor Notes
2018-2021 Condition Forecast
Pavement Loading
Overloaded Vehicles/Axel configuration and wheel load/Repetition of Loads
Forecast: No change Weight: High
Pavement Design, certain vehicles exempt for permitting.
Spring Thaw with loaded vehicles
Rutting - Studded tires/poor sub base see above
Forecast: Decrease with new non studded tire options Weight: High for rutting
Traffic Volume (Heavy Trucks %)
Forecast: No Change Weight: Medium
Tire Pressure Forecast: No Change Weight: Low
High Tire pressure buses
Environmental, Hydraulic and Base Considerations
Poor Drainage
Forecast: Increase Weight: Low
Freeze/Thaw Forecast: Increase Weight: Low
Extreme Temperature differential Transverse Cracks
Temperature Forecast: Increase Weight: Low
Low Temp cause cracks; high temp lose stiffness
Susceptible Foundation (permafrost)/
Subgrade type
Forecast: No change Weight: Low
Wheel load on thin pavements causes deformation of subbase
High Precipitation
Forecast: Increase Weight: Medium Groundwater <1 m pavement. Water intrusion. Caused by Extreme Weather Events

C-18
Factors
Expected Condition Outcome
with factor increase
Current Experience with Factor Notes
2018-2021 Condition Forecast
Construction Quality-substandard material
Forecast: No change Weight: Low
In some areas, quality material is hard to get. Localized
Inadequate design or change in conditions
Forecast: No change Weight: Low
Load Factors Forecast: No Change Weight: Medium
If we move to actual loads instead of axels our load factors would be more accurate and could produce more efficient designs
Design Mix
Forecast: Increase Weight: High
Continued IR use will improve embankment quality and pavement life. Hard Aggregate policy extends pavement life. Rut treatment research
Geometric Considerations
Unsafe Curves, steep hills stopping Vehicles at creep speeds
Forecast: No Change Weight: Low
Low Speed. Turning and stop conditions. Elevated grade. Change localized areas
Intersections (stops/starts)
Forecast: No Change Weight: Low
Low Speed. Turning and stop conditions. Urban areas
Other Factors
Funding Forecast: No Change Weight: High
Aging Infrastructure
Forecast: No change Weight: High
Maintenance Forecast: Increase Weight: High
Programmatic M&O activities are eligible for

C-19
Factors
Expected Condition Outcome
with factor increase
Current Experience with Factor Notes
2018-2021 Condition Forecast
federal funding
Rough Roads Forecast: Increase Weight: Low
Rough roads (high IRI) damage vehicles, fatigue cracks, breakdown base. Localized
New Cracking Data
Forecast: Increase Weight: Medium
New Cracking data

D-1
Appendix D: Asset Overview – Bridges
As of last report to FHWA on March 12, 2018, the DOT&PF Bridge Program manages 1,029 bridges (including large culverts) on public roads in Alaska. The Department owns 837 of them, 28 are owned by other state agencies, and 164 are owned by local government ts. The Department also inspects 42 ramps to ferry docks; three tunnels; and 85 culverts (single culvert diameter 20’ or greater, or multiple culverts spaced not greater than one-half the diameter of the smaller and a combined length along centerline of the roadway greater than 20’). Fourteen of these bridges are closed to the public. Of those 1,029 structures, 415 are on the National Highway System Eight of these bridges are owned by other entities. We are confident that these eight bridges will not affect the overall state target or national goals.
There are three classes of bridges, based the functional class of the road the bridges serve.
• NHS-Bridges on the NHS; • Non-NHS Bridges on the non-NHS but functionally classified as arterials; and • Off-System bridges on roads functionally classified as collectors or local roads.
Since MAP-21 included principle arterials in the NHS, most bridges are either NHS or off system. In other states, off-system bridges are an important class since local roads and collectors are not eligible for federal aid. However, in Alaska there is an exemption so all routes may be eligible for federal aid. This makes the federal aid program attractive to local governments for funding repairs of these off-system bridges.
Inspection Program Bridges are inspected at least once every 24 months by DOT&PF bridge inspectors/engineers. Bridge inspectors examine four main components: the substructure, the superstructure, the deck, and waterway characteristics. The substructure includes the foundation, piers and abutments of the bridge. The superstructure is the overlying framework (trusses or girders) which rest on the piers and abutments. The deck is the portion of the bridge which is visible by the driver. Inspection of waterway characteristics includes inspection of scour and any changes to the waterway since the previous inspection.
Department engineers classify the condition of Alaska bridges according to three different bridge condition categories:
1. Structurally Deficient (NBI≤4) 2. Functionally Obsolete 3. Not Deficient (NBI ≥ 5)

D-2
Bridges are “rated” on a National Bridge Index (NBI) using a scale of 1 to 9. Bridges are considered deficient if they receive an NBI rating of 5 or lower (Table D.1). Bridges are considered structurally deficient if their decks, superstructures, or substructures are found to be in poor condition.
If a bridge is deemed unsafe, the bridge will be closed. If a bridge is deemed to have load carrying capacity below legal load limits, then the bridge will be load posted with a weight restriction that the bridge can safely carry.
NBI numbers are used to report the condition of deck, superstructure, or substructure. NBI ratings are a constituent of the bridge condition rating and recommended work type (Table D.2). If the deck, superstructure, or the substructure has an NBI rating below 4, then the bridge will require rehabilitation or replacement.
The deck, superstructure, and substructure are considered critical elements of a bridge. Inspections follow the AASHTO Manual for Bridge Element Inspection, 1st edition, published in 2013.
SCALE DESCRIPTION N Not Applicable
GO
OD
9 Excellent Condition 8 Very Good Condition – no problems noted.
7 Good Condition – some minor problems.
FAIR
6 Satisfactory Condition – structural elements show some minor deterioration.
5 Fair Condition – all primary structural elements are sound but may have minor section loss, cracking, spalling or scour.
POO
R
4 Poor Condition – advanced section loss, deterioration, spalling or scour. 3 Serious Condition - loss of section, deterioration, spalling or scour may have
seriously affected primary structure components. Local failures are possible. Fatigue cracks in steel or shear cracks in concrete may be present.
2 Critical Condition – advanced deterioration of primary structural elements. Fatigue cracks in steel or shear cracks in concrete may be present or scour may have removed substructure support. Unless closely monitored it may be necessary to close the bridge until corrective action is taken.
CLO
SED
1 Imminent Failure Condition – major deterioration or section loss present in critical structure components or obvious vertical or horizontal movement affecting structure stability. Bridge is closed to traffic but corrective action may put back in light service.
0 Failed Condition – out of service – beyond corrective action.
Table D.1 NBI Scale

D-3
NBI Rating Performance
Target Recommended Work Type 9 Good No work needed
7-8 Preservation Candidate 6 Fair Preservation 5 Minor Rehabilitation/Repair Candidate
4 Poor Rehabilitation or replacement candidate
≤ 3 Replacement candidate
Table D.2 NBI Rating
The Deck Area Bridge Condition Performance measure uses the following calculation:
100 x Total Deck Area of Good or Fair or Poor bridges Total Deck Area of Bridges in the State
Bridges are considered functionally obsolete when a bridge does not meet the current design standards for lane width, number of lanes, shoulder widths, vertical clearances, load capacity, presence of guardrails on the approaches, or some other feature that differs from the standard. A functionally obsolete bridge may be structurally adequate, but not in conformity with current design standards or traffic demands. A functionally obsolete bridge that is structurally deficient is excluded from the functionally obsolete category and categorized as structurally deficient.
Under MAP-21, all state transportation agencies need to collect element condition data on NHS bridges. Superstructure element data includes each beam, stringer, truss, arch, main cable. DOT&PF will also use this more detailed information to prioritize projects. In 2018, all 1,029 bridges were submitted with element-level data.
Bridge element data is being collected for the deck, superstructure and substructure as well as culverts, bridge rail, joints, bearings and wearing surfaces1. Depending on the bridge type, different element reporting is used. The deck is the structural system that supports traffic and does not include non-structural wearing surfaces such as timber running planks and asphalt as those are sacrificial. The superstructure includes the girders, beams or truss that support the deck. The substructure is the foundation of the bridge and includes abutments, piles, pier caps, pier walls, and columns that support the superstructure. The deck, superstructure and substructure includes material types for steel, prestressed concrete, reinforced concrete, timber, masonry and other. The other material type is anything that does not fit into one of the specified material types.
A detailed description of the element inspection can be found in the FHWA Specificiation for the National Bridge Inventory Bridge Element report dated 01-21-2014. 1 http://www.fhwa.dot.gov/bridge/nbi/131216_a1.pdf

D-4
Bridge Management System
All NBI and element data collected during inspection are stored in AASHTO Bridge Management System (Brm). (This system was previously known as PONTIS Bridge Management.) DOT&PF started using PONTIS for data collection in April 2002 and transitioned to BrM in 2014.
Prior to PONTIS, data was collected and stored in a DOT&PF programmed Microsoft Access database. In 2018, DOT&PF upgraded to a new version that will satisfy 23 CFR 515.17. Those regulations require management systems have procedures for collecting, processing, storing and updating bridge inventory on the NHS. DOT&PF Policy and Procedure (P&P) 07.05.025 fulfills this requirement.
The bridge management system contains an out of the box deterioration model for bridge assets. The standard deterioration model is a collaboration of several different states. A research project planned for 2020 will develop an Alaska specific model to replace the default software model.
APTech provided support to develop Lifecycle Planning Scenarios including a no action scenario and a non funding restrained option, that was configured in the BrM. The system provides a 1-year short term as well as a 10-year long term budget needs estimate for NHS Bridges.
BrM prioritizes bridge work based on Bridge Condition (a combination of NBI and element condition data), Utility, Lifecyle Cost, Risk and Mobility. Utility is how much a treatement improves the condition based on the cost and the critically of that bridge. Bridge critically calculation includes traffic volume and detour route if bridge is closed. Lifecycle cost calculates how deferring work now will cost more later since the structure will continue to deteriorate and will need a more costly treatment to improve condition. Risk takes into account bridge age, detour length, whether it is fracture critical bridge, has a load posting, does not meet seismic standard, has scour or other concerns that do not show up in condition. Mobility takes into account geometric issues and ADT. Mobility is usually not a factor for bridge prioritization.
Federal Performance Measures
The final rulemaking for bridge performance measure uses the following metrics for bridges: Deck Rating, Superstructure Rating and Substructure Rating. Table D.3 below lists the thresholds in the final rulemaking. The lowest rating of all three metrics becomes the overall bridge condition.
Bridge Deck Super Sub
Good 9-7 9-7 9-7 Fair 6-5 6-5 6-5 Poor <5 <5 <5
Table D.3 Rulemaking Threshhold

D-5
The calculation for bridge deck area includes the following:
Length = corresponding value of NBI Item 49 – Structure Length for every applicable bridge
Width = corresponding value of NBI Item 52 – Deck Width or value of Item 32 Approach Roadway Width for culverts where the roadway is on a fill [i.e., traffic does not directly run on the top slab or wearing surface of the culvert] and the headwalls do not affect the flow of traffic for every applicable bridge.
The NBI bridge deficient deck area is the sum of the two below.
1) Bridge Deck Area = Structure Length * Deck Width Out to Out 2) Culvert Deck Area = Structure Length * Approach Roadway
Item 1 includes culverts, typically box culverts, where traffic is driving on the top of the culvert. Item 2 includes culverts where traffic is driving on fill carrying “on” and “off” ramps from NHS routes in accordance with the final rule.
A national goal that was part of the MAP-21 legislation requires structural deficiency of deck area less the 10%.Figure D.1 to D.3 summarize the bridge conditions:
Figure D.1 Deck Condition 3-Year Trend
3 year Average Poor = 6.7%(TARGET 10%) 3 year Average Good = 38.9% 3 year Average Fair = 54.4%
30.0%
40.0%
50.0%
60.0%
70.0%
80.0%
90.0%
100.0%
2016 2017 2018
% NHS Bridges - Bridge Condition by Deck Area
Poor
Fair
Good
Trend
Goal
Average 6.7% Poor and the Trend is +0.4%
55.1%
6.4% 6.5% 7.1%
39.4% 39.4% 37.8%
54.2% 54.1%

D-6
Figure D.2
Deck Condition 5-Year Trend
The 2014- 2017 data include on or off ramps, in accordance with the performance measures final rule, categorizing them as structurally decifient, functionally obsolete,or not deficient. This is good information but is not used to calculate the federal performance measures.
Figure D.3
Deck Condition Category Trend
3 year Average of Not Deficient + FO = 93.3% 3-year average Structurally Deficient = 6.7% 3-year average Poor = 6.7% (the MAP-21 requires less than 10%)
30.0%
40.0%
50.0%
60.0%
70.0%
80.0%
90.0%
100.0%
2014 2015 2016 2017 2018
% NHS Bridges - Bridge Condition by Deck Area
Poor
Fair
Good
Poor Trend
Goal
Good Trend
Average 7.6% Poor and the Trend is +0.8%
55.1%
6.4% 6.5% 7.1%
39.4% 39.4% 37.8%
54.2% 54.1%
40.7% 40.8%
9.5% 8.4%
49.8% 50.8%
Average 39.6% Good and the Trend is -0.4%
70.0%
75.0%
80.0%
85.0%
90.0%
95.0%
100.0%
2016 2017 2018
% NHS Bridges - Bridge Condition by Deck Area
SD
FO
Not Deficient
Trend
Goal
Average 6.7% SD and the Trend is
14.3% 10.1% 14.1%
7.2% 6.4% 6.6%
78.5% 83.5% 79.3%

D-7
Percentage of Non-NHS and Off System Bridges – Bridge Condition By Deck Area Non-NHS and off system bridges are not required to meet federal performance measures and are not included in the TAMP. However, we will be tracking the performance of such assets in our Bridge Management System (Figure D.5 and Figure D.6). The graph below does not include closed bridges which would be classified as poor.
Figure D.4
Non-NHS Deck 5-Year Trend
Figure D.5
Off System Bridge Deck 3-Year Trend
30.0%
40.0%
50.0%
60.0%
70.0%
80.0%
90.0%
100.0%
2014 2015 2016 2017 2018
% non-NHS Bridges - Bridge Condition by Deck Area
Poor
Fair
Good
Poor Trend
Good Trend
Average 9.6% Poor and the Trend is +0.9%
51.2%
8.2% 8.7% 8.5%
41.0% 40.3% 40.4%
50.8% 51.0% 45.5% 43.6%
43.3% 44.9%
11.2% 11.5%
Average 42.0% Good and the Trend is -1.1%
30.0%
40.0%
50.0%
60.0%
70.0%
80.0%
90.0%
100.0%
2016 2017 2018
% off-system Bridges - Bridge Condition by Deck Area
Poor
Fair
Good
Trend
Average 15.7% Poor and the Trend is 0.3%
45.2% 42.0% 40.0%
44.3% 41.7% 39.7%
15.7% 15.1% 16.3%

D-8
Bridge Forecasting – Long Range Needs
Table D.4 below from the Long Range Transportation Plan forecasts the funding needed to maintain multiple scenerios. For example, if the Department had a “zero structural deficiency” policy for NHS bridges, we would need to spend ~$46 million annually. If the Department chose less than 7.5% structurally deficient deck area on NHS bridges as its target, the expected cost to the Department would be $25.5 million annually. Targets for the non-NHS bridges are not required. However, in good practice there should be some target for budgeting purposes.
NHS Non-NHS Total
SD Target: 0 Bridges each year
Current Dollars $31,880,886 $21,770,516 $53,651,402 Year of Expenditure $45,968,313 $31,890,129 $77,858,442
SD Target: 7.5% Deck Area each year
Current Dollars $17,355,388 $7,314,022 $24,669,410 Year of Expenditure $25,511,144 $11,064,545 $36,575,689
SD Target: 10% Deck Area each year
Current Dollars $10,564,893 $5,650,451 $16,215,344 Year of Expenditure $15,640,670 $8,587,831 $24,228,500
Table D.4 Forecasted Funding Needs
The Long Range Transportation Plan includes predictions for bridge life cycle management (Figure D.5).
Figure D.5 Forecasted Annual Need Bridge

D-9
Performance Measures
The Bridge Program publishes an annual Bridge Report which includes bridge needs. Federal performance measures require that 10% of the total bridge deck area may be designated Structurally Deficient for all NHS bridges.
DOT&PF’s goal is to maintain NHS bridges designated as Structurally Deficient at or below 10%, which means 90% of NHS bridges would be in fair or better condition. Non-NHS bridges will have a goal of 80% fair or better. Off System bridges too will have a goal of 80% fair or better.
The goal coincides with the DOT&PF’s Strategic Plan to provide for the safe and efficient movement of people and goods.
It is important to keep the deck, joints and paint in good condition since generally that is what will keep the super-structure and bearings in good condition.
Good pavement condition on Bridges can help protect the deck and super-structure from water and chemical infiltration.
Bridge Gap Assessment
The State’s bridge inventory continues to age and one third of our bridges are past the midpoint of their 50- to 75-year design life. As of 2013 at least half of the public bridges in the state are 36 years old or older. Almost 15% are 50 years old or older. It is critical to address the existing inventory of structurally deficient bridges.
The majority of publicly owned bridges in Alaska have been constructed using steel girders, followed by pre-stressed concrete bridges, then timber bridges, which typically compose the older and shorter spans. Because of their relatively low maintenance requirements and relatively low cost, pre-stressed concrete girders are the preferred choice for new construction.
As part of continuous improvement, the bridge section proposes a route-based analysis for project selection by reviewing NHS routes such as the Alaska Highway or the Parks Highway and the sufficiency ratings for each bridge along that route. Maintaining a high-level sufficiency rating on important routes would be a strategy to maintain a high level of access and connectivity. The route analysis strategy is not currently being used by DOT&PF for project selection but could be analyzed further using the Bridge Management System.
Bridge Asset Management Goals
• Have a maximum 7.5% structural deficiency in bridges in the NHS system • Replace one to three structurally deficient bridge every year • Continue the Seismic Bridge Retrofit program

D-10
• Introduce a Bridge Preservation Program that is managed through the statewide bridge section
• Provide a bridge list and coordinate statewide rehabilitation/replacement efforts with regional field office planners
• Provide a seismic retrofit candidate list to regional field office planners • Coordinate statewide Bridge preservation program with regional maintenance
crews to plan a systematic maintenance strategy with federal participation. • Prioritize maintenance work recommendations in Bridge Inspection Reports by
assigning high, medium or low priority where; high – ideally repair within a year, medium – ideally repair within two years and low – repairs can wait more then two years.
Bridge Asset Management Objectives
• Design and construct bridges to last with minimal maintenance. • Seal decks and expansion joints to protect bridges from road-salt laden runoff. • Perform maintenance such as cleaning gutters and deck drains, removing debris
from bottom chords and bearing seats and removing drift from piers. • Invest in preservative treatments for bridges in good and fair condition to retard
deterioration. Preservative treatments might include deck seals, joint seals, and repainting structural steel elements.
• Provide timely information to allow effective selection and design of future maintenance, preservation (i.e. deck treatments), rehabilitation, and reconstruction projects.
Bridge Preservation
Bridge Preservation2 is defined as the actions or strategies that prevent, delay, or reduce deterioration of bridges or bridge elements; restore function of existing bridges; keep bridges in good condition; and extend their life. Preservation actions may be preventative or condition-driven (Source: FHWA Bridge Preservation Expert Task Group).
Effective Bridge Preservation actions are intended to delay the need for costly reconstruction or replacement actions by applying preservation strategies and actions on bridges while they are still in good or fair condition and before the onset of serious deterioration.
Preservation activities may include bridge washing, sealing deck joints, facilitating drainage, sealing concrete, painting steel, removing channel debris, protecting against scour, and lubricating bearings. For more information on Bridge Rehabilitation and Preservation techniques: http://www.fhwa.dot.gov/bridge/preservation/guide/guide.pdf
2 http://www.fhwa.dot.gov/bridge/preservation/guide/guide.pdf

D-11
Major Rehabilitation/Reconstruction
DOT&PF identifies and programs bridge rehabilitation and replacement projects in several different ways. Bridge project strategy is identified using life cycle costs analysis.
1. Highway Projects per the Alaska Highway Preconstruction Manual a. Bridge maintenance work is allowed for Preventive Maintenance projects. b. Specific bridge criteria is presented for projects that resurfacing, restoration or
rehabilitation ( of an existing roadway on the same. alignment, modified alignment or relocated alignment. These are refered to as 3R projects.
c. New road and Major realignment projects.
2. Bridge Prioritization List is a function of: a. Structurally Deficient bridges. b. NBI values for deck, superstructure, and substructure. c. Normalized traffic volume. d. NHS or Non-NHS. e. Functional Class. f. Available detour length.
3. Other: a. Local agency nominates a project. b. State Maintenance & Operations staff requests a project to address either load
limits or on-going high maintenance costs. c. Legislature writes legislation that results in a bridge project. d. Extreme events (earthquake, flood, etc.) result in need for replacement.
Performance Target and External Factors
As noted above, the performance target for bridges was revised to a target of no more than 10% of the deck area being structurally deficient (for both NHS and non-NHS bridges). This target was determined through meetings and DOT&PF Staff and as part of TAM team workshop with MPOs in August 2017. The workshop identified and evaluated external factors that would influence future conditions and affect the targets. Those factors are described below.
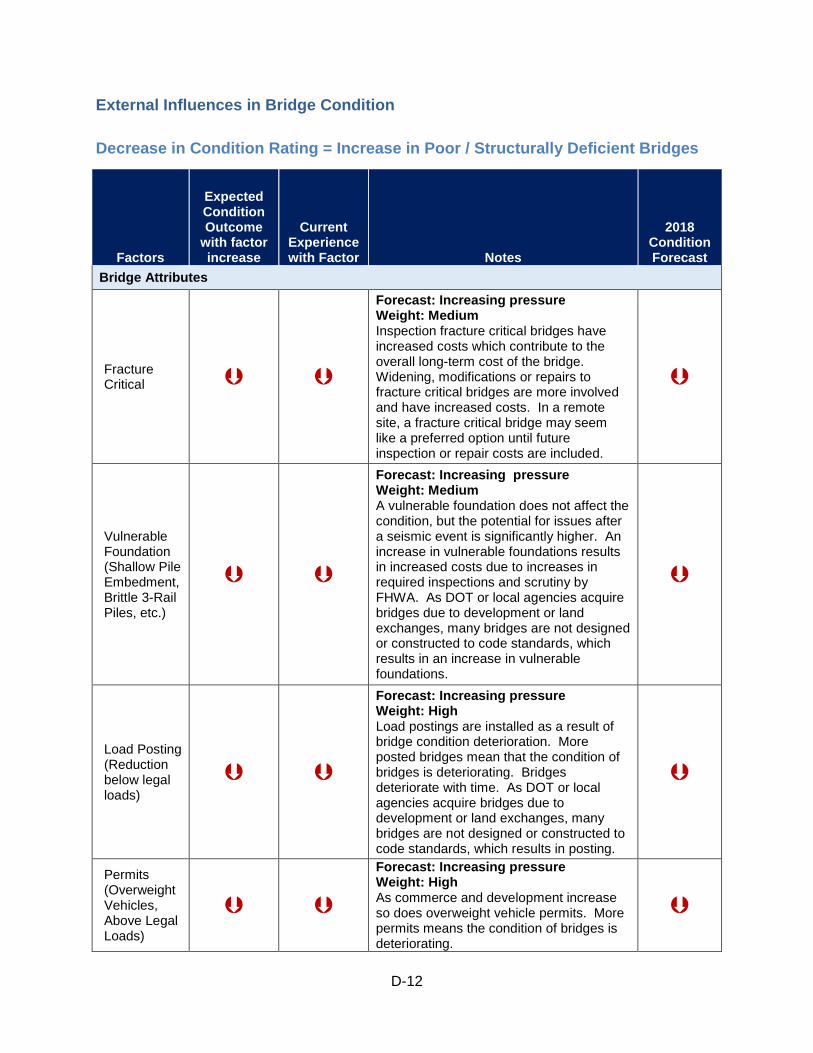
D-12
External Influences in Bridge Condition
Decrease in Condition Rating = Increase in Poor / Structurally Deficient Bridges
Factors
Expected Condition Outcome
with factor increase
Current Experience with Factor Notes
2018 Condition Forecast
Bridge Attributes
Fracture Critical
Forecast: Increasing pressure Weight: Medium Inspection fracture critical bridges have increased costs which contribute to the overall long-term cost of the bridge. Widening, modifications or repairs to fracture critical bridges are more involved and have increased costs. In a remote site, a fracture critical bridge may seem like a preferred option until future inspection or repair costs are included.
Vulnerable Foundation (Shallow Pile Embedment, Brittle 3-Rail Piles, etc.)
Forecast: Increasing pressure Weight: Medium A vulnerable foundation does not affect the condition, but the potential for issues after a seismic event is significantly higher. An increase in vulnerable foundations results in increased costs due to increases in required inspections and scrutiny by FHWA. As DOT or local agencies acquire bridges due to development or land exchanges, many bridges are not designed or constructed to code standards, which results in an increase in vulnerable foundations.
Load Posting (Reduction below legal loads)
Forecast: Increasing pressure Weight: High Load postings are installed as a result of bridge condition deterioration. More posted bridges mean that the condition of bridges is deteriorating. Bridges deteriorate with time. As DOT or local agencies acquire bridges due to development or land exchanges, many bridges are not designed or constructed to code standards, which results in posting.
Permits (Overweight Vehicles, Above Legal Loads)
Forecast: Increasing pressure Weight: High As commerce and development increase so does overweight vehicle permits. More permits means the condition of bridges is deteriorating.

D-13
Seismic Retrofit
Forecast: Neutral pressure Weight: Medium The need for seismic retrofit does not affect the condition, but the potential for issues after a seismic event is significantly higher. Many bridges have been retrofitted, so it is not expected that this number will increase.
Liquefaction Vulnerability
Forecast: Increasing pressure Weight: High As DOT or local agencies acquire bridges due to development or land exchanges, many bridges are not designed or constructed to code standards, which results in an increase in liquefaction vulnerability.
Lead Paint
Forecast: Neutral pressure Weight: Medium Lead paint does not affect the condition, but it does affect the repainting costs of older bridges due to containment costs. As bridges are repainted the number of bridges with lead paint is expected to decrease.
Hydraulic Considerations
Scour Critical
Forecast: Increasing pressure Weight: High More scour critical bridges result in increased costs due to increases in required inspections and scrutiny by FHWA.
Channel Infilling / Aggradation
Forecast: Neutral pressure Weight: Low As the channel infills, material has to be removed from the channel to maintain flow.
River Ice Jams
Forecast: Neutral pressure Weight: Medium Exceedingly high flow as a result of an ice jam may result in overtopping of the bridge, erosion of approach fill or in an extreme case knocking the bridge off of the foundation.
Aufeis Flow (water flowing on ice
Forecast: Neutral pressure Weight: Medium Aufeis flow is water flowing on top of ice that can refreeze increasing the thickness of the ice and thereby blocking the channel.
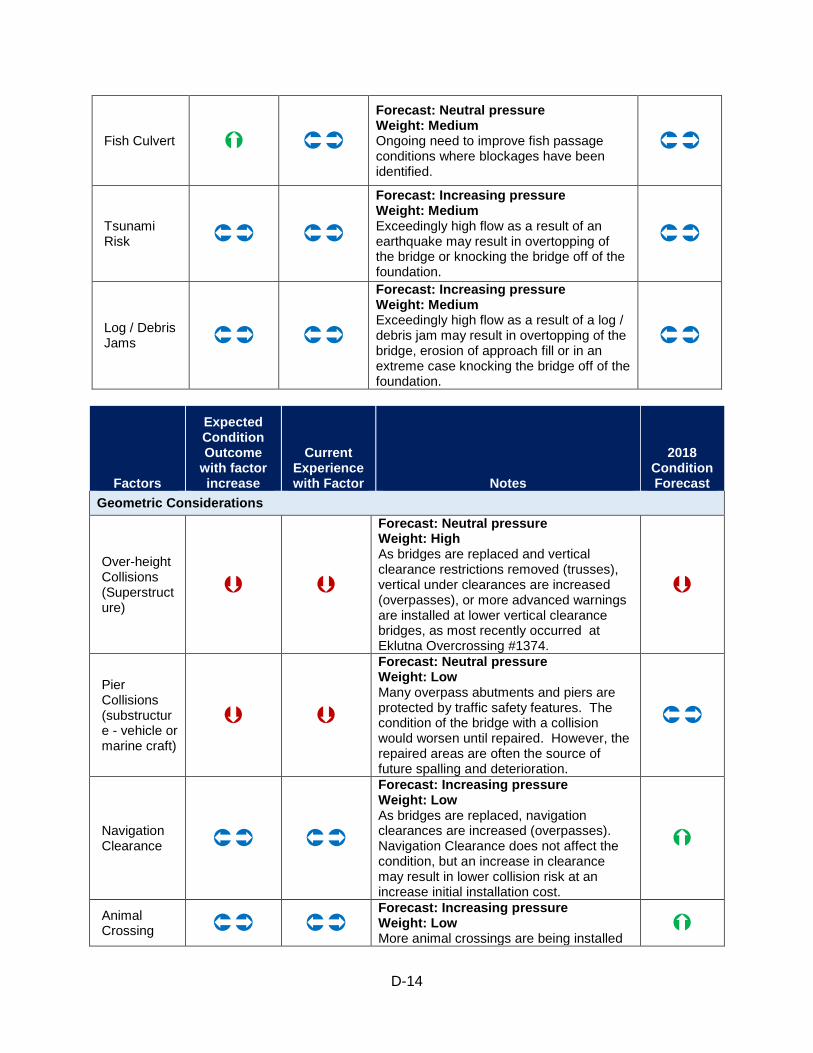
D-14
Factors
Expected Condition Outcome
with factor increase
Current Experience with Factor Notes
2018 Condition Forecast
Geometric Considerations
Over-height Collisions (Superstructure)
Forecast: Neutral pressure Weight: High As bridges are replaced and vertical clearance restrictions removed (trusses), vertical under clearances are increased (overpasses), or more advanced warnings are installed at lower vertical clearance bridges, as most recently occurred at Eklutna Overcrossing #1374.
Pier Collisions (substructure - vehicle or marine craft)
Forecast: Neutral pressure Weight: Low Many overpass abutments and piers are protected by traffic safety features. The condition of the bridge with a collision would worsen until repaired. However, the repaired areas are often the source of future spalling and deterioration.
Navigation Clearance
Forecast: Increasing pressure Weight: Low As bridges are replaced, navigation clearances are increased (overpasses). Navigation Clearance does not affect the condition, but an increase in clearance may result in lower collision risk at an increase initial installation cost.
Animal Crossing
Forecast: Increasing pressure Weight: Low More animal crossings are being installed
Fish Culvert Forecast: Neutral pressure Weight: Medium Ongoing need to improve fish passage conditions where blockages have been identified.
Tsunami Risk
Forecast: Increasing pressure Weight: Medium Exceedingly high flow as a result of an earthquake may result in overtopping of the bridge or knocking the bridge off of the foundation.
Log / Debris Jams
Forecast: Increasing pressure Weight: Medium Exceedingly high flow as a result of a log / debris jam may result in overtopping of the bridge, erosion of approach fill or in an extreme case knocking the bridge off of the foundation.

D-15
Factors
Expected Condition Outcome
with factor increase
Current Experience with Factor Notes
2018 Condition Forecast
to decrease collisions between animals and cars. Animal crossings do not affect the condition, but they do increase the long-term maintenance costs of the inventory.
Pedestrian Crossing
Forecast: Increasing pressure Weight: Low As bridges are replaced there is an increased demand for pedestrian facilities both over and under the bridge. Pedestrian crossings do not affect the condition, but they do increase the initial installation costs as well as the long-term maintenance costs of the inventory.
Other Factors
Funding
Forecast: Increasing pressure Weight: High Funding levels fluctuate from year to year, but overall the condition of our bridges has not significantly changed as a result of current funding levels.
Aging Infrastructure
Forecast: Increasing pressure Weight: High Bridge condition deteriorates with time unless preventative, preservation, or maintenance activities are performed regularly.
Railing Collisions
Forecast: Increasing pressure Weight: Medium Minor railing conditions that result in damage to railing or posts do not affect the condition of the bridge. Significant collisions that result in damage to the deck have a negative impact on condition until repaired. The repaired areas are often the source of future spalling and deterioration.
Detour Length
Forecast: Neutral pressure Weight: Medium Detour length does not affect the condition, but it does increase the initial installation costs as a result of the requirement for detour bridge during construction. There is also an impact to the public and commerce for a bridge with a large detour length being posted or closed due to damage or deterioration.
Remote Location Forecast: Neutral pressure
Weight: Low

D-16
Factors
Expected Condition Outcome
with factor increase
Current Experience with Factor Notes
2018 Condition Forecast
Remote location does not affect the condition, but it does increase the initial installation costs, long-term inspection costs, and long-term maintenance costs of the inventory.
Evacuation Routes
Forecast: Increasing pressure Weight: Medium An evacuation route does not affect the condition, but it does increase the initial installation costs as a result of additional requirements to maintain during construction. There is also an impact to the public and commerce for an evacuation route bridge to be posted or closed due to damage or deterioration.
Coast Guard Permitting
Forecast: Increasing pressure Weight: Medium Permitting does not affect the condition, but it does increase the lead time involved with bridge replacement, rehabilitation or retrofit work.
Historic Bridge
Forecast: Increasing pressure Weight: Medium Being historic does not affect a bridge’s condition, but it does increase the lead time involved with bridge replacement, rehabilitation or retrofit work due to increased paperwork and documentation requirements.
Mobilization Cost
Forecast: Increasing pressure Weight: Medium Mobilization cost does not affect the condition, but it can increase the cost when equipment not regularly used in Alaska has to be mobilized from the lower 48 even to an urban area, much less a remote location.
Climate Change
Forecast: Increasing pressure Weight: Medium Changing conditions may influence design selection processes
Extreme Events
Forecast: Increasing pressure Weight: Medium Projects may be delayed as a result of earthquake damage, road washouts or other damage that leads to a bridge’s needing to be repaired prior to another project.

E-1
Appendix E: Gap Analysis for National Highway System Bridge and Pavements
This Appendix describes the process that DOT&PF uses for conducting performance gaps [GAP 515.7(a)]. The Definitions section of the Final Rule (23 CFR 515.5) defines –“Performance Gap ” to mean both the gaps between the current asset condition and State DOT targets for asset condition, and the gaps in system performance effectiveness that are best addressed by improving the physical assets.
First, DOT&PF identified our current state by reviewing historical data and trends. Looking at bridge structural deficiency and pavement IRI, we see that the condition of our assets is relatively flat.
DOT&PF looked at the three to five years of bridge and pavement conditions using the federal rulemaking standard for good, fair, and poor conditions. Department and MPO staff identified external factors that could improve or worsen physical conditions.
Using knowledge gathered from the NHI Effective Target Setting training in March 2017, future 4-year targets were set. The intent was to keep that performance target flat from historical levels because it is an acceptable condition performance level for the NHS assets and represents a state of good repair for our system.
Using asset management principles and our asset systems, DOT&PF strives to minimize costs to keep those assets at that target condition in order to focus on other assets and new expansion needs. DOT&PF recognizes that in recent past years a significant amount of project off-set and de-obligation funding was re-invested to the NHS in preparation for federal transportation performance management.
Current pavement and bridge data show that this past work helps to set the stage by improving the condition but that the investment level is not sustainable moving forward.

E-2
DOT&PF is meeting pavement and bridge targets and expects to be able to continue to do so; however, there are trade-offs related to funding availability and remaining performance gaps both on and off the NHS.
For example, as funding is focused on preservation and rehabilitation of pavement and bridges, it will be more difficult to fund modernization improvements that the public desires to see (both on and off the NHS) and that may address critical safety and capacity issues. Additionally, funding is needed for the non-NHS, marine highway ferry purchases, high cost mobility improvement projects such as Cooper Landing Bypass, Dalton Highway gravel road preservation, ADA compliance upgrades, geo-technical assets, culverts and other highway related appurtenances, and other improvements that may not contribute toward meeting pavement and bridge condition targets. The Department will have to consider alternatives and trade-offs when making funding decisions related to meeting targets and closing or minimizing these performance gaps.
The LRTP 2036 predicts population growth, and the corresponding growth of travel demand would lead to higher customer service expectations for new and expanded facilities. The risk analysis indicates that user expectations will change and increase over time, outpacing forecasts of financial resources, including assessments of what the public is willing to fund.
A more urban population has expectations for pedestrian and bicycle facilities and other transportation amenities. These expectations would require unplanned maintenance of the system and higher operating expenditures. The plan describes additional needs and expectations for bicycle and pedestrian facilities. According to the LRTP 2036, this user expectation trend has a high risk to the State and the public we serve.
In contrast, population is predicted to continue to decline in rural areas, as the cost of providing services in these areas continues to increase. Rural transportation projects have high mobilization and materials cost that are often disproportionate in relation to urban area projects. These communities also are in need of transportation in and out of their communities, which is typically by air or ferry. The Alaska Marine Highway System competes with other surface transportation projects for NHPP and STP funds.
The LRTP 2036 also indicates that changing climate patterns pose a high, and almost certain, risk to the transportation system. For example, thawing permafrost causes major settlement to roads that requires frequent reconstruction and expensive mitigation measures and earthquakes pose seismic risks to bridges and require pre-emptive mitigation to reduce seismic risk. These risks affect system performance and require significant resources for mitigation. They are discussed in more detail in the LRTP 2036 and in the Risk Management section of this document.
The LRTP and this TAMP recognize that the Department must distribute limited funding resources among these multiple priorities. Projects may be categorized as new construction, modernization, or system preservation.
Pavement and bridge management systems will be used to determine preservation priorities while project selection criteria will be used to select modernization, and to a limited extent, new construction projects.

E-3
Modernization of the transportation system to address safety, capacity, and other user expectations represents a significant performance gap that will likely always exist and require resources. For modernization projects on the NHS, the Department will use the strategies listed in the Investment Strategy section and appendix of this document. Additionally, the Department is beginning to use Planning and Environmental Linkage (PEL) studies to help identify performance gaps and refine alternatives to most cost effectively modernize the transportation system.
Finally, as travel time and freight travel time data is analyzed and targets are set, more refined performance gap information will need to be integrated into project selection and funding decisions.
Regarding bridges, the Department does not currently have a bridge condition gap, but needs to continue programming reconstruction and rehabilitation of bridges to keep bridges at less than 10% poor. Asset Managers strive to meet the target by using 7.5% poor as their internal target level. Bridge staff submits a prioritized list to the field planning staff for consideration when the bridges require major rehabilitation.
The Bridge Section has completed simple retrofits to improve bridge performance during a seismic event. Approximately 25% of the total bridges in Alaska need improvement to perform better in a seismic event. Bridge Asset managers provide regional planners with a list of bridges that do not meet seismic standards. The percentage “good” and percentage “poor” targets are based on historical data.
DOT&PF monitors and manages the performance of the NHS in regards to all seven Transportation Performance Management (TPM) National Goal areas: safety, congestion, system reliability, freight movement and economic vitality, environmental sustainability, and project delivery. Each of these performance areas contribute to the development of DOT&PF’s capital program, in support of the agency’s LRTP. Several internal processes allow DOT&PF staff to manage delivery of program to ensure the expected performance is delivered on time and within budget.
These internal processes are connected to the TAMP development process, as outlined below, to ensure that the TAMP is developed in full awareness of any gaps in the performance of NHS assets and that the gaps are considered in the development of TAMP investment strategies.
1. DOT&PF holds a monthly Planning Chiefs’ meeting to discuss issues related to delivery of the capital program, including STIP projects. This meeting addresses the needs of programmed projects to remain on schedule and budget. If project schedules or budgets change, this group determines the impact on the overall program, decides on actions to balance program delivery, and determines accomplishments to best achieve the agency’s objectives, as described in the LRTP, and including all TPM goal areas.
2. DOT&PF convenes a Capital Program Review Team (CPRT) meeting at least twice per year. This is a cross-disciplined group that discusses and resolves issues in delivery of specific projects and program objectives, including the achievement of TPM goals and targets.

E-4
3. The TAMP Steering Team and Technical Teams include participants in both the Planning Chiefs’ and CPRT meetings. As DOT&PF engages in the update of its TAMP, these members will share performance gaps in areas other than pavement and bridge conditions to the attention of the larger teams. As these issues are discussed and understood, they are included in the risk analysis and are considered when developing gap analysis scenarios in the pavement and bridge management systems.
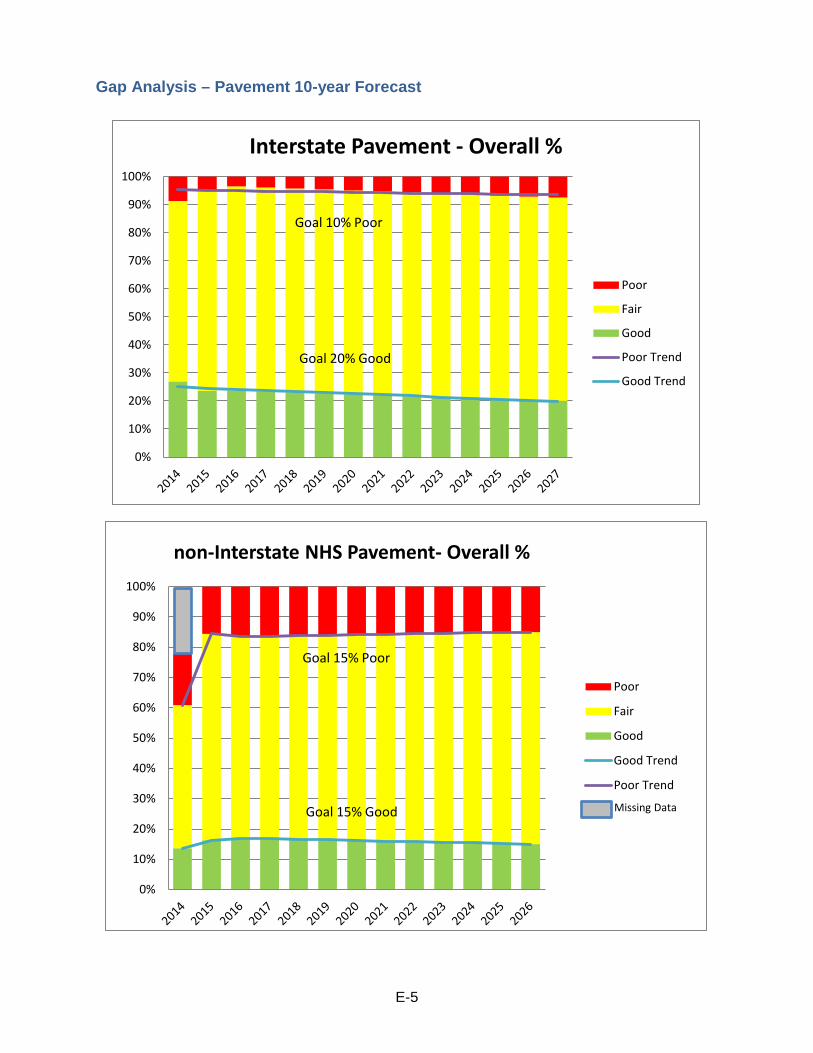
E-5
Gap Analysis – Pavement 10-year Forecast
0%
10%
20%
30%
40%
50%
60%
70%
80%
90%
100%
Interstate Pavement - Overall %
Poor
Fair
Good
Poor Trend
Good Trend
Goal 10% Poor
Goal 20% Good
0%
10%
20%
30%
40%
50%
60%
70%
80%
90%
100%
non-Interstate NHS Pavement- Overall %
Poor
Fair
Good
Good Trend
Poor Trend
Goal 15% Poor
Goal 15% Good Missing Data

E-6
0%
10%
20%
30%
40%
50%
60%
70%
80%
90%
100%
non-NHS Pavement- Overall %
Poor
Fair
Good
GoodTrend
Goal 15% Poor
Goal 15% Good
Missing Data

E-7
Gap Analysis – Bridge 10-year Forecast
30.0%
40.0%
50.0%
60.0%
70.0%
80.0%
90.0%
100.0%
% NHS Bridges - Bridge Condition by Deck Area
Poor
Fair
Good
Poor Trend
Good Trend
Goal 7.6% Poor
Goal 40% Good
30.0%
40.0%
50.0%
60.0%
70.0%
80.0%
90.0%
100.0%
% non-NHS Bridges - Bridge Condition by Deck Area
Poor
Fair
Good
Poor Trend
Good Trend
Goal 7.5% Poor
Goal 40% Good

F-1
Appendix F: Life Cycle Planning
This section describes the process DOT&PF is using to conduct Lifecycle Planning (LCP) Analysis. DOT&PF used the following reference as guidance for this Appendix - Using a Life Cycle Planning Process to Support Transportation Asset Management: A Handbook on Putting the Federal Guidance into Practice. FHWA-HIF-19-006. Federal Highway Administration, January 2019. https://www.fhwa.dot.gov/asset/guidance/hif19006.pdf
Background In May 2013, the DOT&PF was described as being in the “awakening” stage of Asset Management maturity (AASHTO TAM Guide, 2011), where a basic set of capabilities are in place for a few types of assets, but these are not yet integrated into department-level decision making.
DOT&PF is implementing AgileAssets version 7.3, a Pavement Management System (PMS), and AASHTOWare Bridge Management software (BrM), a Bridge Management System (BMS). The PMS and BMS that DOT&PF acquired meet the analysis capabilities required for LCP and are compliant with the federal requirements. Implementation of the BMS and the PMS has begun however, as of January 2019, neither were fully operational.
In place of full functioning PMS and BMS, DOT&PF opted to use a spreadsheet tool provided by TAMP consultants APTech in order to perform an LCP analysis compliant with the federal requirements for the June 2019 TAMP submission. The spreadsheet-based LCP tool is capable of analyzing various life cycle scenarios and simulating changes in network conditions associated with different levels of investment. The tool was specifically developed to support state DOT’s in developing a 10-year TAMP LCP analysis in the absence of a fully operational PMS and/or BMS. Although the spreadsheet tool is not as sophisticated as a PMS or BMS and does not meet the requirements outlined in 23 CFR 515.17, it provides a temporary alternative to DOT&PF as the agency completes the implementation of its PMS and BMS.
The LCP processes described in this appendix are documented procedures, using the LCP spreadsheet, to determine the benefit cost over the life cycle of assets to evaluate alternative strategies, including no-investment decisions. This process will estimate the cost of managing National Highway System (NHS) bridges and pavements over their whole life with consideration for minimizing cost while preserving the condition.
DOT&PF is working on improving both the PMS and BMS to perform the basic analysis required for LCP and be compliant with the federal regulations. With the implementation of the new systems estimated to be completed March 2020 and defined business process, DOT&PF will increase the current Transportation Asset Management maturity level from “awakening” to “structured.”

F-2
Objectives DOT&PF is just beginning to perform LCP. Staying with the TAM motto to “start simple and grow smart,” our objectives are:
• Move away from a “worst first” investment strategy and focus on cost effective preservation on our connected road system and when it makes sense for remote, rural communities;
• Determine the funding needed in each work type to meet our established targets which is our desired state of good repair (SOGR);
• Use deterioration models to predict future conditions; • Reduce the cost of annual expenditures without negatively impacting asset
condition using management system outputs and profession judgment; • Educate internal and external stakeholders on why LCP is the most efficient use
of public funds and how budget cuts affect asset condition over time; • Once the management systems are fully functional, develop a plan for every
NHS Bridge and road segment using age, condition and demand as the primary criteria.
The LCP Analysis Process DOT&PF has developed its process using the five-step model described in this guidance and as illustrated in Figure F.2. The process DOT&PF developed will estimate the cost of managing bridges and pavements over their whole life with consideration for minimizing cost while preserving the condition.
Figure F.2. LCP Process for Transportation Assets
Step 1. Select Asset Classes and Networks To Be Analyzed. DOT&PF will perform an LCP on NHS Bridges and Pavement. To support analysis in the spreadsheet tool, DOT&PF identified asset subgroups and subnetworks that represented different performance characteristics. This is described in more detail in

F-3
step 2, below. For pavements the Central and Southcoast Regions were combined into one subnetwork, with the Northern Region as a separate subnetwork, due to differences in performance. Both pavement subnetworks were subdivided into high volume (AADT >5,000) and low volume (AADT ≤ 5,000) roadways resulting in a total of 4 pavement subnetworks. For bridges, DOT&PF divided the network into NHS bridges and state-owned non-NHS bridges. The subnetworks were subdivided into 3 asset subgroups based on material classes (concrete, steel and timber).
The pavement and bridge asset subgroups and subnetworks summarized in table F.1.
Asset Class Network Subnetwork Subgroup
Pavement NHS
Central and Southcoast Regions High Volume Central and Southcoast Regions Low Volume
Northern Region High Volume
Northern Region Low Volume
Bridge
NHS
All Regions
Steel Concrete Timber
Non-NHS Steel
Concrete Timber
Table F.1. DOT&PF Asset Class, Networks and Subgroups
Step 2. Define LCP Strategies Since 2002, DOT&PF has focused on “worst first.” This worst first strategy has resulted in a good overall condition of the state’s Interstate and non-Interstate NHS network pavement and a low percentage of poor bridges and Interstate IRI around less than 10% poor.
Using this strategy, a forecast of needs was included in the 2016 LRTP. This forecast states the total 23-year need is $10.3 billion, which includes $1.2 billion to address the backlog. For pavements, the LRTP listed an annual need of $253 million for pavement and $24.2 million for bridges. Figure 3 shows how this average annual need compares to forecasted needs by year for bridges. The need in the LRTP was based on a target of having no more than 5 bridges being structurally deficient, i.e. in poor condition. That target was changed to a desired SOGR for the TAMP of having no more than 10% of the deck area being structurally deficient (for both NHS and non-NHS bridges).

F-4
Figure F.3.
LRTP Bridge Life Cycle Management Predictions
As described in the LCP objectives, the DOT&PF desires to move away from worst-first to maximize the potential of maintaining conditions with projected funding. With so few assets currently in poor condition, the DOT&PF is in an excellent position to maintain good infrastructure for longer using preservation strategies. The DOT&PF used the LCP spreadsheet tool to evaluate long-term scenarios representing different strategy approaches by varying the prioritization and relative funding levels of the following work types:
• Preservation (includes minor rehabilitation) • Rehabilitation • Reconstruction.
These initial runs assumed Routine Maintenance would continue at current levels, based on historical work. The DOT&PF expects to improve on these estimates once until the Agile Assets Maintenance Management System is implemented; this analysis also excluded New Construction. DOT&PF will perform life cycle cost planning on New Construction or New Connections when adding a brand-new road, to show the benefits to the State of Alaska versus the costs over time. Figure F.4 displays how each of these work types apply to the lifecycle of a typical highway infrastructure asset.

F-5
Figure F.4. Asset Life Cycle Stages
The LCP spreadsheet provides an analysis approach to evaluate and compare different strategies to maintain the desired SOGR. Without long-term experience LCP analysis, DOT&PF relied on the Technical Team’s and Pavement Sub-Team’s professional judgment to guide the analysis and to develop lifecycle decisions. Eventually, the PMS and BMS systems will forecast future conditions based on funding and investment strategies using a more robust engineering economic analysis.
Step 3. Set Lifecycle Planning Scenario Inputs The primary inputs to each LCP scenario are summarized below:
Desired SOGR: DOT&PF targets are the desired SOGR and there is no differential between urban and rural. DOT&PF’s targets are summarized as follows:
• Interstate pavement – 10% Poor and 20% Good
• Non-Interstate NHS – 15% Poor and 15% Good
• NHS and non-NHS bridges – 10% Poor and 40% Good
– Internal goal is 7.5% Poor For LCP analysis, the performance target for bridges was revised to a target of no more than 10% of the deck area being structurally deficient (SD), as per the Federal definition, for both NHS and non-NHS bridges. This target was determined through conversations with DOT&PF staff and as part of TAM team workshop with MPOs in August 2017. The workshop identified and evaluated external factors that would influence future conditions and effect the targets.

F-6
Analysis Period For this year’s TAMP submission, DOT&PF analyzed both bridges and pavements over a 10-year period (2019 to 2028).
Condition Categories and Treatments For pavements, DOT&PF selected 5 condition categories. Each condition category was assigned a treatment type as summarized in Tables F.2 and F.3. For pavements, Excellent aligns with the Federal performance measure for pavements in Good condition, and Poor aligns with the Federal performance measure for pavements in Poor condition. For bridges, Poor aligns with the Federal definition for SD.
Pavement Condition Category Treatment Type Excellent Do Nothing/Routine Maintenance
Good Preservation Treatment High Fair PM Treatment* Low Fair Rehabilitation
Poor Reconstruction * Includes minor rehabilitation
Table F.2. Pavement Condition Categories
Bridge Condition Category Treatment Type
Excellent Do Nothing/Routine
Maintenance Good Preservation Treatment Fair Rehabilitation Poor Replacement
Table F.3. Bridge Condition Categories
Asset Inventory The initial pavement inventory was based on DOT&PF’s 2018 collection cycle data. Pavement segments that fell on a bridge were ignored from the total count. In addition, measurements taken in a non-2018 collection year, non-DOT&PF managed roads, and non-asphalt roads were also excluded from the count.
The initial bridge inventory was determined based on the 2017 national bridge inventory (NBI) data set maintained by the FHWA.
Within the LCP tool, the inventory of each asset class is associated to the appropriate asset subgroups, subnetworks, and condition categories. Table F.4 shows an example of the table format for the DOT&PF’s pavements.

F-7
Subnetwork Subgroup
Initial Pavement Mileage by Condition Category Total
C/L Miles Excellent Good High
Fair Low Fair Poor
Central and Southcoast Regions High Volume 104 73 83 50 10 318.9
Central and Southcoast Regions Low Volume 200 130 76 45 9 460.4
Northern Region High Volume 26 22 37 8 1 93.7 Northern Region Low Volume 226 217 337 224 63 1,066.9
Table F.4. Pavement Initial Inventory
Treatment Unit Costs The pavement treatment unit costs were determined using DOT&PF’s pavement management team’s data on each region’s traffic control costs and major costs associated with utilities, signal poles, lighting, etc. To factor in the cost of paving shoulders, a lane adjustment multiplying factor of 2.1 was used on the centerline miles. However, because most of the high-volume roadways in Anchorage (Central region) and Fairbanks (Northern region) are 3 lanes rather than 2, a lane adjustment factor of 3 was used on the Central and Southcoast, and Northern high-volume pavement subgroups.
For bridges, the Bridge team evaluated the long range transportation plan (LRTP) cost data by bridge type and found it was not adequate for the LCP. Therefore, to determine the treatment unit costs, the, Bridge team evaluated projects that contained bridge work from 2010 to 2018. The evaluation included the work type, bridge material type, size and cost. A large contingency was added to include construction administation, traffic control and other factors to calculate a “loaded” rate.
The pavement and bridge treatment unit costs are summarized in tables F.5 and F.6.
Subnetwork Subgroup Treatment Unit Costs by Condition Category, $/C/L mi.
Excellent Good High Fair Low Fair Poor Central and Southcoast Regions
High Volume $ - $528,000 $1,056,000 $2,640,000 $7,920,000
Central and Southcoast Regions
Low Volume $ - $300,263 $569,184 $2,112,000 $3,696,000
Northern Region High Volume $ - $528,000 $950,400 $2,428,800 $6,864,000
Northern Region Low Volume $ - $300,263 $569,184 $2,112,000 $2,640,000
Table F.5. Pavement Treatment Unit Costs

F-8
Subnetwork Subgroup Treatment Unit Costs by Condition
Category, $/Sq.Ft Excellent Good Fair Poor
NHS All Regions Concrete $ - $75 $500 $700 NHS All Regions Steel $ - $125 $700 $975 NHS All Regions Timber $ - $30 $300 $200 Non-NHS All Regions Concrete $ - $75 $500 $700 Non-NHS All Regions Steel $ - $125 $700 $975 Non-NHS All Regions Timber $ - $30 $300 $200
Table F.6. Bridge Treatment Unit Costs
The treatment unit costs will be updated as current construction project and maintenance work orders are completed and entered into the management systems. Once the management systems are fully operational, DOT&PF will develop a strategy for minimizing the life cycle costs for the bridges and pavements on the NHS.
Performance Models Deterioration models provide predictive capability to forecast future pavement needs. High level information from the PMS was transferred into the LCP tool. For each asset subgroup, deterioration rates were developed based on the length of the window of opportunity of each condition category. For pavements, plots of the raw distress value versus the next drop in the distress value for roughness (IRI), rutting and fatigue cracking when there were at least 100 tenth-mile segments over the entire network were developed. The deterioration rates were then revised based on the primary distresses in each pavement subgroup which are summarized below:
• Central and Southcoast region high volume roadways – IRI and rutting. Roads deteriorate fast due to studded tire rutting and roughness due to curb and gutter issues in urban conditions.
• Central and Southcoast region low volume roadways – IRI. • Northern region high volume roadways – IRI. • Northern region low volume roadways – IRI, particularly as several of the roads
are built over unstable embankments.
The deterioration models showed that roadways in the Central and Southcoast region deteriorated similarly whereas Northern Region roadways with permafrost conditions were not similar. For example, high volume Northern Region roadways remain in “Excellent” condition between an age of 0 and 5 years requiring routine maintenance before moving into “Good” condition from years 5 to 10 where the roadway can receive a preservation treatment at a given cost. Figure F.4 below shows an example of the pavement deterioration rate for the Central and Southcoast high volume pavement subgroup.

F-9
Figure F.4. Central and Southcoast High Volume Roadway Deterioration Rates
For bridges, the deterioration rates were initially developed based on the deterioration stages in BrM. The initial deterioration rates were compared to the deterioration rates within the 2018 TAMP. Afterwards, historic data on the treatment windows for concrete, steel and timber bridges was used to further refine the deterioration rates and develop individual rates for each bridge subgroup.
There are variations between the anticipated treatments shown in the LRTP with the timing recommended by the Bridge Team. DOT&PF used the Bridge team’s recommended timing to run LCP scenarios using the LCP tool. Figure F.5 below shows an example of the bridge deterioration rates for the NHS concrete bridge subgroup.
Figure F.5. NHS Concrete Bridges Deterioration Rates

F-10
Annual Funding / Budget (for entire network): The LCP tool divides the 10-year budget into annual allocations, then allocates that budget among the asset subnetworks and subgroups. Within each asset subgroup, the budget is further subdivided by each asset condition category (defined in “condition categories and treatments” section of step 3). Tables F.7 and F.8 summarize the budget allocations for pavements and bridges, respectively.
Subnetwork Subgroup % State Budget
by Subgroup
Percent Class Budget by Condition Category
Excellent Good High Fair
Low Fair Poor
Central and Southcoast Regions
High Volume 35% 0% 10% 29% 6% 55%
Central and Southcoast Regions
Low Volume 15% 0% 10% 26% 9% 55%
Northern Region High Volume 7% 0% 10% 29% 6% 55%
Northern Region Low Volume 43% 0% 10% 26% 9% 55%
Table F.7. Pavement Budget Breakdown
Subnetwork Subgroup % State
Budget by Subgroup
Percent Class Budget by Condition Category
Excellent Good Fair Poor NHS All Regions Concrete 33% 0% 7% 60% 33% NHS All Regions Steel 34% 0% 7% 60% 33% NHS All Regions Timber 0% 0% 7% 60% 33%
Non-NHS All Regions Concrete 15% 0% 7% 60% 33% Non-NHS All Regions Steel 15% 0% 7% 60% 33% Non-NHS All Regions Timber 3% 0% 7% 60% 33%
Table F.8. Bridge Budget Breakdown
The inputs used for the bridge LCP scenarios used a funding split between the NHS and non- NHS. For the current STIP LCP scenario, a funding split of 78/22 (NHS/non-NHS) was used. Several funding splits between NHS/non-NHS were evaluated for meeting targets: 75/25; 67/33; and 50/50 for the Level 3 analysis. The best funding split was 67/33 and this was used for all the LCP analyses except for the scenarios previously mentioned. Another bridge input needed was dividing the budget based on bridge material (concrete; steel; and timber) based on the current condition of the bridges. For example, there are only 16,854 square feet of timber bridges out of 4,122,711 square feet of bridge on the NHS. More than half of the timber bridges are in good condition, so 1 percent to no funding was budgeted for NHS timber – it is not needed. The other funding levels were divided up based on the amount of bridge deck area and the bridges’ current conditions.

F-11
The optimized budget split used is 67 percent on the percent NHS and 33 percent on the percent non- NHS. In the TAMP DOT&PF will just be showing the NHS values.
Discount and Inflation Rates: For this year’s TAMP submission, the analysis for both pavements and bridges were performed without a discount or inflation rate.
Risks The LCP tool that was used in this analysis doesn’t have the same capabilities of a fully-fledged PMS or BMS, therefore, the determination of what adjustments needed to be made to determine the most optimal strategies were done manually.
Step 4: Develop Life Cycle Planning Scenarios Step 4 involves the development of LCP scenarios using the strategies defined in Step 2 and the inputs from Step 3. The primary driver in this process is determining the amount of budget available for the TAMP and then the amount of budget required to be able to implement the optimal LCP strategy. DOT&PF accomplished this task by analyzing the STIP, the 3-year extension of the STIP, the LRTP, and national highway performance program (NHPP) funding. DOT&PF determined that an annual budget of $193M is available from all the funding sources. However, after several iterations of the analysis, it was determined that an annual budget of $86.25M and $47M on pavements and bridges, respectively, resulting in a combined budget of $133.25M is required to meet the optimal LCP strategies.
Using the APTech developed LCP tool, DOT&PF ran many scenarios including the three scenarios as listed below.
Level 1 = No investment. This LCP scenario shows how the conditions will deteriorate with no investment.
Level 2 = No financial constraints or high budgets. In this LCP scenario, all pavements and bridges get the recommended work based on age and condition.
Level 3 = Financial constraints based on budgeting to meet targets. Multiple scenarios were run to determine what level of investment is needed to meet the minimum condition Interstate IRI, SD and both Good and Poor targets in 4-years. The scenario must remain at the target for the 10-year TAMP duration to meet those performance measures, national goals and state set targets. This level lead to several iterations based on political or environmental factors. Each level 3 scenario was run with input for a worst first (larger budget toward poor infrastructure) and optimized (larger budget toward preservation – good and fair infrastructure). The tool routinely showed better performance with the optimized budget.
The following list summarizes the other LCP scenarios that were run as part of the iterative process to determine the optimal LCP scenario.

F-12
1) No Investment. 2) Conditions improve over a 10- year period with an investment value that
produces “no poor” infrastructure in 10 years. 3) Funding level to meet targets used in the LRTP –“Worst First” and “Optimized.” 4) Current Investment Practices using STIP levels – “Worst first” and “Optimized.”
a) Conditions if we continue our current investment practices. 5) Optimized Investment level to meet state of good repair/targets.
a) Budgets High/Low and Just right. 6) Reduced Budget: Maintain Current Conditions.
a) We can maintain our current conditions with a slight reduction in budget. 7) Reduced Budget: Maintain Poor Condition and Allow Good to Decrease
a) We exceed our current “Good” target and can decrease funding moderately if required while still meeting our targets after the 10-year period
8) Condition with Idealized Strategy a) Increase preservation, reduce reconstruction to improve conditions with our
current budget. This scenario is not currently realistic and only serves as an example of what we may eventually achieve.
The LCP tool was able to predict future conditions given budgets for the scenarios above. The tool did a good job at predicting the long-term effects of different investment strategies. For example, directing funds to pavement or bridge preservation over rehabilitation or reconstruction significantly improved long term conditions. The LCP tool developed an ideal LCP scenario that meets the desired SOGR for a 10-year period. At the same time, it was apparent the tool uses generalized deterioration modeling, and has a limitation in using an age range approach to deterioration compared to distress- based deterioration, as will be used in the PMS and BMS when fully functional.
These investment strategies for pavements, and associated inputs, were reviewed initially by the Pavement and Bridge sub-teams, and then by the full Technical Team, with feedback given from both reviews. The teams felt the results from the LCP tool were reasonable, although once the PMS and BMS are configured and online, the scenarios should be confirmed through the management systems, and updated as necessary.
DOT&PF will re-run these scenarios if additional funding becomes available or if other priorities require federal funding that will reduce the funding available for NHS bridges and pavements. An example would be a large new road connection or a ferry purchase. DOT&PF will submit the changes in a revised approved TAMP to submit to FHWA.
Step 5: Provide Input to Financial Planning DOT&PF asset management staff provided the ideal 10-year funding scenario needed to meet performance measure targets to DOT&PF Planning and Programming Staff to use when developing the STIP. The Planning staff will evaluate the expected level of funding compared with the funding needed for maintaining performance measures. If there are scenario changes needed due to funding, political or environmental changes,

F-13
new scenarios will be run. The LCP tool was used both for the LCP analysis and to develop the investment strategies for the 10-year financial plan in sections 4 and 5, Financial Plan and Investment Strategies.
10-year Analysis Summaries Due to the iterative nature of the LCP tool analysis process, the development of LCP scenarios led back to Steps 2 and 3 to refine the LCP inputs and develop new and revised strategies.
The resulting outputs summarize the number of miles or square feet treated in each condition category, the total amount spent, and the percent of the system that meets the desired SOGR so that DOT&PF is able to identify the most practicable strategy to minimize life cycle costs while striving to achieve desired pavement and bridge conditions.
Figures F.6 and F.7 illustrate the results of the LCP analysis for the selected LCP strategies for all NHS pavements and NHS bridges expressed in terms of the Federal definitions of Good, Fair and Poor (G/F/P), respectively.
Figure F.6.
NHS Pavements Federal G/F/P Ratings Summary

F-14
Figure F.7.
NHS Bridges Federal G/F/P Ratings Summary

F-15
The following graphs are the results of the life cycle planning performed using the APTech Tool.
Bridge Scenarios 1) Do nothing/zero investment
0%
10%
20%
30%
40%
50%
60%
70%
80%
90%
100%
2019 2020 2021 2022 2023 2024 2025 2026 2027 2028
NHS Bridge Condition
Good Fair Poor
0%
10%
20%
30%
40%
50%
60%
70%
80%
90%
100%
2019 2020 2021 2022 2023 2024 2025 2026 2027 2028
non-NHS Bridge Condition
Good Fair Poor

F-16
2) $175M Annual Budget needed to have “no poor” bridges in 10 years
Optimized Budget 2% to good bridges; 60% budget to fair and 38% of budget to poor
0%
10%
20%
30%
40%
50%
60%
70%
80%
90%
100%
2019 2020 2021 2022 2023 2024 2025 2026 2027 2028
NHS Bridge Condition
Good Fair Poor
0%
10%
20%
30%
40%
50%
60%
70%
80%
90%
100%
2019 2020 2021 2022 2023 2024 2025 2026 2027 2028
non-NHS Bridge Condition
Good Fair Poor
$106.75 M NHS
$68.25M Non NHS

F-17
3) LRTP Budget $35M per year needed to meet targets <10% poor (NHS only)
Optimized –2% budget for Good bridges; 70% budget for Fair Bridges and 28% budget for Poor bridges
Worst First 2% budget for Good bridges; 28% budget for Fair Bridges and 70% budget for Poor bridges
0%
10%
20%
30%
40%
50%
60%
70%
80%
90%
100%
2019 2020 2021 2022 2023 2024 2025 2026 2027 2028
NHS Bridge Condition
Good Fair Poor
0%
10%
20%
30%
40%
50%
60%
70%
80%
90%
100%
2019 2020 2021 2022 2023 2024 2025 2026 2027 2028
NHS Bridge Condition
Good Fair Poor
11% Poor in 2027

F-18
4) Current Investment Practices using STIP levels $50M–“Worst first and Optimized”
Current STIP budget 78% NHS and 22% non NHS; Worst First 2% budget toward good; 40% Fair 58% Poor
0%
10%
20%
30%
40%
50%
60%
70%
80%
90%
100%
2019 2020 2021 2022 2023 2024 2025 2026 2027 2028
NHS Bridge Condition
Good Fair Poor
0%
10%
20%
30%
40%
50%
60%
70%
80%
90%
100%
2019 2020 2021 2022 2023 2024 2025 2026 2027 2028
non-NHS Bridge Condition
Good Fair Poor

F-19
Current STIP budget 78% NHS and 22% non NHS; Optimized 2% budget toward good; 70% Fair 28% Poor
0%
10%
20%
30%
40%
50%
60%
70%
80%
90%
100%
2019 2020 2021 2022 2023 2024 2025 2026 2027 2028
NHS Bridge Condition
Good Fair Poor
0%
10%
20%
30%
40%
50%
60%
70%
80%
90%
100%
2019 2020 2021 2022 2023 2024 2025 2026 2027 2028
non-NHS Bridge Condition
Good Fair Poor
NOTE: Need to shift money to the NHS

F-20
5) Current Investment Practices using STIP levels $50M–“Optimized” only shifting $ to non NHS
0%
10%
20%
30%
40%
50%
60%
70%
80%
90%
100%
2019 2020 2021 2022 2023 2024 2025 2026 2027 2028
NHS Bridge Condition
Good Fair Poor
0%
10%
20%
30%
40%
50%
60%
70%
80%
90%
100%
2019 2020 2021 2022 2023 2024 2025 2026 2027 2028
non-NHS Bridge Condition
Good Fair Poor
Some improvement in non NHS- too close to target for NHS increase funding.

F-21
6) LOW $65 M annual budget –“Optimized” 67% to NHS and 33% to non NHS
0%
10%
20%
30%
40%
50%
60%
70%
80%
90%
100%
2019 2020 2021 2022 2023 2024 2025 2026 2027 2028
NHS Bridge Condition
Good Fair Poor
0%
10%
20%
30%
40%
50%
60%
70%
80%
90%
100%
2019 2020 2021 2022 2023 2024 2025 2026 2027 2028
non-NHS Bridge Condition
Good Fair Poor
NHS within targets but non NHS is not. Next scenario increase funding

F-22
7) HIGH $85 M annual budget –“Optimized” 67% to NHS and 33% to non NHS
0%
10%
20%
30%
40%
50%
60%
70%
80%
90%
100%
2019 2020 2021 2022 2023 2024 2025 2026 2027 2028
NHS Bridge Condition
Good Fair Poor
0%
10%
20%
30%
40%
50%
60%
70%
80%
90%
100%
2019 2020 2021 2022 2023 2024 2025 2026 2027 2028
non-NHS Bridge Condition
Good Fair Poor
Both NHS and non NHS within Targets

F-23
8) “Just Right” $75 M annual budget –“Optimized” 67% to NHS and 33% to non NHS
0%
10%
20%
30%
40%
50%
60%
70%
80%
90%
100%
2019 2020 2021 2022 2023 2024 2025 2026 2027 2028
NHS Bridge Condition
Good Fair Poor
0%
10%
20%
30%
40%
50%
60%
70%
80%
90%
100%
2019 2020 2021 2022 2023 2024 2025 2026 2027 2028
non-NHS Bridge Condition
Good Fair Poor
Both NHS and non NHS within Targets with a $10M budget decrease from the $85M scenario

F-24
Pavement Scenarios A) Do nothing/zero investment
B) $150M Annual Budget needed to have “no poor” pavements in 10 years
0%
10%
20%
30%
40%
50%
60%
70%
80%
90%
100%
2019 2020 2021 2022 2023 2024 2025 2026 2027 2028
Interstate and Non-Interstate NHS Pavement
Good Fair Poor
0%
10%
20%
30%
40%
50%
60%
70%
80%
90%
100%
2019 2020 2021 2022 2023 2024 2025 2026 2027 2028
Interstate and Non-Interstate NHS Pavement
Good Fair Poor

F-25
C) Current Investment Practices using STIP level $125M
Worst First Investments – high reconstruction low preservation
Optimized Investments – low reconstruction, high preservation and moderate
rehabilitation
D) Investment levels to meet state of good repair/targets
High Budget - $100M – Current Investment Practices – 6% Poor, 15% Good
0%
10%
20%
30%
40%
50%
60%
70%
80%
90%
100%
2019 2020 2021 2022 2023 2024 2025 2026 2027 2028
Interstate and Non-Interstate NHS Pavement
Good Fair Poor
0%10%20%30%40%50%60%70%80%90%
100%
2019 2020 2021 2022 2023 2024 2025 2026 2027 2028
Interstate and Non-Interstate NHS Pavement
Good Fair Poor

F-26
Low Budget - $40M - Optimized Investment Strategy – 14% Poor, 15% Good
Moderate Budget - $75M -– Optimized Investment Strategy – 9% Poor, 15% Good
0%
20%
40%
60%
80%
100%
2019 2020 2021 2022 2023 2024 2025 2026 2027 2028
Interstate and Non-Interstate NHS Pavement
Good Fair Poor
0%
50%
100%
2019 2020 2021 2022 2023 2024 2025 2026 2027 2028
Interstate and Non-Interstate NHS Pavement
Good Fair Poor
0%10%20%30%40%50%60%70%80%90%
100%
2019 2020 2021 2022 2023 2024 2025 2026 2027 2028
Interstate and Non-Interstate NHS Pavement
Good Fair Poor

F-27
E) 115M Investment level to maintain current poor conditions using current practices
4% Poor, 17% Good
0%
10%
20%
30%
40%
50%
60%
70%
80%
90%
100%
2019 2020 2021 2022 2023 2024 2025 2026 2027 2028
Interstate and Non-Interstate NHS Pavement
Good Fair Poor

G-1
Appendix G Risk Management
Risk management is a systematic process that involves the identification, assessment, planning, and management of threats and opportunities faced by programs, processes, and projects. To develop a 10-year TAMP with investment strategies to sustain a state of good repair, DOT&PF must identify and evaluate risks to those identified investment strategies. Figure G-1 provides an overview of the five-step risk management process that DOT&PF follows to manage risks related to investments in and the performance of pavements and bridges on the National Highway System in Alaska.
© 2017 Applied Pavement Technology
Figure G-1. The Risk Management Process
The agency follows the first four steps of this process to develop a risk register (shown in table G-1), which documents the highest priority risks and identifies the strategies and actions the agency will take to mitigate those risks. The risk register is used as a management tool in the fifth step, Manage Risks, to support and track execution of the risk mitigation strategies and actions. To support this, the risk register identifies individuals responsible for tracking and reporting on the implementation of each mitigation strategy or action.
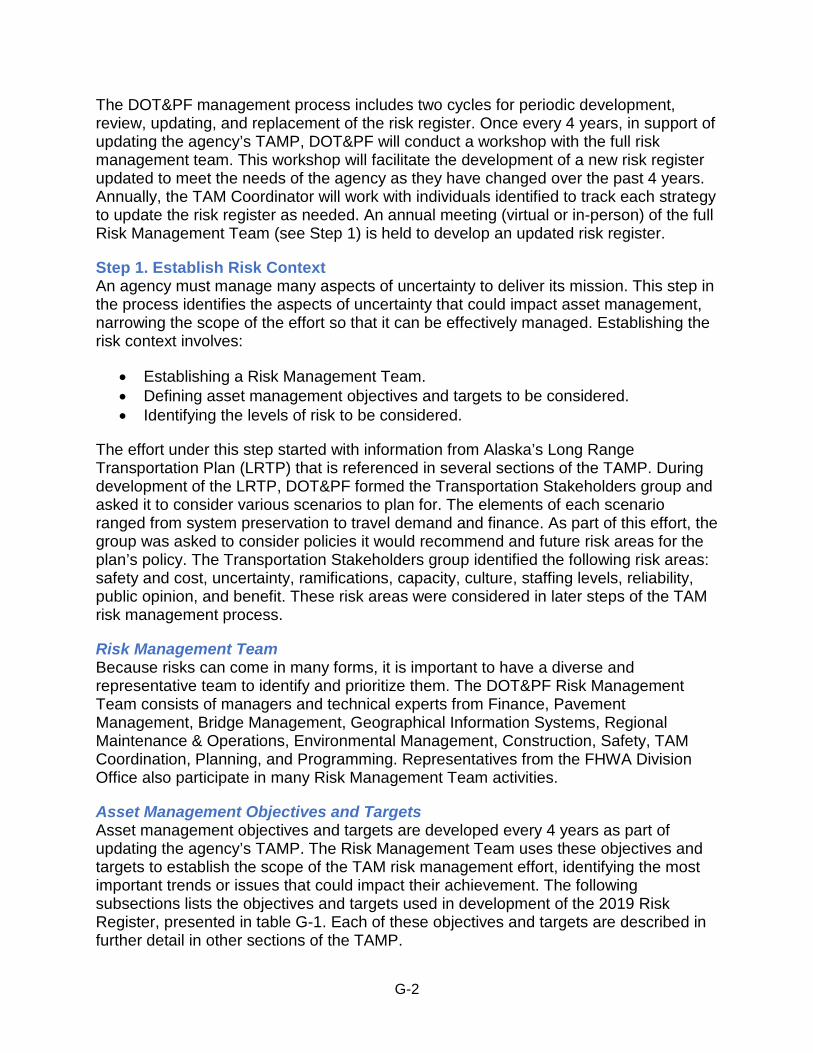
G-2
The DOT&PF management process includes two cycles for periodic development, review, updating, and replacement of the risk register. Once every 4 years, in support of updating the agency’s TAMP, DOT&PF will conduct a workshop with the full risk management team. This workshop will facilitate the development of a new risk register updated to meet the needs of the agency as they have changed over the past 4 years. Annually, the TAM Coordinator will work with individuals identified to track each strategy to update the risk register as needed. An annual meeting (virtual or in-person) of the full Risk Management Team (see Step 1) is held to develop an updated risk register.
Step 1. Establish Risk Context An agency must manage many aspects of uncertainty to deliver its mission. This step in the process identifies the aspects of uncertainty that could impact asset management, narrowing the scope of the effort so that it can be effectively managed. Establishing the risk context involves:
• Establishing a Risk Management Team. • Defining asset management objectives and targets to be considered. • Identifying the levels of risk to be considered.
The effort under this step started with information from Alaska’s Long Range Transportation Plan (LRTP) that is referenced in several sections of the TAMP. During development of the LRTP, DOT&PF formed the Transportation Stakeholders group and asked it to consider various scenarios to plan for. The elements of each scenario ranged from system preservation to travel demand and finance. As part of this effort, the group was asked to consider policies it would recommend and future risk areas for the plan’s policy. The Transportation Stakeholders group identified the following risk areas: safety and cost, uncertainty, ramifications, capacity, culture, staffing levels, reliability, public opinion, and benefit. These risk areas were considered in later steps of the TAM risk management process.
Risk Management Team Because risks can come in many forms, it is important to have a diverse and representative team to identify and prioritize them. The DOT&PF Risk Management Team consists of managers and technical experts from Finance, Pavement Management, Bridge Management, Geographical Information Systems, Regional Maintenance & Operations, Environmental Management, Construction, Safety, TAM Coordination, Planning, and Programming. Representatives from the FHWA Division Office also participate in many Risk Management Team activities.
Asset Management Objectives and Targets Asset management objectives and targets are developed every 4 years as part of updating the agency’s TAMP. The Risk Management Team uses these objectives and targets to establish the scope of the TAM risk management effort, identifying the most important trends or issues that could impact their achievement. The following subsections lists the objectives and targets used in development of the 2019 Risk Register, presented in table G-1. Each of these objectives and targets are described in further detail in other sections of the TAMP.

G-3
Objectives • Treat pavements and bridges in Good and Fair condition before they deteriorate to
save money over the asset life cycle.
• Manage pavement and bridge data and analysis systems centrally to make recommendations through coordination with regional planning, preconstruction, and maintenance.
• Provide information to allow effective selection and design of future maintenance, rehabilitation, and reconstruction projects, including: o Accurate estimates of future conditions versus funding scenarios. o Displays of analysis results in understandable formats.
• Perform appropriate preservation on all national highway system (NHS) roadways maintained by DOT&PF.
• Develop preservation strategies for all pavement types, such as: o A gravel road preservation program. o A disinvestment strategy that converts very low-volume roads to gravel.
• Continue to implement a two-phase seismic retrofit program: o Phase 1 = most critical bridge deficiencies. o Phase 2 = vulnerabilities in bridge columns and foundations.
• Continue to support the seismic bridge retrofit program.
• Address scour-critical bridges in a prioritized manner.
• Develop geotechnical and vulnerable assets mitigation plan.
• DOT&PF upon executive approval would like to add the following assets in future TAMPs: o Road embankments. o Retaining walls. o Culverts. o Rock slopes. o Soil Slopes. o Material Sites. o Drainage Structures. o Tunnels.
o ADA. Targets
• Condition targets:

G-4
o Interstate pavement:
� Less than 10 percent: Poor
� At least 20 percent: Good o Non-Interstate NHS:
� Less than 15 percent: Poor o At least 15 percent: Good o NHS and non-NHS bridges:
� Less than 10 percent: Poor
� At least 40 percent: Good
� Internal goal is less than 7.5 percent Poor
• Replace or rehabilitate 1 to 3 Poor bridges per year
Levels of Risk As shown in figure G-2, there are three primary levels of risk that DOT&PF manage to deliver their mission. The TAMP risk management process is concerned with the two highest levels of risk: agency and program. These risks represent areas of uncertainty that could impact multiple projects or business areas. Project risks are better managed during program delivery processes such as STIP development, design, and construction.
Figure G-2. Risk Levels

G-5
Step 2. Risk Identification Risk identification is the process of identifying and describing aspects of uncertainty and their potential impacts on the organization. Risks are documented in a risk statement, composed in two parts. The first part of the risk statement is referred to as the if clause. An if clause identifies the potential event or occurrence that poses a threat or opportunity related to one or more of the TAM objectives and goals at the agency or program level. The second portion of the risk statement is called the then clause. Then clauses describe the possible, probable, or expected impacts should the If clause come to pass. Often there are multiple then clauses for each if clause, as each risk event is likely to result in multiple impacts. The risk register (Table G-1) is organized with separate columns for if and then clauses.
Quadrennial Risk Workshop For development of TAMP updates, the Risk Management Team will identify risks during an in-person risk workshop. During this workshop, participants will seek to identify as many risks as possible for consideration during risk analysis and evaluation.
Annual Review and Update During annual review, risk identification is handled by individual managers and members of the Risk Management Team. At least annually, the Chief Engineer or their designee will hold an in-person or virtual meeting with the Risk Management Team to assess the need to identify new risks in or remove risks from the risk register. This information will be used as described in step 5, Manage Risks.
Step 3. Risk Analysis Risk analysis is the process of determining and documenting the likelihood and impact of each risk statement. To ensure this is done consistently for all risk and by all Risk Management Team members, DOT&PF developed the risk matrix shown in figure G-3. The risk matrix is used during the Quadrennial Risk Workshop to analyze all identified risks and during annual updates to analyze any new risks that have been identified for inclusion in the risk register. The results of this analysis are used as inputs in step 4, Risk Evaluation.
Step 4. Risk Evaluation Risk Evaluation is the process of prioritizing risks. This is similar to risk assessment, but it considers the agency’s risk threshold, or appetite to tolerate uncertainty, as well as the agency’s capacity to mitigate risks. During this step of the Quadrennial Workshop, the Risk Management Team identifies potential risk mitigation strategies or actions that could serve to reduce the likelihood or impact of threats, improve the agency’s ability to respond should a threat come to pass, or allow the agency to take advantage of opportunities. Following the workshop, the team works by web meeting and conference call to finalize the list of mitigation strategies to be implemented during the TAMP timeframe. These selected mitigation strategies are shown in the right-hand column of the risk register, table G-1.

G-6
Risk Matrix
Figure G-3. DOT&PF TAM Risk Matrix
During its annual review of risks, the Risk Management Team will consider changes to the risk mitigation strategies based on recommendations by the individuals assigned to track and report on each risk. The annual review of mitigation strategies is discussed further in step 5, Manage Risks.
Step 5. Manage Risks Risks are managed through implementation of the selected mitigation strategies. The following subsections describe the risks identified and documented and how the groups primarily responsible for managing the assets included in the TAMP will be responsible for managing risks to those assets and the related TAM objectives and targets.
Risk Register The following risk register documents the risks identified within the context of risk-management and beyond the agency’s risk tolerance. Each of the identified risks has at least one mitigation strategy that Department will pursue and track through its asset management implementation. The organizational unit responsible for implementing and reporting on each mitigation strategy is identified in the register.

G-7
Summary of Key Risk Mitigation Strategies
MANAGEMENT SYSTEM/DATA RISK
Seismic Activity Alaska is the most seismically active state in the United States. The earth’s most active seismic feature, the circum-Pacific seismic belt, brushes Alaska and the Aleutian Islands, where more earthquakes occur than in the other 49 states1 combined.
In 1995 the Department implemented a seismic retrofit program for bridges using hazard data from the U.S. Geological Survey. This data, together with seismic vulnerability assessment of bridges and determination of priority highway routes, have resulted in the prioritization of bridges for seismic retrofit.
The Department retrofits bridges in an attempt to prevent collapse during an earthquake. Phase 1 of the program addresses the most critical bridge deficiencies that can be accomplished for the least cost. Phase 2 of the program is intended to address vulnerabilities in the bridge columns and foundations, which are typically much more expensive to correct. The program is currently funded at $6 million over 3 years.
Resiliency Alaska’s diverse climates can be classified into five general climate regions: maritime, west coast, south central, interior, and arctic. The regions correspond to different climate-related impacts on temperature and precipitation. Weather events show changes in the timing, frequency, form, and intensity of precipitation, which may cause related and increasing natural processes. Impacts also include:
• Melting/warming permafrost. • Increased storm frequencies and intensity. • Increased coastal erosion due to lack of sea ice. • Increased river and shore erosion. • Sea level rise. • Increasing temperatures. • Debris flows. • Avalanches. • Floods. • Aufeis.
For DOT&PF, this means that construction costs will be higher to maintain frozen permafrost as temperatures rise, and maintenance and operations costs will increase if the warming trend continues. In 2015, Dalton Highway2 had major flooding due to ice buildup that caused water to flow over the highway, and spring breakup caused another round of flooding that washed sections of the gravel road away. This flooding caused road closures and resulted in $17 million in emergency repair costs.
1 http://earthquake.usgs.gov/earthquakes/states/alaska/history.php 2 http://www.dot.alaska.gov/nreg/dalton-updates/2015response.shtml

G-8
Flooding Bridges are designed to a 50-year flood event and a 100-year flood event for floodway areas. Bridges are designed so that they do not create a backwater situation. The capacity of the hydraulic feature is designed to protect the asset and existing infrastructure. Some rivers have large, braided channels with existing bridges, and the river can change direction. Maintenance crews work hard to maintain the river in its current location. Some risk is accepted by the Department for certain infrastructure.
Coastal Erosion Alaska has 20 coastal airports and 12 coastal highways. Facilities in coastal areas include roads, airports, harbors, and docks. Coastal areas are vulnerable because they could be affected by land-based changes in patterns of precipitation and temperature as well as increases in sea level and the number of storm-driven tides.3 Diminishing sea ice has reduced the natural coastal protection along Alaska’s northwestern coast. Coastal erosion is causing some shorelines to retreat at rates averaging tens of feet per year.4
Emergency Funding and Section 667 Emergency Relief (ER) funding is available through the Federal Highway Administration to restore essential travel, minimize the extent of damage, or protect remaining facilities. Eighty-seven projects required emergency funding in Alaska from 1998 through 2015. Repair projects were required in the following categories:
Earthquake Repairs 16% $24.8 million Storm Repairs 32% $50.0 million Flood Repairs 52% $83.2 million $158.0 million
Fifty percent of emergency funding is spent on projects in recurring places. Some of these reoccurring projects include:
Richardson Highway 3 projects Copper River 4 projects Haines Storm Damage 4 projects Kenai Flooding 10 projects Nome Flooding & Storm 14 projects
The number of projects by cost category:
# of projects Total $ in each category $250,000 or less 31 $3.5 million $1.0 million or less 22 $12.2 million $10.0 million or less 36 $86.7 million Over $10.0 million 4 $53.7 million
3 http://alaska.usgs.gov/science/doi_landscape/ely.html 4 http://www.epa.gov/climatechange/impacts-adaptation/alaska.html

G-9
$156.1 million The major emergency event in Alaska is flooding: $83 million, or 52.7 percent, of emergency funding was used for flooding. $50 million, or 31.6 percent, was used for emergencies from storms, and $24 million, or 15.7 percent, was spent on emergencies resulting from earthquakes.
The Department conducted a statewide evaluation to determine if there are reasonable alternatives to roads, highways or bridges5 that have required repair/reconstruction6 on two or more occasions due to emergency events7. Assets that have been damaged on two or more occasions since January 1, 1997, are defined as “Twice Damaged Assets”. Section 667 supports long-term investment decision-making in a manner that results in the conservation of federal resources and protection of public safety and health. The following 14 locations on the Richardson Highway that meets the requirements in Section 667; Mile Points (MP) 13.09 - 13.10; MP 17.30 - 17.42; MP 18.08 - 18.27; MP 18.36 - 18.46; 18.69 - 18.77; MP 19.18 - 19.24; MP 37.74 - 37.78; MP 49.67 - 49.69; MP 50.93 - 50.96; MP 51.83 - 52.16; MP 60.28 - 60.33; MP 60.51 - 60.57; MP 225.95 - 225.95; MP 229.75 - 229.77; MP 231.16 - 231.17
Process for Identifying Twice Damaged Assets for Emergency Repair or Reconstruction The figure below illustrates the process for identifying and assets that have been damaged twice since 1997 and reconstructing or repairing the damage.
5 Defined in 23 USC 101(a)(11) that is open to public but excludes tribal and federally owned infrastructure 6 Excludes emergency repairs under 23 CFR 668.103 7 Natural Disaster declared by the Alaska’s Governor or the President of the United States

G-10
Maintenance and Operations staff are the Department’s “first responders” to natural disasters and emergency events. The Regional M&O Chief contacts the Department’s Safety Office to coordinate a Governor’s emergency declaration and checks the GIS layer to see if the asset is a twice-damaged asset.
The Safety Office will include information to add to the GIS layer that includes date of event, declaration type, route identification and beginning/end milepoints.
M&O staff, with support as needed, prepares a Disaster Damage Inspection Report (DDIR) and follows the existing process with the addition of adding the asset to the twice damaged asset GIS layer for future tracking.
Assets that have been damaged twice need an Alternatives Evaluation prior to spending federal aid (excluding the emergency funding). Reasonable alternatives include options that could partially or fully achieve the following:
1. Reduce the need for Federal funds to be expended on emergency repair and reconstruction activities;
2. Mitigate or partially or fully resolve the root cause of the recurring damage to assets; or
3. Better protect public safety and health and the human and natural environment.
These alternatives need to be evaluated in the project design prior to construction activities.
Process for Evaluating Alternatives The Department created a GIS layer to locate assets damaged by natural disasters or catastrophic failure. The GIS layer includes the date of the event, declaration type, Route ID and beginning/end mile points, description of event or disaster, repair/reconstruction date, description of the repair/reconstruction, cost of the repair/reconstruction, alternative evaluations available.
The twice damage asset locations were compared to the current STIP locations. The list of those projects that need an alternatives evaluation are projects that are in the extended 10-year STIP plan, with years 6-10 to be evaluated next. A report on twice affected areas will be sent to Planning, Design and Construction annually.

G-11
RISK WORKSHOP RISK REGISTER
The Matrix below is the result of the November 13–14, 2018 Risk Workshop and follow up meetings to finalize risks, assign responsible unit, mitigation strategies and risk mitigation plans.
If … Then … Applicable Mitigation Strategies
Responsible Unit Risk Mitigation Plan
If actual funding is below current projections,
We risk paying more for facility and equipment maintenance, reprioritization of existing projects, and reorganization or decrease of existing State staff.
We may be unable to take full advantage of federal funds without state matching funds.
We may experience a shift in function / programs / services.
Reductions in seismic funding would lead to greater damage from seismic events than expected, leading to increased injuries, property damage, and deaths.
Implementing Pavement Management System and the Bridge Management System to support optimized investments for achieving targets and objectives. This includes systems that support these systems for example ESRI, MRS and AASHTOWare Project.
Pavement & Bridge
Implement the Pavement and Bridge Management Systems and the Transportation Asset Management System that includes other systems MRS. AASHTOWare Project to be able to predict future conditions on changing funding levels
If Alaska DOT&PF increases the number of assets (lights, facilities, lane miles) without a corresponding increase in maintenance
There will be a net reduction in maintenance across all assets.
Stop acquiring Poor assets (bridges) from other agencies.
Regional Directors / Planning
Asset Managers/M&O Continuous Communication with Regional Directors, Planners and Design. Bridge Design Manual
Present maintenance cost as part of the project development process and include as project criteria for
Planning
Scoring Criteria already in CTP for STP funds.
STIP Criteria in development for NHPP

G-12
If … Then … Applicable Mitigation Strategies
Responsible Unit Risk Mitigation Plan
resources, STIP projects.
Existing Policy & Procedure 09.01.010 requires local maintenance for a local expansion project.
funds, anticipated completion October 1, 2020.
Transfer assets to other agencies (e.g.
Municipalities, and tribes).
Regional Directors / Planning
Current process to work with legislative liaison and community leaders.
Goal - One transfer per year.
Look at design for maintenance savings. Examples: Design new bridges with bulb tee girders which require low maintenance for long periods of time or change smaller culverts to a large arch culvert or bridge.
Design/Bridge
Update Design Manuals with M&O savings in mind.
Tolerate reduced maintenance and communicate to the public how increased infrastructure reduces the level of service (LOS) for maintenance on all assets.
Public Information Officers
Continuous Communication already in place.
If the agency cannot deliver the program,
Infrastructure that would improve performance and safety would not be constructed or improved.
Keep sufficient number of trained project delivery staff (e.g., engineering/ROW/Env).
Regional Directors/Division Directors with Admin and HR staff
Core competency plan. Knowledge Management Initiative with succession planning

G-13
If … Then … Applicable Mitigation Strategies
Responsible Unit Risk Mitigation Plan
Take advantage of materials cost decreases by having contingency projects on hand, and if costs increase, use Advanced Construction (AC).
Planning, Regional Directors
Select shelf ready projects is a continuous process in place using Advance Construction in the STIP.
Improve scoping practices to improve schedule and financial planning accuracy.
Planning, Environmental, Preconstruction Regional Directors.
Develop a scoping standard operating procedure with detailed initial planning estimates.
Create connections between spending or policy plans (10-year plan, STIP, HSIP, SHSP).
Planning Internal 10-year extended STIP and Capital Review Meetings.
Ensure initial construction quality so asset performs as expected over the anticipated timeline and does not require premature investment.
Construction
Bundle bridge projects in rural areas to save on mobilization and material costs.
Regional Directors, Bridge and Planning
Add item for discussion annual Bridge meeting with Preconstruction& M&O.
If the use of studded tires is reduced,
The damage to roads that causes unreasonably short pavement life will be reduced, resulting in longer pavement lives, allowing
Complete research on studded tire impacts.
Work with Leadership to explore options.
Research/Pavement/Central Region
Research project deployment activities

G-14
If … Then … Applicable Mitigation Strategies
Responsible Unit Risk Mitigation Plan
funding to be used for other assets.
Change the dates between which studded tires are allowed. Enforcement if current dates are adequate.
Legislative liaison/Enforcement
Research project deployment activities
Educate public on road damage and other travel options available to them (e.g., nonstudded snow tires, walking, biking).
Public Information Officers and MPO liaisons
Research project deployment activities
Charge fees for studded tire users.
Legislative liaison
This is not DOT&PF authority.
If natural events occur impacting infrastructure (excluding seismic),
Mobility, public health, and safety will be impacted.
Funds would be rerouted from the existing operating budget, causing project delays.
Specific risks include flooding, ice falls, coastal flooding, avalanches, and rock falls.
Design new bridges to a 50-year flood event and floodway areas to a 100-year flood event.
Current Practice—Bridge
Current Practice
Statewide coordination of hydrologists.
Bridge Current Practice
Implement a geotechnical asset management (GAM) plan to support project selection and scoping.
GAM
Statewide Materials developing work plan for Regional comments or concurrence
Implement a system or process for identifying, evaluating, and prioritizing environmental hazards improvement for resiliency and vulnerable assets
Planning with M&O, Design, Bridge
Planning to develop a Resiliency work plan
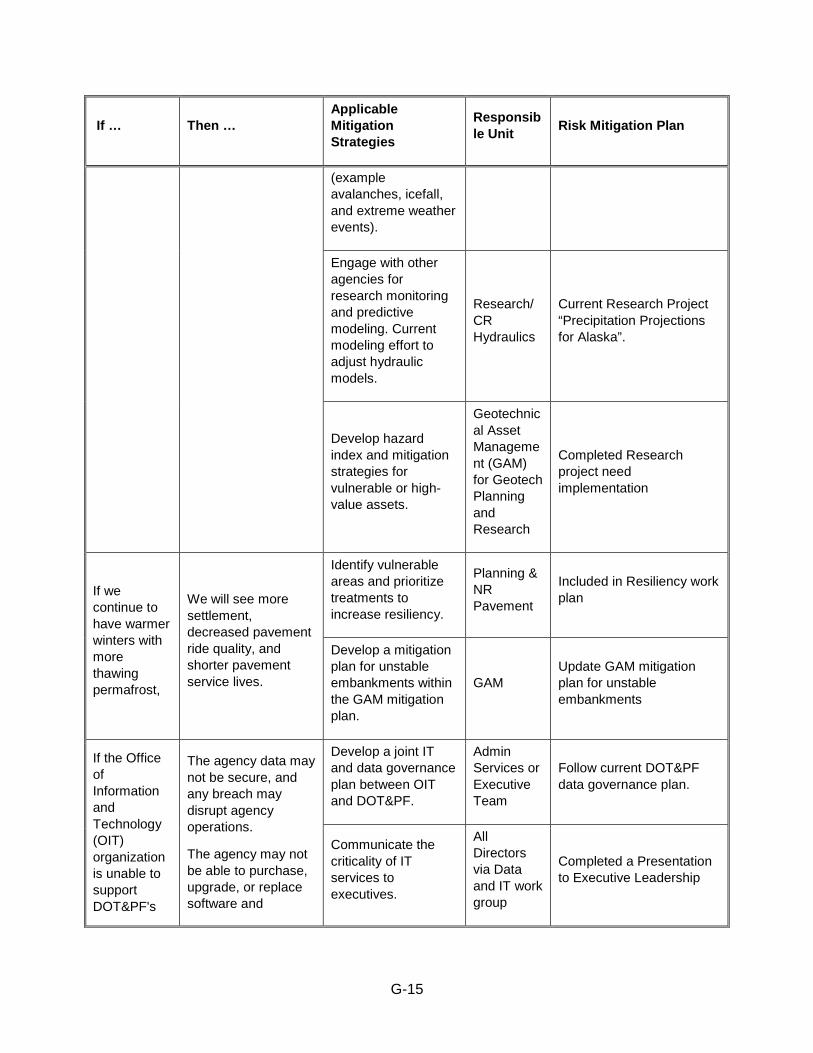
G-15
If … Then … Applicable Mitigation Strategies
Responsible Unit Risk Mitigation Plan
(example avalanches, icefall, and extreme weather events).
Engage with other agencies for research monitoring and predictive modeling. Current modeling effort to adjust hydraulic models.
Research/CR Hydraulics
Current Research Project “Precipitation Projections for Alaska”.
Develop hazard index and mitigation strategies for vulnerable or high-value assets.
Geotechnical Asset Management (GAM) for Geotech Planning and Research
Completed Research project need implementation
If we continue to have warmer winters with more thawing permafrost,
We will see more settlement, decreased pavement ride quality, and shorter pavement service lives.
Identify vulnerable areas and prioritize treatments to increase resiliency.
Planning & NR Pavement
Included in Resiliency work plan
Develop a mitigation plan for unstable embankments within the GAM mitigation plan.
GAM Update GAM mitigation plan for unstable embankments
If the Office of Information and Technology (OIT) organization is unable to support DOT&PF's
The agency data may not be secure, and any breach may disrupt agency operations.
The agency may not be able to purchase, upgrade, or replace software and
Develop a joint IT and data governance plan between OIT and DOT&PF.
Admin Services or Executive Team
Follow current DOT&PF data governance plan.
Communicate the criticality of IT services to executives.
All Directors via Data and IT work group
Completed a Presentation to Executive Leadership

G-16
If … Then … Applicable Mitigation Strategies
Responsible Unit Risk Mitigation Plan
technology needs,
hardware as needed.
The agency’s ability to make informed decisions may be reduced.
Expenditures to collect data will not yield the anticipated benefits.
Develop a specific Technology Risk Register.
All Directors via Data and IT Work Group
No mitigation plan
Document current LOS.
All Directors via Data and IT Work Group
No mitigation plan
Department of Administration (DOA) transfers risk back to DOT&PF.
Commissioner No mitigation plan
If DOT leadership changes,
They may not have a complete understanding of recent federal initiatives, such as TAM, TPM, and performance-based planning.
Develop briefings on key priorities for new leaders.
Asset Management Executive Management Transition Book
Executive Briefings
Schedule NHI and other educational opportunities for new leaders.
Asset Management
Executive Training Opportunities
If there is a moderate seismic event of 6–7 magnitude,
If there is a major seismic event of 8–9 magnitude,
Structural damage may occur, and some bridges, may need to be inspected for structural soundness.
Isolated bridges may collapse or become structurally unsound.
Major structural damage may occur to
Deploy Response Team to inspect and evaluate affected structures, then develop plan to fix detected issues.
M&O, Design, Construction & Bridge others as needed
Develop a Lessons Learned from November 2018 Earthquake
Treat and tolerate the risk for collapse and continue the Seismic Retrofit Program to improve
Bridge with others
Fully Program and administer the Seismic Retrofit Program

G-17
If … Then … Applicable Mitigation Strategies
Responsible Unit Risk Mitigation Plan
multiple bridges, and a significant number of bridge projects would need to be added to the program.
resiliency.
Update existing preliminary seismic analysis and schedule replacement of seismically vulnerable bridges.
Bridge Fully Program and administer the Seismic Retrofit Program
Coordinate with Regions to design and construct new seismically resilient bridges.
Bridge Fully Program and administer the Seismic Retrofit Program
Provide public service information after a seismic event (emergency action plan) and include it in Alaska 511.
Public Information Officers (PIO)s
Develop a Lessons Learned from November 2018 Earthquake
Update Field Operations Guide (FOG).
CR Safety Review and Update Field Operations Guide as needed

H-1
Appendix H: Financial Plan Background
Federal rulemaking published October 2016 requires state DOTs to prepare a 10-year financial plan as part of their Transportation Asset Management Plan. Both MAP-21 and 23 CFR 515 state that the TAMP is one of a series of plans required as part of Transportation Performance Management (TPM).
The TAMP is the connection between long-term planning (Long Range Transportation Plan) and short-term programming (Statewide Transportation Improvement Program), in addressing how the Department will manage pavement and bridges on the NHS to achieve its overall performance goals. The TAMP financial plan, described in Section 5 of the TAMP, describes how the agency manages the STIP to achieve the transportation goals established in the LRTP.
This appendix describes the process DOT&PF completed to develop the TAMP financial plan. As this is the first TAMP financial plan developed by the Department, DOT&PF sought and received considerable assistance from FHWA.
• DOT&PF used the FHWA November 2017 guidance document Developing TAMP Financial Plans as a basis for the process described in this appendix.
• DOT&PF participated in a Gap analysis completed by a FHWA contractor in January 2018.
• DOT&PF participated in an FHWA Asset Management Workshop on Life-Cycle Planning, Risk Management, and Financial Plan to Support the Implementation of Asset Management Plans on March 29, 2018.
• DOT&PF hosted a session of the National Highway Institute Course 136002, Financial Planning for Transportation Asset Management on February 13-14, 2019.
The process for developing the financial plan consists of four steps leading to selection of investment strategies. The following sections describe these four steps, including the data sources and stakeholders that were involved in developing the financial plan.
Step 1. Identify Available Funding for Asset Management
Transportation funding in Alaska is a combination of federal funds, state general funds, and Alaska Marine Highway System revenues. Federal highway program funds form the majority of the available funds. The following subsections describe the process DOT&PF uses to estimate available funding for asset management.
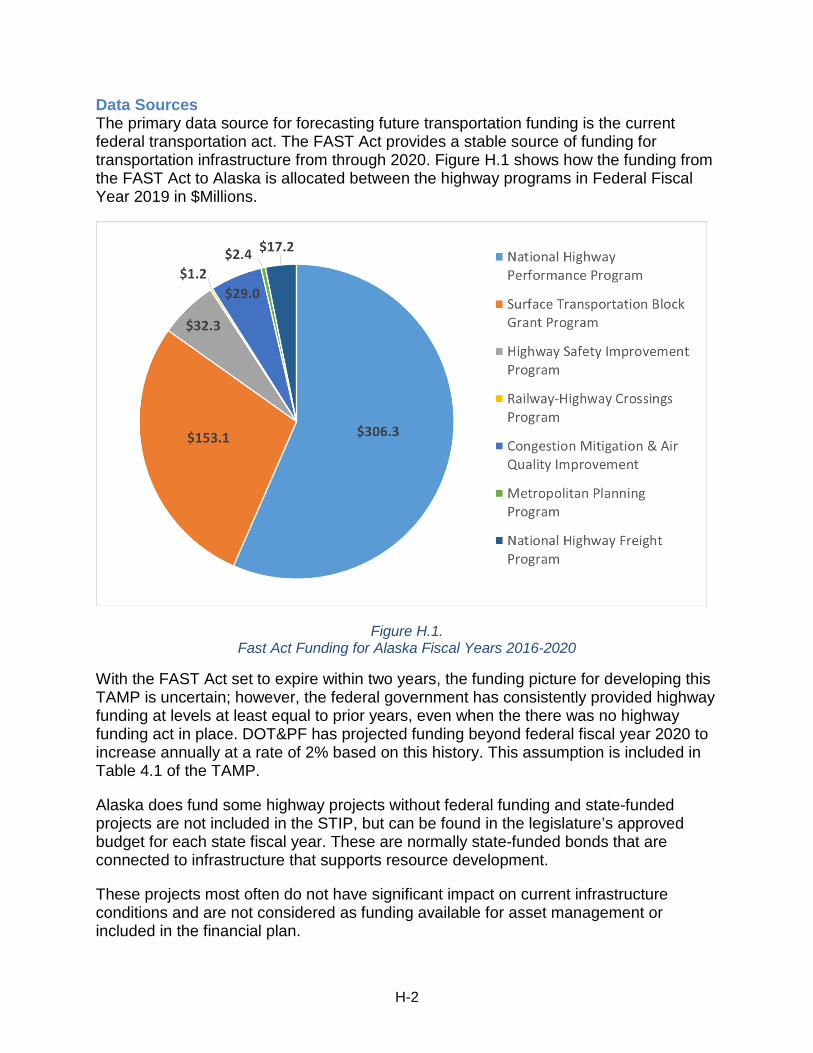
H-2
Data Sources The primary data source for forecasting future transportation funding is the current federal transportation act. The FAST Act provides a stable source of funding for transportation infrastructure from through 2020. Figure H.1 shows how the funding from the FAST Act to Alaska is allocated between the highway programs in Federal Fiscal Year 2019 in $Millions.
Figure H.1. Fast Act Funding for Alaska Fiscal Years 2016-2020
With the FAST Act set to expire within two years, the funding picture for developing this TAMP is uncertain; however, the federal government has consistently provided highway funding at levels at least equal to prior years, even when the there was no highway funding act in place. DOT&PF has projected funding beyond federal fiscal year 2020 to increase annually at a rate of 2% based on this history. This assumption is included in Table 4.1 of the TAMP.
Alaska does fund some highway projects without federal funding and state-funded projects are not included in the STIP, but can be found in the legislature’s approved budget for each state fiscal year. These are normally state-funded bonds that are connected to infrastructure that supports resource development.
These projects most often do not have significant impact on current infrastructure conditions and are not considered as funding available for asset management or included in the financial plan.

H-3
Stakeholders The following organizational units contribute to the estimation of funds available for asset management.
• The Statewide Planning Chief provides information from the STIP.
• The Chief Financial Officer/Director of Administration: o Provides information on the purpose of any state-funded projects in the
legislature’s approved budget. o Contributes to the determination of anticipated future federal funding.
• The TAMP Coordinator develops the funding estimate for state of good repair.
Step 2. Estimate Funding Needs
Funding needs are the estimated expenditures required to achieve condition targets and/or the desired state of good repair for pavement and bridges on the NHS. Funding needs are forward looking, and estimated based on predictions of asset performance under different investment scenarios. The following subsections describe the processes established to estimate funding needs for NHS pavements and bridges, other assets, risks to the transportation network, and system performance.
Funding Needs for Pavements and Bridges To develop funding needs for the TAMP, performance models are used based on the historic performance of pavement and bridges in the state. To develop the models, the average rate of change in condition over the life of a pavement section or bridge was calculated and combined with data from other assets of similar design (which are referred to as a “family”). The average rate of change for the entire family is used to predict the future condition of all assets sections that meet the family criteria.
The performance models are combined with unit cost data from DOT&PF construction projects to model the impacts of investment in different types of treatments over a 10-year period to predict the amount of work that can be accomplished, the impact of that work on asset conditions, and the annual deterioration of asset conditions due to use and exposure to the environment.
The following subsections elaborate on DOT&PF’s procedures for estimating funding needs by describing the data sources used and the stakeholders involved and their roles in the analysis. The final subsection provides information on how to improve the estimation of funding needs for the next TAMP update.
Stakeholders Several internal units contribute to the estimation of funding needs, as described below.
• The Pavement Manager: o develops the pavement performance curves.

H-4
o determines pavement treatment unit costs. o applies the performance models, unit costs, and funding scenarios to
determine the future cost to achieve the asset management objectives for NHS pavements.
• The Bridge Management Unit: o develops the bridge performance curves. o determines the bridge treatment unit costs. o applies the performance models, unit costs, and funding scenarios to
determine the future cost to achieve the asset management objectives for NHS bridges.
• The Statewide Planning Chief provides investment scenario inputs.
• The TAMP Coordinator provides oversight and information on TAM goals and objectives.
Opportunities for Improvement The performance models will be incorporated into the Department’s pavement and bridge management systems, which are expected to be implemented in October 2019. These new management systems will provide the Department with expanded capabilities to evaluate asset performance.
Funding Needs for Other Assets and System Performance Funding needs for other assets and system performance are largely determined based on investment in the current STIP. DOT&PF has developed a 10-year STIP with committed projects to achieve our long-term goals according to the performance-based plans developed under the TPM effort established by MAP-21. The following subsections provide details on the data sources used to develop the estimates, the roles of stakeholders involved, and opportunities to improve the process in the future.
Data Sources The primary data sources for estimating future needs for managing other assets and performance areas are the 10-year STIP and historic maintenance and operations budgets. Figure H.4 shows how we obligated funds for the previous three years (2015 to 2017). The amounts shown for categories M&O, preservation, major rehabilitation, and new construction are considered available for asset management purposes. Additional analysis is performed to identify which of these funds are National Highway Performance Program funds for projects on the NHS. All other funds are considered needed for managing other assets and performance areas.

H-5
Figure H.4
Federal obligations from 2015 to 2017
Stakeholders Several stakeholder units within DOT&PF contribute to the estimation of funding needs for other assets and performance areas, as described below.
• The Statewide Planning Chief provides information from the 10-year STIP, including obligation amounts and fund sources by year.
• The Regional Maintenance and Operations Chiefs provide information on their annual expenditures outside of the STIP.
Opportunities for Improvement The 10-year STIP has recently been developed as a tool for managing long-term programmatic investment strategies. The STIP relies on accurate coding of projects to indicate the contribution of the project to different agency objectives. The Planning Chiefs are working to improve this coding system to improve the accuracy with which project spending can be linked to the achievement of various agency objectives.
Funding Needs for Mitigating Risks to the Transportation System As described in section 3.7 of the TAMP and Appendix G, we actively invest to mitigate significant risks to the transportation system. These investments are made to reduce the likelihood that threats to the system performance will occur, to reduce their impact if they do occur, or to maximize the agency’s opportunities to improve performance.
Data Sources Implementing risk mitigation comes at a cost. Most of the costs of risk mitigation strategies can be identified in the 10-year TAMP through obligation data, which were the primary data source for estimating these needs. However, some risk mitigation efforts, such as seismic retrofitting of bridges, are difficult to distinguish from work done

H-6
to improve bridge conditions. Further complicating such estimates is that mitigation features such as improved bridge design may be incorporated into work done to improve bridge conditions. This type of work may increase project costs but cannot be separated out from preservation or rehabilitation funds.
For risk-related needs that could not be estimated from STIP data, the TAMP Risk Management Team provides estimates to the level of NHPP funding, and state match, that is expected to be programmed for each risk mitigation strategy.
Stakeholders The following stakeholders contribute to developing estimates of needs for transportation risk mitigation:
• The Statewide Planning Chief provides and analyzes 10-year STIP data.
• The TAMP Risk Management Team provides estimates on the impact of risk mitigation efforts on available NHPP funding.
Opportunities for Improvement Alaska is working on developing project selection criteria and other processes identified as risk mitigation activities. This is a work in progress.
Step 3 Quantify Funding Gaps
Funding gaps exist when the forecasted needs exceed the amount of anticipated funding. Funding gaps may occur in any year of the financial plan. If available funding is significantly greater than the needs, it may be determined that there is a surplus of funding. When they occur, surpluses are typically only in one portion of the financial plan. For example, due to specific circumstances, there may be few candidates for work in a specific year of the plan. This could lead to a surplus in funds for one asset class. Generally, surpluses in one program are offset by funding gaps in other programs. This section describes our processes for quantifying funding gaps or surpluses. The processes described in Appendix I explains how the agency uses cross-asset tradeoff to develop an investment plan that balances needs and funding across assets and programs to best achieve the agency’s objectives.
Data Sources The data sources for quantifying funding gaps are the outputs of steps 1 and 2, as described in this appendix. Needs and available funding are estimated for each year of the TAMP. Those estimates are compared to determine whether funding is adequate to address the needs in each year for all asset classes, performance areas, and risks.
Stakeholders The Asset Managers lead the effort to qualify funding gaps with assistance from the Statewide Planning Chief and Chief Financial Officer. The Capital Program Review Team provides support to the process.

H-7
Step 4. Select Investment Strategies
Once funding gaps have been quantified, DOT&PF conducts a review of options to best address its needs across asset classes and programs. DOT&PF selects investment strategies using the process described in the bullets below.
• Review the risk management strategies, life-cycle cost scenarios, and funding distributions that cover the state of good repair or federal performance targets and national goals.
• Prioritize preservation before more costly rehabilitation and reconstruction projects.
• Anticipate funding gaps to reach goals. We plan to use innovative techniques for pavement preservation, especially to respond to high level of surface rutting.
• Improve efficiency to free up money for additional preservation or other priorities.
• Communicate this funding level to external and internal stakeholders who have the opportunity to comment on this funding level.
• Develop an agency self-assessment to implement the investment strategies and any risks to that implementation. Risks may include changes in management, lack of organizational support for asset management objectives and performance management or life-cycle planning, knowledge or technology gaps, or proven inaccurate assumptions.
Additional information on establishing the selected strategies as an investment plan and managing the implementation of that plan are provided in Appendix I.

I-1
Appendix I: Investment Strategies Introduction
“Investment Strategy” is defined in 23 CFR 515.5 as a set of strategies that result from evaluating various levels of funding to achieve state DOT targets for asset condition and system performance effectiveness at a minimum practicable cost while managing risks.
The policies and goals laid out in the Long-Range Transportation Plan: Let’s Keep Moving 2036 (LRTP 2036) and the life-cycle planning, risk management, and financial planning processes described in this TAMP document contribute to the investment strategies DOT&PF will use to achieve national goals, statewide targets, and a state of good repair.
Process for Development of Investment Strategies
The following sections outline the steps used to develop the cross-asset analysis process.
Review Policies and Objectives • Review of existing DOT&PF goals, policies, and actions, particularly the LRTP
2036. • Review of internal processes related to programming decisions, particularly the
10-year STIP.
Step 1. Acquire Scenarios from Tools • DOT&PF used the spreadsheet tool described in Appendix F to develop several
scenarios for both pavements and bridges.
• Scenarios varied in terms of both strategy and total budget.
• The LCP scenarios were compiled into an interactive cross-asset allocation spreadsheet tool that allowed a core group of subject matter experts to compare the results of one pavement scenario and one bridge scenario side-by-side.
• In future years, the spreadsheet tool will be replaced with the PMS and BMS to develop the scenarios.
Step 2. Assess Available Funding The Department will assess funds available for the National Highway System (NHS), including an analysis of federal National Highway Performance Program (NHPP) apportionments, state matching funds, and other state or federal funds that are reasonably expected to be available over a 10-year period. The Department will display funds available by fund type.

I-2
• The Statewide Planning Chief provided an assessment of the available NHPP funding as well as the level of current programming in the STIP dedicated to performance needs other than pavement and bridge conditions.
• An estimated $105 million rescission in 2020 will remove some NHPP apportionment available for programming to directly impact pavement and bridge conditions after 2020.
Assumptions:
• NHPP apportionment: FFY2018 NHPP apportionment after set-asides and penalties, 2% annual growth. Includes NHPP Freight and Exempt. (This is a conservative assumption, predicated on growth keeping pace only with inflation)
• State matching funds: Equal to NHPP Funds apportionment divided by 0.9097, assuming a match ratio of 9.03%. (This is a generous assumption, because some NHPP funds are 100% of total project costs.)
• Other state or federal funds reasonably expected to be available: Limited to those included in the current approved STIP. (This is a conservative assumption as other funds may become available in the beyond STIP years)
• Obligation Limitation: Over a four year period, 100% of NHPP funds will be used (other funds would be allowed to lapse), therefore 100% of NHPP funds will be assumed to be available to the NHS annually with regard to the TAMP financial plan. No obligation limitation will be factored in. (This is a generous assumption, because sequestration and rescission may still occur).
• Total funds available to the NHS: The total of NHPP funds, state matching funds, and other state or federal funds reasonably expected to be available.
• Funds needed for planning, ITS, AMHS ferries, and similar NHS needs that do not impact pavement or bridge conditions will be deducted from the total funds available to the NHS.
The remaining funds will be available for projects that result in construction projects and can be categorized into the five work types as defined below.
• Initial Construction: Includes all projects in the STIP coded to work type New Construction. New Construction is used for projects that construct new roads, new interchanges, or add capacity by constructing new lanes. Passing lanes are not considered added capacity.
• Maintenance: Includes all force account work completed by the regions and Need ID 11439 Whittier Tunnel Maintenance and Operations.
• Preservation: Includes each region’s Pavement and Bridge STIP Need IDs (18922, 18923, 18924) with the amount needed for maintenance work deducted.

I-3
The bridge and pavement management systems will aid staff in the evaluation and selection of road segments or bridges for optimal preservation treatment and timing.
• Rehabilitation: Includes all STIP projects coded to work type System Preservation and Bridge Rehabilitation with the amounts needed for preservation work deducted.
• Reconstruction: Includes all STIP projects coded to work type Reconstruction and Bridge Replacement.
Step 3. Compare Scenarios Alaska selected the following 5 Lifecycle Planning scenarios for each asset type (pavement and bridges) for further analysis:
• Do Nothing—No funding spent on NHS bridges or roads.
• Fix All Poor Roads/Bridges by 2028
o For bridges, this scenario meets the Good target of the desired state of good repair (SOGR) by 2026. For pavements, this scenario keeps the roadways above the Good target throughout the TAMP period.
o This scenario results in 0% Poor bridges in 2027 and 0% Poor pavements in 2028.
• Low Budget Scenario
o For bridges, this scenario meets the Poor target of the desired SOGR with 8% Poor bridges in 2028 but fails to meet the Good target with 24% Good bridges in 2028.
o For pavements, this scenario has the percent Poor increase above 10% in 2025 and reaching 14% in 2028. This scenario falls below the percent Good target in 2021 and plateaus at 15% Good from 2023 to 2028.
• Medium Budget Scenario
o For bridges, this scenario meets the Poor target of the desired SOGR with 6% Poor bridges in 2028 but fails to meet the Good target with 26% Good bridges in 2028.
o For pavements, this scenario meets the Poor target with 9% Poor pavements in 2028. This scenario falls below the percent Good target in 2021 and plateaus at 14% Good from 2024 to 2028.
• High Budget Scenario

I-4
o For bridges, this scenario meets the Poor target of the desired SOGR with 5% Poor bridges in 2028 but fails to meet the Good target with 29% Good bridges in 2028.
o For pavements, this scenario meets the Poor target with 4% Poor pavements in 2028. This scenario falls below the percent Good target in 2022 and plateaus at 17% Good from 2024 to 2028.
Step 4. Recommend Acceptable Scenarios A team of subject matter experts representing the following areas met to review the scenario projections.
• Finance • Planning • Pavement Management • Structures Management • TAMP Lead
The following concerns were raised by the group as they reviewed potential scenarios that could be funded within the STIP:
• The TAMP team decided to create a “cushion” to assure the Federal Poor limits for NHS bridges and interstate pavements were not exceeded in the Preferred scenarios.
• The TAMP team was concerned that for pavements in years 8 to 10, the percent Poor holds steady as the percent Fair increases. As a result, in years 11 onward the percent Fair could fall into Poor.
• For the pavement LCP strategies, some finer assessments will need to be done to assess different treatment mixes in the last 4 years of the program where DOT&PF has more flexibility on what treatments can be applied. This may not be possible until the PMS is operational.
• Alaska decided to go with the most conservative funding scenarios for the TAMP investment strategies. Specifically, the low budget bridge scenario and the medium budget pavement scenario.
o Annual investments will be set at $86.25 million for NHS Pavements and $43 million for NHS bridges. These numbers include project engineering costs.
o The TAMP team noted that if an additional $20 million can be programmed for NHS bridges, the Federal Poor target will be met.
o Details on the division of budget between work types is provided in the TAMP investment strategies.

I-5
Step 5. Determine Funding Risks The TAMP Team identified the following risks to implementing the selected scenarios.
• Implementing scenarios in the first 3 to 4 years of the TAMP period along with current STIP projects will be challenging.
• Major rehabilitation and reconstruction treatments already programmed early in the investment strategy will be pursued while preservation treatments will come in later years.
• It is possible that Alaska’s Federal-match funds may be decreased in the upcoming fiscal year. If this happens, Alaska will not have enough funding to meet the anticipated needs, and the analysis would have to be reexamined.
• Annual programing can vary considerably, so DOT&PF will incorporate both an annual and running-average review to analyzing the agency’s consistency regarding implementing the TAMP investment strategies.
Step 6. Finalize Input to TAMP Investment Strategies The TAMP Team prepared a summary of the TAMP analysis results, including cross-asset tradeoff, for executive review. During the review, executive staff provided feedback on the TAMP processes, analysis, and resulting investment strategies. The executive input was used to finalize the investment strategies included in the TAMP.
Managing Investment Strategies While Addressing System Needs
DOT&PF monitors and manages the performance of the NHS using all seven Transportation Performance Management (TPM) National Goal areas: safety, congestion, system reliability, freight movement and economic vitality, environmental sustainability, and project delivery.
Each of these performance areas contribute to the development of our capital program in support of the agency’s LRTP. Several internal processes allow staff to manage delivery of the program to ensure the expected performance is delivered on time and within budget. These internal processes are connected to the TAMP development process, as outlined below, to ensure that the TAMP is developed in full awareness of any gaps in the performance of NHS assets and that the gaps are considered in the development of TAMP investment strategies.
1. DOT&PF holds a monthly Planning Chiefs meeting to discuss issues related to delivery of the capital program, including STIP projects. This meeting addresses the needs of programmed projects to remain on schedule and budget. If project schedules or budgets change, this group determines the impact on the overall program, decides on actions to balance program delivery, and determines accomplishments to best achieve the agency’s objectives, as described in the LRTP and including all TPM goal areas.

I-6
2. In addition to the Planning Chiefs meeting, DOT&PF convenes a Capital Program Review Team (CPRT) meeting at least twice per year. This is a cross-disciplined group that discusses and resolves issues in delivery of specific projects and program objectives, including the achievement of TPM goals and targets.
3. The TAMP Steering Team and Technical Teams include participants in both the Planning Chiefs and CPRT meetings. As DOT&PF engages in the update of its TAMP, these members will share performance gaps in areas other than pavement and bridge conditions to the attention of the larger teams. As these issues are discussed and understood, they are included in the risk analysis and are considered when developing gap analysis scenarios in the pavement and bridge management systems.
The Department will maintain a 10-Year Extended Statewide Transportation Improvement Program (STIP) for allocation of funds available by work type for asset management and performance management.
The Extended STIP will be informed by the current approved STIP, project delivery schedules, Planning Chief meetings and Capital Program Review Team (CPRT) meetings. Additionally, Pavement Management System (PMS) and Bridge Management System (BMS) will affect greater influence over time of project priorities and fund allocation to further asset management goals.
The Extended STIP will be used to estimate the cost of expected future work, by work type, to implement investment strategies contained in the asset management plan, by State fiscal year and work type (23 CFR 515.6(d)(1)). Most of the Department’s capital program planning is by Federal fiscal year due to the state’s reliance on federal funds but to meet the regulation for State fiscal year, an assumption will be made that the total funds available to the NHS are the same for a State fiscal year as they are for a Federal fiscal year. This assumption is sufficient given that there will remain 12 months represented, and a similar amount of work will be obligated within the State fiscal year (July 1st to June 30) as would be within the Federal fiscal year (October 1st to September 30th).
For the Consistency Review, the Department will use FFY18 STIP and show that there is alignment between actual and planned levels of investment. The Department will assess funds available for the National Highway System (NHS). The Department will display funds available by fund type.
Consistency Review
The investment strategies shown in the TAMP provide a simplified view of how investments are made on an annual basis to improve or sustain asset conditions. In practice projects may be accelerated, delayed, or take multiple years to deliver. As a result, it is nearly impossible to precisely predict the amount of investment to be made in

I-7
a specific future year. This is recognized in several related FHWA policies, such as the policy to provide states up to 4 years to obligate funding after allocation.
DOT&PF will follow the process below to provide a consistent means of assessing whether the agency’s investments are consistent with the TAMP investment strategies in a way that accounts for this natural variation in annual programming and project delivery.
1. DOT&PF will compare the amount of current fiscal year funding in the STIP to the amounts included in the investment strategy for the same year.
This comparison will be made for each asset (pavement and bridges) and work type (new construction, maintenance, preservation, rehabilitation, and reconstruction) included in the TAMP investment strategy, resulting in a total of 10 comparisons for each year.
2. A consistency determination will be made for each asset-work type combination (e.g., maintenance of NHS pavements or reconstruction of NHS bridges). Each asset-work type combination is referred to as a “component” of the TAMP investment strategy.
3. A set of investments will be considered consistent with the relevant component of the TAMP investment strategy if all the following criteria are met:
a. The sum of those investments equals an amount between 50% and 150% of the value of the TAMP investment strategy component for the year of analysis.
b. The sum of those investments for the year of analysis and the 2 previous years do not all either:
i. Exceed 125% of the value of the TAMP investment strategy components for their respective years of analysis.
ii. Fall short of 75% of the value of the TAMP investment strategy components for their respective years of analysis.
This step will not be performed until the third year of consistency review.
4. DOT&PF will investigate and explain any components of the TAMP strategy for which actual investments are inconsistent.
5. The Capital Program Review Team will recommend corrective actions as needed to address inconsistencies between actual investments and the TAMP investment strategies by:
a. Updating the TAMP investment strategy.
b. Modifying future programming.