transport asset management plan part 2 · glen innes severn council – transport infrastructure...
TRANSCRIPT
GLEN INNES SEVERN COUNCIL – TRANSPORT INFRASTRUCTURE ASSET MANAGEMENT PLAN
GLEN INNES SEVERN COUNCIL
TRANSPORT
ASSET MANAGEMENT PLAN
PART 2
Version Draft 2.0

GLEN INNES SEVERN COUNCIL – TRANSPORT INFRASTRUCTURE ASSET MANAGEMENT PLAN
Document Control
Document ID: 59_07_070909_nams.plus_amp template v11
Rev No Date Revision Details Author Reviewer Approver
Draft 18/04/11 For public exhibition VM MD
1.0 22/06/11 Incorporates Community Strategic Plan 2011-2021
outcomes
VM MD VM
Draft 2.0 12/12/2013 For public exhibition – Incorporates modifications for
revision of road hierarchy, service levels, funding
strategies
VM MD
© Copyright 2007 – All rights reserved.
The Institute of Public Works Engineering Australia.

GLEN INNES SEVERN COUNCIL – TRANSPORT INFRASTRUCTURE ASSET MANAGEMENT PLAN
TABLE OF CONTENTS
ABBREVIATIONS ................................................................................................................................................................................... i
GLOSSARY ............................................................................................................................................................................................ ii
1. EXECUTIVE SUMMARY ........................................................................................................................................................... 1
2. INTRODUCTION ....................................................................................................................................................................... 2
2.1 Background ..................................................................................................... 2
2.2 Goals and Objectives of Asset Management ................................................... 2
2.4 Core and Advanced Asset Management .......................................................... 4
3. LEVELS OF SERVICE .............................................................................................................................................................. 5
3.1 Customer Research and Expectations ............................................................. 5
3.2 Legislative Requirements ................................................................................. 6
3.3 Current Levels of Service ................................................................................. 6
3.4 Desired Levels of Service ................................................................................ 7
4. FUTURE DEMAND .................................................................................................................................................................. 20
4.1 DEMAND FORECAST .................................................................................. 20
4.1.2 Demand Factors – Trends and Impacts ....................................................... 20
4.2 Changes in Technology ................................................................................. 21
4.3 Demand Management Plan ........................................................................... 21
4.4 New Assets from Growth ............................................................................... 23
5. Lifecycle management plan .................................................................................................................................................. 24
5.1 Background Data ........................................................................................... 24
5.1.1 Physical parameters ............................................................................... 24
5.1.2 Asset capacity and performance ............................................................ 25
5.1.3 Asset condition ....................................................................................... 27
5.1.4 Asset valuations ..................................................................................... 28
5.2 Risk Management Plan .................................................................................. 28
5.3 Routine Maintenance Plan ............................................................................. 30
5.3.1 Maintenance plan ................................................................................... 30
5.3.2 Standards and specifications.................................................................. 31

GLEN INNES SEVERN COUNCIL – TRANSPORT INFRASTRUCTURE ASSET MANAGEMENT PLAN
5.3.3 Summary of future maintenance expenditures ....................................... 32
5.4 Renewal/Replacement Plan ........................................................................... 32
5.4.1 Renewal plan ......................................................................................... 32
5.4.2 Renewal standards ................................................................................ 33
5.4.3 Summary of OPTIMAL renewal expenditure .......................................... 34
5.5 Creation/Acquisition/Upgrade Plan ................................................................ 34
5.5.1 Selection criteria..................................................................................... 35
5.5.2 Standards and specifications.................................................................. 35
5.5.3 Summary of future upgrade/new assets expenditure .............................. 36
5.6 Disposal Plan ................................................................................................. 37
6. FINANCIAL SUMMARY .......................................................................................................................................................... 38
6.1 Financial Statements and Projections ............................................................ 38
6.1.1 Sustainability of service delivery ............................................................. 39
6.2 Funding Strategy ........................................................................................... 45
6.3 Valuation Forecasts ....................................................................................... 45
6.4 Key Assumptions made in Financial Forecasts .............................................. 49
7. ASSET MANAGEMENT PRACTICES .................................................................................................................................... 50
7.1 Accounting/Financial Systems ....................................................................... 50
7.2 Asset Management Systems ......................................................................... 50
7.3 Information Flow Requirements and Processes ............................................. 50
7.4 Standards and Guidelines .............................................................................. 50
7.5 Data Confidence Level ................................................................................. 50
8. PLAN IMPROVEMENT AND MONITORING .......................................................................................................................... 51
8.1 Performance Measures .................................................................................. 51
8.2 Improvement Plan .......................................................................................... 51
8.3 Monitoring and Review Procedures ............................................................... 52
REFERENCES ...................................................................................................................................................................................... 53
APPENDICES ....................................................................................................................................................................................... 54
Appendix A Maintenance Response Levels of Service ....................................... 54

GLEN INNES SEVERN COUNCIL – TRANSPORT INFRASTRUCTURE ASSET MANAGEMENT PLAN
Appendix B ........................................................................................................... 55
PLANNED TRANSPORT INFRASTRUCTURE EXPENDITURES FOR LONG-
TERM FINANCIAL PLAN (Base Case) ................................................................. 55
PLANNED TRANSPORT INFRASTRUCTURE EXPENDITURES FOR LONG-
TERM FINANCIAL PLAN (SCENARIO 5) ............................................................. 57
Appendix C - PROJECTED 20 YEAR CAPITAL WORKS PROGRAM .................. 59
Appendix D - PLANNED LONG TERM CAPITAL WORKS PROGRAM
(Scenario 5) .......................................................................................................... 60

- i -
GLEN INNES SEVERN COUNCIL – TRANSPORT INFRASTRUCTURE ASSET MANAGEMENT PLAN
ABBREVIATIONS
AAAC Average annual asset consumption
AMP Asset management plan
ARI Average recurrence interval
BOD Biochemical (biological) oxygen demand
CRC Current replacement cost
CWMS Community wastewater management systems
DA Depreciable amount
DoH Department of Health
EF Earthworks/formation
IRMP Infrastructure risk management plan
LCC Life Cycle cost
LCE Life cycle expenditure
MMS Maintenance management system
PCI Pavement condition index
RV Residual value
SS Suspended solids
vph Vehicles per hour
- ii -
GLEN INNES SEVERN COUNCIL – TRANSPORT INFRASTRUCTURE ASSET MANAGEMENT PLAN
GLOSSARY
Annual service cost (ASC)
An estimate of the cost that would be tendered, per
annum, if tenders were called for the supply of a service
to a performance specification for a fixed term. The
Annual Service Cost includes operating, maintenance,
depreciation, finance/ opportunity and disposal costs,
less revenue.
Asset class
Grouping of assets of a similar nature and use in an
entity's operations (AASB 166.37).
Asset condition assessment
The process of continuous or periodic inspection,
assessment, measurement and interpretation of the
resultant data to indicate the condition of a specific asset
so as to determine the need for some preventative or
remedial action.
Asset management
The combination of management, financial, economic,
engineering and other practices applied to physical
assets with the objective of providing the required level
of service in the most cost effective manner.
Assets
Future economic benefits controlled by the entity as a
result of past transactions or other past events
(AAS27.12).
Property, plant and equipment including infrastructure
and other assets (such as furniture and fittings) with
benefits expected to last more than 12 month.
Average annual asset consumption (AAAC)*
The amount of a local government’s asset base
consumed during a year. This may be calculated by
dividing the Depreciable Amount (DA) by the Useful Life
and totalled for each and every asset OR by dividing the
Fair Value (Depreciated Replacement Cost) by the
Remaining Life and totalled for each and every asset in
an asset category or class.
Brownfield asset values**
Asset (re)valuation values based on the cost to replace
the asset including demolition and restoration costs.
Capital expansion expenditure
Expenditure that extends an existing asset, at the same
standard as is currently enjoyed by residents, to a new
group of users. It is discretional expenditure, which
increases future operating, and maintenance costs,
because it increases council’s asset base, but may be
associated with additional revenue from the new user
group, eg. extending a drainage or road network, the
provision of an oval or park in a new suburb for new
residents.
Capital expenditure
Relatively large (material) expenditure, which has
benefits, expected to last for more than 12 months.
Capital expenditure includes renewal, expansion and
upgrade. Where capital projects involve a combination of
renewal, expansion and/or upgrade expenditures, the
total project cost needs to be allocated accordingly.
Capital funding
Funding to pay for capital expenditure.
Capital grants
Monies received generally tied to the specific projects for
which they are granted, which are often upgrade and/or
expansion or new investment proposals.
Capital investment expenditure
See capital expenditure definition
Capital new expenditure
Expenditure which creates a new asset providing a new
service to the community that did not exist beforehand.
As it increases service potential it may impact revenue
and will increase future operating and maintenance
expenditure.
Capital renewal expenditure
Expenditure on an existing asset, which returns the
service potential or the life of the asset up to that which it
- ii -
GLEN INNES SEVERN COUNCIL – TRANSPORT INFRASTRUCTURE ASSET MANAGEMENT PLAN
had originally. It is periodically required expenditure,
relatively large (material) in value compared with the
value of the components or sub-components of the asset
being renewed. As it reinstates existing service potential,
it has no impact on revenue, but may reduce future
operating and maintenance expenditure if completed at
the optimum time, eg. resurfacing or resheeting a
material part of a road network, replacing a material
section of a drainage network with pipes of the same
capacity, resurfacing an oval. Where capital projects
involve a combination of renewal, expansion and/or
upgrade expenditures, the total project cost needs to be
allocated accordingly.
Capital upgrade expenditure
Expenditure, which enhances an existing asset to
provide a higher level of service or expenditure that will
increase the life of the asset beyond that which it had
originally. Upgrade expenditure is discretional and often
does not result in additional revenue unless direct user
charges apply. It will increase operating and
maintenance expenditure in the future because of the
increase in the council’s asset base, eg. widening the
sealed area of an existing road, replacing drainage pipes
with pipes of a greater capacity, enlarging a grandstand
at a sporting facility. Where capital projects involve a
combination of renewal, expansion and/or upgrade
expenditures, the total project cost needs to be allocated
accordingly.
Carrying amount
The amount at which an asset is recognised after
deducting any accumulated depreciation / amortisation
and accumulated impairment losses thereon.
Class of assets
See asset class definition
Component
An individual part of an asset which contributes to the
composition of the whole and can be separated from or
attached to an asset or a system.
Cost of an asset
The amount of cash or cash equivalents paid or the fair
value of the consideration given to acquire an asset at
the time of its acquisition or construction, plus any costs
necessary to place the asset into service. This includes
one-off design and project management costs.
Current replacement cost (CRC)
The cost the entity would incur to acquire the asset on
the reporting date. The cost is measured by reference to
the lowest cost at which the gross future economic
benefits could be obtained in the normal course of
business or the minimum it would cost, to replace the
existing asset with a technologically modern equivalent
new asset (not a second hand one) with the same
economic benefits (gross service potential) allowing for
any differences in the quantity and quality of output and
in operating costs.
Current replacement cost “As New” (CRC)
The current cost of replacing the original service
potential of an existing asset, with a similar modern
equivalent asset, i.e. the total cost of replacing an
existing asset with an as NEW or similar asset
expressed in current dollar values.
Cyclic Maintenance**
Replacement of higher value components/sub-
components of assets that is undertaken on a regular
cycle including repainting, building roof replacement,
cycle, replacement of air conditioning equipment, etc.
This work generally falls below the capital/ maintenance
threshold and needs to be identified in a specific
maintenance budget allocation.
Depreciable amount
The cost of an asset, or other amount substituted for its
cost, less its residual value (AASB 116.6)
Depreciated replacement cost (DRC)
The current replacement cost (CRC) of an asset less,
where applicable, accumulated depreciation calculated
on the basis of such cost to reflect the already consumed
or expired future economic benefits of the asset
Depreciation / amortisation
The systematic allocation of the depreciable amount
(service potential) of an asset over its useful life.
Economic life
See useful life definition.
Expenditure
The spending of money on goods and services.
Expenditure includes recurrent and capital.

- iii -
GLEN INNES SEVERN COUNCIL – TRANSPORT INFRASTRUCTURE ASSET MANAGEMENT PLAN
Fair value
The amount for which an asset could be exchanged, or a
liability settled, between knowledgeable, willing parties,
in an arms length transaction.
Greenfield asset values **
Asset (re)valuation values based on the cost to initially
acquire the asset.
Heritage asset
An asset with historic, artistic, scientific, technological,
geographical or environmental qualities that is held and
maintained principally for its contribution to knowledge
and culture and this purpose is central to the objectives
of the entity holding it.
Impairment Loss
The amount by which the carrying amount of an asset
exceeds its recoverable amount.
Infrastructure assets
Physical assets of the entity or of another entity that
contribute to meeting the public's need for access to
major economic and social facilities and services, eg.
roads, drainage, footpaths and cycleways. These are
typically large, interconnected networks or portfolios of
composite assets The components of these assets may
be separately maintained, renewed or replaced
individually so that the required level and standard of
service from the network of assets is continuously
sustained. Generally the components and hence the
assets have long lives. They are fixed in place and are
often have no market value.
Investment property
Property held to earn rentals or for capital appreciation or
both, rather than for:
(a) use in the production or supply of goods or services
or for administrative purposes; or
(b) sale in the ordinary course of business (AASB 140.5)
Level of service
The defined service quality for a particular service
against which service performance may be measured.
Service levels usually relate to quality, quantity,
reliability, responsiveness, environmental, acceptability
and cost).
Life Cycle Cost **
The life cycle cost (LCC) is average cost to provide the
service over the longest asset life cycle. It comprises
annual maintenance and asset consumption expense,
represented by depreciation expense. The Life Cycle
Cost does not indicate the funds required to provide the
service in a particular year.
Life Cycle Expenditure **
The Life Cycle Expenditure (LCE) is the actual or
planned annual maintenance and capital renewal
expenditure incurred in providing the service in a
particular year. Life Cycle Expenditure may be
compared to Life Cycle Expenditure to give an initial
indicator of life cycle sustainability.
Loans / borrowings
Loans result in funds being received which are then
repaid over a period of time with interest (an additional
cost). Their primary benefit is in ‘spreading the burden’
of capital expenditure over time. Although loans enable
works to be completed sooner, they are only ultimately
cost effective where the capital works funded (generally
renewals) result in operating and maintenance cost
savings, which are greater than the cost of the loan
(interest and charges).
Maintenance and renewal gap
Difference between estimated budgets and projected
expenditures for maintenance and renewal of assets,
totalled over a defined time (eg 5, 10 and 15 years).
Maintenance and renewal sustainability index
Ratio of estimated budget to projected expenditure for
maintenance and renewal of assets over a defined time
(eg 5, 10 and 15 years).
Maintenance expenditure
Recurrent expenditure, which is periodically or regularly
required as part of the anticipated schedule of works
required to ensure that the asset achieves its useful life
and provides the required level of service. It is
expenditure, which was anticipated in determining the
asset’s useful life.
Materiality
An item is material is its omission or misstatement could
influence the economic decisions of users taken on the
basis of the financial report. Materiality depends on the
- iv -
GLEN INNES SEVERN COUNCIL – TRANSPORT INFRASTRUCTURE ASSET MANAGEMENT PLAN
size and nature of the omission or misstatement judged
in the surrounding circumstances.
Modern equivalent asset.
A structure similar to an existing structure and having the
equivalent productive capacity, which could be built
using modern materials, techniques and design.
Replacement cost is the basis used to estimate the cost
of constructing a modern equivalent asset.
Non-revenue generating investments
Investments for the provision of goods and services to
sustain or improve services to the community that are
not expected to generate any savings or revenue to the
Council, eg. parks and playgrounds, footpaths, roads
and bridges, libraries, etc.
Operating expenditure
Recurrent expenditure, which is continuously required
excluding maintenance and depreciation, eg power, fuel,
staff, plant equipment, on-costs and overheads.
Pavement management system
A systematic process for measuring and predicting the
condition of road pavements and wearing surfaces over
time and recommending corrective actions.
Planned Maintenance**
Repair work that is identified and managed through a
maintenance management system (MMS). MMS
activities include inspection, assessing the condition
against failure/breakdown criteria/experience, prioritising
scheduling, actioning the work and reporting what was
done to develop a maintenance history and improve
maintenance and service delivery performance.
PMS Score
A measure of condition of a road segment determined
from a Pavement Management System.
Rate of annual asset consumption*
A measure of average annual consumption of assets
(AAAC) expressed as a percentage of the depreciable
amount (AAAC/DA). Depreciation may be used for
AAAC.
Rate of annual asset renewal*
A measure of the rate at which assets are being renewed
per annum expressed as a percentage of depreciable
amount (capital renewal expenditure/DA).
Rate of annual asset upgrade*
A measure of the rate at which assets are being
upgraded and expanded per annum expressed as a
percentage of depreciable amount (capital
upgrade/expansion expenditure/DA).
Reactive maintenance
Unplanned repair work that carried out in response to
service requests and management/supervisory
directions.
Recoverable amount
The higher of an asset's fair value, less costs to sell and
its value in use.
Recurrent expenditure
Relatively small (immaterial) expenditure or that which
has benefits expected to last less than 12 months.
Recurrent expenditure includes operating and
maintenance expenditure.
Recurrent funding
Funding to pay for recurrent expenditure.
Rehabilitation
See capital renewal expenditure definition above.
Remaining life
The time remaining until an asset ceases to provide the
required service level or economic usefulness. Age plus
remaining life is economic life.
Renewal
See capital renewal expenditure definition above.
Residual value
The net amount which an entity expects to obtain for an
asset at the end of its useful life after deducting the
expected costs of disposal.
- v -
GLEN INNES SEVERN COUNCIL – TRANSPORT INFRASTRUCTURE ASSET MANAGEMENT PLAN
Revenue generating investments
Investments for the provision of goods and services to
sustain or improve services to the community that are
expected to generate some savings or revenue to offset
operating costs, eg public halls and theatres, childcare
centres, sporting and recreation facilities, tourist
information centres, etc.
Risk management
The application of a formal process to the range of
possible values relating to key factors associated with a
risk in order to determine the resultant ranges of
outcomes and their probability of occurrence.
Section or segment
A self-contained part or piece of an infrastructure asset.
Service potential
The capacity to provide goods and services in
accordance with the entity's objectives, whether those
objectives are the generation of net cash inflows or the
provision of goods and services of a particular volume
and quantity to the beneficiaries thereof.
Service potential remaining*
A measure of the remaining life of assets expressed as a
percentage of economic life. It is also a measure of the
percentage of the asset’s potential to provide services
that is still available for use in providing services
(DRC/DA).
Strategic Management Plan (SA)**
Documents Council objectives for a specified period (3-5
yrs), the principle activities to achieve the objectives, the
means by which that will be carried out, estimated
income and expenditure, measures to assess
performance and how rating policy relates to the
Council’s objectives and activities.
Sub-component
Smaller individual parts that make up a component part.
Useful life
Either:
(a) the period over which an asset is expected to be
available for use by an entity, or
(b) the number of production or similar units expected to
be obtained from the asset by the entity.
It is estimated or expected time between placing the
asset into service and removing it from service, or the
estimated period of time over which the future economic
benefits embodied in a depreciable asset, are expected
to be consumed by the council. It is the same as the
economic life.
Value in Use
The present value of estimated future cash flows
expected to arise from the continuing use of an asset
and from its disposal at the end of its useful life. It is
deemed to be depreciated replacement cost (DRC) for
those assets whose future economic benefits are not
primarily dependent on the asset's ability to generate
new cash flows, where if deprived of the asset its future
economic benefits would be replaced.
Source: DVC 2006, Glossary
Note: Items shown * modified to use DA instead of CRC
Additional glossary items shown **
- 1 -
GLEN INNES SEVERN COUNCIL – TRANSPORT INFRASTRUCTURE ASSET MANAGEMENT PLAN
1. EXECUTIVE SUMMARY
Refer Part 1.
- 2 -
GLEN INNES SEVERN COUNCIL – TRANSPORT INFRASTRUCTURE ASSET MANAGEMENT PLAN
2. INTRODUCTION
2.1 BACKGROUND
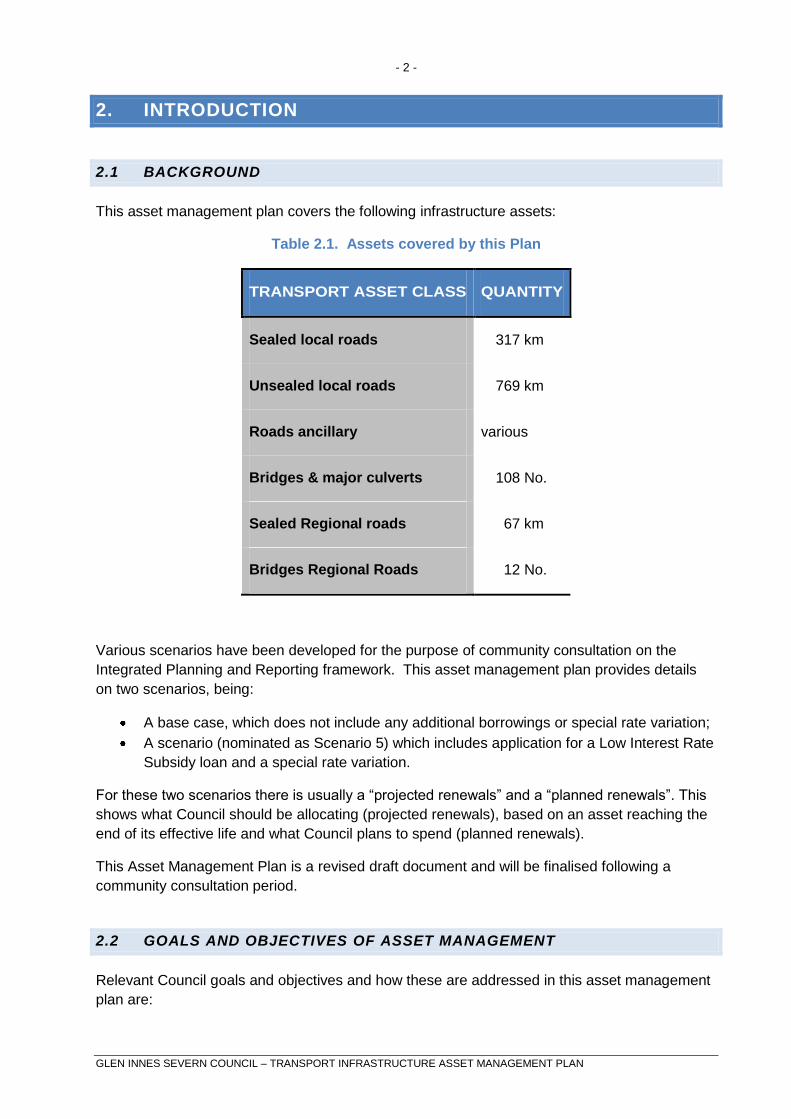
This asset management plan covers the following infrastructure assets:
Table 2.1. Assets covered by this Plan
TRANSPORT ASSET CLASS QUANTITY
Sealed local roads 317 km
Unsealed local roads 769 km
Roads ancillary various
Bridges & major culverts 108 No.
Sealed Regional roads 67 km
Bridges Regional Roads 12 No.
Various scenarios have been developed for the purpose of community consultation on the
Integrated Planning and Reporting framework. This asset management plan provides details
on two scenarios, being:
A base case, which does not include any additional borrowings or special rate variation;
A scenario (nominated as Scenario 5) which includes application for a Low Interest Rate
Subsidy loan and a special rate variation.
For these two scenarios there is usually a “projected renewals” and a “planned renewals”. This
shows what Council should be allocating (projected renewals), based on an asset reaching the
end of its effective life and what Council plans to spend (planned renewals).
This Asset Management Plan is a revised draft document and will be finalised following a
community consultation period.
2.2 GOALS AND OBJECTIVES OF ASSET MANAGEMENT
Relevant Council goals and objectives and how these are addressed in this asset management
plan are:

- 3 -
GLEN INNES SEVERN COUNCIL – TRANSPORT INFRASTRUCTURE ASSET MANAGEMENT PLAN
Table 2.2. Council Goals and how these are addressed in this Plan
GOAL OBJECTIVE HOW GOAL AND OBJECTIVES ARE
ADDRESSED IN AMP
Our built environment
creates an inviting,
safe and inclusive
atmosphere
Beautification of
Emmaville and
Deepwater main
Streets;
To have a network of
accessible footpaths
Footpaths are planned for, constructed
and maintained.
Development of beautification Programs
for Deepwater and Emmaville; develop
and implement Pedestrian Access and
Mobility Plan (PAMP)
Our roads and
drainage meet our
needs
Roads and drainage
assets are fit for
purpose and meet
community service level
aspirations.
Continue the road management review of
our existing road network and plan for the
future; Develop an asset management
program for roads and drainage that sets
out maintenance and renewal program to
maximise the use of available funding for
the maintenance of infrastructure.
Our built environment
creates opportunities
for people to move
around safely
To have accessible
footpaths in Glen Innes
and
Improve road safety
Development and implementation of the
PAMP;
Maximise grant funding opportunities to
improve road safety
We value our natural
environment and a
healthy community by
encouraging
alternative modes of
transport.
Cycle ways and walking
tracks/trails provide links
between areas of high
use and recreational
areas
Development and implementation of the
Bike Plan; Construction of bike paths
Walking tracks/trails in villages.
Supporting the National Bike Paths
Program and NSW Bike Plan

- 4 -
GLEN INNES SEVERN COUNCIL – TRANSPORT INFRASTRUCTURE ASSET MANAGEMENT PLAN
We grow our
population
sustainably and
maintain our
community spirit.
To grow the population
of the LGA to 10,000 by
2021 with an LEP that
ensures the growth is
sustainable, and
community spirit is
maintained.
The Economic Development Strategy
includes strategies and actions to realise
population growth, including incentives to
retire to the LGA; the LEP is finalised and
contains sustainability controls and
maintains the community spirit; we
engage our community in integrated
planning incorporating land use,
economic development infrastructure,
social policy that reflect and retain the
natural and built environment.
We consider long
term environmental
issues in planning our
future.
To monitor emerging
climate change trends
that may shape our long
term planning.
To be a community
leader in sustainability
To take emerging climate change trends
into consideration when undertaking long
term planning
Understand Council‟s contribution to
greenhouse gas emissions
Glen Innes Severn
Council is a well
managed Council and
an employer of choice
To be recognised as a
well managed Council
and an employer of
choice
Continue to improve Financial
Management and accountability. To
become and employer of choice by
growing Council‟s capacity to deliver
existing and future activities and
functions.
Streamline procurement of goods and
services
Glen Innes Severn
LGA maintains its
local autonomy
Glen Innes Severn LGA
will keep its identity and
Local Government has
achieved Constitutional
Recognition.
The AMP informs the long term financial
plan with regard to funding requirements
for long-term sustainability with asset
maintenance and renewal and strategies
to reverse the trend in the growth of the
infrastructure backlog
Refer Part 1.
2.4 CORE AND ADVANCED ASSET MANAGEMENT

- 5 -
GLEN INNES SEVERN COUNCIL – TRANSPORT INFRASTRUCTURE ASSET MANAGEMENT PLAN
Refer Part 1.
3. LEVELS OF SERVICE
3.1 CUSTOMER RESEARCH AND EXPECTATIONS
Council‟s customer research into Rural Road assets needs and satisfaction has included:
Annual public meetings
Customer feed back surveys
“Our Roads” survey, including community satisfaction survey & road condition
survey
community requests to Council
community engagement during the development of a new road hierarchy

- 6 -
GLEN INNES SEVERN COUNCIL – TRANSPORT INFRASTRUCTURE ASSET MANAGEMENT PLAN
The following table shows the community perception of the condition of road
infrastructure
ASSET CATEGORY
RESULT OF SURVEY
% very good
condition % good
condition % fair
condition % poor
condition
% very poor
condition
2009 Sealed rural road network -
29
59
9
2
2010 Sealed rural road network 5
33
41
17
5
2009 Unsealed rural road network -
9
45
35
10
2010 Unsealed rural road network 5
20
39
26
10
2010 Urban road network 3
19
45
25
7
3.2 LEGISLATIVE REQUIREMENTS
Refer Part 1.
3.3 CURRENT LEVELS OF SERVICE
Refer Part 1.
Council has adopted a road hierarchy that informs the level of service for transport
infrastructure. The hierarchy has 8 categories.
1 – Arterial
2 - Primary (ADT > 150 vpd, & through-route for intra-LGA traffic)
3 - Major Collector (100 < ADT < 150 vpd, & through-route for intra-LGA traffic)
4 - Minor Collector (50 < ADT < 100 vpd, & through-route for intra-LGA traffic)
5 - Local Access, Type A (ADT > 30 vpd, generally more than 6 LGA
residences)
6 - Local Access, Type B (6 > ADT > 30 vpd, approx. 2 to 6 LGA residences)
7 - Local Access, Type C (ADT < 5 vpd, approx. 1 LGA residence)
8 – Formed Track (ADT <= 5)

- 7 -
GLEN INNES SEVERN COUNCIL – TRANSPORT INFRASTRUCTURE ASSET MANAGEMENT PLAN
Implications of the hierarchy:
Type C Rural Local Access Roads will not be gravel resheeted and over time will
become formed roads.
Type B Rural Local Access Roads that are currently sealed will not be resealed or
rehabilitated and over time will become Type B gravel roads.
Council's current levels of service are set out in Tables 3.1 and 3.2.
Where table entries are shown as '#' data are unavailable. Future AMP revisions will include
this information, as it becomes available.
3.4 DESIRED LEVELS OF SERVICE
Refer Part 1.

- 8 -
GLEN INNES SEVERN COUNCIL – TRANSPORT INFRASTRUCTURE ASSET MANAGEMENT PLAN
ALL TRANSPORT INFRASTRUCTURE
Table 3.1 : Community Levels of Service
KEY
PERFORMANCE
INDICATOR
COMMUNITY LEVEL OF
SERVICE
PERFORMANCE
MEASUREMENT PROCESS
TARGET PERFORMANCE CURRENT
PERFORMANCE
Sustainability Facilities are managed for future
generations.
Master planning.
Long-Term Financial Plan.
Key TCORP Financial Ratios
are maintained
See below this table
See below this
table
Red text indicates
performance below
benchmark
Cost
effectiveness
Planned scheduled maintenance
Re-use of materials
Use highly productive road
construction machinery
Percent of maintenance done by
planned repairs
30% of road base material to be
obtained from existing road (before
reconstruction) Use advanced
technology methods and new
materials
70% of planned maintenance
activities
Total value of
budgeted transport
asset maintenance
2013/14 $1.465M
Total value of
budgeted
unplanned
maintenance
activities $69,800
%95 planned
activities

- 9 -
GLEN INNES SEVERN COUNCIL – TRANSPORT INFRASTRUCTURE ASSET MANAGEMENT PLAN
RATIO BENCHMARK COUNCIL PERFORMANCE
YEAR ENDED 30 JUNE
2011 2010 2009
Infrastructure Backlog Ratio < 0.02x 0.17x 0.16x 0.17x
Asset Maintenance Ratio > 1.00x 0.62x 0.62x 0.66x
Building and Infrastructure Asset
Renewal Ratio
> 1.00x 0.57x 0.07x 0.39x
Capital Expenditure Ratio > 1.10x 1.10x 0.51x 0.63x

- 10 -
GLEN INNES SEVERN COUNCIL – TRANSPORT INFRASTRUCTURE ASSET MANAGEMENT PLAN
SEALED ROADS
Table 3.2 : Community Levels of Service
KEY
PERFORMANCE
INDICATOR
COMMUNITY LEVEL OF
SERVICE
PERFORMANCE
MEASUREMENT PROCESS
TARGET PERFORMANCE CURRENT
PERFORMANCE
Safety Safe accessible network Crash reports
Customer service request „CRS‟
Zero reported crashes
attributed to road condition
<10 per year
#
Quality Driveability
Minimum delay
Customer Service Requests in
regards to pot holes, patching and
repairs to transport infrastructure
< 20 per month #
Function Meet user requirements for :
accessibility
road width
traffic management
Customer Service Request
Austroads technical specifications
and guidelines
Customer satisfaction survey
<20 per year
Compliance with current
standards and specs
#

- 11 -
GLEN INNES SEVERN COUNCIL – TRANSPORT INFRASTRUCTURE ASSET MANAGEMENT PLAN
Table 3.3 : Technical Levels of Service
KEY
PERFORMANCE
INDICATOR
COMMUNITY LEVEL OF
SERVICE
PERFORMANCE
MEASUREMENT PROCESS
TARGET PERFORMANCE CURRENT
PERFORMANCE
Condition Minimum potholes, cracks, surface
deformation and / or texture
deficiencies
Length of resealed / reconstructed
roads per annum
Condition rating.
Average age of seals
21.5 km resealed and 5.0 km
of sealed roads
reconstructed per year
Average sealed
surfacing condition
index of 38 in
2009/10
(Satisfactory
condition)
Average sealed
pavement
condition index of
32 in 2009/10
(Satisfactory
condition)
Function Adequate road width for traffic
demands on rural roads
Inspection
Regular traffic surveys
> 80 % Arterial (Regional),
Primary, Major Collector and
Minor Collector roads meet
service level width
requirements
See below this
table

- 12 -
GLEN INNES SEVERN COUNCIL – TRANSPORT INFRASTRUCTURE ASSET MANAGEMENT PLAN
Cost
effectiveness
Re-use of materials Pavement design records 30% of annual sealed road
projects utilise overlays or
stabilisation as the
rehabilitation technique
#
Safety Provide :
clear signage
well-maintained linemarking
appropriate traffic
management devices
Compliance inspections
Customer service request „CRS‟
Zero compliance defects
< 10 per year
#
ROAD HIERARCHY AVERAGE OF
SERVICE LEVEL
WIDTH - PAVEMENT
AVERAGE OF
EXISTING
TRAFFICABLE
WIDTH (M)
% MEETING SERVICE
LEVEL WIDTH
1 - Arterial (Sealed) 7 6.19 88%
2 - Primary (Sealed) 6.2 6.09 98%
3 - Major Collector (Sealed) 6 6.35 100%
4 - Minor Collector (Sealed) 5.5 5.68 100%

- 13 -
GLEN INNES SEVERN COUNCIL – TRANSPORT INFRASTRUCTURE ASSET MANAGEMENT PLAN
UNSEALED ROADS
Table 3.4 : Community Levels of Service
KEY
PERFORMANCE
INDICATOR
COMMUNITY LEVEL OF
SERVICE
PERFORMANCE
MEASUREMENT PROCESS
TARGET PERFORMANCE CURRENT
PERFORMANCE
Safety Safe accessible network Crash reports
Customer service request „CRS‟
Zero reported crashes
attributed to road condition
<10 per year
#
Quality Provide smooth, all-weather
access.
Road audits
Customer service request „CRS‟.
<20 per audit
<20 per year
#
Function Road surface free of nuisance
flooding
Customer service request „CRS‟ < 20 per year #

- 14 -
GLEN INNES SEVERN COUNCIL – TRANSPORT INFRASTRUCTURE ASSET MANAGEMENT PLAN
Table 3.5 : Technical Levels of Service
KEY
PERFORMANCE
INDICATOR
COMMUNITY LEVEL OF
SERVICE
PERFORMANCE
MEASUREMENT PROCESS
TARGET PERFORMANCE CURRENT
PERFORMANCE
Condition Patrol grading and resheeting Frequency linked to condition
audit outcomes
Average condition index of
unsealed road network
during annual condition
audit is “ satisfactory”
27.1 km of rural road
resheeting per year
Average unsealed
pavement
condition index of
46 in 2009/10
(Satisfactory
Accessibility Provide all-weather access Length and duration of impassable
conditions
Zero events on major
collector status roads
(Strathbogie Rd often cut at
Severn River, Red Range
Rd cut at Beardy River, and
Shannon Vale/ Pinkett Rds
cut at Mann River bridges
during major events).
Perhaps <2 closures per
year.
#
Cost
effectiveness
Maintenance and resheeting
undertaken in a cost-effective
manner for maximum benefit to
the wider community
Comparison with benchmarked
organisations
Favourable outcome #

- 15 -
GLEN INNES SEVERN COUNCIL – TRANSPORT INFRASTRUCTURE ASSET MANAGEMENT PLAN
Safety Ensure provision of safe network Crash reports
Customer service request „CRS‟
Zero reported crashes
< 10 per year
#
ROAD HIERARCHY AVERAGE OF
SERVICE LEVEL
WIDTH -
PAVEMENT
AVERAGE OF
EXISTING
TRAFFICABLE WIDTH
(M)
% MEETING SERVICE
LEVEL WIDTH
3 - Major Collector (Unsealed) 6 6.13 100%
4 - Minor Collector (Unsealed) 5.5 7.66 100%
- 16 -
GLEN INNES SEVERN COUNCIL – TRANSPORT INFRASTRUCTURE ASSET MANAGEMENT PLAN
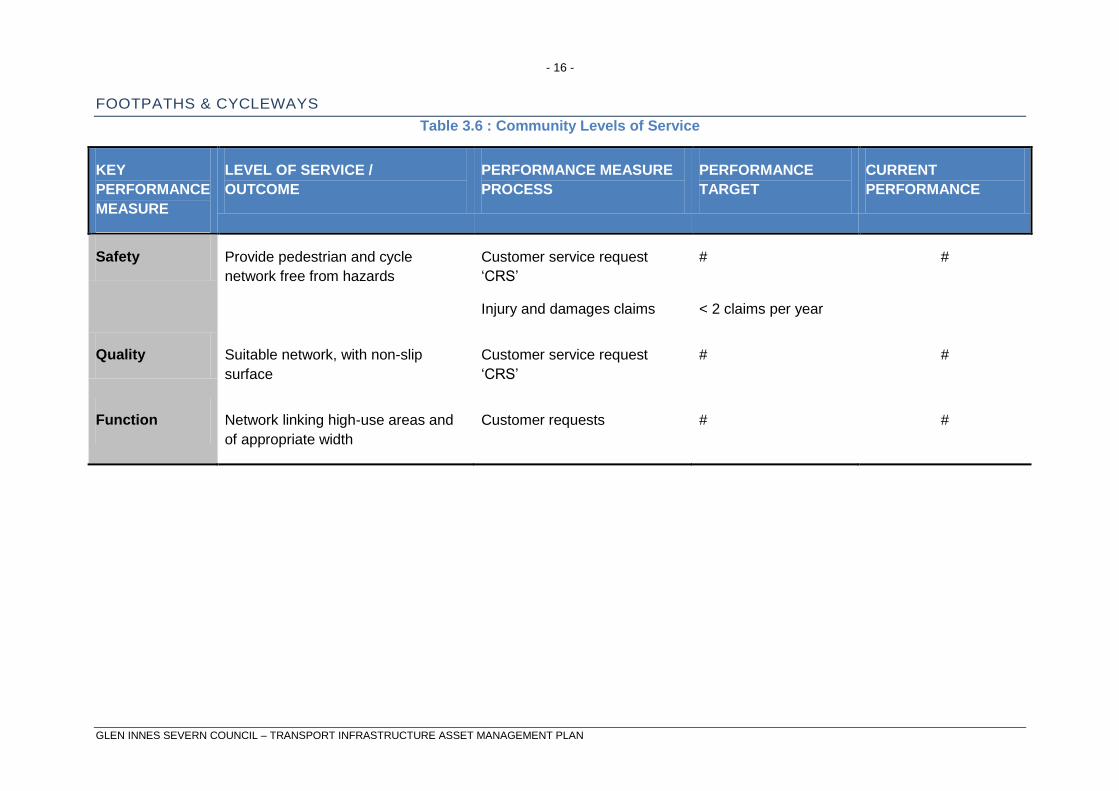
FOOTPATHS & CYCLEWAYS
Table 3.6 : Community Levels of Service
KEY
PERFORMANCE
MEASURE
LEVEL OF SERVICE /
OUTCOME
PERFORMANCE MEASURE
PROCESS
PERFORMANCE
TARGET
CURRENT
PERFORMANCE
Safety Provide pedestrian and cycle
network free from hazards
Customer service request
„CRS‟
Injury and damages claims
#
< 2 claims per year
#
Quality Suitable network, with non-slip
surface
Customer service request
„CRS‟
# #
Function Network linking high-use areas and
of appropriate width
Customer requests # #

- 17 -
GLEN INNES SEVERN COUNCIL – TRANSPORT INFRASTRUCTURE ASSET MANAGEMENT PLAN
Table 3.7 : Technical Levels of Service
KEY
PERFORMANCE
INDICATOR
COMMUNITY LEVEL OF
SERVICE
PERFORMANCE
MEASUREMENT PROCESS
TARGET PERFORMANCE CURRENT
PERFORMANCE
Condition Maintain surface to high
standards
Inspection regime Zero high -risk hazards #
Accessibility Extensive network to and in high-
use areas and for age groups with
special needs, meeting a network
hierarchy
Customer service request „CRS‟
Township development strategies
Hierarchy compliance
#
#
#
#
Cost
effectiveness
Cost-effective material selection
and maintenance practices
Optimised construction for Budget
allocation
# #
Safety Network free of trip hazards and
obstructions
Customer service request „CRS‟
Inspection regime
< 5 outstanding requests
Best practice manual
requirements
#

- 18 -
GLEN INNES SEVERN COUNCIL – TRANSPORT INFRASTRUCTURE ASSET MANAGEMENT PLAN
BRIDGES & MAJOR CULVERTS
Table 3.8 : Community Levels of Service
KEY
PERFORMANCE
MEASURE
LEVEL OF SERVICE /
OUTCOME
PERFORMANCE
MEASURE PROCESS
PERFORMANCE TARGET CURRENT
PERFORMANCE
Quality Provide reliable and safe access and
connectivity
Customer Service Requests
In regards to bridges
Community forums
feedback
< 20 complaints per annum #
Function Meets user requirements for:
Geometry
Accessibility
Customer Requests Service
Austroads technical
specifications and
guidelines
Compliance with current
standards and Specs
#*
Safety Increase public safety Accident reports
Customer Requests
Zero reported crashes
attributed to bridge condition
< 25 CRS received per
annum
#*
Reliability Bridges & major culverts available at
all times & free of mass limits.
Periodic bridge & major
culvert audit
Audit undertaken every 3 to
5 years
#*

- 19 -
GLEN INNES SEVERN COUNCIL – TRANSPORT INFRASTRUCTURE ASSET MANAGEMENT PLAN
Table 3.9 : Technical Levels of Service
KEY
PERFORMANCE
MEASURE
LEVEL OF
SERVICE /
OUTCOME
PERFORMANCE
MEASURE PROCESS
PERFORMANCE
TARGET
CURRENT PERFORMANCE
Condition No restriction on
use
Condition rating.
Average age of bridge
Average condition of
bridges is “Satisfactory”
The assessed average condition of bridges is
38 (Satisfactory) for concrete/steel bridges,
and 44 (Satisfactory) for timber bridges.
Function Adequate capacity
and structural
strength
Regular compliance
inspection
All Bridges inspected
annually
Comply
Safety Bridges comply
with Australian
Standards
Regular inspections
Customer Request
Service
Less number of accident
reports and public
complaints.
#

- 20 -
GLEN INNES SEVERN COUNCIL – TRANSPORT INFRASTRUCTURE ASSET MANAGEMENT PLAN
4. FUTURE DEMAND
4.1 DEMAND FORECAST
Refer Part 1.
4.1.2 DEMAND FACTORS – TRENDS AND IMPACTS
Developers will contribute roads and footpath in land divisions, but Council will need to upgrade
connector roads and footpath links to cater for growth demands and achieve cohesive
networks.
The aim of the road and footpath construction programs are to improve the amenity of urban
areas through the sealing, widening (and kerbing) of streets and to provide improved
infrastructure and access for rural residents and industry through the appropriate width and
geometry of major freight links and access roads, particularly B-double routes.
To enable fair and planned distribution of funding throughout the LGA, many different
methods of prioritising works are used:
Traffic surveys to determine vehicle and cyclist numbers and vehicle classifications.
Meetings with various industry groups (key stakeholders) to determine future expansion
of industry and required needs, eg. B-double routes to wineries.
Known traffic black spots (sites with a high crash history).
High road maintenance costs areas.
Known development areas.
Access to high pedestrian generators.
The impact of some demand factors on services are shown in Table 4.1.
In determining the need for construction or upgrading of bridge infrastructure, the following
aspects have been considered:
Provide greater access for the community where presently restricted by bridge
limitations.
To enable fair and planned distribution of funding throughout the Council area, some of the
factors influencing the prioritising of works are:
Changing community expectations and demographics.
Known areas of bridge load limitations.
Bridges with high maintenance demands.

- 21 -
GLEN INNES SEVERN COUNCIL – TRANSPORT INFRASTRUCTURE ASSET MANAGEMENT PLAN
Table 4.1. Demand Factors, Projections and Impact on Services
FACTOR IMPACT
Population changes in
townships/rural areas
Expectations on level of service
independent of number of
properties serviced
Rural freight task increasing Smaller-scale community buildings,
easily accessed by walking or
mobility aids
4.2 CHANGES IN TECHNOLOGY
Technological changes (as distinct from changes to installations brought about by
external, eg. environmental, forces) will impact on the asset classes in this AMP over the 20
year timeframe.
ROADS
Changes in construction techniques and maintenance practices are likely, such as:
Greater use of in-situ recycling of pavement materials.
Greater use of recycled materials.
Introduction of synthetic binders for road surfacing treatments, as a result of crude oil
shortages and bitumen products.
BRIDGES AND MAJOR CULVERTS
Emerging construction practice will see these replaced by pre-cast components to minimise
community disruption. Major culverts will likely be replaced „like-for-like‟, with improved
endwalls and erosion projection.
KERBS
Machine-laid concrete will replace most original, hand-formed kerbs. This has been common
practice for 20 years or more and valuations already recognise this form of (re)construction.
These impacts will be investigated and quantified in future revisions of the AMP.
4.3 DEMAND MANAGEMENT PLAN
Demand for new services will be managed through a combination of managing existing assets,
upgrading of existing assets and providing new assets to meet demand and demand

- 22 -
GLEN INNES SEVERN COUNCIL – TRANSPORT INFRASTRUCTURE ASSET MANAGEMENT PLAN
management. Demand management practices include non-asset solutions, insuring against
risks and managing failures.
Opportunities identified to date for demand management are shown in Table 4.3. Further
opportunities will be developed in future revisions of this asset management plan.
Table 4.3. Demand Management Plan Summary
SERVICE ACTIVITY DEMAND MANAGEMENT PLAN
Road and footpath maintenance
and upgrades
Upgrades and network extensions to meet population growth
demand and changes identified in review reports and
planning studies.
Consider reducing pavement width in conjunction with road
and footpath rehabilitation works, where traffic figures allow.
Provide access for wheeled mobility devices, pedestrians,
cyclists and tourism growth.
Safety Improvement Plan Upgrades to improve user safety (to be developed further
within the next review period).
Regular road safety audits and footpath inspections.
Road Hierarchy Review Plan Review of Hierarchy Plan to incorporate planned works
particularly and examination of utilisation patterns and
network links, within next review period.
Consideration of freight routes.
Community demand for
reconstruction and reseal of
roads and car parks
Study road condition rating from this plan and prioritise a list
of roads to be included in the annual reseal / rehabilitation
program.
Investigate alternative treatments to lower life cycle costs ie
seal types, rejuvenation.
Community demand for new
bridges and upgrading the old
ones
Inspect and evaluate the condition of bridges and compile
timber decking replacement program.
Upgrading of Unsealed Roads Progressive resheeting of all unsealed roads.
New land divisions Implement enhanced quality control measures for donated
assets.

- 23 -
GLEN INNES SEVERN COUNCIL – TRANSPORT INFRASTRUCTURE ASSET MANAGEMENT PLAN
Kerb Maintenance and Upgrades Upgrades to meet community expectations.
Planning Revise planning controls to increase population density and
decrease the extent of new road network. Encourage
industry to be near State controlled roads.
Capital Works Schedule long-term capital works program and investigate
partners with the adjacent Councils to achieve economies of
scale and cost savings.
4.4 NEW ASSETS FROM GROWTH
The new assets required to meet growth will be acquired from land developments and constructed by
Council. The new asset values are summarised in Fig 1.
Fig 1. New Assets from Growth
Acquiring these new assets will commit council to fund ongoing operations and maintenance costs for the
period that the service provided from the assets is required. These future costs are identified and
considered in developing forecasts of future operating and maintenance costs.

- 24 -
GLEN INNES SEVERN COUNCIL – TRANSPORT INFRASTRUCTURE ASSET MANAGEMENT PLAN
5. LIFECYCLE MANAGEMENT PLAN
The lifecycle management plan details how Council plans to manage and operate the assets at the
agreed levels of service (defined in section 3) while optimising life cycle costs.
5.1 BACKGROUND DATA
5.1.1 PHYSICAL PARAMETERS
The assets covered by this asset management plan are shown below.
TRANSPORT ASSET CLASS QUANTITY
Sealed local roads 317 km
Unsealed local roads 769 km
Roads ancillary various
Bridges & major culverts 108 No.
Sealed Regional roads 67 km
Bridges Regional Roads 12 No.
TOTAL 344
- 25 -
GLEN INNES SEVERN COUNCIL – TRANSPORT INFRASTRUCTURE ASSET MANAGEMENT PLAN
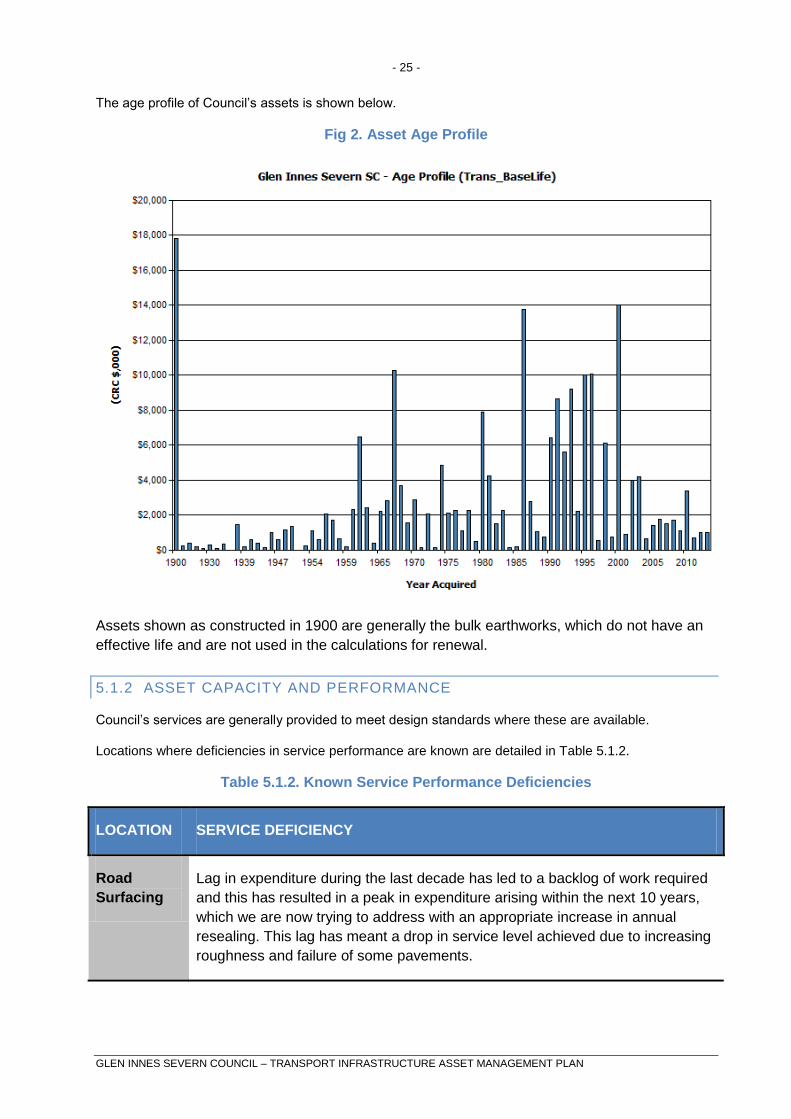
The age profile of Council‟s assets is shown below.
Fig 2. Asset Age Profile
Assets shown as constructed in 1900 are generally the bulk earthworks, which do not have an
effective life and are not used in the calculations for renewal.
5.1.2 ASSET CAPACITY AND PERFORMANCE
Council‟s services are generally provided to meet design standards where these are available.
Locations where deficiencies in service performance are known are detailed in Table 5.1.2.
Table 5.1.2. Known Service Performance Deficiencies
LOCATION SERVICE DEFICIENCY
Road
Surfacing
Lag in expenditure during the last decade has led to a backlog of work required
and this has resulted in a peak in expenditure arising within the next 10 years,
which we are now trying to address with an appropriate increase in annual
resealing. This lag has meant a drop in service level achieved due to increasing
roughness and failure of some pavements.

- 26 -
GLEN INNES SEVERN COUNCIL – TRANSPORT INFRASTRUCTURE ASSET MANAGEMENT PLAN
Road
Pavements
The lag in expenditure created during the last decade has also impacted on
pavement condition as seals have failed and moisture infiltration occurred
together with traffic changes. Again a service level decrease has required
greater financial input to address the shortfall.
Footpaths Missing linkages in the footpath network and older pedestrian ramps not
constructed to meet current standards for accessibility.
Bridges Structurally inadequate timber bridges

- 27 -
GLEN INNES SEVERN COUNCIL – TRANSPORT INFRASTRUCTURE ASSET MANAGEMENT PLAN
5.1.3 ASSET CONDITION
The condition profile of Council‟s assets is shown below.
Fig 3. Asset Condition Profile
Condition is measured using a 1 – 5 rating system.1
Rating Description of Condition
1 Excellent condition: Only planned maintenance required.
2 Very good: Minor maintenance required plus planned maintenance.
1 IIMM 2006, Appendix B, p B:1-3 („cyclic‟ modified to „planned‟)
0 0.5 1 1.5 2 2.5 3 3.5
Bulk Earthworks (Local Sealed Urban …
Bulk Earthworks (Local Sealed Rural …
Bulk Earthworks (Local Unsealed …
Bulk Earthworks (Local Unsealed Rural …
Bulk Earthworks (Regional Roads - …
Pavement (Local Sealed Urban Roads)
Pavement (Local Sealed Rural Roads)
Pavement (Local Unsealed Urban Roads)
Pavement (Local Unsealed Rural Roads)
Pavement (Regional Sealed Roads - …
Surfacing (Local Sealed Urban Roads)
Surfacing (Local Sealed Rural Roads)
Surfacing (Regional Sealed Roads - …
Local Concrete/Steel Bridges & Major …
Local Concrete/Steel Bridges & Major …
Regional Concrete/Steel Bridges & …
Local Timber Bridges - Urban
Local Timber Bridges - Rural
Local Roads - Causeways (Sealed …
Local Roads - Causeways (Unsealed …
Local Roads - Causeways (Sealed Rural …
Local Roads - Causeways (Unsealed …
Local Roads - Kerb & Gutter (Emmaville)
Local Roads - Kerb & Gutter …
Local Roads - Kerb & Gutter (Glen Innes)
Local Roads - Kerb & Gutter (Red Range)
Local Roads - Footpaths (Emmaville)
Local Roads - Footpaths (Deepwater)
Local Roads - Footpaths (Glen Innes)
Local Roads - Major Street Furniture
Local Roads - Carparks
Asset Condition (1 to 5)

- 28 -
GLEN INNES SEVERN COUNCIL – TRANSPORT INFRASTRUCTURE ASSET MANAGEMENT PLAN
3 Good: Significant maintenance required.
4 Average: Significant renewal/upgrade required.
5 Poor: Unserviceable.
5.1.4 ASSET VALUATIONS
The value of assets are shown below for transport infrastructure assets as at 30 June 2013.
Assets are valued at greenfield rates.
ASSET CLASS FINANCIAL REPORTING CRITERION
Current
Replacement
Cost, $‟000
Depreciable
Amount, $,000
Depreciated
Replacement
Cost, $‟000
Annual
Depreciation
Expense, $‟000
Transport
Infrastructure
$213,130 $164,444 $159,212 $2,367
Council‟s sustainability reporting reports the rate of annual asset consumption and compares
this to asset renewal and asset upgrade and expansion.
Table 5.4 : Financial Reporting Ratios
FINANCIAL REPORTING CRITERION TRANSPORT
INFRASTRUCTURE, %
(BASE CASE)
TRANSPORT
INFRASTRUCTURE, %
(SCENARIO 5)
Asset Consumption Rate 1.1% 1.1%
Asset Renewal Rate 71% 100%
Asset Upgrade Expansion Rate 12% 16%
5.2 RISK MANAGEMENT PLAN
The risk assessment process identified credible risks, the likelihood of the risk event occurring
and the consequences should the event occur. Future refinements will use these factors to
develop risk ratings, incorporating a risk treatment plan for non-acceptable risks.

- 29 -
GLEN INNES SEVERN COUNCIL – TRANSPORT INFRASTRUCTURE ASSET MANAGEMENT PLAN
Critical risks, being those assessed as „Very High‟ - requiring immediate corrective action and
„High‟ – requiring prioritised corrective action identified in the infrastructure risk management
plan are summarised in Table 5.2.
Table 5.2. Critical Risks and Treatment Plans
ASSET AT
RISK
WHAT CAN HAPPEN RISK
RATING
(VH, H)
RISK TREATMENT PLAN
Bridges Timber bridges may fail
structurally
VH Comprehensive bridge inspection
programme combined with an
increase in capital renewal funding
and maintenance.
Sprayed seal
surfacing
Increase in seal failures
leading to pavement failures
H Increase cyclical maintenance
expenditure to match asset
depreciation.
Road
surfacing
Seal wear or binder bleeding
can result in vehicle instability
in high-speed rural
environments
H Monitor seal condition and re-seal
ahead of normal intervention as
required.
Footpaths Increase in litigation from trip
hazards
H Increase routine maintenance to
repair failures.
Pavements Increase in pavement
reconstruction due to lack of
maintenance and patching
H Increase maintenance inspections
and repairs.
Cycleways Environmental cracking in
asphalt can become severe
enough to affect cyclist safety
H Inspect remote, off-road paths
regularly and crack seal / repair as
required.
Road seals
and
pavements
Poor service trench
reinstatement by Utilities
H Issue specification for reinstatement
work. (under development)

- 30 -
GLEN INNES SEVERN COUNCIL – TRANSPORT INFRASTRUCTURE ASSET MANAGEMENT PLAN
5.3 ROUTINE MAINTENANCE PLAN
Routine maintenance is the regular on-going work that is necessary to keep assets operating,
including instances where portions of the asset fail and need immediate repair to make the
asset operational again.
5.3.1 MAINTENANCE PLAN
Maintenance includes reactive, planned and cyclic maintenance work activities.
Reactive maintenance is unplanned repair work carried out in response to service requests and
management/supervisory directions.
Planned maintenance is repair work that is identified and managed through a maintenance
management system (MMS). MMS activities include inspection, assessing the condition
against failure/breakdown experience, prioritising, scheduling, actioning the work and reporting
what was done to develop a maintenance history and improve maintenance and service
delivery performance.
Cyclic maintenance is replacement of higher value components/sub-components of assets that
is undertaken on a regular cycle including repainting, building roof replacement, etc. This work
generally falls below the capital/maintenance threshold.
Maintenance expenditure trends are shown in Table 5.3.1. between the 2008/09 and 2009/10
financial year there has been changes to the disbursement of overheads and this is reflected in
the 2009/10 reduction.
Table 5.3.1. Maintenance Expenditure Trends
YEAR TRANSPORT MAINTENANCE EXPENDITURE
Reactive Planned Cyclic
2008/09 $331,900 $806,270 $70,500
2009/10 $289,290 $543,520 $133,650
2010/11 $331,900 $613,223 $178,320

- 31 -
GLEN INNES SEVERN COUNCIL – TRANSPORT INFRASTRUCTURE ASSET MANAGEMENT PLAN
Planned maintenance work is 70% of total maintenance expenditure.
Maintenance expenditure levels are considered to be inadequate to meet required service
levels. Future revision of this asset management plan will include linking required maintenance
expenditures with required service levels.
Assessment and prioritisation of reactive maintenance is undertaken by Council staff using
experience and judgement.
5.3.2 STANDARDS AND SPECIFICATIONS
Maintenance work is carried out in accordance with the following Standards and Specifications.
ARRB Sealed Local Roads Manual
ARRB Unsealed Local Roads Manual
AS 2734 Guide to Good Asphalt Practice
GISC Work Method Statements
AAPA Bituminous Surfacings Manual
Austroads Guide to Sprayed Sealing
Requirements by manufacturers for the use of proprietary products
Traffic control at Works on Roads
Project-specific Technical Specifications
GISC Internal Service Level Agreements
AS4283-1995 Cold mixed asphalt for maintenance patching
AS51.1-2004 Bridge design-scope and general principles
AS2008-1997 Residual Bitumen for pavements
AS3727-1993 Guide to residential pavements
$0
$200,000
$400,000
$600,000
$800,000
$1,000,000
$1,200,000
$1,400,000
2008/09 2009/10 2010/11
Reactive
Planned
Cyclic
total

- 32 -
GLEN INNES SEVERN COUNCIL – TRANSPORT INFRASTRUCTURE ASSET MANAGEMENT PLAN
5.3.3 SUMMARY OF FUTURE MAINTENANCE EXPENDITURES
Future maintenance expenditure is forecast to trend in line with the value of the asset stock as shown in
Fig 4. Note that all costs are shown in current 2013 dollar values.
Fig 4. Planned Maintenance Expenditure
Deferred maintenance, ie works that are identified for maintenance and unable to be funded are to be
included in the risk assessment process in the infrastructure risk management plan.
Maintenance is funded from Council‟s operating budget and grants where available. This is further
discussed in Section 6.2.
5.4 RENEWAL/REPLACEMENT PLAN
Renewal expenditure is major work which does not increase the asset‟s design capacity but restores,
rehabilitates, replaces or renews an existing asset to its original service potential. Work over and above
restoring an asset to original service potential is upgrade/expansion or new works expenditure.
5.4.1 RENEWAL PLAN
Assets requiring renewal are identified from estimates of remaining life obtained from the asset register
worksheets on the ‘Planned Expenditure template’. Candidate proposals are inspected to verify accuracy

- 33 -
GLEN INNES SEVERN COUNCIL – TRANSPORT INFRASTRUCTURE ASSET MANAGEMENT PLAN
of remaining life estimate and to develop a preliminary renewal estimate. Verified proposals are ranked
by priority and available funds and scheduled in future works programmes. The priority ranking criteria is
detailed in Table 5.4.1.
Table 5.4.1 Renewal Priority Ranking Criteria
CRITERIA WEIGHTING
Condition rating (Intervention Score) No current weighting or ranking against other
Asset Classes.
Road No current weighting or ranking against other
Asset Classes.
Other No current weighting or ranking against other
Asset Classes.
Condition No current weighting or ranking against other
Asset Classes.
Total 100%
Renewal will be undertaken using „low-cost‟ renewal methods where practical. The aim of „low-cost‟
renewals is to restore the service potential or future economic benefits of the asset by renewing the
assets at a cost less than replacement cost.
An example of low cost renewal, in lieu of full pavement reconstruction, is pavement rehabilitation work,
where patching and strengthening of the pavement is undertaken.
5.4.2 RENEWAL STANDARDS
Renewal work is carried out in carried out in accordance with the Standards and Specifications noted in
Section 5.3.1.

- 34 -
GLEN INNES SEVERN COUNCIL – TRANSPORT INFRASTRUCTURE ASSET MANAGEMENT PLAN
5.4.3 SUMMARY OF OPTIMAL RENEWAL EXPENDITURE
Projected future renewal expenditures are forecast to increase over time as the asset stock ages. The
costs are summarised in Fig 5. Note that all costs are shown in current 2013 dollar values.
The projected capital renewal program is shown in Appendix B.
Fig 5. Projected Capital Renewal Expenditure
Deferred renewal, ie those assets projected for renewal and not planned for renewal in capital works
programs are to be included in the risk assessment process in the risk management plan.
Renewals are to be funded from Council‟s capital works program and grants where available. This is
further discussed in Section 6.2.
5.5 CREATION/ACQUISITION/UPGRADE PLAN
New works are those works that create a new asset that did not previously exist, or works which upgrade
or improve an existing asset beyond its existing capacity. They may result from growth, social or
environmental needs. Assets may also be acquired at no cost to the Council from land development.
These assets from growth are considered in Section 4.4.

- 35 -
GLEN INNES SEVERN COUNCIL – TRANSPORT INFRASTRUCTURE ASSET MANAGEMENT PLAN
5.5.1 SELECTION CRITERIA
New assets and upgrade/expansion of existing assets are identified from various sources such as
councillor or community requests, proposals identified by strategic plans or partnerships with other
organisations. Candidate proposals are inspected to verify need and to develop a preliminary renewal
estimate. Verified proposals are ranked by priority and available funds and scheduled in future works
programmes. The priority ranking criteria is detailed below.
Table 5.5.1 New Assets Priority Ranking Criteria
CRITERIA WEIGHTING
Community Strategic Plan No current weighting or ranking against other
Asset Classes.
Long Term Financial Plan No current weighting or ranking against other
Asset Classes.
Current Service Level No current weighting or ranking against other
Asset Classes.
Legislative OHS No current weighting or ranking against other
Asset Classes.
Technical need (ie heavy vehicle
increase)
No current weighting or ranking against other
Asset Classes.
Road or path hierarchy No current weighting or ranking against other
Asset Classes.
Total 100%
5.5.2 STANDARDS AND SPECIFICATIONS
Standards and specifications for new assets and for upgrade/expansion of existing assets are the same
as those for renewal shown in Section 5.3.1.

- 36 -
GLEN INNES SEVERN COUNCIL – TRANSPORT INFRASTRUCTURE ASSET MANAGEMENT PLAN
5.5.3 SUMMARY OF FUTURE UPGRADE/NEW ASSETS EXPENDITURE
Planned upgrade/new asset expenditures are summarised in Fig 6. The planned upgrade/new capital
works program is shown in Appendix C. All costs are shown in current 2013 dollar values.
Fig 6a. Planned Capital Upgrade/New Asset Expenditure (Base Case)

- 37 -
GLEN INNES SEVERN COUNCIL – TRANSPORT INFRASTRUCTURE ASSET MANAGEMENT PLAN
Fig 6b. Planned Capital Upgrade/New Asset Expenditure (Scenario 5)
New assets and services are to be funded from Council‟s capital works program and grants where
available. This is further discussed in Section 6.2.
5.6 DISPOSAL PLAN
Road closures, i.e. the legal prevention of use of a road reserve by vehicles and the public, often result in
retention of the land by council for use as a revegetation corridor. Existing road pavement materials
may be ripped and left in-situ. Upgraded pavements (ie. by depth, not width) may result in the
existing pavement layers being removed and re-used elsewhere as second-grade re-sheeting on
local rural roads. For all practical purposes, the value of salvaged road and footpath materials is
of little consequence.

- 38 -
GLEN INNES SEVERN COUNCIL – TRANSPORT INFRASTRUCTURE ASSET MANAGEMENT PLAN
6. FINANCIAL SUMMARY
This section contains the financial requirements resulting from all the information presented in the previous
sections of this asset management plan. The financial projections will be improved as further information
becomes available on desired levels of service and current and projected future asset performance.
6.1 FINANCIAL STATEMENTS AND PROJECTIONS
The financial projections are shown in Fig 7 for planned operating (operations and maintenance) and capital
expenditure (renewal and upgrade/expansion/new assets).
Fig 7a. Planned Operating and Capital Expenditure (Base Case)

- 39 -
Fig 7b. Planned Operating and Capital Expenditure (Base Case)
Scenario 5 above shows the once-off impact of the proposed $4 million loan for bridge renewal and the ongoing
increase in spending for renewal as a result of the proposed special rate variation.
Note that all costs are shown in current 2013 dollar values.
6.1.1 SUSTAINABILITY OF SERVICE DELIVERY
There are two key indicators for financial sustainability that have been considered in the analysis of
the services provided by this asset category, these being long term life cycle costs and medium term
costs over the 10 year financial planning period.
Long term - Life Cycle Cost
Life cycle costs (or whole of life costs) are the average costs that are required to sustain the service
levels over the longest asset life. Life cycle costs include maintenance and asset consumption
(depreciation expense). The annual average life cycle cost for the services covered in this asset
management plan is $4,400,000 (base case) or $4,507,000 (scenario 5).

- 40 -
Life cycle costs can be compared to life cycle expenditure to give an indicator of sustainability in
service provision. Life cycle expenditure includes maintenance plus capital renewal expenditure. Life
cycle expenditure will vary depending on the timing of asset renewals. The average life cycle
expenditure over the 20 year timeframe of the plan is $4,124,000 (base case) or $4,925,000 (scenario
5).
A gap between life cycle costs and life cycle expenditure gives an indication as to whether present
consumers are paying their share of the assets they are consuming each year. The purpose of this
Transport asset management plan is to identify levels of service that the community needs and can
afford and develop the necessary long term financial plans to provide the service in a sustainable
manner.
Over the 20 year horizon of this asset management plan, the average life cycle gap for services
covered by this plan is $276,000 per annum (base case) or $-418,000 (scenario 5). The life cycle
sustainability index is 94% (base case) or 109% (scenario 5).
Medium term – 10 year financial planning period
This asset management plan identifies the estimated maintenance and capital expenditures required
to provide an agreed level of service to the community over a 20 year period for input into a 10 year
financial plan and funding plan to provide the service in a sustainable manner.
This may be compared to existing or planned expenditures in the 20 year period to identify any gap.
In a core asset management plan, a gap is generally due to increasing asset renewals.
Fig 8 shows the projected asset renewals in the 20 year planning period from the asset register. The
projected asset renewals are compared to planned renewal expenditure in the capital works program
and capital renewal expenditure in year 1 of the planning period as shown in Fig 8. Table 6.1.1
shows the annual and cumulative funding gap between projected and planned renewals.

- 41 -
Fig 8a. Projected and Planned Renewals and Current Renewal Expenditure (Base Case)
$0
$5,000
$10,000
$15,000
$20,000
$25,000
$30,000
$35,000
$40,000
$45,000
($,0
00
)
Year
Base Case - cumulative
Projected Renewals Planned Renewals

- 42 -
Fig 8b. Projected and Planned Renewals and Current Renewal Expenditure (Scenario 5)
$0
$10,000
$20,000
$30,000
$40,000
$50,000
$60,000
($,0
00
)
Year
Scenario 5 - cumulative
Projected Renewals Planned Renewals
- 43 -
GLEN INNES SEVERN COUNCIL – TRANSPORT INFRASTRUCTURE ASSET MANAGEMENT PLAN
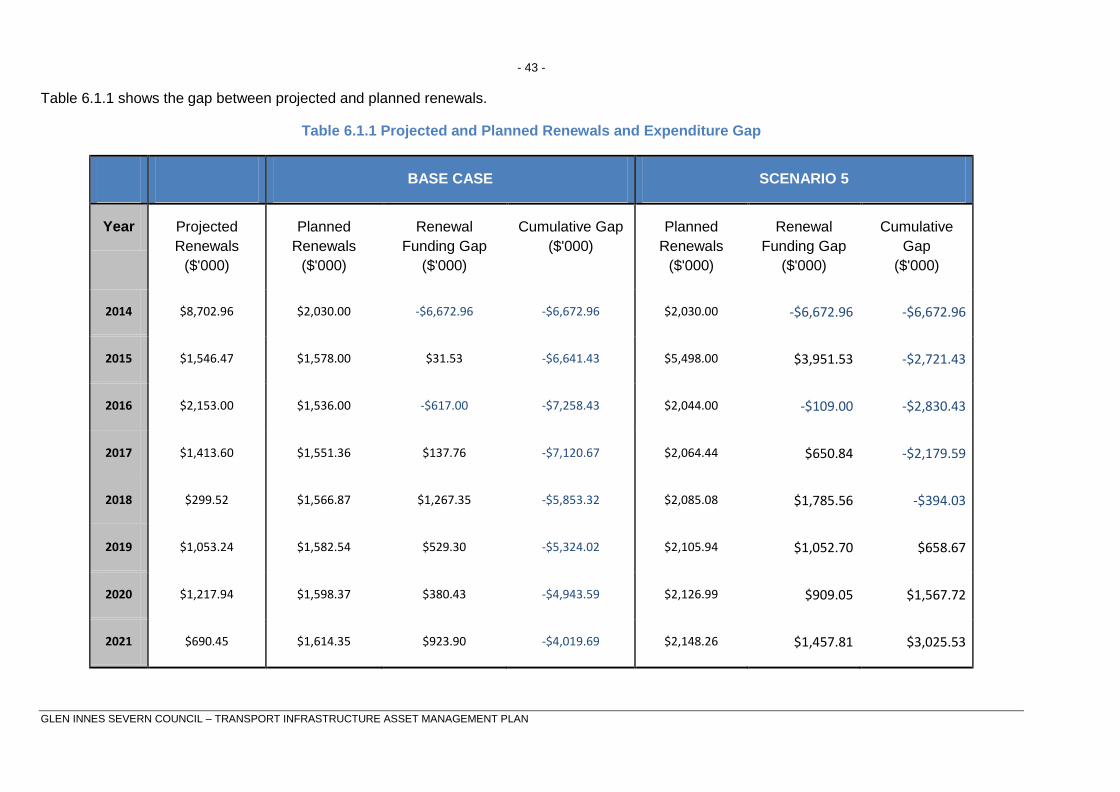
Table 6.1.1 shows the gap between projected and planned renewals.
Table 6.1.1 Projected and Planned Renewals and Expenditure Gap
BASE CASE SCENARIO 5
Year Projected
Renewals
($'000)
Planned
Renewals
($'000)
Renewal
Funding Gap
($'000)
Cumulative Gap
($'000)
Planned
Renewals
($'000)
Renewal
Funding Gap
($'000)
Cumulative
Gap
($'000)
2014 $8,702.96 $2,030.00 -$6,672.96 -$6,672.96 $2,030.00 -$6,672.96 -$6,672.96
2015 $1,546.47 $1,578.00 $31.53 -$6,641.43 $5,498.00 $3,951.53 -$2,721.43
2016 $2,153.00 $1,536.00 -$617.00 -$7,258.43 $2,044.00 -$109.00 -$2,830.43
2017 $1,413.60 $1,551.36 $137.76 -$7,120.67 $2,064.44 $650.84 -$2,179.59
2018 $299.52 $1,566.87 $1,267.35 -$5,853.32 $2,085.08 $1,785.56 -$394.03
2019 $1,053.24 $1,582.54 $529.30 -$5,324.02 $2,105.94 $1,052.70 $658.67
2020 $1,217.94 $1,598.37 $380.43 -$4,943.59 $2,126.99 $909.05 $1,567.72
2021 $690.45 $1,614.35 $923.90 -$4,019.69 $2,148.26 $1,457.81 $3,025.53

- 44 -
2022 $1,257.07 $1,630.50 $373.43 -$3,646.26 $2,169.75 $912.68 $3,938.21
2023 $1,245.08 $1,646.80 $401.72 -$3,244.54 $2,191.44 $946.36 $4,884.57
2024 $591.33 $1,663.27 $1,071.94 -$2,172.60 $2,213.36 $1,622.03 $6,506.60
2025 $338.65 $1,679.90 $1,341.25 -$831.35 $2,235.49 $1,896.84 $8,403.44
2026 $1,244.91 $1,696.70 $451.79 -$379.56 $2,257.85 $1,012.94 $9,416.38
2027 $746.23 $1,713.67 $967.44 $587.88 $2,280.43 $1,534.20 $10,950.58
2028 $8,320.10 $1,730.80 -$6,589.30 -$6,001.42 $2,303.23 -$6,016.87 $4,933.71
2029 $1,262.47 $1,748.11 $485.64 -$5,515.78 $2,326.26 $1,063.79 $5,997.50
2030 $2,136.38 $1,765.59 -$370.79 -$5,886.57 $2,349.53 $213.15 $6,210.65
2031 $2,483.08 $1,783.25 -$699.83 -$6,586.40 $2,373.02 -$110.06 $6,100.59
2032 $1,627.63 $1,801.08 $173.45 -$6,412.95 $2,396.75 $769.12 $6,869.71
2033 $926.38 $1,819.09 $892.71 -$5,520.24 $2,420.72 $1,494.34 $8,364.05
- 45 -
GLEN INNES SEVERN COUNCIL – TRANSPORT INFRASTRUCTURE ASSET MANAGEMENT PLAN
Providing services in a sustainable manner will require matching of projected asset renewals to meet
agreed service levels with planned capital works programs and available revenue.
A gap between projected asset renewals, planned asset renewals and funding indicates that further
work is required to manage required service levels and funding to eliminate any funding gap.
Council will manage the „gap‟ by developing this asset management plan to provide guidance on
future service levels and resources required to provide these services.
6.2 FUNDING STRATEGY
Projected costs are to be funded from Council‟s operating and capital budgets. The funding strategy
will be detailed in the Council‟s LTFP.
Achieving the financial strategy will require an ongoing commitment to fund the increasing demand for
asset renewals.
6.3 VALUATION FORECASTS
Asset values are forecast to increase as additional assets are added to the asset stock from
construction and acquisition by Council and from assets constructed by land developers and others
and donated to Council. Fig 9 shows the projected replacement cost asset values over the planning
period in current 2013 dollar values.

- 46 -
Fig 9a. Projected Asset Values (Base Case)
Fig 9b. Projected Asset Values (Scenario 5)

- 47 -
Depreciation expense values are forecast in line with asset values as shown in Fig 10.
Fig 10a. Projected Depreciation Expense (Base Case)
Fig 10b. Projected Depreciation Expense (Scenario 5)

- 48 -
The depreciated replacement cost (current replacement cost less accumulated depreciation) will vary over the
forecast period depending on the rates of addition of new assets, disposal of old assets and consumption and
renewal of existing assets. Forecast of the assets‟ depreciated replacement cost is shown in Fig 11.
Fig 11a. Projected Depreciated Replacement Cost (Base Case)
Fig 11b. Projected Depreciated Replacement Cost (Scenario 5)

- 49 -
6.4 KEY ASSUMPTIONS MADE IN FINANCIAL FORECASTS
This section details the key assumptions made in presenting the information contained in this asset
management plan and in preparing forecasts of required operating and capital expenditure and asset
values, depreciation expense and carrying amount estimates. It is presented to enable readers to
gain an understanding of the levels of confidence in the data behind the financial forecasts.
Key assumptions:
Assumptions on the relationship between growth and increases in the asset stock.
Assumptions on changes to useful life estimated to reflect improved maintenance and
renewal practices.
Present service levels will remain constant until revised service levels are produced in
accordance with Section 3.3.
Assumption of a steady state condition of unsealed and sealed road network
Assumption of a normal weather conditions.
Assumption that expected and adopted useful life of roads and footbridges will be achieved.
Accuracy of future financial forecasts may be improved in future revisions of this Asset
Management Plan by the following actions:
Undertaking regular surveys on the road pavement, surface and kerb conditions.
Undertaking regular defect surveys on bridges.
Reducing expenditure on unplanned road maintenance and using these funds for planned
reconstruction, rehabilitation and reseal programs.
Undertake analysis of the growth, and build this into future revisions of this Asset
Management Plan.
Improved information systems on maintenance and operating expenditures.
Assumptions have been made as to the average useful lives and remaining lives of the asset
groups based on current local knowledge and experience and historical trends. These need to be
reviewed and the accuracy improved based on real time assessment of asset
deterioration.
Review of the effective economic life of pavement surfacing and layers has the potential for
greatest variance in cost predictions.
Changes in development needs associated with the rate and location of growth.
Changes in the desired level of service and service standards from those identified in this
plan.

- 50 -
7. ASSET MANAGEMENT PRACTICES
7.1 ACCOUNTING/FINANCIAL SYSTEMS
Refer Part 1.
7.2 ASSET MANAGEMENT SYSTEMS
Refer Part 1.
7.3 INFORMATION FLOW REQUIREMENTS AND PROCESSES
Refer Part 1.
7.4 STANDARDS AND GUIDELINES
Refer Part 1.
7.5 DATA CONFIDENCE LEVEL
Data confidence levels for this AMP are rated as B or C.
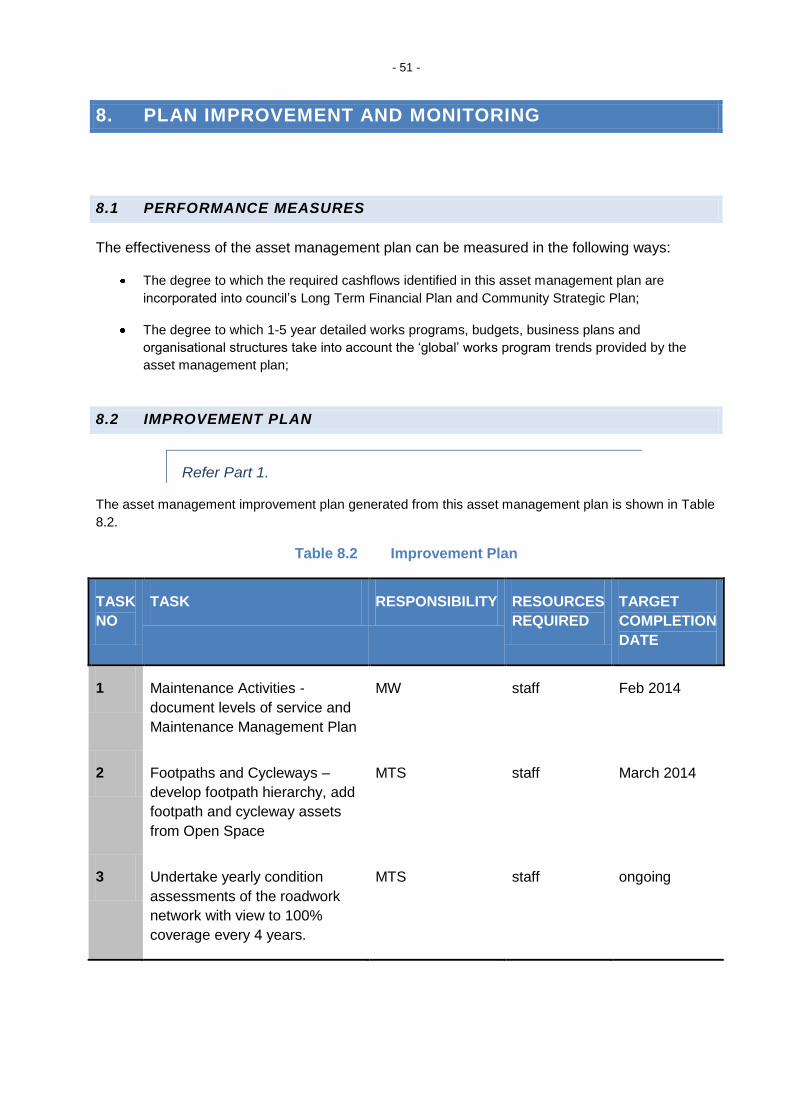
- 51 -
8. PLAN IMPROVEMENT AND MONITORING
8.1 PERFORMANCE MEASURES
The effectiveness of the asset management plan can be measured in the following ways:
The degree to which the required cashflows identified in this asset management plan are
incorporated into council‟s Long Term Financial Plan and Community Strategic Plan;
The degree to which 1-5 year detailed works programs, budgets, business plans and
organisational structures take into account the „global‟ works program trends provided by the
asset management plan;
8.2 IMPROVEMENT PLAN
Refer Part 1.
The asset management improvement plan generated from this asset management plan is shown in Table
8.2.
Table 8.2 Improvement Plan
TASK
NO
TASK RESPONSIBILITY RESOURCES
REQUIRED
TARGET
COMPLETION
DATE
1 Maintenance Activities -
document levels of service and
Maintenance Management Plan
MW staff Feb 2014
2 Footpaths and Cycleways –
develop footpath hierarchy, add
footpath and cycleway assets
from Open Space
MTS staff March 2014
3 Undertake yearly condition
assessments of the roadwork
network with view to 100%
coverage every 4 years.
MTS staff ongoing

- 52 -
Undertake a major review of this
Asset Management plan on a 2
year cycle.
MTS staff Dec 2013
Section 5.4.1 – Renewal priority
criteria.
MTS staff May 2014
Review of risk management
plan detailed in Section 5.2.
MTS staff April 2014
8.3 MONITORING AND REVIEW PROCEDURES
This asset management plan will be reviewed during annual budget preparation and amended to
recognise any changes in service levels and/or resources available to provide those services as a result
of the budget decision process.
The Plan has a life of 4 years and is due for revision and updating within 2 years of each Council election.

- 53 -
REFERENCES
Refer Part 1.

- 54 -
APPENDICES
APPENDIX A MAINTENANCE RESPONSE LEVELS OF SERVICE
Levels of service to be included in next full revision of plan.

- 55 -
APPENDIX B
PLANNED TRANSPORT INFRASTRUCTURE EXPENDITURES FOR LONG-TERM FINANCIAL PLAN (BASE CASE)
YEAR
END
JUN-
30
TOTAL
OPERATIONS
EXPENDITURE
($'000)
TOTAL
MAINTENANCE
EXPENDITURE
($'000)
PROJECTED
CAPITAL
RENEWAL
EXPENDITURE
($'000)
PLANNED
CAPITAL
UPGRADE/NEW
EXPENDITURE
($'000)
PLANNED
DISPOSALS
($'000)
PLANNED
CAPITAL
RENEWAL
EXPENDITURE
($'000)
SHORTFALL
IN RENEWAL
EXPENDITURE
(PROJECTED -
PLANNED)
($'000)
CUMULATIVE
RENEWAL
FUNDING
SHORTFALL
($'000)
2014 $761.19 $1,473.31 $8,702.96 $330.00 $118.00 $2,030.00 $6,672.96 $6,672.96
2015 $762.22 $1,475.30 $1,546.47 $257.00 $92.00 $1,578.00 -$31.53 $6,641.42
2016 $763.23 $1,477.25 $2,153.00 $250.00 $92.92 $1,536.00 $617.00 $7,258.42
2017 $764.25 $1,479.22 $1,413.60 $252.50 $93.85 $1,551.36 -$137.76 $7,120.66
2018 $765.28 $1,481.22 $299.52 $255.03 $94.79 $1,566.87 -$1,267.35 $5,853.30
2019 $766.32 $1,483.23 $1,053.24 $257.58 $95.74 $1,582.54 -$529.31 $5,324.00
2020 $767.37 $1,485.27 $1,217.94 $260.15 $96.69 $1,598.37 -$380.43 $4,943.57
2021 $768.43 $1,487.32 $690.45 $262.75 $97.66 $1,614.35 -$923.90 $4,019.67

- 56 -
2022 $769.51 $1,489.40 $1,257.07 $265.38 $98.64 $1,630.50 -$373.43 $3,646.24
2023 $770.59 $1,491.50 $1,245.08 $268.03 $99.62 $1,646.80 -$401.72 $3,244.52
2024 $771.69 $1,493.63 $591.33 $270.71 $100.62 $1,663.27 -$1,071.94 $2,172.58
2025 $772.80 $1,495.78 $338.65 $273.42 $101.63 $1,679.90 -$1,341.25 $831.33
2026 $773.92 $1,497.95 $1,244.91 $276.16 $102.64 $1,696.70 -$451.79 $379.54
2027 $775.06 $1,500.14 $746.23 $278.92 $103.67 $1,713.67 -$967.43 -$587.90
2028 $776.20 $1,502.36 $8,320.10 $281.71 $104.70 $1,730.80 $6,589.29 $6,001.40
2029 $777.36 $1,504.61 $1,262.47 $284.52 $105.75 $1,748.11 -$485.64 $5,515.76
2030 $778.53 $1,506.87 $2,136.38 $287.37 $106.81 $1,765.59 $370.79 $5,886.55
2031 $779.72 $1,509.17 $2,483.08 $290.24 $107.88 $1,783.25 $699.83 $6,586.38
2032 $780.92 $1,511.49 $1,627.63 $293.14 $108.96 $1,801.08 -$173.45 $6,412.93
2033 $782.13 $1,513.83 $926.38 $296.08 $110.05 $1,819.09 -$892.71 $5,520.22

- 57 -
PLANNED TRANSPORT INFRASTRUCTURE EXPENDITURES FOR LONG-TERM FINANCIAL PLAN (SCENARIO 5)
YEAR
END
JUN-
30
TOTAL
OPERATIONS
EXPENDITURE
($'000)
TOTAL
MAINTENANCE
EXPENDITURE
($'000)
PROJECTED
CAPITAL
RENEWAL
EXPENDITURE
($'000)
PLANNED
CAPITAL
UPGRADE/NEW
EXPENDITURE
($'000)
PLANNED
DISPOSALS
($'000)
PLANNED
CAPITAL
RENEWAL
EXPENDITURE
($'000)
SHORTFALL IN
RENEWAL
EXPENDITURE
(PROJECTED -
PLANNED)
($'000)
CUMULATIVE
RENEWAL
FUNDING
SHORTFALL
($'000)
2014 $761.19 $1,473.31 $8,702.96 $330.00 $118.00 $2,030.00 $6,672.96 $6,672.96
2015 $763.82 $1,478.40 $1,546.47 $895.00 $275.00 $5,498.00 -$3,951.53 $2,721.42
2016 $765.09 $1,480.85 $2,153.00 $333.00 $102.00 $2,044.00 $109.00 $2,830.42
2017 $766.37 $1,483.33 $1,413.60 $336.33 $103.02 $2,064.44 -$650.84 $2,179.58
2018 $767.67 $1,485.84 $299.52 $339.69 $104.05 $2,085.08 -$1,785.57 $394.01
2019 $768.97 $1,488.37 $1,053.24 $343.09 $105.09 $2,105.94 -$1,052.70 -$658.69
2020 $770.30 $1,490.93 $1,217.94 $346.52 $106.14 $2,126.99 -$909.06 -$1,567.74
2021 $771.63 $1,493.52 $690.45 $349.99 $107.20 $2,148.26 -$1,457.81 -$3,025.55
2022 $772.98 $1,496.13 $1,257.07 $353.49 $108.28 $2,169.75 -$912.68 -$3,938.23
2023 $774.35 $1,498.77 $1,245.08 $357.02 $109.36 $2,191.44 -$946.37 -$4,884.60

- 58 -
2024 $775.73 $1,501.44 $591.33 $360.59 $110.45 $2,213.36 -$1,622.03 -$6,506.63
2025 $777.12 $1,504.14 $338.65 $364.20 $111.56 $2,235.49 -$1,896.84 -$8,403.47
2026 $778.53 $1,506.87 $1,244.91 $367.84 $112.67 $2,257.85 -$1,012.94 -$9,416.41
2027 $779.96 $1,509.62 $746.23 $371.52 $113.80 $2,280.43 -$1,534.19 -$10,950.61
2028 $781.39 $1,512.41 $8,320.10 $375.23 $114.94 $2,303.23 $6,016.87 -$4,933.74
2029 $782.85 $1,515.23 $1,262.47 $378.99 $116.09 $2,326.26 -$1,063.79 -$5,997.53
2030 $784.32 $1,518.07 $2,136.38 $382.77 $117.25 $2,349.53 -$213.14 -$6,210.67
2031 $785.81 $1,520.95 $2,483.08 $386.60 $118.42 $2,373.02 $110.06 -$6,100.61
2032 $787.31 $1,523.86 $1,627.63 $390.47 $119.60 $2,396.75 -$769.12 -$6,869.73
2033 $788.83 $1,526.80 $926.38 $394.37 $120.80 $2,420.72 -$1,494.34 -$8,364.07

- 59 -
APPENDIX C - PROJECTED 20 YEAR CAPITAL WORKS PROGRAM
Year Bridges Barriers
Guardrail
Bridges Major
Culverts
Bridges Timber
Roads Carparks
Roads Floodways
Roads Footpath
Roads Furnishings
Roads Kerb & Gutter
Roads Pavement
Roads Surfacing
2014 21,030 19,684 309,457 118,515 101,356
8,132,914
2015
120,769 74,734
66,142 125,272 1,159,550
2016
426,071
43,505 1,683,425
2017 47,905
16,797
9,459
1,339,436
2018
96,254 38,297
164,969
2019
13,863 187,146
852,226
2020 59,754
483,310
15,046 1,228
348,319 310,282
2021
83,058 607,397
2022 12,478 20,972
197,843 1,025,773
2023 88,362
514,103
642,614
2024
117,912
67,334 406,084
2025 52,214
8,677
48,668
53,724 143,849 31,521
2026 103,994
78,248 1,062,663
2027 338,712 6,567
314,797
86,156
2028 72,766
80,182
6,694 8,160,454
2029 47,998
54,925
1,159,550
2030
16,403
20,238
63,178
73,581 279,559 1,683,425
2031
1,143,647
1,339,436
2032
65,673
16,751 1,380,238 164,969
2033
12,861
60,880 416
852,226
Grand Total 845,212 142,160 1,433,005 351,494 2,381,819 271,965 1,644 210,198 2,753,920 30,865,069

- 60 -
APPENDIX D - PLANNED LONG TERM CAPITAL WORKS PROGRAM (SCENARIO 5)
At the time of writing this report, an inspection is being performed on Council‟s bridges to ascertain the extent of works required. The outcome of this
inspection will be considered in the development of the forward capital works program. It is envisaged that the focus of capital works expenditure will include:
Rehabilitation and renewal of timber bridges, particularly with the planned Low Interest Rate Subsidy loan planned for 2014/15;
Resurfacing sealed roads, including minor heavy patching.
Year Bridges Carparks Roads
Floodways
Roads Footpaths
Furnishings
Roads Kerb & Gutter
Roads Pavement
& Surfacing TOTAL
2015 4,000,000
40,000 28,000 30,000 1,400,000 $5,498,000
2016
120,000 74,000 20,000 30,000 1,800,000 $2,044,000
2017
100,000 40,000 30,000 1,894,000 $2,064,000
2018 100,000
100,000 20,000 30,000 1,835,000 $2,085,000
2019
100,000 20,000 30,000 1,956,000 $2,106,000
2020
200,000 77,000 20,000 30,000 1,800,000 $2,127,000
2021 100,000
100,000 20,000 30,000 1,898,000 $2,148,000
2022
100,000 40,000 30,000 2,000,000 $2,170,000
2023
100,000 40,000 51,000 2,000,000 $2,191,000
Grand Total 4,200,000 320,000 791,000 248,000 291,000 16,583,000 $22,433,000