transformations of graphs - m.k. home tuition - maths...
TRANSCRIPT

Mathematics Revision Guides – Transformations of Graphs Page 1 of 24
Author: Mark Kudlowski
M.K. HOME TUITION
Mathematics Revision Guides
Level: AS / A Level
AQA : C1 Edexcel: C1 OCR: C1 OCR MEI: C1
TRANSFORMATIONS OF GRAPHS
Version : 3.5 Date: 24-03-2013
Example 14 is copyrighted to its owner and used with their permission.
Mathematics Revision Guides – Transformations of Graphs Page 2 of 24
Author: Mark Kudlowski
TRANSFORMATIONS OF GRAPHS
It is possible to obtain a whole family of graphs from a single one by shifting or stretching.
The four transformations to remember are: the y-translation, the x-translation, the y-stretch and the x-
stretch.
The y-translation.
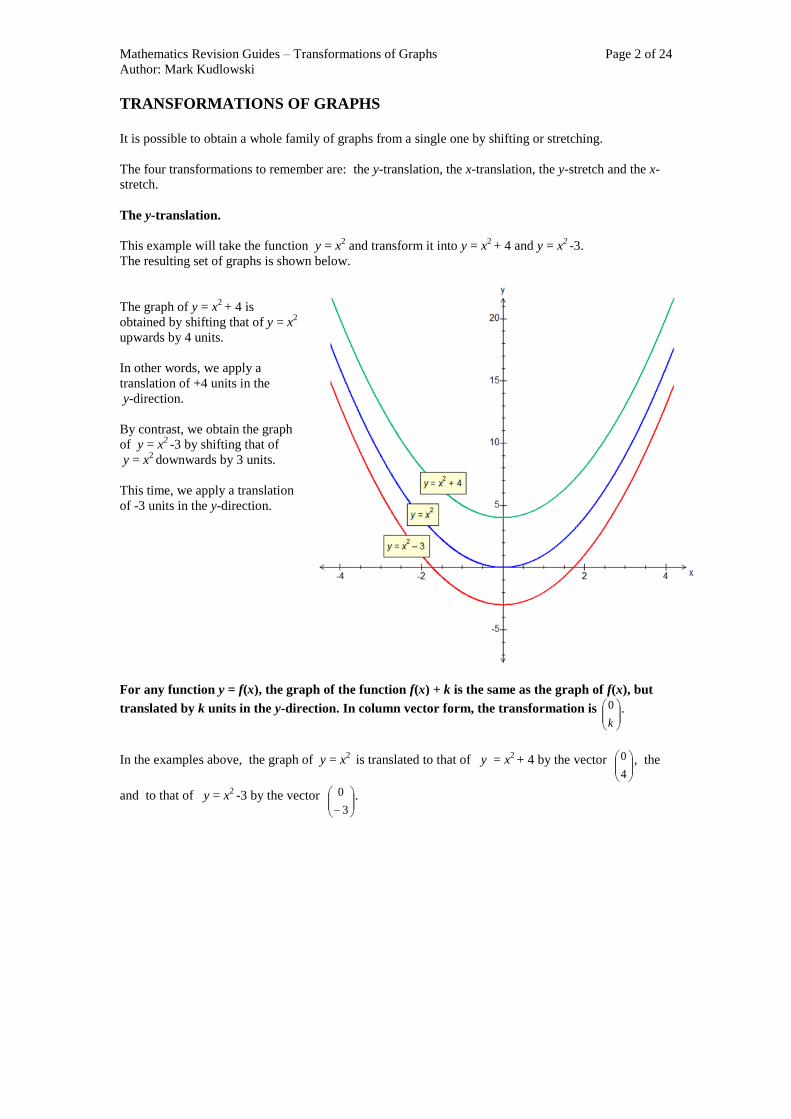
This example will take the function y = x2 and transform it into y = x
2 + 4 and y = x
2 -3.
The resulting set of graphs is shown below.
The graph of y = x2 + 4 is
obtained by shifting that of y = x2
upwards by 4 units.
In other words, we apply a
translation of +4 units in the
y-direction.
By contrast, we obtain the graph
of y = x2 -3 by shifting that of
y = x2 downwards by 3 units.
This time, we apply a translation
of -3 units in the y-direction.
For any function y = f(x), the graph of the function f(x) + k is the same as the graph of f(x), but
translated by k units in the y-direction. In column vector form, the transformation is
k
0 .
In the examples above, the graph of y = x2 is translated to that of y = x
2 + 4 by the vector
4
0 , the
and to that of y = x2 -3 by the vector
3
0 .

Mathematics Revision Guides – Transformations of Graphs Page 3 of 24
Author: Mark Kudlowski
The x-translation.
This example will take the function y = x3 and transform it into y = (x + 2)
3 and y = (x - 1)
3 .
The graph of y = y = (x + 2)3 is obtained by
shifting that of y = x3 leftwards by 2 units.
In other words, we apply a translation of -2
units in the x-direction.
Similarly we obtain the graph of y = (x - 1)3
by shifting the graph of y = x3
rightwards by
one unit.
This time, we apply a translation of +1 unit
in the x-direction.
This transformation may seem to work the
'wrong way' at first sight !
For any function y = f(x), the graph of the function f(x+k) is the same as the graph of f(x), but
translated by -k units in the x-direction. In column vector form, the transformation is
0
k .
In the examples above, the graph of y=x3 is translated to that of (x + 2)
3 by the vector
0
2 , and to
that of (x - 1)3 by the vector
0
1 .
Mathematics Revision Guides – Transformations of Graphs Page 4 of 24
Author: Mark Kudlowski
The y-stretch.
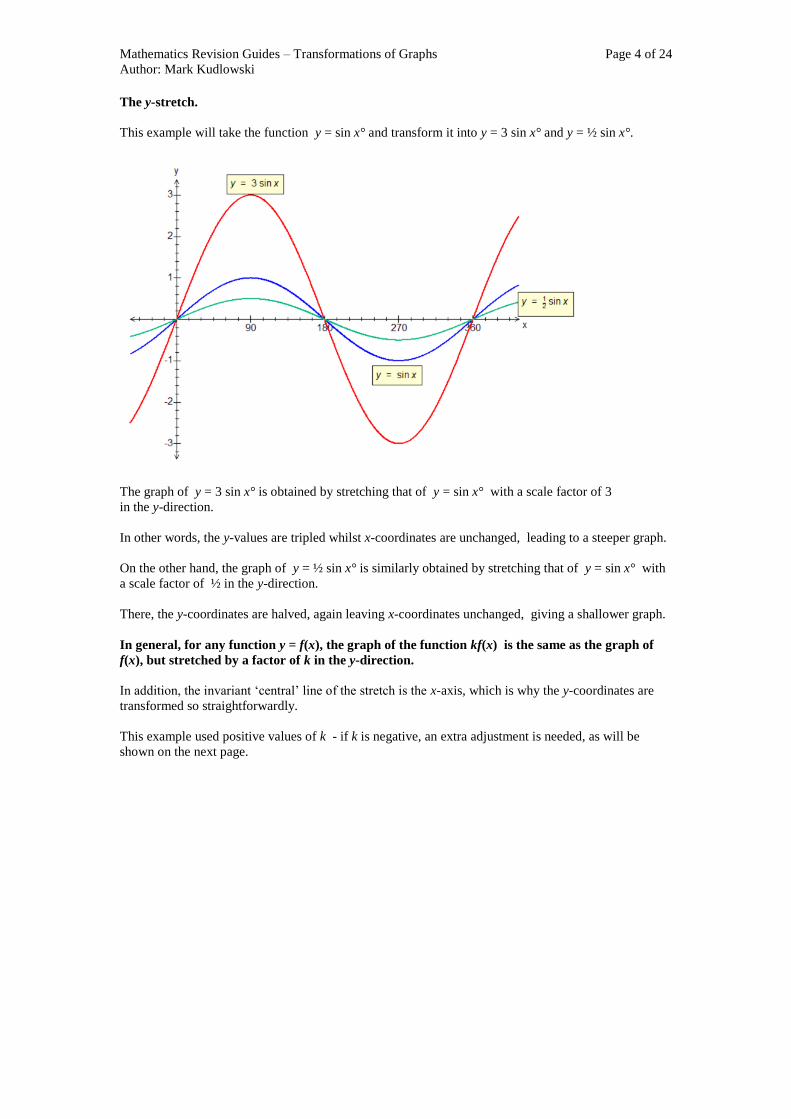
This example will take the function y = sin x° and transform it into y = 3 sin x° and y = ½ sin x°.
The graph of y = 3 sin x° is obtained by stretching that of y = sin x° with a scale factor of 3
in the y-direction.
In other words, the y-values are tripled whilst x-coordinates are unchanged, leading to a steeper graph.
On the other hand, the graph of y = ½ sin x° is similarly obtained by stretching that of y = sin x° with
a scale factor of ½ in the y-direction.
There, the y-coordinates are halved, again leaving x-coordinates unchanged, giving a shallower graph.
In general, for any function y = f(x), the graph of the function kf(x) is the same as the graph of
f(x), but stretched by a factor of k in the y-direction.
In addition, the invariant ‘central’ line of the stretch is the x-axis, which is why the y-coordinates are
transformed so straightforwardly.
This example used positive values of k - if k is negative, an extra adjustment is needed, as will be
shown on the next page.

Mathematics Revision Guides – Transformations of Graphs Page 5 of 24
Author: Mark Kudlowski
Special cases of the y-stretch.
The special case of k = -1, or the
graph of -f(x) against f(x),
corresponds to a reflection of the
graph of f(x) in the x-axis.
The graphs shown here, where
f(x) = sin x, illustrate the situation .
(The y-values have had their sign
reversed).
The next graphs show a y-stretch
with a scale factor of -2.
Here, the graph of y = x2 is
transformed to y = -2x2.
The transformed graph is obtained
by combining a y-stretch of scale
factor 2 with a further reflection in
the x-axis.

Mathematics Revision Guides – Transformations of Graphs Page 6 of 24
Author: Mark Kudlowski
The x-stretch.
This example will take the function y = cos x° and transform it into y = cos 2x° .
The graph of y = cos 2x° is compressed by a factor of 2, or stretched by a factor of ½,
in the x-direction, relative to that of y = cos x°.
(We have not plotted for cos 2x° beyond x = 210° in order to show the relationship between the graphs
more clearly).
In other words, the x-values are halved whilst y-values are unchanged.
As in the case of the x-translation, the result appears to go the 'wrong way'.
The invariant ‘central’ line of the stretch is the y-axis, which is why the x-coordinates are transformed
so straightforwardly.
In general, for any function y = f(x), the graph of the function f(kx) is the same as the graph of
f(x), but stretched by a factor of (1/k) in the x-direction.
This example used a positive value for k - if k is negative, an extra adjustment is needed, as will be
shown on the next page.

Mathematics Revision Guides – Transformations of Graphs Page 7 of 24
Author: Mark Kudlowski
Special case of the x-stretch.
The special case of k = -1, or the
graph of f(-x) against f(x),
corresponds to a reflection of the
graph of f(x) in the y-axis.
The graphs shown here, where
f(x) = 2x, illustrate the situation .
The transformed graph is that of
y = 2-x
.
(The x-values have had their sign
reversed).

Mathematics Revision Guides – Transformations of Graphs Page 8 of 24
Author: Mark Kudlowski
Example (1): Describe the
transformation mapping the graph
of y = x2 to y = f(x).
Hence find the equation of f(x).
We see that the graph of y = f(x) is
a translation of y = x2 by the vector
5
0 , or a y-shift of +5 units.
Therefore f (x) = x2 + 5.
Example (2): Describe the
transformation mapping the graph
of y = x2 to y = f(x).
Hence find the equation of f(x).
We see that the graph of y = f(x) is
a translation of y = x2 by the vector
0
3 , or an x-shift of +3 units.
Therefore f (x) = (x – 3)2.
Mathematics Revision Guides – Transformations of Graphs Page 9 of 24
Author: Mark Kudlowski
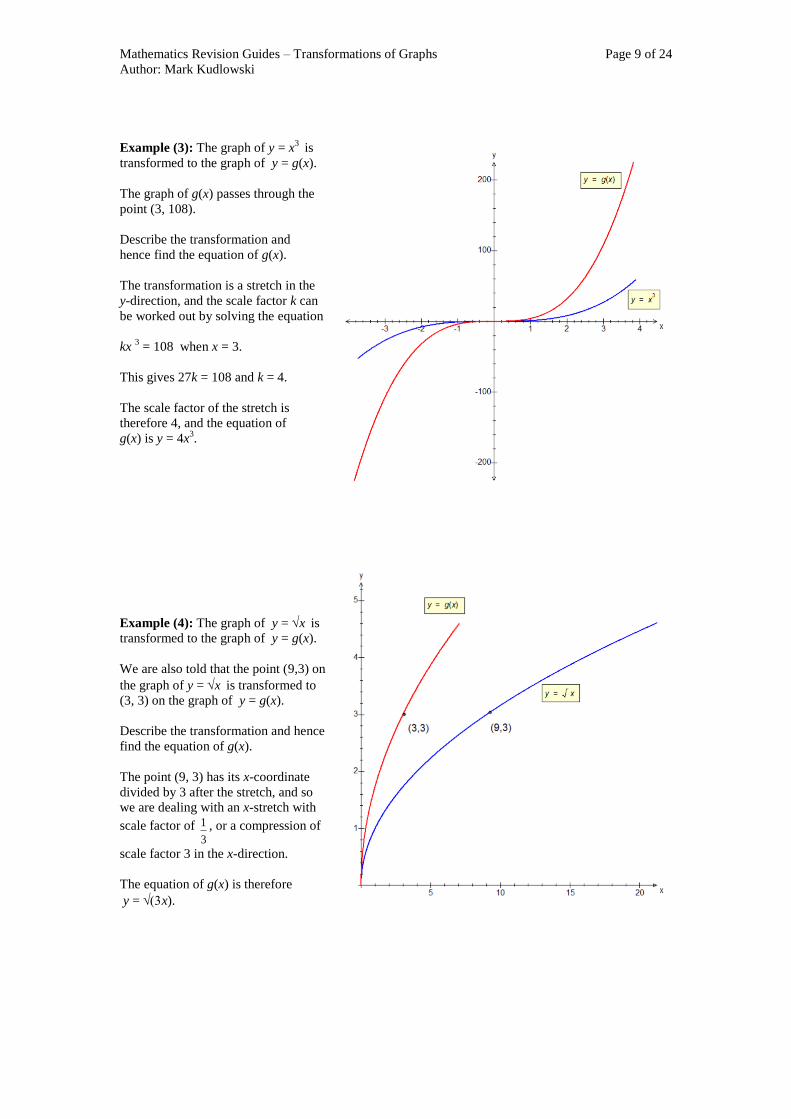
Example (3): The graph of y = x3 is
transformed to the graph of y = g(x).
The graph of g(x) passes through the
point (3, 108).
Describe the transformation and
hence find the equation of g(x).
The transformation is a stretch in the
y-direction, and the scale factor k can
be worked out by solving the equation
kx 3 = 108 when x = 3.
This gives 27k = 108 and k = 4.
The scale factor of the stretch is
therefore 4, and the equation of
g(x) is y = 4x3.
Example (4): The graph of y = x is
transformed to the graph of y = g(x).
We are also told that the point (9,3) on
the graph of y = x is transformed to
(3, 3) on the graph of y = g(x).
Describe the transformation and hence
find the equation of g(x).
The point (9, 3) has its x-coordinate
divided by 3 after the stretch, and so
we are dealing with an x-stretch with
scale factor of 3
1 , or a compression of
scale factor 3 in the x-direction.
The equation of g(x) is therefore
y = x).
Mathematics Revision Guides – Transformations of Graphs Page 10 of 24
Author: Mark Kudlowski
Examples (5): Describe the transformations required to map:
i) f(x) = x2
to g(x) = (x+4) 2
ii) f(x) = x3
to g(x) =
2
x 3
iii) f(x) = x to g(x) = -x
iv) f(x) = sin x to g(x) = sin (-x)
v) f(x) = x2
- 3x - 5 to g(x) = 2x2
- 6x - 10
i) f(x) = x2
is transformed to g(x) = (x + 4) 2
by a translation using vector
0
4
.
ii) f(x) = x3
is transformed to g(x) =
2
x 3 by an x-stretch with scale factor of 2.
iii) f(x) = x is transformed to g(x) = -x by a y-stretch with scale factor -1, which is equivalent to a
reflection in the x-axis.
iv) f(x) = sin x is transformed to g(x) = sin (-x) by an x-stretch with scale factor -1, which is
equivalent to a reflection in the y-axis.
v) We notice here that the expression for g(x) is exactly twice that for f(x). Since all y-values are
doubled, the equivalent transformation is a y-stretch with scale factor 2.
Examples (6): The transformations in each case map f(x) to g(x). Find g(x).
i) f(x) = x
by a translation with vector
2
0
ii) f(x) = x
1 by a y-stretch with scale factor 4
1
iii) f(x) = x3
by a translation with vector
0
3
iv) f(x) = 2x2 – 1 by an x-stretch with scale factor ½
i) Translating f(x) = x with the vector
2
0 gives
g(x) = x + 2.
ii) When we transform f(x) = x
1 by a y-stretch with scale factor 4
1 , we get g(x) = x4
1 .
iii) By translating f(x) = x3
with the vector
0
3 , we obtain g(x) = ( x - 3)
3 .
iv) An x-stretch of factor ½ transforms f(x) to f(2x).
Substituting 2x for x therefore gives f(2x) = g(x) = 2(2x)2
- 1 g(x) = 2(4x2 ) - 1 g(x) = 8x
2 - 1.
(Beware of this common error: (2x)2
= 4x2, not 2x
2 !)

Mathematics Revision Guides – Transformations of Graphs Page 11 of 24
Author: Mark Kudlowski
Example (7): The graph of y = f(x) = 1 + 3x - x2
is reflected in the x-axis
to give the graph of y = g(x).
Give the equation of g(x).
Reflection in the x-axis maps
f(x) to – f(x) , with all y-
coordinates multiplied by –1.
The coefficients of the terms
in the equation of g(x) are
exactly those of the terms in
f(x) but with the + and - signs
reversed.
Hence the equation of g(x) is
y = - (1 + 3x - x2)
y = x2 - 3x – 1.
Example (8): The graph of
y = f(x) = 1 + 4x + 5x2
+ x3
is reflected in the y-axis
to give the graph of g(x).
Give the equation of g(x).
Reflection in the y-axis maps f(x) to
f(-x) , with all references to x replaced
by those to –x.
g(x) = 1 + 4(-x) + 5(-x)2
+ (-x)3
g(x) = 1 - 4x + 5x2
- x3.
Notice how the coefficients of the
even powers of x (and the constant)
remain the same, but those of the odd
powers of x have their sign reversed.
This is because (-x)2 = x
2 , (-x)
4 = x
4 ,
and so on for even powers of x.
Conversely (-x) = -(x) , (-x)3 = -(x
3),
and so on for odd powers of x.

Mathematics Revision Guides – Transformations of Graphs Page 12 of 24
Author: Mark Kudlowski
Composite transformations.
It is possible to combine transformations of graphs, as the next examples show.
Example (9): How can we transform the graph of y = x2
to the graph of y = x2 - 6x + 8 ?
When we look at the two graphs ,
we can see that they have the same
shape, and that the second is a
translation of the first.
By inspecting the minimum points
of the two graphs, we can see that
y = x2 - 6x + 8 is a translation of
y = x2
using the vector
1
3 .
In other words, we have translated
the graph of y = x2
by 3 units right
and 1 unit down.
How could we obtain the vector
without plotting the graph ?
The solution lies in completing the
square !
x2 - 6x + 8 = (x - 3)
2
= (x - 3)2
(We are not asked to solve the
equation.)
This completed-square expression therefore gives us information about the required transformations.
Starting with y = x2 , we begin with an x-shift using the vector
0
3 . This translation produces an
intermediate result of y = (x - 3)2.
Next, we perform a y-shift using the vector
1
0 to obtain the final result of y = (x - 3)2
The two shifts can be combined in a single vector, namely
1
3
We could therefore have carried out the translations with the y-shift first to map y = x
2 to y = x
2 – 1 ,
followed by the x-shift to map y = x2 – 1 to y = (x - 3)
2 1.
This is because we are combining two transformations of the same kind, namely vector translations,
and these obey the laws of vector addition.
It is however more logical to start within the brackets and perform the x-shift first, which is important
when dealing with other types of composite transformations.

Mathematics Revision Guides – Transformations of Graphs Page 13 of 24
Author: Mark Kudlowski
Example (10): The graph of y = x3 can be transformed to y = (x + 3)
3 + 12 in two separate
transformations. Describe them and sketch the graphs.
For compound transformations of this kind, it is often helpful to use function diagrams to break down
the process into steps.
The first step is to get from x3
to (x + 3)3 , and this means a translation using the vector
0
3 .
The second is to get from (x + 3)3 to (x + 3)
3 + 12. This requires a translation using the vector
12
0 .
The two translations can be combined in one vector, namely
12
3 .
The graphs are shown below with the point (0,0) on the original for reference. (The intermediate
function of (x + 3)3 is not shown.)
These graphs are drawn accurately here, but a rougher sketch would be acceptable in an examination
provided the general shape is recognisable and the vector(s) noted.
Mathematics Revision Guides – Transformations of Graphs Page 14 of 24
Author: Mark Kudlowski
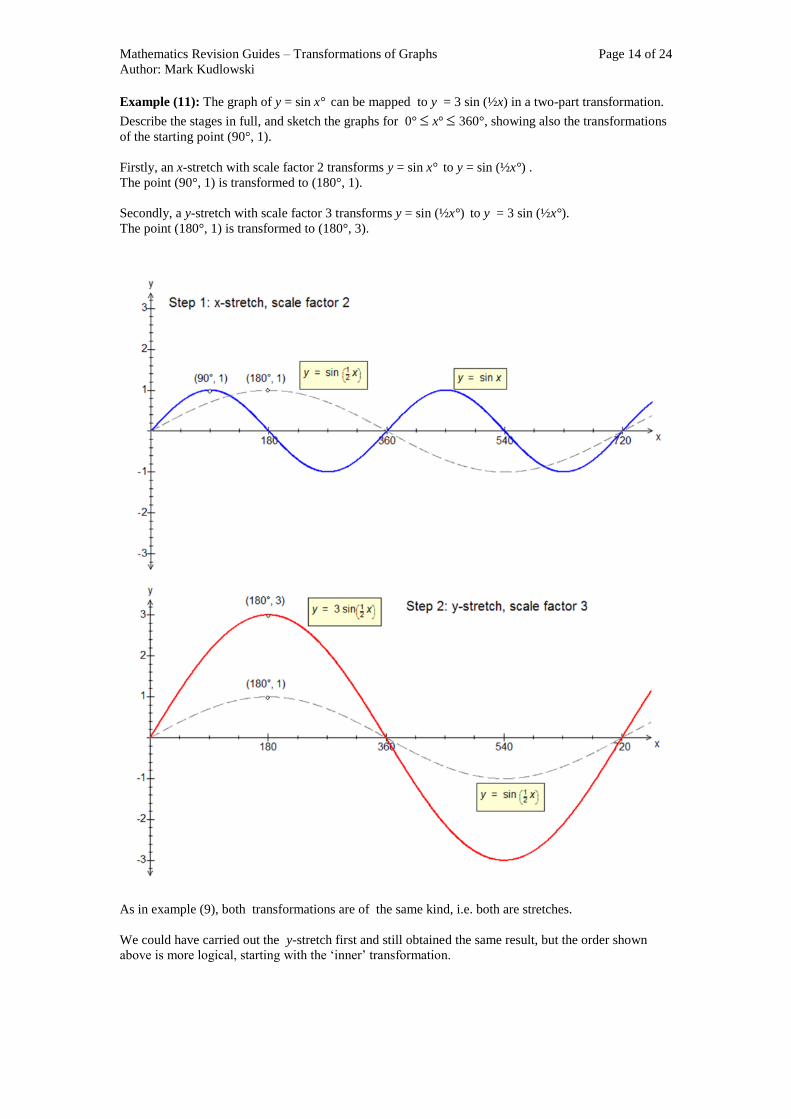
Example (11): The graph of y = sin x° can be mapped to y = 3 sin (½x) in a two-part transformation.
Describe the stages in full, and sketch the graphs for 0° x° 360°, showing also the transformations
of the starting point (90°, 1).
Firstly, an x-stretch with scale factor 2 transforms y = sin x° to y = sin (½x°) .
The point (90°, 1) is transformed to (180°, 1).
Secondly, a y-stretch with scale factor 3 transforms y = sin (½x°) to y = 3 sin (½x°).
The point (180°, 1) is transformed to (180°, 3).
As in example (9), both transformations are of the same kind, i.e. both are stretches.
We could have carried out the y-stretch first and still obtained the same result, but the order shown
above is more logical, starting with the ‘inner’ transformation.

Mathematics Revision Guides – Transformations of Graphs Page 15 of 24
Author: Mark Kudlowski
The last examples involved transformations all of one kind.
It is however possible to combine different types of transformation, namely translations and stretches.
Example (12): The graph of y = x2 can be transformed to y = 2x
2 - 7 in two separate transformations.
Describe them and sketch the graphs.
Step 1: transform y = x
2 to y = 2x
2. This involves a y-stretch with scale factor 2.
Step 2: transform y = 2x
2 to y = 2x
2 - 7. This involves a translation using the vector
7
0 .
The graphs below illustrate the processes, and we have chosen the point (4, 16) as a marker.
In step 1, the point (4, 16) to transformed to (4, 32) as the y-coordinate is doubled in the stretch.
In step 2, point (4, 32) is translated down 7 units to (4, 25).
Notice the minimum point of the graph after the combined transformation; it is at (0, -7).

Mathematics Revision Guides – Transformations of Graphs Page 16 of 24
Author: Mark Kudlowski
It is important to carry out composite transformations in the correct order, as the next example will
show . This is especially true when the transformations are of different kinds !
Example (12a): What happens if we attempt to repeat the transformations in Example (12), but in the
incorrect order ?
Step 1: we
translate with the vector
7
0 , where y = x2 is transformed to y = x
2 - 7 . So far, so good.
Step 2: we perform the y-stretch with scale factor 2.
We now have a problem, because it is the whole of y = x2 – 7 which is doubled, and not just x
2 itself.
The end result is not y = 2x2 – 7, but y = 2(x
2 – 7) which is y = 2x
2 – 14.
Point (4, 16) is now transformed to (4, 9) and then to (4, 18).
In Example (9), the transformations were (4, 16) (4, 32) (4, 25).
The minimum point on the graph is now at (0, -14), not (0, -7).
Mathematics Revision Guides – Transformations of Graphs Page 17 of 24
Author: Mark Kudlowski
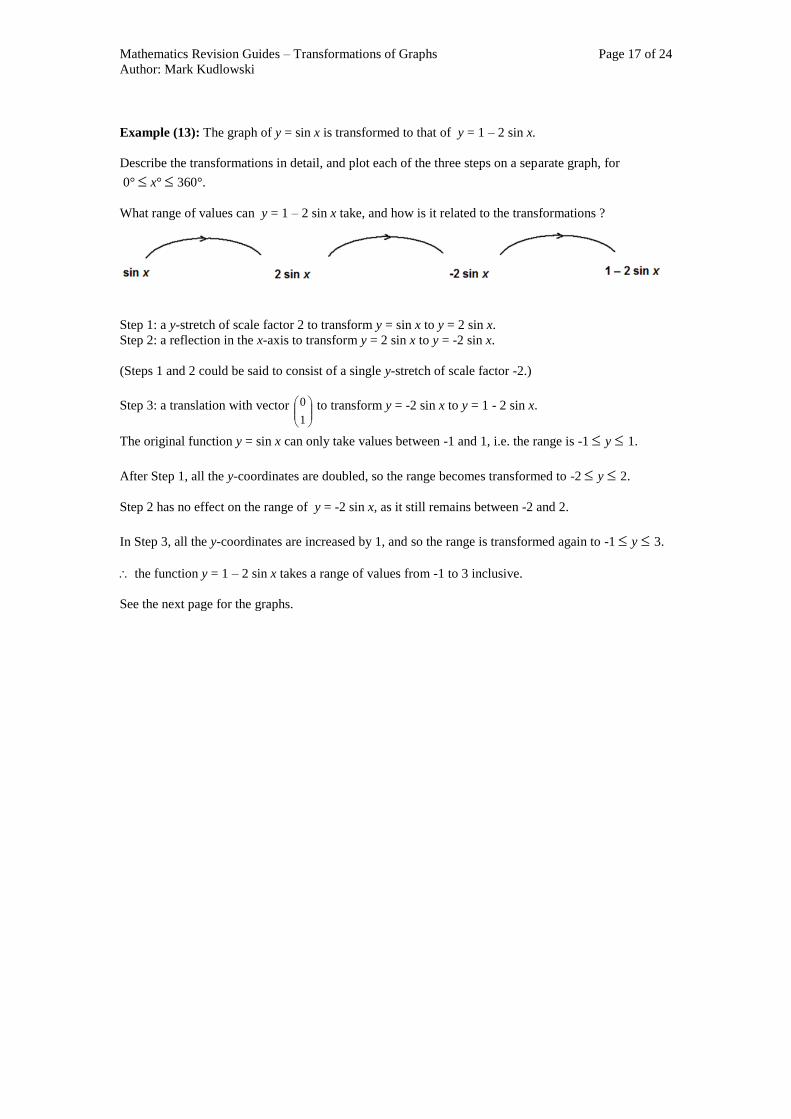
Example (13): The graph of y = sin x is transformed to that of y = 1 – 2 sin x.
Describe the transformations in detail, and plot each of the three steps on a separate graph, for
0° x° 360°.
What range of values can y = 1 – 2 sin x take, and how is it related to the transformations ?
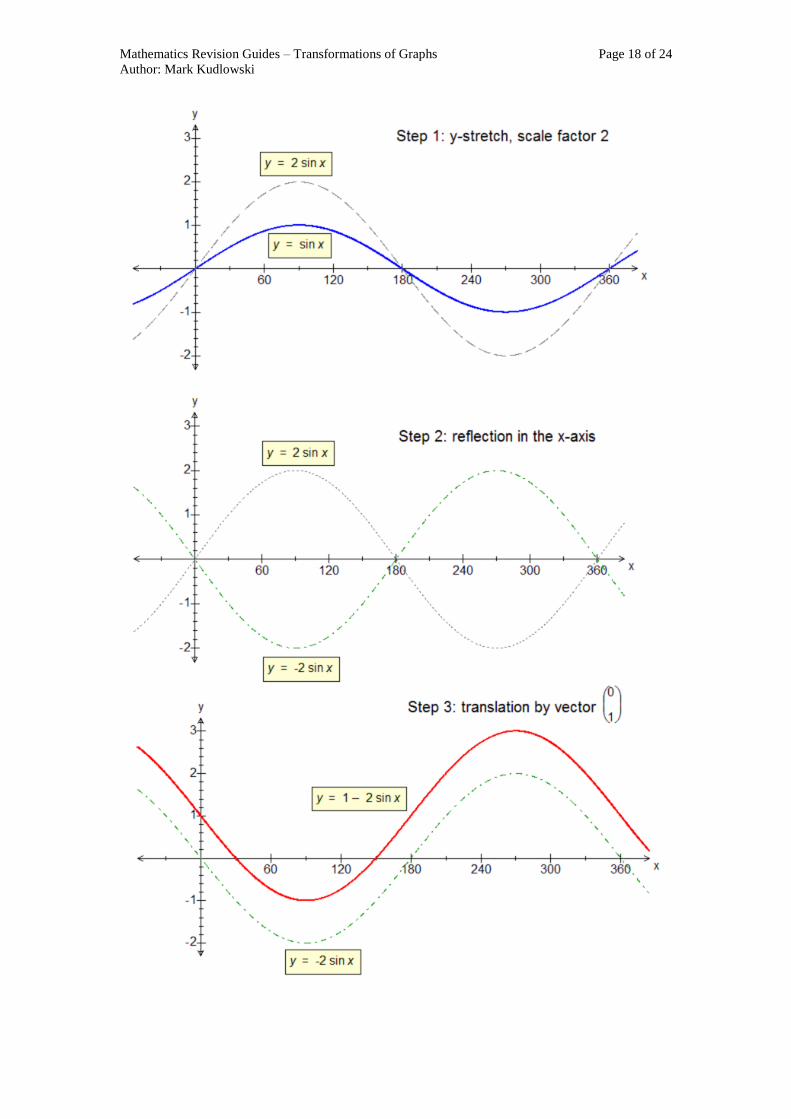
Step 1: a y-stretch of scale factor 2 to transform y = sin x to y = 2 sin x.
Step 2: a reflection in the x-axis to transform y = 2 sin x to y = -2 sin x.
(Steps 1 and 2 could be said to consist of a single y-stretch of scale factor -2.)
Step 3: a translation with vector
1
0 to transform y = -2 sin x to y = 1 - 2 sin x.
The original function y = sin x can only take values between -1 and 1, i.e. the range is -1 y1.
After Step 1, all the y-coordinates are doubled, so the range becomes transformed to -2 y2.
Step 2 has no effect on the range of y = -2 sin x, as it still remains between -2 and 2.
In Step 3, all the y-coordinates are increased by 1, and so the range is transformed again to -1 y3.
the function y = 1 – 2 sin x takes a range of values from -1 to 3 inclusive.
See the next page for the graphs.
Mathematics Revision Guides – Transformations of Graphs Page 18 of 24
Author: Mark Kudlowski
Mathematics Revision Guides – Transformations of Graphs Page 19 of 24
Author: Mark Kudlowski
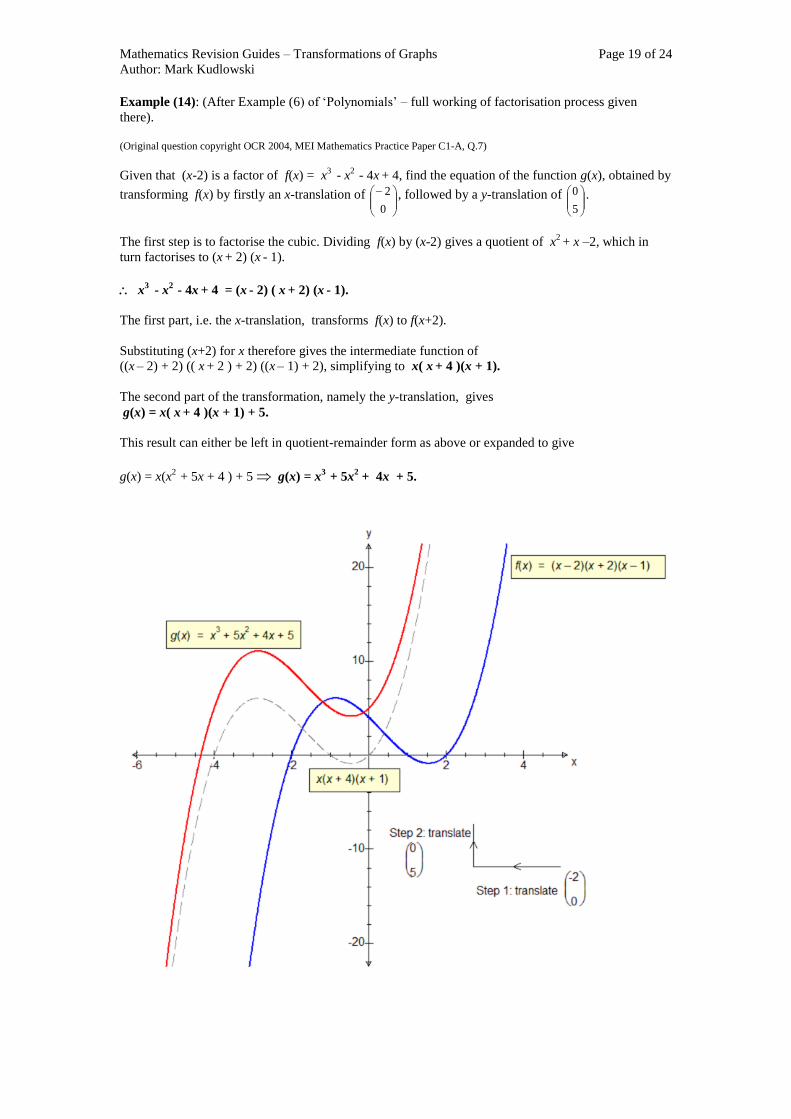
Example (14): (After Example (6) of ‘Polynomials’ – full working of factorisation process given
there).
(Original question copyright OCR 2004, MEI Mathematics Practice Paper C1-A, Q.7)
Given that (x-2) is a factor of f(x) = x3 - x
2 - 4x
+ 4, find the equation of the function g(x), obtained by
transforming f(x) by firstly an x-translation of
0
2 , followed by a y-translation of
5
0 .
The first step is to factorise the cubic. Dividing f(x) by (x-2) gives a quotient of x2 + x –2, which in
turn factorises to (x + 2) (x
- 1).
x3 - x
2 - 4x
+ 4 = (x
- 2) ( x
+ 2) (x
- 1).
The first part, i.e. the x-translation, transforms f(x) to f(x+2).
Substituting (x+2) for x therefore gives the intermediate function of
((x – 2) + 2) (( x
+ 2 ) + 2) ((x
– 1) + 2), simplifying to x( x
+ 4 )(x + 1).
The second part of the transformation, namely the y-translation, gives
g(x) = x( x + 4 )(x + 1) + 5.
This result can either be left in quotient-remainder form as above or expanded to give
g(x) = x(x2
+ 5x + 4 ) + 5 g(x) = x3
+ 5x2 + 4x + 5.

Mathematics Revision Guides – Transformations of Graphs Page 20 of 24
Author: Mark Kudlowski
Alternative transformations.
When it comes to certain pairs of functions, it is sometimes possible to express the same transformation
in alternative ways.
Example (15): Look at the two transformations of y = x2 below.
In the transformation on the left, y = x
2 is transformed to y = 4x
2.
This is a y-stretch with scale factor 4, so the point (3, 9) is mapped to (3, 36) and (-2, 4) to (-2, 16).
In the transformation on the right, y = x2 is transformed to y = (2x)
2.
This is an x-stretch with scale factor ½, so the point (6, 36) is mapped to (3, 36) and (-4, 16) to (-2, 16).
Both transformations represent the same function, since (2x)2 = 4x
2.
Example (16): Show that a y-stretch with scale factor k and an x-stretch with the same scale factor k
are equivalent transformations of the graph of x
y1
.
A y-stretch with scale factor k transforms the graph of x
y1
to that of x
ky .
An x-stretch with scale factor k transforms the graph of x
y1
to that of
xk
y
1
1.
This is equivalent to
k
xy
1 or
x
ky .
Both stretches represent the same transformation.

Mathematics Revision Guides – Transformations of Graphs Page 21 of 24
Author: Mark Kudlowski
Examples (17a): State the sequence of transformations mapping the graph of x2 to the following
graphs. In addition, give the images of the origin and the point (4, 16) at each stage of the composite
transformation.
i) x2 to 2x
2 – 3 ; ii) x
2 to 2(x
2 – 3 ) ; iii) x
2 to 2(x
– 3)
2
i) x2 to 2x
2 – 3
Step 1: transform y = x2 to y = 2x
2. This involves a y-stretch with scale factor 2.
The origin is unchanged, and (4, 16) is mapped to (4,32).
Step 2: transform y = 2x
2 to y = 2x
2 - 3. This involves a translation using the vector
3
0 .
The origin is mapped to (0, -3), and (4, 32) is mapped to (4, 29).
ii) x2 to 2(x
2 – 3 )
Step 1: transform y = x
2 to y = x
2 - 3. This involves a translation using the vector
3
0 .
The origin is mapped to (0, -3), and (4, 16) is mapped to (4,13).
Step 2: transform y = x2 - 3
to y = 2(x
2 – 3). This involves a y-stretch with scale factor 2.
The point (0, -3) is mapped to (0, -6), and (4, 13) is mapped to (4,26).
iii) x2 to 2(x
– 3)
2
Step 1: transform y = x
2 to y = (x- 3)
2 . This involves a translation using the vector
0
3 .
The origin is mapped to (3, 0), and (4, 16) is mapped to (7,16).
Step 2: transform y = (x- 3)2 to y = 2(x- 3)
2. This involves a y-stretch with scale factor 2.
The point (3,0) is unchanged at (3, 0), and (7, 16) is mapped to (7,32).
The three composite transformations in the last example were fairly straightforward to work out, but
there still remains one tricky one !
Mathematics Revision Guides – Transformations of Graphs Page 22 of 24
Author: Mark Kudlowski
Transformations mapping f(x) to f(ax + b).
These transformations combine x-translations and x-stretches. These can be rather treacherous, with
plenty of scope for errors.
Example (17b):
i) What is the solution of (2x – 3)2 = 0 ?
ii) What sequence of transformations maps the graph of x2 to the graph of (2x – 3)
2 ?
i) The solution of (2x – 3)2 = 0 is (2x – 3) = 0 and hence x =
2
11 .
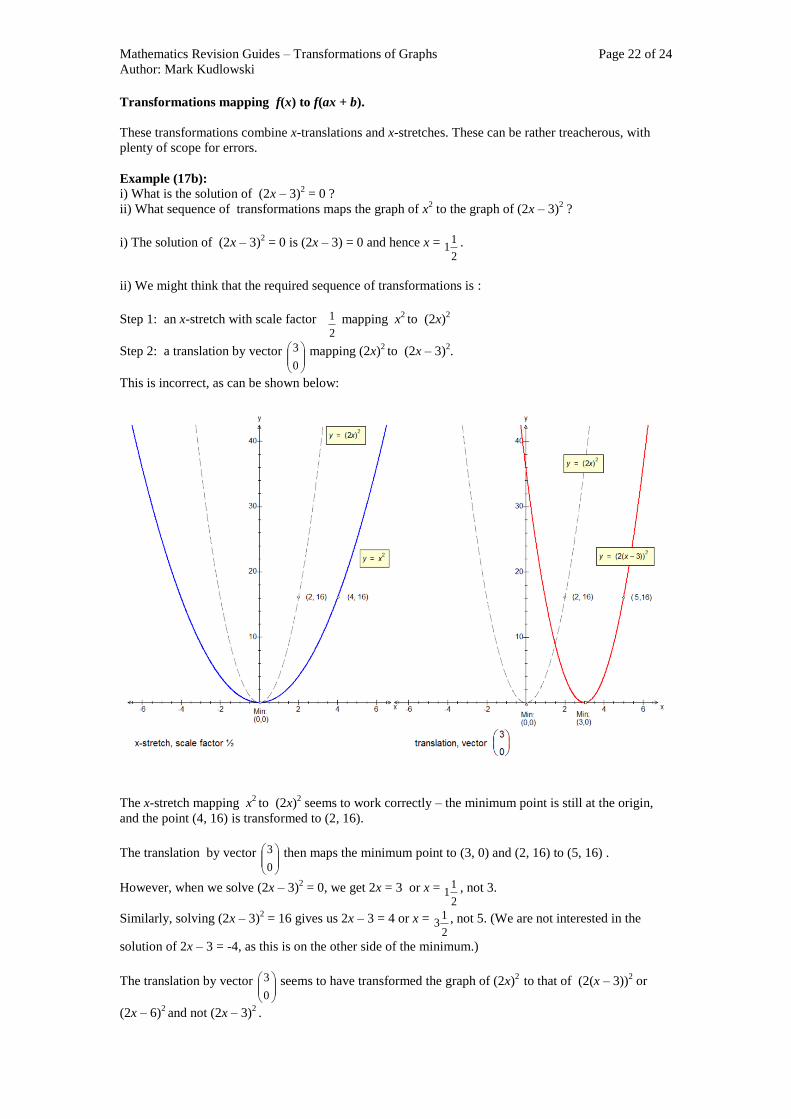
ii) We might think that the required sequence of transformations is :
Step 1: an x-stretch with scale factor 2
1 mapping x2 to (2x)
2
Step 2: a translation by vector
0
3 mapping (2x)2 to (2x – 3)
2.
This is incorrect, as can be shown below:
The x-stretch mapping x2 to (2x)
2 seems to work correctly – the minimum point is still at the origin,
and the point (4, 16) is transformed to (2, 16).
The translation by vector
0
3 then maps the minimum point to (3, 0) and (2, 16) to (5, 16) .
However, when we solve (2x – 3)2 = 0, we get 2x = 3 or x =
2
11 , not 3.
Similarly, solving (2x – 3)2 = 16 gives us 2x – 3 = 4 or x =
2
13 , not 5. (We are not interested in the
solution of 2x – 3 = -4, as this is on the other side of the minimum.)
The translation by vector
0
3 seems to have transformed the graph of (2x)2
to that of (2(x – 3))2 or
(2x – 6)2 and not (2x – 3)
2 .
Mathematics Revision Guides – Transformations of Graphs Page 23 of 24
Author: Mark Kudlowski
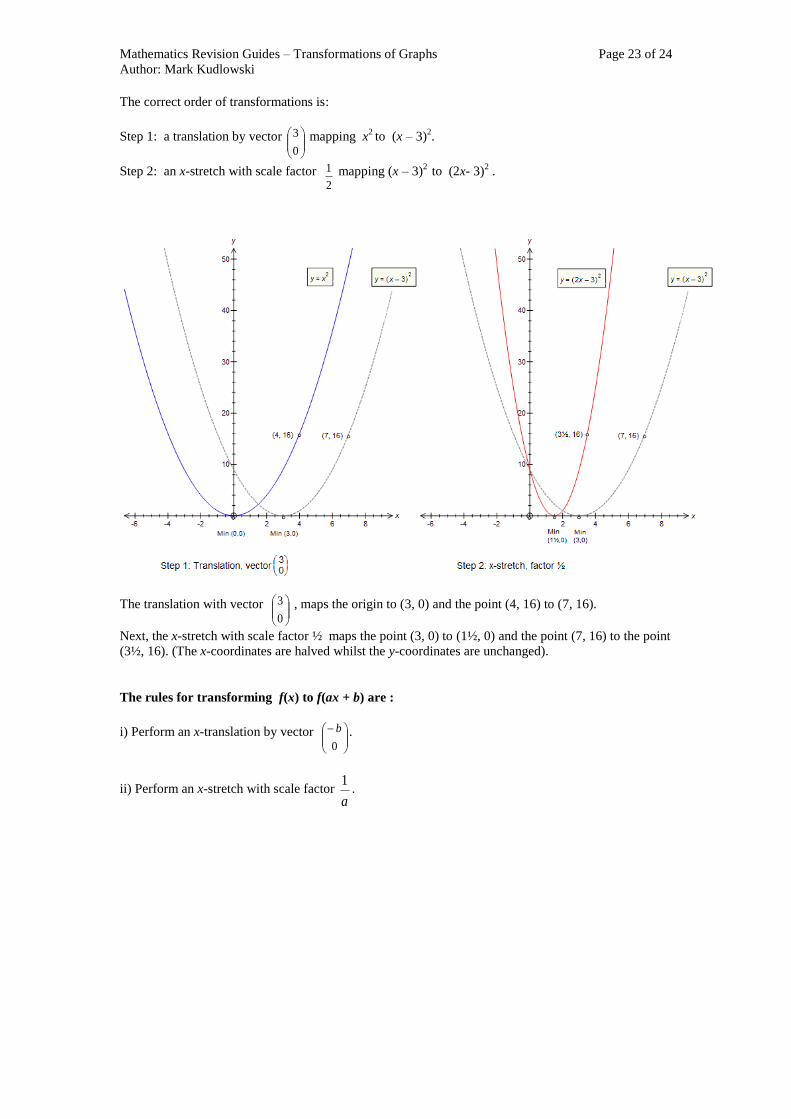
The correct order of transformations is:
Step 1: a translation by vector
0
3 mapping x2 to (x – 3)
2.
Step 2: an x-stretch with scale factor 2
1 mapping (x – 3)2
to (2x- 3)2 .
The translation with vector
0
3 , maps the origin to (3, 0) and the point (4, 16) to (7, 16).
Next, the x-stretch with scale factor ½ maps the point (3, 0) to (1½, 0) and the point (7, 16) to the point
(3½, 16). (The x-coordinates are halved whilst the y-coordinates are unchanged).
The rules for transforming f(x) to f(ax + b) are :
i) Perform an x-translation by vector
0
b .
ii) Perform an x-stretch with scale factor a
1.

Mathematics Revision Guides – Transformations of Graphs Page 24 of 24
Author: Mark Kudlowski
Example (18):
i) What sequence of transformations maps the graph of y = cos x° to the graph of y = cos (2x + 40°) ?
ii) The point (90°, 0) on the graph of y = cos x° is mapped to (p, q) after the combined transformation.
Find the values of p and q.
i) Firstly, we translate in the x-direction by the vector
0
40 - this maps cos x° to cos (x + 40°).
Secondly, an x-stretch with scale factor ½ maps cos (x + 40°) to cos (2x + 40°).
ii) Because the combined transformation only affects x-coordinates of any points, the value of q
remains unchanged at 0.
To find the value of p, we solve (2x + 40°) = 90° for x, giving x = 25°.
(p, q) = (25°, 0)