p1 chapter 4 :: graphs & transformations
TRANSCRIPT

P1 Chapter 4 :: Graphs & Transformations
@DrFrostMaths
Last modified: 14th September 2017

Use of DrFrostMaths for practice
Register for free at:www.drfrostmaths.com/homework
Practise questions by chapter, including past paper Edexcel questions and extension questions (e.g. MAT).
Teachers: you can create student accounts (or students can register themselves).

Chapter Overview
There are a few new bits and pieces since GCSE!
Sketch the graph with equation:
𝑦 = 𝑥 𝑥 − 3 2
1a:: Cubic Graphs
Sketch the graph with equation:𝑦 = 𝑥 − 1 2 𝑥 + 1 2
1b:: Quartic Graphs
Sketch the curves 𝑦 =4
𝑥2and
𝑦 = 𝑥2 𝑥 − 1 on the same axes. Using your sketch, state, with a reason, the number of real solutions to the equation 𝑥4 𝑥 − 1 − 4 = 0.
2:: Points of Intersection
If 𝑓 𝑥 = 𝑥2(𝑥 + 1), sketch the graph of 𝑦 = 𝑓(𝑥 + 𝑎), indicating any intercepts with the axes.
3:: Graph Transformations
NEW! to A Level 2017+The old A Level only included cubic graphs, not quartics.
Sketch the graph with
equation 𝑦 = −3
𝑥2
1c:: Reciprocal Graphs
NEW! to A Level 2017+In addition to graphs of the form
𝑦 =𝑎
𝑥, you now need to
recognise the sketch of 𝑦 =𝑎
𝑥2
NEW! since GCSEThe GCSE 2015+ syllabus included translations of graphs but not stretches.

Polynomial Graphs
In Chapter 2 we briefly saw that a polynomial expression is of the form:
𝑎 + 𝑏𝑥 + 𝑐𝑥2 + 𝑑𝑥3 + 𝑒𝑥3 +⋯where 𝑎, 𝑏, 𝑐, 𝑑, 𝑒, … are constants (which could be 0).
The order of a polynomial is its highest power.
Order Name
0 Constant (e.g. “4”)
1 Linear (e.g. “2𝑥 − 1”)
2 Quadratic (e.g. “𝑥2 + 3”)
3 Cubic
4 Quartic
5 Quintic
Chapter 2 explored the graphs for these.
These are covered in Chapter 5.
We will cover these now.
While these are technically beyond the A Level syllabus, we will look at how to sketch polynomials in general.

Polynomial Graphs
What property connects the order of the polynomial and the shape?The number of ‘turns’ is one less than the order, e.g. a cubic has 2 ‘turns’, a quartic 3 ‘turns’.
Order:
2
3
4
In Chapter 2 how did we tell what way up a quadratic is, and why does this work?
For a quadratic 𝒚 = 𝒂𝒙𝟐 + 𝒃𝒙 + 𝒄, i.f. 𝒂 > 𝟎, we had a ‘valley’ shape. This is because if 𝒙 was a large positive value, 𝒂𝒙𝟐 would be large and positive, thus the graph’s 𝒚 value tends towards infinity.
We would write:“As 𝒙 → ∞,𝒚 → ∞” where “→” means “tends towards”.
Bro Note: …Actually this is not strictly true, e.g. consider 𝑦 = 𝑥4, which has a U shape. But this is because multiple turns are being squashed into a single point.

Polynomial Graphs
Equation If 𝑎 > 0 If 𝑎 < 0Resulting Shape
Resulting Shape
𝑦 = 𝑎𝑥2 + 𝑏𝑥 + 𝑐As 𝑥 → ∞, 𝑦 → ∞As 𝑥 → −∞,𝑦 → ∞
As 𝑥 → ∞, 𝑦 → −∞As 𝑥 → −∞,𝑦 → −∞
𝑦 = 𝑎𝑥3 + 𝑏𝑥2
+𝑐𝑥 + 𝑑As 𝑥 → ∞, 𝑦 → ∞As 𝑥 → −∞,𝑦 → −∞
As 𝑥 → ∞, 𝑦 → −∞As 𝑥 → −∞,𝑦 → ∞
e.g. If 𝑦 = 2𝑥2 + 3, try a large positive value like 𝑥 = 1000. We can see we’d get a large positive 𝑦 value. Thus as 𝑥 → ∞, 𝑦 → ∞
𝑦 = 𝑎𝑥4 + 𝑏𝑥3
+𝑐𝑥2 + 𝑑𝑥 + 𝑒As 𝑥 → ∞, 𝑦 → ∞As 𝑥 → −∞,𝑦 → ∞
As 𝑥 → ∞, 𝑦 → −∞As 𝑥 → −∞,𝑦 → −∞
𝑦 = 𝑎𝑥5 + 𝑏𝑥4 +⋯ As 𝑥 → ∞, 𝑦 → ∞As 𝑥 → −∞,𝑦 → −∞
As 𝑥 → ∞, 𝑦 → −∞As 𝑥 → −∞,𝑦 → ∞
If 𝑎 > 0, what therefore can we say about the shape if:• The order is odd: It goes uphill (from left to right)• The order is even: The tails go upwards.
(And we have the opposite if 𝑎 < 0)

Cubics
Sketch the curve with equation𝑦 = (𝑥 − 2)(1 − 𝑥)(1 + 𝑥)
Features you must consider:
Shape? If we expanded, 𝑥3 term would be negative, so ‘downhill’ shape.
Roots? If 𝑦 = 0, 𝑥 = 2, 1 𝑜𝑟 − 1
If 𝑥 = 0, 𝑦 = −2𝒚-intercept?
-1 1 2
-2Fro Tip: It’s incredibly easy to forget to write in one of the intercepts. So don’t!
Fro Tip: No need to expand out the whole thing. Just mentally consider the 𝑥 terms multiplied together.
Sketch the curve with equation𝑦 = 𝑥2(𝑥 − 1)
Shape?
Roots?
𝒚-intercept?
𝑥3 term is positive so ‘uphill’ shape.
𝑥 = 0 𝑜𝑟 𝑥 = 1However as root of 0 is repeated(because the factor of 𝑥 appears twice), the curve touches at 𝑥 = 0.
If 𝑥 = 0, 𝑦 = 0
1𝑥
𝑦𝑦
𝑥
This is sort of because the curve crosses at 0 then immediately crosses at 0 again!

Cubics
Sketch the curve with equation𝑦 = 2 − 𝑥 𝑥 + 1 2
Shape?
Roots?
𝒚-intercept?
Downhill.
𝑥 = 2, 𝑜𝑟 𝑥 = −1Curve crosses as 2, but touches at -1 (again, because of repeated root)
2
-1 2
2
𝑦
𝑥
Sketch the curve with equation𝑦 = 𝑥 − 4 3
Shape?
Roots?
𝒚-intercept?
Uphill.
𝑥 = 4But root is triple repeated.We have a point of inflection at 𝑥 = 4.
-64
-64
4
𝑦
𝑥
Fro Exam Notes: The term ‘point of inflection’ has been removed from the new A Level syllabus (bad idea!!).
You might be able to see we get this shape at 𝑥 = 4 because as the root is triple repeated, the curve crosses at 4, then crosses again, then crosses again, hence ending up in the same direction and the line becoming momentarily horizontal.
A point of inflection is where the curve goes from ‘convex’ to ‘concave’ (or vice versa), i.e. curves in one direction before and curves in another direction after. You might have encountered these terms in Physics.

Cubics with Limited Roots
Sketch the curve with equation𝑦 = 𝑥 + 1 𝑥2 + 𝑥 + 1
Shape?
Roots?
𝒚-intercept?
Uphill.
Either 𝑥 + 1 = 0 (giving root of -1) or 𝑥2 + 𝑥 + 1 = 0. This does not have any solutions as the discriminant is -3.Thus -1 is the only root.
1
-1
1
𝑦
𝑥
We don’t have enough information to determine the exact shape. It could for example have been:
1
𝑦
𝑥-1
However, in Chapter 12, we’ll be able to work turning points using ‘differentiation’, and hence conclude that it doesn’t have any!

Finding the equation yourself
Figure 1 shows a sketch of the curve 𝐶 with equation 𝑦 = 𝑓(𝑥).The curve 𝐶 passes through the point (–1, 0) and touches the 𝑥-axis at the point (2, 0).The curve 𝐶 has a maximum at the point (0, 4).The equation of the curve 𝐶 can be written in the form.
𝑦 = 𝑥3 + 𝑎𝑥2 + 𝑏𝑥 + 𝑐where 𝑎, 𝑏 and 𝑐 are integers.(a) Calculate the values of 𝑎, 𝑏, 𝑐.
Edexcel C1 May 2013(R) Q9
If it crosses at −1,0 we must have (𝑥 + 1).If it touches at 2,0 we must have 𝑥 − 2 2
∴ 𝑦 = 𝑥 − 2 2 𝑥 + 1= 𝑥2 − 4𝑥 + 4 𝑥 + 1= 𝑥3 + 𝑥2 − 4𝑥2 − 4𝑥 + 4𝑥 + 4= 𝑥3 − 3𝑥2 + 4∴ 𝑎 = −3, 𝑏 = 0, 𝑐 = 4

Test Your Understanding
Sketch the curve with equation𝑦 = 𝑥 𝑥 − 3 2
3
𝑦
𝑥Sketch the curve with equation
𝑦 = 2𝑥2 𝑥 − 1 𝑥 + 1 3
1
N
Point of inflection
Touches𝑥-axis
Crosses𝑥-axis
(I took this question from my Riemann Zeta Club materials:www.drfrostmaths.com/rzc )
[end shameless plug]
Sketch the curve with equation𝑦 = − 𝑥 + 2 3
2
-8-2
𝑦
𝑥
3 A curve has this shape, touches the 𝑥 axis at 3 and crosses the 𝑥 axis at -2. Give a suitable equation for this graph.
𝑦 = 𝑥 − 3 2 𝑥 + 2

Exercise 4A
Pearson Pure Mathematics Year 1/ASPages 62-63
1
Extension
[MAT 2012 1E] Which one of the following equations could possibly have the graph given below?
A) 𝑦 = 3 − 𝑥 2 3 + 𝑥 2 1 − 𝑥B) 𝑦 = −𝑥2 𝑥 − 9 𝑥2 − 3C) 𝑦 = 𝑥 − 6 𝑥 − 2 2 𝑥 + 2 2
D) 𝑦 = 𝑥2 − 1 2 3 − 𝑥
Solution: D
2 [MAT 2011 1A] A sketch of the graph 𝑦 = 𝑥3 − 𝑥2 − 𝑥 + 1 appears on which of the following axis?
(a) (b)
(c) (d)
Cubics can sometimes be factorised by pairing the terms: 𝒙𝟐 𝒙 − 𝟏 − 𝟏 𝒙 − 𝟏 =
𝒙𝟐 − 𝟏 𝒙 − 𝟏 = 𝒙 + 𝟏 𝒙 − 𝟏 𝟐 ∴ (c)

Recap
If we sketched 𝑦 = 𝑥 − 𝑎 𝑥 − 𝑏 2 𝑥 − 𝑐 3 what happens on the 𝑥-axis at:
𝑥 = 𝑎: The line crosses the axis.
𝑥 = 𝑏: The line touches the axis.
𝑥 = 𝑐: Point of inflection on the axis.
𝑥𝑎
𝑥𝑏
𝑥𝑐

Quartics
If you understand the principle of sketching polynomials in general, then sketching quartics shouldn’t feel like anything new.Recall that if the 𝑥4 term is positive, the ‘tails’ both go upwards, otherwise downwards.
Sketch the curve with equation𝑦 = 𝑥(𝑥 + 1)(𝑥 − 2)(𝑥 − 3)
Shape: Tails upwardsRoots: -1, 0, 2, 3𝑦-intercept: 0
-1
𝑦
𝑥2 3
Sketch the curve with equation𝑦 = 𝑥 − 2 2(𝑥 + 1)(3 − 𝑥)
Shape: Tails downwardsRoots: -1, 2, 3
2 is repeated.𝑦-intercept: 𝟒 × 𝟏 × 𝟑 = 𝟏𝟐
-1
𝑦
𝑥2 3

Quartics
Sketch the curve with equation𝑦 = 𝑥 + 1 𝑥 − 1 3
Sketch the curve with equation𝑦 = 𝑥 − 2 4
-1 root only appears once so line crosses at 𝑥 = −1+1 root triple repeated so point of inflection at 𝑥 = 1
-1
𝑦
𝑥1
-1
𝑦
𝑥2
2 is a quadruple repeated root! Because the line effectively crosses the axis 4 times all at -2, it ends up in the opposite direction, and hence looks like a ‘touch’ point.
16

Test Your Understanding
Sketch the curve with equation𝑦 = 𝑥2 𝑥 + 1 𝑥 − 1
Sketch the curve with equation𝑦 = −(𝑥 + 1) 𝑥 − 3 3
-1
𝑦
𝑥1 -1
𝑦
𝑥3
27

Exercise 4B
Pearson Pure Mathematics Year 1/ASPages 65-66
1
Extension
[STEP I 2012 Q2a]a. Sketch 𝑦 = 𝑥4 − 6𝑥2 + 9b. For what values of 𝑏 does the equation y = 𝑥4 − 6𝑥2 + 𝑏 have the following
number of distinct roots (i) 0, (ii) 1, (iii) 2, (iv) 3, (v) 4.
By factorising, 𝑦 = 𝑥2 − 3 2. This is a quartic, where 𝑦 is always positive, and has
repeated roots at 𝑥 = ± 3:
By changing 𝑏, we shift the graph up and down. Then we can see that:
i) 0 roots: When 𝑏 > 9ii) 1 root: Not possible.iii) 2 roots: When b =
9 or 𝑏 < 0iv) 3 roots: 𝑏 = 0v) 4 roots: 0 < 𝑏 < 9
a) b)

GCSE RECAP :: Reciprocal Graphs
Sketch 𝑦 =1
𝑥 Sketch 𝑦 = −3
𝑥
𝑦
𝑥
𝑦
𝑥
Fro Note: The scaling caused by the 3 isn’t observable for this graph in isolation because the axes have no scale. This will only be observation for multiple graphs on the same axes.
Notice the distance between this line and the 𝑥-axis (i.e. the line 𝑦 = 0) gradually decreases as the lines go off towards infinity. The line 𝑦 = 0 is known as an asymptote of the graph.
! An asymptote is a line which the graph approaches but never reaches.
Asymptotes of 𝑦 =𝑎
𝑥:
𝑦 = 0,𝑥 = 0

Reciprocal Graphs
Sketch 𝑦 =3
𝑥2Sketch 𝑦 = −
4
𝑥2
𝑦
𝑥
Hint: Note that anything squared will always be at least 0.
𝑦
𝑥
This is new to the A Level 2017 syllabus.

Reciprocal Graphs
On the same axes, sketch 𝑦 =1
𝑥and 𝑦 =
3
𝑥
𝑦
𝑥
𝑦 =3
𝑥
𝑦 =1
𝑥
The 𝑦 value for 𝑦 =3
𝑥will be
3 times greater than 𝑦 =1
𝑥

Exercise 4C
Pearson Pure Mathematics Year 1/ASPage 67

Points of Intersection
In the previous chapter we saw why the points of intersection of two graphs gave the solutions to the simultaneous equations corresponding to these graphs.
If 𝑦 = 𝑓(𝑥) and 𝑦 = 𝑔(𝑥), then the 𝑥 values of the points of intersection can be found when 𝑓 𝑥 = 𝑔(𝑥).
Example: On the same diagram sketch the curves with equations 𝑦 = 𝑥(𝑥 − 3) and 𝑦 = 𝑥2 1 − 𝑥 . Find the coordinates of their points of intersection.
𝑦
𝑥
𝑥 𝑥 − 3 = 𝑥2 1 − 𝑥𝑥2 − 3𝑥 = 𝑥2 − 𝑥3
𝑥3 − 3𝑥 = 0𝑥 𝑥2 − 3 = 0
𝑥 = 0 or 𝑥 = − 3 or 𝑥 = + 3Substituting these values back into either equation, we obtain points:
− 3, 3 + 3 3 ,
0,0 ,
3, 3 − 3 3
𝒚 = 𝒙𝟐 𝟏 − 𝒙
1 3
Froflections: Cubicsgenerally have 3 solutions. And this seems good news as we have 3 points of intersection.
Fro Tip: A classic mistake is to divide by 𝑥 to get 𝑥2 − 3 = 0. NEVER divide an equation by a variable, because you lose a solution. Always factorise.

Further example involving unknown constants
On the same diagram sketch the curves with equations 𝑦 = 𝑥2 3𝑥 − 𝑎 and 𝑦 =𝑏
𝑥,
where 𝑎, 𝑏 are positive constants. State, giving a reason, the number of real solutions
to the equation 𝑥2 3𝑥 − 𝑎 −𝑏
𝑥= 0
𝑦
𝑥𝑎
3
If 𝑥2 3𝑥 − 𝑎 = 0 then 𝑥 = 0 or 𝑥 =𝑎
3
We were told that 𝑎 is positive, thus this latter root is positive.
If the points of intersection are given by:
𝑥2 3𝑥 − 𝑎 =𝑏
𝑥then clearly:
𝑥2 3𝑥 − 𝑎 −𝑏
𝑥= 0
There are 2 points of intersection, thus 2 solutions to this equation.
Fro Note: Note that the question is asking for the number of solutions, not the solutions themselves. We’d have to solve a quartic, with roots in terms of 𝑎 and 𝑏. While there is a ‘quartic formula’ (like the quadratic formula), it is absolutely horrific.

Test Your Understanding
On the same diagram sketch the curves with equations 𝑦 = 𝑥(𝑥 − 4) and 𝑦 = 𝑥 𝑥 − 2 2, and hence find the coordinates of any points of intersection.
𝑦
𝑥
𝒚 = 𝒙 𝒙 − 𝟒
𝒚 = 𝒙 𝒙 − 𝟐 𝟐
2 4
Looking at the diagram we expect that 0,0will be the only point of intersection (as the cubic will rise more rapidly than the quadratic). But we need to show this algebraically.
𝑥 𝑥 − 2 2 = 𝑥 𝑥 − 4𝑥 𝑥2 − 4𝑥 + 4 = 𝑥2 − 4𝑥𝑥3 − 4𝑥2 + 4𝑥 = 𝑥2 − 4𝑥𝑥3 − 5𝑥2 + 8𝑥 = 0𝑥 𝑥2 − 5𝑥 + 8 = 0
Thus 𝑥 = 0 giving (0,0).But the discriminant of 𝑥2 − 5𝑥 + 8 is -7, thus there are no further solutions to this equation.
Hint: Remember you can use the discriminant to reason about the number of solutions of a quadratic.
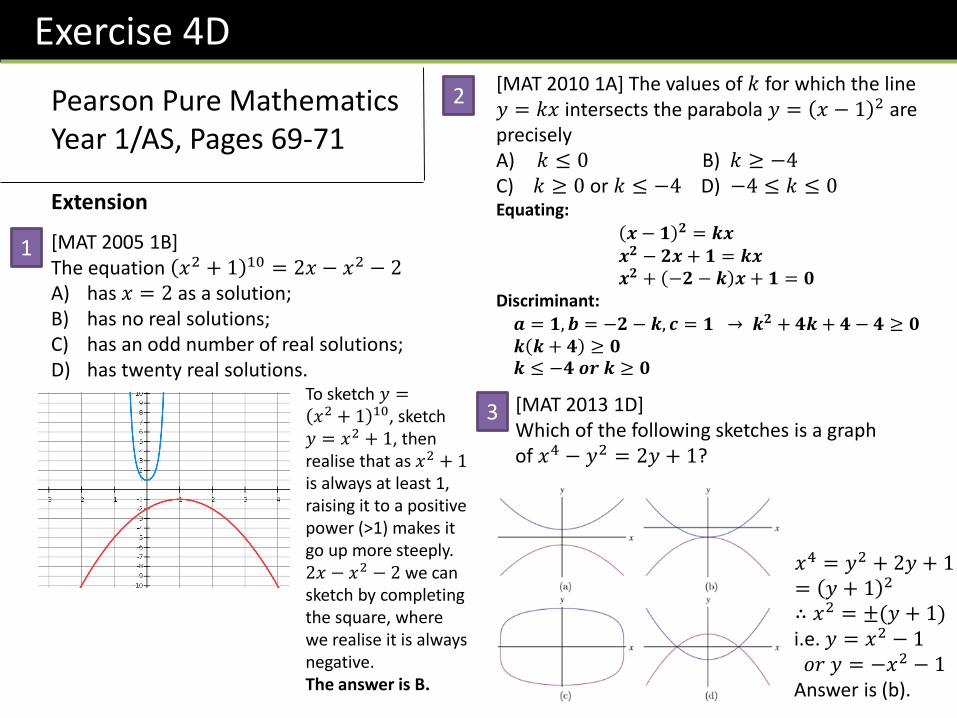
[MAT 2010 1A] The values of 𝑘 for which the line 𝑦 = 𝑘𝑥 intersects the parabola 𝑦 = 𝑥 − 1 2 are preciselyA) 𝑘 ≤ 0 B) 𝑘 ≥ −4C) 𝑘 ≥ 0 or 𝑘 ≤ −4 D) −4 ≤ 𝑘 ≤ 0Equating:
𝒙 − 𝟏 𝟐 = 𝒌𝒙𝒙𝟐 − 𝟐𝒙 + 𝟏 = 𝒌𝒙𝒙𝟐 + −𝟐 − 𝒌 𝒙 + 𝟏 = 𝟎
Discriminant:
𝒂 = 𝟏, 𝒃 = −𝟐 − 𝒌, 𝒄 = 𝟏 → 𝒌𝟐 + 𝟒𝒌 + 𝟒 − 𝟒 ≥ 𝟎𝒌 𝒌 + 𝟒 ≥ 𝟎𝒌 ≤ −𝟒 𝒐𝒓 𝒌 ≥ 𝟎
Exercise 4D
Pearson Pure Mathematics Year 1/AS, Pages 69-71
[MAT 2005 1B]The equation 𝑥2 + 1 10 = 2𝑥 − 𝑥2 − 2A) has 𝑥 = 2 as a solution;B) has no real solutions;C) has an odd number of real solutions;D) has twenty real solutions.
To sketch 𝑦 =𝑥2 + 1 10, sketch 𝑦 = 𝑥2 + 1, then realise that as 𝑥2 + 1is always at least 1, raising it to a positive power (>1) makes it go up more steeply. 2𝑥 − 𝑥2 − 2 we can sketch by completing the square, where we realise it is always negative.The answer is B.
Extension
[MAT 2013 1D]Which of the following sketches is a graph of 𝑥4 − 𝑦2 = 2𝑦 + 1?
1
2
𝑥4 = 𝑦2 + 2𝑦 + 1= 𝑦 + 1 2
∴ 𝑥2 = ±(𝑦 + 1)i.e. 𝑦 = 𝑥2 − 1𝑜𝑟 𝑦 = −𝑥2 − 1
Answer is (b).
3

Transformations of Functions
Suppose 𝑓 𝑥 = 𝑥2 Then 𝑓 𝑥 + 2 = 𝑥 + 2 2
Sketch 𝑦 = 𝑓 𝑥 : Sketch 𝑦 = 𝑓(𝑥 + 2)
x
y
𝑥
𝑦
-2
What do you notice about the relationship between the graphs of 𝑦 = 𝑓 𝑥 and 𝑦 = 𝑓 𝑥 + 2 ?
We know 𝑦 = 𝑥 + 2 2
has a root of -2 where the graph touches.
The graph has been translated
by −𝟐𝟎
, i.e. we have
subtracted 2 from each 𝒙 value.

Transformations of Functions
This is all you need to remember when considering how transforming your function transforms your graph...
Affects which axis? What we expect or opposite?
Change inside 𝑓( )
Change outside 𝑓( )
𝑥
𝑦
Opposite
What we expect
!
𝑦 = 𝑓 𝑥 − 3 Translation by 30
𝑦 = 𝑓 𝑥 + 4 Translation by 04
𝑦 = 𝑓 5𝑥 Stretch in 𝑥-direction by scale factor 1
5
𝑦 = 2𝑓 𝑥 Stretch in 𝑥-direction by scale factor 2
Therefore...

Sketching transformed graphs
Sketch 𝑦 = 𝑥2 + 3
If 𝑦 = 𝑥2, the +3 is ‘outside’ the
squared function, so translation of 03
.
Imagine a sketch of 𝑦 = 𝑥2 and then do the translation, ensuring you adjust any intercepts with the axes.
x
y
3
Sketch 𝑦 =2
𝑥+1
This looks like a reciprocal function 𝑦 =2
𝑥.
The change of +1 is inside the reciprocal function, so we have a translation to the left by 1.
𝑥
𝑦
𝑥=−1
2
The transformation might result in new intercepts or roots. You can find these in the usual way. Do not forget them!
The asymptotes were previously 𝑥 = 0 and 𝑦 = 0. The latter is unaffected but the former is now 𝑥 = −1.
Draw asymptotes using a dotted line and write its equation on it.

More Examples
Sketch 𝑦 = 𝑥(𝑥 + 2). On the same axes, sketch 𝑦 = 𝑥 − 𝑎 𝑥 − 𝑎 + 2 , where 𝑎 > 2.
The input 𝑥 has been replaced with 𝑥 − 𝑎, i.e. a change inside the function. We translate right by 𝑎. The significance of 𝑎 > 2 is that the original root of -2 will now be positive.
𝑥
𝑦
-2
−𝑎 −𝑎 + 2
𝑎𝑎 − 2
Note that our intercepts are in terms of 𝑎.
Sketch 𝑦 = 𝑥2 𝑥 − 4 . On the same axes, sketch the graph with equation
𝑦 = 2𝑥 2 2𝑥 − 4
The input 𝑥 has been doubled to 2𝑥, again a change inside the function, so we do the opposite and halve the 𝑥 values.Ensure that 0 remains 0 and you halve any roots.
𝑥
𝑦
42
Reflections of Graphs
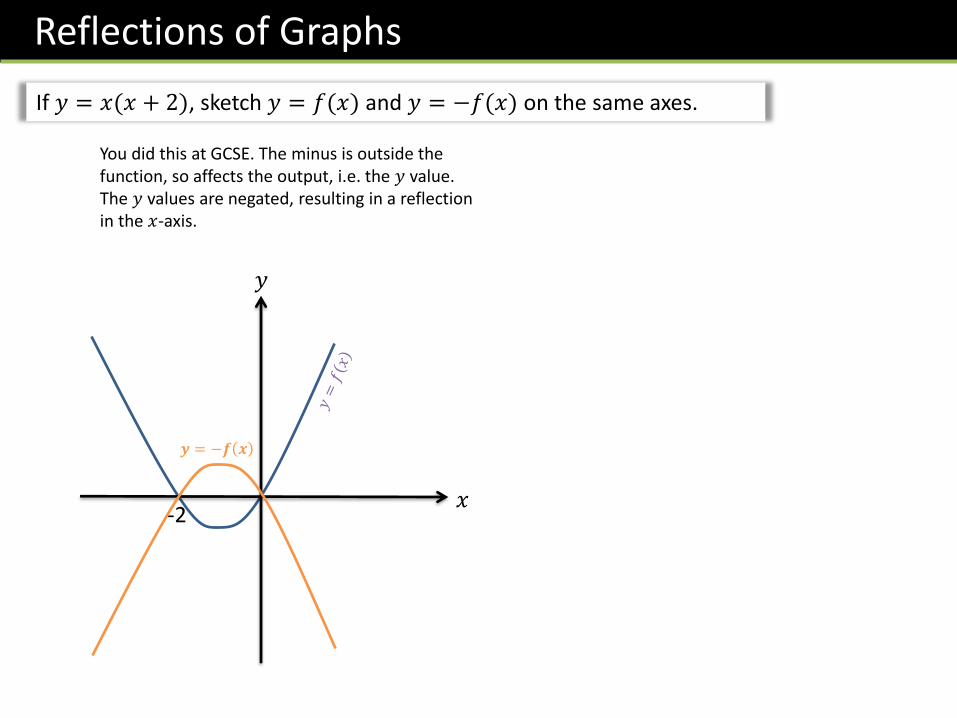
If 𝑦 = 𝑥(𝑥 + 2), sketch 𝑦 = 𝑓(𝑥) and 𝑦 = −𝑓(𝑥) on the same axes.
You did this at GCSE. The minus is outside the function, so affects the output, i.e. the 𝑦 value.The 𝑦 values are negated, resulting in a reflection in the 𝑥-axis.
𝑦
-2
𝒚 = −𝒇 𝒙
𝑥

Test Your Understanding
If 𝑦 = (𝑥 + 1)(𝑥 − 2), sketch 𝑦 = 𝑓(𝑥)
and 𝑦 = 𝑓(𝑥
3) on the same axes.
𝑦
-1 𝑥2 6-3
Sketch the graph of 𝑦 =2
𝑥+ 1,
ensuring you indicate any intercepts with the axes.
-2
𝑦
𝑦 = 1
𝑥-2
To get this new root:2
𝑥+ 1 = 0
2
𝑥= −1 → 𝑥 =
2
−1= −2

Exercise 4E/4F
Pearson Pure Mathematics Year 1/ASPages 74-75 (translations), 78 (stretches/reflections)

Effect of transformation on specific points
Sometimes you will not be given the original function, but will be given a sketch with specific points and features you need to transform.Where would each of these points end up?
𝒚 = 𝑓 𝑥 𝟒, 𝟑 𝟏, 𝟎 𝟔, −𝟒
𝑦 = 𝑓 𝑥 + 1 3,3 0,0 5, −4
𝑦 = 𝑓 2𝑥 2,3 0.5, 0 3, −4
𝑦 = 3𝑓 𝑥 4,9 1,0 6, −12
𝑦 = 𝑓 𝑥 − 1 4,2 1, −1 6,−5
𝑦 = 𝑓𝑥
412,3 4,0 24, −4
𝑦 = 𝑓 −𝑥 −4,3 −1,0 −6,−4
𝑦 = −𝑓 𝑥 4,−3 1,0 6,4

Test Your Understanding
Edexcel C1 May 2012 Q10
Exercise 4G
Pearson Pure Mathematics Year 1/ASPages 80-81