traffic control and architecture for high-quality and …...traffic control and architecture for...
TRANSCRIPT

Traffic Control and Architecture for High-Quality and High-Speed Internet
Tutomu Murase
March 2004
Graduate School of Information Science and Technology
Osaka University

ii

iii
Preface Several tens of bit per second: this mere value was the maximum speed of the
Internet when it was born as a result of a DARPA project. As the Internet is widely deployed, the speed of access networks is improved thanks to ADSL and FTTH technologies, and the capacity of core network routers now reaches several tens of Gbps, today’s Internet has become a part of the daily life of residential users as well as business users, who use e-mails and Web for their business and entertainment. This means that the Internet has already become a life infrastructure.
Compared with the improvement of speed and capacity, the changes in quality are much smaller. The Internet is operated on “best effort” basis. This comes from the design principle of IP, the connectivity is the most important attribute of the Internet. This contributed to the rapid growth of the Internet, but it also results in no quality of service (QOS) guarantee especially for multimedia traffic. Toward the future Internet as an actual infrastructure, QOS consideration is required. We should provide traffic control mechanisms for achieving high QOS and network architecture based on the in-depth consideration to the traffic control while operational cost and equipment cost remains minimum.
This thesis discusses on traffic control and architecture for high-quality and high-speed Internet. The discussion focuses on five subjects; admission control methods for (1) connections and (2) a partial data of connections, i.e. a burst, (3) application aware communication control, (4) network architecture for application level QOS and (5) technologies for realizing high speed routers.
Because Asynchronous Transfer Mode network or an ATM network has been expected to integrate both circuit switch and packet switch, it is necessary to guarantee QOS for accommodating multimedia traffic, i.e. circuit switch friendly traffic such as telephone or movie streams. As ATM networks are based on connection-oriented principle, it is suitable for controlling QOS by controlling network traffic load.
Call Admission Control or Connection Admission Control (CAC) is, thus, firstly addressed. CAC enables networks to achieve required QOS values in the ATM network while keeping network utilization at its maximum. In the CAC, CAC performance depends on a cell loss estimation and a CAC procedure. For that, a classical M/M/1 model is no longer fit to ATM traffic since ATM has to accommodate itself to various traffic characteristics generated from variable bit rate streaming, ftp data transfer, Web data retrieval and computer communication such as LAN interconnection. The CAC proposed in this thesis has good advantages; only two parameters and small time are

iv
needed for accept/reject new connection request. The proposed CAC uses “virtual cell loss rate” instead of cell loss rate as cell loss estimation. Simulation results show that the proposed CAC has appropriate accuracy in estimation and offers appropriate network utilization.
More bursty traffic, however, does not fit to the connection-by-connection CAC. Burst transfer methods have been developed for that purpose. It reserves and releases bandwidth for each piece of burst data at the time when the burst is ready to send. This, however, may cause large latency and waist of bandwidth during the reservation if the bandwidth is not available at least in one link. The more the number of links are on the end-to-end path, the larger the expected delay to grab the all bandwidth on the path simultaneously. To make the latency small, burst server architecture is proposed. In the architecture, a burst server, which stores and forwards the bursts, is placed between links and the reservation methods are modified. Bandwidth reservations can succeed either if the bandwidth on all links between sending and receiving terminals are available, or all links between burstservers/sending/receiving terminals. Numerical results show that the latency is much improved and utilization of networks is also improved two times larger than conventional architecture at maximum.
These contribute packet level QOS improvement. On the other hand, for considering user level QOS, not only packet but throughput and contents retrieval time also must be improved.
One of the today’s most important and popular applications of the Internet is web (World Wide Web). “8-second rule” reveals users have very little tolerate against waiting time of contents displayed. The waiting time consists of combination of network delay and server delay. It is necessary to cooperate networks and servers to reduce the waiting time. The web has a feature that the content that is to be retrieved next can be predicted from the current contents. This feature implies pre-fetch retrieval may be able to hide transfer delay (latency) to users/browsers. However, there is a tradeoff between the latency and the traffic load due to pre-fetching as many contents as potentially expected to be used. If the pre-fetch is done when network is not congested, i.e. is in idle, network can be well utilized and latency can be small as well. The network cache architecture for network friendly pre-fetch retrieval is therefore proposed. Some numerical results show that the network cache improves 40% latency without causing congestion.
To meet the high throughput requirements such as from storage networking and high speed wide-area LAN interconnection, TCP must be improved. TCP has been developed since 1980s, and has never essentially improved by today. TCP has to

v
provide new functions to meet their requirements for today’s high-speed link, fairness consideration, and future services. Although many TCP modifications has been proposed, it is difficult to introduce new TCP to end hosts/servers, but easy to the intermediate node. TCP relay node (TCP Bridge) is proposed to be set in a network. It can thus give new functions such as reliability and high throughput applications without changing existing IP network and user terminals/servers. TCP overlay network then is proposed. In the TCP overlay network TCP Bridges are cooperated each other and change TCP characteristics to appropriate one for the links between TCP Bridges. Since TCP Bridge has a little experience, there are many issues to be solved. One of these is a congestion control issue. If a trivial congestion occurs on sending side of a TCP Bridge, it causes serious rather than non-trivial congestion on receiving side of the TCP Bridge. To prevent this problem, buffer control in TCP Bridge is proposed and discussed. Simulation results shows that proposed control method improve the problem and can achieve throughput two times higher than the case without any control.
As well above mentioned traffic control, network itself must be improved in its speed to accommodate today’s huge traffic. One of essential bottleneck in developing high-speed router is IP address table search. Longest Prefix Matching (LPM) search must be used to search the table. Although a lot of quick search methods are developed in full matching search, they cannot apply to LPM search. Algorithmic approach is very cost effective but has lower speed. One of the solutions for quick search is to develop hardware search engine, i.e. Ternary CAM (T-CAM). T-CAM is tri-state Contents Addressable Memory. However, it causes high cost and small capacity, and to accommodate large IP table, many T-CAM chips are necessary, which increases the cost. The idea is proposed that cache architecture is employed with algorithmic search and hardware search engine. Instead of ordinary CAM as used by conventional caching architecture, T-CAM is employed to reduce cache miss-hit ratio. Because caching-in/out rule is not obvious in LPM search, the rule is carefully invented and investigated for a validation. Performance evaluation is shown to disclose the proposed architecture can achieve at least ten times smaller miss-hit ratio than the conventional cache architecture.
Today’s Internet has become a part of the daily life of residential users and business users as a life infrastructure. Internet must have high quality and capability of multimedia data traffic. Toward the future Internet, this thesis discusses new architecture and control for high QOS with the networks while operational cost and equipment cost remains minimum. We believe these discussions contribute to realize next generation high quality, high-speed Internet.

vi
Acknowledgements This work has its root in the teaching, help, and inspiration of a great number of
people. I wish to express my gratitude to them.
Prof. Masayuki Murata, my advisor, is the reason I have studied this work. He
has given me so much energy for research study and meaningful advice on nearly every
pages of this work. I would like to express my warm appreciation for him.
I would like to express my gratitude to Prof. Makoto Imase and Prof. Teruo
Higashino for serving as readers of my thesis committee.
I would like to express my gratitude to President of Osaka University Hideo
Miyahara for his countless advice and continuous support. This work would not have
been realized without expert knowledge and advice of Associate Prof. Go Hasegawa.
His appreciated ideas, support, and feedback have been great help for my study.
I would likewise thank my colleagues and friends both in the department and in
computer and communication media research laboratories, NEC Corporation, for their
detailed, valuable instructions, fellowship, and underpinning. I particularly thank Mr.
Akira Arutaki, Mr. Yoshiaki Kiriha, Mr. Takao Takeuchi, and Dr. Hiroshi Suzuki, for
their expert suggestions and warm support.
I dedicate this thesis to my parents, my wife, Kyoko, and my daughter, Yume
who have continuously loved and supported to me.

vii
Contents
CHAPTER 1 INTRODUCTION .....................................................................................1 1.1 Toward high-quality network with new traffic control
and network architecture .............................................................1 1.2 Organization of this thesis ..........................................................13
CHAPTER 2 A CALL ADMISSION CONTROL FOR ATM NETWORKS BY USING SIMPLE QUALITY ESTIMATE..............................16
2.1 Introduction ................................................................................16 2.2 Quality estimation measure – virtual cell loss
probability .................................................................................18 2.2.1 Definition and features of virtual cell loss
probability........................................................................18 2.2.2 Comparison between real and virtual cell loss
probability........................................................................22 2.2.3 Extension to a network model .......................................25 2.2.4 Extension to a heterogeneous traffic
environment.....................................................................27 2.3 Guaranteeing a specific QOS – individual virtual cell
loss probability..........................................................................29 2.3.1 Characteristics of individual multiplexed
traffic ...............................................................................29 2.3.2 Definition of individual virtual cell loss
probability........................................................................29 2.3.3 Comparison between real and virtual
individual cell loss probabilities......................................31 2.3.4 Comparison between average and individual
virtual cell loss probabilities............................................32 2.4 Call admission control scheme...................................................34
2.4.1 Virtual bandwidth method .............................................34 2.4.2 Virtual link capacity.......................................................35 2.4.3 Traffic clustering............................................................39 2.4.4 Quality class and bandwidth allocation .........................41 2.4.5 Call admission control ...................................................42
2.5 Conclusion..................................................................................45
CHAPTER 3 BURSTSERVER ARCHITECTURE FOR BURST BANDWIDTH RESERVATION PROTOCOL............................47
3.1 Introduction ................................................................................47 3.2 Characteristics of the bandwidth reservation method ................48
3.2.1 Blocking in burst bandwidth reservation .......................48 3.2.2 Store and forward burst transfer ....................................49
3.3 Burstserver..................................................................................51 3.3.1 Basic functions...............................................................51

viii
3.3.2 Burstservers and connectionless servers........................52 3.3.3 Best effort procedure .....................................................54 3.3.4 Step-by-step procedure ..................................................58
3.4 Performance evaluation study ....................................................58 3.4.1 Model .............................................................................58 3.4.2 Numerical results ...........................................................60
3.5 Conclusion..................................................................................66
CHAPTER 4 PROACTIVE CACHING NETWORK ARCHITECTURE ...................67 4.1 Introduction ................................................................................67 4.2 Load balancing technologies ......................................................70
4.2.1 Load balancing network and redirect method................70 4.2.2 Mirroring and caching ...................................................72 4.2.3 Caching method .............................................................73 4.2.4 Pre-fetch for caching......................................................74
4.3 Proactive caching network .........................................................76 4.3.1 Resource engineering.....................................................76 4.3.2 Proactive caching...........................................................76 4.3.3 Layer 8 switch................................................................80
4.4 Simulation results .......................................................................82 4.4.1 Simulation model...........................................................82 4.4.2 Results and discussions..................................................83
4.5 Conclusion..................................................................................86
CHAPTER 5 TCP OVERLAY NETWORK ARCHITECTURE AND TCP CONTROL.....................................................................................87
5.1 Introduction ................................................................................87 5.2 TCP overlay network..................................................................89
5.2.1 Architecture ...................................................................89 5.2.2 New services for TCP overlay network .........................91
5.3 Congestion control in TCP Bridge .............................................92 5.4 Buffer control mechanism ..........................................................93
5.4.1 Conventional method.....................................................93 5.4.2 Proposed method............................................................97 5.3.3 Comparison..................................................................100
5.4 Simulation results .....................................................................102 5.5 Prototyping and evaluations .....................................................107 5.6 Conclusion................................................................................108
CHAPTER 6 CACHING ARCHITECTURE FOR LONGEST PREFIX MATCHING IP FORWARDING TABLE SEARCH.................110
6.1 Introduction ..............................................................................110 6.2 Longest Prefix Match cache architecture .................................113
6.2.1 LPM search ..................................................................113 6.2.2 Caching architecture ....................................................115 6.2.3 Host address caching method ......................................116 6.2.4 LPM caching method...................................................117 6.2.5 Caching rules ...............................................................117 6.2.6 Selection of caching-in/out entry.................................121 6.2.7 Policy control of cache selection .................................122
6.3 Features of the LPM cache method ..........................................122

ix
6.3.1 Efficiency per entry .....................................................122 6.3.2 Frequency bias of use of individual entry....................123 6.3.3 LPM search engine LSI ...............................................124 6.3.4 Caching-in/out moving overhead.................................124
6.4 Performance evaluation ............................................................125 6.4.1 Definition of caching search system
performance...................................................................125 6.4.2 Simulation model.........................................................126 6.4.3 Miss-hit rate comparison .............................................127
6.5 Conclusion................................................................................129
CHAPTER 7 CONCLUSION......................................................................................131
BIBLIOGRAPHY……………........................................................................................135

x
List of Figures Fig. 2-1 Traffic model......................................................................................................19
Fig. 2-2 Real cell loss probability P versus virtual cell loss probability pv ....................20
Fig. 2-3 Cell loss probability: P versus pv.......................................................................22
Fig. 2-4 Maximum link utilization versus MAX (homogeneous traffic).........................24
Fig. 2-5 Network model. (a) Queueing network model. (b) Queue length versus number of nodes S. (c) Queue length versus AVG. (d) Queue length versus MAX ......................................................................................................26
Fig. 2-6 Change into less bursty ......................................................................................27
Fig. 2-7 Individual virtual cell loss probability ...............................................................31
Fig. 2-8 Individual real cell loss probability Pj versus individual virtual cell los probability pvj ...................................................................................................32
Fig. 2-9 Individual virtual cell loss probability characteristics .......................................33
Fig. 2-10 Virtual bandwidth (VB) allocation...................................................................35
Fig. 2-11 Admissible call region (two types). (a) Interference: small. (b) Interference: large .............................................................................................38
Fig. 2-12 Traffic clustering..............................................................................................40
Fig. 2-13 Virtual link capacity.........................................................................................41
Fig. 2-14 Virtual bandwidth allocation with virtual link capacity. (a) Interference: small. (b) Interference: large .......................................................44
Fig. 3-1 Diagram with/without burstserver .....................................................................51
Fig. 3-2 Network structure...............................................................................................52
Fig. 3-3 Burstserver and connectionless server ...............................................................54
Fig. 3-4 Flowchart of procedure-1 “Best Effort”.............................................................56
Fig. 3-5 Routing from/to burstserver ...............................................................................57
Fig. 3-6 VC connection table...........................................................................................57
Fig. 3-7 Throughput versus delay characteristics ............................................................61
Fig. 3-8 Offered load versus throughput..........................................................................63

xi
Fig. 3-9 Long hop and short hop model ..........................................................................63
Fig. 3-10 Number of links versus throughput..................................................................64
Fig. 3-11 Peak rate versus throughput .............................................................................65
Fig. 4-1 Proactive caching network architecture .............................................................69
Fig. 4-2 Load balance and redirect ..................................................................................71
Fig. 4-3 Redirect ..............................................................................................................71
Fig. 4-4 Proactive caching ...............................................................................................77
Fig. 4-5 Layer 8 switch....................................................................................................81
Fig. 4-6 Proposed pre-fetch scheduling ...........................................................................83
Fig. 4-7 User response time.............................................................................................85
Fig. 4-8 Cache hit ratio ....................................................................................................85
Fig. 5-1 TCP proxy communication ................................................................................92
Fig. 5-2 Operation when receiver buffer is full ...............................................................94
Fig. 5-3 Advertised window values in proposed method and conventional method ..............................................................................................................99
Fig. 5-4 Network model of simulation 1 .......................................................................103
Fig. 5-5 Performance improvement: RTT of link 2 is 10ms .........................................104
Fig. 5-6 Performance improvement: RTT of link 2 is 20ms .........................................104
Fig. 5-7 Network model of simulation 2 .......................................................................105
Fig. 5-8 Simulation 2 results..........................................................................................106
Fig. 6-1 LPM cache system and traditional cache system.............................................114
Fig. 6-2 LPM cache search architecture ........................................................................116
Fig. 6-3 Rules for LPM caching ....................................................................................120
Fig. 6-4 Efficiency of IP address space coverage with LPM cache ..............................120
Fig. 6-5 Typical router architecture by using proposed LPM cache search ..................126
Fig. 6-6 Cache performance (miss hit rate for cache size) ............................................129

xii
List of Tables
Table 2-1 Traffic control scheme comparison based on pv versus P ..............................24
Table 2-2 Regions ...........................................................................................................39
Table 2-3 Bandwidth allocation ......................................................................................43
Table 4-1 Response time (sec) ........................................................................................84
Table 5-1 Hit ratio (%) ....................................................................................................84
Table 6-1 Conventional method and proposed method characteristics .........................101
Table 6-2 Simulation 2 results ......................................................................................107
Table 7-1 Forwarding table ...........................................................................................115

1
CHAPTER 1 INTRODUCTION
1.1 Toward high-quality network with new traffic control and network architecture
Several tens of bit per second: this mere value was the maximum speed of the
Internet when it was born as a result of a DARPA project. As the Internet is widely
deployed, the speed of access networks is improved thanks to ADSL and FTTH
technologies, and the capacity of core network routers now reaches several tens of Gbps,
today’s Internet has become a part of the daily life of residential users as well as
business users, who use e-mails and Web for their business and entertainment. This
means that the Internet has already become a life infrastructure.
Compared with the improvement of speed and capacity, the changes in quality
are much smaller. The Internet is operated on “best effort” basis. This comes from the
design principle of IP; the connectivity is the most important attribute of the Internet.
This contributed to the rapid growth of the Internet, but it also results in no quality of
service (QOS) guarantee especially for multimedia traffic. Toward the future Internet as
an actual infrastructure, QOS consideration is required. We should provide traffic
control mechanisms for achieving high QOS and network architecture based on the
in-depth consideration to the traffic control while operational cost and equipment cost
remains minimum.
This thesis discusses on several traffic control methods and new architecture
based on those methods for establishing high QOS Internet. The discussion focuses on
five subjects; admission control methods for (1) connections and (2) a partial data of

2
connections, i.e. a burst, (3) application aware communication control, (4) network
architecture for application level QOS and (5) technologies for realizing high speed
routers.
A transport network that people expected to become an essential part of
broadband multimedia network is an Asynchronous Transfer Mode network or an ATM
network. ATM has been initially developed by ITU, international standard body, and by
telephone operators and careers. Next, The ATM Forum [71] has been funded for
industrial de facto standard in 1991. In 1990s, although packet switching technologies
could not achieve high-speed routers, a fixed length packet, which is called a cell used
in ATM, is the key technology to realize high-speed packet switching. Because ATM
has been expected to integrate both circuit switch and packet switch, it is necessary to
guarantee QOS for accommodating multimedia traffic, i.e. circuit switch friendly traffic
such as telephone or movie streams. As ATM networks are based on
connection-oriented principle, it is suitable for controlling QOS by controlling network
traffic load i.e. by controlling numbers of connections.
Traffic control methods can be divided into two categories, that is, reactive
control and preventive control, and the most efficient use of network resources can be
achieved by combining the two. Traffic load control such as call admission control or
Connection Admission Control (CAC) is, of course, a form of preventive control, which
is by its nature more effective than reactive control for use in high-speed networks [3].
CAC is, thus, firstly addressed. CAC enables networks to achieve required QOS
values while keeping network utilization at its maximum. In the CAC, CAC
performance depends on a cell loss estimation and a CAC procedure. A Classical
M/M/1 model is no longer fit to ATM traffic since ATM has to accommodate itself to
various traffic characteristics. The traffic is generated from not only telephone

3
conversation but variable bit rate streaming, ftp data transfer, Web data retrieval and
computer communication such as LAN interconnection. Such traffic characteristics are
categorized into two; Constant Bit Rate (CBR) and Variable Bit Rate (VBR). VBR is
characterized with three parameters; peak rate, sustainable rate (average rate) and burst
length. Traffic is called bursty if the ratio of peak rate divided by average rate is large. It
is easy to achieve no cell loss by multiplexing traffic on peak rate basis, but this makes
network utilization quite low in case of bursty traffic. If we accept very low cell loss
rate, utilization can drastically be improved by using statistical multiplexing. Many
queueing theories suggest that in statistical multiplexing traffic load must be kept lower
to handle more bursty traffic with the same buffer overflow rate. This means a tradeoff
between utilization resulted from statistically multiplexing gain and QOS, i.e. cell loss
rate. Network, thus, requires accurate estimations of cell loss rate for multiplexing a
new call (connection), before giving the connection an admission to setup the
connection. The problem is that in real network, the estimation must be calculated in
practical time. This generates another tradeoff between accuracy of the estimation and
calculation time to the estimation.
The traffic of an admitted connection must be guaranteed up to the point that it
declared at the admission. The traffic that exceeds the declared value is not guaranteed
even though it comes from the traffic source of the admitted connection. The
mechanism to distinguish a traffic data into guaranteed part and non-guaranteed part is
referred to as “policing”. Because cell loss due to the policing may larger than cell loss
due to network congestion, it is required for user to declare the traffic characteristic
values. Cell loss rate resulted from the multiplexing may vary between connections each
of which have different characteristics. To meet QOS requirements for all
accommodated connections, cell loss rate estimation for each connection are required.

4
Various call admission control schemes have been proposed [3]-[7] these days.
A cell loss measure based on “queueing model” is sensitive to burst length that is
difficult to be declared and policed. More simple and robust estimation mechanism is
required for practical use. Furthermore, many preceding works which fall into this
category use average cell loss probability defined over the mixture of different traffic
classes [4]-[8]. In most practical situations where a variety of applications share a link,
it is usually difficult for an admission control method based on the average cell loss
probability to reflect a specific quality requirement for individual calls. Individual cell
loss probability has therefore been introduced in [9], [10]. However, it is not sufficient
for practical use. Several other studies have proposed simple and fast control procedures
using virtual bandwidth methods but for similar reasons they are insufficient to ensure
that all individual cell loss probabilities fall within a specific degree of quality.
Moreover, while each of these studies notes that virtual bandwidth methods fail to
guarantee a specific quality in heterogeneous traffic multiplexing, none gives any
solution to the problem [11]-[14]. In [10], the problem is referred to as “interference”
between different types of bursty traffic and, though a solution is offered, [10] itself
admits that the solution is still incomplete.
The objective to propose a new CAC is thus to give network a simple and
practical cell loss estimation considering the traffic QOS requirements of each request.
The proposed method has three features; the estimation “virtual cell loss rate” is
calculated in “buffer less fluid flow model” instead of “queueing model” and simulation
results show that the estimation is sufficiently accurate for practical use. The estimation
and virtual bandwidth derived from the estimation are well meets for individual
estimation and interference even the traffic is the mixture of heterogeneous ones.

5
More bursty traffic, however, does not fit to the connection-by-connection CAC.
Looking at data transfer such as LAN interconnection, traffic can be so bursty that we
seldom can expect meaningful statistical multiplexing gain. For such traffic burst
bandwidth reservation protocol is more appropriate. The reservation protocol includes
admission control for each burst. Before sending a burst, necessary bandwidth, i.e. peak
rate must be reserved on all links between a source and a destination. After sending the
burst, the reserved bandwidth is released immediately. It is obvious that admission
control for the reservation protocol for bursts is the same with the one for CBR
connections. For small bursts or short bursts, latency of the reservation is the key
performance measure. Since reservation succeeds only when all links are
simultaneously reserved, insufficient resources even of a link result in the failure of
reservation. This failure causes another reservation attempt after a certain backoff time,
which results in large delays at the source terminals and throughput degradation. This
problem becomes serious as the number of links on the path increases. One study [31]
shows that the multipath scheme improves the blocking probability if terminals manage
many different paths to the same destination.
To solve the blocking problem based on an ATM single path, there are two
approaches that provide feasible solutions. One is to reduce the bandwidth used for each
burst transfer in order to get smaller burst blocking probabilities [32]. This approach,
however, may result in large transfer delays at the source terminals. The other approach
is to reduce the number of links that must be reserved simultaneously. A method is
proposed based on this approach. In the method, networks have special servers –
so-called burstservers – and use it by storing and forwarding bursts. Because only a
reservation between terminals and burstservers is necessary for transfer data, a number
of links reserved simultaneously is reduced.

6
These are the efforts taken to guarantee QOS on packet networks, and the author
are sorry to say that the efforts has not achieved much success until now. Considering
the situation the Internet, a network developed as best effort network, focused on QOS
improvements rather than QOS guarantees. In addition to this improvement of both
packet level QOS and user level QOS such as throughput and contents retrieval time
must be achieved, instead of packet level QOS guarantee.
Since Web must be a today’s most popular application, it is reasonable to focus
Web application as to improve user level QOS. In terms of application level QOS, web
QOS can be measured with the latency for the web contents shown up on a user browser.
For example, it is reported in [36] as 8-second rule that users who suffer more than
8-second latency from a web cite will leave the cite. This is vital for Web-based
e-commerce business or network service provider. The latency of a web site generally
consists of two delays; network delay and server delay. Either one may cause
above-mentioned problem. Internet technology is developing so as to solve such
problems.
On the network side, some Internet providers give service level agreement
(SLA) of QOS to dedicated users. However, it is not sufficient even to employ a new
network QOS mechanism such as Differentiated Services. Problems lays in that finer
granularity is required in SLA, monitoring methods are not established in QOS values,
and operation difficulties remain in Differentiated Services. Moreover Differentiated
Services are defined for a certain pair of source and destination, and need prior
procedure for bandwidth reservation. It is, thus, hard to apply for Web in which users
browse many different servers spreading over the world.
On the server side, reducing CPU load and treating large number of accesses
simultaneously, cache and mirror technologies such as Digital Island [38], Akamai [39]

7
are developed and deployed. While mirroring is useful in case of predicted access bursts
such as concert ticket reservation, it costs much for other purposes because of the cost
of copying contents. Moreover, the benefit of mirroring arises only in the contents
provider side. There is no merit for the user side.
Caching seems attractive to reduce server and network congestion because the
most popular contents at the moment will be automatically and naturally distributed to
the caching servers. Caching server is widely deployed both as forward cache
combining with proxy servers and as reverse cache in front-end of servers. While
reverse cache reduces the number of accesses to servers, it has no benefits on a network.
Although forward cache is useful for very popular contents access, it requires more “hit
ratio” for less popular contents. “Hit ratio” is defined as a rate of number of accesses for
which cache server has a requested content over number of all request accesses. After
miss-hit, i.e. access not hit on cache servers, cache servers set up a new connection to
origin Web servers. Because Web contents size is not so large, say several 10K bytes in
average [42], miss-hit cause extra delay due to connection setup delay as large as
contents retrieval delay.
If the contents are retrieved prior to user’s real retrieval the so-called pre-fetch -,
the latency of which user is able to recognize can be small. In [43], [44], pre-fetch has
effects on latency by 45% reduction by using client pre-fetch and by 60% reduction by
using cache server pre-fetch.
This pre-fetch, however, should be used carefully to prevent network congestion
and the waste of server resources. Because the pre-fetch is based on prediction of the
link on the page of which users are supposed to click, the pre-fetched data may
eventually not be used and causes the waste of network resources, causing congestion
on network resources and/or server resources [45], [46]. If network can control the

8
pre-fetch access so as to control network load, it may achieve both less congestion for
networks and low latency for users
Including Web application, almost all application uses TCP protocol. Although
TCP provides high reliability transport to the application, TCP has a potential
performance bottleneck in terms of throughput in its acknowledge based feedback
mechanism. It is, thus, required to improve TCP throughput as the next QOS of user
level. To meet the high throughput requirements such as from storage networking and
high speed wide-area LAN interconnection, TCP must be improved. TCP has been
developed since 1980s, and has never essentially improved by today. TCP has to
provide new functions to meet their requirements for today’s high-speed link, fairness
consideration, and future services.
The speed of the networks must keep pace with the ever-increasing traffic,
providing the traffic control mentioned above. Various efforts for high-speed networks
contribute to the improvement of network speed in layer 1, 2 and 3 such as WDM,
Ethernet, and IP networks. On the other hand, very little efforts on network side for
layer 4 such as TCP protocol are being made for high-speed network because layer 4 is
end-to-end protocol and a network usually does not process layer 4 protocols. In other
words, TCP can be a bottleneck for high-speed data transfer. For example, TCP
throughput is limited in 18 Mbps with typical implementations for 30 msec round trip
time (RTT), which is a typical RTT between Tokyo and Osaka in the Internet. This
means that an application can never expect large throughput even a 1 Gbps network is
installed between Tokyo and Osaka. Almost of all applications use TCP and require
high throughput. To improve TCP throughput, many proposal are presented. Many of
them focus on the improvements of TCP rate control. Famous improvement includes
TCP-Tahoe, TCP-Reno and TCP-Vegas implementation of rate control. Their design

9
principle is to sustain TCP-friendly nature. TCP is expected to have congestion control,
to share the bandwidth in fair manner and to be robust against QOS degradation such as
packet loss and packet re-ordering. Further High-Speed TCP, TCP-FAST achieved high
throughput by ignoring fair-share nature. These approaches could be successful to the
specified networks. For example, High-Speed TCP shows high throughput only if the
connection alone exists in a link. Another example is that TCP-Vegas shows better link
utilization than TCP-Reno although TCP-Vegas has poor throughput if it is mixed with
TCP-Reno.
These approaches do not fit the practical situations. As mentioned before, TCP
is an end-to-end protocol and is implemented in clients and servers. It is not easy for
application to change TCP implementations because the application does not know
whether it uses leased line network or best effort public network, or whether it is
multiplexed with TCP-Reno, TCP-Vegas or some other kind of TCP implementations.
Who should choose the best TCP implementation for the application considering the
communication environment?
As a result of the TCP improvement to reach its bedrock, new approaches based
on TCP overlay network are proposed. In the architecture TCP is relayed in network, i.e.
TCP is terminated and initiated to the next destination at TCP relay node, which is
herein called TCP Bridge. The overlay network architecture will be discussed for high
throughput. By relaying TCP, RTT can be short in individual TCP loop because TCP
bridge terminates TCP flow control, i.e. feedback loop. Packet loss probability in
individual TCP loop can also become small. TCP throughput estimation [53] shows that
smaller RTT and smaller packet loss lead to higher throughput.
There are some disadvantages of TCP relay schemes. One problem is that if
TCP connection is accidentally collapsed in intermediate TCP Bridge, no protocol is

10
provided to recover TCP connections between both ends of the collapsed port of the
TCP Bridge. Another problem is that if latency is more important performance criteria
than throughput, for example, small data transaction, extra delay due to TCP relay may
cause QOS degradation since TCP Bridge work in store and forward basis.
While the first problem might be a fundamental problem for TCP overlay
network architecture, it will not be a problem in practical sense. Separate-TCP such as
Wireless TCP [69], which is based on TCP relay schemes, is lately proposed and is
broadly spreading to mobile wireless networks (so what?). Furthermore, because one
end of TCP often happens to become collapsed, for example, client computer being
hung up, almost all applications using TCP provide application layer handshake, i.e.
acknowledgement mechanism in case against such TCP collapse. The second problem,
the increase of latency, occurs depending on implementation of TCP relay architecture.
If TCP Bridge is explicitly specified or not specified by an application when TCP
connection is set up, the problem may not arise because throughput sensitive
applications only can specify TCP bridge. Since TCP Bridge has a little experience,
there are many issues to be solved. One of these is congestion control issue. If a trivial
congestion occurs on sending side of a TCP Bridge, it causes serious rather than
non-trivial congestion on receiving side of the TCP Bridge. To prevent this problem
buffer control in TCP Bridge is proposed and discussed. Simulation results show that
proposed control method improve the problem and can achieve throughput two times
higher than the case without any control.
Above-mentioned traffic control technologies, including CAC, pre-fetch caching,
TCP overlay network, are necessary to prevent network congestion. In other words,
such traffic engineering technologies must be employed in the next-generation
high-quality Internet.

11
Besides these traffic control or traffic engineering technologies, high-speed
switching technologies are required to reduce congestion by reducing network
utilization. Recent high-speed routers have several hundreds interfaces of Gbps lines
and a capacity of terra (T) bps. Such routers are very expensive because they use
expensive hardware chips for protocol processing. One of the bottlenecks of the
protocol processing is a search process in IP address table lookup. The table stores IP
packet forwarding information and must be searched by Longest Prefix Matching
(LPM) search method. Although Full Matching search methods are well developed and
less expensive, LPM search has not been developed yet. For example of LPM search,
there are supposed to be three entries in IP version 4 address tables, entry A: 63.0.1.*,
B:63.0.2.* and C:63.0.2.4 where “*” means “don’t care,” i.e. wildcard. When IP packet
having 63.0.x.y arrives, the table is searched using IP address as a search key. In the
case of x=1, entry A must be the search result. In the case of “x=2 and y=3,” and “x=2
and y=4,” the search results are entry B and C, respectively because entry C match
longer than B in the case of “x=2 and y=4”. The situation becomes even more difficult
because the number of table entry is increasing day by day. For example, more than
64K entries are stored in border gateway routers. It is necessary to develop search
methods for a large table in enough high-speed. There are two approaches; one is
algorithmic approach and the other is hardware approach. Algorithmic approach has
advantages of low cost and robust for table size. Previous researches are based on
Patricia tree algorithm and are mainly devoted for improvement of Patricia tree search
[70]. On the other hand, a hardware-based approach has advantages in its speed and
simple implementation. Some venders have already sold a search chip, which is based
on Ternary Contents Addressable Memory (T-CAM) [64][68]. While T-CAM has not
only “0” and “1” state but also “don’t care” state for LPM search, T-CAM is likely to

12
work as CAM. This is the reason why this is fast and simple. Because the chip is
expensive and its capacity is limited, for example, 4K entries, this approach cannot
adopt the increase of the table size. Because neither approach is able to achieve both fast
and low cost search, a new approach is required.
On the other hand, if the requirement of search speed is not so rigid, i.e. is not in
wire-speed, it is possible to have high-speed, low cost and large capacity search
methods. They intend to search all table entries with always the same speed. In real
networks, entries searched in a short time are expected not so spread and may have
locality and successiveness because several packets for the same destination are likely
to arrived at the routers in a short time. It is, therefore, possible to develop a new search
method with low cost and enough speed by considering a practical packet arrival
process.
One of the feasible methods is a cache method where recently used entries only
are stored in the cache table and all entries are stored in the main table. Expensive but
fast search is employed for the cache table such as T-CAM chips, and slow but low cost
search is employed for the main table (herein called full table). This method has
characteristics that it can search fast if cache hits, but the search becomes slow if the
search entries are widely spread due to cache miss-hit. The previous idea of this cache
method is here referred host-address-cache methods since host address is stored in the
cache as the entry [67]. The host-address-cache, however, is expected poor performance
because its cache covers very narrow IP address. For example B:63.0.2.* covers 256 IP
addresses but C:63.0.2.4 covers only an IP address. This may cause thrashing between
cache and full table and result in high miss-hit ratio if it is used in backbone routers,
which receive widely variety of IP address. It is therefore important to improve miss-hit
ratio in a cache table in order to realize low cost and high speed LPM search. The idea

13
is proposed that cache architecture is employed with algorithmic search and hardware
search engine. Instead of ordinary CAM as used by conventional caching architecture,
T-CAM is employed to reduce cache miss-hit ratio. Because caching-in/out rule is not
obvious in LPM search, the rule is carefully invented and investigated for a validation.
Performance evaluation is shown to disclose the proposed architecture can achieve at
least ten times smaller miss-hit ratio than the conventional cache architecture.
Today’s Internet has become a part of the daily life of residential users and
business users as a life infrastructure. Internet must have high quality and capability of
multimedia data traffic. Toward the future Internet, this thesis discusses new
architecture and control for high QOS with the networks while operational cost and
equipment cost remains minimum. We believe these discussions contribute to realize
next generation high quality, high-speed Internet.
1.2 Organization of this thesis This thesis consists of five approaches for high quality network. Connection
admission control (CAC), burst transfer methods, network caching architecture, TCP
overlay network architecture and high speed IP address table search methods are
individually addressed.
Chapter 2 discusses CAC, which enables networks to achieve required QOS
values while keeping network utilization at its maximum. The CAC proposed in this
chapter has advantages; only two parameters and small time are needed for accept/reject
new connection request. The proposed CAC uses “Virtual cell loss rate” instead of cell
loss rate as cell loss estimation. Simulation results show that the proposed CAC has
appropriate accuracy in estimation and offers appropriate network utilization.

14
In Chapter 3, burst transfer methods are addressed for more bursty data. To
accommodate bursty data in an efficient manner, it is suitable to reserve and release
bandwidth for each piece of burst data at the time when the burst is ready to send. This,
however, may cause large latency to the burst if the bandwidth is not available. The
more the number of links are on the end-to-end path, the larger the expected delay to
grab the all bandwidth on the path simultaneously. To make the latency small, burst
server architecture are proposed. In the architecture, a burst server, which stores and
forwards the bursts, is placed between links and the reservation methods are modified.
Bandwidth reservations can succeed either if the bandwidth on all links between
sending and receiving terminals are available, or all links between burstservers or
sending/receiving terminals. Numerical results show that the latency is improved in this
architecture.
In Chapter 4, we prove the fact that if we can take account of application feature
into congestion control, both network utilization and user QOS can be improved. One of
the today’s most important and popular applications of the Internet is web (World Wide
Web). The web has a feature that the content that is to be retrieved next can be predicted
from the current contents. This feature implies pre-fetch retrieval may be able to hide
transfer delay (latency) to users/browsers. There is a tradeoff between the latency and
the traffic load due to pre-fetching as many contents as potentially expected to be used.
If the pre-fetch is done when network is not congested, i.e. is in idle, network can be
well utilized and latency can be small as well. The network cache architecture for
network friendly pre-fetch retrieval is therefore proposed.
Chapter 5 describes TCP overlay network architecture. TCP has been developed
since 1980s, and has never essentially improved by today. TCP has to provide new
functions to meet their requirements for today’s high-speed link, fairness consideration,

15
and future services. I believe it is easy to introduce new TCP functions not to end
hosts/servers, but to the intermediate node. TCP relay node (TCP bridge) can thus give
new functions such as reliability and high throughput applications without changing
existing IP network and user terminals/servers.
In Chapter 6, improvement of IP router in protocol processing speed is discussed.
To accommodate huge Internet traffic, high-speed routers are the key. IP address table
search is one of a bottleneck to realize high speed protocol processing in such routers.
Longest Prefix Matching (LPM) search must be used to search the table. Although a lot
of quick search methods are developed in Full matching search, they cannot apply to
LPM search. Algorithmic approach is very cost effective but has lower speed. One of
the solutions for quick search is to develop hardware search engine, i.e. Ternary CAM
(T-CAM). T-CAM is tri-state Contents Addressable Memory. However, It causes high
cost and small capacity, and to accommodate large IP table, many T-CAM chips are
necessary, which increases the cost. The idea presented in this thesis is to solve the trade
off with cache architecture with algorithmic search and T-CAM. Because of LPM
search, caching-in/out rule is not obvious. The rule is carefully invented and
performance evaluation is shown in this chapter.
The last chapter concludes this thesis.

16
CHAPTER 2 A CALL ADMISSION CONTROL
FOR ATM NETWORKS BY USING SIMPLE QUALITY ESTIMATE
2.1 Introduction The asynchronous transfer mode (ATM) is an important component of the
Internet. ATM has useful features, for example connection oriented connection, traffic
control to each connection inside networks [1], [2]. Since ATM, however, involves a
statistical multiplexing scheme, queueing delay, cell loss, or other degradation of
quality of service (QOS) may easily occur in cases of network congestion. Bursty traffic,
such as image data transfers, has a particularly serious impact on communication quality
because of statistical load fluctuations. Traffic control is, thus, necessary to avoid
congestion. Traffic control methods may be divided into two categories (reactive control
and preventive control) and the most efficient use of network resources may be
achieved by combining the two. Call admission control is, of course, a form of
preventive control, which is by its nature more effective than reactive control for use in
high-speed networks [3].
We are interested here in developing a practical control system, a very important
function of which is the guaranteeing of a specific QOS for each call. It is also very
important that the decisions to accept or reject calls be made in real time. That is, a
simple and fast call admission control should be able to estimate individual cell loss
probability rather than average cell loss probability. From the economical aspect, it is
expected for the control to obtain statistical multiplexing gain. The call admission

17
control we report here is based on a measure which estimates traffic characteristics in a
link. The measure is calculated from user declaration parameters of a traffic description.
Burst traffic is modeled here as on-off traffic and is basically characterized by three
parameters: peak rate, mean rate, and burst length. A measure based on “queueing
model” is sensitive to burst length, which is difficult to be declared and policed. A
measure based on a “bufferless fluid flow model” is simply calculated by two
parameters of peak rate and mean rate, which are easily declared by users and easily
policed [4]. We use a call admission control using a measure based on a bufferless fluid
flow model. Many preceding works which fall into this category use average cell loss
probability defined over different traffic class mixes [4]-[8]. In many cases of practical
interest, where a variety of applications share a link, it may be difficult for an admission
control based on the average cell loss probability to reflect a specific quality
requirement for individual calls. In [9] and[10], individual cell loss probability has been
introduced. However, it is not sufficient to discuss the use of the measure for practical
control. We will show the comparison between average and individual cell loss
probabilities, and show link utilization results using the measure of individual cell loss
probability. Several other studies have proposed simple and fast control procedures
using virtual bandwidth methods but, for similar reasons, they are insufficient to ensure
that all individual cell loss probabilities lay within a specific degree of quality. Further,
while each of these studies note that virtual bandwidth methods fail to guarantee a
specific quality in heterogeneous traffic multiplexing, none gives any solution to the
problem [11]-[14]. In [10], the problem is referred to as “interference” between different
types of bursty traffic and, though a solution is offered, it is still incomplete. That is to
say, they seek to improve the virtual bandwidth method by using a virtual link capacity
scheme, the basic idea of which is to give a margin to every virtual bandwidth and to

18
execute acceptance judgments using subdivided link capacities. They fail, however, to
mention how to allocate bandwidths so as to meet the various QOS requirements.
In Section 2.2 of this thesis, after briefly describing our traffic model, we
introduce a “link overflow model,” a kind of “bufferless fluid flow model,” and
compare the virtual cell loss probability calculated for it with cell loss probability
calculated for a queueing model. In Section 2.3, we show the difference between
individual cell loss probabilities and average cell loss probability. Section 2.4 proposes
a bandwidth allocation scheme, based on the virtual bandwidth scheme, which employs
virtual link capacities. We summarize the results of our study in Section 2.5.
2.2 Quality estimation measure – virtual cell loss probability
2.2.1 Definition and features of virtual cell loss probability
The traffic model we use here is characterized as follows. Bursty traffic sources
such as video sources might generate bursty traffic, i.e., bursty cell streams. Such
sources have both active and idle periods. In active periods, cells are generated at a
constant rate MAX, the peak rate. In idle periods, no cells are generated (see Fig. 1-1).
The number of cells generated in an active period is denoted by B, and AVG is the mean
rate. The respective source’s being active or idle are, then, probabilities for AVG/MAX
and 1 - AVG/MAX. In constant bit rate (CBR) traffic, AVG is equal to MAX.

19
Fig. 2-1 Traffic model

20
Fig. 2-2 Real cell loss probability P versus virtual cell loss probability pv
Although real ATM networks have buffers in each switch, for simplicity’s sake,
we use a bufferless model. In our model, quality is measured in terms of the virtual cell
loss probability, which is based on a “link overflow model,” a logically bufferless fluid
flow model, derived from the traffic characteristic parameters MAX and AVG alone [4],
[7], [8]. In the link overflow model, cell losses due to overflow occur if and only if an
aggregated peak rate R exceeds link capacity C (Fig. 1-2), where R is defined by a load
with n sources being active, i.e., n·MAX. Cell loss probability in the model is the ratio
of excess traffic OF and traffic load ρ. The virtual cell loss probability (pv) is defined in
(1), where the number of sources multiplexed in the link is denoted by N.
pv=OF/ρ (2-1)

21
OF= Σn=N
p(n)(n·MAX-C) (n·MAX-C)=>0
(2-2)
ρ= N·AVE (2-3)
where p(n) is the probability that n out of N sources are active: that is.
(2-4)
One of the advantages of pv is that it is easy to declare and police both MAX and
AVG1. Another advantage is its explicit formulation. This means that it is simple and
easy to estimate the quality provided to the users.
In the bufferless model, when the aggregated peak rate R is smaller than link
capacity, i.e., R < C, cell loss is assumed to never occur. Even if the condition R < C
holds true, due to a short-term load fluctuation caused by simultaneous cell arrival from
different calls, traffic load may instantaneously excess the link capacity. It is the reason
why buffers should have an appropriate capacity in a real system to prevent cell loss due
to the short-term load fluctuation. The necessary buffer capacity is derived from
anM/D/1-S queueing model [16], [17]. For example, about 100 cells are necessary2 for
a cell loss probability of 10-9 and a traffic intensity of 0.9.
The cell loss probability observed in a real system is less than the quality
measure pv, since the buffer can save cells that should normally be discarded in a
bufferless model.
1 A sliding-moving window scheme can police MAX and AVG.
2 The buffer would cause cell delay, but the delay might be quite small
in high-speed networks.
nNn
MAXAVG
MAXAVG
nN
np−
��
���
� −��
���
����
����
�= 1)(

22
2.2.2 Comparison between real and virtual cell loss probability
Simulation results show that, for identical traffic, the virtual cell loss probability
pv in the link overflow model is always larger than real cell loss probability P in the
queueing model. Fig. 1-3 shows pv and P for B-
/M3, where
Fig. 2-3 Cell loss probability: P versus pv
B-
is the average burst length, M is buffer capacity, MAX and AVG are
normalized by the link capacity C, and the link utilization ρ is fixed. In this case, 100
homogeneous traffic sources which have a peak rate of 0.1 and mean rate of 0.009 are
3 Even with the same load and with the same MAX and AVG parameters,
the value of B-
/M determines P [8], [13]-[15].

23
multiplexed on the link. The figure shows that pv provides the upper bound of P as B-
/M
increases. Furthermore, P converges to the value of pv when B-
/M goes to infinity. For
example, pv is almost the same as P for B-
/M = 208.33, which corresponds to the ratio
of one burst of still picture containing 1 Mbyte (= 20,833 cells) and buffer capacity of
100 cells.
From a control point of view, this means that pv is a conservative quality
measure of P4, and a good quality measure because pv is robust to variation of B-
. The
same results are expected in the cell loss probability under 10-4, which is hard to obtain
due to computer processing power.
The efficiency of statistical multiplexing under pv < 10-9 results in Fig. 1-4,
where non-statistical mode means a maximum utilization under a peak rate multiplexing,
i.e., MAX < C. The figure shows that we can expect statistical multiplexing gain for
almost all kinds of traffic. It also shows that we should not expect an economical use of
resources for traffic whose peak rate is bigger than 0.1. To reduce peak rate, a user can
employ a traffic shaping mechanism [3]. The features of the call admission control,
based on pv and P, are summarized in Table 1-1. Consequently, we use the virtual cell
loss probability as the quality measure for call admission control.
4 When B is smaller than M, P becomes too sensitive, and such characteristics become intractable for the call admission control.

24
Fig. 2-4 Maximum link utilization versus MAX (homogeneous traffic)
Table 2-1 Traffic control scheme comparison based on pv versus P

25
2.2.3 Extension to a network model
We discuss how to estimate virtual cell loss probabilities in intermediate links,
where the traffic usually has different characteristics from those of a sending terminal.
Generally, traffic characteristics are changed at every queue[8], [14], [18], and their
estimation is too complicated. To evaluate such changes, we employ a queueing
network model shown in Fig. 1-5(a) for output-buffer type switches [19], [20]. Fig.
1-5(b)-(d) show a queue length Qi instead of the cell loss probability in simulation
results, where a subscript i indicates i-th stage of the network model [8], [21]. In Fig.
1-5(c) and (d), using the average queue length q and the variance σ from the average, q
+ 3σ is indicated as the approximate tail distribution of the queue length. It is found that
traffic is still bursty at the second stage, but is less bursty than at the first stage. Such
effects may be caused by a decrease of MAX. The reason is thought to be that several
bursts are mixed and interleaved with each other in a queueing buffer, and they leave
the buffer to reach the next queueing buffer in a sparse form (as illustrated in Fig. 1-6).
Other simulation results also show that the average queue length at the third stage is
smaller than that at both the first stage (Q1) and second stage (Q2), but almost the same
as Q25. Similar results concerning the queue length distribution for interrupted Poisson
process traffic [18] confirm the above discussion.
5 A study in [14] evaluates a two-stage queueing network model, and explains similar behavior as the "smoothing effect." That study, however, does not give the traffic behavior after the second stage.

26
Fig. 2-5 Network model. (a) Queueing network model. (b) Queue length versus number of nodes S. (c) Queue length versus AVG. (d) Queue length versus MAX
It would be reasonable to predict that the average queue length in the i-th (i > 3)
stage (Q2,) is smaller than Q1. However, the queue length difference between the first

27
and i-th (> 1) stages is small. We should assume that traffic characteristics are the same
in all stages in order to implement a simple and practical control, although the quality
estimation at the i-th stage is rather conservative. We conclude that the virtual cell loss
probability pv, which is calculated using the peak and mean rates of the sending
terminal, should be directly applied to all intermediate links.
Fig. 2-6 Change into less bursty
2.2.4 Extension to a heterogeneous traffic environment
In the case of a heterogeneous traffic environment, it is necessary to extend the
virtual cell loss probability defined in the case of homogeneous traffic of Section 2.2.1.
At first, it is convenient for control to categorize traffic types according to their
characteristics, i.e., MAX and AVG. The peak rate of the traffic category j is denoted
MAXj, and the mean rate AVGj. The virtual cell loss probability (PV) for heterogeneous
traffic is defined in (5) [8].
PV=OF/ρ (2-5)

28
(2-6)
(2-7)
(2-8)
where
K:
Nj:
Number of categories
Number of category j calls
The virtual cell loss concept based on the link overflow model is, thus, easily
extended to a case of heterogeneous traffic.
On the other hand, PV calculation steps would dramatically increase as the
number of categories K increases. From a practical point of view, in order to reduce
calculation steps, we present in Section 2.2.4 another approach to implement a call
admission control scheme based on an indirect calculation of PV.
�=
⋅=K
jjj AVGn
1ρ
jjj nN
j
j
n
j
j
j
jjj MAX
AVGMAXAVG
nN
np−
��
�
�
��
�
�−
��
�
�
��
�
����
����
�= 1)(
� � ∏ �=
≥−⋅∈
=
= =�
��
���
�−⋅⋅⋅⋅=
=
11
1}0{
1 1)))(((
Nn
CMAXnn
Nn K
i
K
jjjii
K
iiii
KK
CMAXnnpOF

29
2.3 Guaranteeing a specific QOS – individual virtual cell loss probability
2.3.1 Characteristics of individual multiplexed traffic
From a practical point of view, call admission control should guarantee a
specific QOS for every call using a measure which evaluates individual cell loss
probability observed for each call.
When different categories of traffic, i.e., traffic sources with different
characteristics, are multiplexed, even if their required qualities (cell loss rates) are the
same6, the cell loss probabilities observed for each individual category are usually
different [22]-[24]. The cell loss probability for traffic type j is denoted by Pj, and the
average value of Pj (j = 1, … , K) is denoted P. It is easy to predict that Pj is relatively
larger for more bursty traffic and relatively smaller for less bursty traffic when various
kinds of bursty traffic sources are multiplexed. The intuitive reason is that more bursty
traffic causes congestion by itself, so that cells tend to be discarded more frequently. We
need to extend the virtual cell loss probability concept in order to consider a specific
quality for individual traffic, because the virtual cell loss probability mentioned above
corresponds to an average of the individual cell loss probabilities for individual traffic
sources.
2.3.2 Definition of individual virtual cell loss probability
In order to investigate individual loss characteristics and to use them in a call
admission control scheme, a quality measure, individual virtual cell loss probability,
PVj should be employed. The individual virtual cell loss probability PVj is based on the
6 In this chapter, we focus on individual traffics (all of which require the same QOS).

30
same conceptual model as the average virtual cell loss probability PV. Fig. 1-7
illustrates the individual link overflow model, where several Type 1 and Type 2 calls
are multiplexed. The individual virtual cell loss probability for two types of traffic is
shown in [9]. The individual virtual cell loss probability for type j among K types of
traffic results in PVj in (9) [10], [25].
pvj=OFj/ρj (2-9)
(2-10)
(2-11)
(2-12)
Where
K:
N:
MAX:
AVG:
C:
Number of traffic categories
Number of type j call
Type j peak rate
Type j mean rate
Link capacity
Underlined terms in (10) correspond to individual loads that instantaneously
exceed the link capacity, OFj, in Fig. 1-7. When MAX and MAX/AVG increase, traffic
jjj AVGn ⋅=ρ
iii
i
nN
i
i
n
i
i
i
ii MAX
AVGMAXAVG
nN
np−
���
����
�−��
�
����
����
����
�= 1)(
� � ∏ � �=
≥−⋅∈
=
= = =�
��
���
�⋅⋅−⋅⋅⋅⋅=
=
11
1}}0{{
1 1 1)/())))((((
Nn
CMAXnn
Nn K
i
K
j
K
iiijjiiiij
K
iiii
KK
MAXnnMAXCMAXnnpOF

31
becomes more bursty [8], [13], [15], [26]. From (10), PVj is large for relatively large
MAXj and MAXj/AVGj.
Fig. 2-7 Individual virtual cell loss probability
2.3.3 Comparison between real and virtual individual cell loss
probabilities
Comparing PVj with Pj shows that PVj is reasonable as a quality measure for Pj.
Pj was evaluated by a simulation technique. Fig. 1-8 shows PVj and Pj as a function of
B/M. In Fig. 1-8, Type 1 traffic is more bursty than Type 2. Comparison between virtual
and real cell loss probabilities of Type 1 traffic, PV1 and P1, has a similar behavior as
those in the average case (as shown in Section 2.2.2). We can obtain the same
conclusion about Type 2 traffic behavior. Consequently, the individual virtual cell loss
probability PVj is suitable for quality estimation for individual traffic.

32
Fig. 2-8 Individual real cell loss probability Pj versus individual virtual cell los probability pvj
2.3.4 Comparison between average and individual virtual cell loss
probabilities
It is necessary to know how much difference there is between individual and
average virtual cell loss probabilities, i.e., PVj and PV. Fig. 1-9 shows the PVj
characteristics (solid line) for two kinds of calls, Type 1 and Type 2, and PV (dashed
line) defined by (5), where Type 1 traffic is more bursty than Type 2. The difference is
large between PVj and PV. The PVj ratio between Type 1 and Type 2 is about 10 times.
The same characteristics hold true for three or four kinds of calls. In that case, for
example, the PVj ratio between the most (MAX = 0.2) and the least (MAX = 0.02)
bursty traffic types is at least 10 times. Consequently, the difference between PVj and

33
PV is significant and it is necessary to base the call admission control, not on the
average, but on the individual virtual cell loss probability, in order to guarantee a
specific QOS for every traffic types. In the next Section, such a call admission control is
practically developed.
Fig. 2-9 Individual virtual cell loss probability characteristics

34
2.4 Call admission control scheme
2.4.1 Virtual bandwidth method
A call admission control scheme is developed, based on the above-mentioned
individual virtual cell loss probability. Call admission control schemes using virtual
bandwidth methods have been proposed in many papers as practical control methods
[11]-[15], [27]. In the virtual bandwidth method, each call has its own virtual bandwidth,
and a new call is accepted only if the total virtual bandwidth is smaller than the link
capacity [see Fig. 1-10(a)]. The virtual bandwidth VB is defined as the bandwidth
necessary for one call to guarantee a specific cell loss probability in a homogeneous
traffic environment [13], [27]. Fig. 1-10(b), which is obtained using (1), provides VB
for a cell loss probability of 10-9. Although a virtual bandwidth method is very practical,
we found two problems in it. After briefly introducing these problems and the way to
solve them, we discuss the details in the following sections.
Problem 1: The virtual bandwidth method has the disadvantage that it is not
certain to guarantee a specific cell loss probability [12]-[14], [26] because of
interference between different traffic categories during statistical multiplexing, although
it has the advantage of being quite simple. To avoid such uncertainty, the virtual
bandwidth method should be executed based on the virtual link capacity scheme [13].
Problem 2: The relation between the required QOS and the provided VB is not
clear. A study in [28] proposes a scheme to realize multiple QOS by giving each call a
different VB and priority. This scheme, however, requires a rather complicated
algorithm, and it is not clear whether it guarantees the required QOS. We take a similar
approach, but we emphasize simplicity and the respect of the QOS instead of
emphasizing efficiency.

35
Fig. 2-10 Virtual bandwidth (VB) allocation
2.4.2 Virtual link capacity
First, we describe the problem of the virtual bandwidth method, then explain the
virtual link capacity scheme.
Fig. 1-11 shows four admissible call regions, corresponding to a cell loss
probability guaranteed at 10-9 for both types of calls. These regions are represented in
Table 1-2.

36
The PVj-region is the exact admissible call region in which the cell loss
probability is under 10-9. It is more concave than the KB-region7, as shown in Fig. 1-11.
This means that a call lying in the shaded area of Fig. 1-11, if accepted by the call
admission control scheme, might have a cell loss probability bigger than 10-9. The
reason why the PVj-region is concave seems to be that statistical multiplexing is
interfered with and it results in a reduction in statistical multiplexing gain for every call.
(We call such phenomenon “interference.”)
In order to ensure a specific quality, we use the modified virtual bandwidth VB’
instead of VB. VB’ is function of VB and is larger than VB. For example, VB’ = VB + 0.1
·VB. In Fig. 1-1l(a), where interference has been taken small, the KB’-region is
completely included in the PVj-region. On the other hand, in Fig. 1-1l(b), where
interference has been taken large, the VB’-region is not included within the PVj-region.
In order to use the virtual bandwidth method with VB’, we divide traffic into
two categories: a small interference and a large interference category. In the case of the
small interference, the KB’-region is completely included in the PVj-region as shown in
Fig. 1-11(a), and in the case of the large interference, it is not. In the virtual link
capacity scheme [13], traffic sources belonging to the large interference category (which
we, from now on, call large interference traffic) require an amount of virtual bandwidth
equal to MAX and are allocated to a predefined part of the total link capacity C. On the
other hand, those belonging to the small interference category (which we, from now on,
call small interference traffic) require an amount of virtual bandwidth equal to VB
(<MAX) calculated based on the rest of the total link capacity and are allocated to that
7 We use here individual virtual cell loss probability PVj to derive admissible call region. When we use the average virtual cell loss probability PV by (6) instead of PVj, of course, we have the same problem.

37
capacity. We describe this again in Section 2.4.5. Note that the link capacity is not
physically but virtually divided; that is, bandwidth allocation is executed in each
separate capacity and cell transfer is executed using the whole link capacity shared by
the two categories. Using the combination of this virtual bandwidth method and virtual
link capacity, call admission control can ensure a specific quality if traffic is
appropriately divided.
The virtual link capacity concept and the division of traffic appeared in the paper
[13]. However, the quality measure in the paper is not individual cell loss quality but
average cell loss quality. We use this concept but should revise the division of traffic
presented in [13], which we call now “traffic clustering. “

38
Fig. 2-11 Admissible call region (two types). (a) Interference: small. (b) Interference: large

39
Table 2-2 Regions
2.4.3 Traffic clustering
Because traffic-clustering results depend on modified virtual bandwidth
definitions, we employ two kinds of definition for the modified virtual bandwidth.
Results given by both definitions are, however, essentially similar. As mentioned above,
Fig. 1-11 shows the admissible call region in the case of the small interference (a) and
the large interference (b), where the modified virtual bandwidth VB’ = VB + 0.1 ·VB.
Type 1 traffic in (b) is more bursty than that in (a), and Type 2 traffic is the same in (a)
and (b). Similar results are obtained when three kinds of traffic sources are multiplexed.
In another example, to guarantee PVj < 10-9, we define VB’ to be equal to VB
calculated for pv < 10-10. In that case, traffic-clustering results are shown in Fig. 1-12,
where Type 1 traffic is indicated by a circle if both Type 1 and 2 are the small
interference traffic, and by “x” if both are not. Traffic sources that have large MAX such
as MAX > 0.1 and traffic sources that are nearly CBR, which even have statistical
multiplexing gain, tend to virtually reduce the link capacity for statistical multiplexing
and they are prone to large interference [10], [25].

40
We can derive some boundary conditions for traffic clustering from evaluation
results in Figs. 1-11 and 1-12. Advancing in such an evaluation, the boundary
conditions will become more strict, and the intensity of interference will be estimated.
Fig. 2-12 Traffic clustering

41
Fig. 2-13 Virtual link capacity
2.4.4 Quality class and bandwidth allocation
The relation between bandwidth allocation and QOS classes to be provided by
the network is discussed. If statistical multiplexing is adopted for all services, statistical
quality degradation will occur for all services. The deterministic quality class should
also be supported by the network.
Therefore, we consider that networks should treat at least two QOS classes, a
“deterministic class” and a “statistical class” [26], [13]. The deterministic class implies
an individual virtual cell loss probability PVj of zero, and for the statistical class traffic,

42
a PVj of a specific value8. The specific value, such as 10-9, is determined by user
requirements. Users can select among these QOS classes. To prevent not only buffer
overflow but also link overflow, MAX is allocated to the deterministic class traffic.
Basically, the virtual bandwidth as mentioned in Section 1.4.1 is allocated to the
statistical class traffic. In order to prevent cell loss probability fluctuations for the
deterministic class, deterministic class traffic is transmitted with a higher priority in
each cell. The proposed priority control scheme provides excellent service quality (PVj
= 0) for the deterministic class traffic, and statistical multiplexing gain for the statistical
class traffic while ensuring the required quality PVj; on a long-term average. In the next
section, a call admission control based on the previous discussion is summarized and
evaluated.
2.4.5 Call admission control
E. Call Admission Control This section summarizes a call admission control
scheme using the VB method and a virtual link capacity scheme in order to guarantee
individual cell loss probability. Table 1-3 shows virtual bandwidth allocation and virtual
link capacity allocation. The link capacity is divided into two capacities, Cmd and C’,
for two QOS classes. The “deterministic class” traffic sources are allocated in the
subcapacity Cmd. For the “statistical class,” the subcapacity C’ is virtually divided to
two capacities, Cms and Cv, in which traffic sources of large and small interference
categories are allocated, respectively, as illustrated in Fig. 1-14. Each divided capacity,
which should be determined according to the forecasted traffic intensity, is basically
fixed, but can be adaptively changed with long-term traffic intensity variation. The
8 For the statistical class, the PVj value can fluctuate time by time during a call [29], but it is guaranteed to meet a specific value over a long period.
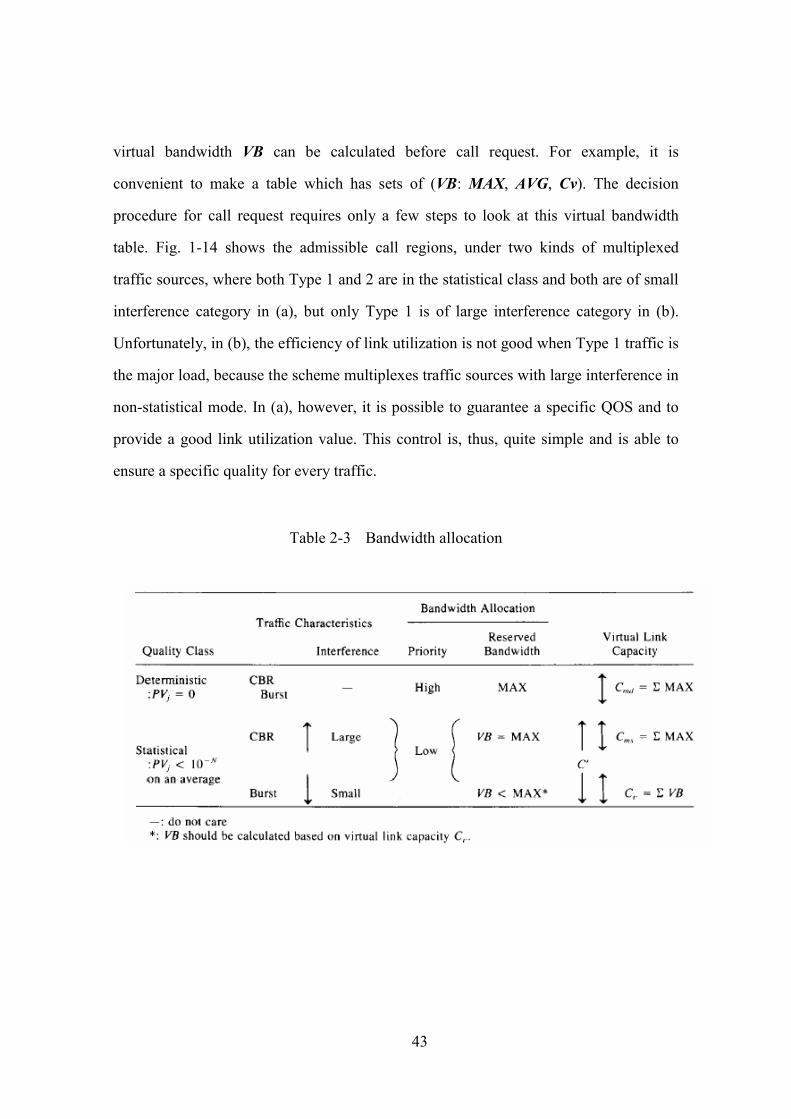
43
virtual bandwidth VB can be calculated before call request. For example, it is
convenient to make a table which has sets of (VB: MAX, AVG, Cv). The decision
procedure for call request requires only a few steps to look at this virtual bandwidth
table. Fig. 1-14 shows the admissible call regions, under two kinds of multiplexed
traffic sources, where both Type 1 and 2 are in the statistical class and both are of small
interference category in (a), but only Type 1 is of large interference category in (b).
Unfortunately, in (b), the efficiency of link utilization is not good when Type 1 traffic is
the major load, because the scheme multiplexes traffic sources with large interference in
non-statistical mode. In (a), however, it is possible to guarantee a specific QOS and to
provide a good link utilization value. This control is, thus, quite simple and is able to
ensure a specific quality for every traffic.
Table 2-3 Bandwidth allocation

44
Fig. 2-14 Virtual bandwidth allocation with virtual link capacity. (a) Interference: small. (b) Interference: large

45
2.5 Conclusion This chapter has indicated a practical call admission control scheme for ATM
networks, in order to keep cell loss probabilities observed for individual traffic sources
under a specific value. For quality estimation, we should use a quality measure, the
“virtual cell loss probability” based on the link overflow model (bufferless fluid flow
model). The measure is simply calculated using two traffic characteristic parameters
only: peak and mean rate, and is good estimation of real cell loss probability for
homogeneous and heterogeneous traffic when burst length is larger than buffer capacity.
The results of link utilization for peak rate show that we cannot expect statistical
multiplexing gain for traffic which has a larger peak rate than 10% of the link capacity,
so that traffic shaping is useful for such traffic. For quality estimation in intermediate
node or link, it is reasonable to use the same traffic characteristic parameters as those at
the sending terminal. Furthermore, from the viewpoint of individual call quality,
practical control should be based on the measure “individual virtual cell loss
probability,” to which the virtual cell loss probability is extended and which
corresponds well to the real individual cell loss probability. For the implementation of
call admission control, the virtual bandwidth allocation method should be employed to
develop a simple and practical call admission control. Before the call setup request,
each traffic is given its own virtual bandwidth, which should be determined from both
the traffic characteristics and the required QOS classes such as “deterministic” or
“statistical” quality class. For statistical class traffic, traffic should be divided into two
clusters and be allocated in virtually divided link capacity, separately. The traffic
clustering is executed based on interference intensity, which is defined as a reduction
factor of statistical multiplexing gain in heterogeneous traffic, and depends on traffic
characteristics. In one cluster, traffic has statistical multiplexing gain in a heterogeneous

46
traffic environment and is statistically multiplexed. In the other, traffic is provided with
an amount of virtual bandwidth corresponding to its peak rate. For deterministic class
traffic, traffic should have a high priority and should be non-statistically multiplexed in
order to logically avoid any cell loss. Call admission control based on these methods is
simple, practical, and guarantees a specific quality to all traffic sources.
In this conclusion, the author would like to thank Colleague of NEC for their
helpful guidance and advice.

47
CHAPTER 3 BURSTSERVER ARCHITECTURE
FOR BURST BANDWIDTH RESERVATION PROTOCOL
3.1 Introduction To increase network utilization for accommodating more bursty traffic,
burst-by-burst admission control is here discussed. High-speed bursty data traffic in
ATM networks is increasing more and more as the demand to interconnect ATM LANs
has been expanding. In LAN interconnection, the intermediate links between LANs are
shared by many users and may become a bottleneck. The high cost of intermediate links,
which may be leased from the network carrier, make it desirable for LAN users to use
links efficiently. Many research works [33], [34], however, have pointed out that
high-speed bursty data traffic can not be multiplexed to gain statistical multiplexing of
the cell level.
The Fast Reservation Protocol (FRP) [30] is one traffic control method which
provides high speed bursty data users both with high quality of service and with
statistical multiplexing gain in the burst level [31]. In FRP, each bursty data source
reserves a bandwidth for itself on a virtual channel (VC) path from the source to the
destination before transmission, and releases the bandwidth for other data traffic after
the transmission has been completed.
In wide area networks, for example, LAN interconnection for remote LANs,
however, bursts may suffer from high blocking ratios in FRP because each burst must
simultaneously succeed in making bandwidth reservations over all links on the path. A

48
reservation is blocked when just one link on the path is not available. This results in
another reservation attempt after a certain backoff time. Then, large delays at the source
terminals and throughput degradation occur. This problem becomes serious as the
number of links on the path increases. One study, [31], shows that the multipath scheme
improves the blocking probability, if terminals manage many different paths to the same
destination.
To solve blocking problems based on an ATM single path, there are two
approaches that provide feasible solutions. One is to reduce the bandwidth used for each
burst transfer in order to get smaller burst blocking probabilities [32]. This approach,
however, may result in large transfer delays at the source terminals. The other approach
is to reduce the number of links which must be reserved simultaneously.
This thesis proposes a “Burstserver” architecture based on the latter approach,
which reduces the number of links reserved simultaneously by dividing all the links on
the path into small sets, and obtains higher network throughput due to low reservation
blocking ratios.
3.2 Characteristics of the bandwidth reservation method
3.2.1 Blocking in burst bandwidth reservation
Let us focus on bursty data transfers such as, Internet Protocol (IP) packet
transfers and Ethernet packet transfers between remote LANs. These packets in ATM
networks are delimited into a series of ATM cells, which is defined as a “burst”. In
addition, a series of cells are called a burst, if all the cells go to the same destination via

49
the same ATM connection. The bursts defined here are assumed to require high peak
rates for ATM transfer.
In FRP [30] or the burst bandwidth reservation protocol [31], bursts are sent
after they succeed in reserving a bandwidth along the established connection path. Each
source/destination pair establishes the virtual channel (VC) connection with no
bandwidth before generating a burst because it takes much more time to set up a
connection than to reserve a bandwidth. When a burst is generated, it has to reserve
necessary bandwidths in all the links on the path. The reserved bandwidth is released
after the burst is sent. Each burst is identified by a beginning-of-burst cell and an
end-of-burst cell, which are detected by looking at the ATM cell headers [35].
Reservation blocking, which causes delays because of successive reservation
attempts after a certain backoff time can occur frequently as the number of links on a
path increases. In such cases, simultaneous link reservations can be difficult as shown in
Fig. 3-1. The figure shows a communication diagram for sending a burst to the
destination via Link #1, #2 and #3. Suppose that Link #1, #2 and #3 have traffic streams
independent of each other. Then, busy periods occur randomly on each link. In (a), the
first several reservations are denied by any one of the three links. It is so difficult to
reserve all three links simultaneously that the burst suffers many reservation attempts
and an extended waiting delay in order to complete the bandwidth reservation.
3.2.2 Store and forward burst transfer
One reasonable solution is to logically divide the network look into smaller parts
in order to avoid reserving many links simultaneously. At the first attempt in Fig. 3-1
(a) and (b), the generated burst tries to reserve bandwidths over all Links #1, #2 and #3.
Then, Link #2 rejects the reservation. If the burst goes first only to Link #1, the next

50
attempt could start at Link #2, and would try to reserve bandwidth only for Link #2 and
#3 regardless of Link #1. Figure 1 (b) shows reservations made in such a manner, i.e.
the burst is sent first on Link #1, and is stored at a relay station between Link #1 and
Link #2, then the next attempt arises for link #2 and so on. This transfer method seems
to intuitively solve the simultaneous reservation problem. In fact, delay quality is
drastically improved in Fig. 3-1 (b) as compared with (a).
In order to realize this procedure and implement a relay station such as depicted
in Fig. 3-1 (b), the ATM burstserver architecture is proposed, which introduces a burst
store-and-forward mechanism into the ATM network. It is necessary to consider the
amount of storage space for bursts because the cell buffer capacity in current ATM
nodes is not large enough for this purpose. In addition, a function which performs a
burst bandwidth reservation protocol must be considered. The reservation protocol tries
to reserve the rest of the links on the path for the stored burst in the same way as the
source terminal does. It is a useful option to reserve B-server buffer storage as well as
link bandwidth in order to avoid buffer overflow.

51
Fig. 3-1 Diagram with/without burstserver
3.3 Burstserver
3.3.1 Basic functions
A burstserver is composed of a large capacity cell storage unit, which is able to
read/write cells at the same speed of the link where the burstserver is attached, and a
bandwidth reservation protocol function. A sample network configuration is illustrated
in Fig. 3-2. Burstservers (referred to simply as B-servers from now on) may be placed
not at all the nodes but at the appropriate nodes.
(a) Without Burstserver (b) With Burstserver
Reservation is acceptedReservation is NOT accepted (Link blocking)
Link block
Accepted
Data transfer
Sourc
e
Burstserver_1 server_2
Complete
AttemptR
eser
vatio
n
Link #1
Link #2
Link #3
Destina
tion
Sourc
eLink
#1Link
#2Link
#3Dest
inatio
n
Burst

52
Fig. 3-2 Network structure
In the data transfer phase, the burst transfer protocol treats a series of cells as a
burst by detecting both a beginning-of-burst cell and an end-of-burst cell identifier as
well as the VC identifier (VCI) in the ATM cell header. The burst in the B-server is also
treated as a series of cells. The bursts are separately stored into the corresponding areas
in terms of VCI. No upper layer protocol, other than the ATM layer protocol and a
reservation protocol, is necessary in the B-server.
3.3.2 Burstservers and connectionless servers
Burstservers have significant differences from so-called connectionless servers,
which may be used for low speed and small amount of data rather than for high speed
and bulk data.
Connectionless servers (CLS) are defined to share certain VCs among many
paths. CLS data transfer protocols must switch AAL or upper layer packets to the
appropriate destinations as illustrated in Fig. 3-3 (a). It is necessary to check the ATM
payload for switching information. It is thus very difficult to implement CLS functions
in hardware. Further, it is not possible to guarantee the requirements for quality of
service (QOS) such as the cell loss ratio or cell delay.
On the other hand, B-servers treat only ATM layer protocols and never take care
of ATM payload. B-servers require no switching function in burst-by-burst nor in
DestinationSource
Burst server
ATM sw

53
cell-by-cell, because each B-server knows the VC path to which the burst should be sent
as shown in Fig. 3-3 (b). The ATM protocol function can be easily implemented by
hardware. For storage, high-speed read/write is required and a huge capacity is desirable.
In practice, a serial/parallel converter can realize high-speed read/write. It is possible to
use static RAMs of several tens of megabytes, a relatively inexpensive option. Low cost
storage such as magnetic disc arrays can help to reduce the cost of B-servers.
Note that the B-server protocol guarantees the specified QOS, but CLS protocols
can not.

54
Fig. 3-3 Burstserver and connectionless server
3.3.3 Best effort procedure
Two feasible procedures in the reservation phase to decide usage of the
burstserver are proposed.
One is the “best effort” way, where a reservation goes straight toward the
destination until it is blocked. A flow chart of this method is drawn in Fig. 3-4. This
means that B-servers attached to less busy links may be skipped. For example, the
B-server on the right side of Fig. 3-1 (b), named server_2, is not used.
(a) Connectionless server
(b) Burstserver
server
server
vc
vc
: switchingfunction

55
The source terminal establishes VCs for all or part of the B-servers, from the
source to a B-server and from the B-server to another B-server, and so on, to the
destination (See an example in Fig. 3-5). These VCs should have no bandwidth at the
time of connection setup. At each input port in a switch, a VC connection table, which
maps input VCIs into output VCIs of particular output switching ports, is set during VC
establishment. An example of the connection table for the switch in Fig. 3-5 is shown in
Fig. 3-6. In Fig. 3-6 (a), input VCI #2 is mapped either towards the next switch (output
VCI #5 and output port #3) or towards the B-server (output VCI #100 of output port #7).
Another entry with the input VCI #200 and output VCI #5 of output port #3 must exist
at input port #7 (Fig. 3-6 (b)).
If the reservation is blocked, the reservation cell is sent back towards the source
according to the flowchart in Fig.3-4. On the way back from the blocked link, the
reservation cell gives switching information; indicating which of the two output VCIs in
the VC connection table must be used at each ATM switch. This mapping is realized by
marking a sign in the “availability” field of the corresponding output VCI in Fig. 3-6.
The sign is represented by “OK”. Note that this decision should be done separately for
each burst reservation.

56
Fig. 3-4 Flowchart of procedure-1 “Best Effort”
Next link
Link reservation attempt?
Success
Destination?
Not yet
Yes
Burstserver Link
Cancel the reservationfor this link
Regard the burstserver as a relaystation (virtual destination)
Transfer bursts to theburstserver
Transfer bursts to thedestination
Failure
Start
Reservation
Data transfer
Go back to the burstserverlocated just before this link, or otherwise to the previous link

57
Fig. 3-5 Routing from/to burstserver
Fig. 3-6 VC connection table
out in
in out
VCI VCI#200#100
VCI #5VCI #2
77
1 3
7
7
1 : Input port number
: Output port number
#n : VCI number
to next switchfrom previous
from/to burstserver
: Input port number
: Output port number3
switch
Input VCI Output Port Output VCI
Input VCI Output Port Output VCI
(c)
(d)
#2 OK #7 #100
#200 OK #3 #5
Input VCI Availability Output Port Output VCI
Input VCI Output Port Output VCI
(a)
(b)
#2#3
#7
#5
#100
#200 OK #3 #5
VC connection table of Input port 1.
Availability
Availability
Availability
VC connection table of Input port 7.
VC connection table of Input port 1.
VC connection table of Input port 7.
OK
(a) (b) Best effort procedure
(c) (d) Step-by-step procedure

58
3.3.4 Step-by-step procedure
The second way to use the B-server is the “step-by-step” method. In this method,
all B-servers along the connection setup path should be used for each burst. VCs are
setup like chains from the source to a neighbor B-server, from the neighbor B-server to
the next B-server, and so on to the destination, and the route is fixed identically. Figure
3-6 (c) and (d) corresponds to the VC connection table using this method. The source
terminal sends a reservation to the nearest B-server regardless of the network status. If
the traffic load is not heavy throughout the network, this procedure may lose the
opportunity that a burst may succeed to reserve a bandwidth at all the necessary links
and so may take less time to transfer the burst. This method, however, can be
implemented much more simply than the best effort way.
3.4 Performance evaluation study
3.4.1 Model
Burstservers could give high-speed bursty data an improvement in performance
such as throughput, delay, and fairness of them. This section is devoted to a
performance evaluation based on the models described below.
To make the analysis simple, the “step-by-step” procedure (Proc-2) is employed,
where every burst has to be stored and forwarded in every B-server even in low load as
described in Section 3.3.3. This procedure is compared with the conventional procedure
(Proc-0), where bursts can use no B-servers. A set of links between neighbor B-servers
or terminals is called a “hop”. For example, a system with two B-servers on the path
like Fig. 3-2 has three hops. Congestion in and around B-servers is assumed to occur so
rarely that overflow probability in B-server storage and the probability of contention in

59
the input or output of B-servers are negligible in the analysis. Queueing delays of data
and reservation cells in switch buffers are negligible since high-speed links, say, 150
Mbps, and peak rate bandwidth allocation, i.e. no statistical multiplexing, are assumed
here. Protocol processing delays are ignored.
Burstservers are placed symmetrically in the dedicated path, which is composed
of K links. The number of B-servers is denoted as S. The number of hops is S+1, and
the number of links in one hop is K’=K/(S+1). Link blocking ratio on each link B, mean
delay for burst emission H, mean backoff delay Db, and propagation delay on one way
Dp are defined. Bursts are homogeneously generated randomly and each has its peak
rate of 1/m, which is denoted as the value normalized by the link speed. The maximum
number of bursts which can be multiplexed in one link is m. Each link is assumed to
have identical and independent load ρ.
First, the elapsed delay is defined as the time from the first attempt to send a
burst at source terminal to the finish of receiving the burst at the destination terminal.
Such mean elapsed delay T for K links and S burstservers in Proc-0 and Proc-2 is
calculated by Eq. 3-1. Dp is set to be zero. H is equal to the amount of a burst divided
by its peak rate and is added to the elapsed delay in each time when bursts go out from
the B-server or from the source terminal. W is mean waiting time before success
reservation in one hop and is calculated by Eq. 3-2 from the Bernoulli trial model. It is
assumed that a burst is blocked in the probability G in each hop, and not blocked in 1-G.
Such G is defined in Eq. 3-3 since each link is assumed to behave identically and
independently. Equation 3-4 is an Erlang B formula.
T=(W+H)·(S+1) (3-1)
W=Db·G/(1-G) (3-2)

60
G=1-(1-B)K/(S+1) (3-3)
B=Erl(m, λ)=( λm/m!)/( Σmj=0(λ
j/j!)) (3-4)
Second, throughput ρ is calculated by Eqs. (3-4) – (3-7). Throughput
degradation results from frequent retransmission due to reservation blocking. λr is
defined as retransmission load. When λr becomes large, it grabs almost all of the load
since the load λ is kept to be constant.
λr=λ·G (3-5)
ρ=λ· (1-G) (3-6)
λ=ρ+λr (3-7)
3.4.2 Numerical results
Figure 3-7 (a)(b)(c) show throughput ρ vs. mean elapsed delay T curves for
m=100, 10, 5, respectively. The source/destination pair has K=16 links with B-servers
of S =0, 1, 3, 7 and 15 on the path. The back off time Dp is set to be five times of the
emission time H. In these figures, four curves of S=0, 1, 3 and 7 start at left bottom in a
low offered load. As the offered load increases, the curves go to the right and up, and
after certain values they still go up but turn to the left. On the return to the left, most all
of the offered load is blocked. Throughput degradation and large backoff delay occur.
Throughput is much limited when bursts require higher speed transfer, comparing Fig.
3-7 (b)(c) with (a). Note that throughput decreases although delay increases as offered
load increases.

61
Fig. 3-7 Throughput versus delay characteristics
0
5
10
15
20
25
30
0
Del
ay (T
/H)
0.2 0.4 0.6 0.8 1
m=100, K=16, Db/H=5, Dp=0
0
5
10
15
20
25
30
0
Del
ay (T
/H)
0.2 0.4 0.6 0.8 1
m=100, K=16, Db/H=5, Dp=0
Throughput (ρ)
S=0 (Proc-0)S=1 (Proc-2)S=3 (Proc-2)S=7 (Proc-2)S=15 (Proc-2)
(a)
0
5
10
15
20
25
30
0
Del
ay (T
/H)
0.2 0.4 0.6 0.8 1
m=10, K=16, Db/H=5, Dp=0
Throughput (ρ)(b)
S=0 (Proc-0)S=1 (Proc-2)S=3 (Proc-2)
0
5
10
15
20
25
30
0
Del
ay (T
/H)
0.2 0.4 0.6 0.8 1
m=10, K=16, Db/H=5, Dp=0
Throughput (ρ)(b)
S=0 (Proc-0)S=1 (Proc-2)S=3 (Proc-2)S=7 (Proc-2)S=15 (Proc-2)
0
5
10
15
20
25
30
0
Del
ay (T
/H)
0.2 0.4 0.6 0.8 1
(c)
0
5
10
15
20
25
30
0
Del
ay (T
/H)
0.2 0.4 0.6 0.8 1
(c)
m=5, K=16, Db/H=5, Dp=0
Throughput (ρ)
S=0 (Proc-0)S=1 (Proc-2)S=3 (Proc-2)S=7 (Proc-2)S=15 (Proc-2)

62
Since B-server architecture can reduce the number of links in one hop, it is
possible to reduce blocking ratio drastically and provide high throughput. For example,
for m=10 and S=1, the system can achieve a 14% improvement in throughput compared
with no B-server case (S=0). For m=5 and S=1, it can get a 23% improvement. If bursts
require higher peak rate, i.e. m reduces, B-servers show improvement in throughput
more significantly for a high-speed burst transfer. When S=15 B-servers can be used,
throughput characteristics is similar to the ideal one, that is, throughput reaches 1.0.
Figure 3-8 shows the existence of the unfairness problem lying between long
and short distance data transfer by evaluating throughput vs. offered load characteristics
for some K’s. In the figure, m=10 and there are four different hops for four different
pairs of B-servers as shown in Fig. 3-9. These hops are denoted #1, #2, #3 and #4, each
of which has K’=1, 2, 3 and 4 links on their hops, respectively, and the offered load to
each link is kept equal by appropriate background traffic. The figure shows the
disadvantages of long distance transfer. Throughput of more numbers of links is
suppressed by that of less numbers of links. That is, throughput decreases in long
distance traffic but increases in short distance traffic as the offered load increases. This
is the reason that throughput in Fig. 3-7 is characterized by the number of B-servers.
This unfairness problem becomes more serious if short distance traffic is relatively
heavier than long distance traffic and if over all traffic in the network is high. The
number of links K’, therefore, should be small to provide high throughput for both long
and short distance communications.

63
Fig. 3-8 Offered load versus throughput
Fig. 3-9 Long hop and short hop model
Figure 3-10 shows maximum throughput vs. number of links in one hop K’. The
offered load is given adaptively to get the maximum throughput. In the figure, results
0
0.1
0.2
0.3
0.4
0.5
Thro
ughp
ut
0 0.1 0.2 0.3 0.4 0.5
(ρ)
Offered load
K'= 1(#1)K'= 2(#2)K'= 3(#3)K'= 4(#4)
(λ)
Burst server
#1 #2 #3 #4
#n : Hop number
Background traffic
ATM sw

64
for 1/m=0.2, 0.1 and 0.01 are plotted. It shows throughput is limited by K’. K’ has
strong effects on the throughput, especially in high peak rate burst. A desirable strategy
is to introduce B-servers to maintain K’ within 1 or 2 for high-speed data.
Figure 3-11 shows maximum throughput vs. peak rate. It shows that the peak
rate also strongly effects throughput characteristics. Burstservers are required in order to
realize higher speed data transfer by maintaining throughput in the same value. In K’=2,
4, 8, and 16, high peak rate transfer, such as in range between 1/m=1.0 and 0.1, results
in very low throughput.
In a real situation, however, the characteristics may be less pessimistic as in Fig.
3-11. Since independence assumption in the link blocking is employed in this analysis,
blocking of high peak rate bursts depend more strongly on the neighbor link blocking
than does blocking of low peak rate bursts.
Fig. 3-10 Number of links versus throughput
0
0.2
0.4
0.6
0.8
1
Throughput
1 3 5 7 9Number of links (K')
1/m= 0.21/m= 0.11/m= 0.01
11 13 15
(ρ)

65
Fig. 3-11 Peak rate versus throughput
Burstservers are desirable for high throughput although mean elapsed delay T is
larger in Proc-2 than in Proc-0 in low traffic loads in Fig. 3-7, which is because every
burst in Proc-2 must stay at every B-server. For example, S=15 model in Fig. 3-7, T/H
at minimum must be 16. The Best effort procedure, Proc-1, also has great advantages
over Proc-0, and is expected to be much better than Proc-2 in both delay and throughput.
Since Proc-1 in low load skips B-servers in nature if they are not necessary, both delay
and throughput performance are supposed to be better than the corresponding ones
shown in Fig. 3-7.
In the above analysis, propagation delay Dp is set at zero for the sake of
simplicity. It is possible to see throughput go down more if Dp becomes significant
compared with the burst emission delay. In such a situation, the B-server architecture is
more useful to reduce the reservation time.
As a conclusion in the performance evaluation, if the network has many links or
spreads in a wide area, the network is likely to have the unfairness problem and QOS
0
0.2
0.4
0.6
0.8
1
Thro
ughp
ut
0.001 0.01 0.1 1
(ρ)
Peak rate (1/m)
K'= 2K'= 4K'= 8K'= 16

66
degradation, which results in smaller throughput. Implementation of B-servers is one
good solution to improve the unfairness problem and throughput degradation.
3.5 Conclusion The burstserver architecture is proposed for high-speed bursty data transfer in
order to improve QOS and throughput for large networks or wide area networks.
Because connection/call level admission control could not achieve statistical
multiplexing gain with high-speed bursty data multiplexing, burst-by-burst admission
control (FRP) is required for such bursty data.
In FRP, success of simultaneous link reservation is too difficult in burst-by-burst
bandwidth reservation. This results in delay and throughput degradation. For long
distance traffic, for example, in ATMLAN interconnection, the degradation can be
serious.
First, the proposed burstserver can achieve higher throughput by decreasing the
number of links simultaneously reserved. Second, it can reduce the unfairness problem
in which long distance communications suffer a disadvantage against short distance
communications. The burstserver provides a good solution to improving the unfairness
problem and maximizing throughput in order to enhance high-speed bursty data
transfer.

67
CHAPTER 4 PROACTIVE CACHING NETWORK
ARCHITECTURE
4.1 Introduction These are the efforts taken to guarantee QOS on packet networks, and the author
are sorry to say that the efforts have not achieved much success until now. Considering
the situation the Internet, a network developed as best effort network focused on QOS
improvements rather than QOS guarantees. In addition to this improvement of both
packet level QOS and user level QOS such as throughput and contents retrieval time
must be achieved, instead of packet level QOS guarantee.
Since Web must be a today’s most popular application, it is reasonable to focus
Web application as to improve user level QOS. In new services such as shopping and
video transmission, just “connecting” to the Internet is not acceptable for today’s users;
it is essential to connect with “some degree of quality.” For example, according to [36],
a user will leave a site if it is not displayed within 8 seconds. That is, in terms of
application level QOS, web QOS can be measured with the latency for the web contents
shown up on a user browser. Considering such statistics and user behavior, delays in the
network or server are very serious problems for providers involved in activities such as
e-commerce.
Delays that are usually felt by users are the sum of the delays in the network and
server, which are due to problems in the network, or problems with the server.
For the network in recent years, ISPs that provide a SLA (Service Level
Agreement) in their QOS, and/or guaranteed Differentiated Service (DS) in their QOS

68
have emerged. However, quantization and evaluation methods of SLA are still not
confirmed, and a DS only guarantees the QOS pipe between ground that was previously
set as a SLA in a single ISP, so it is not realistic to access the WWW servers around the
world.
On the other hand, on the server side, attempts are made to rectify delays such as
applying mirroring and caching techniques, and distributing the access traffic in order to
reduce load so as to deal with simultaneous multiple accessing. First though, mirroring
needs to create a copy in advance. So when access can be comprehensively predicted, it
is effective, but when it cannot be, it is difficult to realize because of cost problems.
Furthermore, mirroring is a technique that only makes contents on a specific server
high-speed, and it does not satisfy all client users.
Caching is the attractive method to reduce load because it can in nature
distribute contents that are most popular (centralized access) at a specific time. Present
cache servers are used mainly as forward caches with a proxy server, or as a reverse
cache preliminary of a server farm. However, a forward cache is said to have trouble
with a low hit ratio, and a reverse cache can reduce server load but does not connect
network traffic, and does not relate to an improved response during congestion on the
net.
Dealing with the network side, as noted above, and the server side separately,
this can not bring benefits to client users. So in this section, as shown in Figure 4-1, by
caching within the network, we aim to reduce traffic load on the network while
simultaneously reducing the access load of the server, and offer possibilities for a user
to improve total response.

69
Fig. 4-1 Proactive caching network architecture
Client
Network Cache
NetworkCache
NetworkCache
NetworkCache
Server
Congestion
Layer 8switch
Congestion
Mirror server

70
4.2 Load balancing technologies
4.2.1 Load balancing network and redirect method
The load balance network in real is configured with a switch that can process the
protocol at the application level and re-direct operations (Figure 4-2).
As Figure 4-3 shows, the switch to analyze a URL by re-direct, in other words,
snatch TCP flow of the HTTP, and judge if the cache server has contents with even a
small possibility and work to turn the flow to the cache server, is called a Layer 5 or
Layer 7 Switch [37]. (This kind of caching is called transparent caching.) If the cache
server responds with a mis-hit, it will perform a proxy operation.
In this case, a delay by the TCP connection relay may be a problem. A Layer 7
switch must be a TCP relay switch that terminates the TCP once for URL analysis and
from the switch resets the cache server, then the cache server sets the TCP to the
destination (Figure 4-2); this creates both a communication processing overhead and a
bigger delay.
In other words, problems are caused by the combination of a Layer 7 switch and
the cache server unable to control delays caused by an increase in the number of TCP
relays and pre-fetch traffic, which will be described in detail later. Correspondingly, in
Section 4.3.3, a new switch to solve this problem will be proposed.

71
Fig. 4-2 Load balance and redirect
Fig. 4-3 Redirect
Client
Mirrorserver
Cache
Server Congestion
Forwardcache
CongestionL7
L7Reverse
cache
Proxyserver
Disk
Disk
Distribution URLindex
Proxy OperationsProxy OperationsProxy OperationsProxy Operations
SwitchSwitchSwitchSwitch
Cache Se rve rCache Se rve rCache Se rve rCache Se rve r
Cache S er v e rCache S er v e rCache S er v e rCache S er v e r
Except Httpex. Telnet、POP Http
: TCP Con
Connection
URL index

72
4.2.2 Mirroring and caching
Originally, mirroring was used as method to provide contents while avoiding
overload to the server and net congestion, Digital Island [38], Akamai [39] are famous
services. Mirroring avoids an increase of traffic caused by accessing servers in the far,
by locating a copy of the content description near the user, and using a DNS operation
that will be described later. The “Near” and ”Far” used here are defined as follows.
“Near” can better satisfy conditions in a shorter response time. For example, it can be
defined as near if the server 3 hops away on a 150M bps line has a shorter response time
than a server 2 hops away on a 64K bps line. Mirroring by distribution has a very high
load reduction effect, and an improved response time can be expected by decentralizing
the servers with a copy near the users.
However, mirroring is not possible when people flock to contents that have not
been predicted on the server side. For example, when access is over a short period or
during a sudden burst such as when a popular website introduces daily news, TV, or a
bulletin board, it is almost impossible to predict which contents to mirror. And in P2P
(Peer to Peer) transmissions as are being discussed by napstar [40], gnutella [41] etc,
you cannot predict which servant (server and client) the traffic will focus on at all. It is
also impossible to balance the load by mirroring.
On the other hand, caching can reduce extreme loads that occur suddenly, as
noted above, because it automatically decentralizes the arrangement of the most popular
contents, in other words, where access is concentrated. First, we will categorize the
original caching method, and evaluate on its cons and pros.

73
4.2.3 Caching method
Caches can be functionally categorized into two - the forward cache and the
reverse cache.
The reverse cache is mainly located as the preliminary step of a server group
such as server farm etc, and the access request is backlogged just before server (Figure
4-2). It can effectively use the CPU resources to retrieve that static contents such as
un-animated images, text, etc., that are processed by the cache server, and process
script-type, dynamic contents etc., which are impossible to cache, on the server. In such
cases, it is common to locate them on the server side between the network and access
link server because there is no advantage for the net side, even though it is at the
network edge. Thus, it can reduce traffic to server in itself, but does not attempt to
reduce traffic of the link connecting the network and server. Furthermore, its weakness
is that it cannot avoid a deteriorating response if congestion occurs at the access link.
On the other hand, a forward cache is mainly used on the Net edge near to the
user, mainly through a proxy server or transparent cache as shown in Figure 4-2.
Forward caching is usually located within the Net to reduce traffic in the network as it
reduces traffic exchanged between far location servers. The response time will be very
good because it is near the user when the cache is hit.
Adversely, because access goes to the original server when it isn’t hit, traffic is
concentrated on one part of the network as the load is focused to the original server.
Furthermore, as shown in Figure 4-3, because the cache server always redirects, delays
will be bigger when mis-hits are set with a relay TCP Connection. Especially on the
Web it is said that the volume of most transmissions of download contents is in the
several Kbytes per TCP session, which is called short-lived traffic [42], so TCP
connection delays are often at the same level as content transfers.

74
Thus, by reducing mis-hits is the key to improving response when using a cache.
This is done by pre-fetch. Pre-fetch operation of a cache is noted below and its weak
points are discussed.
4.2.4 Pre-fetch for caching
Here, conventional pre-fetch technology and its problems are discussed.
Caching is advantageous when distributing contents, but its effect determines
caching performance, in other words, the hit ratio. Hit ratio is defined as ratio that the
cache can answer a request. To raise the hit ratio, contents that have a high possibility of
being accessed are cached. Normally, when the maximum hit ratio of cache is low, its
upper statistics are 40%-60%. One way to raise the hit ratio is by pre-fetch.
There are two main ways of Pre-fetch. One is pre-fetching in order to refresh,
preventing the cached contents from getting old, in expectation of their use in the future.
The other is pre-fetching in order to analyze related links and foresee a request before it
is actually made by a client.
According the literature [43], latency can be reduced by 45% when pre-fetching
is performed by the client himself. And, latency can be reduced up to a maximum of
60% when perfect caching and pre-fetching by the cache server is assumed [44]. But
since pre-fetching causes traffic, it can also be said that pre-fetching is a reverse
technique by basically increasing the improved response to traffic. Generally, an
increase in traffic increases the possibility of queuing delays and packet disposal by
resend. Hence, for pre-fetch to be considered advantageous, traffic must be light at the
start or pre-fetch must have a very high efficiency.
Thus, efforts are being made to raise pre-fetch efficiency. One method is to
predict future access with higher precision. Methods like server side pre-fetch and client

75
side pre-fetch are employed, but accurate prediction of objects that have never been
accessed before is difficult when the user is accessing new pages one after another.
Raising efficiency has its limits. Furthermore, increasing unnecessary traffic on the Net
may occur instead.
Especially, speculative pre-fetch raises burstiness, causes queuing in the network,
and deterioration of the response [46]. To rectify this, it is necessary to control the rate
of pre-fetching, and in turn reducing traffic burstiness to a level lower than that without
pre-fetch. There is also the possibility of negating the effect of the cache when the client
aborts access via cache server and uselessly accesses the Web server by the cache server
[47]. This phenomenon can be seen when cache server performs a pre-fetch. To avoid
this, pre-fetching needs to control the rate and abortion process.
In conventional techniques, controlling the rate is needed to guarantee prefetch
validity, but what is essentially needed is to realize the favorable utilization of the
network. This is not necessarily limited to controlling rate.
As stated above, conventional caching techniques have a negative side such as
increasing traffic and consequently when trying to improve the response by pre-fetch
may actually result in a worse response, but these weaknesses are caused by cache
servers pre-fetching independently of the network. In the next Section, techniques that
organically combine the Net and cache to solve these weaknesses are discussed.

76
4.3 Proactive caching network
4.3.1 Resource engineering
As stated in the previous section, in order to solve conventional problems, and to
realize WWW access with a good end-to-end response, the following are needed.
1: Increase the optimum distribution of dynamic contents that use caching,
2: Perform pre-fetch caching that reflects the traffic condition of the whole
network,
As a practical method to realize this, we propose a system and method that
applies a caching technique within the network to distribute dynamic contents, and
perform cache operation based on traffic conditions.
As a component to realize a resource engineering that uses network caching,
there are cache servers and switches but each must understand traffic conditions of the
network and the positional information of the original server, and use it effectively. This
realistic method is called resource engineering because it is manages the resources of
the whole network; not just the traffic engineering of network but also the engineering
of its contents at the same time.
The method shown below uses network caching as a practical method of
resource engineering.
4.3.2 Proactive caching
By network caching, the pro-active caching performs a cache operation that
doesn’t load onto the Net, but in cooperation with it, rather than performing the usual
cache operation independently of the Net. Some methods are described below.

77
Fig. 4-4 Proactive caching
[Route/Server Selection]
When a mis-hit, or pre-fetch operation is performed, instead of pre-fetching the
fixed upstream cache server, a server is chosen from among the server group, including
any mirror servers, that can download most effectively at the point in time when the
pre-fetch is to be performed. The best server is determined by considering how near the
server load and server are, and the degree of congestion of the pass. In conventional
methods, there is a method that refers to the utilization ratio of the link and the
connected cache [48], and another that uses RTT (Round Trip Time) and hop number
Route A
Route B
Relay server: store and forward
Local informationmay NOT suggests the best path
Used for normal traffic
Unused bandwidth is usedfor cache-cache deliveryLink
bandwidth
time
QOS-routinginformation
A
B
C Network
Cache
Layer 8 switch

78
[49]. However, in the first case, it only looks at a part of utilization ratio of the link in
the pass. And the other only receives congestion information on the pass that it is using
at the time, and cannot receive the availability of other links on the net, so it is
ill-informed to choose a route and server. Therefore, we propose a method to process
information from the routing protocol, such as the extended OSPF, considering QOS
information by the cache server or switch connected to the cache, and choosing the
route or server based on this information (Figure 4-4).
[Traffic Priority]
In assuming that user response time should be first considered, data transmission
of a pre-fetch is assumed to have a lower priority when compared with data
transmission of a cache mis-hit. Thus, the cache server should perform data
transmission in consideration of priority. Furthermore, the problem that predictive
pre-fetch raises access burstiness, causing queuing in the network, and deteriorating of
the response [50] is noted, but for this problem as well, by lowering the priority of
pre-fetch traffic, a reduction in burstiness as seen from other traffic can be expected as a
result.
[Store and Forward by the Relay Server]
Pre-fetching does not require real-time, so the usability of whole net can
increase by transmitting when load is low. When there are plural links in the pass
between caches to transmit the contents, conventional real-time transmitting such as
Differentiated Service, transmission starts after confirming the entire link band at the
same time, and needs to have all the links on the pass vacant, but in this proposed
method, transmission can be done when there is a partially vacant band in the pass. The
proposed method uses the cache server (Contents Relay Server) in the route as shown in

79
Figure 4-4. The server gathers the contents transmitted between caches temporarily, and
forwards the gathered contents by checking the link condition of the forward side. For
example, when there is the relay server (B) on the route between the transmitting server
(A) and the receiving server (C), the transmission of the contents from A is done by
confirming a vacant band in the link between A and B; the transmitting from B to C will
also be done in the same manner. It is possible to renew the cache of B at that time. In
this method, transmitting can be done if there is a vacancy in the band of the link to the
relay server. More effective use of the network is possible than by conventional means.
[Contents Routing]
To effectively use the network, circulating traffic according availability of the
network is needed. In the expanded form of conventional routing, QOSPF (QOS-OSPF)
is becoming standardized by IETF etc. But since short-lived best effort traffic is targeted
here, route flapping chooses the best route based on the congestion information at that
specific time, so if traffic is concentrated on one route, another route is immediately
chosen. This circumventing is generally difficult. And when the cache has a mis-hit, a
way to choose the server when multiple conventional servers exist is important in order
to shorten the response. Although some options can be thought of, only by using the
DNS, the appropriate server can be chosen by taking into account the actual conditions.
For example, one method is to sort appropriate servers for a client by using its IP
address as a clue for the DNS (FQDN) requests. At that point in time, the DNS server
route, even without knowing the location of the client, and the traffic condition of the
network around the client, static sorting is still done to a certain level no matter what the
conditions of the net are. Next, in consideration of the circumventing of the route
flapping, expanding the DNS function, and the network availability conditions, a
protocol that responds to the FQDN dynamically is used.

80
4.3.3 Layer 8 switch
A switch that realizes the prediction functions (called Layer 8 Switch) is
proposed to operate resource engineering used in network caching. As shown in Figure
4-5, the Layer 8 Switch functions as a cache server with pro-active functions, and the
ability to terminate the TCP, extracting the URL, and forward the HTTP request.
Regarding conventional Layer 7 Switch, it was noted in Section 4.2.1 that delays
caused by the increase in the number of TCP relay columns can be problematic, and
Section 4.2.3 pointed out the problem of traffic increase caused by pre-fetch, but Layer
8 Switch has a cache function in the switch, and as noted in Section 4.3.2, and has
solved these problems by a pro-active pre-fetch operation.
The operation of the Layer 8 Switch is as below. The cache server function
within Layer 8 Switch exchanges content information with other cache servers by using
the ICP protocol etc, and gains topology and congestion information of the network
from the QOS expanded routing protocol. Based on this information, the URL
forwarding table is dynamically updated. The URL forwarding table is the table that is
displayed to which the HTTP request for each URL should be forwarded, contains
expired information etc. of each URL, and pro-actively operates pre-fetch, etc., using
congestion information. Of course, it can easily access to the cache contents in its own
switch by memory reference etc., within the equipment without using TCP, reducing the
number of TCP relay columns, and possibly improving the response.

81
Regarding the architecture of the Layer 8 Switch, for example, a cache function
is installed on the server card in the switch, and the forwarding function is on the line
interface in the switch. Software processing is done using the processor on the server
card until analysis of the URL, which was noted above, but once deciding which cache
server to forward to, it can shift to high-speed transmission by the hardware in the line
interface.
Fig. 4-5 Layer 8 switch
Disk
DiskDistribution
URLIndex
Layer 8 switch
CacheSever function
Except Httpex. Telnet、POP
Http : TCP Connection
Congestion information
BestRoute informationBestPre-fetchtiming
: Internal communication
Disk
DiskDistribution
URLIndex
Layer 8 switch
CacheSever function
Except Httpex. Telnet、POP
Http : TCP Connection
Congestion information
BestRoute informationBestPre-fetchtiming
: Internal communication
: Internal communication

82
4.4 Simulation results
4.4.1 Simulation model
Proposed method is here evaluated by computer simulation. Because proposed
pre-fetch caching is supposed to be done only when networks are not congested, both
low miss-hit ratio and low latency for miss-hit retrieval due to well pre-fetching and less
congestion in network, respectively, are expected to be achieved. Three models are
compared; (1) no pre-fetch: neither user nor network does pre-fetch, (2) greedy
pre-fetch: user or network pre-fetch regardless of network congestion, and (3) proposed
pre-fetch with traffic smoothing: pre-fetch is only performed when network is not
congested. Since it is difficult to construct a general model of Web traffic, a set of real
measured traffic data is used as a simulation input. The data set was originated from
NEC laboratory with access logs in the proxy cache server, and was collected in the
period from 2003/3/1 to 2003/3/7.
User response time is set as a performance measure. We can vary bottleneck link
bandwidth. From the cache log, throughput of a contents retrieval is calculated from file
size divided by processing time if the access results in cache-miss. Each Web page has
five links in average with binominal probability distribution. This number of links was
derived from a calculation where volume of waste pre-fetch traffic must be twice as
large as real used traffic. The scheduling of (3) is controlled with keeping throughput of
the pre-fetched traffic is controlled keeping under a certain fraction of the link
bandwidth as shown in Fig. 4-6.

83
Fig. 4-6 Proposed pre-fetch scheduling
4.4.2 Results and discussions
The simulation results show that good user response time can be achieved
without network congestion. Table 1 and Fig. 6 shows user response time between three
algorithms. In Table 4-1 and Fig. 4-7, (1) no pre-fetch, (2) greedy pre-fetch, and (3)
proposed pre-fetch with traffic smoothing. Bottleneck link bandwidth varies from 100%
to 3.3%. As the value decreases, response time increases. Note that (2) greedy pre-fetch
has poor result when bandwidth is small because the mechanism causes congestion by
means of its pre-fetch traffic. The reason is proved in Table 4-2 and Fig. 4-8. In the
table, cache hit ratio is shown and both models (2) and (3) have done effective
P3
(33.6)
time
bytes
traffic volume monitored in
a unit time
P1
(33.6)
P2
(7.2)
queue for pre-
fetch access
control objective
M=100
expected volume for
previous per-fetch
B=50
if P≦∑Xi,
then Xi can go.
bytes for
alloable pre-
fetch
P=M-B=50
pre-fetch
access
Ex. P=50, then P1,
P2 can go out

84
pre-fetching. In this simulation, the scheduling of (3) is controlled with keeping
throughput of the pre-fetched traffic is controlled keeping under 40% of the link
bandwidth.
As shown in Fig. 4-7, proactive caching model achieve about 40% better
response time compared with no pre-fetch and greedy pre-fetch model.
Table 4-1 Response time (sec)
Link bandwidth 3.3% 10.0% 16.7% 100% (1) no pre-fetch 6.69 1.97 1.48 1.15 (2) greedy pre-fetch 10.46 1.95 1.32 0.97 (3) pre-fetch with scheduling
6.44 1.71 1.24 0.97
Table 4-2 Hit ratio (%)
Link bandwidth 3.3% 10.0% 16.7% 100% (1) no pre-fetch 0.53 0.53 0.53 0.53 (2) greedy pre-fetch 0.66 0.70 0.71 0.72 (3) pre-fetch with scheduling
0.59 0.67 0.69 0.72

85
Fig. 4-7 User response time
Fig. 4-8 Cache hit ratio
0
2
4
6
8
10
12
3.3%
6.7% 10.0% 13.3% 16.7%
sec
(1) no pre-fetch
(2) greedy pre-fetch
(3) pre-fetch with scheduling
50%
55%
60%
65%
70%
75%
3.3% 10.0% 16.7% 50.0% 100.0%
(1)�no pre-fetch
(2) greedy pre-fetch
(3) pre-fetch with scheduling

86
4.5 Conclusion Considering the situation the Internet, a network developed as best effort
network focused on QOS improvements rather than QOS guarantees. In addition to this
improvement of both packet level QOS and user level QOS such as throughput and
contents retrieval time must be achieved, instead of packet level QOS guarantee.
Since Web must be a today’s most popular application, it is reasonable to focus
Web application as to improve user level QOS. Web QOS can be measured with the
latency for the web contents shown up on a user browser. That is, delays that are usually
felt by users are the sum of the delays in the network and server, which are due to
problems in the network, or problems with the server.
A method to locate a cache in the network and a network architecture that uses a
pro-active cache switch that can balance traffic control in the net and caching is
proposed. By the proposed method, improving the response time not only of the specific
servers but also the entire WWW transmission in the network is possible.
The aim of pro-active cache network is a dynamic autonomous load balance, and
the effective use of the network by considering the circulation of contents at a specific
time, in other words, resource engineering. In this thesis, we introduced a framework for
a resource engineering method and a partial actual method. Then, we evaluated a
pre-fetch model as a proactive caching instance, and showed that the proposed pre-fetch
with traffic smoothing; pre-fetch is only performed when network is not congested, can
achieve both low miss-hit ratio and low latency for miss-hit retrieval. This reveals that
use response time can be 40% smaller than that of conventional models.
In conclusion, the author would like to express our appreciation to colleagues in
NEC for their helpful suggestions during this research.

87
CHAPTER 5 TCP OVERLAY NETWORK ARCHITECTURE AND TCP
CONTROL
5.1 Introduction The quality of the “best-effort” class internet service has become increasingly
less expensive. Yet, quality control that is cost effective for particular customers who
desire high quality is now in need. This thesis proposes TCP-based overlay network
architecture, and discusses the possibility of new services.
With the spread of connection environments such as ADSL, optical fibers, and
FTTH, today’s networks are able to maintain a user-side communication bandwidth of a
few megabits per second to several tens of megabits per second. Nevertheless, in actual
communication, the communication bandwidth cannot be sufficiently utilized. One of
the reasons for this is the special characteristics of TCP communication which is
dominant of the Internet traffic. Because the TCP communication throughput is mainly
determined by the network RTT (Round Trip Time) and packet loss rate [51], any
throughput higher than that throughput cannot be achieved, even with a broadband link.
An overlay network based on TCP proxy technology, thus, has been proposed as to
solve this problem [52].
While normal communication is achieved using a single end-to-end TCP loop,
TCP proxy communication is achieved by dividing the end-to-end TCP loop into
multiple TCP loops. With the TCP loop divided, each TCP loop receives the full benefit

88
of, for example, (1) an small RTT, and (2) a small packet loss rate, thereby improving
the TCP communication throughput.
Nevertheless, the problem exists that even though the theoretical throughput of
TCP proxy communication found from the RTT and packet loss rate should be
multiplied that of normal communication, the expected value is not achieved by simple
TCP relaying. This problem originates in the TCP rate control algorithm. The TCP
algorithm, in broad terms, consists of operations that result in rapid rate drops and
operations that result in gradual rate climbs. Compared to the amount of time required
for the rate to drop, the amount of time required for the rate to be restored is extremely
long. When the TCP proxy buffer becomes full, the upstream (receiving side of the TCP
proxy) TCP transmission rate drops and, because the transmission rate cannot rapidly
increase even if sufficient buffer space becomes available, TCP relay buffer overflow
causes performance degradation. A full TCP reciever buffer on the side of the receiving
terminal does not readily occur such buffer full with conventional communication
methods that does not relay the TCP. This is because the applications that use the data
normally load and process the data from the buffer at sufficiently high speeds.
In comparison, communication methods that relay the TCP involve a TCP proxy
buffer that decreases in availability according to the transmission rate of the
downstream (sending side of TCP proxy) TCP loop. When there is congestion
downstream that causes a sharp drop in the downstream transmission rate, the loading
rate from the buffer also drops, thereby increasing the possibility of overflow of the
proxy’s TCP receiver buffer. Due to such differences in the buffer loading mechanism,
TCP proxy buffer overflow has become a serious issue with regard to its adverse effect
on throughput.

89
This thesis takes into consideration measures that will solve this problem and, in
an effort to maintain TCP friendliness, adopts a method which does not involve
modifications to the TCP algorithm itself.
To summarize the above, while communication methods that relay the TCP
offer better performance due to advantages such as (1) an small RTT, and (2) a small
packet loss rate, when upstream degradation in throughput occurs as the result of
downstream congestion caused by a full proxy receiver buffer, the theoretical rate
cannot be fully achieved. This thesis proposes a measure for improving throughput
while maintaining TCP friendliness.
This chapter first describes architecture of TCP overlay network, then the basic
nature of TCP proxy (hereafter called TCP Bridge) communication and the problem
regarding the decrease in proxy communication performance with respect to the
theoretical value. Comparing conventional method, we propose a stealth buffer control
method, i.e. a proxy congestion control algorithm, to solve the issue. Lastly, this chapter
evaluates the proposed method through simulation and prototyping, thereby illustrating
the method’s effectiveness.
5.2 TCP overlay network
5.2.1 Architecture
[Problems in current network with conventional traffic control mechanism]
There have been many approaches to providing quality of service, such as the
IETF standards Diffserv and IntServ. Nevertheless, these approaches are problematic
since they involve layer 2 or 3 technologies, which comprehensively drive up all switch
and router expenses in contradiction to the lower cost demanded by users who do not

90
necessarily desire high quality. While innovative methods such as active nets have also
been proposed to iron out this problem, issues related to the time required for migration,
for instance, still remain.
[TCP Overlay network]
This thesis proposes a network architecture that, taking into consideration
realistic migration and cost effectiveness, provides enhanced quality of service by
realizing the minimum quality of service features using the existing network and then
constructing on top of that network an overlay network which performs TCP relay
(Figure 5-1). The proposed architecture performs communication by terminating the
conventional end-to-end based TCP session at an appropriate spot in the network and
then reestablishing connection. The flow relayed in the network at the time is based on a
flow control format that reflects the quality demanded.
[Advantages of TCP Overlay network]
By implementing window flow control on the side of the network, the proposed
method makes it possible to provide fair-share bandwidth services, a larger number of
quality control services for services that, for instance, maintain bandwidths, and
improvements in network reliability, such as illegal flow detection and elimination
The above-described effects can be achieved by implementing specific TCP
flow control at the relay point of a flow that passes through a congested node, thereby
eliminating the need for direct control using the device such as an ether switch or router
that is the congested node. Consequently, the advantage for TCP layer based control is
that the cost increase that results from comprehensive replacement of all user-required
router and switch functions is not necessary. That is, by facilitating deployment of
required locations only and by enabling gradual increases in scale in response to service
demands, this method is a practical method with superior cost performance.

91
Furthermore, this method does not involve any changes to the existing terminal
interface, including the TCP itself, thereby enabling terminal communication after
proposed network introduction using the same conventional method. Additionally,
while there have speed-related problems with TCP termination to date, chips that
perform TCP termination at a speed of 10 Gbps or higher have been announced in
recent years, increasing the potential for realization of multiple high-speed TCP
termination within the network.
[Differences from Conventional Overlay Networks]
The main purpose of conventional network TCP termination methods was either
to provide a security service using the upper layer, i.e. the application layer, or to
guarantee connectivity with existing protocols and improve link layer communication
special characteristics. Conventional methods such as SOCKS proxy and HTTP proxy
of the proxy system or mobile TCP gateway of the protocol conversion system were
designed to actively control quality, with only a few of these methods performing TCP
termination.
Designed with the purpose of active quality control, the proposed method, on the
other hand, actively performs quality control for both wired and wireless systems,
facilitating ISP construction of new quality services for users.
5.2.2 New services for TCP overlay network
With use of this TCP overlay network, realization of various services that were
difficult cost-wise using conventional layer 2 or 3 network control can be expected.
Examples of such services are described below.
(1) Quality differentiated services: (i) Though the guarantee of absolute quality
similar to Diffserv/IntServ is difficult, the potential for relative quality differentiation
[54] that is not dependent on layers 2 or 3 is possible, (ii) Small end-to-end delay due to

92
the short RTT and using optimum TCP between the TCP Bridge is possible. (iii) A
LAN-WAN seamless service that achieves optimum throughput without terminal
knowledge of the geographical location of the party terminal by relaying the TCP tuned
to LAN to a wide-area VLAN.
(2) Network monitoring service: An accurate charge for volume of packets
(goodput) [53]; Illegal TCP detection and elimination, including DOS attack
countermeasures.
5.3 Congestion control in TCP Bridge First, we focus and try to solve the problems; while communication methods that
relay the TCP offer better performance due to advantages such as (1) an small RTT, and
(2) a small packet loss rate, when upstream degradation in throughput occurs as the
result of downstream congestion caused by a full proxy receiver buffer, the theoretical
rate cannot be fully achieved.
A simple description of the TCP Bridge (TCP proxy) communication
mechanism which enhances throughput is given below (Fig. 5-1).
Fig. 5-1 TCP proxy communication
Normal TCP CommunicationNormal TCP CommunicationNormal TCP CommunicationNormal TCP Communication
TCP Proxy CommuTCP Proxy CommuTCP Proxy CommuTCP Proxy Communicationnicationnicationnication
Sending terminal Receiving terminal
Sending terminal Receiving terminalOrdinary TCP connectionOrdinary TCP connection
TCP relay connectionsTCP relay connections
TCP Bridge

93
The upper and lower diagrams of Figure 5-1 illustrate normal TCP
communication and TCP proxy communication, respectively. The TCP theoretical
communication throughput B(p) is, according to reference [53] in the bibliography,
generally found as follows:
(5-1)
Where, the unit for B(p) is pps (packets per second), p is the packet loss rate,
RTT is Round Trip Time, Wmax is the receiver buffer volume and To is the timeout
wait time.
The left term in the above equation is predominantly determined by RTT and the
packet loss rate p, and the right term – which is generally referred to as the bandwidth
delay product – is determined by the TCP receiver buffer capacity and RTT. Here, the
receiver buffer capacity is an item that can be determined by the user and, assuming that
a buffer can be sufficiently prepared, throughput is determined by the right term in the
equation. For this reason, when TCP is relayed as illustrated in Figure 5-1, both RTT
and the packet loss rate p decrease, thereby improving throughput B(p).
5.4 Buffer control mechanism
5.4.1 Conventional method
TCP proxy communication enables improvements in throughput. Depending on
the network environment, however, the problem exists that the rate does not improve to
the extent of the theoretical value found from RTT and the packet loss rate. The cause
of this discrepancy is related to the proxy transmission and receiving process. This
section explains the cause of rate decreases due to this processing.
B(p)=RTT
1
32bp + To min(1, 3 )p(1+32P)
83bp 2
Min( , )RTTW max

94
With TCP proxy communication, data is sent from the sending terminal and
temporarily accumulates in the buffer of the next proxy. The next TCP sends the data
accumulated in the proxy buffer to either the next proxy or the receiver terminal. If the
receiver buffer of the proxy or receiver terminal is full, the operation described below is
performed through TCP congestion management.
Figure 5-2 illustrates the operation performed when the receiver buffer is full.
Fig. 5-2 Operation when receiver buffer is full
This operation occurs when the residual space in the TCP receiver buffer
reaches zero. At this time, the terminal to receive TCP communication notifies the
sending terminal of the zero status using an advertised window. The sending terminal
sends the minimum (congestion window or advertised window) amount of data and
stops transmission when it receives the zero advertised window.
There are two types of triggers used to restart communication. The first is a
notification from the receiver terminal that communication is possible. The moment
space becomes available in the TCP buffer, the receiver terminal sends a window
reopen signal (advertised window ≠0 in ACK), thereby indicating that data receiving
is possible. The second is a probe signal from the sending terminal. After
communication stops due to the zero advertised window, the sending terminal sends 1
Sending terminal
TCP Bridge
Receiving terminal
NW1 NW2
congestion
Receiver buffer
Space available
Window reopen message
Sending terminal
TCP Bridge
Receiving terminal
NW1 NW2
congestion
Receiver buffer
Space available
Window reopen message

95
byte of data every 5 seconds to the receiver terminal to check the terminal status. When
the sending terminal receives a window reopen signal from the receiver terminal,
communication begins once again [55].
Regardless of the trigger used, problems related to the TCP congestion control
algorithm, such as those described below, occur.
Method 1: Receiving Side Sends One Reopen Signal
In this method, the TCP receiver side sends one window reopen signal when
space in the TCP buffer becomes available. The problem, however, is that when ACK
of the window reopen signal is discarded in the network, there is no means for restarting
communication immediately. Even though communication does not stop completely
since the sending side issues a probe signal every 5 seconds, because communication
does stop for those 5 seconds, throughput deteriorates greatly.
Method 2: Receiving Side Sends Multiple Reopen Signals (BSD OS [56])
In this method, the TCP receiver side sends multiple window reopen signals
when space in the receiver buffer becomes available. In contrast to Method 1, this
method does not result in a 5-second suspension of communication since the next
window reopen signal arrives at the TCP sending side if the first reopen signal is
discarded. However, when space in the receiver buffer becomes available, the receiver
terminal sends an ACK of the same ID over and over again, causing the sending
terminal to regard these ACKs as duplicate ACKs. The TCP sending side assumes the
packet has been discarded and decreases the congestion window by half. Once the
congestion window decreases, TCP cannot increase the size rapidly even when space
becomes available in the receiver buffer. As a result, throughput deteriorates.

96
With BSD, after notification of the zero advertised window, communication
restarts using a congestion window of half the previous size.
Method 3: Receiving Side Sends Multiple Reopen Signals (Linux OS)
In this method, the resulting behavior is basically the same as Method 2.
However, with Linux, the size of the congestion window at the time communication
restarts depends on the amount of time communication was suspended after the sending
side received the zero advertised window. With Linux, the congestion window
decreases by half each time a certain amount of time passes after communication
suspension. Furthermore, when communication does restart, duplicate ACKs are
received, causing the congestion window to decrease by half once again. As a result, the
degree of throughput deterioration is greater than that of the BSD OS.
With Linux, after notification of the zero advertised window, communication
restarts using a congestion window of half the previous size or less (time-dependent
factor).
In this manner, while TCP detailed behavior varies according to OS, when the
receiver buffer becomes full TCP throughput deteriorates to half or less.
The frequency at which the receiver buffer becomes full when proxy
communication is not performed is high since the rate at which the data in the receiver
buffer decreases is dependent upon the application speed of the terminal. However,
when proxy communication is performed, the data in the receiver buffer decreases at a
rate that is more dependent on the bottleneck rate of the destination network than that of
the proxy. Consequently, the frequency at which the receiver buffer becomes full is

97
greater with TCP proxy communication, and this high frequency is conceivably the
cause of rate deterioration.
To resolve the receiver buffer problems described in the previous section, i.e. to
prevent decreases in throughput, this thesis proposes a method (stealth buffer,
hereinafter referred to as “s-buffer”) which adjusts the window size to be advertised on
the TCP receiver side. The purpose of this method is to decrease to the extent possible
the number of times the receiver buffer overflows (becomes full).
The prerequisites of the proposed method were as follows: The proposed method
was to realize improvements in performance by devising a TCP proxy buffer
management method without tinkering with the sending terminal or receiver terminal.
To this end, one of the advantages of TCP proxy communication is that throughput
improvement can be realized by simply inserting a proxy in the network without
modifying the terminals. The proposed method, therefore, was to involve changes to the
TCP proxy buffer management method only without requiring any user changes.
In conventional methods, the sending side is notified of the total receiver buffer
space capacity using an advertised window (Figure 5-3). With this type of management
method, the receiver buffer instantly becomes full when the congestion window opens
up. When the receiver window becomes full, the congestion window decreases to half
its original size or less. With TCP, once the congestion window decreases due to the
control algorithm, the congestion window cannot be restored rapidly even when the
amount of receiver buffer space and, consequently, the advertised window size increase.
This causes the transmission rate to decrease.
5.4.2 Proposed method
To avoid the problems of conventional methods, the proposed method eliminates
the instantaneous filling of the receiver buffer by using an advertised window value that

98
is smaller than the conventional value (Figure 5-3). By reducing the size of the
advertised window in this manner, the method reduces the number of times a zero
advertised window is sent to the TCP sending terminal, thereby preventing congestion
window decreases.
Figure 5-3 shows in graph format an example of the advertised windows for
both the proposed method and convention method when the maximum value of the
receiver buffer is 60MSS. The horizontal axis and vertical axis in the graph indicate the
amount of receiver buffer used and the advertised window value at that time (solid line:
conventional method, dashed line: proposed method), respectively. The unit of
measurement for both the vertical and horizontal axes is MSS (Maximum Segment
Size).

99
Fig. 5-3 Advertised window values in proposed method and conventional method
In the proposed method, the value assigned to the advertised window is that
described below.
First, threshold X is set, parameter Y is defined and the receiver buffer space
capacity Z is assigned.
When Z > (X+Y):
Advertised window = Z - X
0
10
20
30
40
50
60
0 4 8 12 16 20 24 28 32 36 40 44 48 52 56 60
used receiver buffer size [MSS]
adve
rtiz
ed
win
dow
siz
e[M
SS]
Conventional Proposal

100
When Z < (X+Y) and Z > Y:
Advertised window =Y
When Z < Y:
Advertised window =0
5.3.3 Comparison
The purpose of this method is to suppress the decrease in throughput on the TCP
proxy receiver side. The proposed method reduces the number of times the receiver
buffer becomes full, thereby preventing the rate of the TCP loop on the data sending
side from decreasing to a value lower than that of the proxy. That is, the proposed
method is effective when there is a bottleneck between the data sending side and proxy
that causes the receiver buffer to become full frequently, i.e. when a packet loss rate
exists at a certain level.
Conventional methods always indicate the maximum value in the advertised
window, resulting in the risk of a decrease in the congestion window on the sending
side. Conversely, the proposed method performs communication by temporarily
decreasing the size of the advertised window, but without decreasing the size of the
congestion window. Although an instant increase in the advertised window size is
possible, increasing the size of the congestion window takes time. The proposed method,
which uses the advertised window to control the rate and prevent decreases in the
congestion window size, is more capable of maintaining a high communication rate.
Table 5-1 summarizes the characteristics of the conventional method and the
proposed method.

101
Table 5-1 Conventional Method and Proposed Method Characteristics
Conventional Method Proposed Method
Advertised window Indicates max Less than max
Congestion window Easily reduced Easily maintained
The proposed method involves two parameters: the receiver buffer threshold X
and the amount Y that is communicated when the receiver buffer space decreases to a
value less than or equal to the threshold.
The threshold X affects the apparent total buffer amount. This is because when
the receiver buffer is empty, the value notified is equal to “Reception buffer amount –
X.” When this value is less than or equal to the bandwidth delay product, performance
peaks at that value. For this reason, the threshold set should be a value greater than or
equal to the bandwidth delay product.
The parameter Y is the amount notified when the amount of space in the receiver
buffer has decreased. The value set should be greater than or equal to 3MSS, and should
be higher for networks with a higher packet loss rate. If the value is set to 2MSS, for
example, when one or more packets are lost during communication when the buffer size
is less than or equal to the threshold value, a timeout error occurs. Normally, even if a
packet is lost, if the same ACK number subsequently arrives three times in a row, the
“fast retransmit” function is activated and retransmission is performed before the
timeout occurs. However, when parameter Y is set as 2MSS, duplicate ACKs are not
received three times in a row, even after a single packet loss, thereby resulting in
non-activation of the retransmit function and the system waiting for the timeout. Thus, it
is advantageous to set a value at a level greater than or equal to 3MSS.

102
Additionally, the amount of time that transpires without the occurrence of buffer
overflow during a period in which the receiver buffer is sluggishly decreasing is
determined by X/Y. This is because this value is equivalent to the number of times
communication is performed after the buffer decreases to a value less than or equal to
threshold X. This value is proportional to the number of times the proxy receiver buffer
becomes full. The above is summarized as follows:
Parameter X
Taking into consideration the window size to be advertised, a smaller value is
best. However, since a larger number decreases the number of times the receiver buffer
becomes full, there is a trade-off.
Parameter Y
To mitigate the loss between the sending terminal and proxy, a larger value is
best. However, since a smaller number decreases the number of times the receiver
buffer becomes full, there is a trade-off.
5.4 Simulation results The following section reports the results of a conventional method and proposed
method performance comparison study that was conducted using Network Simulator 2
(hereinafter referred to as “ns2”)[57].

103
Fig. 5-4 Network model of simulation 1
Simulation 1
Simulation was first conducted to study the basic nature of the proposed method
and therefore presumed a network such as that indicated in Figure 5-4. The conventional
method used for comparison purposes was that of a BSD OS (the congestion window
decreases by half when multiple ACKs are received after the receiver buffer becomes
full).
The presumed network consisted of a single TCP proxy in end-to-end
communication. Throughput was then measured while changing the Link 1 and Link 2
packet loss rates and the Link 2 RTT parameters. The results are shown in part in
Figures 5-5 and 5-6.
For the proposed method, 300KB – which is larger than the bandwidth delay
product – was set as the receiver buffer threshold (X), and 5MSS (>3MSS) as parameter
Y.
Sending terminal Receiving terminal
TCP BridgeTCP Bridge
RTT:fixed:1msec RTT:varied:10 or 20 msec
Link1 Link2
Receiver buffer500KB

104
Fig. 5-5 Performance improvement: RTT of link 2 is 10ms
Fig. 5-6 Performance improvement: RTT of link 2 is 20ms
0 0.01 0.01 0.05 0.1 0.51
0.05
0.3
0.7
2
0
0.2
0.4
0.6
0.8
1
1.2
1.4
1.6
1.8
2
performanceimprovement
ratio(proposal/con
ventional)
packet loss rate on Link 2
packet loss rateon Link 1
0-0.2 0.2-0.4 0.4-0.6 0.6-0.8 0.8-1 1-1 .2 1.2-1 .4 1.4-1 .6 1.6-1 .8 1.8-2
0
0.01
0.01
0.0
5
0.1
0.5 1 0.05
0.3
0.7
2
0.1
0.51
0
0.2
0.4
0.6
0.8
1
1 .2
1 .4
1 .6
1 .8
2
performanceimprovement ratio
(proposal/conventional)
Link2のロス率
packet loss rateon Link 1
0-0.2 0.2-0.4 0.4-0.6 0.6-0.8 0.8-1 1-1 .2 1 .2-1 .4 1 .4-1 .6 1 .6-1 .8 1.8-2
packet loss rate on Link 2

105
In Figures 5-5 and 5-6, the horizontal axis indicates the packet loss rate (%) of
Link 2, the vertical axis the packet loss rate (%) of Link 1 and the depth axis the
performance comparison (proposed method/conventional method).
Figures 5-5 and 5-6 show only the results achieved when RTT of Link 2 equals
10ms and 20ms. Nevertheless, the study confirmed the existence of a range in which the
proposed method is effective for all Link 2 RTTs tested (values less than or equal to
100ms, in units of 10ms).
Simulation 2
Next, the effect of the proposed method under realistic network conditions was
confirmed by simulation.
Fig. 5-7 Network model of simulation 2
In Simulation 2, an environment similar to LAN was established and a Link 1
RTT value of 1ms and a Link 2 RTT value of 50ms were presumed. This latter value
was used since it is the intermediate value between the Japan Tokyo – Osaka RTT
(approx. 30ms) and the US west coast – east coast RTT (approx. 70ms).
Sending terminal Receiving terminal
TCP BridgeTCP BridgeLink1 Link2
RTT:1msec RTT:50msecReceiver buffer
500KB
TCP BridgeTCP Bridge
Receiver buffer500KB
Link3
RTT:1msec

106
The proxy receiver buffer size was set as 500KB. While the receiver buffer
default value is normally 64KB, special units designed for proxies and high speeds use a
value between hundreds of KBs to several MBs. Because the TCP proxy is a special
device for relaying, the 500KB value – which is of the same level as that of special units
designed for proxies and high speeds - was employed.
Under such conditions, the Link 2 packet loss rate was set at about 0.01% within
the normal wired network range, and throughput was measured while changing the Link
1 (= Link 3) packet loss rate as shown in the table. The results are indicated below.
The parameters of the proposed method were the same as those used in
Simulation 1.
Fig. 5-8 Simulation 2 results
Simulation Results
0
5
10
15
20
25
30
35
0.1 0.25 0.5 0.75 1
Link 1, Link 3 Loss Rate
Thro
ugh
put
[Mbp
s]
Proposed method Conventional method
Method without proxy

107
Table 5-2 Simulation 2 results
Packet Loss Rate 0.1% 0.25% 0.5% 0.75% 1%
Proposed Method 30.1 28.6 22.2 16.6 11.0
Conventional Method 22.9 18.3 8.78 8.62 6.39
Without Proxy 3.19 1.77 1.18 0.957 0.710
The simulation results are shown in Figure 5-8 and Table 5-2. In Figure 5-8, the
horizontal axis indicates the Link 1 (= Link 3) packet loss rate. With these results, a
throughput comparison study was conducted between three methods: the proposed
method, conventional method and a non-proxy method (providing TCP end-to-end
communication using the network of Figure 5-5). In addition, the conventional method
employed was the BSD method. This method was chosen since the receiver buffer
problem results in a smaller rate decrease with BSD.
The results indicated that TCP proxy communication can greatly improve
throughput in comparison to communication performed without a proxy. Additionally, a
comparison between the proposed method and conventional method indicated that,
under simulation conditions, a performance level nearly twice that of the conventional
method (BSD) can be achieved. These results confirmed the effectiveness of the
proposed method.
5.5 Prototyping and evaluations To confirm the effect of the above-described proposed method in an actual
system, the proposed method was installed in UNIX and a simple evaluation conducted.

108
For the performance comparison, communication was conducted by inserting a
TCP proxy between two terminals in the same manner as the network of Figure 5-4.
Network conditions were established by placing a Network Emulator (NE) between the
TCP proxy and terminal. Under this environment, proxy communication was conducted
based on the proposed method and conventional method, respectively, and the results
were compared.
The results confirmed that a performance level equivalent to approximately
twice that of the convention method can be achieved in the effective range of the
proposed method
5.6 Conclusion This chapter addressed about TCP overlay network architecture and its
throughput performance issues, then proposed a TCP proxy congestion control
algorithm designed to improve TCP throughput, and described the results of proposed
method evaluation conducted through simulation and prototyping.
In order to deploy high quality communication mechanism into existing the
“best effort” internet, TCP overlay network is a desirable solution. TCP overlay
network can improve throughput performance and also can introduce many new future
services.
TCP Bridge (TCP proxy), however, must be careful to relay TCP
communications to prevent throughput degradation due to buffer overflow in TCP
Bridge. With conventional methods, congestion from downstream causes throughput
degradation upstream. Conversely, with proposed stealth buffer management, the
number of times the receiver buffer becomes full is decreased by restricting the

109
advertised window through proxy buffer management. The proposed method, therefore,
facilitates stable TCP relaying without decreasing throughput.
Results of ns-2 based simulation conducted to verify the effect of the proposed
method confirmed that the proposed method results in a performance level that is
approximately twice that of conventional TCP relaying. While the results are based on a
two-stage proxy system, the proposed method resolved the problems that occurred with
the proxy transmission/receiver buffer, indicating that the effect can be further improved
when the number of proxy stages is increased. Additionally, the operation and effect of
the proposed method were confirmed through prototyping.
Future plans include identification of a detailed method for determining each
parameter and clarification of the relationship between the number of proxy stages and
performance.
This work was partly supported by Ministry of Public Management, Home
Affairs, Posts and Telecommunications of Japan, for which the author would like to
express his gratitude.

110
CHAPTER 6 CACHING ARCHITECTURE FOR LONGEST PREFIX MATCHING IP FORWARDING TABLE SEARCH
6.1 Introduction With the increase in Internet traffic, acceleration of the backbone router is
increasingly demanded. In order to speed up the router, acceleration of the protocol
processing of the packet is needed. One area causing a bottleneck in the acceleration of
the packet processing is the search for the IP forwarding table to decide the output path
of packet. Because searching for the Longest Prefix Match (LPM) is needed when
searching for the IP forwarding table, conventional full match high-speed searching
methods such as hashing etc. cannot be used. Therefore, acceleration of LPM searching
is becoming an increasing challenge. Many attempts in acceleration have been
conducted in recent years, but while high speed searching is demanded, the search for a
high capacity table needs to be done at a low cost.
First, we will explain the LPM search method as previously suggested, and then
discuss weaknesses from the IP forwarding table capacity viewpoints. The IP
forwarding table in the Ipv4 backbone net that is widely used now consists of huge
entries over 64K, and the number of table entries is increasing daily. Furthermore, with
regards to the VPN (Virtual Private Network), when thousands of entries are prepared
for only hundreds of VPN users, it still needs to search for a high capacity table for
millions of entries alone. In order to search the high capacity table by LPM,
complicated algorithms and much calculation time are needed. For LPM searching, the

111
algorithmic approach and hardware accelerator (LSI chip) approach have been
suggested. For example, in the algorithmic approach like ones suggested in
reports[60][61][62], the algorithm is sped up by using a layered system of an IP address
that is actually in use and is characteristic of an integrated address space. In these
algorithms, it searches the tree by referring to the memory several times, so memory
access becomes bottlenecked and has a speed limit. On the other hand, as shown in
reports[64][65][66], in the LSI chip approach (hereinafter called T-CAM method. The
LSI chip implemented in the T-CAM method is called a T-CAM chip.) where several
LSI chips are laid out and acceleration is performed using a parallel action, it is possible
to search at a very high speed because LPM searching is done by the LPM searching
chip (T-CAM) [68][64]by adding a special built-in hardware circuit to the
content-addressable memory(CAM). Another approach is a hybrid approach, where
algorithmic approach is performed on a CPU chip and a CPU internal cache
memory[72][73][74]. This can enable high-speed search because of the high-speed
internal cache memory access. However, both in LSI chip approach and hybrid
approach, the table entry number for packing is limited to 1 chip. Therefore, even if
initially equipped with enough capacity chips, a response for bigger IP forwarding
tables are needed, and it will be difficult due to net broadening etc. For the router, in the
other words the silicon router that processes protocol with the current common
hardware, an increase in table capacity, in other words more chips, would mean
extensive changes in the hardware, and is not realistic from both the cost and operation
viewpoints. As such, in both approaches, searching the high capacity table at high speed
and low cost, is difficult.
Conventional methods try to search the entire entries of a IP Forwarding Table,
at a uniform and stable speed. However, under present conditions, with regard to the

112
entries used, characteristics such as locality and continuity can be predicted because
packets with the same destination may be arrival continuously. Consequently, entire
entries do not need to be searched at the high cost method uniformly; there is high
possibility to search in low cost by devising a search method that considers actual
packet arrival characteristics.
As the search method considers locality and entry continuity, several search
methods using a cache have been suggested. For example, an architecture that has an IP
forwarding table and cache table (it is simply called cache) to search only IP addresses
that have been recently used when searching at high speed instead of searching all of the
IP forwarding table[67]. This method can search at high speed because it easily hits the
cache when the same IP address is continuously searched. However, when the IP
address is widely distributed, cache mistakes will increase. In this case, a low speed
longest prefix matching search at the IP forwarding table is conventionally done.
Another method uses an extension of the host address with caching [67] (called the Host
address Cache Method), but when there are many traffic flows and they are mixed, the
miss-hit rate will be bigger because many different IP addresses would be frequently
switched in the cache. In other words, improving the cache hit ratio is needed to realize
high speed searching at a low cost.
In this thesis, we propose a LPM Cache Method to improve the cache hit ratio.
The proposed LPM Cache Searching method searches the IP forwarding table in a low
cost algorithmic approach, and searches in high speed using a T-CAM chip, making
high speed LPM searching possible using the cache. Also, in a high speed cache in
order to further reduce the cache miss-hit rate dynamically, an entry switching method
to locate actual entries that are frequently used is proposed. As shown in Fig. 6-1, the

113
LPM cache method stores a wider space in one entry than the host address, thus it is
possible to lower the miss-hit rate by caching rather than by conventional methods.
Conventional points of issue and the proposed LPM cache method are explained
in Section 6-2, below. In Section 6-3, features of the proposed method are stated. In
Section 6-4, a quantitative performance evaluation of the proposed method is done
through a simulation using actual network traffic and an IP forwarding table.
6.2 Longest Prefix Match cache architecture
6.2.1 LPM search
First, the LPM Search is explained. In an IP forwarding table (hereinafter simply
called forwarding table), several entries- prefix, prefix length and output port No.,
become one entry and constitute the table (Figure 6-1). An address search at the router
is an operation to obtain the output port information of an entry with the longest match
(searched by the LPM search) within a combination of prefixes and prefix lengths as the
retrieval key for the destination IP address (called DestIP) of an arrival packet. In this
report, a prefix and prefix length pair are hereinafter called a simple entry, to simplify
explanations.
The prefix shows the lead part of the IP address used for IP address matching
assessment, and the prefix length show the effective length from the head of the prefix.
In other words, the part longer than the prefix length is considered excluded ( called the
“don’t care”) from the matching assessment. To simplify explanation, when considering
4 bits of an IP address, if the prefix of an entry is 0000, and 1 is the prefix, the entry will
be written as 0*** or 0000/1 hereinafter ( * is the don’t care part). In the matching
assessment, IP addresses (Host addresses) that match this entry are eight- 0000、0001、

114
0010、…、0100、0101、0110、0111. LPM is the method to hit the entry that has the
longest prefix length among several entries that match the prefix at the time. As in Fig.
6-1, when searched with DestIP=0100 as key, Entry No. 1, 4, 5 are prefix matches. The
prefix length of individual entries that match are 0,1,2, thus entry No. 5 with the has
longest prefix length would be the LPM1 search result. Then, the packet is the output
from #4, which is specified as the output port of Entry 5.
Fig. 6-1 LPM cache system and traditional cache system
~~
~~
66K~128K entries
232
=40G entries
LPMcache
Host address cache
full table cache table
IPv4 Address space
LPMentry
Host address

115
Table 6-1 Forwarding table
6.2.2 Caching architecture
Searching architecture using caching is explained. First, this paragraph explains
the caching architecture. The next paragraph in turn, explains conventional methods and
a proposed method based on that architecture.
In the caching architecture, there are two tables- the forwarding table (Full table)
and the cache table. The full table is the table that has the whole entries from the
forwarding table, and the cache table is the table that has partial entries of the full table
as is, or in an expanded form. The full table determines an action of low cost through
the use of high capacity memory and an algorithmic approach [60][61][62] search
method at the sacrifice of high speed. On the other hand, the cache table uses a T-CAM
method, in other words a search method [64][65][66] using a proprietary LSI chip to
search at high speed. A proprietary LSI chip has a smaller capacity per chip and is
expensive, so it is common for the size of the table size to be smaller than the full table
at a realistic scale and cost.
Prefix Prefix length Output PortNo.
AggregatedAddress
**** 0 #1 1000, 1001, 1010, 1011
11** 2 #2 1100, 1101, 1110
1111 4 #1 1111
0*** 1 #3
01** 2 #4 0100
011* 3 #2 0110, 0111
0101 4 #5 0101
EntryNo.1
2
3
4
5
6
7
0000, 0001, 0010, 0011

116
In the table search, the cache table is first searched, and if it doesn’t hit, in other
words, if there is a miss-hit, the full table is searched. All entries are stored in the full
table, so it is sure to be hit,9 and the search will be completed.
Fig. 6-2 LPM cache search architecture
6.2.3 Host address caching method
The conventional, Host Address Cache Method is described here.
In Host Address Cache Method, the full table retains the prefix and its prefix
length as the complete entry. However, the cache table retains the IP address, meaning
the host address. Therefore, the cache table searches for a full match search, in other
words a host address that completely matches the DestIP. For example, when the full
table is as in Figure 6-1, the DestIP=0100 packet operates the LPM search, and as a
9There are cases that do not result in hit such as IP Unreachable address, but is considered here with exceptions of those.
cache
full
++++hit
hit cach
e/fu
llta
ble
hit r
ecor
d
cachingin/out

117
result of this full table search, entry No.5 is hit. By that, the host address 0100 is put in
the cache table as an entry.
When the host address method is used, usability of cache may deteriorate
because host address distributed in very wide space would be put into a comparatively
smaller cache.
6.2.4 LPM caching method
As shown in Fig. 6-1, in contrast to the conventional host address cache method
that caches the IP address (in other words, the host address), the LPM cache method
caches the entry itself into the forwarding table, in other words, the combination of
prefix and prefix length instead of host address. That is to say, the LPM cache method
operates an LPM search for part of an entry in the forwarding table at high speed. For
example, in the example in paragraph 6.2.3, for the LPM cache method, only entry 1,
01**/2, is inputted into cache table.
As shown in Figure 6-2, in the search procedure for the LPM cache method, the
cache table is first LPM searched, and if there is a hit in the cache table, the search is
completed. If there is a miss-hit, the search continues to the forwarding table (full table).
To improve the hit ratio at the time, the hit condition of the table is recorded, and by
switching the appropriate cache entry, an improvement in the cache hit ratio can be
realized. This is described in the next paragraph.
6.2.5 Caching rules
The caching system is generally characterized by cache management such as
switching the algorithm rule of entries. In this LPM Cache method, in order to correctly
perform an LPM search, rules of cache need to be established first. The rules for cache

118
switching of LPM cache are first stated below, and the selection of a candidate for the
switch target will be discussed in next paragraph.
Data switching rules of the cache, which is essential in order to correctly
perform the LPM will now be discussed. To increase the hit ratio, the cache table entry
and full table entry are switched with appropriate timing. In the LPM cache method,
During this switching, the rule is that the entry and its corresponding entry are switched
together, not switching the entry singly. This is because the longest match entry within
cache table would not be able to guarantee the correct longest match entry if a single
entry is moved between tables. For example, in Figure 6-1, if only Entry 4
(prefix=0***) and Entry 5 (prefix=01**) are put in the cache table, in the results of the
search of cache table, Entry 5 will be judged as the longest match, and the search would
be completed, but this is incorrect since Entry 6 in the full table side is also the correct
match. Caching rules needed to avoid such incorrect searches are explained below.
To explain caching rules, terms are defined. When entries have the same prefix,
the long entry is called a child, and the short entry is called the parent. For example, for
LPM entry of 100.120.0.0/16, 100.0.0.0/8 is the “Parent”, and 100.120.140.0/24 and
100.120.180.0/24 are the” Children”.
At this point, the switching rule will be (refer to in Fig. 6-3)
[When adding to the cache]: Register both the objective entry and all the
“Children” into cache together.
[When taking out from cache]: Delete both the objective entry and all “Parents”
from the cache.
This rule puts the complete entry of the long prefix into cache so that when only
one prefix entry is registered into cache, the shorter prefix entry in the cache is hit,

119
ending the search, even if the “Child” should be hit, in other words the entry with the
longer prefix (fundamentally this should be hit). The same idea applies when removing
from the cache as well.
As shown in Figure 6-4, the related parent-child entry, explained in other terms,
corresponds to a sub tree with a focused entry at the top spot, and the forwarding table
is described as a binary tree that branches out at 0/1. The above-mentioned selection
rule can be rephrased as the rule to register a whole sub-tree.
An example of a cache operation using a full table as in Figure 6-1 is explained.
First, the cache starts in an empty condition. After receiving the packet destination, in
the full table is searched, in other words, the key is the host address. When the host
address is 0100, Entry 5 is hit, and output port is determined as #4. Based on this
information, the packet is forwarded, and at the same time this entry is LPM cached. As
shown in Figure 6-4, in the Entry 5 sub-tree (shaded part in the smaller part of Figure
6-4), Entry 6, and 7 are included. In other words, within Entry 5 is Entry 6 and 7, which
have longer prefixes as “Children” on an individual branch, so that Entry 5 is stored
with Entry 6 and 7 in the cache. Furthermore, when host address =0000 is received, the
cache will be miss-hit, but will still hit 4 in the full table side, so it is necessary to put a
sub tree of Entry 4 in other words, Entry 4,5,6,7 into the cache. Since Entry 5,6,7 are
already in cache, only Entry 4 needs to be added. Under these conditions, the four
entries corresponding to the sub-tree in the large shaded area of Figure 6-4 are
registered, and it represents a caching of eight host addresses.
In the LPM cache, of course caching the host address itself is possible.
Therefore, it is possible to cache the host address as it is when the cache does not have

120
enough space to put several entries that comprise a sub-tree10. In that case, when there
is enough space in cache later, it may delete this host address and store the desired
sub-tree.
Fig. 6-3 Rules for LPM caching
Fig. 6-4 Efficiency of IP address space coverage with LPM cache
10 In that case, prefix length to be maximum value. In the case of IPv4, it is 32 bits.
*.*.*.*
1.1.1.1
0.1.1.*
0.1.*.* 1.1.*.*
0.*.*.*
0.1.0.1
Binary tree expression ofIP forwarding table entries
cache-out parent
for caching-out this entryfor caching-in this entry
cache-in child
cache-in child cache-in child
*.*.*.*
1.*.*.*
0.0.1.00.0.1.10.1.0.0 0.1.1.00.1.1.11.0.0.01.0.0.11.0.1.01.0.1.11.1.0.01.1.0.11.1.1.01.1.1.10.0.0.1
0.0.0.* 0.0.1.* 0.1.0.* 0.1.1.* 1.0.0.* 1.0.1.* 1.1.0.* 1.1.1.*
0.0.*.* 0.1.*.* 1.0.*.* 1.1.*.*
0.*.*.*
0
1
2
3
4
Prefix length IP address bit length = 4 bitIP address space(P)=16
Forwarding entries (Q)=7
Prefix Match
0.1.0.1
Sub-tree for #4
Sub-tree for #5
0.0.0.0
Entry #1
Entry #3
Entry #2
Entry #4
Entry #5
Entry #6
Entry #7

121
6.2.6 Selection of caching-in/out entry
For entry switching, selection of which data to switch is important. Data
selection is choosing which data should be added to the cache and which data should be
deleted from the cache.
Heretofore, for cache switching, selection methods such as FIFO (First In First
Out) and LRU (Least Recently Used) are known. These methods choose data based on
the history of the individual data remaining in cache. However in the LPM cache, it is
not proper to add a one time entry, or delete multiple entries using the conventional
selection method as is, since the history of each of those multiple entries is different.
So when applying FIFO or LPU to this proposed method, it will be as below. To
realize FIFO, make the oldest existing entry in the cache to be delete target, and delete
the entry along with the “Parent” based on the caching rule. In LPU, the entry that has
been least hit recently should be the delete target, and it should be deleted with the
existing “parent” in the cache. However, when a new entry is registered in the cache, if
a “Child” of the entry already exists in the cache, it should be treated as recently being
hit and re-registered.
Qualitative comparison of both methods is as below. In FIFO, even for those
with a high hit frequency in the cache, they will be eventually be deleted when a new
entry comes. Thus, efficiency is not good, but management of cache is easy. On the
other hand, in LRU, entries that are often hit are always new, and those not used get
older and become delete targets, so the cache can be used effective, but entry
management is complicated. Section 6-4 shows the results regarding the qualitative
comparison of these two.

122
Meanwhile, the timing of a switch to the cache is decided by the miss-hit rate
and trade off of moving overhead. To reduce overhead, it is assumed that it would be
effective if a method could determine the point of moving based on if it has been hit
frequently by using threshold value, instead of moving it to the cache right away even if
it hits in the full table. Details are explained in Section 6-3.
6.2.7 Policy control of cache selection
For the selection method of cache switching entries, not only should
performance be considered but also the possibility of adopting an IP Packet forwarding
policy. In contrast to the performance-oriented cache management mentioned in
previous paragraph, in the Forwarding Policy Control, settings according to the SLA
(Service Level Agreement) and management of the net is possible. Actual control can
be realized by functions such as lengthening the cache residence time of specific entries,
or letting them remain. For example, in the SLA, an entry including the address of users
who contracted a high speed forwarding service can be forwarded in high speed from
other packets by remaining in the cache. Also, it is possible to choose an entry to
effectively handle traffic for a hosting server.
6.3 Features of the LPM cache method Features of the proposed LPM cache method are compiled in this section.
6.3.1 Efficiency per entry
Usability of cache in the proposed LPM cache method and conventional host
address cache method is assumed as below. As shown in Figure 6-1 (B), when
considering a 32 bit address system of IPv4 and a realistic scale of the table of router,

123
the relation of P, the scale of host address space (232=about 40 billion), Q, the number
of entries for the forwarding table(Full table), R; the cache entry number will be P≫Q
≫R.
In the host address cache method, a host address is stored in the cache. The
cache entry number R is in host address format, so in order to place a part of the address
space into R, P≫R. This is said to be very ineffective.
On the other hand, Q>R in the LPM cache method. It can use the cache
efficiently because it caches an extended part of the compact forwarding table Q that is
combined with the host address space P (Figure 6-1(a)).
6.3.2 Frequency bias of use of individual entry
One of the features of the LPM cache is the use of a biased use frequency entry.
The current forwarding table (Full table) consists of an enormous number of entries.
The conventional method that proposes searching with the LPM is premised on the
treating of all entries equally, but it would be more appropriate to show bias according
to use frequency.
A proposed LPM cache method will put a small quantity of entries that are used
frequently in the high-speed cache, and majority of entries that are not often used are
searched in the full table. Details of the evaluation will be given later, but in fact, space
of each IP address space differs largely by entry, and use frequency is a great bias in the
forwarding table entry set at the router. For example, there are about 100 “child” entries
of for an entry with a prefix length of 16, and another independent entry with a prefix
length of 24 does not have a “Parent” or a “Child”. Also, simulation results stated in
Section 4 confirm that there are many entries that are hardly used or not used at all
within the specific observation period.

124
6.3.3 LPM search engine LSI
A search engine that can perform a high speed LPM search for a high-speed
cache, which is essential to realize a LPM cache search system is discussed here. As a
high-speed search cache, a LPM capable T-CAM chip has been realized[68]. Only 16K
~64K per chip can be accommodated, but it can ensure the capacity according to the
allowed cost because capacity can be extended by connecting several chips in sequence.
The approximate search delay of these chips is a very high speed, 20~60 nano seconds.
However, when considering that several entries are often placed in and out, when there
is no restriction [64] on the sequence of adding the entry, a search chip that does no
sequencing is good for the LPM cache. Without a sequence restriction it lessens the
overhead of entry switching, which will be described later.
When comparing cache realization costs of the LPM cache search method and
the host address cache search method, cost of the host address cache will be lower when
they have the same cache capacity. This is because the host cache address search can be
realized using the existing CAM etc. On the other hand, the cost per entry in T-CAM is
estimated to be about 2-4 times of CAM. This is because the regions that hold prefix
length and additional circuits to find the entries with the longest match are needed when
using T-CAM.
6.3.4 Caching-in/out moving overhead
Considerations about cache overhead are discussed here. In the host address
cache method, each new host address needs to be put in the cache. Therefore, the
overhead for cache input is large.
On the other hand, in the LPM cache, even in different host addresses, entry
cache-in/out can be not needed. If the same entry is hit for the addresses, that amount of

125
overhead will be reduced. Also, by having only entries with a high use frequency
remained in the cache, it is possible to further reduce the overhead.
However, in the LPM cache method, the travel distance in one jump is large
because caching of the entry is performed for several entries, not by a single entry unit,
according the previous rules. This travel distance differs according to entry
configuration of each forwarding table, use frequency, and the complicated relationship
between “Parent” and “Child”. And, when using search LSI chip like having restriction
for order of entry, its overhead will be increased more because switching of existing
entry order also will be occurred when switching entries.
Caching-in/out must be waited, when searches are performed. This may be a
problem of cache search system. However, this is not a severe problem in practical
network because time lag between the consecutive arrived packet headers makes idle
time of search system for cache-in/out.
6.4 Performance evaluation
6.4.1 Definition of caching search system performance
In this thesis, as a function of the cache system, the miss-hit rate or hit ratio
(=1-miss-hit rate) is used as a gauge. As previously stated, when using only the full
table, at least 10 times the search period is needed as compared with using caches
together. When the router is configured so that the full table is in a different location
from the cache, for example in the case of Figure 6-5, more time is needed to search the
full table. Furthermore, when processing a full table search with a CPU using a routing
protocol (RIP, OSPF etc) process, the CPU overloads when miss-hitting, and the routing

126
process may lag. Furthermore, when short packets arrive continuously, and the cache
miss-hit still continues, the next packet may become search waiting, or at the end be
disposed.
It is clear that the average search period can be improved by reducing the
miss-hit rate. Also by lowering the miss-hit rate, the minimizing of the cache capacity is
also possible; the effects of improving the miss-hit rate is also large from the actual cost
of cache system.
Fig. 6-5 Typical router architecture by using proposed LPM cache search
6.4.2 Simulation model
The miss-hit rate of the proposed method was evaluated by simulation. In the
simulation, the forwarding processing at one of inputs of router IF was used as a model.
IP processing
LPM Cache
CPU Card
Line Card
SwitchFabric
Full Table
2.4G~10G bps
Data
IP processing
LPM Cache
CPU

127
The data used was a recorded IP address packet that arrived in the router located in the
backbone network, and was searched; the forwarding table of a common router was
used as the full table. The full table has 68,000 entries; there is a maximum class size
for a router. Total number of input packets is about 2,000,000 packets. The data was
derived from gains measured on September 30, 1999.
Data characteristics are summarized as follows. Entries hit by the LPM amount
for each of the 68,000 full tables was about 3,000, remaining entries did not get hit by
the LPM. And, for the frequency of entry moves between “Parent” and “Child”, each
entry moved at 4.6 entries per one time on the average, including the entry itself.
6.4.3 Miss-hit rate comparison
Regarding the performance evaluation indicator, comparison was done using the
miss-hit rate. The miss-hit rate is the ratio that did not have an entry to hit in the cache
table search, in other words, it is the probability of a hit in the full table, and gives a hit
number for the full table and the entire hit number.
The result of a changed cache capacity and comparison of the miss-hit rate of
host address cache and the hit ratio of LPM cache is shown in Figure 6-6. Two methods
of evaluation were used, FIFO, LRU. In the evaluation, the entry that was a miss-hit on
cache side, in other words an entry that was hit in the full table, is immediately moved
to the cache, along with its “Child”. Figure 6-6 shows that the LPM cache is always
better than host cache in a cache capacity over 2000. The difference is especially
noticeable when the cache capacity is large.
However, the proposed LPM cache method is at a disadvantage when the
capacity is smaller. Putting an entry with a lower hit rate into the cache appears to be
more noticeable when the cache capacity is smaller because the LPM cache is

128
performing caching at an average of 4.6 entries unit. On the other hand, when the
capacity is bigger, as recorded above, the performance of the LPM cache is better
because of the effect from the fact that the space the entry covers is wide, rather than
using the cache wastefully.
And by using the LPU, instead of FIFO, the host address cache constantly
changes the destination IP address, the performance will get better because frequently
used entries will tend to remain in cache.
Meanwhile, also in the fixed method that does not switch between caches,
performance exceeding the host address cache method was achieved. This is because
the actual, frequently used entries are the only parts among many entries in the full
table; an area that used frequency has a large bias.
Lastly, results of Figure 6-6 will be evaluated from viewpoint of cache capacity.
When a miss-hit ratio of 0.01 is achieved, it has a difference of only thousands of
entries. On the contrary to host address cache method however, improvement of
miss-hit rate is peaked even with an increased cache size, thus the proposed method can
gain more improvement. Viewing the range gained by the data this time, when a gain
miss-hit rate of 0.003 is desired, the host address cache method needs about 12K cache
size, but LPM cache method needs only about 6K. Even if the expense of cache in LPM
cache method is considered, it is understood that the LPM cache method will be
advantageous when striving for further improvement of miss-hit rate.

129
Fig. 6-6 Cache performance (miss hit rate for cache size)
6.5 Conclusion In this manuscript, an LPM cache method that operates a high capacity IP
forwarding search, at a high speed and low cost by using cache has been introduced.
Performance was quantitatively evaluated by simulation using data of the router, which
is used in actual backbone networks, and its efficiency was demonstrated. In the
comparison with the conventional host address cache method, it showed that the
miss-hit rate of cache can be improved by almost 10 times. And, it was found that
performance could be greatly changed by switching algorithms of cache. In this
2000 4000 6000 8000 10000 12000 14000 160001E-4
1E-3
0.01
0.1
2000 4000 6000 8000 10000 12000 14000 160001E-4
1E-3
0.01
0.1
LPM, LRULPM, FIFOHOST, LRUHOST, FIFO
CacheMissRate
Cache Size (entries)

130
evaluation, only the algorithms FIFO, LPU, were used. An examination of algorithms
with better performance is planned in the future.

131
CHAPTER 7 CONCLUSION
Today’s Internet has become a part of the daily life of residential users as well as
business users, who use e-mails and Web for their business and entertainment. This
means that the Internet has already become a life infrastructure.
Compared with the improvement of speed and capacity, the changes in quality
are much smaller. Toward the future Internet as an actual infrastructure, QOS
consideration is required. We should provide traffic control mechanisms for achieving
high QOS and network architecture based on the in-depth consideration to the traffic
control while operational cost and equipment cost remains minimum.
This thesis discusses on traffic control and architecture for high-quality and
high-speed Internet. The discussion focuses on five subjects; admission control methods
for (1) connections and (2) a partial data of connections, i.e. a burst, (3) application
aware communication control, (4) network architecture for application level QOS and
(5) technologies for realizing high speed routers.
A transport network that people expected to become an essential part of
broadband multimedia network is an Asynchronous Transfer Mode network or an ATM
network. Because ATM has been expected to integrate both circuit switch and packet
switch, it is necessary to guarantee QOS for accommodating multimedia traffic, i.e.
circuit switch friendly traffic such as telephone or movie streams. As ATM networks
are based on connection-oriented principle, it is suitable for controlling QOS by
controlling network traffic load i.e. by controlling numbers of connections. Call
Admission Control or Connection Admission Control (CAC) is, thus, firstly addressed.
In the CAC, CAC performance depends on a cell loss estimation and a CAC procedure.
The CAC proposed in this thesis has good advantages; only two parameters and small

132
time are needed for accept/reject new connection request. The proposed CAC uses
“virtual cell loss rate” instead of cell loss rate as cell loss estimation. Simulation results
show that the proposed CAC has appropriate accuracy in estimation and offers
appropriate network utilization.
More bursty traffic, however, does not fit to the connection-by-connection CAC.
Burst transfer methods has been developed for that purpose. It reserves and releases
bandwidth for each piece of burst data at the time when the burst is ready to send. This,
however, may cause large latency and waist of bandwidth during the reservation if the
bandwidth is not available at least in one link. To make the latency small, burst server
architecture is proposed. In the architecture, a burst server, which stores and forwards
the bursts, is placed between links and the reservation methods are modified. Bandwidth
reservations can succeed either if the bandwidth on all links between sending and
receiving terminals are available, or all links between burstservers/sending/receiving
terminals. Numerical results show that the latency is much improved and utilization of
networks is also improved two times larger than conventional architecture at maximum.
These contribute packet level QOS improvement. On the other hand, for
considering user level QOS, not only packet but throughput and contents retrieval time
also must be improved. One of the today’s most important and popular applications of
the Internet is web (World Wide Web). “8-second rule” reveals users have very little
tolerate against waiting time of contents displayed. The waiting time consists of
combination of network delay and server delay. It is necessary to cooperate networks
and servers to reduce the waiting time. . The network cache architecture for network
friendly pre-fetch retrieval is therefore proposed. Some numerical results show that the
network cache improves 40% latency without causing congestion.

133
To meet the high throughput requirements such as from storage networking and
high speed wide-area LAN interconnection, TCP must be improved. Although many
TCP modifications has been proposed, it is difficult to introduce new TCP to end
hosts/servers, but easy to the intermediate node. TCP relay node (TCP bridge) is
proposed to be set in a network. In the TCP overlay network TCP Bridges are
cooperated each other and change TCP characteristics to appropriate one for the links
between TCP Bridges. One of issues to be solved is a congestion control issue. If a
trivial congestion occurs on sending side of a TCP Bridge, it causes serious rather than
non-trivial congestion on receiving side of the TCP Bridge. To prevent this problem,
buffer control in TCP Bridge is proposed and discussed. Simulation results shows that
proposed control method improve the problem and can achieve throughput two times
higher than the case without any control.
As well above mentioned traffic control, network itself must be improved in its
speed to accommodate today’s huge traffic. One of essential bottleneck in developing
high-speed router is IP address table search. Longest Prefix Matching (LPM) search
must be used to search the table. The idea is proposed that cache architecture is
employed with algorithmic search and hardware search engine. Instead of ordinary
CAM as used by conventional caching architecture, Ternary-CAM is employed to
reduce cache miss-hit ratio. Because caching-in/out rule is not obvious in LPM search,
the rule is carefully invented and investigated for a validation. Performance evaluation
is shown to disclose the proposed architecture can achieve at least ten times smaller
miss-hit ratio than the conventional cache architecture.
Toward the future Internet, this thesis has discussed new architecture and control
for high QOS with the networks while operational cost and equipment cost remains

134
minimum. We believe these discussions contribute to realize next generation high
quality, high-speed Internet.

135
BIBLIOGRAPHY
[1] CCITT (ITU) Recommendation 1.121, “Broadband Aspects of ISDN,” 1988.
[2] J. S. Turner, “New Directions in Communications (or Which Way to the
Information Age?),” IEEE Communications Magazine, Vol. 25, No. 10, Oct.
1986.
[3] G. Woodruff, R. Rogers, and P. Richards, “A Congestion Control Framework
for High-Speed Integrated Packetized Transport,” in Proceedings of
GLOBECOM ’88, paper 7.1, 1988.
[4] S. B. Jacobsen, K. Moth, and L. Dittmann, “Load Control in ATM Networks,”
in Proceedings of 8th Int. Switching Symposium, paper A8-5, May 1990.
[5] J. Appleton, “Modeling a Connection Acceptance Strategy for Asynchronous
Transfer Mode Networks,” in Proceedings of 7th ITC Seminar, paper 5.1, 1990.
[6] B. Jabbari, “A Connection Control Strategy for Bursty Sources in Broadband
Packet Networks,” International Journal of Digital and Analog Cabled Systems,
Vol. 3, pp. 351-356, 1990.
[7] S. Sato and S. Tanabe, “A Study on ATM Traffic Burstiness,” IEICE Technical
Report, IN88-142, Feb. 1989.
[8] H. Suzuki, T. Murase, S. Sato, and T. Takeuchi, “A Simple and Burst-Variation
Independent Measure of Service Quality for ATM Traffic Control,” in
Proceedings of 7th ITC Seminar, paper 17.2, 1990.

136
[9] H. Kroener, G. Hebuterne, P. Boyer, and A. Gravey, “Priority Management in
ATM Switching Node,” IEEE Journal on Selected Areas in Communications,
Vol. 9, No. 3, pp. 418-427, April 1991.
[10] T. Murase, H. Suzuki, and T. Takeuchi, “A Call Admission Control for ATM
Networks Based on Individual Multiplexed Traffic Characteristics,” in
Proceedings of ICC ’91, paper 6.3, 1991.
[11] M. Decina and T. Toniatti, “On Bandwidth Allocation to Bursty Virtual
Connections in ATM Networks,” in Proceedings of ICC ’90, paper 318.6, 1990.
[12] J. Hui, “Resource Allocation for Broadband Networks,” IEEE Journal on
Selected Areas in Communications, Vol. 6, No. 9, Dec. 1988.
[13] H. Suzuki, T. Murase, S. Sato, and T. Takeuchi, “A Burst Traffic Control
Strategy for ATM Networks, “ in Proceedings of GLOBECOM ’90, paper 505.6,
Dec. 1990.
[14] G. Woodruff, R. Kositpaiboon, G. Fitzpatrick, and P. Richards, “Control of
ATM Statistical Multiplexing Performance, “ in Proceedings of 6th ITC
Seminar, paper 17.2, 1989.
[15] G. Woodruff and R. Kositpaiboon, “Evaluation of ATM Network
Performance,” in Proceedings of COMSOC International Workshop, paper 2.2,
Canada, April 1989.
[16] M. J. Karol and M. Hluchyj, “Using a Packet Switch for Circuit Switched
Traffic,” in Proceedings of ICC ’87 paper, 48.3, June 1987.
[17] B. Eklundh, K. Sallberg, and B. Stavenow, “Asynchronous Transfer Mode -
Options and Characteristics,” in Proceedings of ITC 12, paper 1.3A.3, 1988.

137
[18] Y. Ohba, M. Murata, and H. Miyahara, “Analysis of Interdeparture Process for
Bursty Traffic in ATM Networks,” IEEE Journal on Selected Areas in
Communications, Vol. 9, No. 3, pp. 468-476, April 1991.
[19] H. Suzuki, H. Nagano, T. Suzuki, T. Takeuchi, and S. Iwasaki, “Output-buffer
Switch Architecture for Asynchronous Transfer Mode, “Journal of Digital and
Analog Cabled Systems, Vol. 2, pp. 269-276, 1989.
[20] M. Henrion, K. Schrodi, D. Boettle, M. Somer, and M. Dieudonne, “Switching
Network Architecture for ATM Based Broadband Communications,” in
Proceedings of 8th International Switching Symposium (ISS), Vol. 5, paper
S-A7.1, 1990.
[21] T. Murase, H. Suzuki, Y. Miyao, S. Sato, and T. Takeuchi, “A Traffic Control
for ATM Networks,” IEICE Technical Report, SSE89-69, Sept. 1989.
[22] M. Murata, Y. Oie, T. Suda, and H. Miyahara, “Analysis of a Discrete-Time
Single-Server Queue with Bursty Inputs for Traffic Control in ATM Networks,”
IEEE Journal on Selected Areas in Communications, Vol. 8, No. 3, pp. 447-458,
April 1990.
[23] H. Yamada, T. Komine, and S. Sumita, “Characteristics of Statistical
Multiplexing with Heterogeneous Inputs, ” IEICE Technical Report, SSE90-49,
July 1990.
[24] G. Gallassi, G. Rigolio, and L. Fratta, “ATM: Bandwidth Assignment and
Bandwidth Enforcement Policies,” in Proceedings of GLOBECOM ’89, paper
49.6, 1989.

138
[25] T. Murase, H. Suzuki, and T. Takeuchi, “A Call Admission Control for ATM
Networks Based on Individual Multiplexed Traffic Characteristics,” IEICE
Technical Report, SSE90-47, July 1990.
[26] G. Woodruff and R. Kostipaiboon, “Multimedia Traffic Management Principles
for Guaranteed ATM Network Performance,” IEEE Journal on Selected Areas
in Communications, Vol. 8, No. 3, pp. 437-446, April 1990.
[27] S. Akhtar, “Congestion Control in a Fast Packet Switching Network, “Master’s
Thesis, Washington University, St. Louis, MO, 1987.
[28] A. Gersht and K. Lee, “A congestion Control Framework for ATM Networks,”
in Proceedings of INFOCOM ’88, pp. 701-710, 1988.
[29] T. Kamitake and T. Suda, “Evaluation of an Admission Control Scheme for an
ATM Network Considering Fluctuations in Cell Loss Rate,” in Proceedings of
GLOBECOM ’89, paper 49.4, Nov. 1989.
[30] P. E. Boyer and D. P. Tranchier, “A Reservation Principle with Applications to
the ATM Traffic Control,” Computer Networks and ISDN Systems, Vol. 24, No.
4, pp. 321-334, May 15, 1992.
[31] H. Suzuki and F. A. Tobagi, “Fast Bandwidth Reservation Scheme with
Multi-link & Multi-path Routing in ATM Networks,” in Proceedings of
INFOCOM ’92, pp. 2233-2240, May 1992.
[32] C. Ikeda and H. Suzuki, “Adaptive Congestion Control Schemes for ATM
LANs,” in Proceedings of INFOCOM ’94, pp. 829-838, June 1994.
[33] G. Woodruff, et. al., “Control of ATM Statistical Multiplexing Performance,” in
Proceedings of 6th ITC seminar paper 17.2 1989.

139
[34] T. Murase, H. Suzuki, and T. Takeuchi, “A Call Admission Control for ATM
Networks Based on Individual Multiplexed Traffic Characteristics,” in
Proceedings of ICC ’91, paper 6.3, 1991.
[35] ITU recommendation I.361, 1992.
[36] “Eight seconds rule,”
http://www.zdnet.co.jp/special/e-business/9911/11/column1.html.
[37] “Layer 7 switch,” http://www.toplayer.com/.
[38] “Digital Island,” http://www.digitalisland.com/.
[39] “Akamai,” http://www.akamai.com/.
[40] “Napstar,” http://music.zdnet.com/features/napster/.
[41] “Gnutella,” http://www.gnutellanews.com/.
[42] J. Mogul, “The Case for Persistent-Connection HTTP,” in Proceedings of ACM
SIGCOMM ’95, 1995.
[43] V. Padmanabhan and J. Mogul, “Using Predictive Prefetching to Improve
World Wide Web Latency,” in Proceedings of ACM SIGCOMM ’96, 1996.
[44] T. Kroeger, D. E. Long, and J. Mogul, “Exploring the Bounds of Web Latency
Reduction from Caching and Prefetching,” in Proceedings of the 1997 Usenix
Symposium on Internet Technologies and Systems, Dec. 1997.
[45] Z. Wang and J. Crowcroft, “Prefetching in World Wide Web,” in Proceedings
of IEEE Global Internet 96, Nov. 1996.
[46] M. Crovella and P. Barford, “The Network Effects of Prefetching,” in
Proceedings of INFOCOM ’98, April 1998.

140
[47] A. Feldmann, R. Caceres, and F. Douglis, Gideon Glass, and Michael
Rabinovich, “Performance of Web Proxy Caching in Heterogeneous Bandwidth
Environments,” in Proceedings of INFOCOM ’99, March 1999.
[48] C. Maltzahn and K. Richardson, “On Bandwidth Smoothing,” in Proceedings of
The 4th International Web Caching Workshop (WCW’99), March 1999.
[49] F5 Networks, Inc., “3DNS,” http://www.f5.com/3dns/3dns.pdf
[50] P. Barford and M. Crovella, “A Performance Evaluation of Hyper Text Transfer
Protocols,” in Proceedings of ACM SIGMETRICS ’99, May 1999.
[51] http://www.ntt-me.co.jp/news/news2001/nws010118.html.
[52] I. Maki, H. Shimonishi, T. Murase, M. Murata, and H. Miyahara,
“Hierarchically Aggregated Fair Queuing (HAFQ) for Per-flow Fair Service in
High-speed Networks,” in Proceedings of the 2001 IEICE Society Conference,
SB-5-4, Sept. 2001.
[53] J. Padhye, V. Firoiu, D. Towsley, and J. Kurose, “Modeling TCP Throughput:
A Simple Model and its Empirical Validation,” in Proceedings of ACM
SIGCOM ’98.
[54] T. Murase, H. Shimonishi, and Y. Hasegawa, “TCP Overlay Network
Architecture,” in Proceedings of the 2002 IEICE Society Conference, B-7-49,
Sept. 2002.
[55] J. Postel, “Transmission control protocol,” IETF RFC793, Sept. 1981.
[56] W. Stevens. ”TCP/IP Illustrated, Volume 1: The Protocols,” Addison-Wesley,
1994.
141
[57] “Network Simulator-ns (Version 2),” available from
http://www.isi.edu/nsnam/ns/.
[58] M. Allman, et. al., “TCP Congestion Control,” IETF RFC2581, April 1999.
[59] M. Allman, et. al., “Increasing TCP’s Initial Window,” Oct. 2002.
[60] M. Waldvogel et al., “Scalable High Speed IP Routing Lookups,” in
Proceedings of ACM SIGCOMM ‘97, Sept. 1997.
[61] M. Degermark et al., “Small Forwarding Tables for Fast Routing Lookups,” in
Proceedings of ACM SIGCOMM ’97, Sept. 1997.
[62] M. Kobayashi and T. Murase, “High Speed Forwarding Table Search Method
Used Internal Cache of Processor,” IEICE Technical Report, SSE99-180
(IN99-143), March 2000.
[63] C. Partridge et al., “A 50-Gb/s IP Router,” IEEE/ACM Transactions on
Networking, Vol.6, No.3, June 1998.
[64] M. Kobayashi and T. Murase, et. al., “50Mpps Longest Prefix Match Search
LSI for Multi Gigabit IP Forwarder,” IEICE Technical Report, SSE98-119
(IN98-119), Nov. 1999.
[65] M. Uga and K. Shiomoto, “Proposal of high speed / High capacity / route chart
search method,” IEICE Technical Report, SSE, June 1999.
[66] T. Hayashi and T. Miyazaki, “Hit Signal Look-ahead Type High Speed Table
Search Hardware,” IEICE Technical Report, IN Jan. 2000.
[67] http://www.cisco.com/warp/public/cc/pd/iosw/ioft/neflct/tech/napps_wp.htm.

142
[68] LPM Search Method Search Chip of Each Companies : available from
http://www.music-ic.com/,
http://www.idt.com/products/pages/Network_Search_Engines.html.
[69] G. Montenegro, et. al., “Long Thin Networks,” IETF, RFC-2757, 2000.
[70] D. Morrison, “Patricia--practical algorithm to retrieve information coded in
alphanumeric,” Journal of ACM, Vol. 15, No. 4, pp. 514-534, Jan. 1968.
[71] “The ATM FORUM,” http://www.atmforum.org/.
[72] P. Guputa, S. Lin, and N. McKeown, “Routing Lookups in Hardware at
Memory Access Speeds,” in Proceedings of INFOCOM ’98, 1998.
[73] N. Huang, et. al., “A Novel IP-Routing Lookups Scheme and Hardware
Architecture for Multigigabit Switching Routers,” in Proceedings of ICC ’99,
June 1999.
[74] V. Srinivasan, et. al., “Faster IP Lookups using Controlled Prefix Expansion,” in
Proceedings of ACM SIGMETRICS ’98, 1998.

143
Presented papers Journals
[1] T. Murase, H. Suzuki, S. Sato, and T. Takeuchi, “A Call Admission Control Scheme
for ATM Networks Using A Simple Quality Estimate,” IEEE Journal of Selected
Areas in Communications, Vol. 9, No. 9, pp. 1461 -1470, Dec. 1991.
[2] T. Murase, M. Kobayashi, and M. Murata, “A High Speed and Low Cost Search
Method for IP Forwarding Table by Using IP Longest Prefix Match Cache,”
submitted to IEICE Journal of communications, B, Sept. 2003.
[3] M. Kobayoshi and T. Murase, “Efficient Support for Pipelined Requests in
Content-Based Switches Using Asymmetric TCP Splicing,” IEICE Transaction on
Communications”, Vol.E86-B, No.6, pp.1812-1820, June 2003.
[4] H. Shimonishi and T. Murase, “A Network Processor Architecture for Very High
Speed Line Interfaces,” Journal of Communications & Networks 2002.
[5] Kolarov, G. Ramamurthy, T. Takamichi, and T. Murase, “Comparison of Three
Policing Algorithm for ABR Conformance,” Journal of the Brazilian Computer
Society, Vol.5, No.3, Feb. 1999.
International Conferences [6] H. Suzuki, T. Murase, T. Takeuchi, and F. Akashi, “An Experiment High Speed
Packet Switching System,” International Workshop on Future Prospects of
Burst/Packetized Multimedia Communications, 1989.
[7] T. Murase, H. Suzuki, and T. Takeuchi, “Continuous Bit Stream Oriented Services
in ATM Network,” International Multimedia Communications Workshop

144
(MULTIMEDIA), 1989.
[8] H. Suzuki, T. Murase, S. Sato, and T. Takeuchi, “A Simple And Burst-Variation
Independent Measure of Service Quality for ATM Traffic Control,” in Proceedings
of 7th ITC Seminar, paper 17.2, 1990.
[9] H. Suzuki, T. Murase, S. Sato, and T. Takeuchi, “A Burst Traffic Control Strategy
for ATM Networks,” in Proceedings of GLOBECOM ’90, paper 505.6, Dec. 1990
[10] Murase, H. Suzuki, and T. Takeuchi, “A call admission control for ATM
networks based on individual multiplexed traffic characteristics,” in Proceedings of
ICC ’91, paper 6.3, 1991.
[11] E. Spiegel and T. Murase, “Alternate Path Routing Schemes Supporting QOS
and Fast Connection Setup in ATM Networks,” in Proceedings of GLOBECOM ’94,
pp. 1224-1230, Dec. 1994.
[12] T. Murase, “Burstserver Architecture for ATM LAN Interconnection,” in
Proceedings of GLOBECOM ’94, pp. 1231-1237, Dec. 1994.
[13] A. Kolarov, G. Ramamurthy, T. Takamichi, and T. Murase, “Impact of
Misbehaving Users and the Role of Policers in ABR Service,” in Proceedings of
INFOCOM ’98, March 1998.
[14] A. Kolarov, G. Ramamurthy, T. Takamichi, and T. Murase, “Comparison of
Three Policing Algorithm for ABR Conformance,” International Workshop on
Computer-Aided Modeling, Analysis & Design of Communication Links &
Networks, Aug. 1998.
[15] A. Kolarov, G. Ramamurthy, T. Takamichi, and T. Murase, “Impact of

145
Misbehaving Users and the Role of Policers in ABR Service,” in Proceedings of
GLOBECOM ’98, Vol. 3, pp. 1533-1540, Nov. 1998.
[16] S. Yoshikawa, N. Hiroshi, T. Suzuki, H. Nakane, M. Shinohara, T. Murase, and
G. Ramamurthy, “Large Scale Input and Output Buffered ATM Switch,” IEEE ATM
Workshop (ATM), pp. 115 -120, May 1999.
[17] H. Shimonishi, T. Murase, and K. Yamada, “IP-on-the-fly Packet Processing
Mechanism for an ATM/IP Integrated Switch,” in Proceedings of GLOBECOM ’99,
Vol. 1B, pp. 626-630, Dec. 1999.
[18] M. Kobayashi, T. Murase, and A. Kuriyama, “A Longest Prefix Match Search
Engine for Multi-gigabit IP Processing,” in Proceedings of ICC 2000, pp.
1360-1364, June 2000.
[19] M. Kobayashi and T. Murase, “Processor Based High-Speed Longest Prefix
Match Search Engine,” IEEE Workshop on High Performance Switching &
Routing, pp. 233-239, May 2001.
[20] H. Shimonishi and T. Murase, “A Network Processor Architecture for Flexible
Traffic Control in Very High Speed Line Interfaces,” IEEE Workshop on High
Performance Switching & Routing, pp. 402-406, May 2001.
[21] H. Shimonishi and T. Murase, “A Network Processor Architecture for Flexible
Header Handling and Buffer Management in Very High-speed Line Interfaces,”
International Symposium on the Convergence of Information Technologies &
Communications (ITCom).
[22] H. Shimonishi, I. Maki, T. Murase, and M. Murata, “Dynamic Fair Bandwidth
Allocation for DiffServ Classes,” in Proceedings of ICC ’02, Vol.4, pp. 2348-2352,

146
May 2002.
[23] M. Kobayashi and T. Murase, “Asymmetric TCP Splicing for Content-Based
Switches,” in Proceedings of ICC ’02, Vol. 2, pp. 1321-1326, May 2002.
[24] I. Maki, H. Shimonishi, T. Murase, M. Murata, and H. Miyahara,
“Hierarchically Aggregated Fair Queuing (HAFQ) for Per-flow Fair Bandwidth
Allocation in High Speed Networks,” in Proceedings of ICC ’03, Vol.3, pp.
1947-1951, May 2003.
Standard Activities
[25] Tutomu Murase and Herbert Ruck, “Disclosure and Notice Regarding Patent
Rights,” ATM Forum Technical Meeting Contribution, ATMF-0059, Feb. 2000.
Published books [26] Tutomu Murase, “Chapter 3.3 Multimedia communication protocols” and
“Chapter 3.4 Multimedia communication control,” in (Editor) Shiro Sakata,
“Internet QOS and multicasting,” Shokabo Netcom Library, pp. 28-79, June 2001.
Patents
Domestic Patents
26 patents
US Patents
15 patents (PAT. NO. Title)

147
[27] 6,570,866 High-speed flexible longest match retrieval
[28] 6,389,549 LIST MANAGEMENT SYSTEM, A LIST MANAGEMENT
METHOD, A RECORDING MEDIUM WHEREIN A COMPUTER PROGRAM
FOR REALIZING THE LIST MANAGEMENT SYSTEM IS RECORDED AND
A PACKET EXCHANGE WHEREIN THE LIST MANAGEMENT SYSTEM IS
APPLIED
[29] 6,388,994 Traffic rate controller in a packet switching network
[30] 6,298,042 Packet switching apparatus adapted to control allowed transmission
rate in packet switching network, and method of controlling allowed transmission
rate
[31] 6,295,576 Associative memory having a mask function for use in a network
router
[32] 6,272,111 Routing system
[33] 6,144,574 Associative memory with a shortest mask output function and search
method
[34] 6,108,302 UPC unit and UPC controlling method
[35] 5,974,033 Dynamic shaping apparatus of traffic of ATM network
[36] 5,940,368 Cell rate supervising system terminating congestion feedback loop
[37] 5,793,748 Priority control method of virtual circuit and a device thereof
[38] 5,703,870 Congestion control method
[39] 5,649,108 Combined progressive and source routing control for

148
connection-oriented communications networks
[40] 5,559,797 Burst server stored switching system and its method
[41] 5,113,395 Frame phase aligning system using a buffer memory with a reduced
capacity

149
Biography Tutomu Murase was born in Kyoto, Japan in 1961. He received his M.E. degree
from Graduate School of Engineering Science, Osaka University, Japan, in 1986. He
joined NEC Corporation in 1986 and has been engaged in research on traffic
management for high-quality and high-speed internet. He is a member of IEICE. He
was a secretary and has been a member of steering committee of Communication
Quality Technical Group in IEICE. He is also a member of steering committee of
Information Network Technical Group in IEICE. He is a vice chair person of Next
Generation Network working group in 163rd Committee on Internet Technology
(ITRC).