trafï¬c & transportation planning transport planning and
TRANSCRIPT
CRRI New Delhi
109
Traffic & Transportation
Planning
Transport Planning and Environment
Annual Report 2009-10
110
Traffic & Transportation
Planning
Transport Planning and Environment
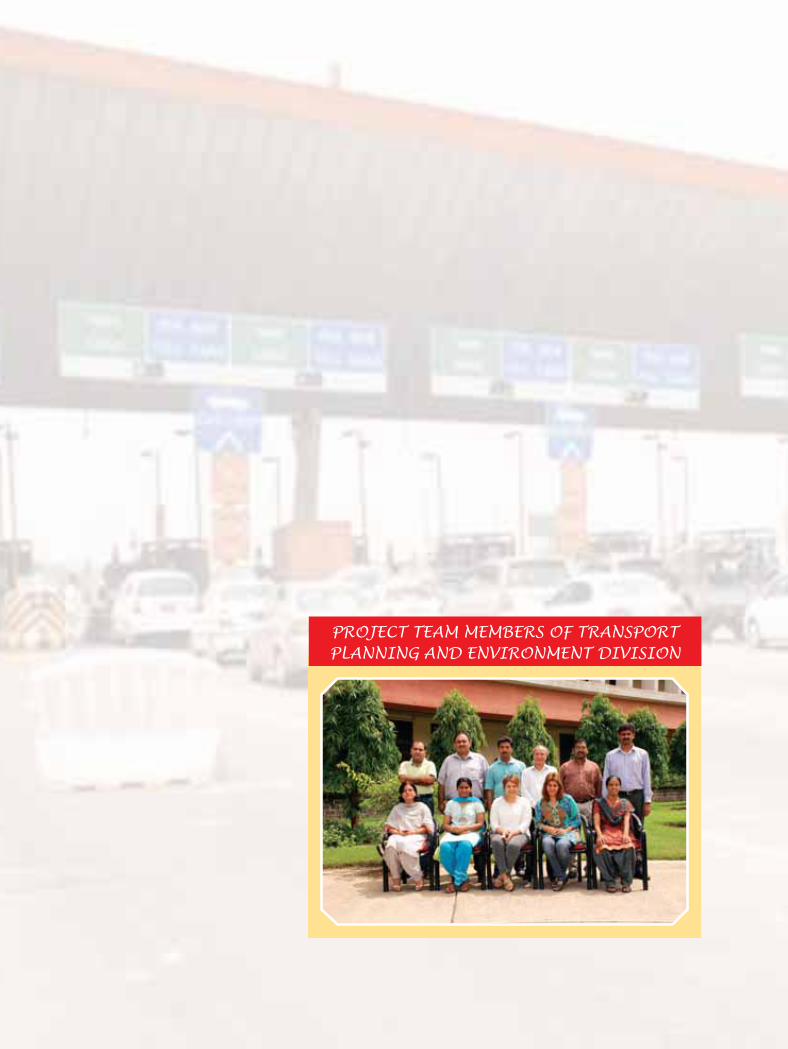
PROJECT TEAM MEMBERS OF TRANSPORT PLANNING AND ENVIRONMENT DIVISION

CRRI New Delhi
111
Traffic & Transportation
Planning
Transport Planning and Environment
E n v i r o n m e n t a l & R o a d Safety Considerations during Transportation of Hazardous Materials by RoadIn recent years, keeping pace with other industrialized countries, India has also witnessed rapid growth in transportation of hazardous goods by road. Experiences from all over the world have shown that the movement of such substances is more prone to accidents than the movement of the other goods. It has been observed that the carriers of such hazardous materials, when involved in a road accident may lead to disastrous consequences like fire, explosion, spillage and leakage, resulting in a number of fatalities and injuries besides property loss and environmental pollution.
At present in India there are several agencies of the Government, both Central and State, which prescribe various rules and regulations regarding the safe handling (e.g., manufacture, storage, transportation, treatment and disposal) of hazardous materials. The Ministry of Environment and Forests (MoEF), Govt. of India has prescribed various rules and regulations under various Environmental Legislations/Acts for safe handling of these hazardous materials (excluding related to their transportation by road), which has been covered under the different provisions of the Motor Vehicles Act (MVA) (1988) including the Central Motor Vehicle Rules (CMVR) (1989). In spite of these rules and regulations, accidents do take place due to the lack of their strict implementation and awareness amongst different stakeholder. In India, Rule 129 to 137 of the CMVR (1989) contains several provisions for safe transportation of hazardous materials in India. These rules, which are applicable to whole country, stipulates various
provisions related to educational qualifications for drivers, manner of display of Class Labels and Emergency Information Panel (EIP), responsibility of the consignor, transporter or owner & driver, instructions to the driver and requirement of driver to report to police station about the accident.
Present study has been undertaken to know the present status of compliance of various CMVR provisions related to safe transportation of hazardous materials by road. Study findings have indicated that the compliance and awareness of these rules and regulations have improved quite significantly since last 10 years. A higher percentage of the hazardous material carriers now display correct EIP, although significant percentage of drivers are still not fully aware about the contents and purpose of the display. It was also found that the most of the drivers were carrying Transport Emergency Card (TREMCARD), but they were found to be carrying them like any other important document without understanding their importance. In many cases, the drivers were carrying different TREMCARDs, which were not relevant to the hazardous materials being transported by them and probably was pertaining to earlier assignment.
It was found that the drivers employed by reputed Public Sector Undertakings (PSUs)/big industrial houses for transporting hazardous materials, were much more aware than the drivers employed by others and had attended at least one training programme regarding various safety aspects during transportation of hazardous materials by road. As a part of the study, a compilation of the road accidents involving hazardous material carriers in India was also done for the period between 1996 to 2009 and various major national laws were also
Annual Report 2009-10
112
Traffic & Transportation
Planning
Transport Planning and Environment
enlisted which are applicable while transporting such hazardous materials by road in India. The present study has clearly revealed that, while there are ample legal provision and guidelines for transportation of hazardous materials their implementation is grossly lacking in India due to lack of awareness among transporters, drivers as well as among enforcement agencies.
Various enforcement agencies and other stakeholders including transporter, drivers, and general public are also not fully aware about the various provisions/guidelines stipulated in MVA (1988) & CMVR (1989) and about disastrous consequences in case of their accidents. There is an urgent need that the Central, State Governments and local authorities remain to fully prepare to meet any eventualities involving such carriers.
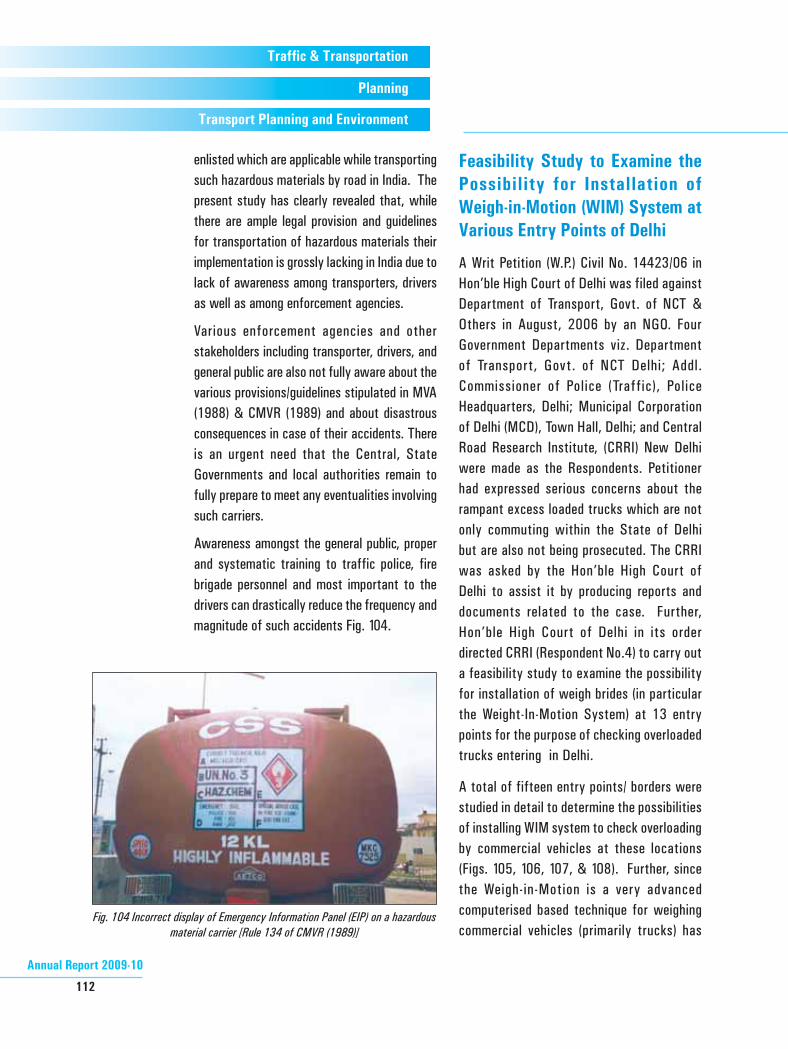
Awareness amongst the general public, proper and systematic training to traffic police, fire brigade personnel and most important to the drivers can drastically reduce the frequency and magnitude of such accidents Fig. 104.
Feasibility Study to Examine the Possibility for Installation of Weigh-in-Motion (WIM) System at Various Entry Points of Delhi
A Writ Petition (W.P.) Civil No. 14423/06 in Hon’ble High Court of Delhi was filed against Department of Transport, Govt. of NCT & Others in August, 2006 by an NGO. Four Government Departments viz. Department of Transport, Govt. of NCT Delhi; Addl. Commissioner of Police (Traffic), Police Headquarters, Delhi; Municipal Corporation of Delhi (MCD), Town Hall, Delhi; and Central Road Research Institute, (CRRI) New Delhi were made as the Respondents. Petitioner had expressed serious concerns about the rampant excess loaded trucks which are not only commuting within the State of Delhi but are also not being prosecuted. The CRRI was asked by the Hon’ble High Court of Delhi to assist it by producing reports and documents related to the case. Further, Hon’ble High Court of Delhi in its order directed CRRI (Respondent No.4) to carry out a feasibility study to examine the possibility for installation of weigh brides (in particular the Weight-In-Motion System) at 13 entry points for the purpose of checking overloaded trucks entering in Delhi.
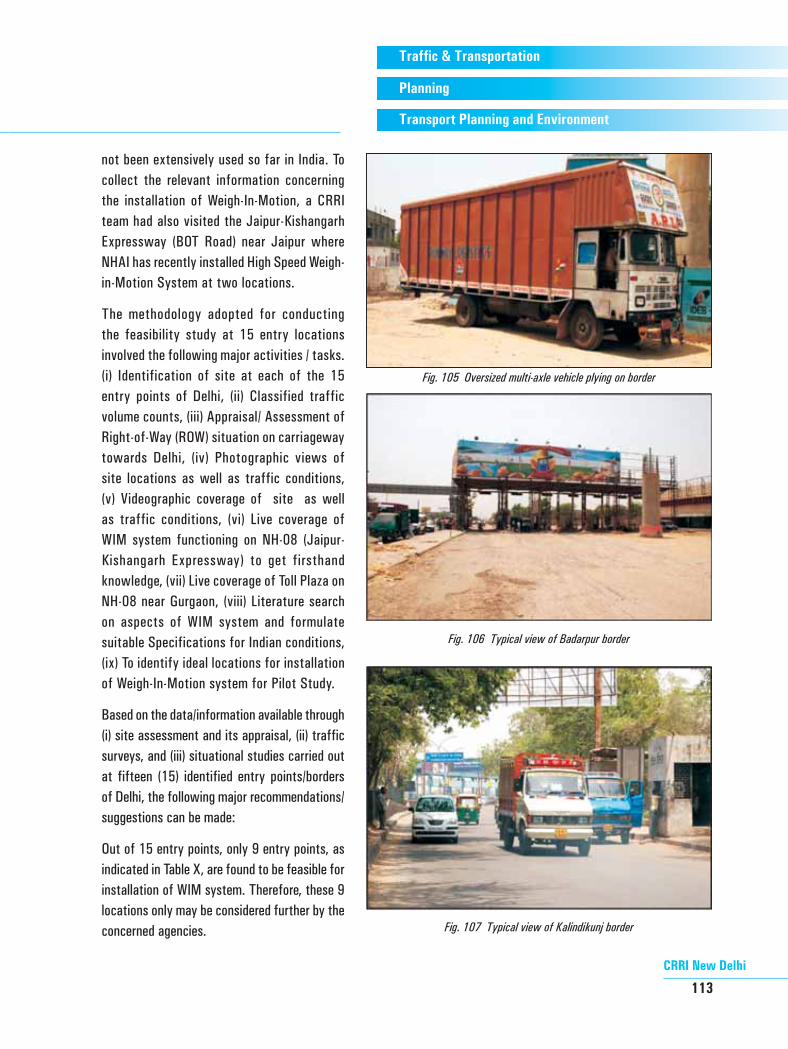
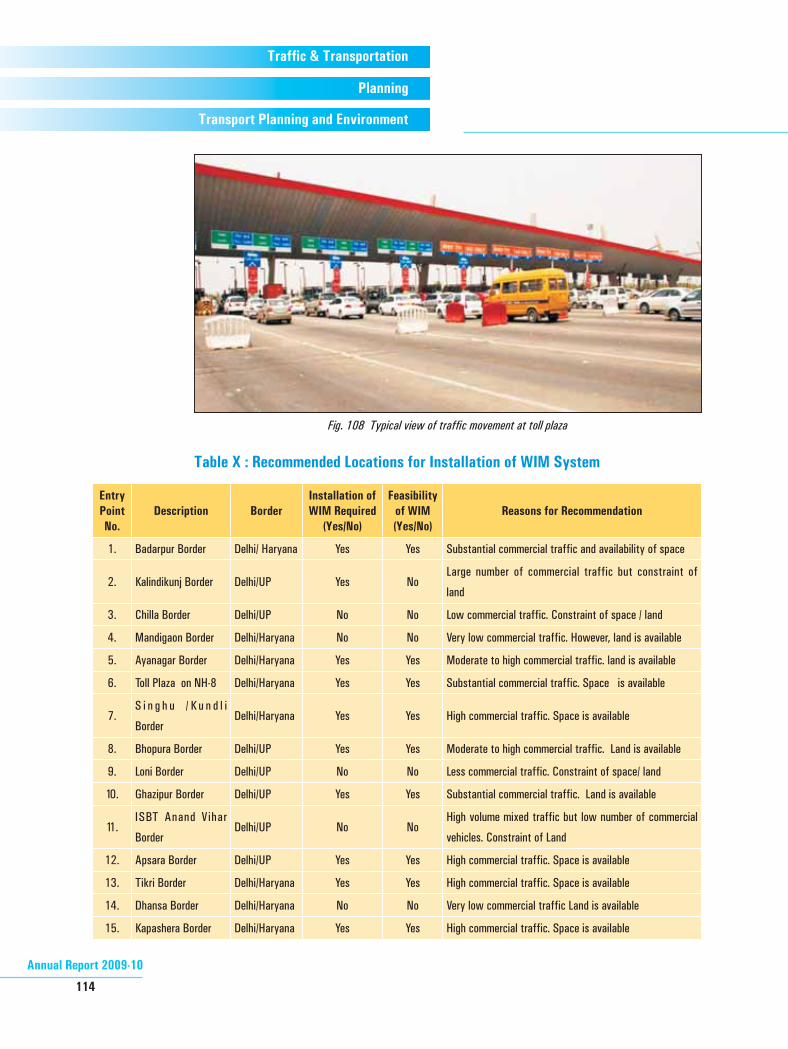
A total of fifteen entry points/ borders were studied in detail to determine the possibilities of installing WIM system to check overloading by commercial vehicles at these locations (Figs. 105, 106, 107, & 108). Further, since the Weigh-in-Motion is a very advanced computerised based technique for weighing commercial vehicles (primarily trucks) has
Fig. 104 Incorrect display of Emergency Information Panel (EIP) on a hazardous material carrier [Rule 134 of CMVR (1989)]
CRRI New Delhi
113
Traffic & Transportation
Planning
Transport Planning and Environment
not been extensively used so far in India. To collect the relevant information concerning the installation of Weigh-In-Motion, a CRRI team had also visited the Jaipur-Kishangarh Expressway (BOT Road) near Jaipur where NHAI has recently installed High Speed Weigh-in-Motion System at two locations.
The methodology adopted for conducting the feasibility study at 15 entry locations involved the following major activities / tasks. (i) Identification of site at each of the 15 entry points of Delhi, (ii) Classified traffic volume counts, (iii) Appraisal/ Assessment of Right-of-Way (ROW) situation on carriageway towards Delhi, (iv) Photographic views of site locations as well as traffic conditions, (v) Videographic coverage of site as well as traffic conditions, (vi) Live coverage of WIM system functioning on NH-08 (Jaipur-Kishangarh Expressway) to get firsthand knowledge, (vii) Live coverage of Toll Plaza on NH-08 near Gurgaon, (viii) Literature search on aspects of WIM system and formulate suitable Specifications for Indian conditions, (ix) To identify ideal locations for installation of Weigh-In-Motion system for Pilot Study.
Based on the data/information available through (i) site assessment and its appraisal, (ii) traffic surveys, and (iii) situational studies carried out at fifteen (15) identified entry points/borders of Delhi, the following major recommendations/suggestions can be made:
Out of 15 entry points, only 9 entry points, as indicated in Table X, are found to be feasible for installation of WIM system. Therefore, these 9 locations only may be considered further by the concerned agencies.
Fig. 105 Oversized multi-axle vehicle plying on border
Fig. 106 Typical view of Badarpur border
Fig. 107 Typical view of Kalindikunj border
Annual Report 2009-10
114
Traffic & Transportation
Planning
Transport Planning and Environment
Table X : Recommended Locations for Installation of WIM System
Entry Point No.
Description BorderInstallation of WIM Required
(Yes/No)
Feasibilityof WIM(Yes/No)
Reasons for Recommendation
1. Badarpur Border Delhi/ Haryana Yes Yes Substantial commercial traffic and availability of space
2. Kalindikunj Border Delhi/UP Yes NoLarge number of commercial traffic but constraint of
land
3. Chilla Border Delhi/UP No No Low commercial traffic. Constraint of space / land
4. Mandigaon Border Delhi/Haryana No No Very low commercial traffic. However, land is available
5. Ayanagar Border Delhi/Haryana Yes Yes Moderate to high commercial traffic. land is available
6. Toll Plaza on NH-8 Delhi/Haryana Yes Yes Substantial commercial traffic. Space is available
7.S i n g h u / K u n d l i
BorderDelhi/Haryana Yes Yes High commercial traffic. Space is available
8. Bhopura Border Delhi/UP Yes Yes Moderate to high commercial traffic. Land is available
9. Loni Border Delhi/UP No No Less commercial traffic. Constraint of space/ land
10. Ghazipur Border Delhi/UP Yes Yes Substantial commercial traffic. Land is available
11.ISBT Anand Vihar
BorderDelhi/UP No No
High volume mixed traffic but low number of commercial
vehicles. Constraint of Land
12. Apsara Border Delhi/UP Yes Yes High commercial traffic. Space is available
13. Tikri Border Delhi/Haryana Yes Yes High commercial traffic. Space is available
14. Dhansa Border Delhi/Haryana No No Very low commercial traffic Land is available
15. Kapashera Border Delhi/Haryana Yes Yes High commercial traffic. Space is available
Fig. 108 Typical view of traffic movement at toll plaza
CRRI New Delhi
115
Traffic & Transportation
Planning
Transport Planning and Environment
Modelling Time Mean Speed and Space Mean Speed for Heterogeneous Traffic Conditions
Speed, a primary element in the area of traffic engineering has a wide range of applications. For instance, it has a vital role in determining capacity of roads through speed-flow relationships, geometric design of roads, implementation of traffic control measures to improve safety, fuel consumption and associated vehicle operating cost components for economic evaluation of road projects, evaluation of performance through journey speed etc. The mean vehicular speed on roads is generally represented in two forms namely Time Mean Speed (TMS) and Space Mean Speed (SMS). TMS is defined as the arithmetic average of speeds of vehicles observed passing a point on a highway and is also referred to as the average spot speed. Individual speeds of vehicles passing a point are recorded and are arithmetically averaged (HCM, 2000) as shown below:
UT =i=1nuin ----------- (1)
where UT is time mean speed in Km/h
ui is spot speed of ith vehicle in Km/h
n is total number of vehicles traversing in the defined period of time
SMS is a statistical term frequently used to denote an average speed based on the average travel time of vehicles to traverse a segment of roadway. Because of this it is called SMS and average travel time essentially weighs according to the length of time each vehicle spends in the defined roadway segment or space (HCM, 2000) as shown below:
US= d1n i=0nti ----------- (2)
where US is space mean speed in Km/h
d is the length of the selected stretch in Km
ti is time spent by ith vehicle in defined stretch of roadway in hours
n is total number of vehicles traversing in the defined period of time
In developed countries where homogeneous traffic conditions and traffic lane discipline prevails, SMS data is usually collected by automatic methods using induction loops, infrared scanners etc. (Han, et. al., 2010). But in these situations, the length of stretch is very small. TMS is collected usually employing laser and radar based techniques. However, in India, the presence of induction loops etc. to measure the spot speeds/time mean speeds which can be used as the primary input to the calculation of travel times, are close to negligible. Hence the travel time/space mean speed calculations are carried out based on manual methods such as registration plate method, moving car method etc. The processes involved in these methods are very tedious and require a huge manpower.
The heterogeneous traffic data collected from the following four road sections around the city of Delhi, India was analyzed and the estimation of TMS and SMS values from Wardrop and Rakha’s model were carried out.
1. Greater Noida Expressway near Lotus Valley School
2. Greater Noida Expressway near Panchsheel Bal Inter College

Annual Report 2009-10
116
Traffic & Transportation
Planning
Transport Planning and Environment
3. Delhi - Gurgaon Expressway near Mahipalpur
4. National Highway 1 near Sonepat
Correlation plots between the measured and estimated values of TMS and SMS were made as shown in Fig. 109, using the above mentioned models. The figure highlights the poor estimates of TMS and SMS obtained using these conventional models. In the case of TMS estimation from Wardrop equation, all the points lies below the 45 degree line indicating under prediction of TMS whereas in case of SMS estimation from Rakha and Zhang equation all the points lies above 45 degree showing over prediction of SMS. The poor performance by these conventional models can be attributed to high variance of speeds due to the heterogeneous traffic conditions that exist on Indian roads. From these results, it becomes imperative to modify these models to represent the heterogeneous traffic conditions with sufficient accuracy. The development of proposed speed model is described in subsequent sections.
The proposed models for estimation of TMS are as follows:
TMS 1: UT=aUS+ bσS2US
TMS 2: UT= USa+ σS2USb
where a and b are model parameters to be estimated.
The above TMS 1 and TMS 2 models were calibrated and model parameters were estimated using SPSS software. The calibration process was carried out using the data collected at three test section viz. Greater Noida Expressway and Delhi - Gurgaon Expressway whereas National Highway 1 data was used for validation purposes. The estimated statistical results along with Root Mean Square Error (RMSE) values from TMS modeling are shown in Table XI .
These models were further compared with Wardrop model (1952) to demonstrate the accuracy in considering heterogeneous traffic conditions and the same is presented in Table XII. From Table, it can be clearly inferred that TMS 1 and TMS 2 models are far better than Wardrop model and TMS 1 model has high accuracy in terms of less RMSE and percentage error values
(a) TMS from Wardrop Model
Fig. 109 Correlation between the observed and estimated speeds
(b) SMS from Rakha and Zhang Model
CRRI New Delhi
117
Traffic & Transportation
Planning
Transport Planning and Environment
Table XI . Parameter Estimates of Different TMS Models
ModelModel Parameter RMSE
ValueSample Size
a b
TMS 1 Model1.368
(0.050*, 27.401$)1.091
(0.169*, 6.454$)13.62 78
TMS 2 Model1.080
(0.008*, -$)1.040
(0.044*, -$)14.12 78
* Standard error, $ t-value
Table XII Validation Results of Different TMS Models
Model Percentage of Error RMSE Value Sample Size
Wardrop Model 23.76 17.14 33
TMS 1 Model -6.47 14.35 33
TMS 2 Model -6.20 15.23 33
The estimated statistical results along with Root Mean Square Error (RMSE) values from SMS modeling are shown in Table XIII. From Table, it can be observed that SMS 1 model has
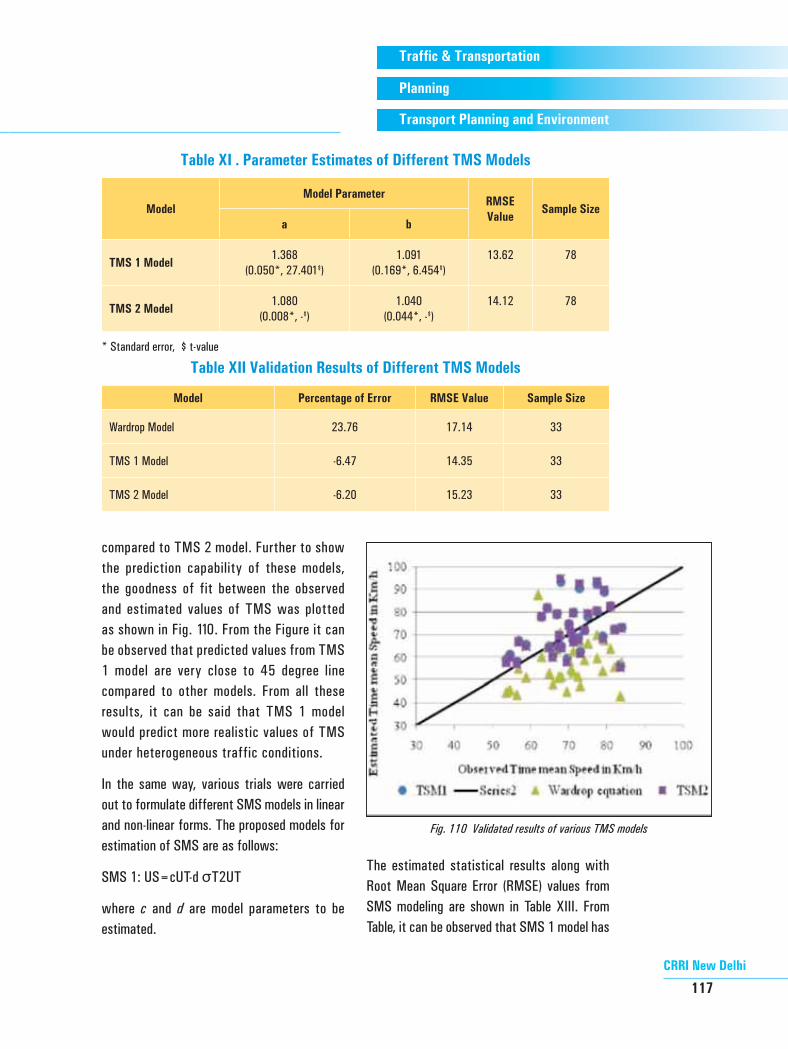
Fig. 110 Validated results of various TMS models
compared to TMS 2 model. Further to show the prediction capability of these models, the goodness of fit between the observed and estimated values of TMS was plotted as shown in Fig. 110. From the Figure it can be observed that predicted values from TMS 1 model are very close to 45 degree line compared to other models. From all these results, it can be said that TMS 1 model would predict more realistic values of TMS under heterogeneous traffic conditions.
In the same way, various trials were carried out to formulate different SMS models in linear and non-linear forms. The proposed models for estimation of SMS are as follows:
SMS 1: US=cUT-d σT2UT
where c and d are model parameters to be estimated.
Annual Report 2009-10
118
Traffic & Transportation
Planning
Transport Planning and Environment
Table XIII Parameter Estimates of Different SMS Models
ModelModel Parameter
R2 RMSE Value
Sample Sizec d
SMS 1 Model0.694
(0.050*, 13.783$)1.343
(0.634*, 2.120$)0.9 10.04 78
* Standard error, $ t-value
Table XIV Validation Results of Different SMS Models
Model Percentage of Error RMSE Value Sample Size
Rakha and Zhang Model -53.29 22.81 33
SMS 1 Model -12.97 11.06 33
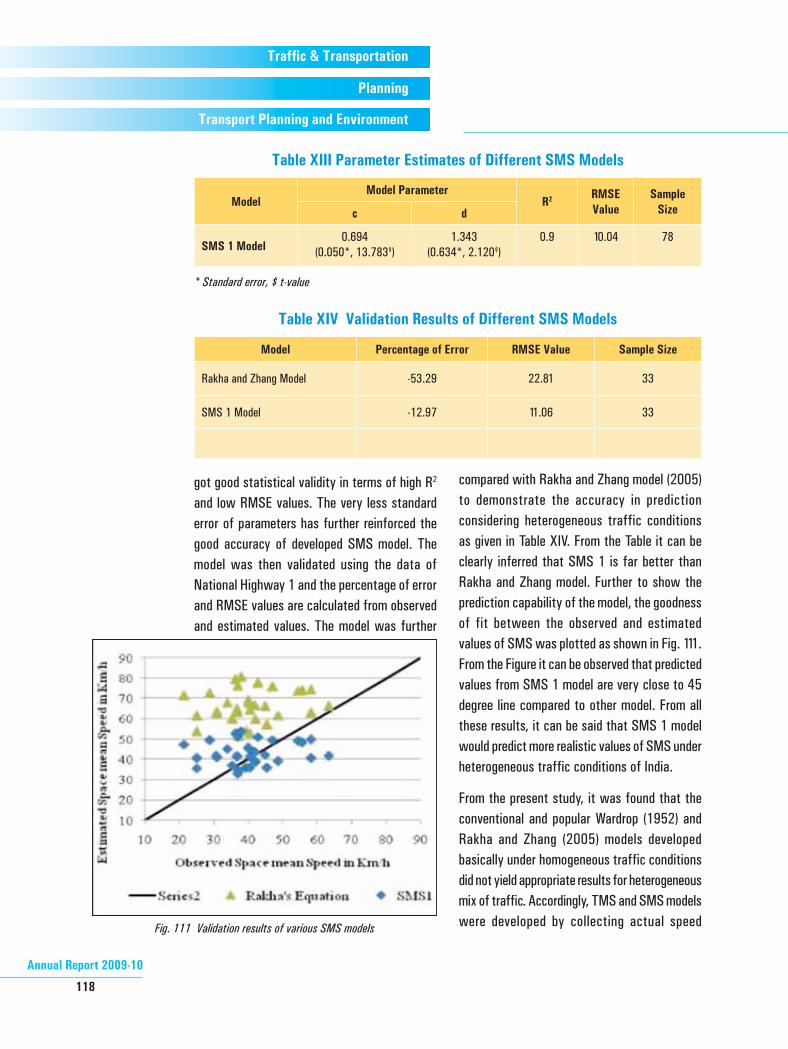
Fig. 111 Validation results of various SMS models
got good statistical validity in terms of high R2 and low RMSE values. The very less standard error of parameters has further reinforced the good accuracy of developed SMS model. The model was then validated using the data of National Highway 1 and the percentage of error and RMSE values are calculated from observed and estimated values. The model was further
compared with Rakha and Zhang model (2005) to demonstrate the accuracy in prediction considering heterogeneous traffic conditions as given in Table XIV. From the Table it can be clearly inferred that SMS 1 is far better than Rakha and Zhang model. Further to show the prediction capability of the model, the goodness of fit between the observed and estimated values of SMS was plotted as shown in Fig. 111. From the Figure it can be observed that predicted values from SMS 1 model are very close to 45 degree line compared to other model. From all these results, it can be said that SMS 1 model would predict more realistic values of SMS under heterogeneous traffic conditions of India.
From the present study, it was found that the conventional and popular Wardrop (1952) and Rakha and Zhang (2005) models developed basically under homogeneous traffic conditions did not yield appropriate results for heterogeneous mix of traffic. Accordingly, TMS and SMS models were developed by collecting actual speed
CRRI New Delhi
119
Traffic & Transportation
Planning
Transport Planning and Environment
data of heterogeneous traffic conditions. After making a critical comparison with conventional models, the superiority of the proposed models was demonstrated. It can be concluded based on this study that the conventional models as such cannot be used for Indian traffic conditions and therefore the proposed TMS 1 and SMS 1 models are found to be better estimators and consistent in predicting speeds with high accuracy especially for heterogeneous traffic conditions.
Modification of Bitumen and Its Emission Characteristics
There is always a need to develop new bituminous material for roads in order to face increased traffic, heavier loads etc as well as for longer repairing periods and reduce the total cost in roads maintenance / construction. Neat bitumen at higher temperatures is very soft material while at lower temperatures it is brittle material. Therefore this neat bitumen is modified / blended with different types of polymers to get desired properties. For a polymer to be effective, it must blend with the bitumen and improve resistance at high temperatures without making the bitumen too viscous at mixing temperatures or too brittle at low temperatures. So, the blending / modification of bitumen will be done at always high temperature which is much higher than its softening point.
Bitumen is very complex material and is widely known for its carcinogenic nature. It is main material used for road pavement, roofing etc. Therefore it is always associated with the health hazards for the workers associated with this industry. A study has been undertaken
characterize bitumen emission while modification in the laboratory as well as at hot mix plant.
Speed-Flow Characteristics and Capacity of Four-Lane and Six-Lane Divided Carriageway
Roadway capacity is a very important parameter that is needed in almost every phase of roadway planning. It is usually estimated from speed-flow relationships and these are applied in many areas of transportation and traffic engineering. It has been used as a tool to determine design capacities for roads, to determine level of service for traffic flow and to calculate travel costs on a specific road section. In India, practically very little research was done on this important field till 1980. Traffic studies on India roads were conducted extensively for the first time under the project titled Road User Cost Study (CRRI, 1982) and were subsequently updated through different studies over the years (URUCS, 1992 and 2001). As the quantum of high speed corridors have started increasing quite drastically, these equations have to be necessarily extended for the high speed corridors as well. Also, vast changes have taken place in the country in the recent past in the transportation sector. The technology of vehicles itself has undergone major changes. New technology cars and light commercial vehicles have come on Indian roads in a big way. Also, the country is embarking upon major programmes of improvements and widening of highways under NHDP. All these developments have a definite bearing on traffic flow, and in order to make its evaluation further research work in this direction is required to establish speed-flow relationships and determine capacity of roads for the changing scenario.
Annual Report 2009-10
120
Traffic & Transportation
Planning
Transport Planning and Environment
In developing countries like India, where the traffic is heterogeneous, the research findings of developed countries cannot be applied directly.
In this study, realistic profile of free speeds are established and evolved speed-flow relationships for High Speed Corridors for different vehicle types and thus estimated the capacity of High Speed Corridors (namely Four-Lane and Six-Lane carriageways) for the first time in the country. It is expected that the proposed equations and capacities would improve the reliability of results in carrying out realistic economic evaluation of roads and thus help in the effective evaluation and implementation of polices.
Development of Vehicle Operating Cost Equations for High Speed Corridors
Transport sector plays a very significant role in improving the economic development of any country. Fast depleting financial, land and other resources and ever increasing travel demand calls for careful planning for optimum utilization of resources in the road transportation sector. It is most essential to utilise the available resources in an optimal way to provide an efficient road infrastructure and enable the economy to grow with minimum hindrance. In the process of economic analysis of highways projects, assessment of Vehicle Operating Cost (VOC) plays a predominant role. The major factors affecting the VOC are the speed coupled with traffic flow characteristics at which vehicles operate on roads which in turn determines fuel consumption and other cost components per unit distance traveled. In the last decade, Government of India has been involved in road capacity
augmentation by building high speed corridors to link major cities through the implementation of various projects like Golden Quadrilateral, North-South, East-West and some Expressway Corridors. These radical changes in road network and vehicle technology have resulted in variations in speed - flow characteristics and subsequently road user costs. Considering the above mandate of the Government, it is felt essential to quantify the investment made on the multilane highways by developing VOC models exclusive to the high speed corridors. The term ‘High Speed Corridors’ implies for the two-lane to multi-lane divided carriageways.
In the present study, an attempt was made first time in the country to develop VOC equations for different vehicle types which are basically explaining the relationship between VOC components and influencing factors primarily vehicle and road characteristics. Further, it is observed that significant increase in levels of congestion on Indian roads is affecting the road user costs.
Study of Benzene and Volatile Organic Compounds (VOCs) in Delhi
This study mainly focuses on the estimation of benzene and VOCs (Volatile Organic Compounds) due to vehicular traffic and road traffic. The objectives and scope of this study included.
• To assess the concentration of benzene in different locations such as petrol pump, residential areas and other road side corridors.
• To monitor the air concentration of benzene and other aromatic Volatile
CRRI New Delhi
121
Traffic & Transportation
Planning
Transport Planning and Environment
Organic Compounds in corridors with dense traffic and to determine the emissions from the car fleet.
Volatile Organic Compounds (VOCs) play a significant role in the generation of urban photochemical smog. In addition some VOCs like benzene, toluene and xylene are harmful to human health. In India, motor vehicles are the dominants source of VOCs therefore it is important to determine the emission of VOCs from vehicles in order to estimate human risk and the production mechanisms of photochemical smog. Benzene is a ubiquitous chemical and it is found in refined petroleum products like gasoline. It is volatile and it has been estimated that 10kg of benzene is lost per ton of benzene produced, during transfer and storage, with approximately 94 percent lost as air emissions and 6 percent as water effluents.
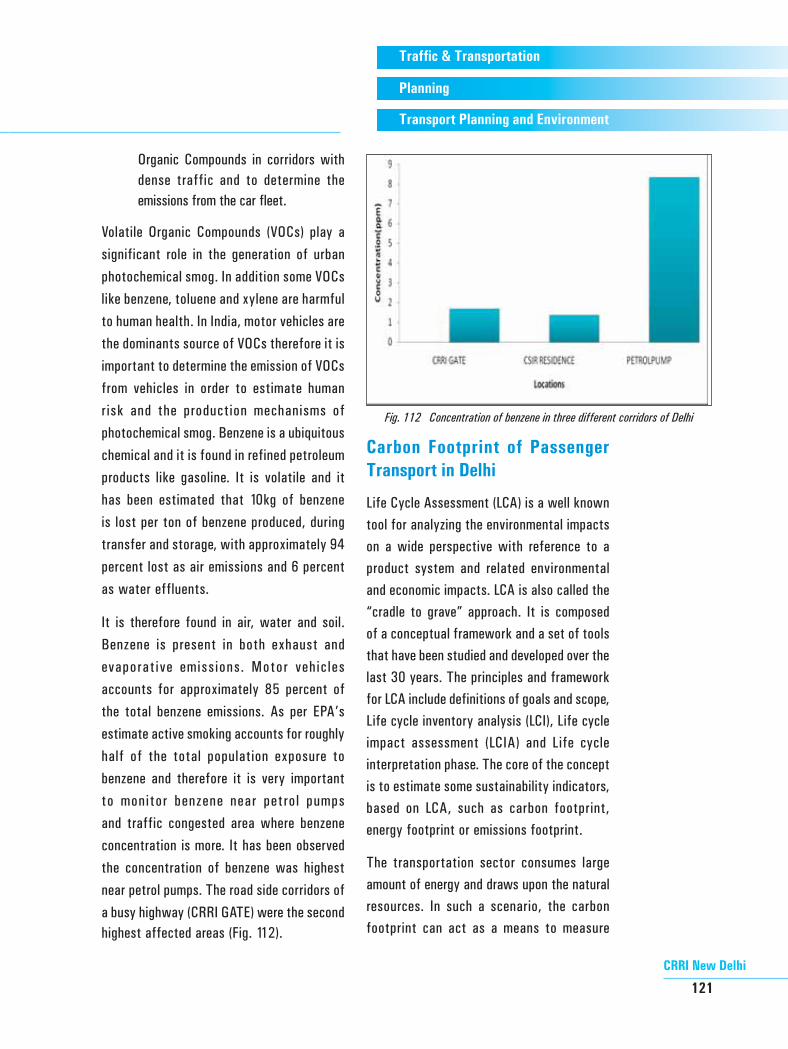
It is therefore found in air, water and soil. Benzene is present in both exhaust and evaporative emissions. Motor vehicles accounts for approximately 85 percent of the total benzene emissions. As per EPA’s estimate active smoking accounts for roughly half of the total population exposure to benzene and therefore it is very important to monitor benzene near petrol pumps and traffic congested area where benzene concentration is more. It has been observed the concentration of benzene was highest near petrol pumps. The road side corridors of a busy highway (CRRI GATE) were the second highest affected areas (Fig. 112).
Carbon Footprint of Passenger Transport in Delhi
Life Cycle Assessment (LCA) is a well known tool for analyzing the environmental impacts on a wide perspective with reference to a product system and related environmental and economic impacts. LCA is also called the “cradle to grave” approach. It is composed of a conceptual framework and a set of tools that have been studied and developed over the last 30 years. The principles and framework for LCA include definitions of goals and scope, Life cycle inventory analysis (LCI), Life cycle impact assessment (LCIA) and Life cycle interpretation phase. The core of the concept is to estimate some sustainability indicators, based on LCA, such as carbon footprint, energy footprint or emissions footprint.
The transportation sector consumes large amount of energy and draws upon the natural resources. In such a scenario, the carbon footprint can act as a means to measure
Fig. 112 Concentration of benzene in three different corridors of Delhi

Annual Report 2009-10
122
Traffic & Transportation
Planning
Transport Planning and Environment
the amount of ecological pressure of a road, highway or a rail exerts on the earth. This research study aims to estimate the carbon footprint of the two main transport infrastructure, i.e. road and rail. Large amount of research has been done on the mobility and commuting indicators like travel distance, modal choice, travel time, vehicle speed etc. But while evaluating the impact of mobility on environment or on global warming, Co2 emissions or carbon footprint appears to be a preferable method. This method accounts for direct and indirect Co2 emissions.
Measurement of Fuel Consumption in Vehicles under Test Conditions
The objective of the study is (i) To measure fuel consumption for various speed, surface roughness, gradient and vehicle types and to develop relationship among the variables (ii) To facilitate calibration of user cost survey data.
The study will highlight the optimum fuel required for various road conditions thereby enabling efficient usage of fuels. The analysis conducted will serve a larger purpose as it will be used as an input to the road user cost study.
Fuel consumption study has been completed on one test section at Noida-Greater Noida Expressway covering various steady speed from 20 to 90 km/hr on Tata Sumo, 20 to 80 km/hr on Maruti Van, 20 to 70 km/hr on Tata Truck for all three load condition. Also completed study on test section including concrete and bituminous section at Hodal on NH-2 covering various steady speed from 20 to 80 km/hr on Tata Sumo, Maruti Van and
on Tata Truck for all three load conditions (empty, half, full).
The driver evaluation was done in two aspects (i) Fuel consumption tests (involving five drivers) consisting of steady speed test and driving style test and (ii) Laboratory tests (involving six drivers) consisting of visual ability and sensory motor tests. In all four drivers were common for both type of tests and the comparison between fuel studies (steady speed and driving style) and laboratory studies (visual ability and sensory motor test) has been made with respect to these drivers.
In steady speed test, it has been observed from the test results for both the vehicles (i.e. Tata Sumo and Maruti Van) the drivers used different gear position for all steady speed tests except for steady speed of 70 km/hr for Maruti Van (all the drivers used 4th gear since option of overdrive (5th gear) was not available in the vehicle).The maximum influence on variation in fuel consumption among drivers was observed due to choice of different gear position for the same steady speed test The variation in fuel consumption among drivers varied up to 160 percent in steady speed test for Tata Sumo and up to 96 percent in steady speed test for Maruti Van.
In driving style tests, drivers used different gear combination for Tata Sumo but for Maruti Van all the drivers used the same gear combination. In driving style tests the variation in fuel consumption among drivers was up to 42 percent for Tata Sumo and up to 34 percent for Maruti Van.
The study results reveal that for Maruti Van, there do not seem to be much variation in use
CRRI New Delhi
123
Traffic & Transportation
Planning
Transport Planning and Environment
of gear especially in driving style due to the lower power of the vehicle. For Tata Sumo there seems to be large variation in use of the gears due to the reserve power available with the vehicle. It could be stated that gear change habbit has significant influence on the overall fuel consumption particularly for vehicles with higher reserve power.
While comparing the results of fuel tests (steady speed and driving style tests) to that of laboratory tests (visual ability and sensory motor tests) it is to be borne in mind that the steady speed tests has no relation to the safety aspects of driving as the driver was instructed to maintain the steady speed in a situation where there was no conflict with the traffic. However, the aspects of fuel economy and safety are reflected in the choice of gear position in the case of driving style tests.
In case of laboratory tests (visual ability and sensory motor tests) the aspects of safety of the driver is highlighted. The comparison of fuel tests to that of laboratory test was intended to understand whether safe driver are the most economical drivers. From the field results the ranking of drivers as per fuel economy (out of the drivers who took both the tests fuel and laboratory) is as follows (i) Rank I-Driver 3 (ii) Rank II-Driver 5 (iii) Rank III-Driver 2 (iv) Rank IV-Driver 6, whereas from the laboratory studies the ranking of drivers as per safety is as follows (i) Rank I-Driver 6 (ii) Rank II-Driver 5 (iii) Rank III-Driver 3 (iv) Rank IV-Driver 2.
By inter comparison of the performance of drivers in fuel tests to that of laboratory test, it has been observed that the drivers who were ranked higher based on performance related to
fuel economy were found to be ranked lower in the laboratory test. The results therefore highlight the point that safe drivers might not be the economical (fuel) drivers and similarly most economical driver might not be the safe driver
Stud ies o f Non - Methane Hydrocarbons in the Atmospheric Environment of Delhi Region
Non – methane hydrocarbon and oxides of nitrogen emitted from various anthropogenic sources in urban areas may cause an increase in the concentration of ozone in the troposphere. Ozone (tropospheric ozone) can have a negative impact on the environment and public health when present in the lower atmosphere in sufficient quantities. Ozone, however, is unique among pollutants because it is not emitted directly in to the air. It is a secondary pollutant, which is generated when nitrogen oxides (NOx) and non – methane hydrocarbon (NMHC) interact under the action of sunlight. Therefore, the primary pollutants NOx and NMHC are referred to as ozone precursors. Non- methane hydrocarbons with upto 10 carbon atoms form the main part of volatile organic compounds in urban areas. The increasing concerns of the scientific community and local authorities in non – methane hydrocarbon detection is due to the potential carcinogenity of some of these compounds like benzene. Non – methane hydrocarbons emitted in the atmosphere are pollutants of special concern due to their adverse health impact and their implication in ozone and other toxic secondary pollutants formation. Major anthropogenic non – methane hydrocarbon sources in urban areas include vehicle exhaust
Annual Report 2009-10
124
Traffic & Transportation
Planning
Transport Planning and Environment
gas, vehicle fuel evaporation and distribution, solvent use, natural gas emission and industrial processes. Therefore it is important to study non – methane hydrocarbons in the atmospheric environment of Delhi region-a mega city.
As we know Delhi has extra burden of non – methane hydrocarbons emitted from various industries as well as vehicular exhaust in its atmospheric air. This may affect its surroundings by prevailing winds i.e. it affects regionally and ultimately globally.
Therefore, the study of non – methane hydrocarbon in the atmospheric environment of Delhi region, could be a significant step to elucidate the relationship between ozone and its precursors like non – methane hydrocarbons. It may help in formulating policy measures to control ozone and its precursors.
Development of Road User Cost Models for High Speed Corridors
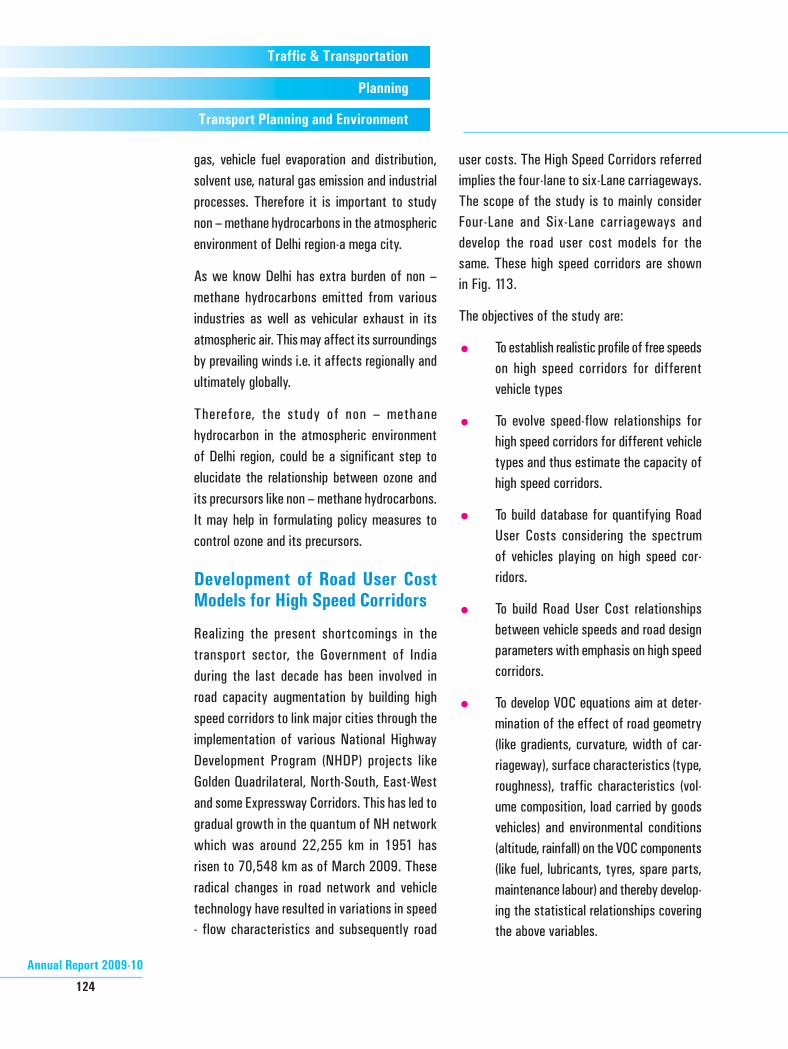
Realizing the present shortcomings in the transport sector, the Government of India during the last decade has been involved in road capacity augmentation by building high speed corridors to link major cities through the implementation of various National Highway Development Program (NHDP) projects like Golden Quadrilateral, North-South, East-West and some Expressway Corridors. This has led to gradual growth in the quantum of NH network which was around 22,255 km in 1951 has risen to 70,548 km as of March 2009. These radical changes in road network and vehicle technology have resulted in variations in speed - flow characteristics and subsequently road
user costs. The High Speed Corridors referred implies the four-lane to six-Lane carriageways. The scope of the study is to mainly consider Four-Lane and Six-Lane carriageways and develop the road user cost models for the same. These high speed corridors are shown in Fig. 113.
The objectives of the study are:
� To establish realistic profile of free speeds on high speed corridors for different vehicle types
� To evolve speed-flow relationships for high speed corridors for different vehicle types and thus estimate the capacity of high speed corridors.
� To build database for quantifying Road User Costs considering the spectrum of vehicles playing on high speed cor-ridors.
� To build Road User Cost relationships between vehicle speeds and road design parameters with emphasis on high speed corridors.
� To develop VOC equations aim at deter-mination of the effect of road geometry (like gradients, curvature, width of car-riageway), surface characteristics (type, roughness), traffic characteristics (vol-ume composition, load carried by goods vehicles) and environmental conditions (altitude, rainfall) on the VOC components (like fuel, lubricants, tyres, spare parts, maintenance labour) and thereby develop-ing the statistical relationships covering the above variables.
CRRI New Delhi
125
Traffic & Transportation
Planning
Transport Planning and Environment
In the present study, an attempt has been made to identify the need to develop the equations of VOC components for specific vehicle types operating on high speed corridors in varied conditions. The vehicle types considered in the present study include small car, big car, bus, LCV, HCV and MAV. The data used are based on fuel consumption experiments conducted on selected road sections along with VOC data obtained during the road user cost study data collection from vehicle owners / operators. Using the above data, VOC model for different vehicle have been developed. Following conclusions are drawn from the study.
� The mean free speed of cars is more or less same in four lane and six lane divided
carriageways, however it is slightly more in the case of heavy vehicles on six-lane as compared to four-lane divided carriageways.
� Separate speed-flow equations for uncongested and congested parts are developed for four lane and six lane divided carriageways. From the statistical results, it can be said that these equations can predict realistic capacity values as their R2 values are very good coupled with low value of the standard error of the coefficient and the constant.
� The comparison of free speed and intercepts of speed-flow equations shows
Golden Quadrilateral
(GQ) Corridor
North – South
(NS) CorridorEast – West
(EW) Corridor
Fig.113 High speed corridors in India

Annual Report 2009-10
126
Traffic & Transportation
Planning
Transport Planning and Environment
� Similarly, the free speeds of buses, HCVs and MAVs have also increased substantially by about 12, 10 and 23 percent respectively whereas the free speed of LCVs has registered a marginal increase of about 2 percent as compared to 2001 study.
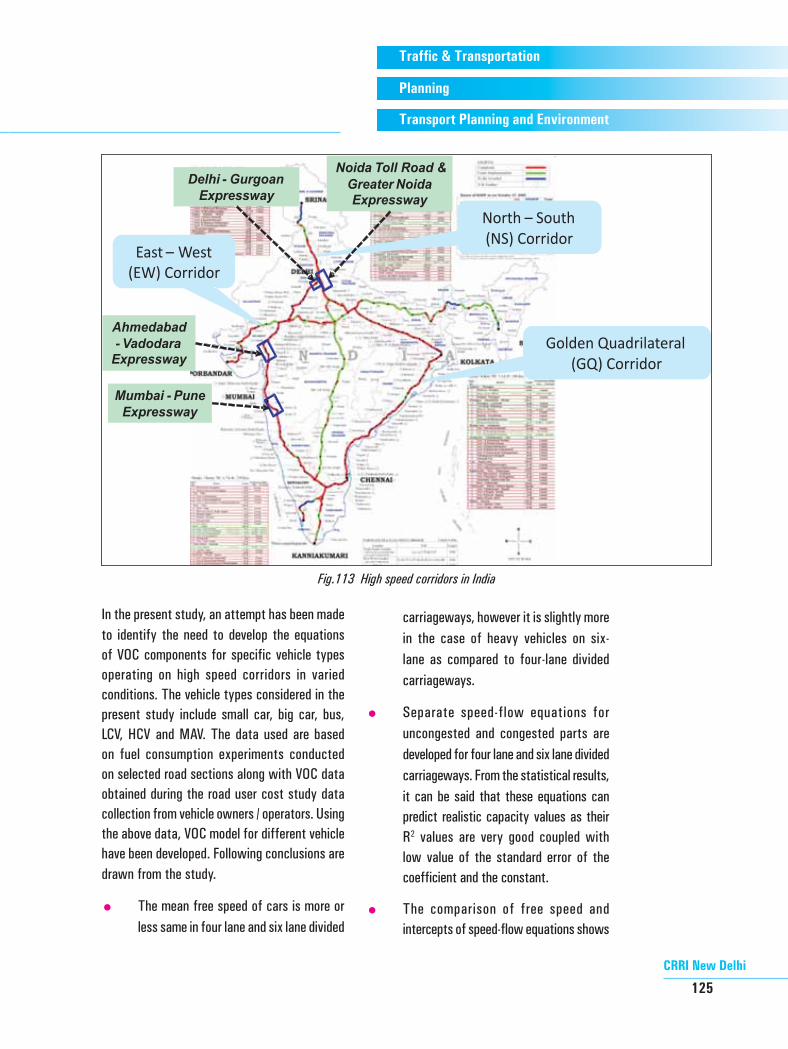
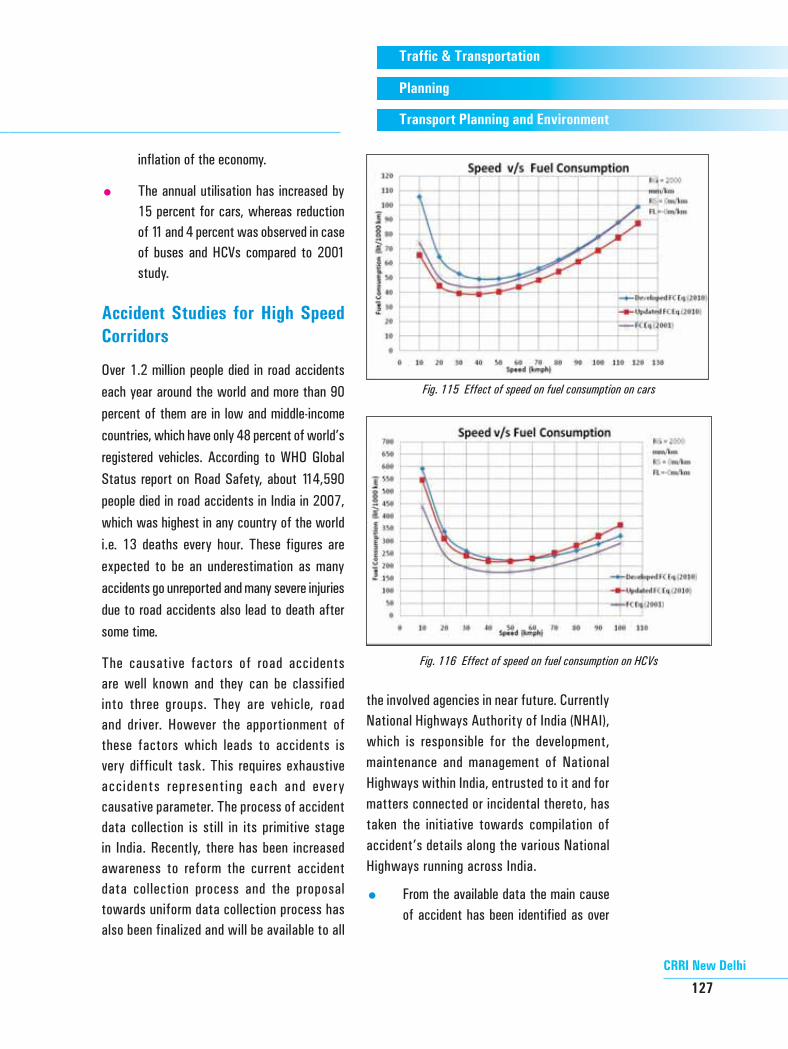
� Interestingly, the fuel consumption studies illustrate that the fuel consumption rate has increased as compared to 2001 study which implies the rapid advancements in vehicle technologies coupled with enhancements engine characteristics such as horsepower, engine capacity etc. (Figs. 115 & 116). On the contrary, the speed at optimum fuel consumption has gone up by about 4 to 10 km/h which can be termed as the ideal speed of the vehicle for achieving better fuel efficiency
� In case of Engine oil consumption, it was observed that 63 and 36 percent reduction for bus and HCV, however 31 percent increase was observed for LCV.
� Tyre life has increased drastically about 55 percent in case of buses, which can be attributed to advancements in tyre manufacturing and also improvements in road characteristics.
� The repairs and maintenance cost has drastically increased by 5 times compared with 2001 in case of cars. The increment is more than 100 percent in case of buses and LCVs which can be attributed to hike occurred in labour charges, cost of the spare parts due to
Fig. 114 Speed-flow relationship for four-lane divided carriageway
that developed speed-flow equations are consistent.
� Considering this, the speed - flow equation developed using for cars (having the PCU value of 1) can be used with assurance for fixing capacity norms of multi-lane highways on Indian roads. Hence, the estimated capacity for the four-lane divided carriageways is 5123 PCU/hr/direction (Fig. 114).
� The speed of the vehicle mainly depends upon roadway factors like roughness, rise and fall, road width and curvature. Considering this, the free speeds of small and big cars have increased compared to 2001 study by 24 percent and 27 percent respectively which can be attributed to rapid improvement in highway standards coupled with advancements in vehicle technologies.
CRRI New Delhi
127
Traffic & Transportation
Planning
Transport Planning and Environment
inflation of the economy.
� The annual utilisation has increased by 15 percent for cars, whereas reduction of 11 and 4 percent was observed in case of buses and HCVs compared to 2001 study.
Accident Studies for High Speed Corridors
Over 1.2 million people died in road accidents each year around the world and more than 90 percent of them are in low and middle-income countries, which have only 48 percent of world’s registered vehicles. According to WHO Global Status report on Road Safety, about 114,590 people died in road accidents in India in 2007, which was highest in any country of the world i.e. 13 deaths every hour. These figures are expected to be an underestimation as many accidents go unreported and many severe injuries due to road accidents also lead to death after some time.
The causative factors of road accidents are well known and they can be classified into three groups. They are vehicle, road and driver. However the apportionment of these factors which leads to accidents is very difficult task. This requires exhaustive accidents representing each and every causative parameter. The process of accident data collection is still in its primitive stage in India. Recently, there has been increased awareness to reform the current accident data collection process and the proposal towards uniform data collection process has also been finalized and will be available to all
the involved agencies in near future. Currently National Highways Authority of India (NHAI), which is responsible for the development, maintenance and management of National Highways within India, entrusted to it and for matters connected or incidental thereto, has taken the initiative towards compilation of accident’s details along the various National Highways running across India.
� From the available data the main cause of accident has been identified as over
Fig. 115 Effect of speed on fuel consumption on cars
Fig. 116 Effect of speed on fuel consumption on HCVs
Annual Report 2009-10
128
Traffic & Transportation
Planning
Transport Planning and Environment
the accident are correlated is nullified by the data analysed using chi square test. The test elaborated that the severity of the accident does not depend of the type of vehicles involved in the accident.
� However the data analysis also proved that in case of vehicles noted as “un-known” the hypothesis that the severity of accident depends on the vehicle type involved in the accident holds true. Hence the data involving “unknown” vehicles cannot be ignored.
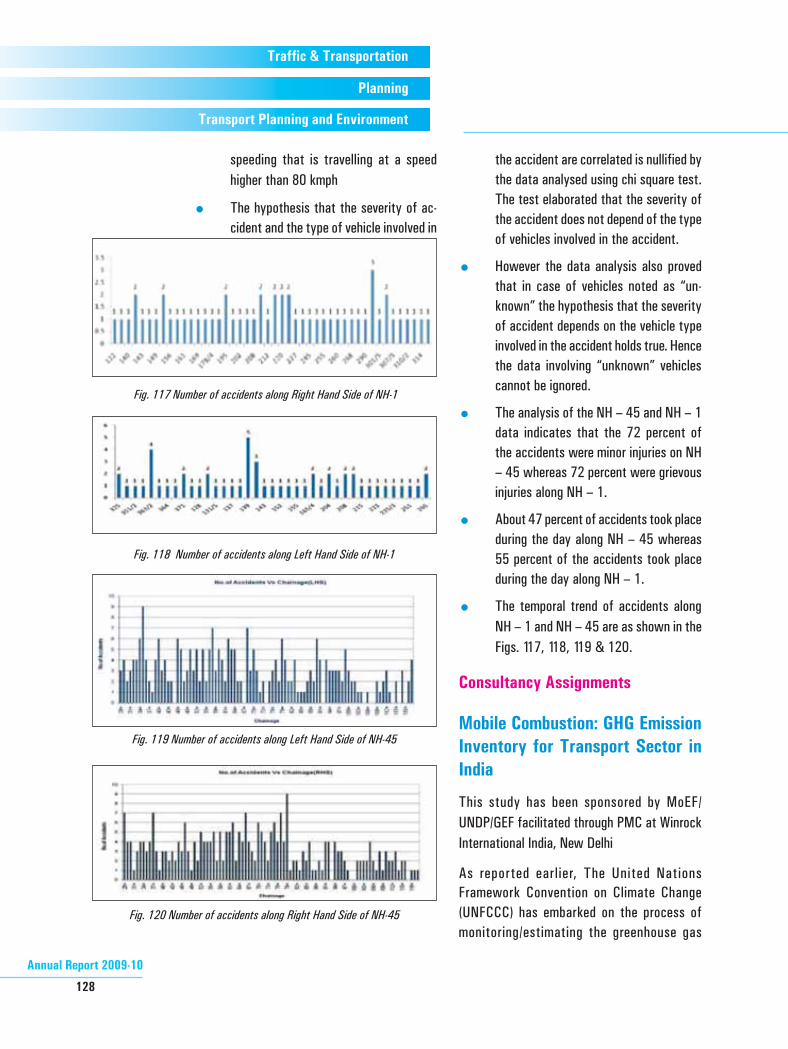
� The analysis of the NH – 45 and NH – 1 data indicates that the 72 percent of the accidents were minor injuries on NH – 45 whereas 72 percent were grievous injuries along NH – 1.
� About 47 percent of accidents took place during the day along NH – 45 whereas 55 percent of the accidents took place during the day along NH – 1.
� The temporal trend of accidents along NH – 1 and NH – 45 are as shown in the Figs. 117, 118, 119 & 120.
Consultancy Assignments
Mobile Combustion: GHG Emission Inventory for Transport Sector in India
This study has been sponsored by MoEF/UNDP/GEF facilitated through PMC at Winrock International India, New Delhi
As reported earlier, The United Nations Framework Convention on Climate Change (UNFCCC) has embarked on the process of monitoring/estimating the greenhouse gas
Fig. 117 Number of accidents along Right Hand Side of NH-1
Fig. 118 Number of accidents along Left Hand Side of NH-1
Fig. 119 Number of accidents along Left Hand Side of NH-45
Fig. 120 Number of accidents along Right Hand Side of NH-45
speeding that is travelling at a speed higher than 80 kmph
� The hypothesis that the severity of ac-cident and the type of vehicle involved in
CRRI New Delhi
129
Traffic & Transportation
Planning
Transport Planning and Environment
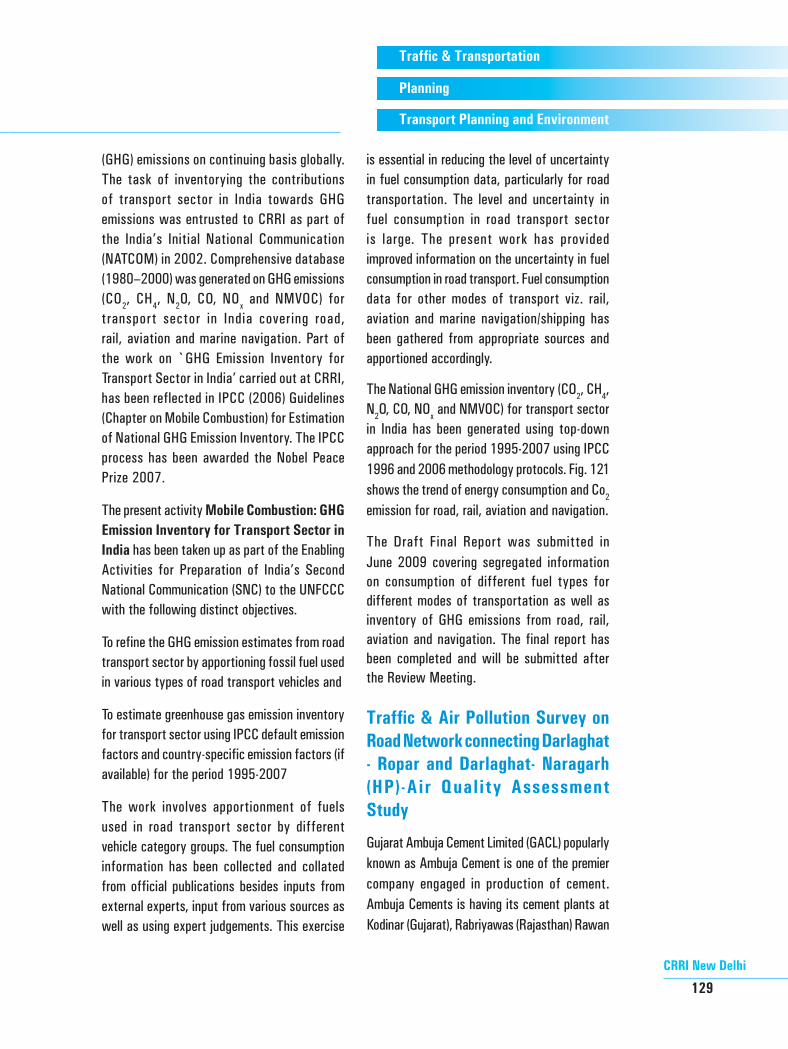
(GHG) emissions on continuing basis globally. The task of inventorying the contributions of transport sector in India towards GHG emissions was entrusted to CRRI as part of the India’s Initial National Communication (NATCOM) in 2002. Comprehensive database (1980–2000) was generated on GHG emissions (CO2, CH4, N2O, CO, NOx and NMVOC) for transport sector in India covering road, rail, aviation and marine navigation. Part of the work on `GHG Emission Inventory for Transport Sector in India’ carried out at CRRI, has been reflected in IPCC (2006) Guidelines (Chapter on Mobile Combustion) for Estimation of National GHG Emission Inventory. The IPCC process has been awarded the Nobel Peace Prize 2007.
The present activity Mobile Combustion: GHG Emission Inventory for Transport Sector in India has been taken up as part of the Enabling Activities for Preparation of India’s Second National Communication (SNC) to the UNFCCC with the following distinct objectives.
To refine the GHG emission estimates from road transport sector by apportioning fossil fuel used in various types of road transport vehicles and
To estimate greenhouse gas emission inventory for transport sector using IPCC default emission factors and country-specific emission factors (if available) for the period 1995-2007
The work involves apportionment of fuels used in road transport sector by different vehicle category groups. The fuel consumption information has been collected and collated from official publications besides inputs from external experts, input from various sources as well as using expert judgements. This exercise
is essential in reducing the level of uncertainty in fuel consumption data, particularly for road transportation. The level and uncertainty in fuel consumption in road transport sector is large. The present work has provided improved information on the uncertainty in fuel consumption in road transport. Fuel consumption data for other modes of transport viz. rail, aviation and marine navigation/shipping has been gathered from appropriate sources and apportioned accordingly.
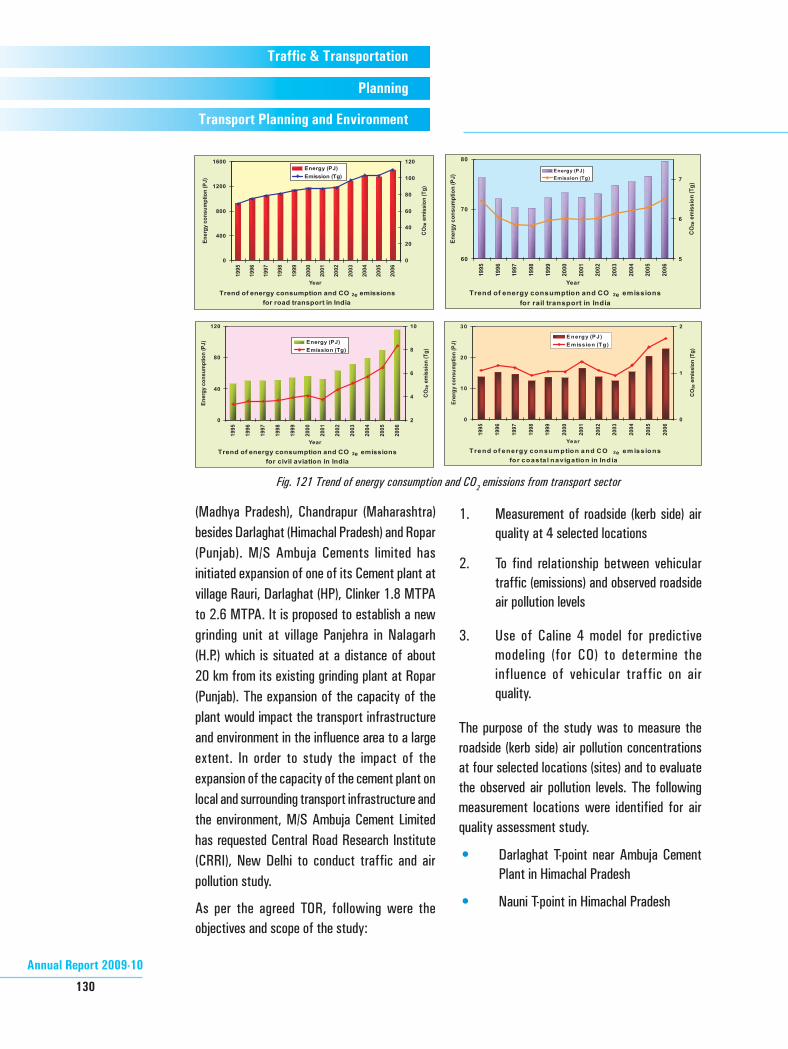
The National GHG emission inventory (CO2, CH4, N2O, CO, NOx and NMVOC) for transport sector in India has been generated using top-down approach for the period 1995-2007 using IPCC 1996 and 2006 methodology protocols. Fig. 121 shows the trend of energy consumption and Co2 emission for road, rail, aviation and navigation.
The Draft Final Report was submitted in June 2009 covering segregated information on consumption of different fuel types for different modes of transportation as well as inventory of GHG emissions from road, rail, aviation and navigation. The final report has been completed and will be submitted after the Review Meeting.
Traffic & Air Pollution Survey on Road Network connecting Darlaghat - Ropar and Darlaghat- Naragarh (HP)-Air Quality Assessment Study
Gujarat Ambuja Cement Limited (GACL) popularly known as Ambuja Cement is one of the premier company engaged in production of cement. Ambuja Cements is having its cement plants at Kodinar (Gujarat), Rabriyawas (Rajasthan) Rawan
Annual Report 2009-10
130
Traffic & Transportation
Planning
Transport Planning and Environment
(Madhya Pradesh), Chandrapur (Maharashtra) besides Darlaghat (Himachal Pradesh) and Ropar (Punjab). M/S Ambuja Cements limited has initiated expansion of one of its Cement plant at village Rauri, Darlaghat (HP), Clinker 1.8 MTPA to 2.6 MTPA. It is proposed to establish a new grinding unit at village Panjehra in Nalagarh (H.P.) which is situated at a distance of about 20 km from its existing grinding plant at Ropar (Punjab). The expansion of the capacity of the plant would impact the transport infrastructure and environment in the influence area to a large extent. In order to study the impact of the expansion of the capacity of the cement plant on local and surrounding transport infrastructure and the environment, M/S Ambuja Cement Limited has requested Central Road Research Institute (CRRI), New Delhi to conduct traffic and air pollution study.
As per the agreed TOR, following were the objectives and scope of the study:
1. Measurement of roadside (kerb side) air quality at 4 selected locations
2. To find relationship between vehicular traffic (emissions) and observed roadside air pollution levels
3. Use of Caline 4 model for predictive modeling (for CO) to determine the influence of vehicular traffic on air quality.
The purpose of the study was to measure the roadside (kerb side) air pollution concentrations at four selected locations (sites) and to evaluate the observed air pollution levels. The following measurement locations were identified for air quality assessment study.
• Darlaghat T-point near Ambuja Cement Plant in Himachal Pradesh
• Nauni T-point in Himachal Pradesh
Fig. 121 Trend of energy consumption and CO2 emissions from transport sector
CRRI New Delhi
131
Traffic & Transportation
Planning
Transport Planning and Environment
• Nalagarh (Ambuja Cement Factory site) in Himachal Pradesh.
• Kiratpur ((near Ropar) in Punjab
Continuous real-time measurements were carried out for air pollutants SO2, NOx, CO, HC, O3 and particulate matter (PM10) along with micrometeorological parameters at each of the selected locations on 24-hr basis. The measurements were carried out at the height of ~3m from the ground surface. In addition, micro-meteorological parameters such as wind speed, wind direction, ambient temperature and relative humidity are anticipated to be measured at each of the selected locations. Details of Dalaghat (one of the locations) comprising of Road Network, location, micro-meteorological parameters and pollutant distribution are shown in Fig. 122.
The pollutant distribution patterns indicate that besides motor vehicle emissions, other sources contribution predominates at few of the locations. Ozone levels were observed to relatively higher at hill locations (Darlaghat). PM10 levels were found to be lower at hill locations than for those along the planes (Nalagarh and Kiratpur). Contribution of natural roadside dust to PM and biomass burning to CO levels were observed.
The draft report was submitted to Ambuja Cement. Further work related to modelling (use of CALINE 4 model) is under progress.
Road Traffic and Air Pollution in Delhi
Delhi, the capital city of India is one of the most rapidly expanding mega cities and as per the Census of India (2001) it had a population
of 12.7 million in 2001 (estimated to be around 16.64 million in 2007). Delhi is very rapidly growing with an average annual population growth rate of about 4.5 percent (India has national average growth rate of 2.1 percent per annum). Delhi is having total registered vehicles of more than 5.63 million in 2008 (more than 12 percent of India’s automobile population) with the predominance of two wheelers and cars. The travel needs in Delhi are mainly met by road transport with a total road network of about 30,000 km, which includes all categories of roads.
The recent past transportation studies (CRRI, 1984 and CRRI, 2002) revealed that the travel demand has tremendously increased in the last three decades by more than two times in terms of per capita trip rate (vehicular) in a day from 0.45 in 1969 to about 1.0 in 2001. Further the latest transportation study (GNCTD, 2009) found that the major modes of transportation are buses, private vehicles (namely cars and two wheelers), taxis, auto rickshaws and bicycles in the order of total trips made in a day. But the trips made by car and two wheelers were increased significantly as compared to year 2001 whereas bus trips were reduced and redistributed among the other modes such as Metro, Cycle Rickshaws etc. Further the average trip lengths have increased marginally for all modes of transport over years.
The increase in average trip lengths is clearly indicating that the compact city concept was gradually diminishing. Travelling longer trip lengths a day is further increasing the pressure on exiting road network and increasing vehicular emissions. In order to curb these traffic and

Annual Report 2009-10
132
Traffic & Transportation
Planning
Transport Planning and Environment
Fig. 122 Diurnal distribution of pollutants at Darlaghat (HP)
CRRI New Delhi
133
Traffic & Transportation
Planning
Transport Planning and Environment
pollution loads, many different policies were proposed. However, a proper assessment of pollution loads from vehicular traffic is an essential requisite for any policy measures to enable to propose appropriate remedial measures to control the menace of congestion and air pollution. This aspect is very aptly emphasised in the CRRI study on Urban Road Traffic and Air Pollution (URTRAP) in 2002, which deals with the quantification of the travel demand and associated pollution loads in a scientific manner and thereby enabled in evaluating the impact of the proposed National Auto Fuel Policy apart from the devising road map for its implementation (CRRI, 2002). Considering the above facts, the present study aimed at estimating quantum of travel demand in terms of Vehicles Kilometres Travelled (VKT) by each mode and quantifies the associated pollution loads in Delhi and impact of National Auto fuel policy emission norms on vehicular pollution loads in Delhi.
Keeping the objectives and resources allotted for the present study in view, it was proposed to utilise the traffic database generated by URTRAP study (CRRI, 2002) as the datum. Thereafter, it has been proposed to carry out the defined scope of work based on the traffic studies carried out in the intervening period for the year 2009. The traffic studies, which are to be carried out and methodology to be adopted for the estimation of traffic and pollution loads is briefly explained in the paragraphs to follow.
In order to accurately estimate the pattern of traffic flows and spatial distribution of pollution loads from vehicles, the primary road network of the city would be identified and
inspected physically through the field visits. As discussed earlier, the major arterial roads of Delhi carry more than 80 percent of traffic. Control points (location of survey points where traffic volumes to be measured) were selected based on previously available database on traffic volume, importance of road, adjoining
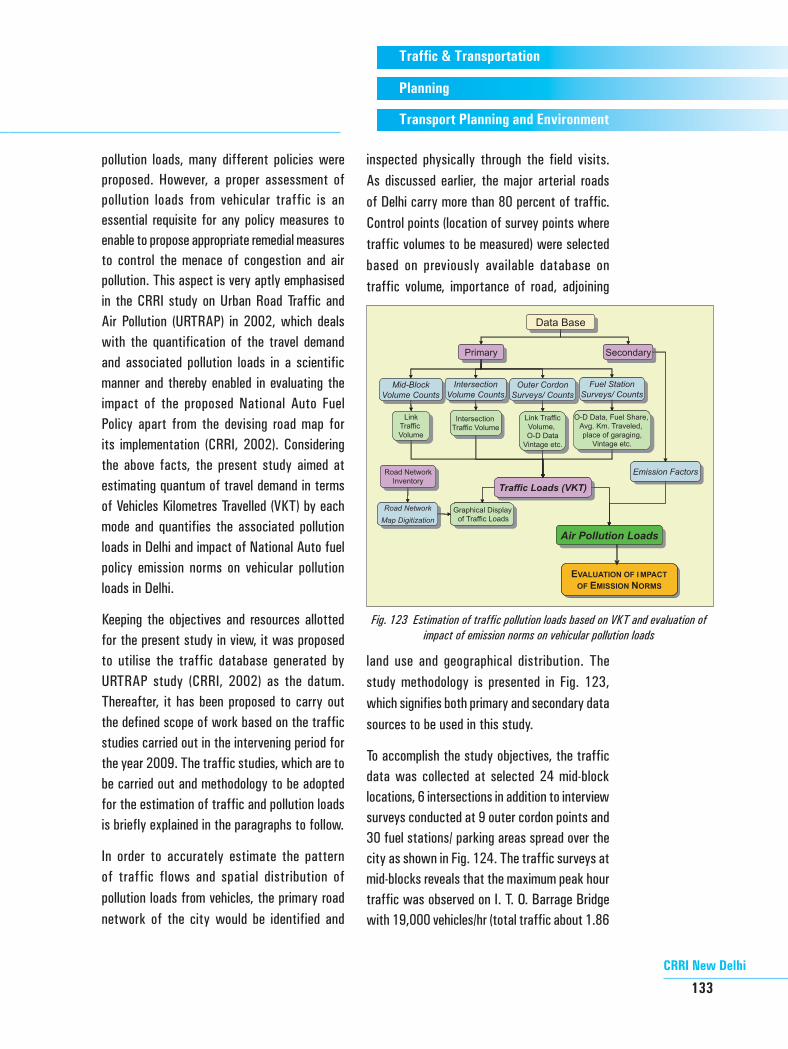
Fig. 123 Estimation of traffic pollution loads based on VKT and evaluation of impact of emission norms on vehicular pollution loads
land use and geographical distribution. The study methodology is presented in Fig. 123, which signifies both primary and secondary data sources to be used in this study.
To accomplish the study objectives, the traffic data was collected at selected 24 mid-block locations, 6 intersections in addition to interview surveys conducted at 9 outer cordon points and 30 fuel stations/ parking areas spread over the city as shown in Fig. 124. The traffic surveys at mid-blocks reveals that the maximum peak hour traffic was observed on I. T. O. Barrage Bridge with 19,000 vehicles/hr (total traffic about 1.86

Annual Report 2009-10
134
Traffic & Transportation
Planning
Transport Planning and Environment
lakh vehicles for 12 hours) and on Lala Lajpat Rai Marg with about 15,000 vehicles (total traffic about 1.54 lakh vehicles for 12 hours). From the intersections counts it was observed that Ashram intersection has the maximum intersection traffic flows about 3.65 lakh vehicles for 24 hours. The outer cordon surveys revealed that the maximum traffic was observed at NH-8 Toll Plaza with about 2.28 lakh vehicles for 24 hours and minimum traffic was at Apsara border on Old G. T. Road with about 50,000 vehicles for 24 hours. It was observed from traffic composition analysis that the proportion of two wheelers has shown a downward trend
in inner and middle areas whereas in the outer areas it has remained more or less same during 2002 to 2009. SMVs have shown a downward trend in inner, middle and outer areas during this period. Over all, about two times increase in the traffic was observed as compared to URTRAP study in 2002.
Further from the commuter interview surveys at outer cordon points revealed that a total of about 4.3 lakh vehicles enter and about 4.6 lakh vehicles leave leave Delhi on an average working day. It can also be noticed that the goods traffic forms about 13 percent of the total traffic with
Fig. 124 Locations of different surveys on road network of elhi
CRRI New Delhi
135
Traffic & Transportation
Planning
Transport Planning and Environment
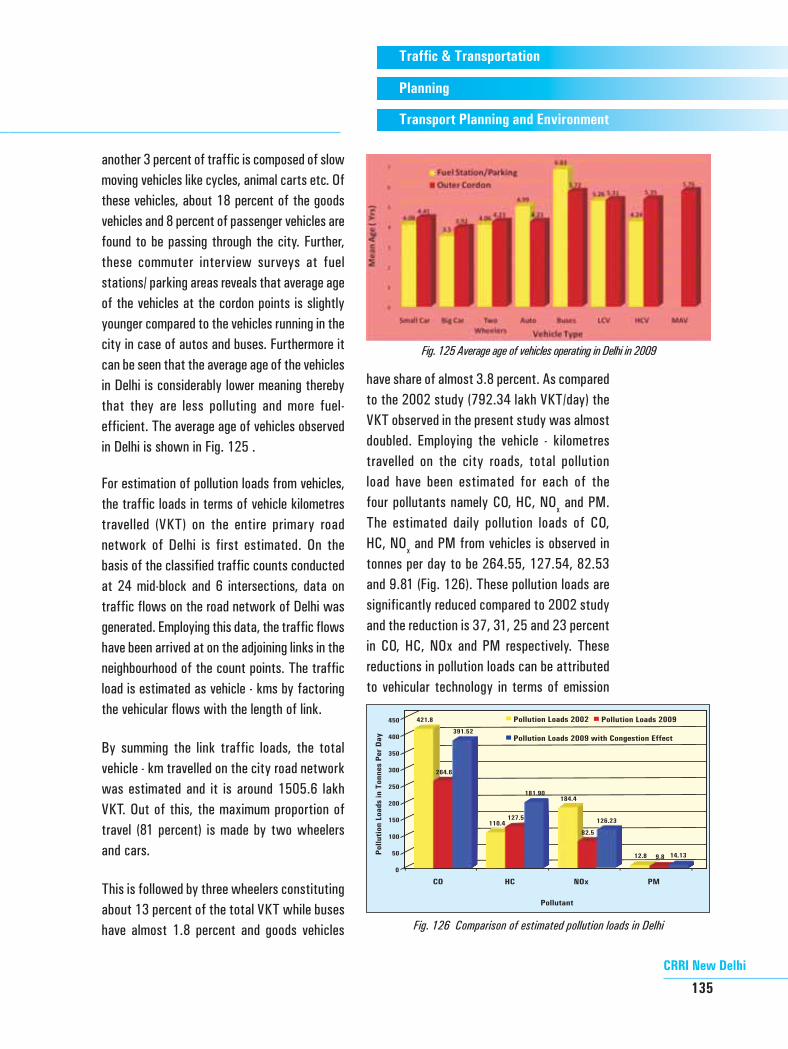
another 3 percent of traffic is composed of slow moving vehicles like cycles, animal carts etc. Of these vehicles, about 18 percent of the goods vehicles and 8 percent of passenger vehicles are found to be passing through the city. Further, these commuter interview surveys at fuel stations/ parking areas reveals that average age of the vehicles at the cordon points is slightly younger compared to the vehicles running in the city in case of autos and buses. Furthermore it can be seen that the average age of the vehicles in Delhi is considerably lower meaning thereby that they are less polluting and more fuel-efficient. The average age of vehicles observed in Delhi is shown in Fig. 125 .
For estimation of pollution loads from vehicles,the traffic loads in terms of vehicle kilometres travelled (VKT) on the entire primary road network of Delhi is first estimated. On the basis of the classified traffic counts conducted at 24 mid-block and 6 intersections, data on traffic flows on the road network of Delhi was generated. Employing this data, the traffic flows have been arrived at on the adjoining links in the neighbourhood of the count points. The traffic load is estimated as vehicle - kms by factoring the vehicular flows with the length of link.
By summing the link traffic loads, the total vehicle - km travelled on the city road network was estimated and it is around 1505.6 lakh VKT. Out of this, the maximum proportion of travel (81 percent) is made by two wheelers and cars.
This is followed by three wheelers constituting about 13 percent of the total VKT while buses have almost 1.8 percent and goods vehicles
have share of almost 3.8 percent. As compared to the 2002 study (792.34 lakh VKT/day) the VKT observed in the present study was almost doubled. Employing the vehicle - kilometres travelled on the city roads, total pollution load have been estimated for each of the four pollutants namely CO, HC, NOx and PM. The estimated daily pollution loads of CO, HC, NOx and PM from vehicles is observed in tonnes per day to be 264.55, 127.54, 82.53 and 9.81 (Fig. 126). These pollution loads are significantly reduced compared to 2002 study and the reduction is 37, 31, 25 and 23 percent in CO, HC, NOx and PM respectively. These reductions in pollution loads can be attributed to vehicular technology in terms of emission
Fig. 125 Average age of vehicles operating in Delhi in 2009
Fig. 126 Comparison of estimated pollution loads in Delhi

Annual Report 2009-10
136
Traffic & Transportation
Planning
Transport Planning and Environment
norms implemented in the country such as BS-II and BS-III and implementation of CNG in Autos and Buses.
The above pollution loads were calculated assuming the existence of typical Indian Driv ing Cycle ( IDC) on Delhi roads by considering the CPCB emission factors (CPCB, 2000). However, as the traffic congestion is so acute for most part of the day on major arterials and sub-arterials of the city, the effect of congestion on Delhi road network was appropriately accounted by assuming that average travel times of various modes have increased by 50 percent due to congestion since the non-availability of emission factors due to congestion in our Indian conditions. Subsequently the pollution loads were estimated by increasing the loads by cars and buses with separate factor as they get affected more compared to two wheeler and autos. The estimated pollution loads of CO, HC, NOx and PM with congestion effect is around 391.5, 181.9, 126.2 and 14.1 tonnes per day.
Impact of National Auto Fuel Policy Emissions
The pollution loads are estimated for the cases of Business As Usual (BAU) 2000 and BAU 2002 and subsequently compared with present study 2009 to assess the impact of National Auto Fuel Policy emission norms. BAU 2000 and BAU 2002 options are considered because these policy norms were implemented in Delhi during this period i.e between 2000 and 2009. Fig. 127 shows the BAU 2000, BAU 2002 and present study after implementing the Auto fuel
policy emission norms. It can be clearly seen that the policy norms have successfully reduced all of the pollutants compared to BAU 2000 and BAU 2002.
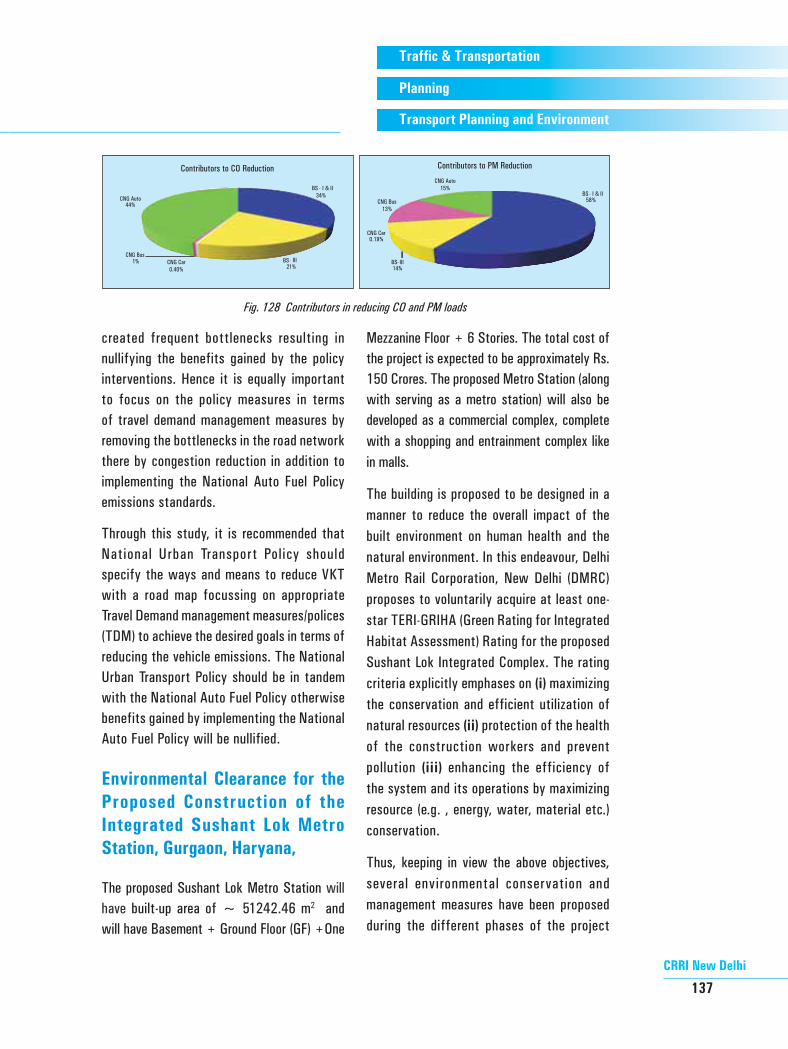
Further from the analysis of results it was found that the major contributor in reducing CO is CNG Auto which reduces 44 percent followed by BS-I & II (34 percent) and BS-III (21 percent) as shown in Fig. 128 . CNG Bus and CNG car are very insignificant in reducing CO loads. In case of PM, the major contribution is from BS-I & II (58 percent). BS-III, CNG Auto and CNG Bus are contributed about 14 percent each. CNG car has very insignificant contribution in reducing PM loads as they are very less in number. The other vehicle technology factors such as conversion of 2 stroke to 4 stroke engines in two wheelers and auto rickshaws and fuel quality also indirectly included under BS-I, II and III category.
The study results show that the policy interventions by implementing the Bharat Stage I, II and III, in addition to implementing the CNG Autos, CNG buses and conversion of some of the cars into CNG have reduced the pollution loads considerably. However, absence of proper travel demand management to tackle the increased travel demand has
Fig.127 Impacts of policy interventions on pollution loads
CRRI New Delhi
137
Traffic & Transportation
Planning
Transport Planning and Environment
created frequent bottlenecks resulting in nullifying the benefits gained by the policy interventions. Hence it is equally important to focus on the policy measures in terms of travel demand management measures by removing the bottlenecks in the road network there by congestion reduction in addition to implementing the National Auto Fuel Policy emissions standards.
Through this study, it is recommended that National Urban Transport Policy should specify the ways and means to reduce VKT with a road map focussing on appropriate Travel Demand management measures/polices (TDM) to achieve the desired goals in terms of reducing the vehicle emissions. The National Urban Transport Policy should be in tandem with the National Auto Fuel Policy otherwise benefits gained by implementing the National Auto Fuel Policy will be nullified.
Environmental Clearance for the Proposed Construction of the Integrated Sushant Lok Metro Station, Gurgaon, Haryana,
The proposed Sushant Lok Metro Station will have built-up area of ~ 51242.46 m2 and will have Basement + Ground Floor (GF) +One
Mezzanine Floor + 6 Stories. The total cost of the project is expected to be approximately Rs. 150 Crores. The proposed Metro Station (along with serving as a metro station) will also be developed as a commercial complex, complete with a shopping and entrainment complex like in malls.
The building is proposed to be designed in a manner to reduce the overall impact of the built environment on human health and the natural environment. In this endeavour, Delhi Metro Rail Corporation, New Delhi (DMRC) proposes to voluntarily acquire at least one- star TERI-GRIHA (Green Rating for Integrated Habitat Assessment) Rating for the proposed Sushant Lok Integrated Complex. The rating criteria explicitly emphases on (i) maximizing the conservation and efficient utilization of natural resources (ii) protection of the health of the construction workers and prevent pollution (iii) enhancing the efficiency of the system and its operations by maximizing resource (e.g. , energy, water, material etc.) conservation.
Thus, keeping in view the above objectives, several environmental conservation and management measures have been proposed during the different phases of the project
Fig. 128 Contributors in reducing CO and PM loads
Annual Report 2009-10
138
Traffic & Transportation
Planning
Transport Planning and Environment
to preserve and protect the landscape during construction, development of Green Belt and use of solar energy have been proposed and integrated into the project.
Traffic and Transportation Study for Delhi Metro Phase - III
The scope of the work to be covered by CRRI under the present study would be confined to collection of data from secondary sources, road inventory and analysis of field data. Digitisation and verification of transport network map, calibration of speed flow models, application of transport modelling and generalised cost derivation application of transport modelling which include development of origin-destination (OD) matrix, traffic assignment and estimation of ridership at metro stations and link flows in terms of peak hour peak direction traffic (PHPDT), derivation of economic values of benefit components and EIRR. Sensitivity analysis with reference to change in travel demand and construction cost are also proposed to cover under the present study.
Traffic Study and Economic Analysis of Ahmedabad Metro
The scope of the work to be covered by CRRI under the present study would be confined to collection of data from secondary sources, road inventory and analysis of field data. Digitisation and verification of transport network map, calibration of speed flow models, application of transport modelling and generalised cost derivation Application of transport modelling which include development of origin-destination (OD) matrix, traffic assignment and estimation of ridership at
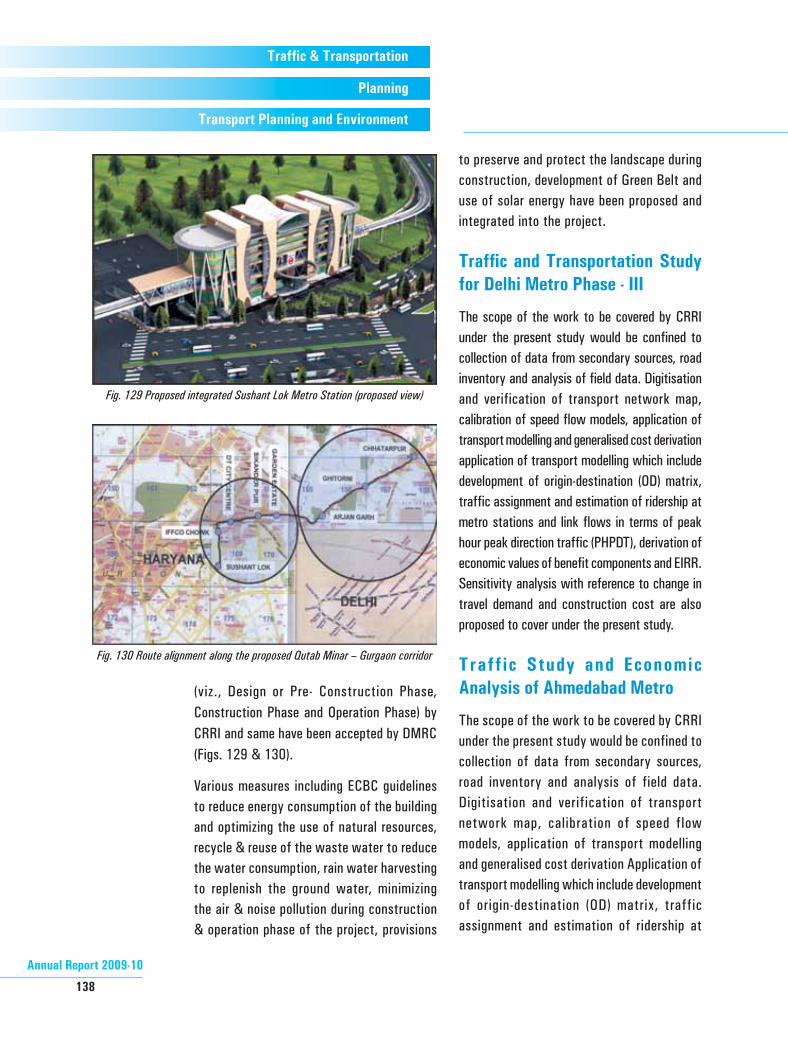
Fig. 129 Proposed integrated Sushant Lok Metro Station (proposed view)
Fig. 130 Route alignment along the proposed Qutab Minar – Gurgaon corridor
(viz., Design or Pre- Construction Phase, Construction Phase and Operation Phase) by CRRI and same have been accepted by DMRC (Figs. 129 & 130).
Various measures including ECBC guidelines to reduce energy consumption of the building and optimizing the use of natural resources, recycle & reuse of the waste water to reduce the water consumption, rain water harvesting to replenish the ground water, minimizing the air & noise pollution during construction & operation phase of the project, provisions
CRRI New Delhi
139
Traffic & Transportation
Planning
Transport Planning and Environment
metro stations and link flows in terms of peak hour peak direction traffic (PHPDT), derivation of economic values of benefit components and EIRR. Sensitivity analysis with reference to change in travel demand and construction cost are also proposed to cover under the present study.
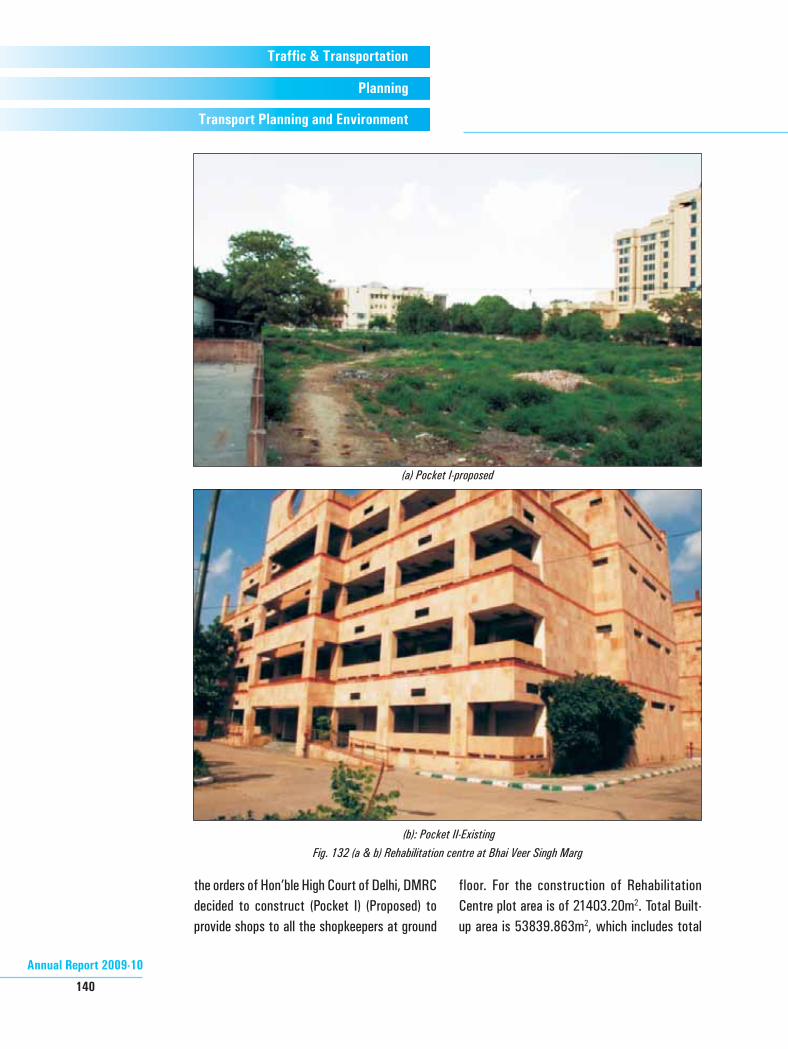
Environmental Clearance for Rehabilitation Work of Delhi Metro Rail Corporation (DMRC) Limited at Bhai Veer Singh Marg for Shopkeepers Displaced from Panchkuian Road, New Delhi
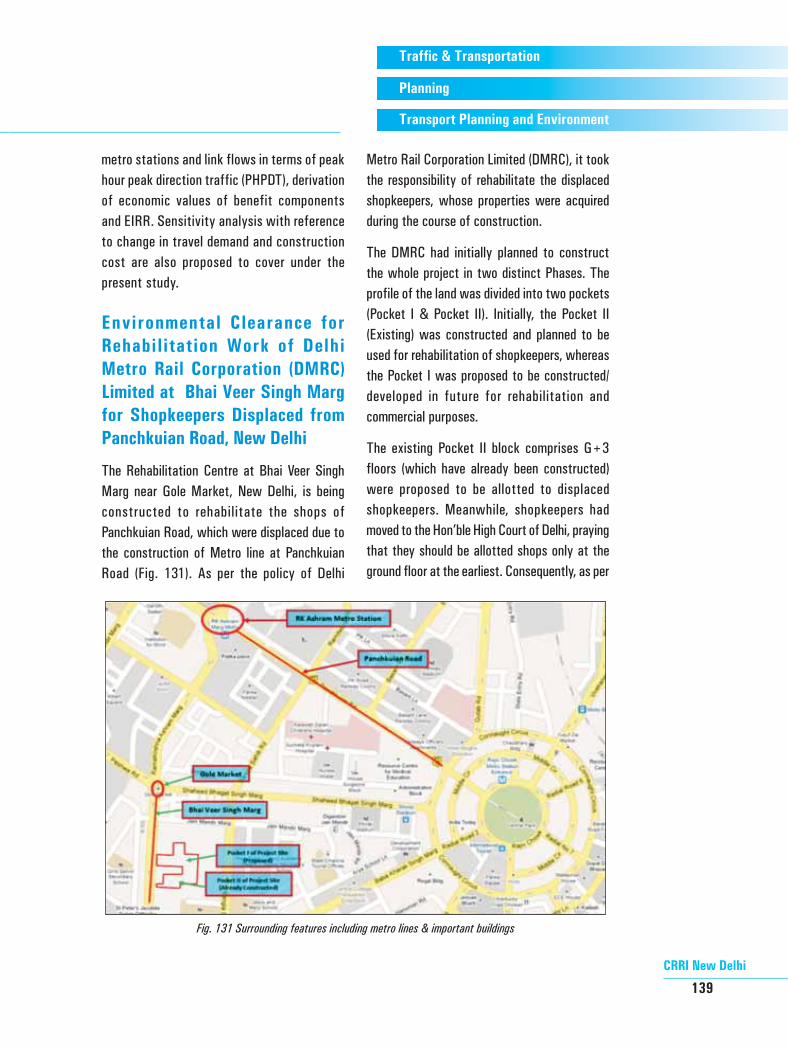
The Rehabilitation Centre at Bhai Veer Singh Marg near Gole Market, New Delhi, is being constructed to rehabilitate the shops of Panchkuian Road, which were displaced due to the construction of Metro line at Panchkuian Road (Fig. 131). As per the policy of Delhi
Metro Rail Corporation Limited (DMRC), it took the responsibility of rehabilitate the displaced shopkeepers, whose properties were acquired during the course of construction.
The DMRC had initially planned to construct the whole project in two distinct Phases. The profile of the land was divided into two pockets (Pocket I & Pocket II). Initially, the Pocket II (Existing) was constructed and planned to be used for rehabilitation of shopkeepers, whereas the Pocket I was proposed to be constructed/developed in future for rehabilitation and commercial purposes.
The existing Pocket II block comprises G+3 floors (which have already been constructed) were proposed to be allotted to displaced shopkeepers. Meanwhile, shopkeepers had moved to the Hon’ble High Court of Delhi, praying that they should be allotted shops only at the ground floor at the earliest. Consequently, as per
Fig. 131 Surrounding features including metro lines & important buildings
Annual Report 2009-10
140
Traffic & Transportation
Planning
Transport Planning and Environment
(a) Pocket I-proposed
(b): Pocket II-ExistingFig. 132 (a & b) Rehabilitation centre at Bhai Veer Singh Marg
the orders of Hon’ble High Court of Delhi, DMRC decided to construct (Pocket I) (Proposed) to provide shops to all the shopkeepers at ground
floor. For the construction of Rehabilitation Centre plot area is of 21403.20m2. Total Built-up area is 53839.863m2, which includes total
CRRI New Delhi
141
Traffic & Transportation
Planning
Transport Planning and Environment
floor area of 26743.154 m2 for Pocket I & II and total basement area of 27096.709 m2 for Pocket I only. The building is divided into two pockets: Pocket I (to be constructed) and Pocket II (Existing) Fig 132(a&b).
Existing Pocket II (~7154.8 m2) has GF + 3 Stories and has no basement. Pocket I (~19588.354 m2) Fig 132(a) which is proposed to be constructed will have GF + 8 stories and has 3 basements. Total cost of the proposed project is Rs. 180 Crores.
Delhi Metro Rail Corporation Limited (DMRC) has engaged Central Road Research Institute (CRRI), New Delhi as their EIA consultant to carry out EIA Studies and to prepare Environmental Management Plan (EMP) to mitigate various environmental impacts which might arise during Pre- Construction/Design, Construction and Operation phase of the proposed project and help DMRC to get “Environmental Clearance” as per the provisions of the EIA notification dated September 14th 2006.
The objectives of the EIA study included assessment of environmental impacts related to location. Design, construction and Preparation of appropriate Environmental Management Plan (EMP) to minimize the negative impacts, during all the three phases namely, (i) Pre-construction (ii) Construction and (iii) Post Construction/Operation phase of the project.
The methodology included base-line data collection related to traffic, air, noise, soil , water and prediction of impacts on different environmental components likely to be affected due to the proposed activity including air and noise environment by using appropriate mathematical models followed by the evaluation of impacts. Based on these an appropriate
Environmental Management Plan (EMP) has been suggested to mitigate the adverse environmental impacts during different phases of the project.
Based on the Form I and Form IA, along with Environment Management Plan prepared as a part of EIA Study and Presentation made before the Delhi State Environmental Appraisal Committee (DSEAC) it is expected that the “Environmental Clearance” for the above project will be granted very soon as per the provisions of EIA notification of Sept. 14th, 2006.
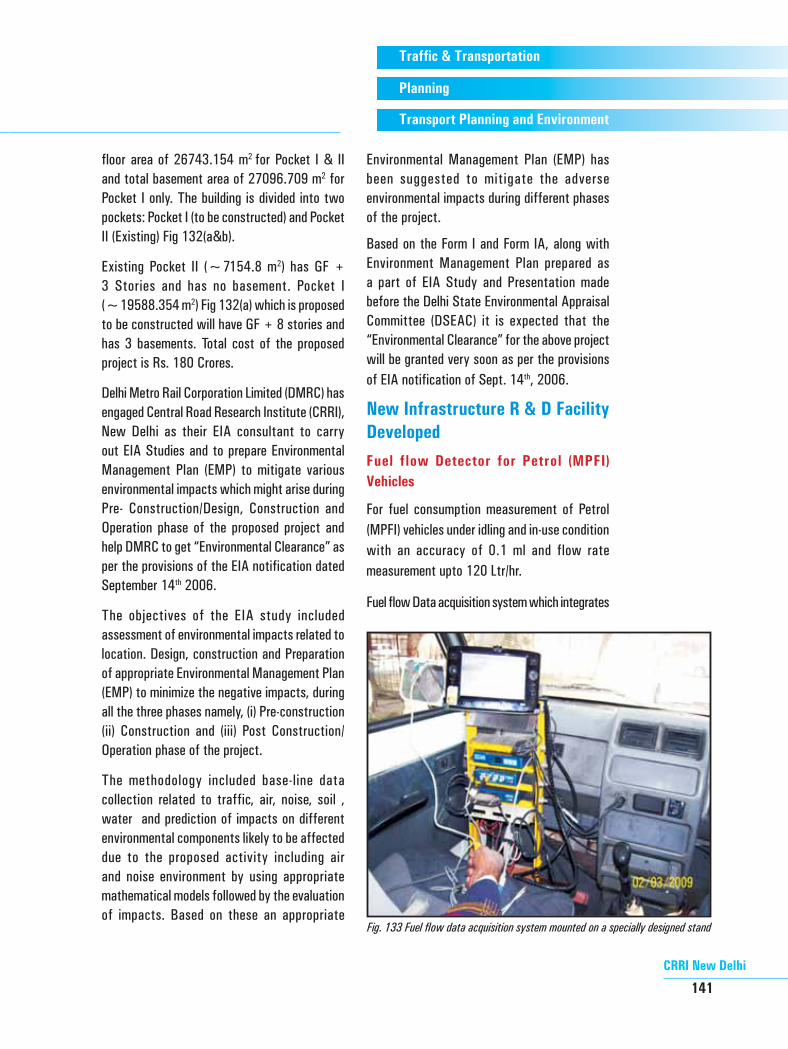
New Infrastructure R & D Facility DevelopedFuel flow Detector for Petrol (MPFI) Vehicles
For fuel consumption measurement of Petrol (MPFI) vehicles under idling and in-use condition with an accuracy of 0.1 ml and flow rate measurement upto 120 Ltr/hr.
Fuel flow Data acquisition system which integrates
Fig. 133 Fuel flow data acquisition system mounted on a specially designed stand
Annual Report 2009-10
142
Traffic & Transportation
Planning
Transport Planning and Environment
distance data logged through GPS with fuel flow data logged through fuel flow Detector, with a speed accuracy of 0.1 km/hr Fig. 133.
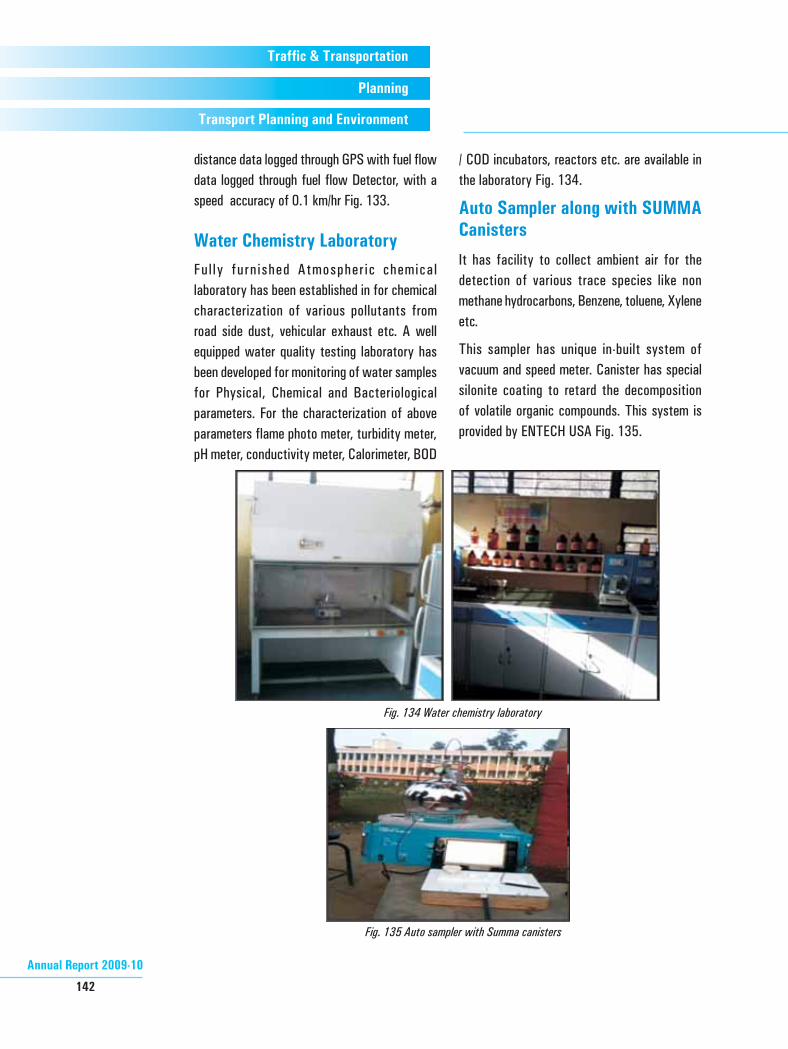
Water Chemistry LaboratoryFul ly furnished Atmospher ic chemical laboratory has been established in for chemical characterization of various pollutants from road side dust, vehicular exhaust etc. A well equipped water quality testing laboratory has been developed for monitoring of water samples for Physical, Chemical and Bacteriological parameters. For the characterization of above parameters flame photo meter, turbidity meter, pH meter, conductivity meter, Calorimeter, BOD
/ COD incubators, reactors etc. are available in the laboratory Fig. 134.
Auto Sampler along with SUMMA Canisters
It has facility to collect ambient air for the detection of various trace species like non methane hydrocarbons, Benzene, toluene, Xylene etc.
This sampler has unique in-built system of vacuum and speed meter. Canister has special silonite coating to retard the decomposition of volatile organic compounds. This system is provided by ENTECH USA Fig. 135.
Fig. 134 Water chemistry laboratory
Fig. 135 Auto sampler with Summa canisters