trade what you see not what you think
TRANSCRIPT

1
Planning the Trade, Trading the Plan23 June 2014
Nabil Mattar
Premium Client Manager
2
DISCLAIMER
IG Asia Pte Ltd (Co. Reg. No. 20051002K) holds a capital markets services licence from the MonetaryAuthority of Singapore for dealing in securities and leveraged foreign exchange trading and is an exemptfinancial adviser. It is also licensed by International Enterprise Singapore to trade CFDs on commodities.
CFDs are leveraged products. CFD trading may not be suitable for everyone and can result in losses thatexceed your initial investment, so please ensure that you fully understand the risks and costs involved byreading the Risk Disclosure Statement at www.ig.com.sg. Trading in CFDs may not be suitable for manymembers of the public. You should carefully consider whether such trading is appropriate for you in the lightof your personal circumstances. In considering whether to trade, please be aware of the marginrequirements, commissions, fees and other charges for which you will be liable. These charges will affectyour net profit (if any) or increase your loss.
IG provides an execution-only service. The information in this presentation is intended for general circulation.It does not take into account the specific investment objectives, financial situation or particular needs of anyparticular person. You should take into account your specific investment objectives, financial situation orparticular needs before making a commitment to trade, including seeking advice from an independentfinancial adviser regarding the suitability of the investment, as you deem fit.
IG accepts no responsibility for any use that may be made of this information and for any consequences thatresult. No representation or warranty is given as to the accuracy or completeness of the information.Consequently any person acting on it does so entirely at his or her own risk. This presentation must not bereproduced or further distributed.
3
4
IT IS MORE IMPORTANT TO KNOW WHEN TO BUY/SELLTHAN WHY THE ____________ WENT UP/DOWN
5
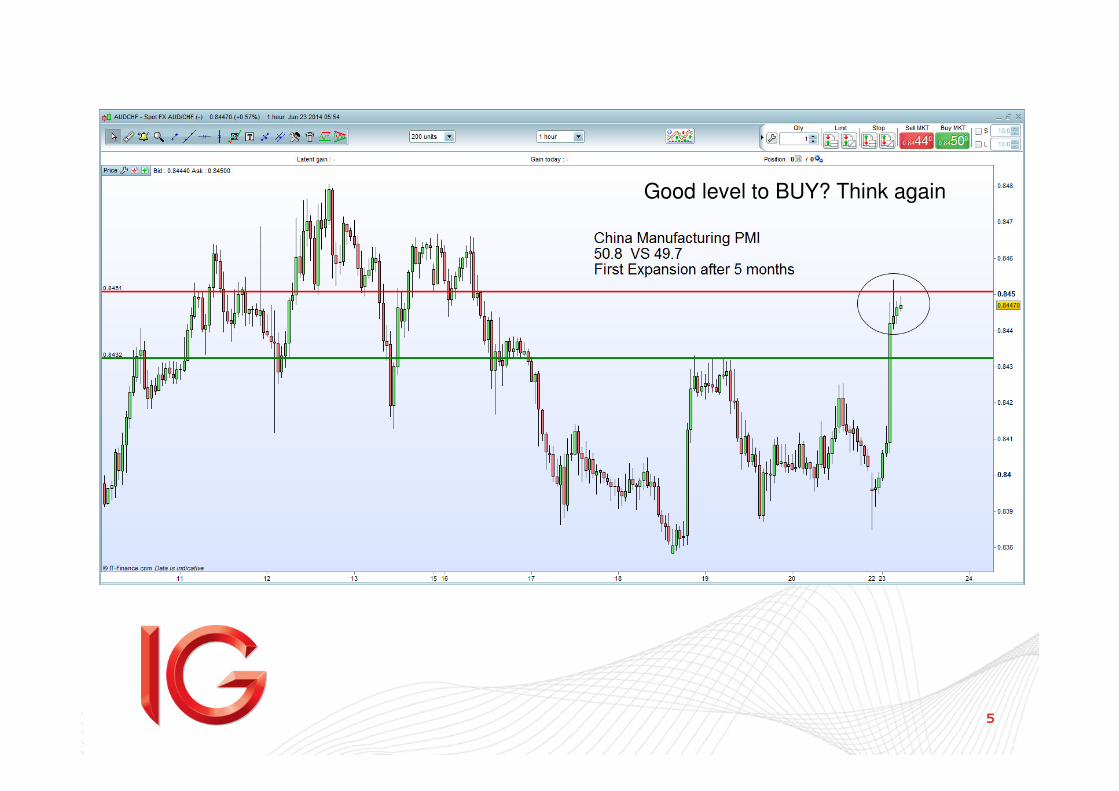
Good level to BUY? Think again
6
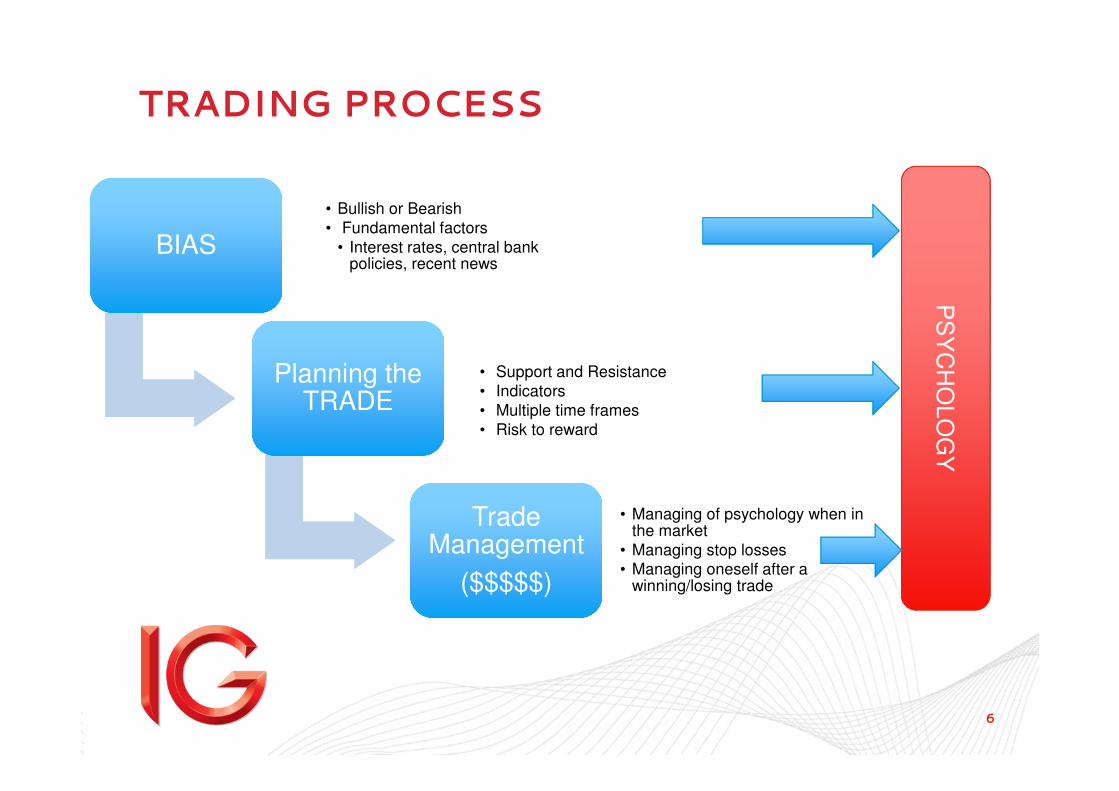
TRADING PROCESS
BIASBIAS
• Bullish or Bearish• Fundamental factors
• Interest rates, central bank policies, recent news
Planning the TRADE
Planning the TRADE
• Support and Resistance• Indicators• Multiple time frames• Risk to reward
Trade Management
($$$$$)
Trade Management
($$$$$)
• Managing of psychology when in the market
• Managing stop losses • Managing oneself after a
winning/losing trade
PS
YC
HO
LO
GY
7
WHO IS THIS SEMINAR FOR
• Tired of being ping-ponged by the news
• Sick of getting stopped out only for the market to go to the direction you originally predicted
• Desperate on getting it right and gaining consistency
• Frustrated of taking profit too early, only for the market to move in your favour by another 100pips
• Disgusted by the trades that you missed when it is so obvious to you after looking back over the weekend
• Dismayed by the number of trades that you tried chasing only for market to move against you completely
• Totally NEW and lost

8
UNDERSTANDING WHAT PRICE IS DOING ON THE CHART
9
PRICE ACTION
• Price is simply the purest form of data
• Price Action is historical price data plotted on a chart without any indicators
• Trust what the price is doing, NOT what you hope will happen
• Let price show you, not an indicator
– Use indicators as confirmation tools
– Most indicators are lagging
– Indicators typically wait for price close on a bar or candle before plotting
• Price Action involves these elements
– Support & Resistance
– Chart Structure
– Trends
– Multiple time frame
– Candles
10
11
12
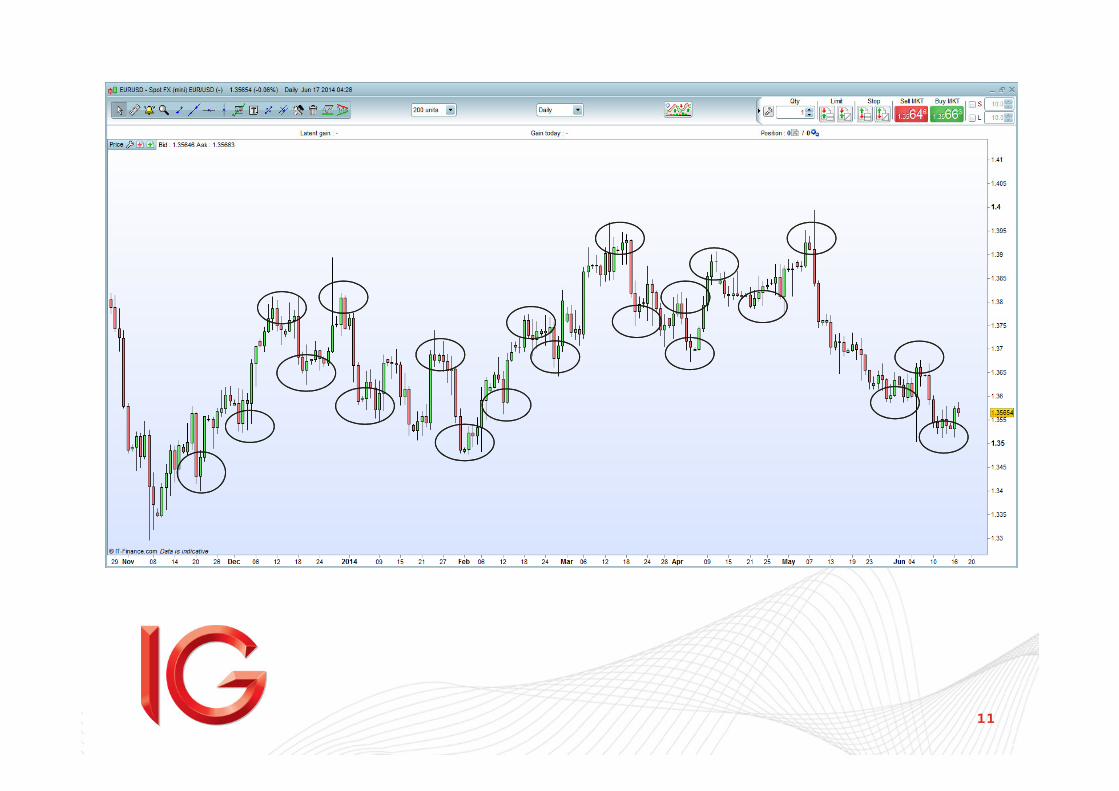
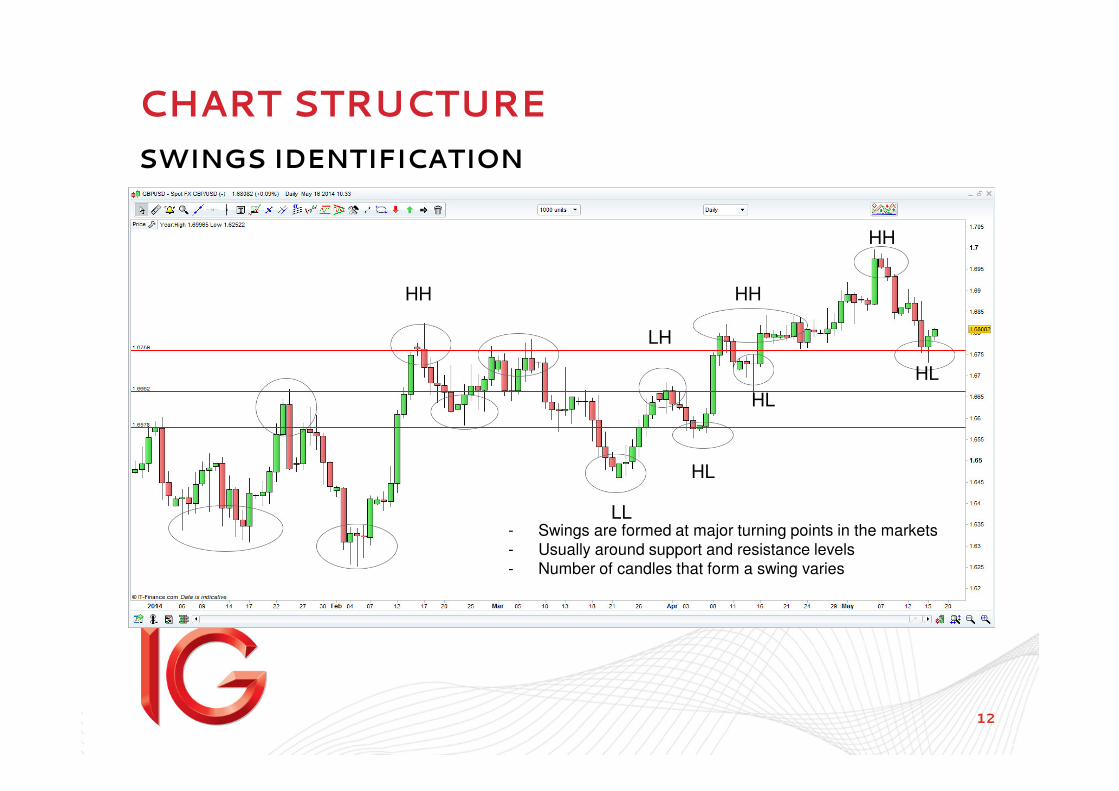
CHART STRUCTURE
SWINGS IDENTIFICATION
LL
HL
HL
HL
HH
HH
HH
LH
- Swings are formed at major turning points in the markets- Usually around support and resistance levels- Number of candles that form a swing varies
13
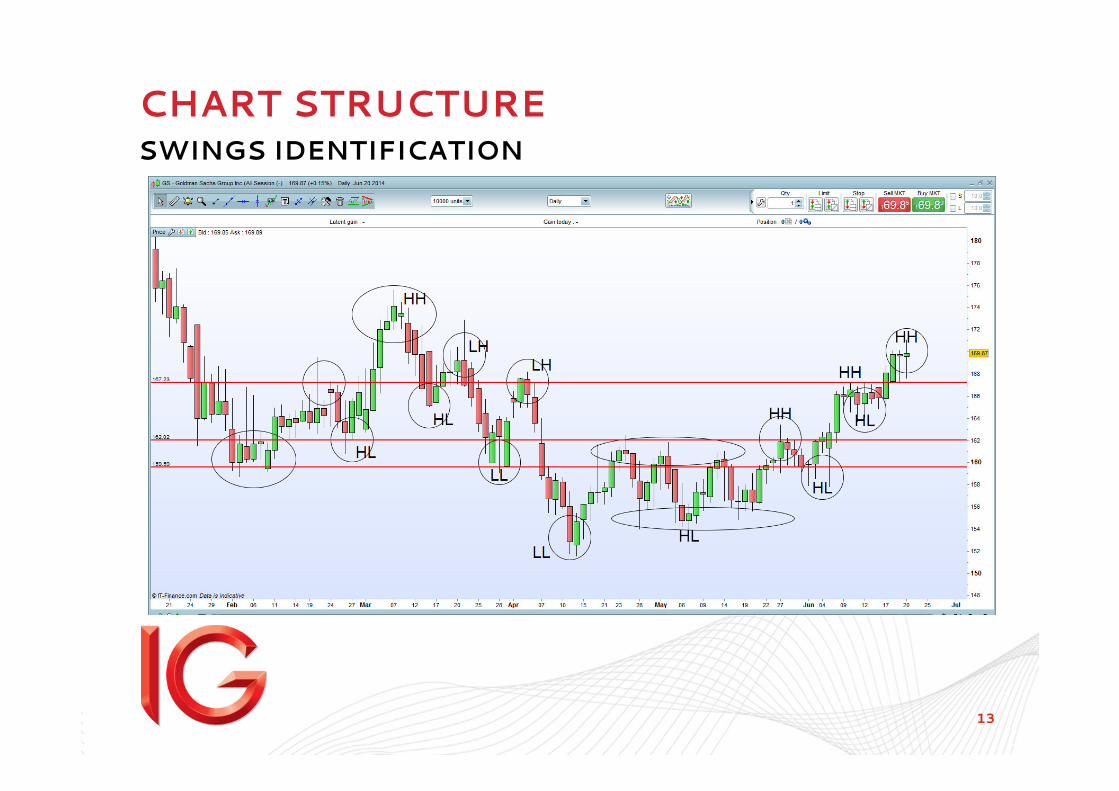
CHART STRUCTURESWINGS IDENTIFICATION
14
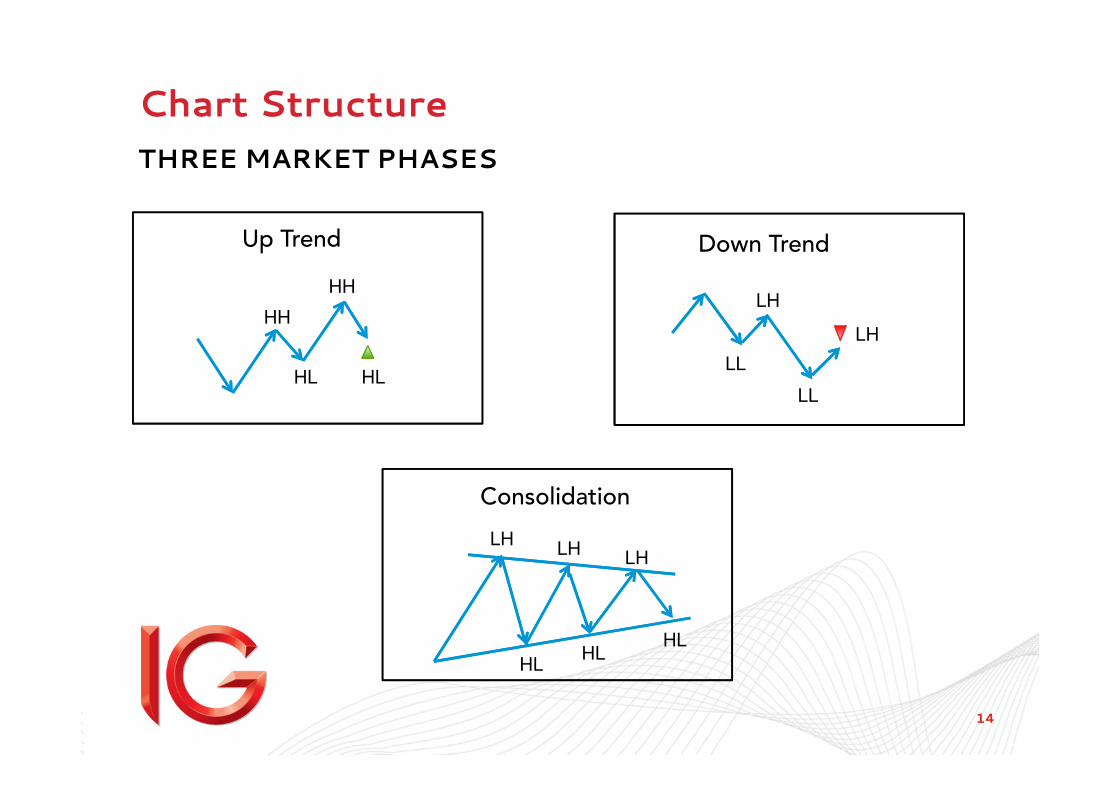
Chart Structure
THREE MARKET PHASES
Consolidation
LHLH
HL
LH
HLHL
Up Trend
HL
HH
HL
HH
Down Trend
LH
LH
LL
LL
15
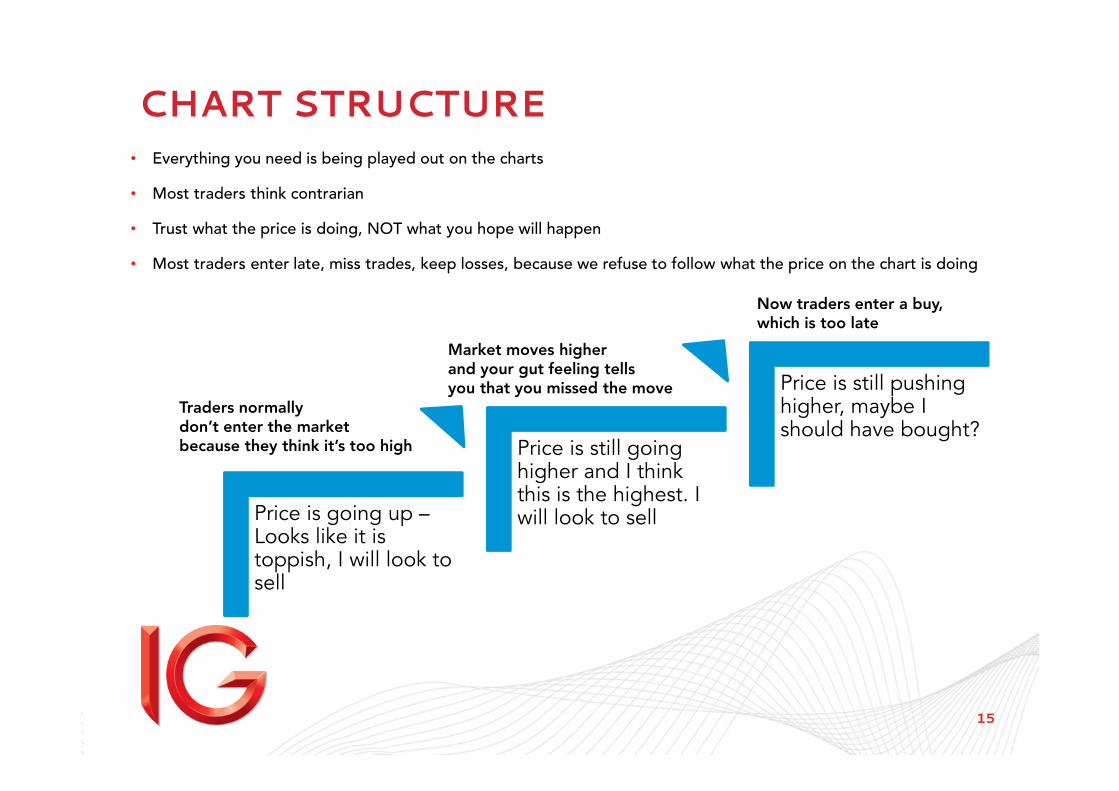
CHART STRUCTURE
Price is going up –Looks like it is toppish, I will look to sell
Price is still going higher and I think this is the highest. I will look to sell
Price is still pushing higher, maybe I should have bought?
• Everything you need is being played out on the charts
• Most traders think contrarian
• Trust what the price is doing, NOT what you hope will happen
• Most traders enter late, miss trades, keep losses, because we refuse to follow what the price on the chart is doing
Traders normallydon’t enter the market because they think it’s too high
Market moves higherand your gut feeling tells you that you missed the move
Now traders enter a buy, which is too late
16

17
SELECTING WHICH MARKET TO TRADE
Clearest Direction, Strongest Conviction
Hang Seng
18
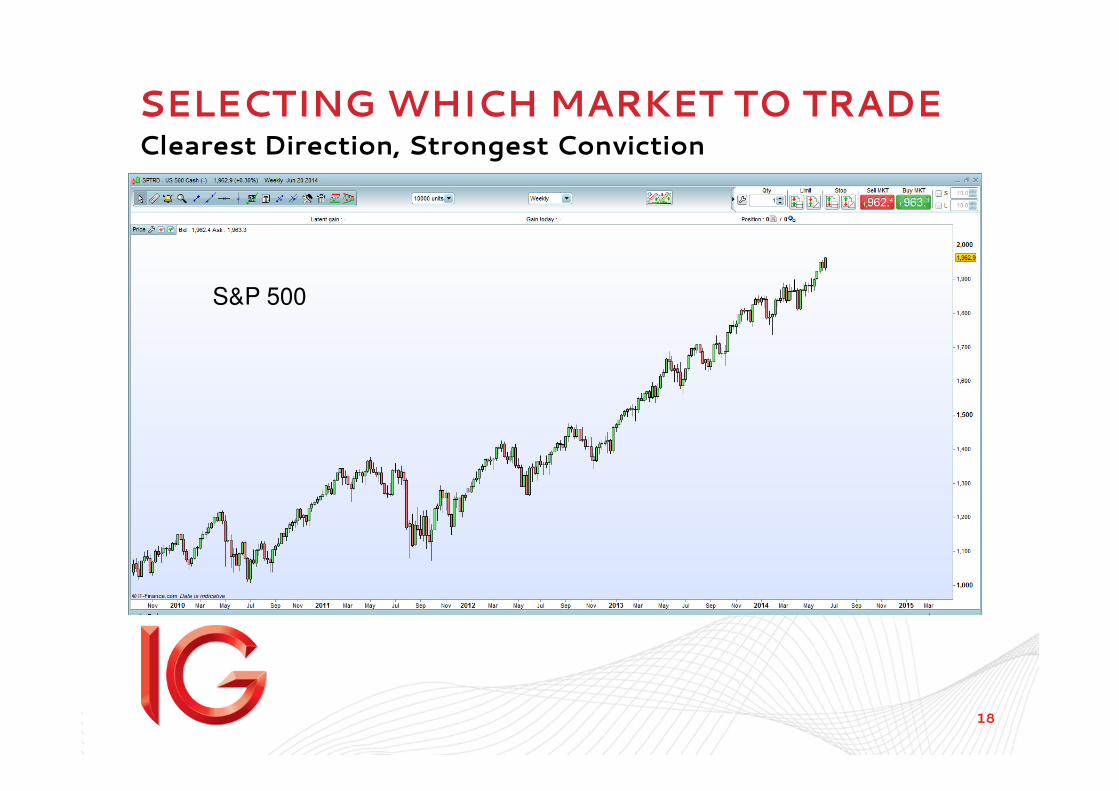
SELECTING WHICH MARKET TO TRADEClearest Direction, Strongest Conviction
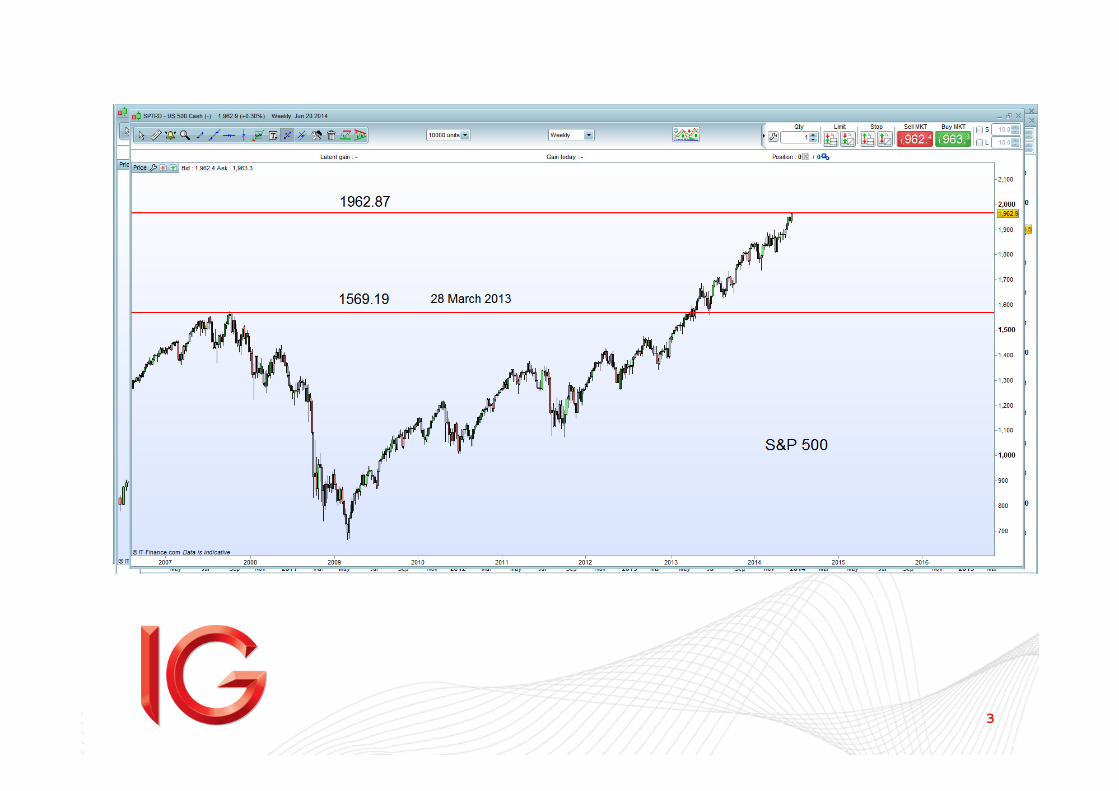
S&P 500
19
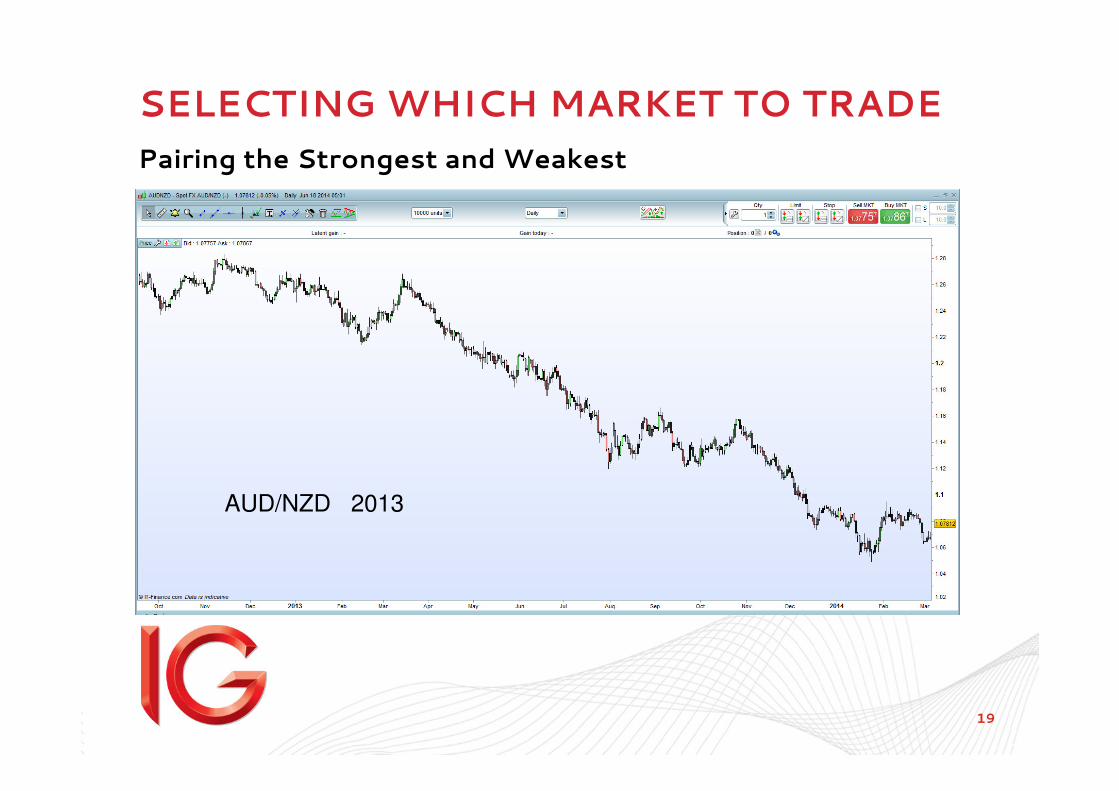
SELECTING WHICH MARKET TO TRADE
Pairing the Strongest and Weakest
AUD/NZD 2013
20
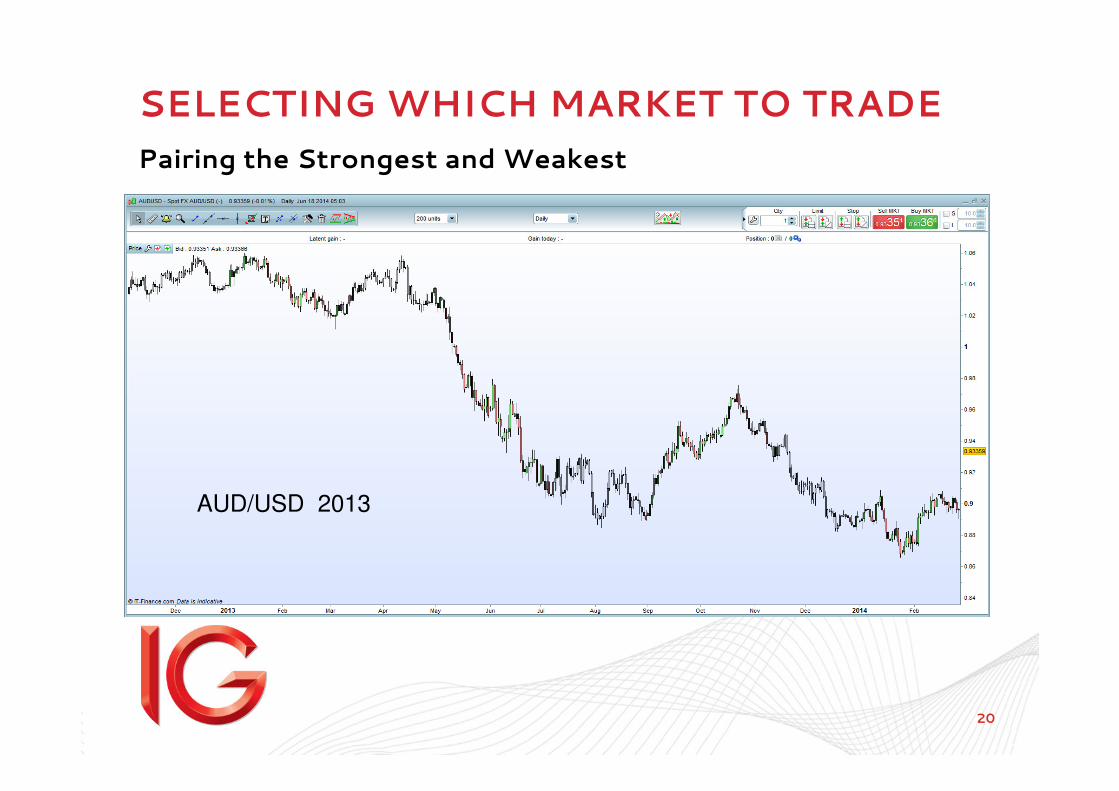
SELECTING WHICH MARKET TO TRADE
Pairing the Strongest and Weakest
AUD/USD 2013
21
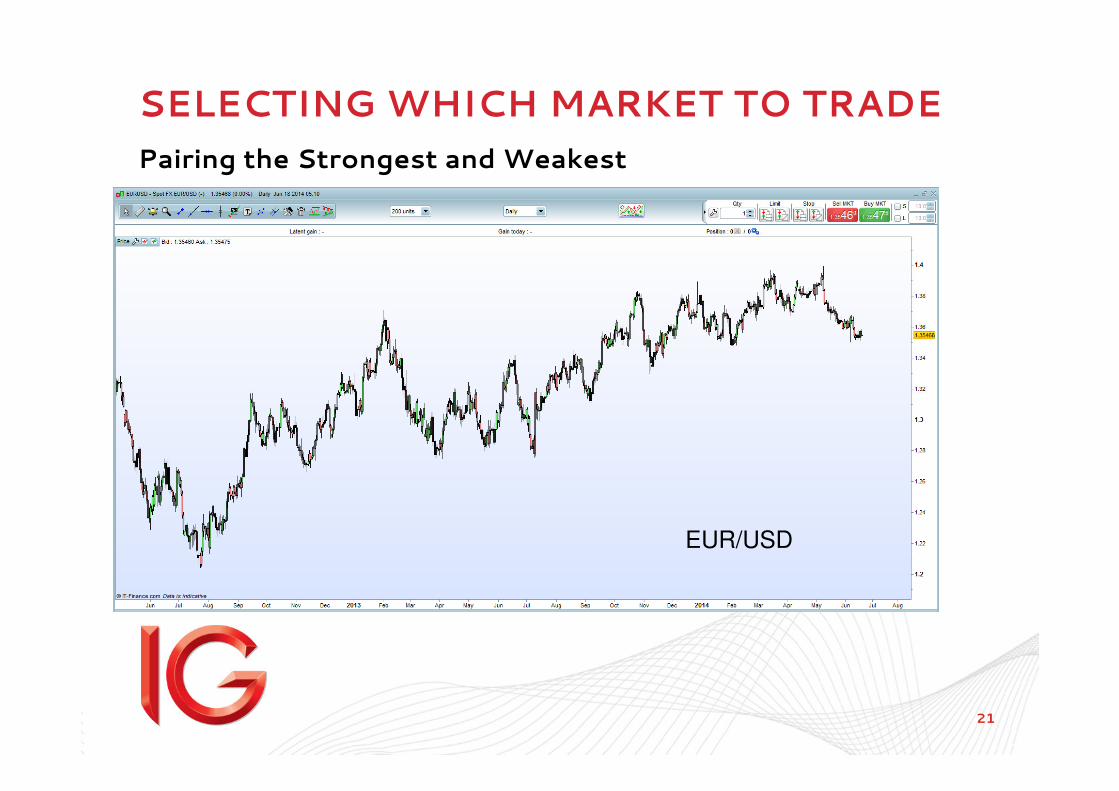
SELECTING WHICH MARKET TO TRADE
Pairing the Strongest and Weakest
EUR/USD

22
SELECTING WHICH MARKET TO TRADE
Pairing the Strongest and Weakest
EUR/GBP
23
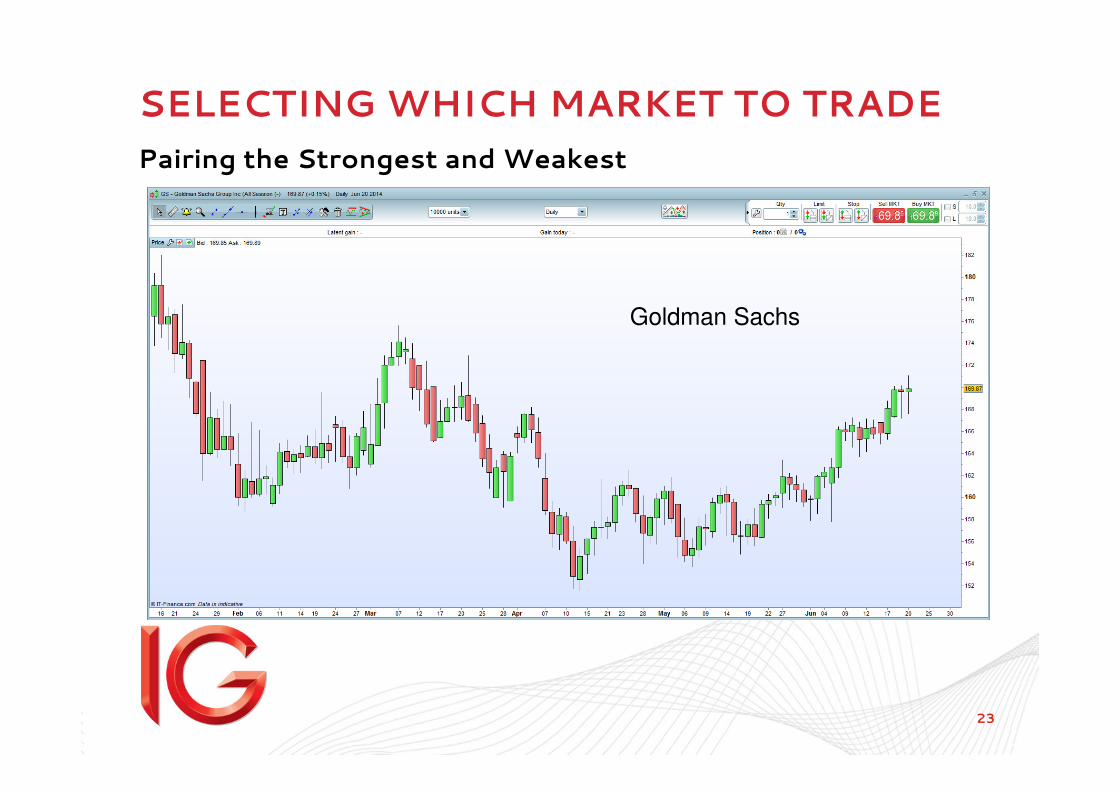
SELECTING WHICH MARKET TO TRADE
Pairing the Strongest and Weakest
Goldman Sachs
24
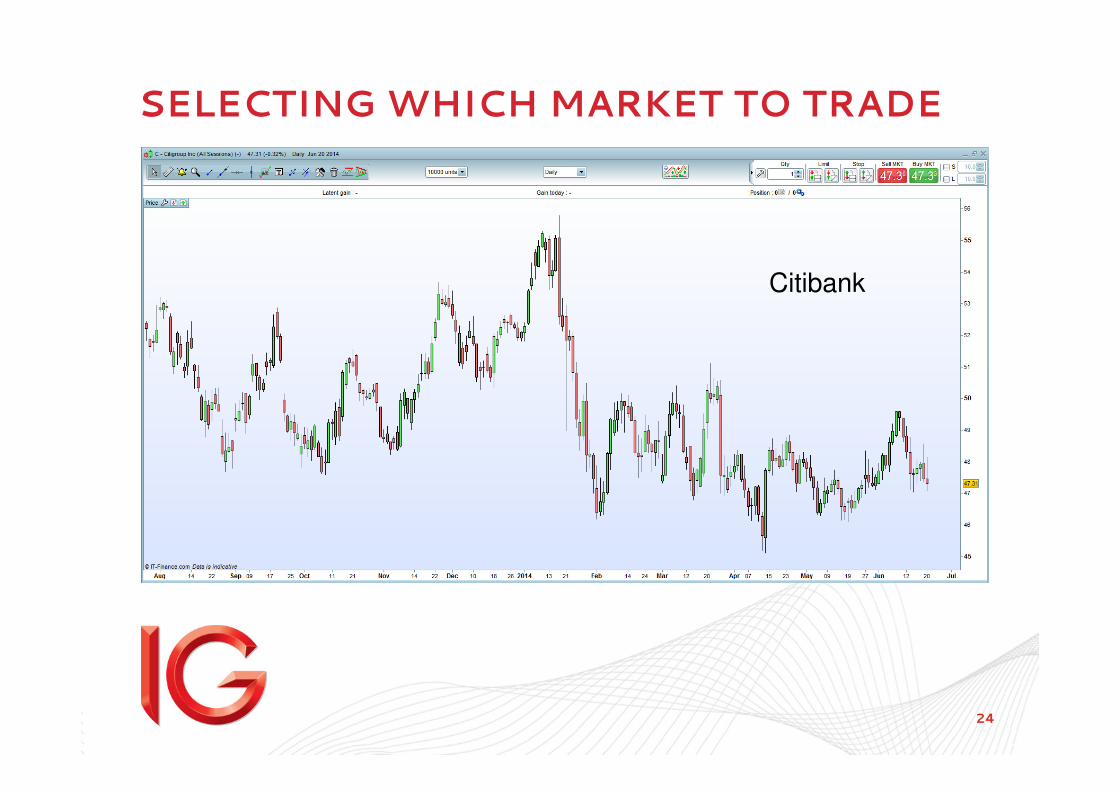
SELECTING WHICH MARKET TO TRADE
Citibank
25
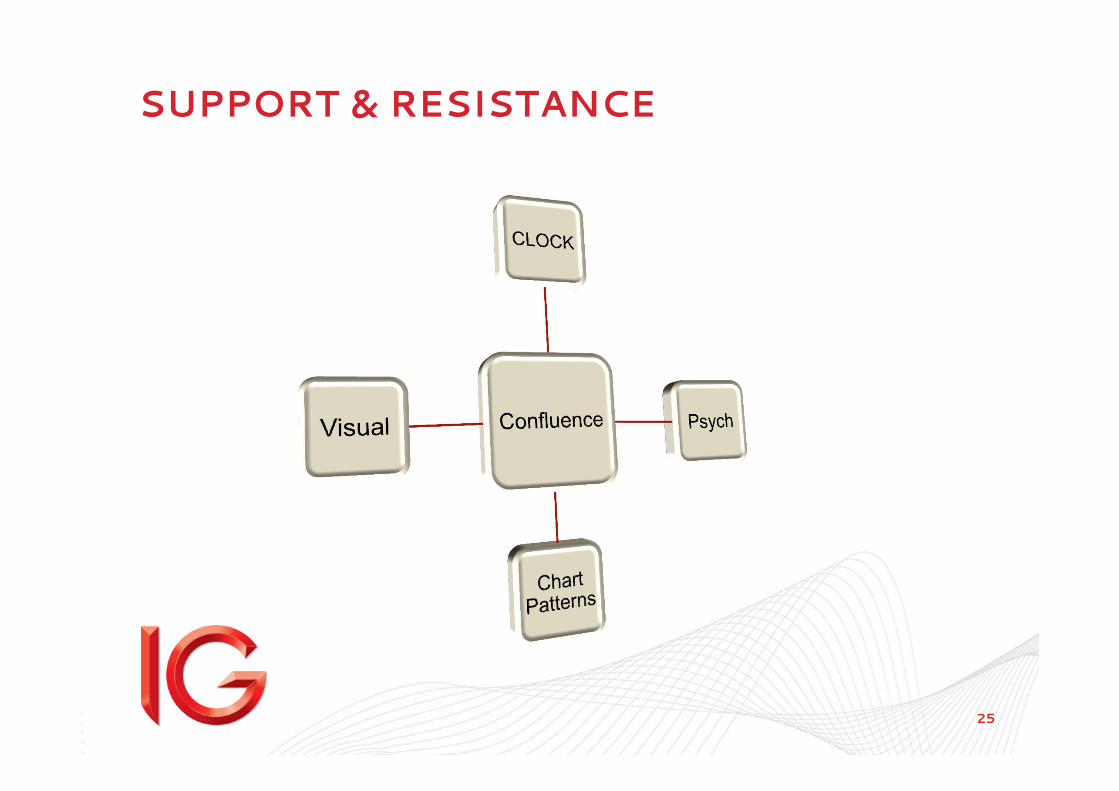
SUPPORT & RESISTANCE
26
SUPPORT & RESISTANCE
VISUAL & PSYCHOLOGICAL
• Look for whole numbers
– 00, 20, 50, 80
• Previous failures and bounces
• Pay attention to shadows and body close of candles – ROLE REVERSAL
• Always think of S&R levels as zones
• Look for a candle close above or below S&R levels before considering it broken
– Many times, they are simply market spikes
• Use multiple time-frames to confirm levels
• The higher the time-frame, the more respected the levels are
• A broken support can turn into resistance and vice versa
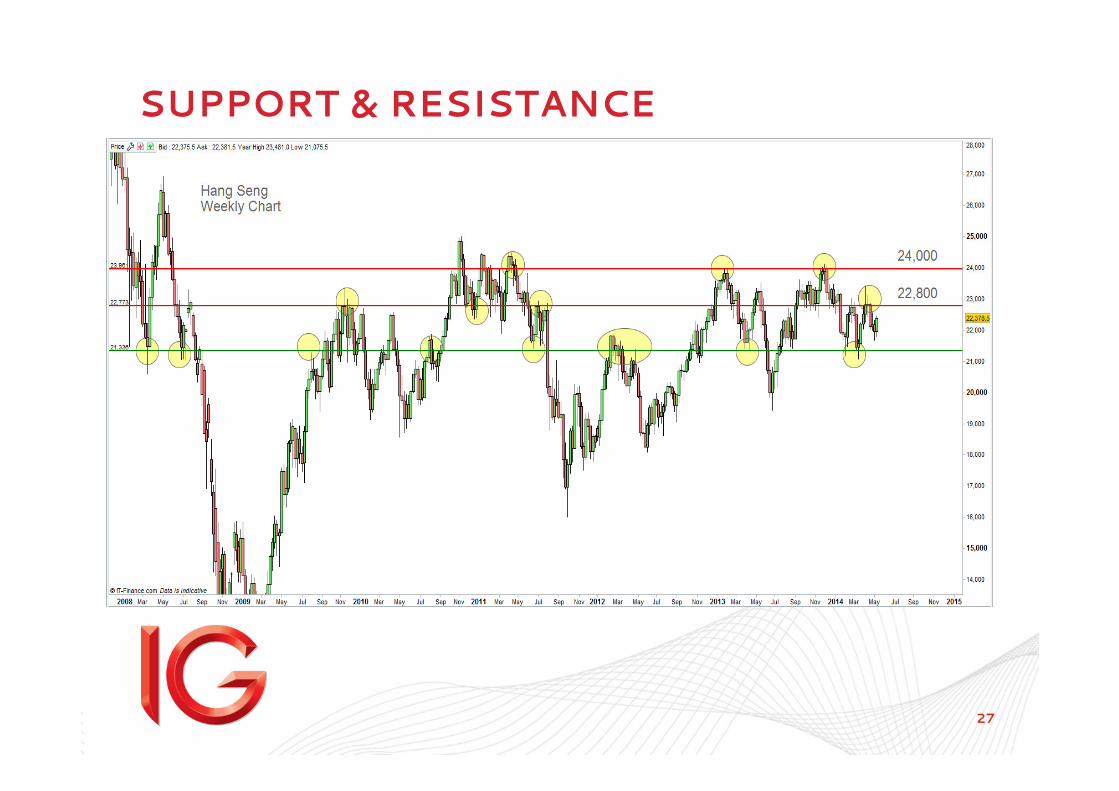
27
SUPPORT & RESISTANCE
Trade Planning – Looking for Confluence
Why Confluence Works
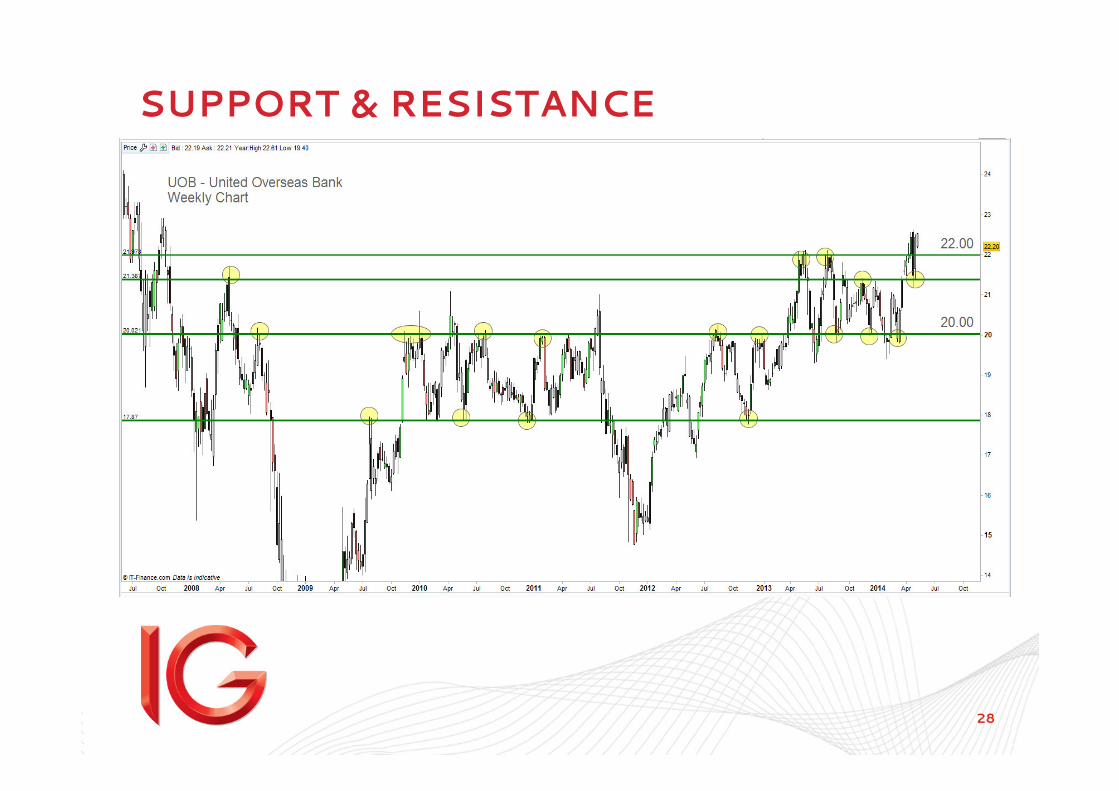
28
SUPPORT & RESISTANCE
Trade Planning – Looking for Confluence
Why Confluence Works
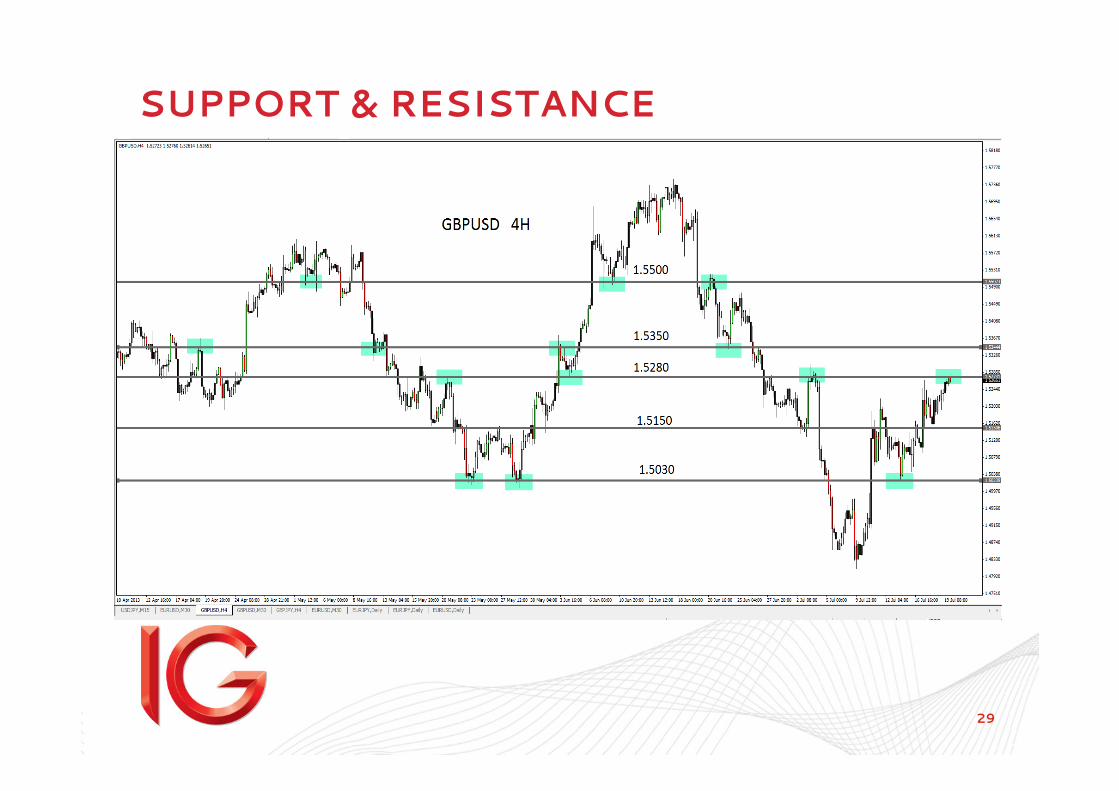
29
SUPPORT & RESISTANCE
Trade Planning – Looking for Confluence
Why Confluence Works
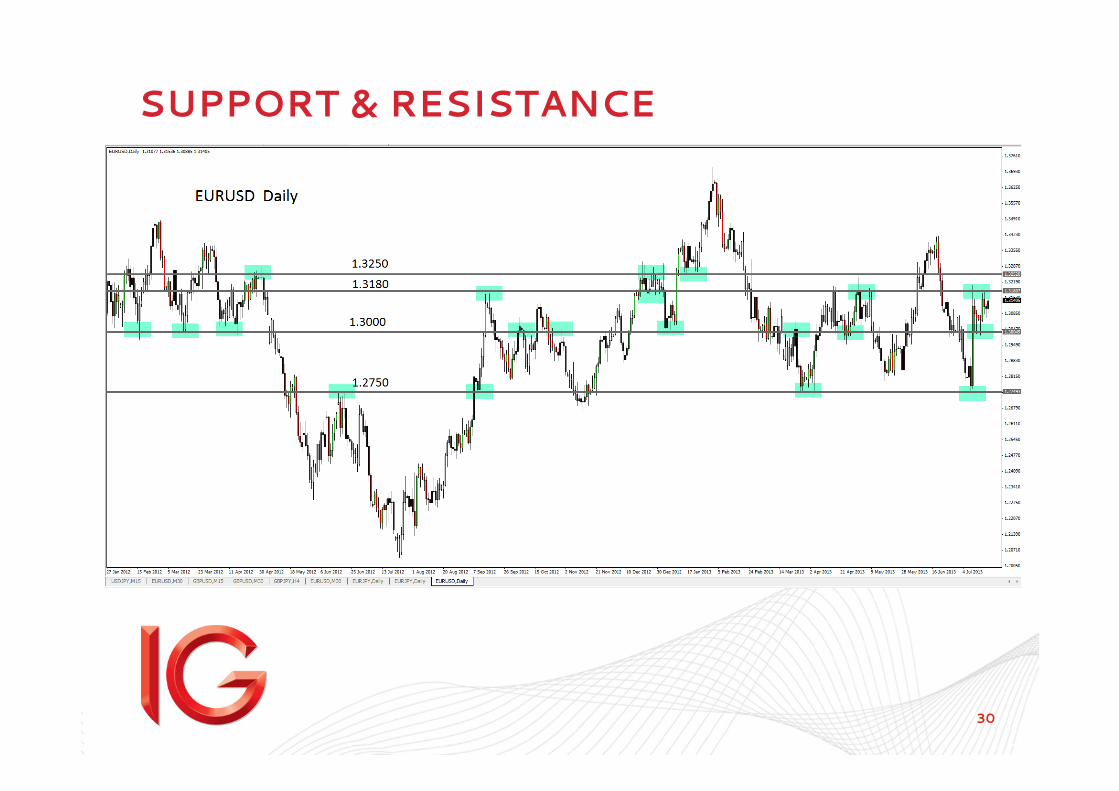
30
SUPPORT & RESISTANCE
31
SUPPORT & RESISTANCE
TREND LINES
• Not a random drawing on the chart
• There are rules to follow when drawing a trend line
• Trend lines provide guidelines for price
• Can be a support/resistance
• Most of the time, trend lines are sloping
• The degree of the slope indicates trend strength
• Applicable to any chart time-frame

32
SUPPORT & RESISTANCE
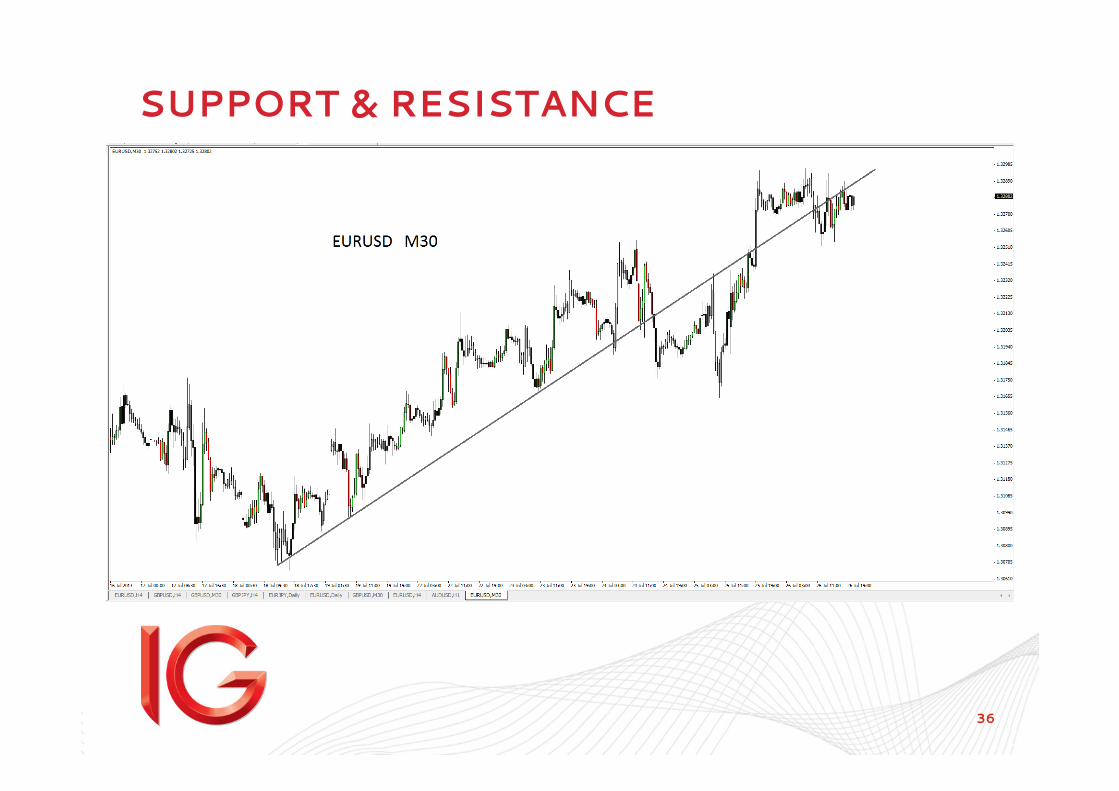
TREND LINE - UPTREND
• Look out for swing lows on the chart
• Connect the lows of the swings to form a straight line
– Lows and not the period close
• Trend Line must have at least 3 points of contact of the swing low
• Indicates bullish momentum, more buyers than sellers
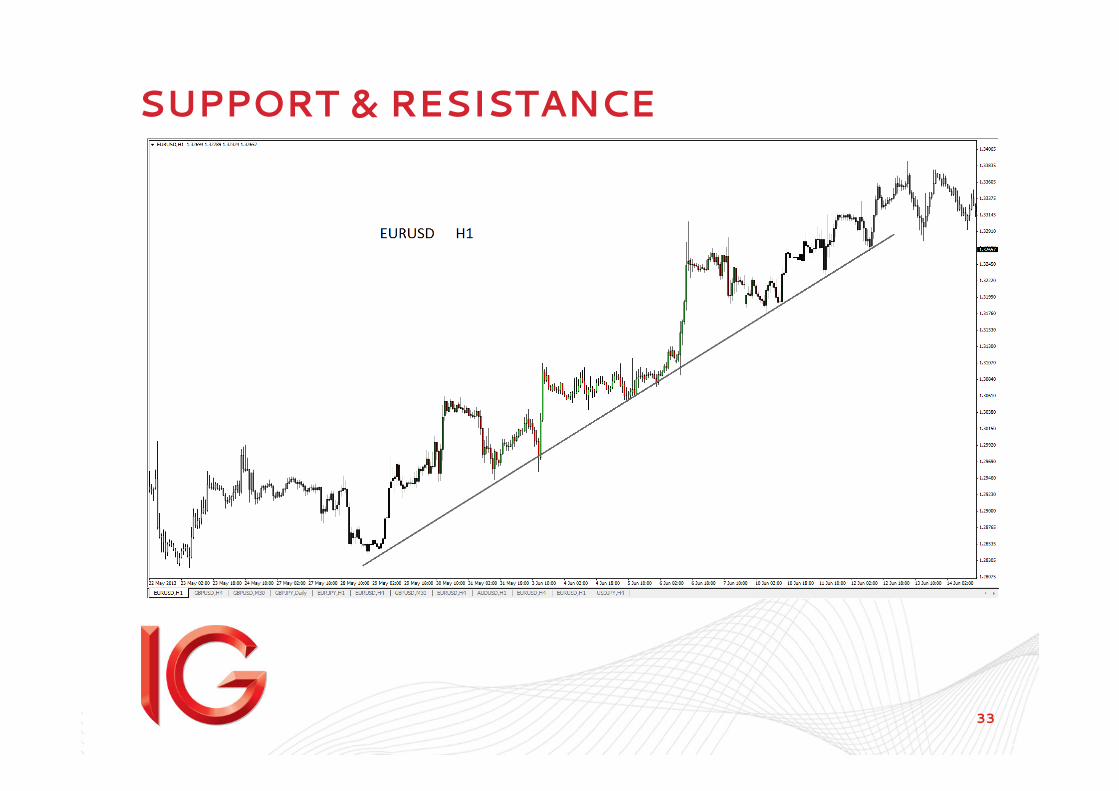
33
SUPPORT & RESISTANCE
34
SUPPORT & RESISTANCE
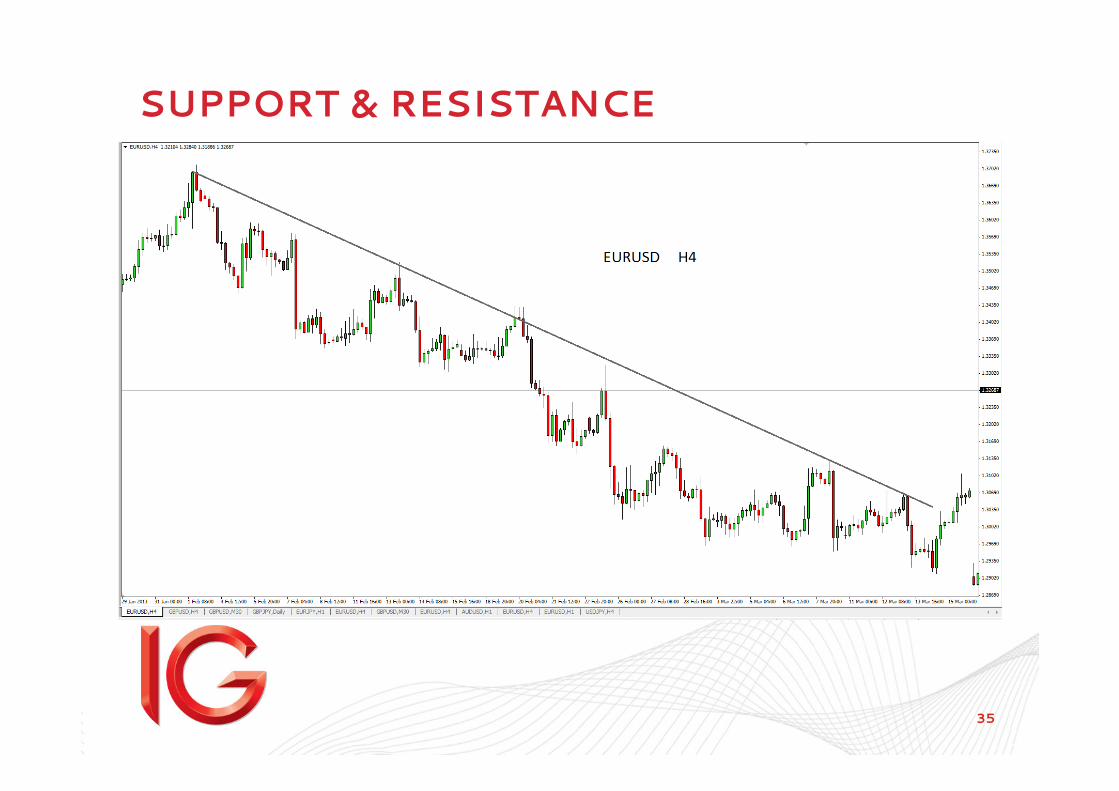
TREND LINE - DOWNTREND
• Look out for swing highs on the charts
• Connect the highs of the swings to form a straight line
– Highs and not the period close
• Trend Line must have at least 3 points of contact of the swing high
• Indicates bearish momentum, more sellers than buyers
35
SUPPORT & RESISTANCE
36
SUPPORT & RESISTANCE
37
SUPPORT & RESISTANCE
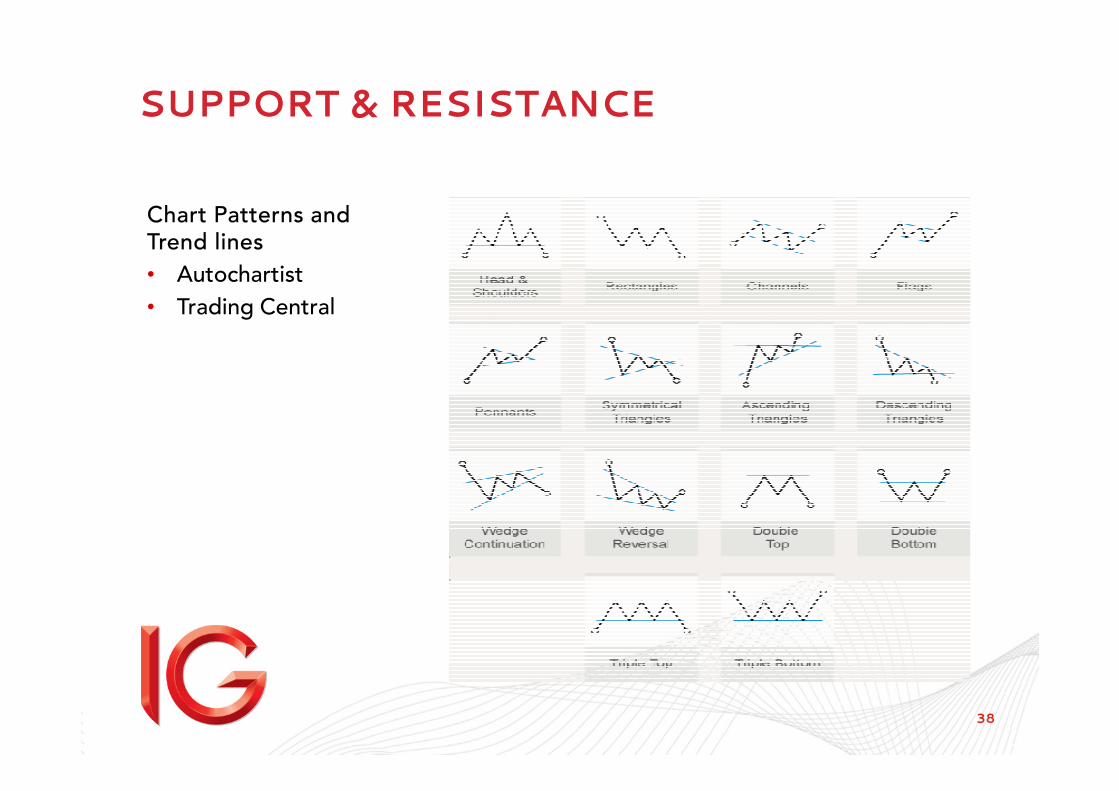
CHART PATTERNS
• Used to measure sentiment
– period of consolidation
– provides parameters to the market
• Detect continuation or reversal of trends
• Same rules on how we draw trend lines
• Most common ones:
– wedge, triangle, pennants, flags
• Applicable to any chart time-frame
– adjust trade plan base on time frame
– i.e. a consolidation on a daily chart might be a new trend on a H1 chart
38
SUPPORT & RESISTANCE
Chart Patterns and Trend lines
• Autochartist
• Trading Central
39
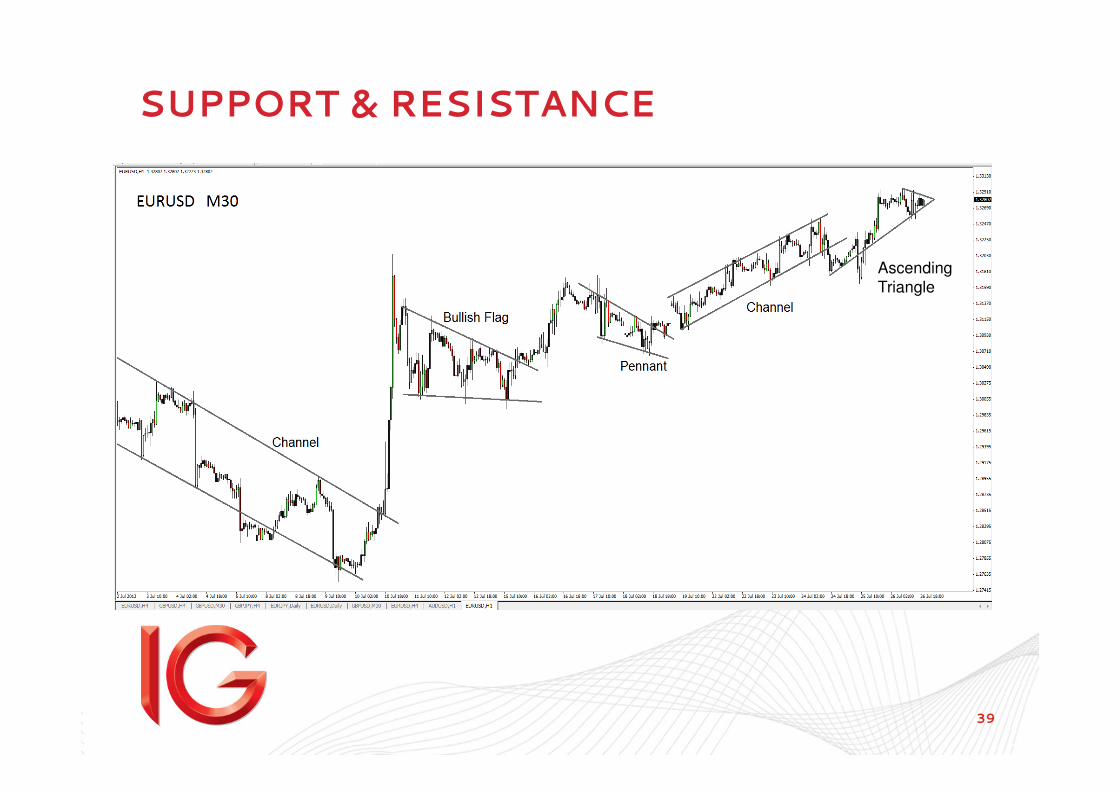
SUPPORT & RESISTANCE
Ascending Triangle
40
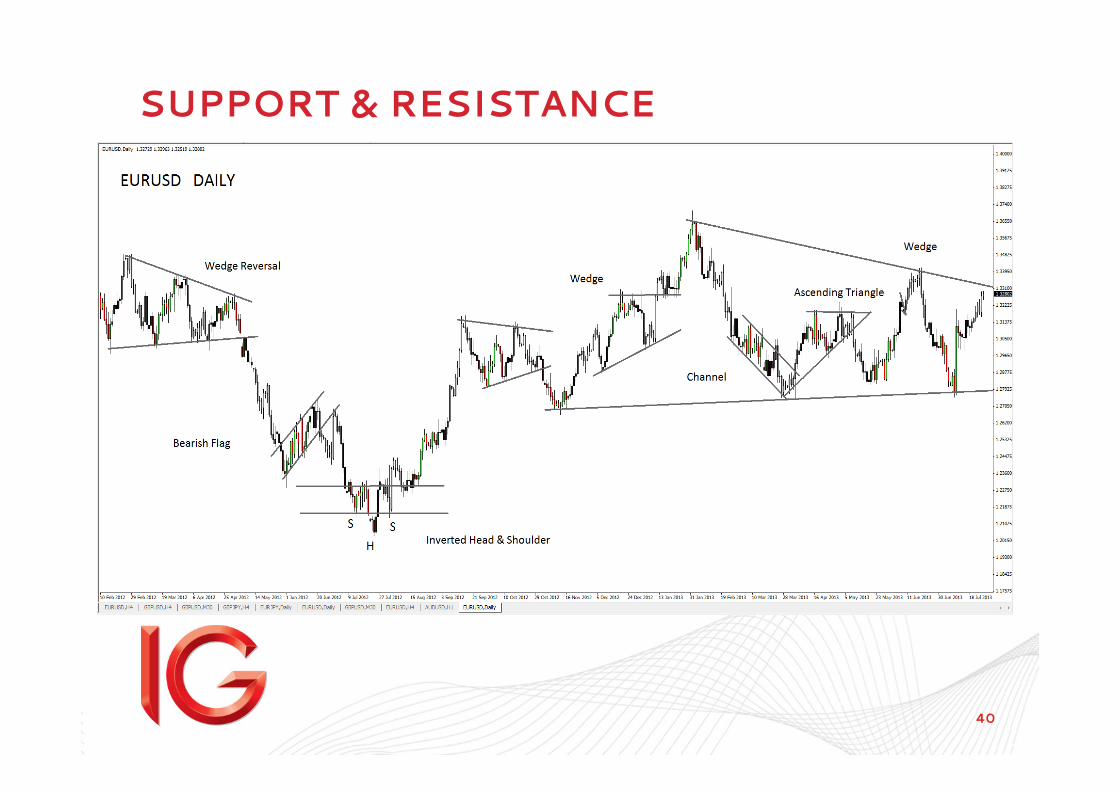
SUPPORT & RESISTANCE
41
TRADING WITH THE TREND
42
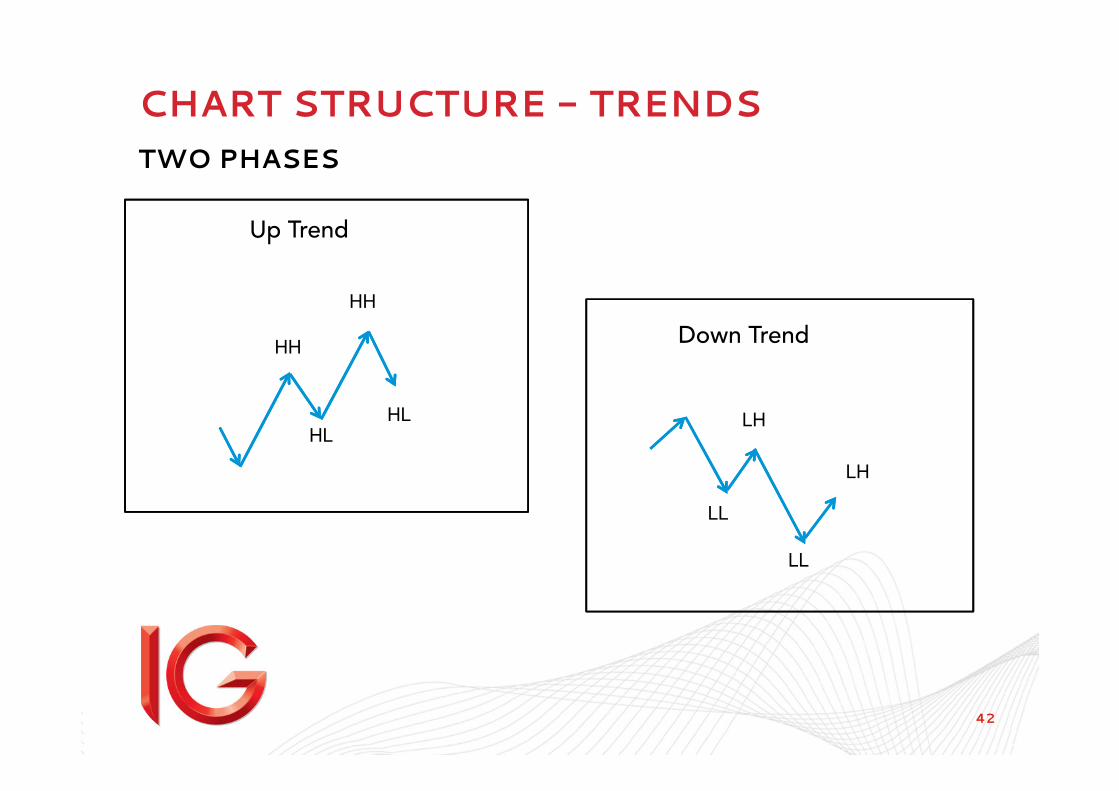
CHART STRUCTURE - TRENDS
TWO PHASES
Up Trend
HL
HH
HL
HH
Down Trend
LH
LH
LL
LL
43
CHART STRUCTURE - TRENDS
• Cliché – The Trend is Your Friend
The market can stay irrational longer than you can stay solvent” – John Maynard Keynes
• Trends
– Highest Probability
– Highest Potential Rewards
• It can’t go any higher/lower”
– We tend to use fundamental analysis to “support” our “prediction” even if chart does not show it
– “Homerun” mindset
44
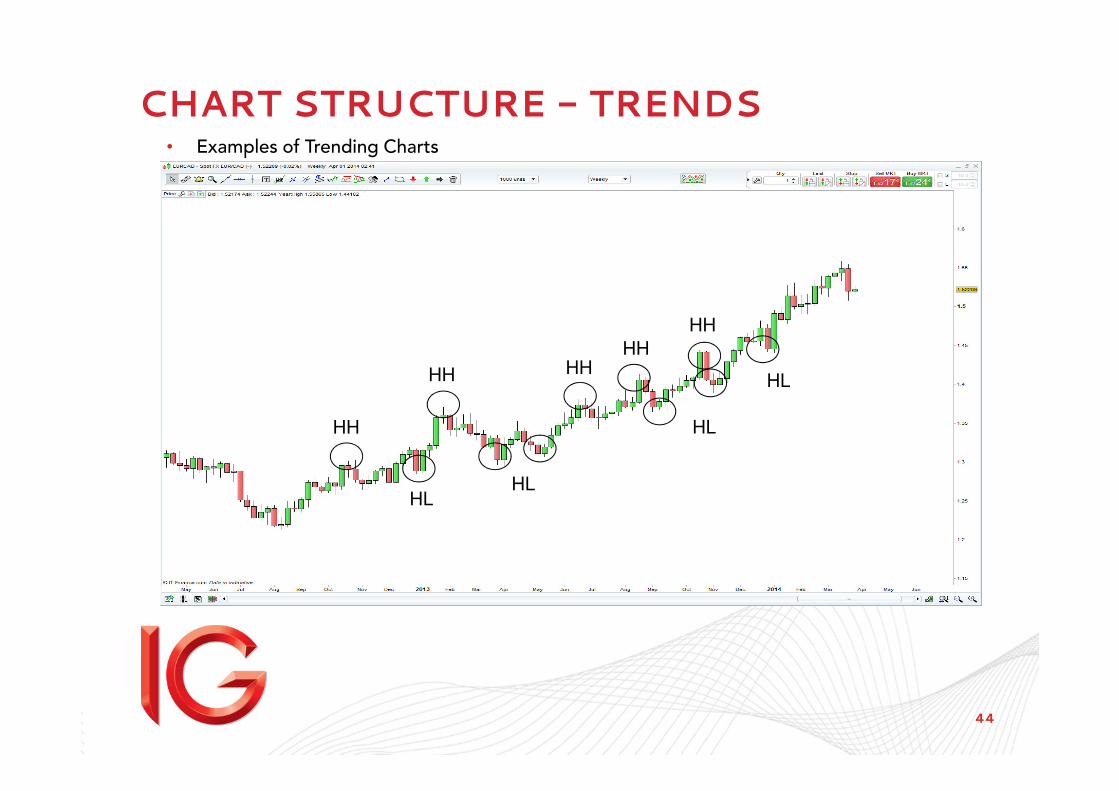
CHART STRUCTURE - TRENDS• Examples of Trending Charts
HLHL
HL
HLHH HHHH
HH
HH
45
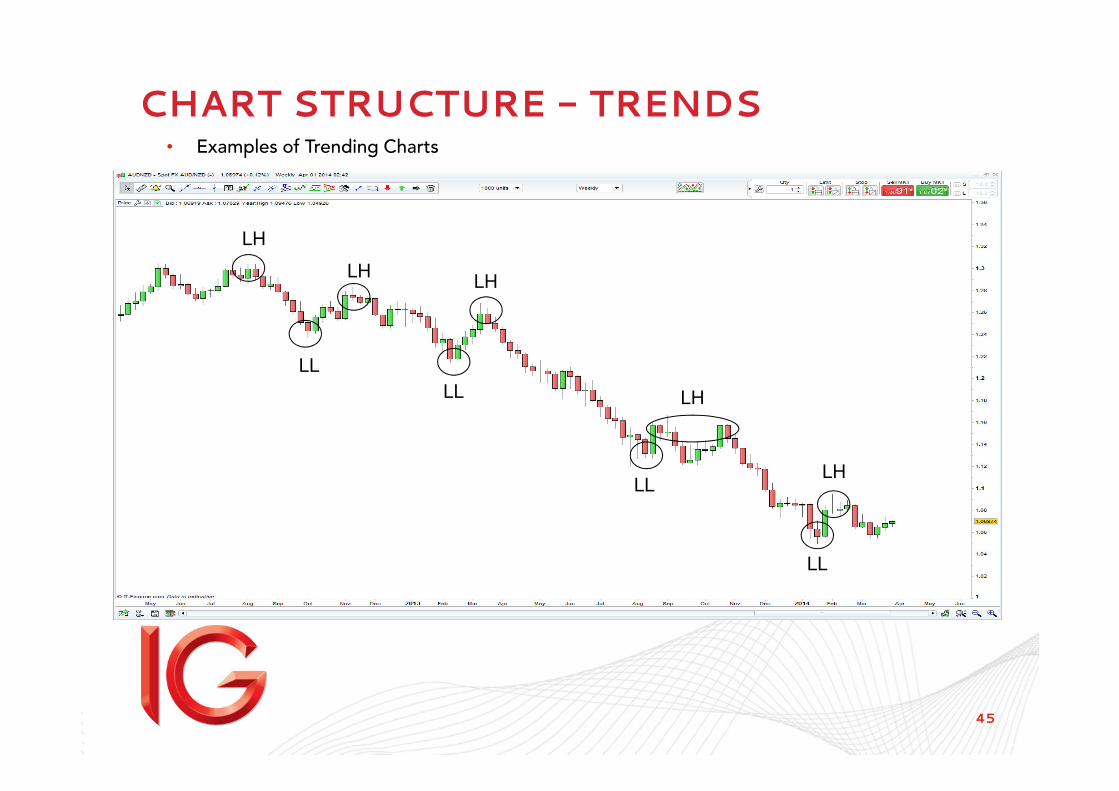
CHART STRUCTURE - TRENDS• Examples of Trending Charts
LL
LL
LL
LL
LH
LHLH
LH
LH

46
CHART STRUCTURE - TRENDS• Examples of Trending Charts
HL
HL
HL
HL
HL
HLHH
HH
HH
HH
S&P 500
47
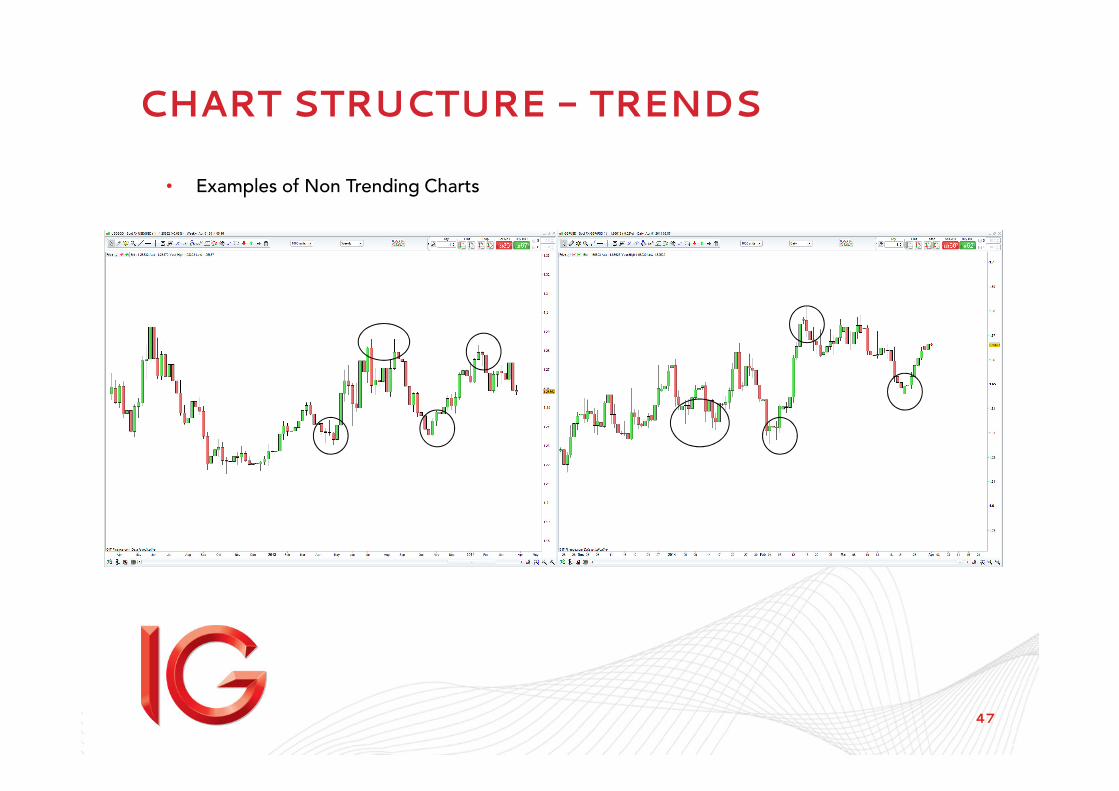
CHART STRUCTURE - TRENDS
• Examples of Non Trending Charts
48
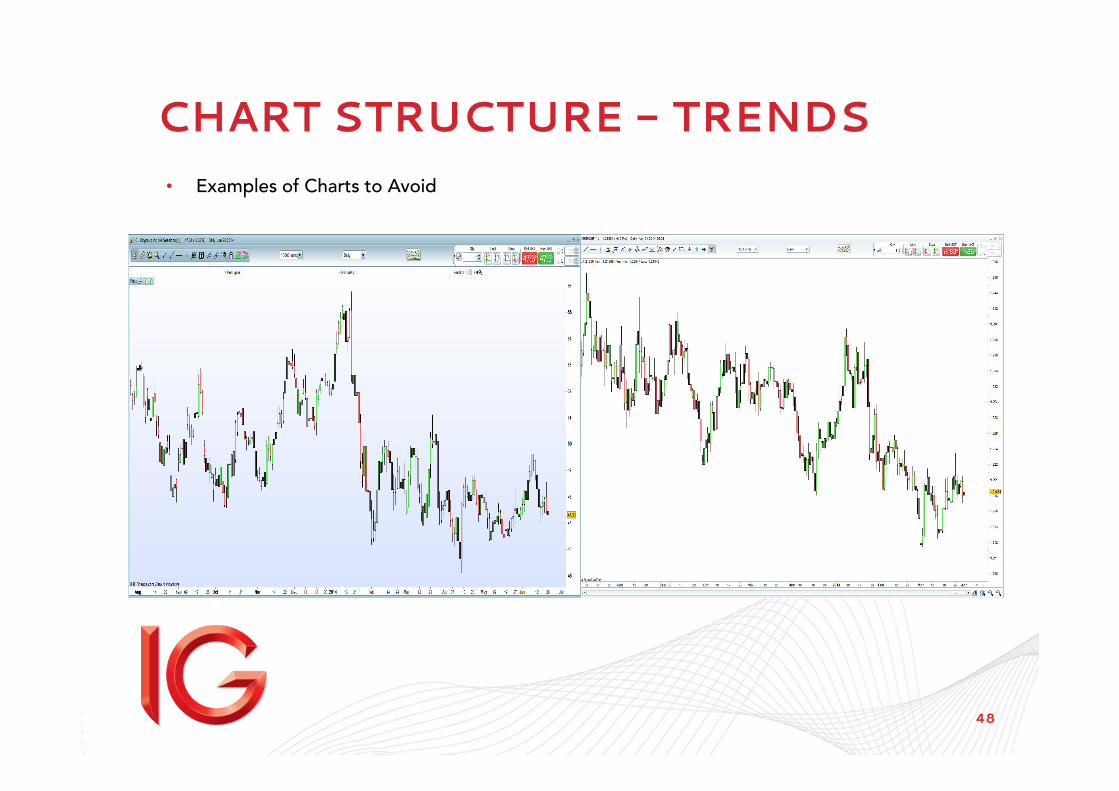
CHART STRUCTURE - TRENDS
• Examples of Charts to Avoid
49
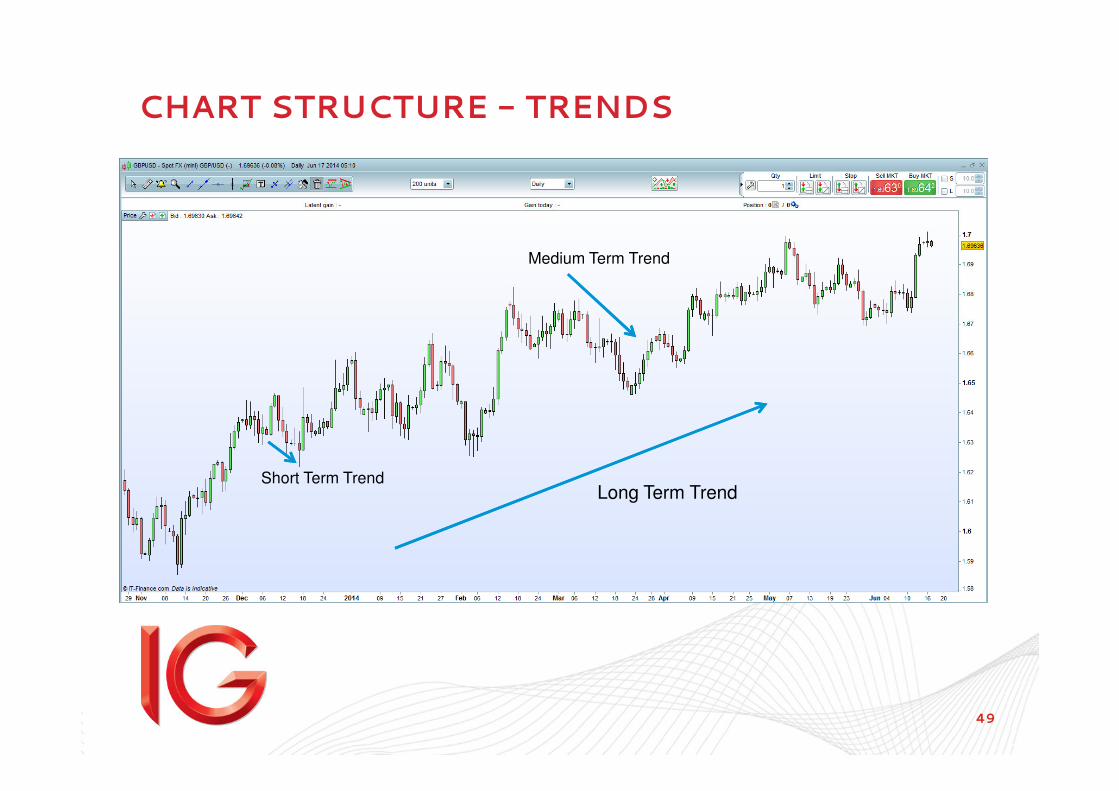
CHART STRUCTURE - TRENDS
Long Term TrendShort Term Trend
Medium Term Trend
50
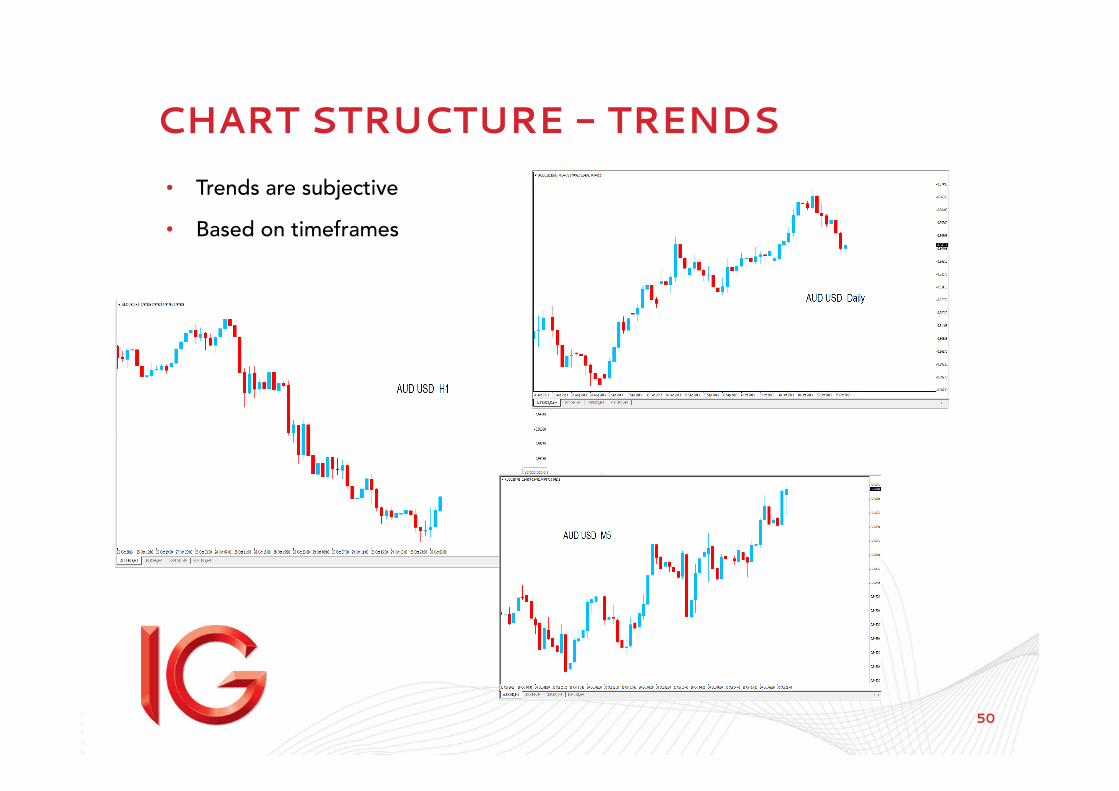
CHART STRUCTURE - TRENDS
• Trends are subjective
• Based on timeframes
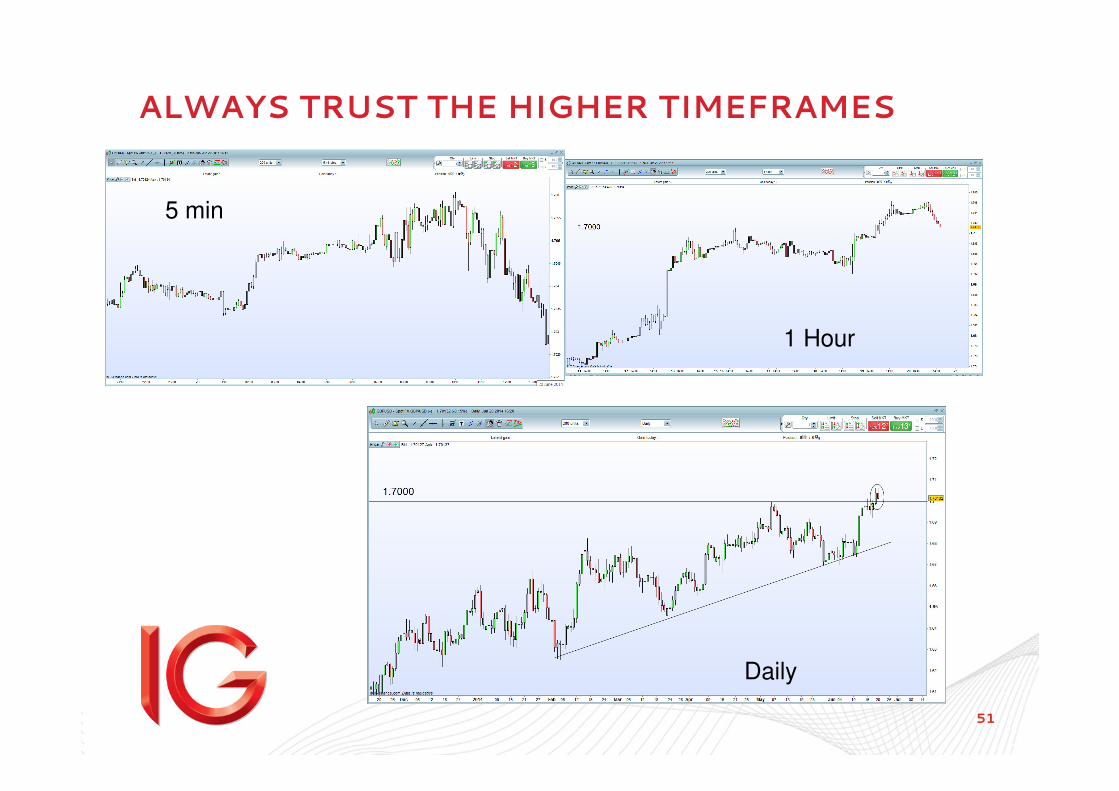
51
ALWAYS TRUST THE HIGHER TIMEFRAMES
5 min
1 Hour
Daily
52
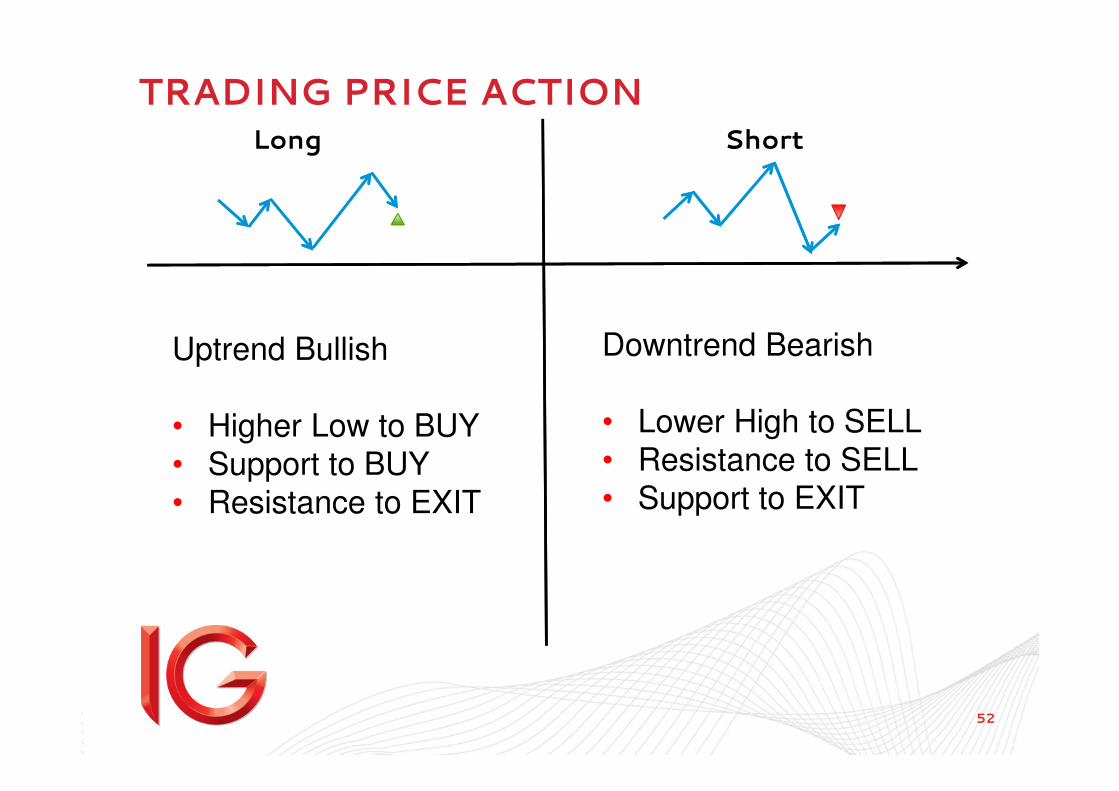
TRADING PRICE ACTIONLong Short
Uptrend Bullish
• Higher Low to BUY• Support to BUY• Resistance to EXIT
Downtrend Bearish
• Lower High to SELL• Resistance to SELL• Support to EXIT
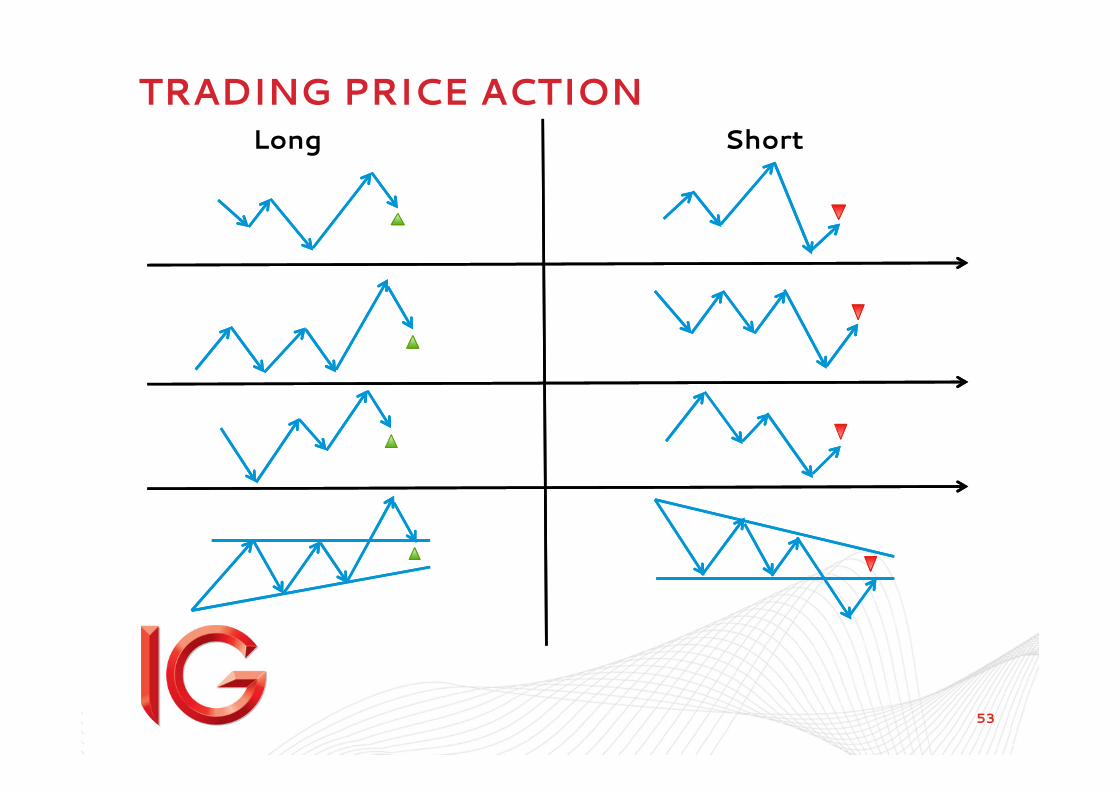
53
TRADING PRICE ACTIONLong Short
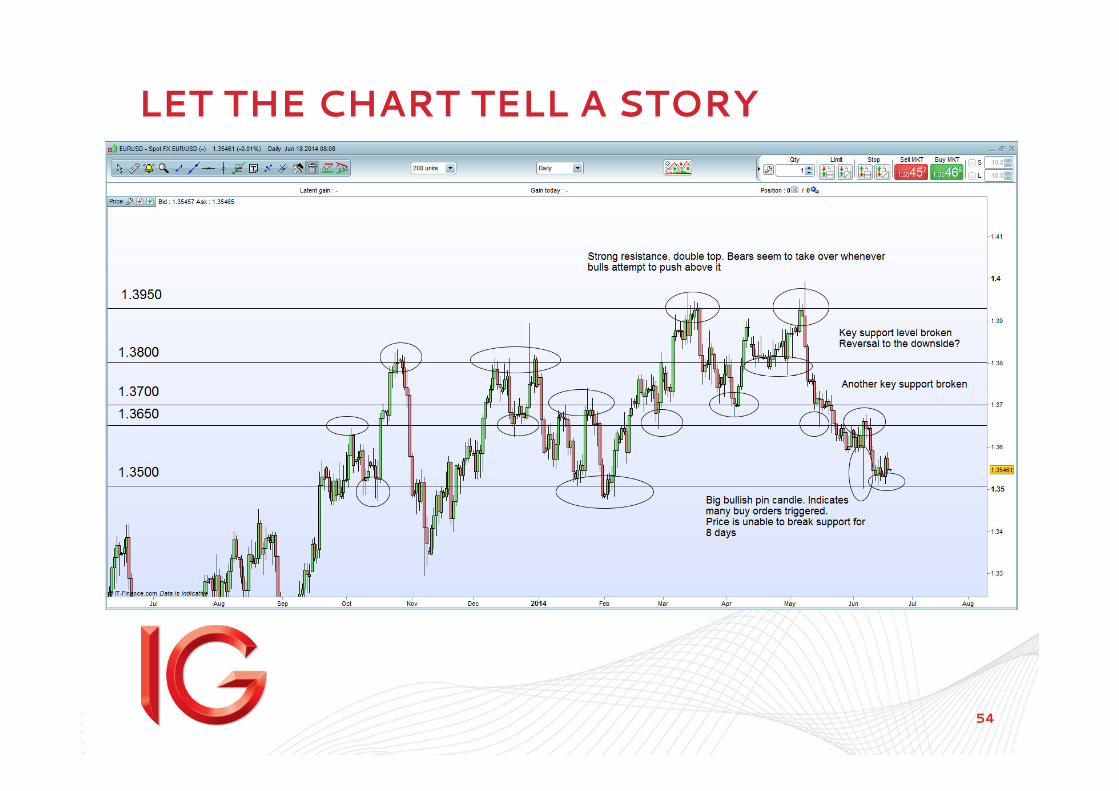
54
LET THE CHART TELL A STORY
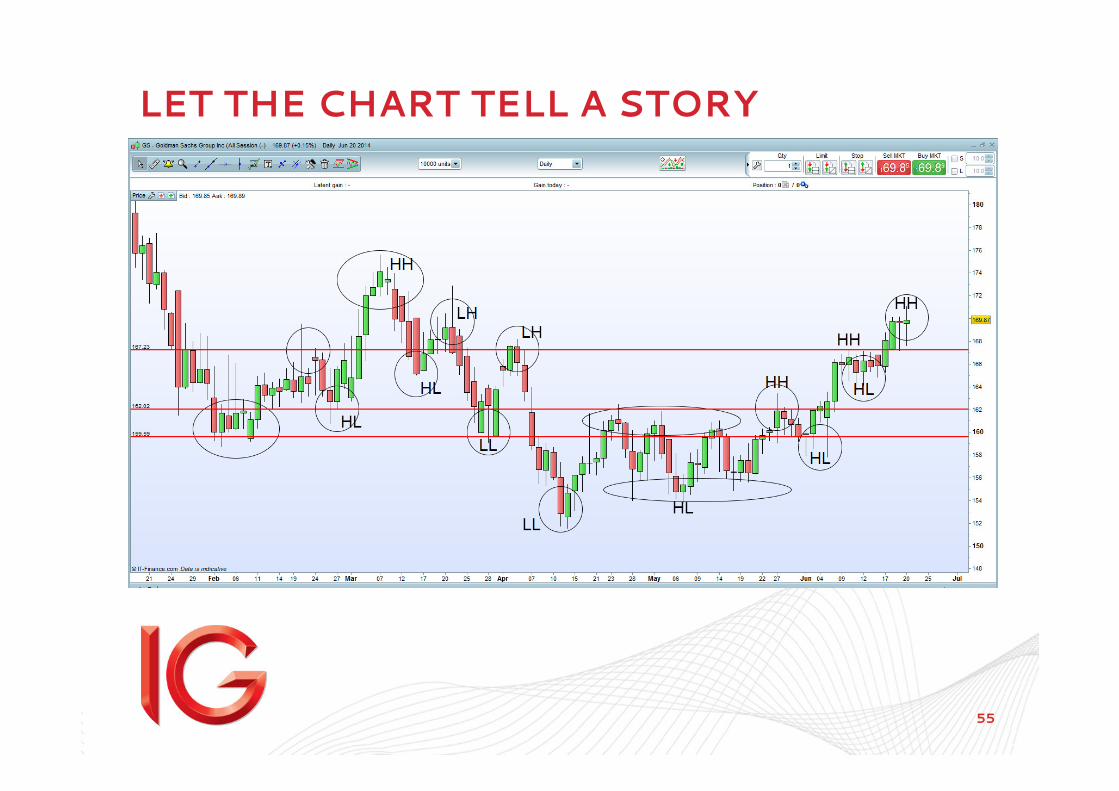
55
LET THE CHART TELL A STORY
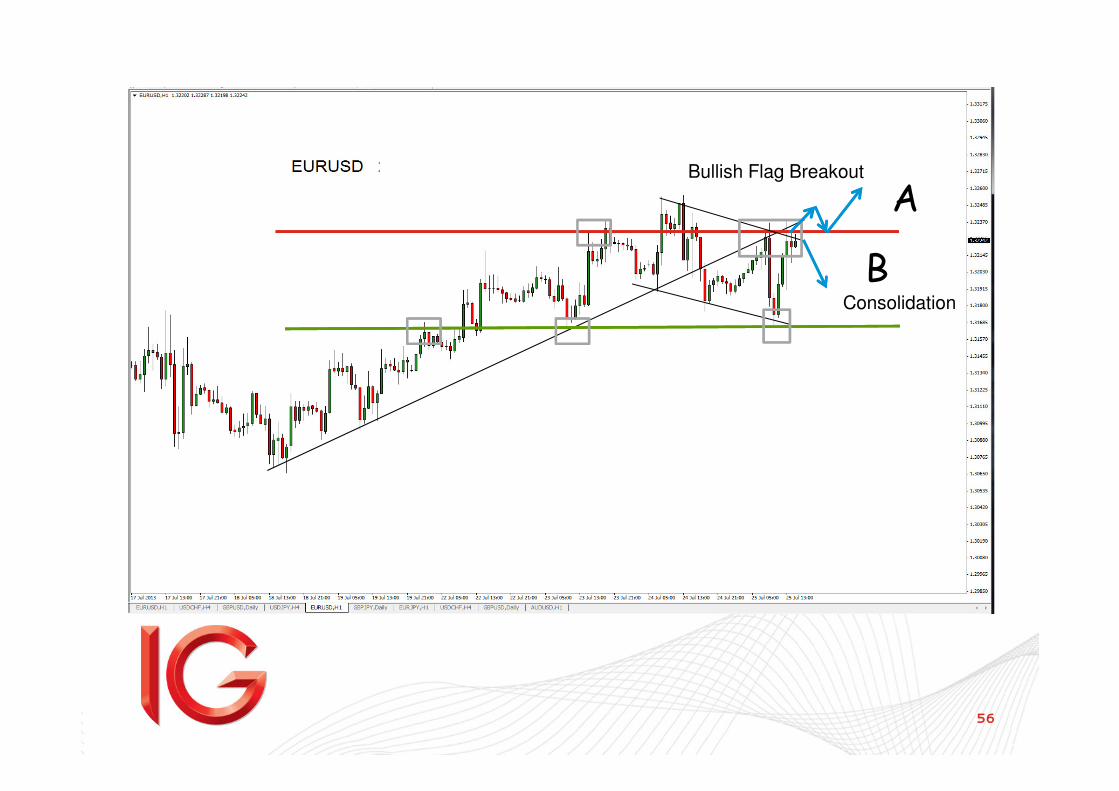
56
ABullish Flag Breakout
Consolidation
B
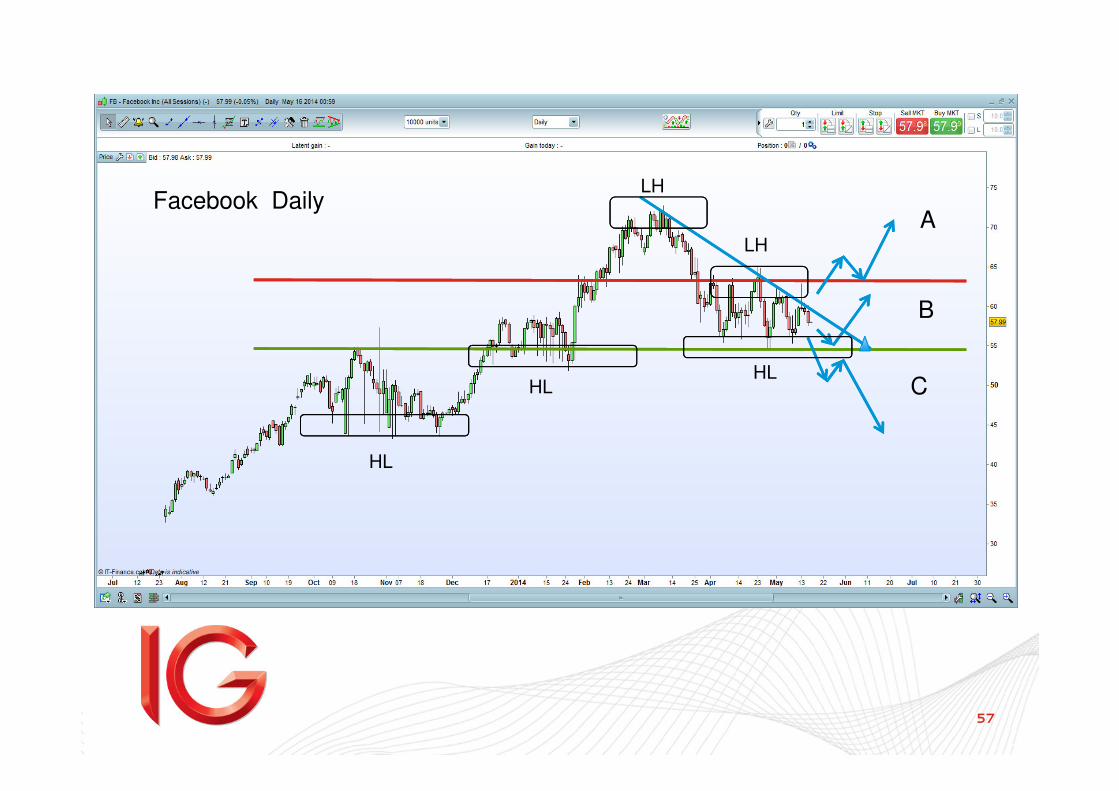
57
HL
HLHL
LH
LH
Facebook DailyA
B
C
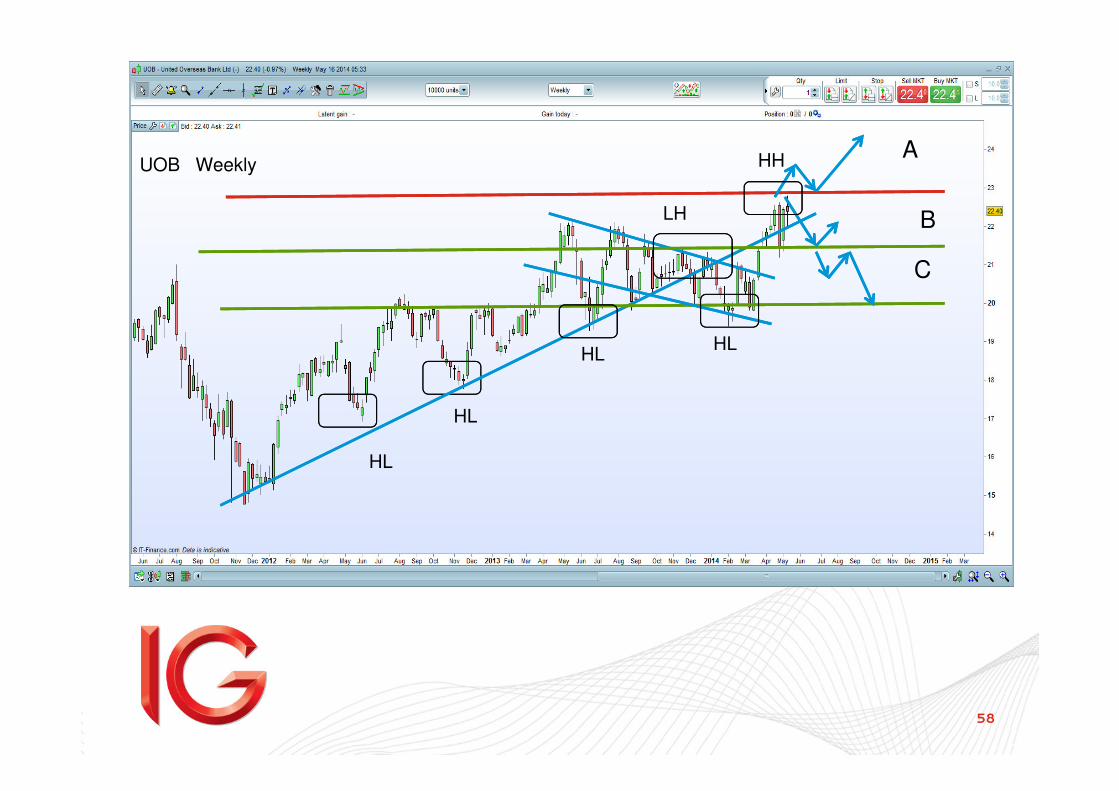
58
UOB Weekly
HL
HL
HL
LH
HH
HL
A
B
C
59
TRADE PLANNING
60
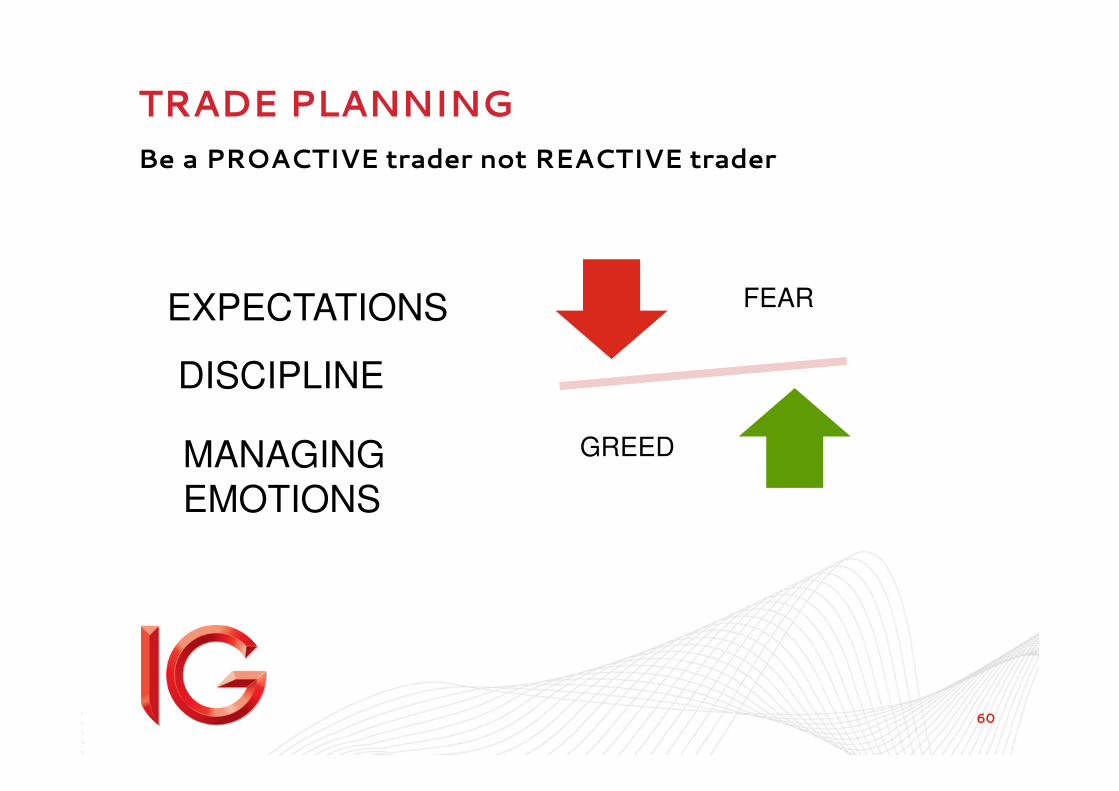
TRADE PLANNING
Be a PROACTIVE trader not REACTIVE trader
FEAR
GREED
EXPECTATIONS
DISCIPLINE
MANAGING EMOTIONS
61
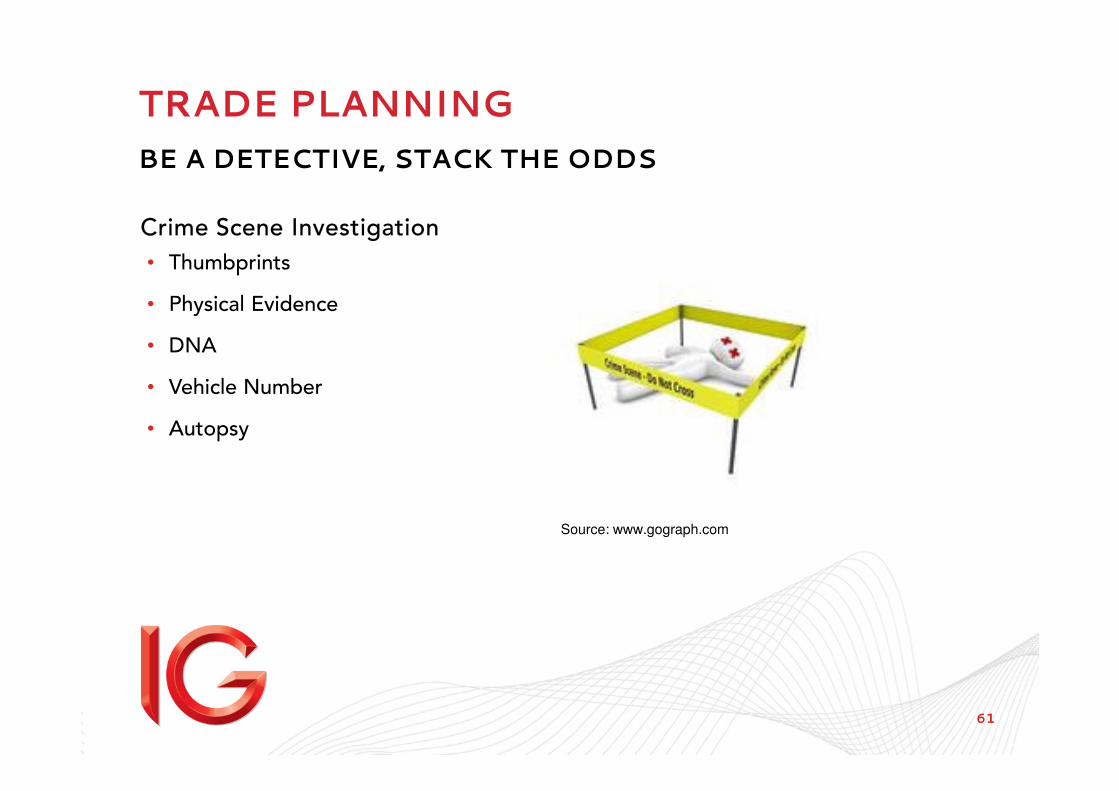
TRADE PLANNING
BE A DETECTIVE, STACK THE ODDS
Crime Scene Investigation
• Thumbprints
• Physical Evidence
• DNA
• Vehicle Number
• Autopsy
Source: www.gograph.com
62
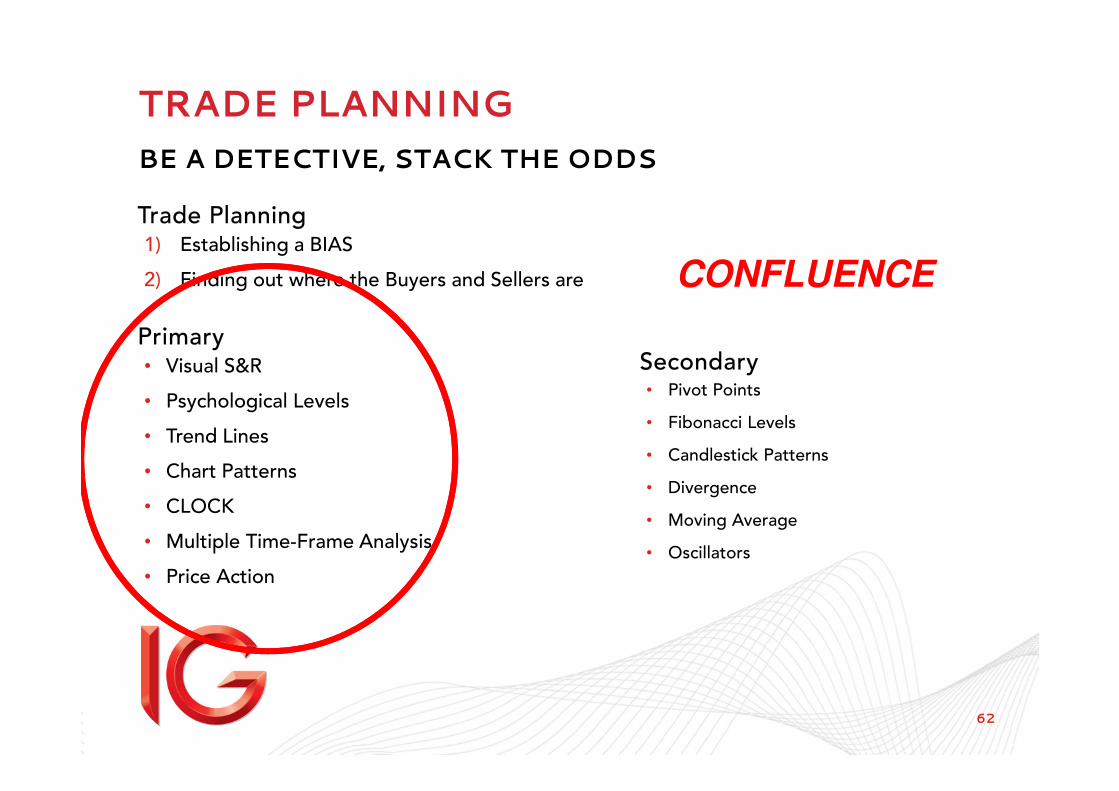
TRADE PLANNING
BE A DETECTIVE, STACK THE ODDS
Trade Planning 1) Establishing a BIAS
2) Finding out where the Buyers and Sellers are
Primary• Visual S&R
• Psychological Levels
• Trend Lines
• Chart Patterns
• CLOCK
• Multiple Time-Frame Analysis
• Price Action
Secondary• Pivot Points
• Fibonacci Levels
• Candlestick Patterns
• Divergence
• Moving Average
• Oscillators
CONFLUENCE
63
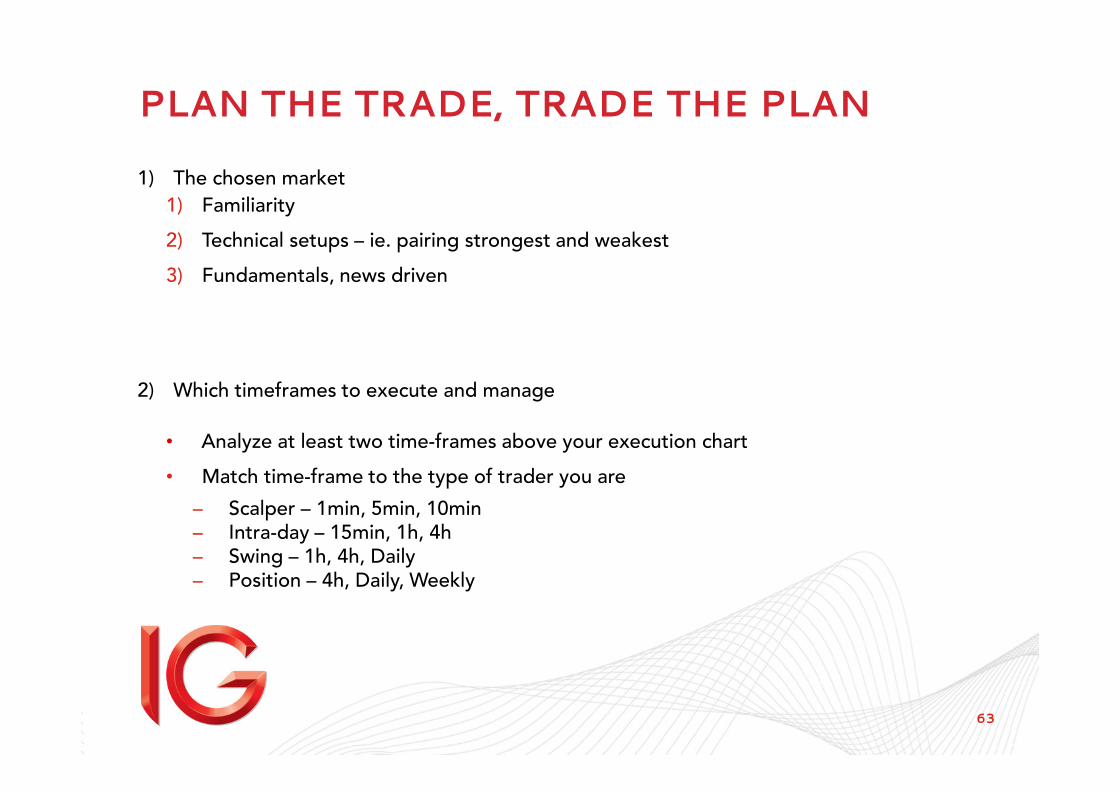
PLAN THE TRADE, TRADE THE PLAN
1) The chosen market
1) Familiarity
2) Technical setups – ie. pairing strongest and weakest
3) Fundamentals, news driven
2) Which timeframes to execute and manage
• Analyze at least two time-frames above your execution chart
• Match time-frame to the type of trader you are
– Scalper – 1min, 5min, 10min– Intra-day – 15min, 1h, 4h– Swing – 1h, 4h, Daily– Position – 4h, Daily, Weekly
64
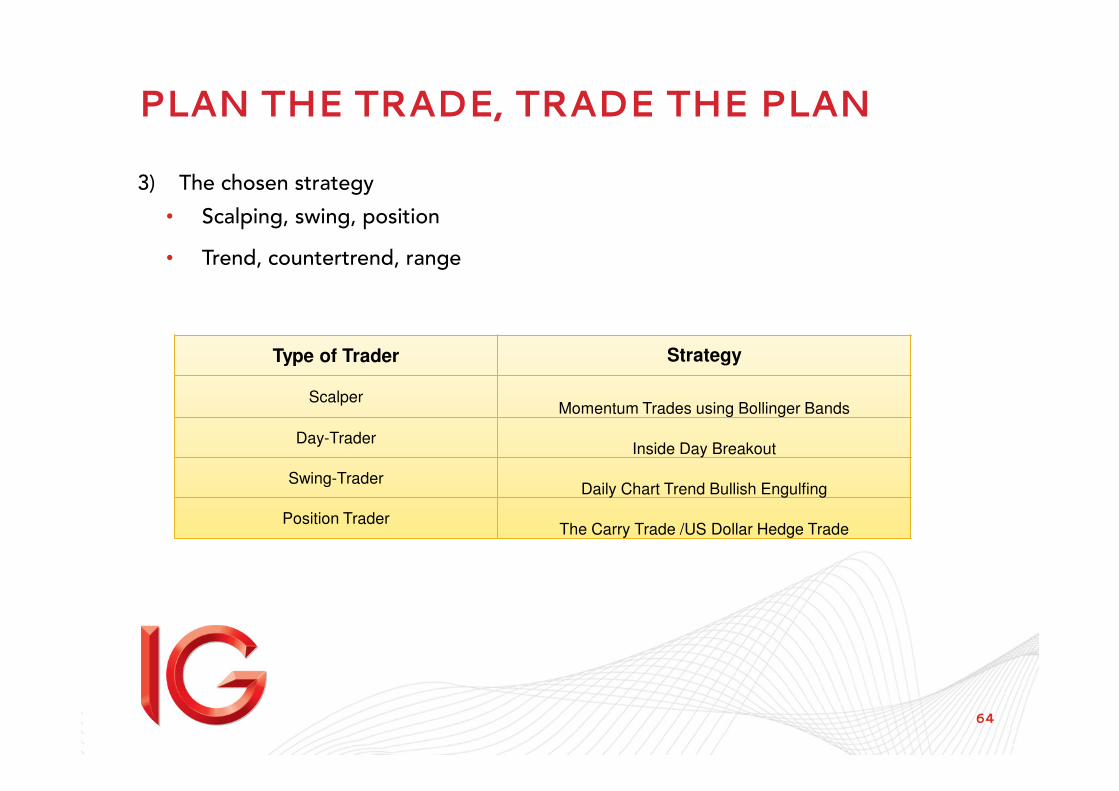
PLAN THE TRADE, TRADE THE PLAN
3) The chosen strategy
• Scalping, swing, position
• Trend, countertrend, range
Type of Trader Strategy
ScalperMomentum Trades using Bollinger Bands
Day-TraderInside Day Breakout
Swing-TraderDaily Chart Trend Bullish Engulfing
Position TraderThe Carry Trade /US Dollar Hedge Trade
65
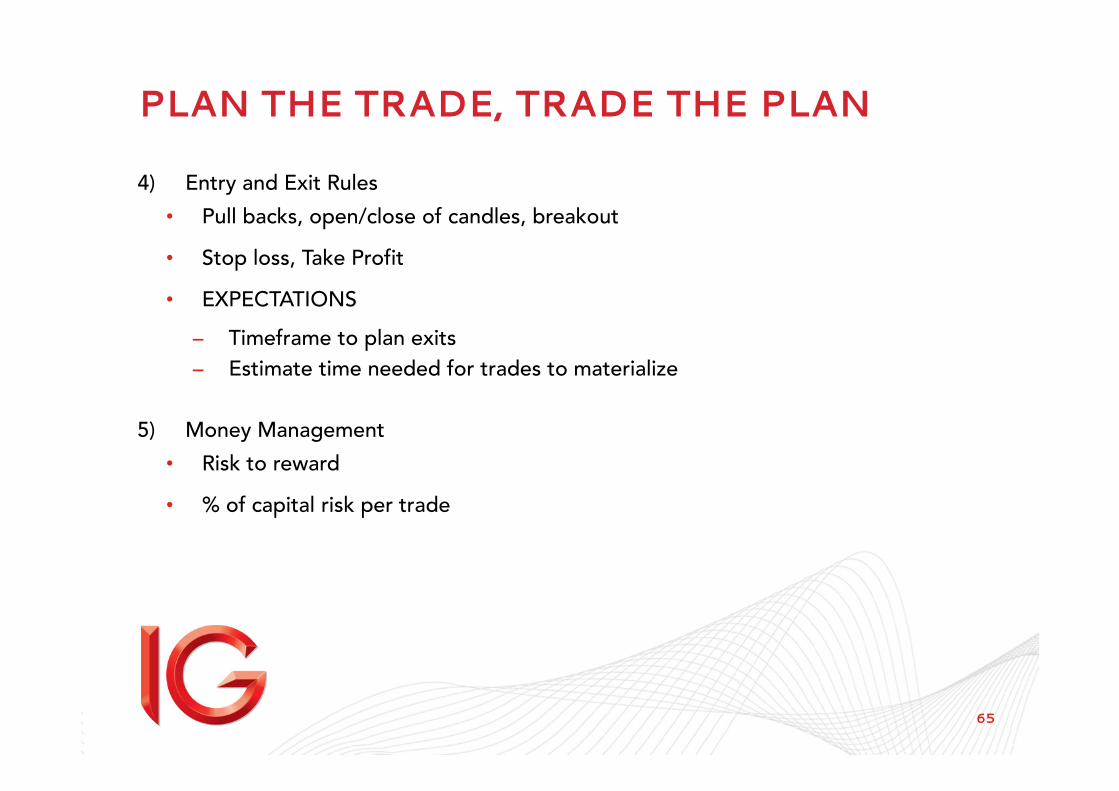
PLAN THE TRADE, TRADE THE PLAN
4) Entry and Exit Rules
• Pull backs, open/close of candles, breakout
• Stop loss, Take Profit
• EXPECTATIONS
– Timeframe to plan exits
– Estimate time needed for trades to materialize
5) Money Management
• Risk to reward
• % of capital risk per trade
66
SUMMARY
• Understand what the chart is doing, be a master of leading indicators
• Price Action
• Support and Resistance
– Visual, Psychological
– Trend lines
– Support and Resistance
• Know your timeframes and make sure it suits your trading style
• Plan the trade, trade the plan