trade and poverty case study: small household · pdf fileinternational trade exposes producers...
TRANSCRIPT

Trade and Poverty Case Study:
Small household appliances
By Taz Chaponda Matthew Stern
2006

Disclaimer
Funding for this project was provided by the UK Department for International Development (through RTFP and the Trade and Industry Policy Strategies), the Department of Trade and
Industry and USAID.
The views expressed in these papers do not necessarily reflect the views of the relevant funding agencies.

TRADE AND POVERTY CASE STUDY: SMALL HOUSEHOLD APPLIANCES
By: Taz Chaponda and Matthew Stern
1. Introduction This case study is part of a much larger research project on trade and poverty in South Africa. The overarching project borrows from the framework developed by McCulloch, Winters and Cirera (2001) to demonstrate the different channels through which trade can impact on poverty and economic development. In particular, the project tries to measure the impact on households from lower prices and changes in production and employment in the effected industries. This is achieved by quantitative analyses as well as five sector-specific case studies. In identifying sectors for case study analysis, the project team and reference group tried to strike a balance between the likely winners and losers of trade reform. The consumer appliance sector in general, and manufacturers of small household appliances in particular, were seen as possible beneficiaries of globalisation. South Africa manufactures a diverse range of small electrical appliances and local manufacturers have won significant export contracts in the USA and Europe (AMAP 2000). The recent financial performance of these companies is impressive and their brand presence within South Africa remarkably strong. Yet the case study reveals a surprising picture. The industry has, without doubt, been a major beneficiary of globalisation. Increased international competition has forced a substantial restructuring of the domestic industry and existing suppliers have become leaner, more focused and much more profitable. Although the two market leaders continue to manufacture some products locally, the primary activity of both companies has switched from manufacturing to importing and brand management. Exports are small and recent gains in the USA and Europe were fortuitous and short-lived. The experience of this sector is therefore somewhat different to what was anticipated. This is not an export success story, but one of overwhelming import success. The companies interviewed and analysed in this paper have adapted very well to the ‘threat’ of international competition and have captured most of the gains. The gains to consumers, in terms of product variety and quality, have also been substantial; and the employment losses have been small. But input and output prices remain distorted by unnecessary tariffs and South African consumers continue to pay a high price for basic home appliances. The policy lessons are conventional. International trade exposes producers and consumers to new markets and products. Tariffs get in the way of these opportunities and the cost is usually borne by the consumer. In this particular industry, the maximum number of jobs protected by existing tariffs is small. The case study provides compelling reasons to do away with these tariffs and enable South African consumers to share with business in the benefits of international trade in this sector. The paper begins with a brief overview of the consumer appliance sector and the recent performance of the dominant players in this industry. Next, we look at changes to tariffs and protection on specific appliances through multilateral and preferential reforms. The following two sections evaluate the impact of tariff changes on enterprises and consumers – two of the three channels in the McCulloch, Winters and Cirera framework. In conclusion, we comment on THE likely effect of tariff liberalisation in this sector on poverty in South Africa.
2. Sector Overview The consumer appliance sector falls within the broader category of electrical machinery and components. This sector consists of large appliances such as washing machines, refrigerators, and ovens (so called “white goods”) as well as small household appliances such as toasters, hot-plates

Trade and Poverty Project, Southern Africa Labour and Development Research Unit
Trade and poverty case study: Small household appliances 2
and kettles. The sector is small when compared to other manufacturing sectors reviewed in this project, such as the automotive, chemical and plastics, and apparel industries. The white goods industry has its roots in the foundries of the 1800s which first produced cast-iron coal- and wood-fired stoves and later turned to electrically powered stoves and refrigerators (Bezuidenhout 2002). The modern day white goods industry based on mass production emerged in the 1920s under high levels of protection, mainly in the form of import tariffs. Protection remained a feature of South Africa’s industrial development for most of the 20th century and enabled domestic manufacturers of consumer appliances to operate with little threat of import competition. A major shift in industrial protection took place in the mid 1990s with a gradual reduction of import tariffs and the removal of surcharges on manufactured goods in general (Edwards 2005). The average tariff (including surcharges) on electrical machinery fell from a high of around 25% in the late 1980s to 7% in 2004. But the household appliance sector remained largely immune to such cuts, with the average tariff falling from 16% to 13% over this period (Ibid 2005). Moreover, there remains significant variation across products with zero tariffs on some items and tariffs as high as 25 per cent on refrigerators and freezers. Despite these modest attempts at trade liberalisation, imports of consumer appliances rose rapidly at an average annual rate of 20% during the 1990s. Exports also grew, though not as fast as imports. These trends led to substantial restructuring and consolidation in the industry culminating in the liquidation of Kelvinator and Master Fridge, two major players in the South African market, and a sharp reduction in employment (Bezuidenhout 2002). Employment data on consumer appliances is not reported separately in South Africa, but is captured under the broader category of electrical machinery. Figure 1 shows the trend in employment for the electrical machinery sector. From an initial rise in employment in the 1970s, the total number of jobs peaked at 77 000 in the early 1980s and the sector has been shedding jobs ever since. The most dramatic and persistent decline in jobs occurred over the 1990s, with total employment falling from about 68 000 to a little more than 33 000. The largest number of jobs lost has been among lesser skilled workers.
Figure 1: Employment in the electrical machinery sector
0
10000
20000
30000
40000
50000
60000
1970
1972
1974
1976
1978
1980
1982
1984
1986
1988
1990
1992
1994
1996
1998
2000
2002
2004
Highly skilledSkilledSemi- and unskilled
Source: Quantec
This aggregate trend in employment probably reflects the experience of the consumer appliance sector. In the early 1990s, the total workforce in this sector was estimated at about 10 000 (Bezuidenhout 2002). Interviews with the major players indicate that the workforce currently stands at about 5 300 and there has been an increased reliance on temporary contract workers. Job losses are a result of some combination of rising imports and productivity gains.

Trade and Poverty Project, Southern Africa Labour and Development Research Unit
Trade and poverty case study: Small household appliances 3
Most research in the consumer appliance sector has focused on manufacturers of white goods. Some of this work is updated in this study, but the focus from hereon is on manufacturers and consumers of small household appliances. Two companies supply about 90% of all small household appliances sold in South Africa and their recent experiences are described below. Most of the following information comes from interviews with the two companies and is supplemented in places with financial information obtained from their annual reports.
The South African market for small household appliances The South African market for small household appliances is dominated by two Gauteng-based companies: Nu-World and Amalgamated Appliances (AMAP). Both companies were set-up as manufacturing concerns in the 1940’s and benefited from significant tariff protection for most of the 20th century. In 1990 about 80% of domestic consumption of small, consumer appliances was produced by these two companies. Globalisation has had a dramatic impact on both companies. By 2005 domestic production had shrunk to around 20% of consumption and imports now dominate the local market. But almost all imports are accounted for by Nu-World and AMAP and their stronghold over the domestic market remains largely unchallenged. Nu-World has positioned itself as a ‘one-stop shop’ for branded consumer durables. It manufactures, imports, exports and distributes various household appliances under 15 different brands1. The company has a market capitalisation of about R604 million and has reported fourteen years of consecutive growth. Year on year growth in revenues has averaged 22% between 1997 and 2005 and it’s total annual revenue reached R1,63 billion in 2005 (Nu-Wold, 2005). Presently, the company manufactures or assembles about 10 different products in-house including hot plates, irons, ovens, grills, and gas burners. In addition to its South African operations, Nu-World has two overseas subsidiaries, Prima Australasia in Australia and Nu-World UK. In total, the company employs 1 000 people world wide of which 800 are located in South Africa and about 500 in their manufacturing facility in Johannesburg. Like Nu-World, AMAP is a medium-sized company with total sales of R1,8 billion in 2005. It also sees itself as a brand management company, rather than a manufacturer, and the company ‘owns’ 13 major brands in South Africa2. Total revenue has grown rapidly between 1997 and 2004 at an annual average rate of 39%. Sales arise from three main divisions: small domestic appliances, consumer electronics, and a manufacturing division. The latter operates two modern factories, one producing kettles, frying pans, tabletop cookers, heaters and floor care products in Pinetown, Kwazulu Natal, and the other assembling television sets in Atlantis, Western Cape. Nu World and AMAP’s manufacturing plants source inputs from a range of local and overseas suppliers. Plastics, steel, and aluminium are largely sourced domestically, while specialist component parts are imported. While one company reports no significant problems in sourcing raw materials, the other identifies the high cost of South African metals and plastics as its main competitive disadvantage relative to Chinese producers. Material costs can reach between 60 and 70 percent of production costs, with steel the most important input. While manufacturers of white goods enjoy a steel rebate from ISCOR, this does not apply to manufacturers of smaller appliances. Procuring components from offshore presents a different set of problems. Many switches, elements, valves and pipes which are not available domestically continue to attract significant import duties. Both companies have made representations to ITAC to obtain duty rebates on key inputs. Nu World recently succeeded in its application for a rebate on imports of valves for the manufacture of gas heaters – but this process took almost a year to complete and the rebate does not apply retroactively. The recent strength of the Rand has had a mixed impact on the business of these companies. Manufacturing of small appliances has been hurt as the cost of Chinese imports continues to fall. Even the overseas subsidiaries of these companies have reduced their purchases from South Africa. On the other hand, consumers have responded positively to the reduced cost of imported and domestically manufactured appliances and the sales and profitability of both companies have risen dramatically.
1 Nu World Brands include JVC, Telefunken, Morphy Richards, Sunbeam, Conti, Nu-tec and Ideal. 2 Amap brands include Salton, Pineware, Hoover, Remington, Tedelex, Russel Hobbs and Brother.

Trade and Poverty Project, Southern Africa Labour and Development Research Unit
Trade and poverty case study: Small household appliances 4
The management of these companies recognise their inability to compete head-to-head with imports across all product lines and they have responded positively to opportunities arising from increased trade with China. They have reduced the portfolio of products manufactured domestically to focus on those where they remain competitive; and have invested in technological innovations to retain their competitiveness in these products. This includes using local design skills and marketing skills to develop products to be manufactured in China for the domestic market. Surprisingly, labour costs are not a significant constraint to competitiveness in the manufacture of small appliances. According to one producer, labour costs contribute just 3-5% of total production costs. The majority of Nu World’s 500 workers are employed on an hourly and seasonal basis: the company produces specific products at specific times of the year and brings in sufficient staff to respond to domestic demand. AMAP has used the threat of competition to force a fundamental restructuring of its manufacturing processes and has reduced its permanent factory staff by 60% (a total loss of about 100 workers). The company now employs much more people in its three services divisions (between 150 and 200 people) than it does in its Pinetown facility (just 60 workers). Employment in sales and servicing within AMAP and throughout the distribution chain is likely to grow as sales rise.
3. Tariffs and protection Nominal protection South Africa implemented a wave of trade reforms in the mid-1990’s that saw tariffs on most traded goods reduced sharply between 1994 and 2004 (Edwards 2005). These general trends mask high levels of protection on specific products and domestic manufacturers of small household appliances have been among the greatest ‘beneficiaries’ of recent trade policy. Figure 2 shows the change to the SACU external tariff on specific household appliances over this period. Tariffs on vacuum cleaners and irons have remained unchanged, at 20%, since at least 1988, while those on cooking equipment, toasters and kettles have been reduced from 30% to 20%.
Figure 2: MFN tariffs on small household appliances
0
5
10
15
20
25
30
35
Vacuumcleaners
Irons Microw aveovens
Cooking,grilling &roasting
equipment
Kettles Toasters
per c
ent
1988
1994
1997
2000
2004
Source: Edwards (2005)

Trade and Poverty Project, Southern Africa Labour and Development Research Unit
Trade and poverty case study: Small household appliances 5
Effective protection Tariffs on outputs do not show the full impact of trade protection on local producers because they do not show how tariffs on imports effect the cost of inputs used in the production process. The effective rate of protection is a standard indicator of protection used in international trade policy analysis that accounts for tariffs on outputs as well as those on inputs. It provides an estimate of the percentage increase (or decrease) in domestic value added in the presence of prevailing import duties and incentives relative to what it would be under free trade and in the absence of incentives (Flatters, 2004).
Effective rates of protection can be derived from the following basic formula:
ERP = (VAd – VAw)/ VAw x 100
where VAd is the value added in the activity at protection-inclusive domestic prices (after accounting for the effect of tariffs on inputs and sales)
and
VAw is the value added in the activity at undistorted world prices (no tariffs on inputs or sales).
Tables 1 and 2 show effective rates of protection (ERPs) given to consumer appliances produced for both the domestic market and for export between 1988 and 2004. The actual effective rate of protection depends on the share of base metals, plastics and component inputs in total production costs and the tariffs on these inputs. ERPs are shown for three different combinations of these inputs, using trade-weighted aggregate tariffs for each of these product groups. The overall story is consistent. For vacuum cleaners and irons, the fall in output tariffs has been accompanied by an even faster fall in the tariffs on key inputs. This has contributed to a steady increase in the effective level of protection received in domestic and export markets. Ovens, kettles and toasters have seen some reduction in the ERP over the last decade. But by 2004, the value-added in domestic manufacturing was still more than 70% higher than that which would be possible under zero tariffs.
Table 1. Effective Protection for vacuum cleaners and irons (%)
Inputs Domestic sales Export sales Component Share 1988 1994 2000 2004 1988 1994 2000 2004 Metals Plastic Electrical
50% 10% 20% 39 46 68 73 -61 -54 -32 -27
Metals Plastic Electrical
30% 20% 30% 39 44 69 72 -61 -56 -31 -28
Metals Plastic Electrical
20% 10% 50% 44 48 73 76 -56 -52 -27 -24
Table 2. Effective Protection for ovens, kettles and toasters (%)
Inputs Domestic sales Export sales Component Share 1988 1994 2000 2004 1988 1994 2000 2004 Metals Plastic Electrical
50% 10% 20% 89 96 68 73 -61 -54 -32 -27
Metals Plastic Electrical
30% 20% 30% 89 94 69 72 -61 -56 -31 -28
Metals Plastic Electrical
20% 10% 50% 94 98 73 76 -56 -52 -27 -24

Trade and Poverty Project, Southern Africa Labour and Development Research Unit
Trade and poverty case study: Small household appliances 6
Products manufactured for export sales attract duties on inputs (or pay import parity prices on locally sourced inputs) but do not receive the benefit of output protection. The resulting negative ERPs are a significant disincentive to export. These negative rates of protection can be reduced through rebates on imported inputs. But this raises the administrative burden of exporting and still cannot compensate producers for the much higher rate of protection received in the domestic market. Preferential trade agreements The MFN tariff and any analysis based on it do not show the marginal impact of preferential trade agreements on tariffs in this sector. And the industry has raised concerns (in the interviews) that the conclusion of preferential free trade agreements with the European Union and others will impact adversely on domestic manufacturing. The SA-EU Trade, Development and Cooperation agreement allows for the elimination of duties on almost all products, including consumer appliances, over a twelve-year period. Tariffs on the main categories of small household appliances will fall by about 2.5% a year to 0% by 2012. This will certainly be of benefit to EU exporters, but gives South African producers significant time to adjust and respond. More importantly, future competition for South African manufacturing in this sector is more likely to come from Asia than Europe. South Africa has also concluded a Free Trade Agreement (FTA) with SADC. Tariffs under the SADC FTA were reduced to zero over a three-year period upon implementation in 2000. It is unlikely that a manufacturer will establish a presence in a SADC country to export into South Africa; and if they do, they will probably be unable to take advantage of this preference anyway. To qualify for the zero duty, SADC rules of origin require that the value of imported materials used in the manufacture of electrical goods does not exceed 40% of the ex-works price. In other words, at least 60% of the factory price must be explained by regional materials, labour and profit. According to South African producers, labour costs constitute a small percentage of value-added and most components are imported. Within SADC, the necessary metal and plastic inputs are probably only manufactured in South Africa. There would therefore be little benefit, arising from the SADC FTA, in locating a manufacturing facility in another SADC country. It is therefore unsurprising that by 2004, there were insignificant imports from SADC countries in 5 the 6 products considered above3.
4. The impact of trade on enterprises The above analysis shows that there has been little liberalisation in the consumer appliance sector over the past few decades and that tariffs remain generally high. Tariff liberalisation cannot be considered accountable for changes in this sector. Globalisation, on the other hand, has contributed to significant increases in trade and productivity worldwide. And these global phenomena have had an effect on employment, exports, imports, output and the profitability of South African enterprises.
Trade in consumer appliances Different companies import and export different combinations of large and small consumer appliances and it is difficult to isolate the performance of either sub-sector from the available trade data (even at the HS-8 digit level it is sometimes impossible to differentiate between white goods and small consumer appliances). The approach here is to look first at the performance of the entire industry (white goods and small appliances products combined) and to then focus on six specific products that are likely to explain a large proportion of South African trade in small household appliances.
Figure 3 shows total exports and imports of the 30 consumer appliance products for which data is available at the HS-8 digit level. Imports have grown rapidly over the last few years, doubling in dollar
3 The only exception is cooking, grilling and roasting equipment. SADC imports rose as a share of world imports upon implementation of the SADC FTA, reaching a quarter of South Africa’s total imports of this product group in 2003. Over the last 5 years South Africa has imported around $6.5 million of cooking equipment from within SADC, of which 95% comes from Zimbabwe. In 2003, Zimbabwe was the largest single exporter of such products to South Africa. The authors were unable to establish whether these exports reflect legitimate trade; or whether imports are being diverted through Zimbabwe to take advantage of SADC preferences.
Trade and Poverty Project, Southern Africa Labour and Development Research Unit
Trade and poverty case study: Small household appliances 7
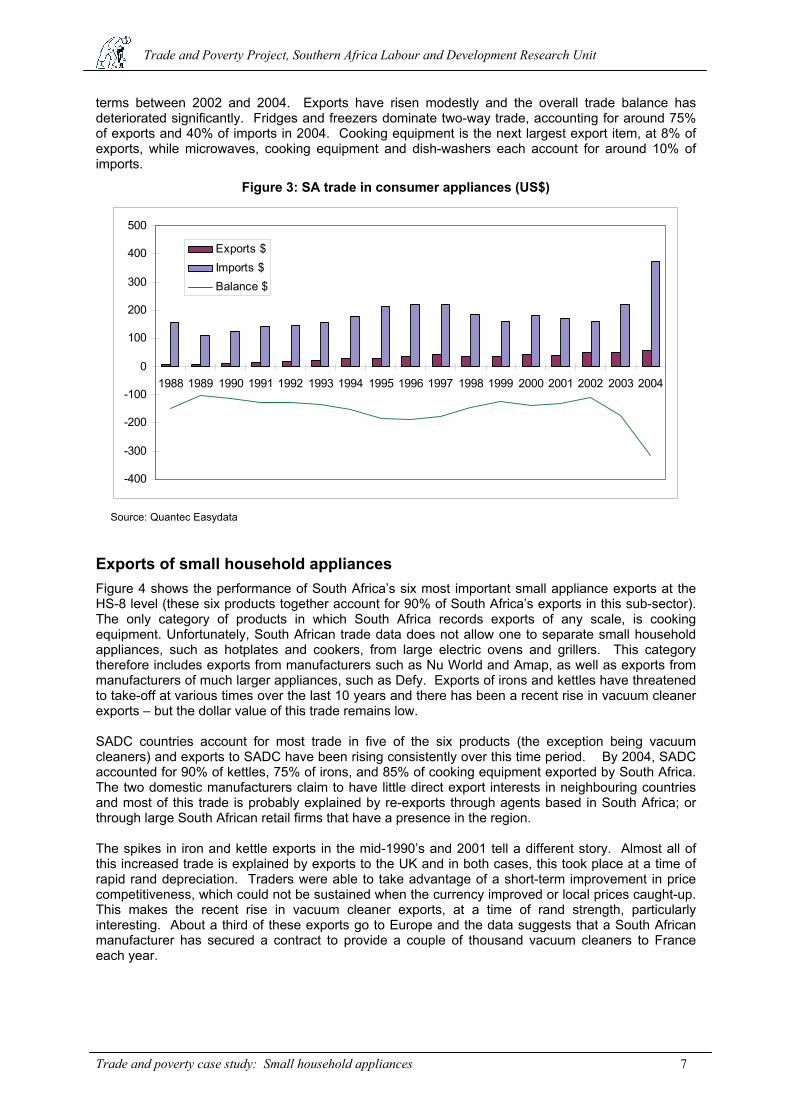
terms between 2002 and 2004. Exports have risen modestly and the overall trade balance has deteriorated significantly. Fridges and freezers dominate two-way trade, accounting for around 75% of exports and 40% of imports in 2004. Cooking equipment is the next largest export item, at 8% of exports, while microwaves, cooking equipment and dish-washers each account for around 10% of imports.
Figure 3: SA trade in consumer appliances (US$)
-400
-300
-200
-100
0
100
200
300
400
500
1988 1989 1990 1991 1992 1993 1994 1995 1996 1997 1998 1999 2000 2001 2002 2003 2004
Exports $Imports $Balance $
Source: Quantec Easydata
Exports of small household appliances Figure 4 shows the performance of South Africa’s six most important small appliance exports at the HS-8 level (these six products together account for 90% of South Africa’s exports in this sub-sector). The only category of products in which South Africa records exports of any scale, is cooking equipment. Unfortunately, South African trade data does not allow one to separate small household appliances, such as hotplates and cookers, from large electric ovens and grillers. This category therefore includes exports from manufacturers such as Nu World and Amap, as well as exports from manufacturers of much larger appliances, such as Defy. Exports of irons and kettles have threatened to take-off at various times over the last 10 years and there has been a recent rise in vacuum cleaner exports – but the dollar value of this trade remains low. SADC countries account for most trade in five of the six products (the exception being vacuum cleaners) and exports to SADC have been rising consistently over this time period. By 2004, SADC accounted for 90% of kettles, 75% of irons, and 85% of cooking equipment exported by South Africa. The two domestic manufacturers claim to have little direct export interests in neighbouring countries and most of this trade is probably explained by re-exports through agents based in South Africa; or through large South African retail firms that have a presence in the region. The spikes in iron and kettle exports in the mid-1990’s and 2001 tell a different story. Almost all of this increased trade is explained by exports to the UK and in both cases, this took place at a time of rapid rand depreciation. Traders were able to take advantage of a short-term improvement in price competitiveness, which could not be sustained when the currency improved or local prices caught-up. This makes the recent rise in vacuum cleaner exports, at a time of rand strength, particularly interesting. About a third of these exports go to Europe and the data suggests that a South African manufacturer has secured a contract to provide a couple of thousand vacuum cleaners to France each year.

Trade and Poverty Project, Southern Africa Labour and Development Research Unit
Trade and poverty case study: Small household appliances 8
Figure 4: SA exports of small household appliances (US$)
0
500
1000
1500
2000
2500
3000
3500
4000
4500
5000
1988
1989
1990
1991
1992
1993
1994
1995
1996
1997
1998
1999
2000
2001
2002
2003
2004
$ 00
0Vacuum cleaners IronsMicrow ave ovens Cooking equipmentKettles Toasters
Source: Quantec Easydata
The explanation for South Africa’s substantial exports of cooking equipment is a little more complex. As indicated above, most exports go to SADC countries. But SADC’s share of SA exports of this product has fallen from an average of 90% between 1988 and 1996, to 80% between 1996 and 2004. This shift is explained by a surge in exports to Germany, and to a lesser extent the UK and Australasia, between 2000 and 2002. Again, rand weakness over this period probably led to a handful of export contracts, which have since been rescinded. Exports to Germany, for example, peaked at R7 million in 2002 and then fell to below R20 000 in 2004.
Imports of small household appliances Figure 5 shows South Africa’s imports of the same six products. Imports were remarkably stable over the 1990s but have risen sharply over the last two years. This is most likely a reflection of buoyant consumption expenditure, lower world prices, and the strong domestic currency. A large proportion of this trade is accounted for by AMAP and Nu-World. There has also been a significant shift in the origin of South African imports. Historically, imports from the EU were of particular importance, though overall imports were relatively low until 1996. As domestic production shrunk and imports increased, European suppliers were unable to retain their share of trade in this sector. This is largely because they, like domestic producers, have been displaced by the rapid rise in imports from lower-cost and largely Chinese producers. And the rise in imports from China has been phenomenal. See Figure 6 below. By 2004, China was the leading exporting country to South Africa in all but one of these six products, microwave ovens. South Korea retains a small edge over China in this product category, though recent trends suggest that Chinese exports of microwaves will exceed those from South Korea in 2005.

Trade and Poverty Project, Southern Africa Labour and Development Research Unit
Trade and poverty case study: Small household appliances 9
Figure 5: SA imports of small household appliances (US$)
0
10000
20000
30000
40000
50000
60000
1988
1989
1990
1991
1992
1993
1994
1995
1996
1997
1998
1999
2000
2001
2002
2003
2004
$ 00
0Vacuum cleaners IronsMicrow ave ovens Cooking equipmentKettles Toasters
Source: Quantec Easydata
Figure 6: SA imports from the China (share of total imports)
0%
10%
20%
30%
40%
50%
60%
70%
80%
90%
1988
1989
1990
1991
1992
1993
1994
1995
1996
1997
1998
1999
2000
2001
2002
2003
2004
Vacuum cleaners
Irons
Microw ave ovens
Cooking equipment
Kettles
Toasters
Source: Quantec Easydata
Net trade in small household appliances In general, South Africa’s trade balance in each of the six products is the inverse of the import picture i.e. the country exports very little compared to what it imports. It is perhaps more informative to view the trade balance (exports - imports) as a percentage of South Africa’s total trade (exports + imports) in each product. See Figure 7 below. The resulting measure provides an indication of South Africa’s

Trade and Poverty Project, Southern Africa Labour and Development Research Unit
Trade and poverty case study: Small household appliances 10
‘revealed comparative advantage (RCA)4’ in each product. An RCA close to 1 indicates a strong comparative advantage; an RCA close to -1 indicates a strong comparative disadvantage. Although the RCA is negative for all products throughout this period, there have been times when exports of specific products have approached import levels (and RCA of 0). This was true of kettles in 1995 and 2000, and vacuum cleaners in 2001 (both periods of rand weakness). South Africa’s RCA in all six products has deteriorated significantly over the last few years in line with the strong rand.
Figure 7: Revealed comparative advantage (RCA)
-1.2
-1
-0.8
-0.6
-0.4
-0.2
019
8819
8919
9019
9119
9219
9319
9419
9519
9619
9719
9819
9920
0020
0120
0220
0320
04
RC
A
Vacuum cleaners Irons Microw ave ovens
Cooking equipment Kettles Toasters
5. The impact of trade on households Consumers would expect to benefit most from the rising share of imports in this sector. International trade and competition should contribute to a greater variety and quality of goods and lower prices. Interviews with the dominant manufacturers and suppliers in South Africa suggest that this has taken place, and this is confirmed by the price analysis below. But for the purposes of this study, it is important to assess whether poor households have participated in these gains or whether the benefits of better and cheaper goods accrue mostly to the rich. This too is evaluated in this section.
Tariffs and prices During the first half of the 1990’s, the aggregate price of consumer appliances tracked the consumer price commodities index5. See figure 8 below. But since 1994, the aggregate price of consumer appliances began to fall in real terms (increased at a slower rate than aggregate CPI) and since January 2003, nominal prices have fallen. These shifts correspond with changes in the pattern of trade. Prior to 1994, around 80% of consumer appliances were produced domestically. This
4 Most indicators of revealed comparative advantage are derived from Balassa (1965). The advantage of this particular derivation is that it can be used to show “own” country trade performance within a particular commodity (Utkulu and Seymen 2004). . 5 This index excludes non-tradables and is therefore a better comparison for changes in the retail price of manufactured goods, such as appliances. That said, there is very little difference between the trend in this sub-component of the CPI index and the overall trend in consumer prices.

Trade and Poverty Project, Southern Africa Labour and Development Research Unit
Trade and poverty case study: Small household appliances 11
changed in the mid-1990’s as South Africa opened to the world economy and imports, particularly from Asia, began to increase. Moreover, lower world prices in this sector and the recent strength of the rand have undoubtedly contributed to a wider selection of more affordable appliances within the South African market and improved productivity at home.
Figure 8: Consumer price index (2000 = 100)
0
20
40
60
80
100
120
140
Jan-
90
Jan-
91
Jan-
92
Jan-
93
Jan-
94
Jan-
95
Jan-
96
Jan-
97
Jan-
98
Jan-
99
Jan-
00
Jan-
01
Jan-
02
Jan-
03
Jan-
04
Jan-
05
Hhold appliancesAll commodities
Source: StatsSA
The sharp rise in prices in 2002 and subsequent decline is almost entirely a currency story. Prices have fallen by 5% over the last 2 years; and the rand has strengthened against the dollar by 5.5% over this period. This suggests an almost uniform pass-through effect. Changes in the border prices of consumer appliances are fully reflected within the domestic market. Any reduction in tariffs would have a similar impact. If this is correct, then the elimination of the tariff on irons, kettles, toasters, vacuum cleaners and irons would contribute a near 20% reduction in the border price of these appliances in South Africa (the actual reduction would depend on the relative contribution of transport, insurance and freight charges to the retail price of appliances; and the extent to which retailers would be willing to pass on the benefits of lower tariffs to consumers). One way to measure the financial cost of tariffs to consumers is to consider the total amount of duties paid on imports of appliances as well as the additional cost paid on domestically produced goods because of tariff protection. The value of duties paid can be estimated by applying the relevant tariff to actual imports of each of these products. To estimate the impact of protection on purchases of domestically produced products, it is assumed that manufacturers mark-up the prices to the duty-inclusive price for all products sold in South Africa6. The additional cost (domestic rent) to consumers is then equal to the import tariff multiplied by the value of domestically produced goods sold in South Africa. Figure 9 provides a conservative estimate of the cost of protection on imported and domestically produced small household appliances7. For the purposes of this calculation, import and tariff data is available but disaggregated information on domestic production of the six main categories of small
6 South Africa is a net importer of consumer appliances. There is no reason for domestic producers to charge below the cost of imported appliances, on which duties are charged, and the only options available to consumers are to pay the duty-inclusive price on local goods or purchase imports and pay the duty anyway. 7 The analysis done here presents a lower estimate of the actual cost to consumers. In addition to the duty on imports, consumers would pay higher VAT and higher mark-ups on the tariff inclusive price of imported goods. Similarly, the value of domestic production is calculated as a share of the free on board (FOB) import value and also excludes these additional costs.

Trade and Poverty Project, Southern Africa Labour and Development Research Unit
Trade and poverty case study: Small household appliances 12
consumer appliances is not. Discussions with industry indicate that in 1990, imports accounted for about 20% of aggregate consumption, and by 2004 this figure had fallen to 80%. It is assumed here that domestic production fell at a fixed rate from 80% of total consumption to 20% over this period. The results show that the average cost of protection, to consumers, was more than R100 million per year over this period. Since 1998, about R1 billion in duties has been paid on imports of these six products alone (this is consistent with actual SARS data, which shows that R163 million in duties was paid on these six items in 2005). More than 40% of these duties are accounted for by microwave ovens which are no longer manufactured in South Africa.
Figure 9: The cost of protection
0
20
40
60
80
100
120
140
160
180
200
1990 1991 1992 1993 1994 1995 1996 1997 1998 1999 2000 2001 2002 2003 2004
R m
illion
s
Import duties
Domestic rent
Source: own calculations
Thus tariffs represent a sizeable tax on consumers and the price of household appliances could fall considerably with further tariff liberalisation. This would, almost certainly, lead to further job losses in the manufacturing side of this sector and low-skilled workers would suffer most. At present, around 560 people are employed in the manufacture of small household appliances. Given the estimated cost of protection at R160 million in 2004, the cost per worker is around R285 000 a year. This seems a relatively high price to pay to maintain 60 full-time and 500 part-time jobs. Who pays this tax?
Consumption The 2000 Income and Expenditure Survey provides detailed information on average expenditure on consumer appliances by household. Refrigerators dominate domestic consumption, accounting for 36% of total expenditure in this sector (but just 0.3% of total household expenditure). Stoves and ovens follow at 18%; with electrical washing machines and tumble dryers at 14%. Most small household appliances account for between 2% and 4% of household expenditure on consumer appliances. The pattern differs somewhat amongst the poorest decile of households. Refrigerators remain the largest single expenditure item, followed by paraffin stoves and heaters, while a number of small electrical appliances (kettles, irons and hotplates) each account for about 10% of expenditure in this sector. But total spending by the poorest households on consumer appliances averaged just R11 in 2000). So at best, the data tells us that a very small proportion of poor households purchased
Trade and Poverty Project, Southern Africa Labour and Development Research Unit
Trade and poverty case study: Small household appliances 13
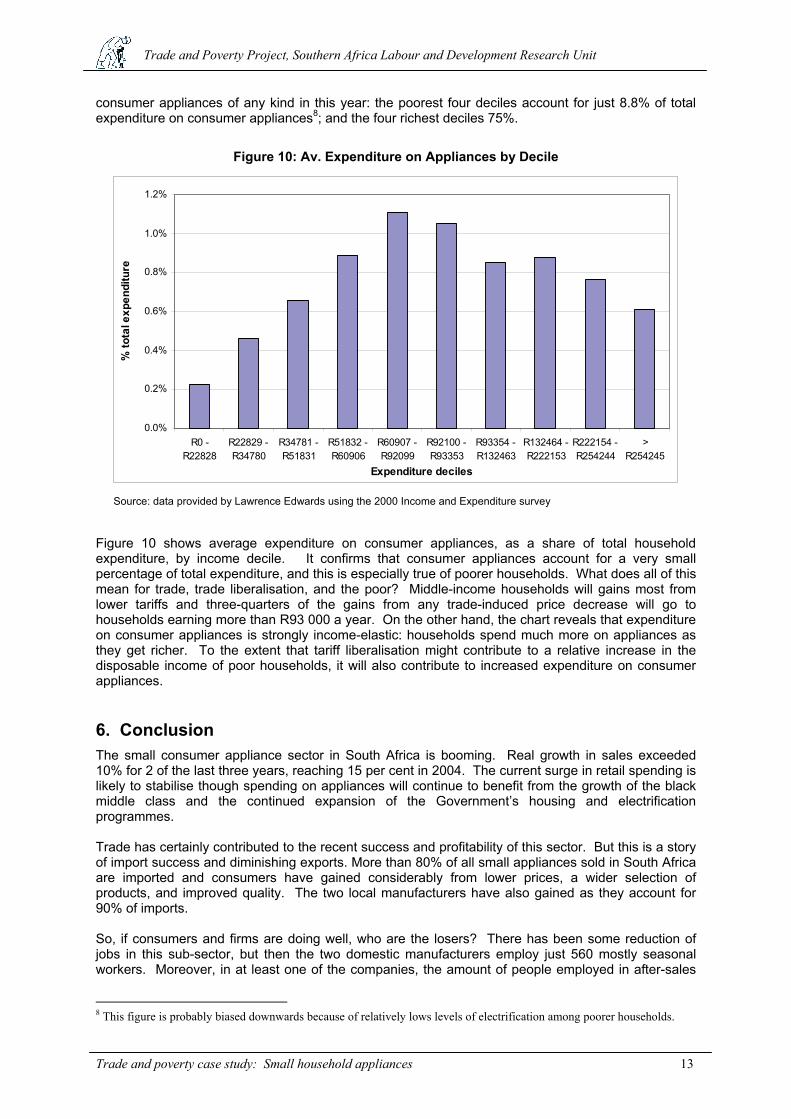
consumer appliances of any kind in this year: the poorest four deciles account for just 8.8% of total expenditure on consumer appliances8; and the four richest deciles 75%.
Figure 10: Av. Expenditure on Appliances by Decile
0.0%
0.2%
0.4%
0.6%
0.8%
1.0%
1.2%
R0 -R22828
R22829 -R34780
R34781 -R51831
R51832 -R60906
R60907 -R92099
R92100 -R93353
R93354 -R132463
R132464 -R222153
R222154 -R254244
>R254245
Expenditure deciles
% to
tal e
xpen
ditu
re
Source: data provided by Lawrence Edwards using the 2000 Income and Expenditure survey
Figure 10 shows average expenditure on consumer appliances, as a share of total household expenditure, by income decile. It confirms that consumer appliances account for a very small percentage of total expenditure, and this is especially true of poorer households. What does all of this mean for trade, trade liberalisation, and the poor? Middle-income households will gains most from lower tariffs and three-quarters of the gains from any trade-induced price decrease will go to households earning more than R93 000 a year. On the other hand, the chart reveals that expenditure on consumer appliances is strongly income-elastic: households spend much more on appliances as they get richer. To the extent that tariff liberalisation might contribute to a relative increase in the disposable income of poor households, it will also contribute to increased expenditure on consumer appliances.
6. Conclusion The small consumer appliance sector in South Africa is booming. Real growth in sales exceeded 10% for 2 of the last three years, reaching 15 per cent in 2004. The current surge in retail spending is likely to stabilise though spending on appliances will continue to benefit from the growth of the black middle class and the continued expansion of the Government’s housing and electrification programmes. Trade has certainly contributed to the recent success and profitability of this sector. But this is a story of import success and diminishing exports. More than 80% of all small appliances sold in South Africa are imported and consumers have gained considerably from lower prices, a wider selection of products, and improved quality. The two local manufacturers have also gained as they account for 90% of imports. So, if consumers and firms are doing well, who are the losers? There has been some reduction of jobs in this sub-sector, but then the two domestic manufacturers employ just 560 mostly seasonal workers. Moreover, in at least one of the companies, the amount of people employed in after-sales
8 This figure is probably biased downwards because of relatively lows levels of electrification among poorer households.

Trade and Poverty Project, Southern Africa Labour and Development Research Unit
Trade and poverty case study: Small household appliances 14
servicing exceeds those in manufacturing by a factor of three. Jobs in the downstream industry would only grow with further liberalisation. The real loss is one of economic waste. Domestic producers are supported by very high levels of effective protection and do not export. The full cost of this protection is borne by consumers of mostly imported appliances. The fact that most consumers of appliances in South Africa are relatively wealthy makes it difficult to make a definitive statement on the net poverty impact of further reforms. Existing workers will lose most and middle-income consumers will reap the largest share of the benefit. On the other hand, there is no reason to believe that all jobs will be lost and good reason to believe that sales will rise and new and better paid employment will be created in downstream distribution and servicing. What, then, are the policy implications of this analysis? Firstly, the South African tariff book is littered with unnecessary tariffs that should be reduced or removed. In this sector, Government continues to provide protection on key inputs (such as heating elements and gas valves) and final products (such as microwaves), none of which are manufactured in South Africa. Similar problems are likely to be found in other sectors. Secondly, the high cost of import parity pricing is a substantial constraint to users of plastics and base metals in this and many other sectors and deserves priority attention by the competition authorities. Manufacturers of small consumer appliances cite this as their greatest competitive disadvantage relative to China. Finally, there would seem to be sufficient evidence for substantial tariff liberalisation in this sector. Manufacturers of small, household appliances have been largely exempt from trade reform and this has almost certainly contributed to higher prices and lower levels of exports than would have otherwise been the case (the incentive to produce for the domestic market is just too high). If South African producers are internationally competitive, they will survive under lower or zero tariffs; and this will certainly be made easier if progress is made on lowering the import cost of inputs. References AMAP. 2000. Annual Report. Available from www.amap.co.za
AMAP. 2005. Annual Report. Available from www.amap.co.za
Bezuidenhout, A. 2002. Changing Colours: Trade Liberalisation, Production Regimes and the White Goods Manufacturing Industry in Southern Africa. RAU Sociology Seminar Series No. 2002/9.
Edwards. 2005. Has South Africa Liberalised its Trade? South African Journal of Economics, 73, 4: 754 – 776.
Flatters. 2004. Measuring the Impacts of Trade Policies: Effective Rates of Protection. Unpublished.
McCulloch, N., Winters, A. and Cirera, X. 2001. Trade Liberalization and Poverty. A Handbook. DFID and Centre for Economic Policy Research. London.
Nu-World. 2005. Annual Report. Available from www.nuworld.co.za
Utkulu, U and D. Seyman,. 2004. Revealed Comparative Advantage and Competitiveness: Evidence for Turkey vis-à-vis the EU/15. Paper presented to the European Trade Study Group 6th Annual Conference. Available from: www.etsg.org/ETSG2004/Papers/seymen.pdf
~~~~~~~~~~

The Southern Africa Labour and Development Research Unit
The Southern Africa Labour and Development Research Unit (SALDRU) was established in 1975 as part of the School of Economics. SALDRU conducted the first national household survey in 1993 (the Project for Statistics on Living Standards and Development). More recently, SALDRU ran the Langeberg Integrated Family survey (1999) and the Khayelitsha/Mitchell’s Plain Survey (2000). Current projects include research on public works programmes, poverty and inequality.
The Trade and Poverty Project
South Africa is currently engaged in various trade negotiations at the multilateral, regional and bilateral level. The net impact of the resulting trade reforms should be to contribute to growth, employment and raising average incomes. But this net impact conceals a range of differential effects: the benefits of reform do not accrue automatically and equally to all households or communities, and in some cases poverty and unemployment may rise. Policy makers need to be aware of these different effects and implement trade reforms in a way that maximizes the benefits for the poor. The objective of the South Africa Trade and Poverty Research Project is to analyse the impact of specific trade reforms on poverty in South Africa. The project includes a number studies that explores various linkages through which trade reform affects prices, consumption, production, and employment. These studies fall under 5 broad sections:
1. Review of trade and poverty in South Africa 2. Industry level analysis of trade, enterprise production and employment 3. Household level analysis of trade and poverty 4. Sector specific analysis and case studies 5. Policy simulations
The project is funded by the Department for International Development (through the Trade and Industrial Policy Strategies and the RTFP), USAID and the Department of Trade and Industry. All papers can be accessed via the project home page:
http://www.saldru.uct.ac.za/saldru_trade&poverty.html.