trade policies, household welfare and poverty alleviation...
TRANSCRIPT

300
Trade policies, household welfare and poverty alleviation
Viet Nam

301
Vie
t N
am
Household welfare and pricing of rice: Does the Large-Scale Field Model matter for Viet Nam?
Abstract
Since 2006, Viet Nam’s rice exports have soared, and in 2011 the coun-try surpassed Thailand to become the world’s largest rice exporter. Even though one would expect higher rice exports to directly benefit rural households at all levels of well-being, most rice producers in Viet Nam are still poor, living on less than USD 2 per day. The government’s ef-forts to ensure a minimum rate of return for farmers by imposing price floors (minimum prices) have not been successful, as there is no enforce-ment mechanism in place. This study examines the potential impact on household welfare in Viet Nam of value chain upgrading in rice produc-tion through the Large-Scale Field Model. The possible effects of the adop-tion of such a model are: (a) an increase in the farm gate price of rice, (b) an increase in the productivity of rice farmers, and (c) a reduction in farmers’ production costs. The study shows how these changes would affect house-hold welfare, taking into account the ripple effect that a change in the farm gate price of rice would have on other prices in the economy, and hence on household consumption, production, and wage income. The policy simula-tions in this study assume that farmers do not pass on any cost reductions and productivity improvements to the price of paddy. The results suggest that the implementation of the Large-Scale Field Model in the Mekong River Delta would increase the welfare of households by 4.1 per cent in the short term and 4.9 per cent in the longer term, and reduce poverty rates by approximately 0.55 per cent among the 10 per cent poorest households and by 0.42 per cent among the 20 per cent poorest households in that region.
* The authors would like to thank Dang Kim Son and Tran Cong Thang from the Institute of Policy and Strategy for Agriculture and Rural Development, and Bui Trinh from the General Statistics Office of Viet Nam, for their support in the preparation of this study.
Ngoc Quang Pham and Anh Hai La *

302
Trade policies, household welfare and poverty alleviation
1 Introduction
Doi Moi, a Vietnamese term meaning “renovation”, marked the beginning of Viet Nam’s transition from a centrally planned to a more market-driv-en economy. Initiated by the Communist Party Congress in 1986, Doi Moi became a major phenomenon in Viet Nam during 1986–1990. Its main aim was to promote a multi-sectoral economic system encompassing both state-owned and private enterprises. In the framework of the Doi Moi pol-icy, state-owned enterprises were reformed, private sector enterprises and companies with foreign investment emerged de novo, and the domes-tic market was liberalized to allow for free market prices. In agriculture, Politburo Resolution No. 10 made it possible to conclude “end-product contracts” with households; and land use rights were granted for 15 years in 1988, a period further extended to 20 years in 1993 (Pham et al., 2007).
One of the most striking features of Viet Nam’s transition was a high growth rate of the gross domestic product (GDP), coupled with a remarka-ble increase in exports. Before the Doi Moi, Viet Nam had to import food for domestic consumption. After the agricultural reforms in 1988, agricultur-al output rose tremendously and in 1989, Viet Nam became a rice export-er (Pham et al., 2007). The value of the country’s rice exports has soared particularly since 2006 (Figure 1). In 2011, Viet Nam surpassed Thailand to become the world’s largest rice exporter, with more than 7 million met-ric tons of rice exported, of which 95 per cent was contributed by farmers – net rice producers – in the Mekong River Delta (Jaffee, 2012a).
Figure 1 Viet Nam’s rice exports, 1989–2011
8
7
6
5
4
3
2
1
0
4,000
3,500
3,000
2,500
2,000
1,500
1,000
500
0
Mill
ions
of
met
ric
tons
Nom
inal
tho
usan
ds o
f U
SD
1989
1990
1991
1992
1993
1994
1995
1996
1997
1998
1999
2000
2001
2002
2003
2004
2005
2006
2007
2008
2009
2010
2011
■ Volume (LHS) ― Value (RHS)
Source: Authors’ calculations, based on data from the Vietnam Food Association (VFA, 2006) and General Statistics Office (GSO) of Viet Nam.Note: LHS stands for left-hand scale, RHS for right-hand scale.

303
Vie
t N
am
Household welfare and pricing of rice: Does the Large-Scale Field Model matter for Viet Nam?
Although higher rice exports could be expected to directly benefit rural households at all levels of well-being, most rice producers in Viet Nam remain poor, living on less than USD 2 per capita per day (Coxhead et al., 2012).
Viet Nam’s current rice value chain, shown in Figure 2, explains the main reason for the low incomes of Vietnamese farmers. Owing to the many in-termediaries in the chain, the benefits of the remarkable increase in rice export volumes and prices have not accrued to the households that ac-tually grow the rice. As a matter of fact, 95.8 per cent of total paddy rice produced by those households is sold to collectors and (subsequently) to millers, and only 4.2 per cent is sold directly to exporters.
Figure 2 Viet Nam’s rice value chain, 2010
Source: Vo and Nguyen (2011).
Inputs:Capital stockLabourIrrigationSeedFertilizersPesticidesTechnical support
Farmers
Col
lect
ors
Mil
lers
Trad
ers/
Exp
orte
s
Dom
esti
c re
tail
ers
Poli
shin
g fa
ctor
ies
4.2%
Rice export: 70.3%
Rice domesticconsumption: 29.7%
2.7%
93.1%30.3%
47.8%
15%
21%
10.7% 3.5% 6.2%
1.3% 1.3% 1.3%
7.2% 7.2%
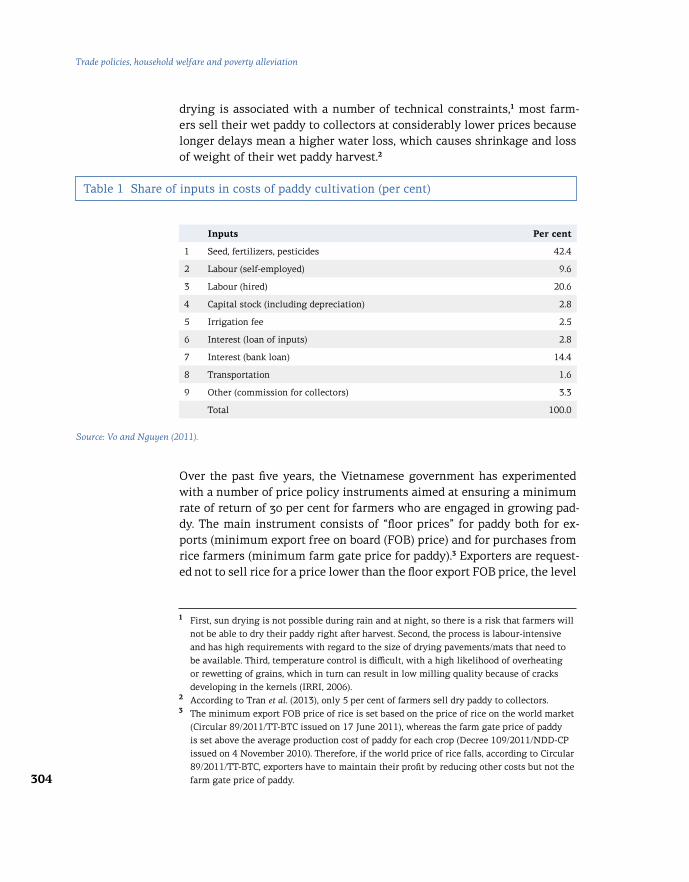
Collectors, who tend to participate more actively in the value chain (mill-ers or polishing factories act as service providers for collectors), earned 10 times more than farmers in 2011 (Tran et al., 2013). Having more market power than farmers, collectors usually set low prices, particularly if there is a good crop (a surplus of paddy rice supply). Additionally, as most farm-ers are poor, their biggest need for cash is in the period right after the har-vest. They therefore have to sell their output as quickly as possible and at any price (usually lower than the floor farm gate price, i.e. the minimum price set by the government) to settle their debts in time. Table 1 shows that interest payments on farmers’ loans alone account for more than 17 per cent of total costs related to rice cultivation. Another problem is the losses directly attributable to poor post-harvest technologies, which do not allow farmers to retain rice for later sale. Post-harvest losses occur as a result of the lack of storage facilities (most farmers use small storehous-es and have no storage systems), as well as inadequate paddy drying tech-nology. To save on costs, most farmers prefer sun drying. However, as sun
304
Trade policies, household welfare and poverty alleviation
drying is associated with a number of technical constraints,1 most farm-ers sell their wet paddy to collectors at considerably lower prices because longer delays mean a higher water loss, which causes shrinkage and loss of weight of their wet paddy harvest.2
Over the past five years, the Vietnamese government has experimented with a number of price policy instruments aimed at ensuring a minimum rate of return of 30 per cent for farmers who are engaged in growing pad-dy. The main instrument consists of “floor prices” for paddy both for ex-ports (minimum export free on board (FOB) price) and for purchases from rice farmers (minimum farm gate price for paddy).3 Exporters are request-ed not to sell rice for a price lower than the floor export FOB price, the level
Table 1 Share of inputs in costs of paddy cultivation (per cent)
Source: Vo and Nguyen (2011).
Inputs Per cent
1 Seed, fertilizers, pesticides 42.4
2 Labour (self-employed) 9.6
3 Labour (hired) 20.6
4 Capital stock (including depreciation) 2.8
5 Irrigation fee 2.5
6 Interest (loan of inputs) 2.8
7 Interest (bank loan) 14.4
8 Transportation 1.6
9 Other (commission for collectors) 3.3
Total 100.0
1 First, sun drying is not possible during rain and at night, so there is a risk that farmers will not be able to dry their paddy right after harvest. Second, the process is labour-intensive and has high requirements with regard to the size of drying pavements/mats that need to be available. Third, temperature control is difficult, with a high likelihood of overheating or rewetting of grains, which in turn can result in low milling quality because of cracks developing in the kernels (IRRI, 2006). 2 According to Tran et al. (2013), only 5 per cent of farmers sell dry paddy to collectors. 3 The minimum export FOB price of rice is set based on the price of rice on the world market (Circular 89/2011/TT-BTC issued on 17 June 2011), whereas the farm gate price of paddy is set above the average production cost of paddy for each crop (Decree 109/2011/NDD-CP issued on 4 November 2010). Therefore, if the world price of rice falls, according to Circular 89/2011/TT-BTC, exporters have to maintain their profit by reducing other costs but not the farm gate price of paddy.

305
Vie
t N
am
Household welfare and pricing of rice: Does the Large-Scale Field Model matter for Viet Nam?
of which is set on the assumption that exporters would buy paddy directly from farmers for the recommended floor farm gate price.4
As shown in Figure 2, exporters (or even domestic retailers) almost never buy paddy from farmers, but rather from millers and/or polishing facto-ries. What prevents farmers from selling directly to exporters and/or do-mestic retailers?
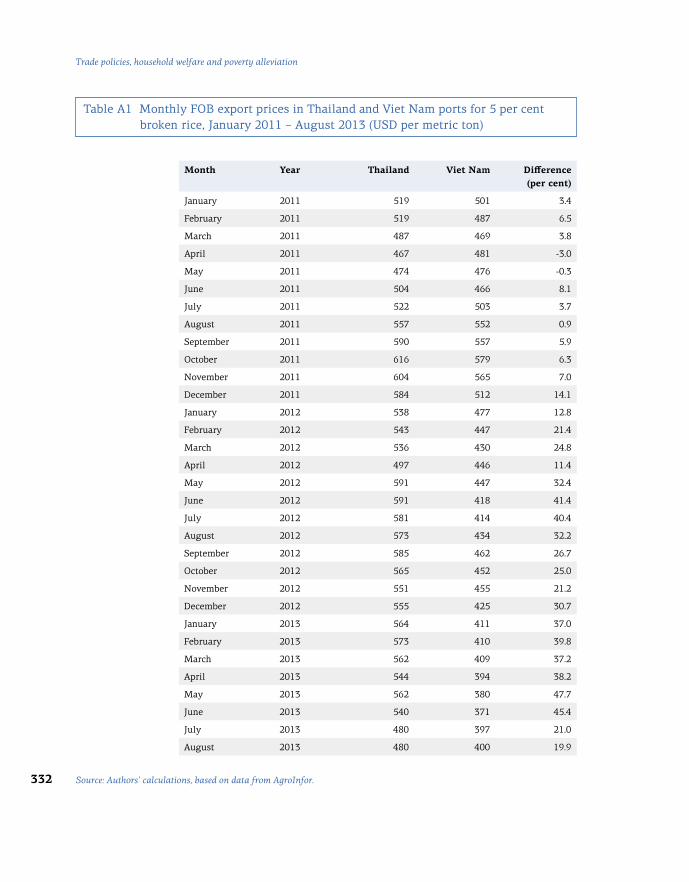
One of the main reasons is the imperfect competition among Vietnamese rice exporters. In Viet Nam, 50 per cent of rice is exported through gov-ernment-to-government (G2G) contracts. The Vietnam Food Association has the right to allocate 80 per cent of total volume of G2G contracts to its members, which are mostly state-owned enterprises (SOEs) (Tran et al., 2013).5 As SOEs have little incentive to improve performance (Boycko et al., 1996) and G2G contracts do not require high-quality rice, these pub-lic exporters have become less active in searching for new markets or im-proving the quality of exported rice. As a result, Viet Nam’s current export prices are typically the lowest when compared with those of Thailand (see Table A1 in the Annex), India and Pakistan. The apparent lack of capaci-ty of public exporters to bargain for a higher export price of Vietnamese rice puts pressure on them to lower the domestic price of rice to maximize their margin. Therefore, public exporters prefer to buy rice from collec-tors rather than directly from farmers, as this allows them to avoid paying the official floor farm gate price for paddy. The government currently lacks enforcement measures, so collectors, who are non-registered entities (i.e. operate in the informal sector), can evade the floor farm gate price enforce-ment.6 As a result, in the event of a good crop, prices of paddy paid to farm-ers fall and exporters benefit from these lower prices offered by collectors.
Other reasons preventing a direct linkage between farmers and export-ers are high transportation and transaction costs. One of the characteris-tics of the Mekong River Delta is the existence of interlacing drainage and irrigation canal systems, which also serve as transportation routes. Boat
4 Resolution No. 63/NQ-CP issued on 23 December 2009, and Decree 109/2011/NDD-CP issued on 4 November 2010. 5 Two SOEs, Vinafood I and Vinafood II, which supply most of the volume of G2G contracts, accounted for 15 per cent and 41 per cent, respectively, of total rice export in 2008 (AgroInfor, 2009). 6 According to Circular 89/2011/TT-BTC issued on 17 June 2011, exporters have to report their export prices to the VFA, but collectors do not have the same obligation. Since the linkages between collectors and farmers take place within the informal economy, it is very difficult for the VFA to determine which collectors buy from farmers and what volume/value of paddy they procure from them.

306
Trade policies, household welfare and poverty alleviation
transportation is the only means for transporting paddy from the fields to the market. As paddy is grown in small fields, which mostly have a size of 0.5 to 2 hectares (ha) (see Figure 4 in Section 2.2), it is not possible for ex-porters to buy large volumes because these cannot be delivered by small individual farmers. Moreover, even if exporters could buy directly from farmers, it would be costly (in terms of transportation costs and losses di-rectly attributed to transport) and less convenient (in terms of differences in harvest time). That is why collectors, who own small boats, have long played a key role in connecting small farmers who produce only limited volumes of rice for sale with exporters who require larger volumes of pad-dy to fulfil their export contracts.
Owing to the multi-layered rice value chain and the lack of a mechanism to effectively enforce the floor prices, efforts by the Vietnamese govern-ment to ensure a minimum rate of return for farmers by imposing price floors have not been successful. To address existing constraints and help farmers increase their income from growing rice, local authorities in the Mekong River Delta area have designed and are currently piloting a set of policy measures under a project called the Large-Scale Field Model (LSFM).
This study examines the potential impact of the LSFM on household wel-fare in Viet Nam. Possible effects of the adoption of the project are: (a) an increase in the farm gate price of rice, (b) an increase in the productivity of rice farmers, and (c) a reduction in farmers’ production costs. The study shows how these changes would affect household welfare, taking into ac-count the ripple effect that a change in the farm gate price of rice would have on other prices in the economy, and hence on household consump-tion, production, and wage income.
The policy simulation in this study suggests that implementation of the LSFM in the Mekong River Delta would increase the welfare of house-holds by 4.1 per cent in the short term and 4.9 per cent in the longer term. It would also reduce poverty rates by approximately 0.55 per cent among the 10 per cent poorest households and by 0.42 per cent among the 20 per cent poorest households in that region.
The next section of this study explains the LSFM and the various channels through which it affects those involved in the rice production. Section 3 provides a literature review of the impact of rice price changes on house-hold welfare in Viet Nam. Section 4 presents the methodology used to es-timate ex ante price changes and welfare effects, and Section 5 describes data sources used in the estimations of price changes and welfare effects.
307
Vie
t N
am
Household welfare and pricing of rice: Does the Large-Scale Field Model matter for Viet Nam?
Section 6 presents the pass-through and price change estimations and Section 7 puts forth a policy simulation with ex ante estimations of the welfare effects of the LSFM. Section 8 summarizes the main findings and, based on them, proposes several policy recommendations.
2 The Large-Scale Field Model
2.1 How the Large-Scale Field Model works
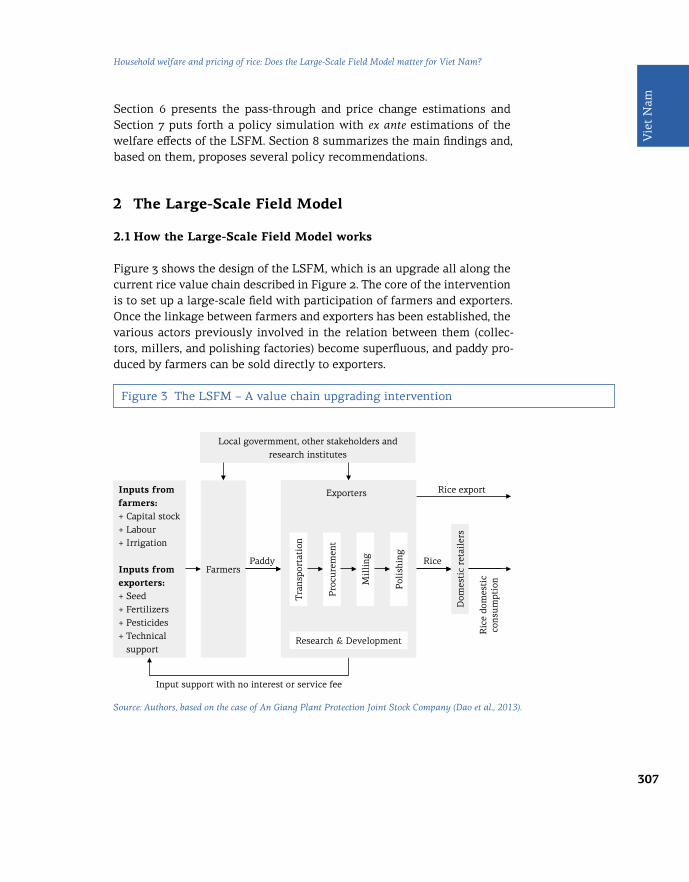
Figure 3 shows the design of the LSFM, which is an upgrade all along the current rice value chain described in Figure 2. The core of the intervention is to set up a large-scale field with participation of farmers and exporters. Once the linkage between farmers and exporters has been established, the various actors previously involved in the relation between them (collec-tors, millers, and polishing factories) become superfluous, and paddy pro-duced by farmers can be sold directly to exporters.
Figure 3 The LSFM – A value chain upgrading intervention
Inputs fromfarmers:+ Capital stock+ Labour+ Irrigation
Inputs fromexporters:+ Seed+ Fertilizers+ Pesticides+ Technical support
Farmers
Local govermment, other stakeholders and research institutesD
omes
tic
reta
iler
s
Paddy Rice
Rice export
Input support with no interest or service fee
Ric
e do
mes
tic
cons
umpt
ion
Tran
spor
tati
on
Research & Development
Pro
cure
men
t
Mil
ling
Poli
shin
g
Exporters
Source: Authors, based on the case of An Giang Plant Protection Joint Stock Company (Dao et al., 2013).

308
Trade policies, household welfare and poverty alleviation
According to a study by Dao et al. (2013) of an LSFM recently put in place by the An Giang Plant Protection Joint Stock Company (AGPPS),7 the LSFM works as follows:
• The government’s land consolidation programme allows for the swap-ping of fragmented agricultural fields between households to form a large-scale field, without any change in title to the land.8 Hence, a large-scale field can be set up under a common agreement among all partici-pating small farmers, who continue to be responsible for the cultivation of a small portion of the aggregated large field.
• An exporter coordinates the agglomeration of all the small farmers. However, unlike the collective farming that dominated Viet Nam’s ag-riculture between 1954 and 1988,9 the LSFM is not a public entity. Its focus is on pursuing the objectives of efficiency and profit maximiza-tion rather than addressing the objectives of social welfare maximiza-tion set by the government.
• Once a farming agreement has been signed between farmers and the exporter, the exporter provides the following to control the quality of growing paddy: (a) inputs (e.g. seed, fertilizers, pesticides)10 for rice pro-duction in the form of no-interest loans; (b) technical services conduct-ed by the exporter’s technical expert (called “farmer friend”), directly linked with the exporter’s research institute (if any) or other research institutes; (c) free on-farm transportation and procurement services (be-cause the volume of crop harvested from the LSFM is large enough to set up on-farm grain silos, traditional boat transportation is not nec-essary); (d) in the case of AGPPS, one month of free storage for paddy
7 A total of 1,000 ha of large-scale fields were first piloted by AGPPS in An Giang Province for the winter-spring crop of 2010–2011. By 2013, the total area of the AGPPS LSFM had reached more than 80,000 ha located in three provinces of the Mekong River Delta: An Giang, Dong Thap, and Long An (Dao et al., 2013). 8 Before 1945, agricultural land in Viet Nam was privately owned; 24.5 per cent of land belonged to only 4 per cent of the population. From 1953 to 1957, when Viet Nam was divided into two separate states, 810,000 ha of agricultural land were redistributed to more than 2 million households in the north of the country, based on household size (Le, 2007). Redistribution of land was, however, not implemented in the south of Viet Nam. Therefore, while all households in the north have access to agricultural land today, poor households in the south do not have their own land. For this reason, land is highly fragmented in the north (Red River Delta) and less fragmented in the south (Mekong River Delta). However, households do not have the ownership title to their agricultural land (all land belongs to the state) but are only granted a land use right. In the framework of the Doi Moi policy, land use rights were granted for 15 years in 1988, a period further extended to 20 years in 1993. Land use rights are considered as assets and can be transferred or used as collateral.
309
Vie
t N
am
Household welfare and pricing of rice: Does the Large-Scale Field Model matter for Viet Nam?
grain, which allows farmers to keep rice for later sale; and (e) a commit-ment to buy all paddy harvested. If farmers for any reason do not want to sell their rice to the exporter, they have to compensate the exporter by refunding the inputs provided, the costs of packaging bags, transpor-tation costs, and the costs of procurement services (if any).
As can be seen, applying the LSFM would provide a secure and stable sup-ply source of high-quality paddy grain for rice exports.11 Consequently, the exporter could bargain for a higher export price of Vietnamese rice on in-ternational markets. The profits from the increased export price would be shared between the farmers – through an increased farm gate price (pass-through effect) – and the exporters (who would thus also be compensated for the “free” transportation, milling, polishing, and storing services pro-vided to the farmers).12
2.2 Location – Why not the Red River Delta?
In Viet Nam, the Red River Delta and the Mekong River Delta are the two main sources of rice supply.13 While 95 per cent of rice exports are pro-duced in the Mekong River Delta, rice from the Red River Delta is destined for domestic consumption. Therefore, the Mekong River Delta was the nat-ural first choice as the location for the LSFM. Additionally, as shown in Figure 4, almost all farmers in the Red River Delta cultivate small farms (under 0.5 ha and even under 0.2 ha), whereas in the Mekong River Delta, more than 60 per cent of farmers have larger agricultural lands (0.5 ha and above). It is therefore more feasible to create a large-scale field needed for the project in the Mekong River Delta.14
9 Politburo Resolution No. 10 (1988) put an end to the collective farming model of the planned economy because of its inefficiency. 10 Seed is important in determining the quality of exported rice. Paddy is sensitive to the natural condition of the flooded parcel of arable land (e.g. soil) as well as the technique of cultivation (the way farmers use fertilizers, pesticides, and water from irrigation). Using the wrong seed can lead to a low or even no crop yield. 11 Exporters would apply quality management procedures to assure that the cultivation process strictly follows the Vietnamese Good Agricultural Practices and the Global Good Agricultural Practices. 12 As it is not expected that state-owned exporters would have an incentive to efficiently implement the LSFM scheme, private exporters who are not protected against competition will likely lead its implementation. However, in order to broaden the scope of the LSFM scheme, the government should also encourage it through policy measures. 13 See Figure A3 in the Annex for the geographical location of the Red River Delta and the Mekong River Delta. 14 Finally, the policy simulation’s finding that farmers in the Red River Delta might not benefit from the LFSM’s paddy price increase (see the baseline scenario in Section 7.2) provides more supporting evidence for the choice of location for the LSFM.

310
Trade policies, household welfare and poverty alleviation
2.3 Paddy price increase
What would be the expected increase of the farm gate price if the LSFM were implemented? The increase is computed using information on the prices along the value chain from Vo and Nguyen (2011). The focus is on the best-case scenario for farmers under the assumption that rents pre-viously captured by collectors, millers and polishing factories would be transferred to farmers. Furthermore, the export price of rice is assumed to remain unchanged at Vietnamese dong (VND) 9,737 per kilogram (kg). As shown in Table 2, under the best-case scenario for farmers, if total rents originally distributed among intermediaries were allocated to farmers, one could assume that the farm gate price of paddy would increase from VND 5,212 to 5,728 per kg. Hence, the marginal increase in the farm gate price of paddy would amount to 9.9 per cent.
Figure 4 Farm size (per cent)
100
90
80
70
60
50
40
30
20
RRD RRD RRD RRDMRD MRD MRD MRD
10
0
Winter–springplain rice
Per
cent
Autumn-winterplain rice
Summer–autumnplain rice Sticky rice
■ 2 ha and above
□ 0.5 to 2 ha
■ 0.2 to 0.5 ha
□ Under 0.2 ha
Source: Authors’ calculation, based on the 2010 Viet Nam Household Living Standards Survey (VHLSS).Note: RRD stands for Red River Delta, MRD stands for Mekong River Delta.

311
Vie
t N
am
Household welfare and pricing of rice: Does the Large-Scale Field Model matter for Viet Nam?
Source: Vo and Nguyen (2011) and authors’ calculations.
Table 2 Price and value added in the current and upgraded rice export value chain (VND per kg)
As explained above, the current low quality of Vietnamese rice makes ex-porters less competitive in the international market. One of the benefits of the LSFM is that it facilitates the production of high-quality paddy. Because Viet Nam’s rice export prices were similar to those of Thailand during 2008–2010, one could expect that, in the medium term, Viet Nam’s export prices would increase by 11.4 per cent, which equals the small-est gap between Viet Nam’s and Thailand’s export prices in 2011–2013 (see Table A1 in the Annex). As can be computed from the data in Table 2, under the upgraded rice value chain, production cost per kg of export-ed rice (VND 5,728) accounts for about 59 per cent of the export price of rice (VND 9,737). If farmers could keep the same share of the increase in the export price of rice, there would be a further marginal increase of the farm gate price of paddy by an expected amount of 11.4 per cent.15
2.4 Reduction of production costs
A reduction of production costs would arise because farmers in Viet Nam currently cultivate fragmented agricultural land. The small size of plots prevents them from taking advantage of modern agricultural ma-chinery (such as tractors) and thus raises labour costs (Markussen et al., 2012). Table 3 shows the costs of growing paddy associated with three main crops per year observed among a group of farmers cultivating a
Current rice export value chain Upgraded rice export value chain
Cost Value added
Price Cost Value added
Price
Farmers 4,672 540 5,212 4,672 1,056 5,728
Collectors 1,208 280 6,700 0
Millers 447 186 7,333 0
Polishing factories 793 50 8,176 0
Exporter 1,139 422 9,737 3,587 422 9,737
Total – 1,478 – – 1,478 –
15 Exporters could agree to pass on 59 per cent (which equals the share of production costs in the export price of rice) of the increase in the export price of rice to farmers, as their increased bargaining power in international markets would result from the higher quality of paddy produced by farmers under the LSFM.

312
Trade policies, household welfare and poverty alleviation
large-scale field and another group cultivating fragmented fields. Table 3 shows that by achieving economies of scale, cost saving (1) would be VND 456 per kg of paddy, which equals 11.1 per cent of the average produc-tion costs under the case without the LSFM (VND 4,096 per kg of paddy). Farmers would benefit from direct linkages with exporters in terms of cost savings by having access to interest-free input-material loans, and free packaging bags for paddy storage. Thus, the cost saving (2) from having access to these services would be about 3 per cent of the farm gate price of paddy. Hence, the total cost saving (3) would be 14.1 per cent of the current average production costs under the case without the LSFM.16
Table 3 Production costs savings under the Large-Scale Field Model
With the LSFM
Without the LSFM
1. Production costs per kg of paddy (VND)
Winter-spring crop 2,951 3,309
Summer-autumn crop 3,921 4,311
Autumn-winter crop 4,050 4,669
Average production costs 3,640 4,096
Cost saving (1) 456
Cost saving (1) as a share of the average production costs under the case without the LSFM (per cent)
11.1
2. Benefits from exporters per kg of paddy (VND)
No-interest loan on inputs 83 0
Free packaging bags 40 0
Cost saving (2) 123
Cost saving (2) as a share of the average production costs under the case without the LSFM (per cent)
3.0
3. Total cost saving (3) as a share of the average production costs under the case without the LSFM (per cent)
14.1
Source: Authors’ calculations, based on data from Dao et al. (2013).
2.5 Productivity increase
The difference in productivity (yield per farm size) between large farms (2 ha and above) and small farms (under 0.2 ha) can be used as a proxy for
16 This study assumes that there is no pass-through of cost reductions on the farm gate price of paddy. Further discussion of this assumption can be found in Section 4.3.

313
Vie
t N
am
Household welfare and pricing of rice: Does the Large-Scale Field Model matter for Viet Nam?
Table 4 Productivity by farm size (kg per square metre)
Source: Authors’ calculations, based on the 2010 VHLSS.Note: The average yield is computed as a simple average across the three crops.
17 This study assumes that there is no pass-through of productivity increases on the farm gate price of paddy. Further discussion of this assumption can be found in Section 4.3.
the expected productivity increase under the LSFM. Table 4 suggests that a large farm size could improve average yield by 14 per cent.17
Productivity Winter–spring crop
Spring–autumn crop
Autumn–winter crop
Average yield
Under 0.2 ha (1) 0.577 0.448 0.44
0.2 to 0.5 ha 0.602 0.449 0.418
0.5 to 2 ha 0.65 0.477 0.467
2 ha and above (2) 0.655 0.501 0.513
Productivity improvement (per cent) if upgrade from smallfarm (1) to large farm size (2)
13.5 11.8 16.6 14.0
3 Related literature
At the macroeconomic level, it is expected that trade liberalization would stimulate growth and that higher growth would in turn lead to welfare gains and poverty reduction. Chi-Chung et al. (2002) investigate the behav-iour of main rice exporters (in Thailand, Viet Nam and the United States) and rice importers (in Brazil, Europe, Japan, the Philippines and the former Soviet Union) and find that there are welfare gains of USD 1,492 million when all trading countries comply with the free trade agreement (which implies that all countries are price takers and act as perfect competitors).
At the microeconomic level, there is consensus that households are affect-ed by price changes: after a price increase, net consumers are worse off and net producers are better off. The impact of a price change of rice has been largely studied in Viet Nam. On the one hand, a number of authors have reported a positive impact of a price increase of rice exports on household welfare. Minot and Goletti (1998) find that rice export liberalization in Viet Nam would raise food prices but also increase average real income and re-duce poverty. In a later study, they show that a rice price increase of 14 to 22 per cent could bring about USD 200 million in welfare gains, a quarter of which would be distributed to households and the rest to SOEs (Minot

314
Trade policies, household welfare and poverty alleviation
and Goletti, 2000). Benjamin and Brandt (2002) find that significant in-creases in the price of rice have a largely beneficial impact on rural house-hold welfare. On the other hand, Coxhead et al. (2012), using a macro-micro model, find a negative effect of an increase in the price of rice on house-hold welfare, especially among the poor.
Despite the availability of numerous studies on the effects of rice price changes on household welfare, it is still not clear whether Vietnamese households would on average win or lose from rice price increases. One of the possible reasons may be that most of the studies were conducted long before Viet Nam’s rice export prices soared in 2006. Since 2006, there has been a large change in policy instruments that have influenced both pric-es and volumes of rice exports. Another reason may be the limitation of data. In their macro-micro model, Coxhead et al. (2012) investigate the im-pact of the price change in 2008 but use the 2003 Social Accounting Matrix and the database of household income and expenditure in the 2004 VHLSS.
4 Methodology
As discussed in Section 2, the LSFM will affect household welfare through the effects that it will have on: (a) farm gate prices of paddy, (b) productivi-ty of rice farmers, and (c) production costs. This section models how these changes would affect household welfare, taking into account the ripple effect that a change in the farm gate price of paddy would have on other prices in the economy, and hence on household consumption, production, and wage income.
4.1 Modelling price changes
One of the main channels through which the LSFM will affect household welfare is via the increase in farm gate prices of paddy. At the same time, any change in prices of paddy will result in changes in prices of other goods in the economy.
There are several ways of modelling the ripple effect that a change in the farm gate price of paddy would have on other prices in the economy. The econometric estimation model (Nicita et al., 2005; Balat et al., 2009) and the global simulation model (Francois and Hall, 2009) are useful for sim-ulating effects of tariff reductions and global, regional, or unilateral trade policy changes. But they are not useful for simulating the effects of price changes of a certain sector’s products on the prices of another sector’s products in an economy. Moreover, the data limitation with regard to key
315
Vie
t N
am
Household welfare and pricing of rice: Does the Large-Scale Field Model matter for Viet Nam?
inputs (such as export-supply elasticities and import-demand elasticities) is a major constraint in these estimations, particularly in terms of reconcil-ing the trade data classification with the living survey classification.
To estimate the price changes that result from a change in tariffs or pric-es of goods, one could use the Computable General Equilibrium (CGE) model (Chen and Ravallion, 2004). However, this model has many lim-itations in terms of assumptions with regard to the functioning of an economy. A major weakness of the CGE model is the limitation of data re-quired to calibrate the parameters of the model to accurately represent the studied economy. Therefore, studies using CGE models to represent the Vietnamese economy have so far borrowed the parameters from other economies (Coxhead et al., 2012).
Taking into account the methods and data availability, this study there-fore prefers to use the cost-push Leontief price model to estimate the price changes (Miyazawa, 1976; Oosterhaven, 1996; Dietzenbacher, 1997; ten Raa, 2005; Miller and Blair, 2009). In this model, the value-added coeffi-cient is the difference between the revenues per unit of output (the price of the commodity) and the material costs per unit of output. Hence, the cost-push Leontief price model has the following equation:
p = A' p + v (1)
where p is the column vector of index prices (number of sectors (n)); v is the column vector of the value-added coefficient, i.e. value added per unit of output (number of sectors (n)), and A is a transposition of the input co-efficient matrix (number of sectors (n) by number of sectors (n)).
If the farm gate price of paddy increases, which is considered a price shock, we could estimate the changes in prices of other goods using equation (1). Following Miyazawa (1976), we split the set of n sectors of the input-out-put (I – O) table into two subgroups: the P sector, which consists of the pad-dy sector, and the S sector, which consists of the rest of the n – 1 sectors of the economy. The n × n input coefficient matrix A is:
A = PS1
PS
1 (2)
where P (1 × 1) and S1 (n – 1 × 1) are the submatrices of input coefficients of the paddy sector, and P1 (1 × n – 1) and S (n – 1 × n – 1) are the submatri-ces of input coefficients of the rest of the n – 1 sectors.
316
Trade policies, household welfare and poverty alleviation
Equation (1) could be re-written for the two subgroups as follows:
pp = P' pp + S'1 ps + vp
ps = P'1 pp + S' ps + vs (3)
where pp and ps are column vectors of index prices of the P sector’s prod-uct (which is paddy) and S sector’s products (which are the rest of the n – 1 products in the economy), respectively; vp and vs are P sector’s and S sec-tor’s column vectors of value-added coefficients, respectively; and P', S1', P1' and S' are transpositions of the matrices P, S1,P1, and S, respectively.
As we want to estimate the effects of paddy rice price changes on prices of other goods in the economy, in system (3), we take pp and vs as exogenous variables, whereas ps and vp are endogenous variables.
Under the cost-push effect, if the price of paddy rises from pp to (pp+∆pp), we could determine the price increase in other S sectors by solving the system as follows:
∆ps = ( I – S' ) –1 P1' ∆pp = T' P1' ∆pp = (P1 T)' ∆pp= T1' ∆pp (4)
Note that the price increase in other S sectors estimated under equation (4) could be viewed as a result of: (a) direct effects of change in the price of paddy, (b) second-order or indirect effects, and (c) paddy input in S sec-tors induced by internal propagation in S sector industries T1
= P1T = P1 (I – S) –1 (Miyazawa, 1976).
4.2 Estimating labour income effects
Wages are the key source of income for many households. They depend on the prices of goods, particularly given the fact that the Vietnamese la-bour market is segmented (M4P2, 2009). To estimate the elasticity of wag-es with respect to changes in prices, we can modify system (3) by splitting the value-added component of each sector into a wage component w (com-pensation of employees per unit of output) and a capital stock component r (rent paid to capital stock per unit of output):
pp = P' pp + S1' ps + wp + rp
ps = P1' pp + S' ps + ws + rs (5)
where vp = wp + rp
vs = ws + rs

317
Vie
t N
am
Household welfare and pricing of rice: Does the Large-Scale Field Model matter for Viet Nam?
If we take pp and vs as exogenous variables, whereas ps and vp are endog-enous variables, from system (5), the variation of vp could be seen as the change in wage in the P sector due to the change in price of the P sector’s product (Miyazawa, 1976). Under the cost-push effect, if the price of the P sector’s product increases from pp to ( pp + ∆pp ), under the assumption that capital stock coefficients rp and rs are constant in the short term and thus have not been affected by price changes, we obtain:
∆wp = { ( I – P' ) – S1' T' P1' } ∆pp (6)
The term ∆wp is the response of equilibrium wages in the P sector to the change in the prices of the P sector’s product.
The responses of the equilibrium wages to prices under equation (6) will differ across different sectors (industry wage premiums), but will be the same for household members working in the same sector, regardless of their labour skills.
4.3 Modelling welfare effects
Non-parametric density estimations and regressions are used here to study the distributional effects of rice price changes in relation to house-hold characteristics, particularly living standards and geographical loca-tions. The idea of non-parametric analysis was first introduced by Deaton (1989a) and then extensively used in various studies on welfare analy-sis (Deaton, 1989b; Budd, 1993; Benjamin and Deaton, 1993; Barrett and Dorosh, 1996; Sahn and Sarris, 1991). An extension of Deaton (1989a) con-siders the responses of the labour market because a change in the price of a good will affect labour demand and then the wage in the production sec-tor of this good.
For each household, the welfare impact could then be calculated as follows:
duh = ∑ ( Фph – Cp
h ) dpp + ∑ θjh εωp dpp (7)
where Фph is the share of household income from production of good p; Cp
h is the income share of household consumption spent on good p; θj
h is the share of wage income in total household income for member j; and εωp is the elasticity of wages earned with respect to the price of good p, estimat-ed in equation (6).
p p,j

318
Trade policies, household welfare and poverty alleviation
Note the following:
• One would expect that farming must be fairly competitive, so cost re-duction and productivity increases could lower the farm gate price of paddy. However, in the LSFM scheme, all paddy harvested in the large-scale fields will be purchased by exporters, as agreed upon by both par-ties under the contract. On the one hand, this ensures a secure source of high-quality rice for the exporter, on the other hand, farmers do not face competitive pressures (from other producers in the market), and hence do not need to reduce their paddy price.
• Therefore, in the policy simulation, we assume that there is no pass-through of productivity increases and production cost savings to the farm gate price of paddy sold by farmers who join the LSFM. Hence, the change in productivity and the lower cost of production only affect (pos-itively) the household income from paddy production in which the pro-ductivity gain (crop yield) leads to higher income, and the saving with regard to costs results in a lower cost of growing paddy.
• The increase in the price of paddy and the change in the price of oth-er goods (first step) affect both household incomes earned from produc-tion of these goods and household consumption of these goods. Slight increases in wages (second step) affect wage incomes of household members. Households’ exposure to price and wage changes depends on the structure of their income and the allocation of their expenditure
5 Data access and availability
For estimation of the price changes, this study uses the 2007 national I-O table published by the General Statistics Office of Viet Nam, which is the latest national benchmark I-O table based on a direct full survey released in 2010. Viet Nam’s 2007 I-O table classifies commodities and industries into 138 three-digit level commodities/industries.
For estimation of welfare effects, this study uses data from the 2010 Viet Nam Household Living Standards Survey, which was conducted by the GSO, with technical assistance from the United Nations Statistics Division, the World Bank, and Statistics Sweden. The surveys are representative at the national level.
In terms of sample design, the 2010 VHLSS is a classical three-stage strat-ified random survey covering ordinary households at the national level.

319
Vie
t N
am
Household welfare and pricing of rice: Does the Large-Scale Field Model matter for Viet Nam?
The sample size is quite large, with 45,000 households surveyed in the full sample each year. However, because a detailed questionnaire (including expenditures and other subject-specific modules) was applied to a random subsample of about 9,000 households, our policy simulations are based on the 9,000 households in the VHLSS that were selected for the full ques-tionnaire out of the 45,000 households surveyed. The 2010 VHLSS includes a number of modules providing information on demographics, education, employment, health, income, and labour supply. An expenditure module and extensive modules with information on farm activities related to agriculture, livestock, and aquaculture (including pro-duction, sale, inputs, and investment) are also included.
To reconcile the I-O table classification with the VHLSS sector classifica-tion, we aggregate the I-O table into 138 sectors and 81 sectors for estima-tions of household consumption/income effects and labour income effects, respectively.
Finally, we use data on monthly export prices of rice of Viet Nam and Thailand (in USD, current prices) as shown in Table A1 in the Annex. For the estimation of price transmission effects of the paddy price increase in the Mekong River Delta on other parts of the country (see Section 7.3), we use domestic prices of rice and farm gate prices of paddy (current prices) in the Mekong River Delta and the Red River Delta regions, which are avail-able from the Information Center for Agriculture and Rural Development (AgroInfor) for the period from January 2008 to the present.
6 Estimation of price change
The Vietnamese 2007 I-O table classifies commodities and industries into 138 three-digit level categories. This classification is almost perfectly con-cordant with the household consumption data and production income data. For labour income effects, we have to reconcile the I-O table with sectors of the household survey containing data on labour income. We thus aggre-gate the 138 sectors with the 81-sector classification of the household sur-vey’s labour income data.
Figure 5 presents our estimation of the top 20 price increases (out of 138) resulting from a 1 per cent increase in the farm gate paddy price, using equation (4). This vector of price changes for the 138-sector classification is used for the estimation of the consumption and production income ef-fects. The largest price increases are recorded for rice (0.8 per cent), flour

320
Trade policies, household welfare and poverty alleviation
(0.6 per cent), animal feed (0.3 per cent), and other agricultural and aqua-cultural sectors. The cost-push effects tend to be concentrated in some ag-ricultural commodities and processed foods.18
Figure 5 Estimation of the top 20 price increases due to a 1 per cent increase in the farm gate price of paddy (per cent)
Other cropsFood services
SugarProcessed preserved fishery and by-products
Processed coffeeAlcohol
Non-alcohol water and soft drinksBuffaloes, cows
BeerProcessed, preserved meat and by-products
Other remaining foodChocolate, candy, products from flour
Other livestock and poultry, n.e.c.Poultry
Fish farmingAgricultural services and other products
PigsAnimal feed
Flour (all kinds)Rice
0 0.1 0.2 0.3 0.4 0.5 0.6 0.7 0.8 0.9
Source: Authors’ estimations.Note: n.e.c. stands for not elsewhere classified.
18 A comprehensive list of the 138-sector and 81-sector price changes, and the estimation of wage increases (using equation (6)) are available from the authors upon request.
7 Policy simulation
7.1 Scenario definition
This section uses the estimates for the farm gate price of paddy, productiv-ity increases, and production cost reductions from Sections 2 and 6 to sim-ulate the impact of the LSFM on household welfare in the Mekong River Delta and Red River Delta (only baseline scenario). Results from Section 2 are used to define the scenarios described in Table 5. The baseline sce-nario incorporates only a 1 per cent increase in paddy price. The objective of this scenario is to test the distributional effects of a 1 per cent increase in the farm gate price on the welfare of households in the Red River Delta and the Mekong River Delta, and hence, provide more supporting evidence for the choice of location for the LSFM.

321
Vie
t N
am
Household welfare and pricing of rice: Does the Large-Scale Field Model matter for Viet Nam?
Source: Authors.
Scenario 1 is our short-term policy simulation, which incorporates not only the paddy price increase (9.9 per cent), but also the improvement in productivity (14 per cent) and the lower cost of paddy production (14.1 per cent).
It might be bold to assume that the increase in productivity following the LSFM would simply be equivalent to the difference in the observed pro-ductivity of large versus small farms. In scenarios 2 and 3, we therefore use productivity growth of only 5 and 10 per cent, respectively, to see how sensitive welfare is to changes in productivity growth.
It is important to note that the simulations assume that the farmers do not pass any cost reductions and productivity improvements on to the price of paddy. This assumption is based on the observed case of the LSFM run by the AGPPS (Dao et al., 2013), where farmers who join the LSFM are not in competition with other farmers in the market (see Section 4.3).
Table 5 Definition of scenarios
Location Parameters
Baseline scenario
Red River Delta and Mekong River Delta, rural areas
Paddy price increase by 1 per cent
Scenario 1 Mekong River Delta,rural areas
Paddy price increase by 9.9 per cent (owing to the direct farmers-exporters linkage)Production cost reduction by 14.1 per centProductivity increase by 14 per cent
Scenario 2 Mekong River Delta, rural areas
Paddy price increase by 9.9 per cent (owing to the direct farmers-exporters linkage)Production cost reduction by 14.1 per centProductivity increase by 5 per cent
Scenario 3 Mekong River Delta,rural areas
Paddy price increase by 9.9 per cent (owing to the direct farmers-exporters linkage)Production cost reduction by 14.1 per centProductivity increase by 10 per cent
Scenario 4 Mekong River Delta,rural areas
Paddy price increase by 9.9 per cent (owing to the direct farmers-exporters linkage)Further paddy price increase by 11.4 per cent (owing to the 11.4 per cent increase in the export price of rice)Production cost reduction by 14.1 per centProductivity increase by 14 per cent

322
Trade policies, household welfare and poverty alleviation
Scenario 4 is designed for a longer term: productivity grows by 14 per cent but, due to the upgrade of rice quality, exporters will have a stronger ca-pacity to bargain for an increase in the export price of rice. As discussed in Section 2, they could then agree to pass 59 per cent (equal to the share of paddy price in the export price of rice) of the increase in the export price of rice on to the producers. This would result in an 11.4 per cent increase of the farm gate price of paddy, in addition to the 9.9 per cent increase due to the direct farmers-exporters linkage.
7.2 Results
7.2.1 Baseline scenario simulation
Figure 6 shows total welfare effects. For rural households in the Red River Delta, estimations show that a 1 per cent increase in the farm gate price of paddy would not benefit the average household welfare across the entire income distribution. Losses decrease as household income increases, but the total effects on poor households are found to be significantly negative. The middle-income and rich households would be neither hurt nor better off. Due to the very small size of farms in the Red River Delta, the poorer households tend to be net consumers of rice – their gains from selling pad-dy are not large enough to offset the negative consumption effect, whereas the labour income effect is zero. Therefore, it is not surprising that, even though most of the poor rural households in the Red River Delta are rice farmers, faced with the paddy price increase, they are not better off.19
― Rural Viet Nam
― Rural RRD
Rural MRD
-.6
-.4
-.2
0
.2
4 6 8 10
Tota
l wel
fare
cha
nge
Ln (monthly income per capita)
Figure 6 Baseline scenario – Total welfare effects
Source: Authors’ calculations.

323
Vie
t N
am
Household welfare and pricing of rice: Does the Large-Scale Field Model matter for Viet Nam?
― Rural Viet Nam
― Rural RRD
Rural MRD
Figure 7 Distribution of income from rice production
Source: Authors’ calculations.
In the Mekong River Delta, we find a pro-rich bias in welfare gains. Welfare losses for poor households amount to 0.6 per cent of the initial income. For middle-income and rich households in the rural areas of the Mekong River Delta, total welfare effects are found to be positive and gains extend to nearly 0.2 per cent of initial income. The negative welfare effects on the poor in the Mekong River Delta are due to the fact that these households are larger net consumers of rice than richer households.20
Figure 7 highlights the difference in income from rice production between households in the Mekong River Delta and the Red River Delta. In the Red River Delta, only poor households depend on rice production income. This situation is reversed in the Mekong River Delta, where richer households earn a significant share of income from selling paddy.
1
2
3
4
4 6 8 10
Ln (r
ice
prod
ucti
on in
com
e)
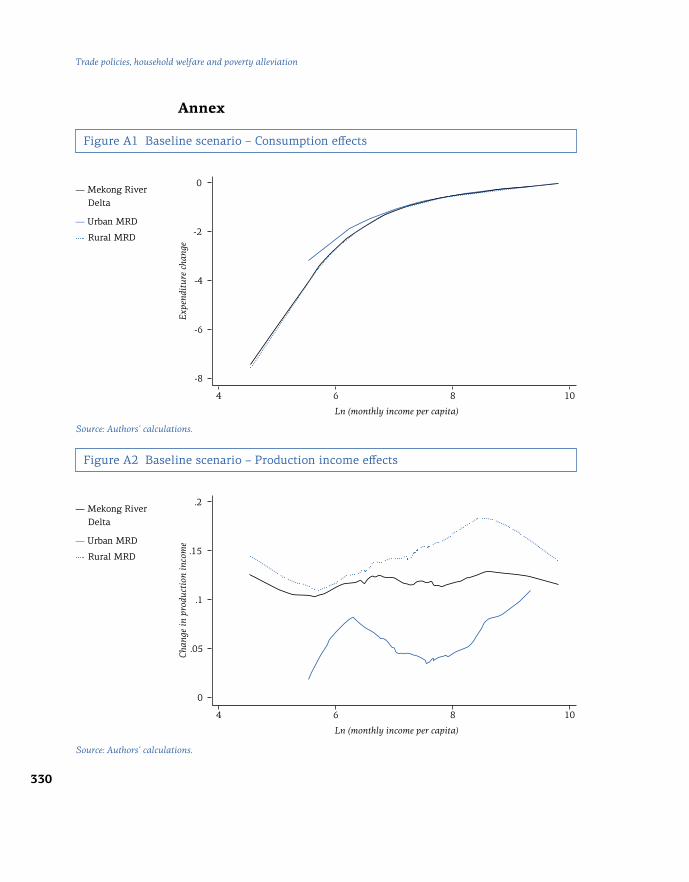
19 Rice is the main source of calories in the diet of the Vietnamese population. It accounted for 57 per cent of the daily calorie intake in Viet Nam over 2005–2007, compared to 26 per cent in China, 38 per cent in Thailand, 48 per cent in the Philippines, and 49 per cent in Indonesia. Per capita consumption of rice in Viet Nam is 135 kg, the second highest among Asian countries, just after Myanmar (Jaffee et al., 2012b). According to Jaffee’s calculation, in-house rice consumption per capita is higher among rural populations and among the poorest income group. 20 Figures A1 and A2 in the Annex focus only on the effects on consumption and production in the Mekong River Delta (effects on wage income are zero).
Ln (monthly income per capita)

324
Trade policies, household welfare and poverty alleviation
Figure 8 shows rice income by farm size. In the Red River Delta, income from rice production does not merely depend on farm size or the level of household income. As discussed in Section 2.2, larger fragmentation in the Red River Delta is a constraint for farmers to achieve economies of scale. In the Mekong River Delta, however, productivity gains would be higher and income earnings from rice production hence greater for larg-er farms and higher levels of household income (poor households usually have no land for cultivation and gain income by working for other rich-er households).21
21 As explained above, agricultural land in Viet Nam belongs to the state and is only for lease for a 20-year period (according to the Land Law). Unlike farmers in the Red River Delta, to whom agricultural land was redistributed according to their household size during 1953– 1957, farm size in the Mekong River Delta is a result of the historical development of this region and does not depend on the size of households.
Figure 8 Rice income by farm size
― Red River Delta
― Mekong River Delta
8
8
6
6
4
4
2
2
Ln (r
ice
prod
ucti
on in
com
e pe
r ca
pita
)
4
4
4
4
6
6
6
6
8
8
8
8
10
10
10
10
Ln (income per capita)Source: Authors’ calculations.
In conclusion, our baseline scenario suggests that farmers in the Red River Delta who work on small farms are net consumers of rice and hence might not benefit from the paddy price increase under the LSFM. However, farm-ers in the Mekong River Delta are likely to be potential members of the LSFM policy target group. Because larger gains would be captured by rich-er households, households with a farm size of 2 ha or above would benefit more from participating in the LSFM.
Under 0.2 ha
0.5 to 2 ha 2 ha and above
0.2 to 0.5 ha
325
Vie
t N
am
Household welfare and pricing of rice: Does the Large-Scale Field Model matter for Viet Nam?
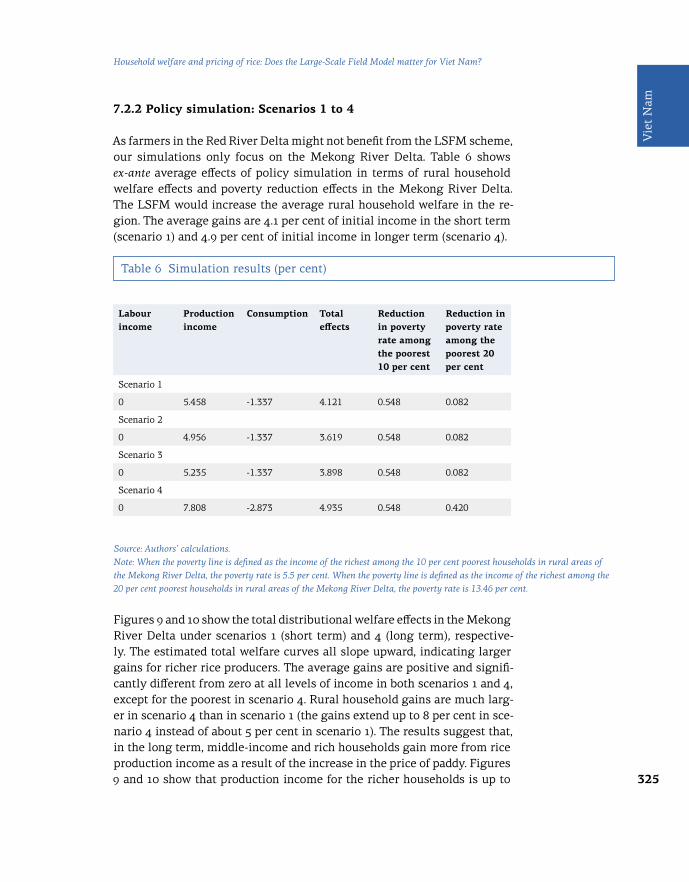
Table 6 Simulation results (per cent)
Source: Authors’ calculations.Note: When the poverty line is defined as the income of the richest among the 10 per cent poorest households in rural areas of the Mekong River Delta, the poverty rate is 5.5 per cent. When the poverty line is defined as the income of the richest among the 20 per cent poorest households in rural areas of the Mekong River Delta, the poverty rate is 13.46 per cent.
7.2.2 Policy simulation: Scenarios 1 to 4
As farmers in the Red River Delta might not benefit from the LSFM scheme, our simulations only focus on the Mekong River Delta. Table 6 shows ex-ante average effects of policy simulation in terms of rural household welfare effects and poverty reduction effects in the Mekong River Delta. The LSFM would increase the average rural household welfare in the re-gion. The average gains are 4.1 per cent of initial income in the short term (scenario 1) and 4.9 per cent of initial income in longer term (scenario 4).
Labour income
Production income
Consumption Total effects
Reduction in poverty rate among the poorest 10 per cent
Reduction in poverty rate among the poorest 20 per cent
Scenario 1
0 5.458 -1.337 4.121 0.548 0.082
Scenario 2
0 4.956 -1.337 3.619 0.548 0.082
Scenario 3
0 5.235 -1.337 3.898 0.548 0.082
Scenario 4
0 7.808 -2.873 4.935 0.548 0.420
Figures 9 and 10 show the total distributional welfare effects in the Mekong River Delta under scenarios 1 (short term) and 4 (long term), respective-ly. The estimated total welfare curves all slope upward, indicating larger gains for richer rice producers. The average gains are positive and signifi-cantly different from zero at all levels of income in both scenarios 1 and 4, except for the poorest in scenario 4. Rural household gains are much larg-er in scenario 4 than in scenario 1 (the gains extend up to 8 per cent in sce-nario 4 instead of about 5 per cent in scenario 1). The results suggest that, in the long term, middle-income and rich households gain more from rice production income as a result of the increase in the price of paddy. Figures 9 and 10 show that production income for the richer households is up to

326
Trade policies, household welfare and poverty alleviation
8 per cent in scenario 4 compared to 4 per cent in scenario 1. Expenditure on rice also increases for all households. However, the poorest households are the most adversely affected because their rice expenditure increases by 8 per cent in scenario 1 and by 16 per cent in scenario 4. This is more than the increase in these households' income from rice production, making the total welfare effect of the rice price increase negative for them.
Policy simulation results presented in Table 6 also show poverty reduction effects in the Mekong River Delta. Poverty rate estimations use per capita income from the 2010 VHLSS. In both short-term and longer-term scenar-ios, the reductions in the poverty rate among the poorest 10 per cent are the same, namely 0.548 per cent. This is because the poorest 10 per cent in the Mekong River Delta do not produce rice at all, as they do not have ac-cess to agricultural land, as explained above. Therefore, different scenari-os only affect them as net consumers.
With regard to poverty reduction among the poorest 20 per cent, because we include one richer decile of households among the poorest rural de-ciles, an additional 11.4 per cent increase in the paddy price under scenario 4 does move some of the poor across the poverty line. As a result, attaina-ble poverty reduction is higher in the longer term (0.420 per cent versus 0.082 per cent).
In scenarios 2 and 3, we try to see how sensitive our simulations are to the assumed productivity increase. Results presented in Table 6 show that to-tal welfare effects decrease (due to the lower level of productivity gains) but that the impact on poverty reduction remains unchanged in both pov-erty rate definitions (10 per cent and 20 per cent, respectively).

327
Vie
t N
am
Household welfare and pricing of rice: Does the Large-Scale Field Model matter for Viet Nam?
Figure 9 Scenario 1 – Total welfare effects
Figure 10 Scenario 4 – Total welfare effects
-8
-16
-8
-12
-4
-4
0
0
8
8
4
4
12
16
12
Tota
l wel
fare
cha
nge
Tota
l wel
fare
cha
nge
4
4
5
5
6
6
7
7
8
8
9
9
10
10
Ln (monthly income per capita)
Ln (monthly income per capita)
Expenditure change
― Wage income change
― Production income change
Total welfare change
Expenditure change
― Wage income change
― Production income change
Total welfare change
Source: Authors’ calculations.
Source: Authors’ calculations.
7.3 Discussion of potential side effects of the Large-Scale Field Model
Although it is not quantitatively shown in our simulation results, the joint effects of the LSFM would not only increase rural household welfare in the Mekong River Delta but also increase the volume and value of rice exports (through productivity improvements and higher

328
Trade policies, household welfare and poverty alleviation
export prices). Therefore, some side effects of the LSFM might be of con-cern to policymakers. These effects may relate to: (a) national food securi-ty – whether or not it could be compromised if and when the LSFM results in an increase in the value and the volume of rice exports, and (b) wheth-er there would be price transmission effects of the paddy price increase in the Mekong River Delta on other parts of the country.
Regarding the first potential side effect, Jaffee et al. (2012b) show that, in 2030, the expected output would be far in excess of national food security needs even under the worst-case scenario of a reduction of paddy land to 3 million ha (from 4 million ha), given the current low level of productivity (5.8 metric tons per ha) and assuming that the domestic rice consumption remains at 120 kg per capita per year and there is no change in post-har-vest losses (10 per cent at the farm level).
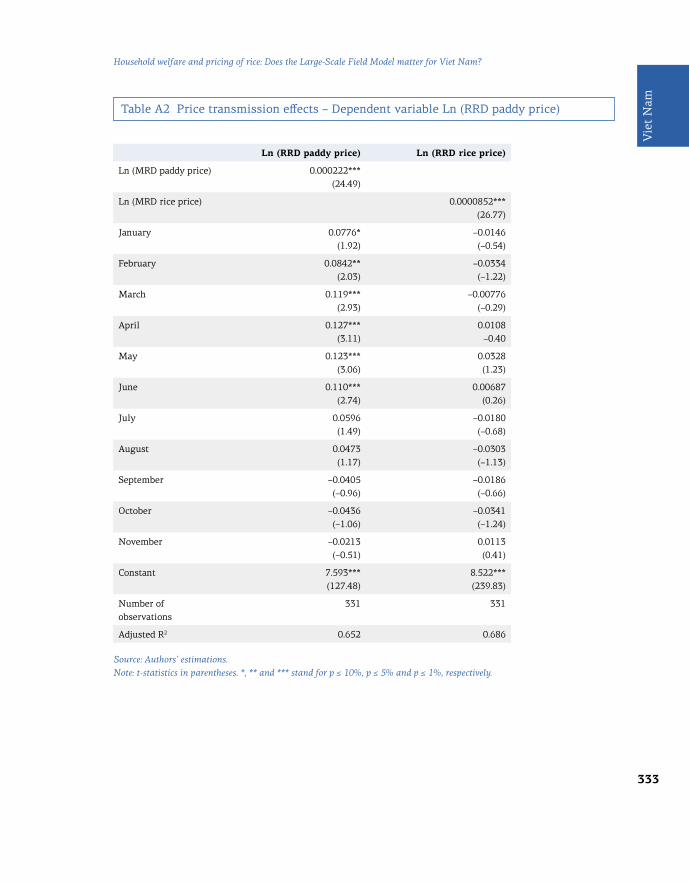
Regarding the second side effect, because the paddy price change would directly affect the domestic price of rice, we could assume that the law of one price holds. This implies that any change in the farm gate price of pad-dy would be fully transmitted to the domestic price of rice in the Mekong River Delta. Therefore, we could apply a simple framework to examine the price transmission effects of the paddy price increase in the Mekong River Delta. The domestic price of rice in time t in the Red River Delta is a func-tion of domestic prices of rice in the Mekong River Delta:
ln ptMRD = β0 + β1 ln pt
RRD + ε (8)
Econometric estimations use panel data on weekly domestic paddy pric-es from 1 January 2008 to 20 August 2013. The results are shown in Table A2 in the Annex. We use dummies for monthly fixed effects. The estimat-ed pass-through elasticity is close to zero and statistically significant. This implies no price transmission between the Mekong River Delta and the Red River Delta. This result confirms that an increase in the farm gate price of paddy following the LSFM would not affect the domestic price of rice in the rest of Viet Nam.
If the LSFM were applied on a region-wide scale, it is likely that additional exporters would join the scheme. As the LSFM leads to productivity gains and cost reductions, one would expect the domestic price of paddy to de-crease over the longer run (at least partially in the Mekong River Delta re-gion), due to greater market competition among farmers.
329
Vie
t N
am
Household welfare and pricing of rice: Does the Large-Scale Field Model matter for Viet Nam?
8 Conclusions
This study has examined the potential impact of the adoption of the Large-Scale Field Model on household welfare and poverty reduction in the Mekong River Delta.
The study has first found that an increase of 1 per cent in the price of paddy would benefit households in the Mekong River Delta but not households in the Red River Delta. The larger fragmentation of land in the Red River Delta makes it difficult to implement the LSFM. We therefore suggest that farmers from the Mekong River Delta be given priority for the application of the LSFM. Within this policy target group, households with a farm size of 2 ha or above would likely benefit more from participating in the LSFM.
The estimation of ex-ante effects shows that the LSFM would improve av-erage rural household welfare by 4.1 per cent in the short term and by 4.9 per cent in the longer term. In all scenarios, the LSFM would result in pov-erty reduction in the Mekong River Delta. The effective poverty reduction would be higher in the longer term, when exporters could bridge the gap between export prices of Viet Nam and Thailand.
As the LSFM idea has been met with considerable interest by the gov-ernment of Viet Nam, as well as by local authorities in provinces in the Mekong River Delta, we suggest that to attain the government’s objec-tive of a minimum rate of return of 30 per cent for rice farmers, the LSFM might be a better policy option than setting price floors for export prices and farm gate prices of paddy.
As discussed above, the combined effects of the LSFM would not only im-prove household welfare in the region but also foster Vietnamese rice ex-ports. As state-owned exporters may have fewer incentives to implement the changes proposed by the LSFM scheme, private exporters would like-ly be better candidates to lead the implementation of this policy. The rice export quota granted to SOEs could be a bottleneck, however, because the implementation of the LSFM requires that some level of competition be established among Vietnamese rice exporters.
330
Trade policies, household welfare and poverty alleviation
Annex
Figure A1 Baseline scenario – Consumption effects
Figure A2 Baseline scenario – Production income effects
-8
0
-6
.05
-4
.1
0
.2
-2
.15
Expe
ndit
ure
chan
geC
hang
e in
pro
duct
ion
inco
me
4
4
6
6
8
8
10
10
Ln (monthly income per capita)
Ln (monthly income per capita)
― Mekong River Delta
― Urban MRD
Rural MRD
― Mekong River Delta
― Urban MRD
Rural MRD
Source: Authors’ calculations.
Source: Authors’ calculations.

331
Vie
t N
am
Household welfare and pricing of rice: Does the Large-Scale Field Model matter for Viet Nam?
Figure A3 Viet Nam regional map
Source: General Statistics Office of Viet Nam.Note: The eight socio-ecological zones recognized by the GSO are: (1) Red River Delta, (2) North-East, (3) North-West, (4) North Central Coast, (5) South Central Coast, (6) Central Highlands, (7) South-East, and (8) Mekong River Delta.
Thailand
China
Lao People's Democratic Republic
Yunnan Province
Guangxi Province
Cambodia
Viet Nam
8
7
6
N
5
4
3
2
1
Hanoi
■ ■
■
■
Haiphong
Hue
Ho Chi Minh City
332
Trade policies, household welfare and poverty alleviation
Month Year Thailand Viet Nam Difference (per cent)
January 2011 519 501 3.4
February 2011 519 487 6.5
March 2011 487 469 3.8
April 2011 467 481 -3.0
May 2011 474 476 -0.3
June 2011 504 466 8.1
July 2011 522 503 3.7
August 2011 557 552 0.9
September 2011 590 557 5.9
October 2011 616 579 6.3
November 2011 604 565 7.0
December 2011 584 512 14.1
January 2012 538 477 12.8
February 2012 543 447 21.4
March 2012 536 430 24.8
April 2012 497 446 11.4
May 2012 591 447 32.4
June 2012 591 418 41.4
July 2012 581 414 40.4
August 2012 573 434 32.2
September 2012 585 462 26.7
October 2012 565 452 25.0
November 2012 551 455 21.2
December 2012 555 425 30.7
January 2013 564 411 37.0
February 2013 573 410 39.8
March 2013 562 409 37.2
April 2013 544 394 38.2
May 2013 562 380 47.7
June 2013 540 371 45.4
July 2013 480 397 21.0
August 2013 480 400 19.9
Source: Authors’ calculations, based on data from AgroInfor.
Table A1 Monthly FOB export prices in Thailand and Viet Nam ports for 5 per cent broken rice, January 2011 – August 2013 (USD per metric ton)
333
Vie
t N
am
Household welfare and pricing of rice: Does the Large-Scale Field Model matter for Viet Nam?
Table A2 Price transmission effects – Dependent variable Ln (RRD paddy price)
Ln (RRD paddy price) Ln (RRD rice price)
Ln (MRD paddy price) 0.000222***(24.49)
Ln (MRD rice price) 0.0000852***(26.77)
January 0.0776*(1.92)
–0.0146(–0.54)
February 0.0842**(2.03)
–0.0334(–1.22)
March 0.119***(2.93)
–0.00776(–0.29)
April 0.127***(3.11)
0.0108–0.40
May 0.123***(3.06)
0.0328(1.23)
June 0.110***(2.74)
0.00687(0.26)
July 0.0596(1.49)
–0.0180(–0.68)
August 0.0473(1.17)
–0.0303(–1.13)
September –0.0405(–0.96)
–0.0186(–0.66)
October –0.0436(–1.06)
–0.0341(–1.24)
November –0.0213(–0.51)
0.0113(0.41)
Constant 7.593***(127.48)
8.522***(239.83)
Number of observations
331 331
Adjusted R2 0.652 0.686
Source: Authors’ estimations.Note: t-statistics in parentheses. *, ** and *** stand for p ≤ 10%, p ≤ 5% and p ≤ 1%, respectively.

334
Trade policies, household welfare and poverty alleviation
References
AgroInfor (2009). “Vietnam Annual Rice Market Report 2008.” Information Center for Agriculture and Rural Development. Institute of Policies and Strategies for Agriculture and Rural Development, Hanoi.
Balat, J., Brambilla, I. and Porto, G. (2009). “Realizing the Gains from Trade: Export Crops, Marketing Costs, and Poverty.” Journal of International Economics, 78 (1): 21–31.
Barrett, C.B. and Dorosh, P.A. (1996). “Farmers’ Welfare and Changing Food Prices: Nonparametric Evidence from Rice in Madagascar.” American Journal of Agricultural Economics, 78 (3): 656–669.
Benjamin, D. and Brandt, L. (2002). “Agriculture and Income Distribution in Rural Vietnam under Economic Reforms: A Tale of Two Regions.” William Davidson Institute Working Paper 519, University of Michigan.
Benjamin, D. and Deaton, A. (1993). “Household Welfare and the Pricing of Cocoa and Coffee in Côte d'Ivoire: Lessons from the Living Standards Surveys.” World Bank Economic Review, 7 (3): 293–318.
Boycko, M., Shleifer, A. and Vishny, R.W. (1996). “A Theory of Privatisation.” The Economic Journal, 106 (435): 309–319.
Budd, J. (1993). “Changing Food Prices and Rural Welfare: A Nonparametric Examination of the Côte d’Ivoire.” Economic Development and Cultural Change, 4 (3): 587–603.
Chen, S. and Ravallion, M. (2004). “Welfare Impacts of China’s Accession to the World Trade Organization.” World Bank Economic Review, 18 (1): 29–57.
Chi-Chung, C., Bruce, A.M., Ching-Cheng, C. and Shih-Hsun, H. (2002). “Spatial Equilibrium Modeling with Imperfectly Competitive Markets: An Application to Rice Trade.” Presentation at the American Agricultural Economics Association’s 2002 Annual Meeting, Long Beach CA, 28–31 July.
Coxhead, I., Linh, V.H. and Tam, L.D. (2012). “Global Market Shocks and Poverty in Vietnam: The Case of Rice.” DEPOCEN Working Paper No. 2012/32. Development and Policies Research Center, Hanoi.
Dao, M.H.T., Nguyen, A.V. and Vo, L.M.T. (2013). “Linkages in Rice Production and Consumption in Vietnam.” VIE Report. Vietnam Institute of Economics, Hanoi.
Deaton, A. (1989a). “Rice Prices and Income Distribution in Thailand: A Non-Parametric Analysis.” Economic Journal, 99 (395): 1–37.
Deaton, A. (1989b). “Household Survey Data and Pricing Policies in Developing Countries.” World Bank Economic Review, 3 (2): 183–210.
Dietzenbacher, E. (1997). “In Vindication of the Ghosh Model: A Reinterpretation as a Price Model.” Journal of Regional Science, 37 (4): 629–651.
Francois, J.F. and Hall, H.K. (2009). “Global Simulation Analysis of Industry-Level Trade Policy: The GSIM Model.” IIDE Discussion Paper No. 20090803. Institute for International and Development Economics, Rotterdam.
GSO (various years). Statistical Yearbooks of 2006–2011. General Statistics Office, Hanoi.
IRRI (2006). Paddy Drying Systems [online]. International Rice Research Institute, Manila. Available at: http://www.knowledgebank.irri.org/training/fact-sheets/postharvest-management/drying-fact-sheet-category/paddy-drying-systems-fact-sheet.

335
Vie
t N
am
Household welfare and pricing of rice: Does the Large-Scale Field Model matter for Viet Nam?
Jaffee, S., Nguyen, S.V., Le, D.C. and Vo, L.T.T. (2012a). “From Rice Bowl to Rural Development: Challenges and Opportunities Facing Vietnam’s Mekong Delta Region.” In: World Bank Ed. Vietnam Rice, Farmers and Rural Development: From Successful Growth to Sustainable Prosperity. World Bank, Washington DC.
Jaffee, S., Nguyen, T.A.D., Nguyen, Q.N., Dao, A.T., Nguyen, D.T., Nguyen, M.N., Nguyen, V. and Nguyen, P.A. (2012b). “Moving the Goal Posts: Vietnam’s Evolving Rice Balance and Other Food Security Considerations.” In: World Bank Ed. Vietnam Rice, Farmers and Rural Development: From Successful Growth to Sustainable Prosperity. World Bank, Washington DC.
Le, H.M. Ed. (2007). The General History of Vietnam. Vol. 3. Hanoi: Education Publishing House.
M4P2 (2009). “Improving the Relevance of the TVET System to the Needs of the Private Sector.” Making Markets Work Better for the Poor II, M4P2 Project. Asian Development Bank and United Kingdom Department for International Development.
Markussen, T., Tarp, F., Do, T.H. and Nguyen, T.A.D. (2012). “Inter- and Intra-farm Land Fragmentation in Vietnam.” CIEM Policy Brief 06. Central Institute for Economic Management, Hanoi.
Miller, R.E. and Blair, P.D. (2009). Input-Output Analysis: Foundations and Extensions. Second Edition. Cambridge: Cambridge University Press.
Minot, N. and Goletti, F. (1998). “Export Liberalization and Household Welfare: The Case of Rice in Vietnam.” American Journal of Agricultural Economics, 80 (4): 738–749.
Minot, N. and Goletti, F. (2000). “Rice Market Liberalization and Poverty in Vietnam.” Research Report 114. International Food Research Institute, Washington DC.
Miyazawa, K. (1976). Input-Output Analysis and the Structure of Income Distribution. Lecture Notes in Economics and Mathematical Systems. No. 116. Berlin: Springer Verlag.
Nicita, A., Hoekman, B. and Olarreaga, M. (2005). “Estimating the Effect of Global Trade Reforms.” In: Hoekman, B. and Olarreaga, M. Ed. Doha and Poverty in Low Income Countries. New Haven CT: Yale University Press.
Oosterhaven, J. (1996). “Leontief versus Ghoshian Price and Quantity Models.” Southern Economic Journal, 62 (3): 750–759.
Pham, N.Q., Bui, T. and Nguyen, T.D. (2007). “Economic Performance of Vietnam, 1976–2000: New Evidence from Input-Output Model.” DEPOCEN Working Paper Series No. 2007/13. Development and Policies Research Center, Hanoi.
Sahn, D.E. and Sarris, A. (1991). “Structural Adjustment and the Welfare of Rural Smallholders: A Comparative Analysis from Sub-Saharan Africa. “World Bank Economic Review, 5 (2): 259–289.
ten Raa, T. (2005). The Economics of Input-Output Analysis. Cambridge: Cambridge University Press.
Tran, T.C., Do, H.L. and Le, M.N. (2013). Who Has Benefited From High Rice Prices in Vietnam? Oxfam International, Hanoi.
VFA (2006). “Important Export Growth during 1989-2005 [online].” Vietnam Food Association, Hanoi. Available at:http://www.vietfood.org.vn/vn/newwindow.aspx?n=907
Vo, L.T.T. and Nguyen, S.P. (2011). “Part 1: Analysis of Rice Value Chains in the Red River Delta Region.” Scientific Journal, 19a: 96–108.
