tracking animals with gps - invasive.org · case studies in the use of gps for tracking animals...
TRANSCRIPT

TRACKING ANIMALS WITH GPS
AN INTERNATIONAL CONFERENCE HELD AT THE MACAULAY LAND USE RESEARCH INSTITUTE
ABERDEEN, 12-13 MARCH 2001
Sponsored by:
Lotek Wireless, 115 Pony Drive, Newmarket, Ontario, Canada, L3Y 7B5,TVP Positioning AB,Televilt, Bandygatan 2, 711 34 Lindesberg, Sweden and Vectronic Aerospace GMbH, Carl-Steele-Str. 12, D-12489 Berlin, Germany
ISBN 0 7084 0643 2

CONTENTS
Foreword..................................................................................................................................................................................................piiiIain J Gordon
CASE STUDIES IN THE USE OF GPS FOR TRACKING ANIMALS
Tracking animals with GPS:The first 10 years ......................................................................................................p1Arthur R Rodgers
Evaluating elk habitat interactions with GPS collars ..................................................................................p11Mark A Rumble, Lakhdar Benkobi, Frederick Lindzey and R Scott Gamo
Diurnal and nocturnal habitat use by reintroduced elk in eastern Kentucky,United States ....................................................................................................................................................................................p19Elizabeth G Springborn and David S Meahr
Animal movement and habitat use estimates for moose Alces alces from GPS tracking and satellite images ..............................................................................................................................................p21Holger Dettki and Lars Edenius
GPS tracking and spatial data as a method for studying the use of pastureby reindeer ..........................................................................................................................................................................................p23Jouko Kumpala, Alfred Colpaert and Ulrich Fielitz
The first tracking results from a female free-ranging red deer (Cervus elaphus L.)fitted with GPS collar in Ardenne, Belgium ........................................................................................................p25Alain M Licoppe and Julien Lievens
Performance of store-on-board GPS collars on elk, mule deer and mountain lions in Wyoming, USA ..........................................................................................................................................................................p29Frederick Lindzey, Hall Sawyer, Charles Anderson and Brad Banulis
GPS collars with remote download facilities, for studying the economics of moosehunting and moose-wolf interactions ........................................................................................................................p33Barbara Zimmermann, Torstein Storaas, Petter Wabakken, Knut Nicolaysen, Ole Knut Steinset, Micheal Dötterer, HegeGundersen and Harry Petter Andreassen
Using GPS to study the effect of human disturbance on the behaviour of red deerstags on a highland estate in Scotland ......................................................................................................................p39Angela M Sibbald, Russell J Hooper, Iain J Gordon and Stewart Cumming
A GPS-assisted approach to measuring fine-scale foraging patterns of small mammals ..............................................................................................................................................................................................p45A D Kliskey and A E Byrom
i

GPS PRACTICALITY AND PROGRESS
GPS and its use in animal telemetry:The next five years ......................................................................p51Ian A R Hulbert
Evaluation of GPS technology for tracking mountain ungulates:VHF transmitters or GPS collars? ................................................................................................................................................................................p61Ruedi Haller, Flurin Filli and Stephan Imfeld
Establishing GPS technology in the ungulate research project in the Swiss National Park - first results ................................................................................................................................................p67
Ruedi Haller and Flurin Filli
GPS performance in a temperate forest environment ............................................................................p69Georges Janeau, Christophe Adrados, Jean Joachim and Dominique Pépin
Is it still necessary to use GPS in differential mode since the elimination of Selective Availability? ................................................................................................................................................................p73Georges Janeau, Christophe Adrados and Irène Girard
Measuring diet composition and food intake by moose in the Swedish boreal forest: integrating GPS and faecal marker technologies ..........................................................................p77Robert W Mayes, Glenn Iason, Neil White and Thomas Palo
Analysis and application of fine scale movement data ..............................................................................p81Patrick A Zollner
HRE:The home range extension for ArcviewTM ................................................................................................p83Arthur P Rodgers and Angus P Carr
Virtual fencing - a prescription range animal management tool for the ................................p8521st centuryDean M Anderson
A very lightweight flight recorder for homing pigeons based on GPS ......................................p95Karen von Hünerbein and Eckhard Rüter
High performance GPS collars, use of the latest available technology ......................................p97Robert Schulte and Ulrich Feilitz
GPS solutions from Lotek Wireless - a new approach to wildlife research ........................p103
Discover the full power of GPS with Televilt GPS collars ....................................................................p107
List of delegate names and addresses ....................................................................................................................p111
ii

FOREWORD
Understanding the factors determining the distribution and movements of animals around the landscape is a majorobjective for scientists, conservationists and natural resource managers alike. It is only through developing thisknowledge that animal populations will be managed to meet conservation, sporting or natural heritage objectives.Scientists have long battled with the logistics of gathering information on the movement and distribution ofindividuals and populations, often relying on tedious visual observation or VHF technology to gather data. Havingspent some time tracking Chilean huemul (Hippocamelus bisulcus), an endangered deer native to the Andes of Chile,using conventional VHF radio tracking, I can vouch for the limitations of the data, from e.g. disturbing the animaland only being able to track during the day because of the difficulty of the terrain. The advent of the developmentof Global Positioning Satellite (GPS) technology has offered the opportunity to overcome a number of theselimitations. However, whilst there has been a growing interest in the use of GPS amongst biologists, there has onlybeen limited uptake to date. In part this reflects the expense of the units and the weight of the battery supply which,until recently, has prohibited the use of collars except for large animals. However, it also reflects the lack ofinformation available to biologists as to what equipment is available and the experiences of others in its use.
We, at the Macaulay Institute, are interested in the ecological determinants of habitat use by wild and domesticspecies, in order to predict the economic and environmental consequences of adopting different animal managementstrategies. In the mid-1990s we took the decision to invest in GPS collars to help with a project to measure the impactof visitor access on the movement patterns of red deer in the Highlands of Scotland. Having deployed the collars, weran into a number of teething problems which, we now know, other researchers were also experiencing. We felt veryisolated at the time and from that isolation grew the incentive to establish a network of GPS users who could shareexperience and information about the latest developments etc. The conference on Tracking Animals with GPS, heldat The Macaulay Institute in Aberdeen, Scotland, on the 12th and 13th of March 2001, was one of our contributionsto the development of that network and the flow of information. In the workshop we wished not only to hear whatbiologists have been doing with GPS, but also to hear what they wanted from the technology in the future. Weinvited a few of the major manufacturers of GPS collars for wildlife tracking to attend the conference so that theycould hear first hand what biologists want from the technology and also to tell the researchers what technology is indevelopment.
The conference was extremely well attended and offered a forum of lively debate, which should continue on the GPSForum e-mail: [email protected]. Hopefully, this conference will not be a one off, but will be the first in a series.I expect that in future workshops we will see a move away from discussions on the limitations of the technologytowards discussions of the academic and practical value of the information produced by GPS technology.
Iain J Gordon 10 July 2001
iii

TRACKING ANIMALS WITH GPS:THE FIRST 10 YEARS
Arthur R. Rodgers
Ontario Ministry of Natural Resources, Centre for Northern Forest Ecosystem Research, Thunder Bay, Ontario,Canada P7B 5E1
INTRODUCTION
The growth of environmental awareness and public concern for wildlife that began in the 1980s has continued intothe 21st century. Large-scale alterations of the landscape such as hydroelectric development, or the cumulative effectsof timber extraction over many years, have continued the demand for high-quality studies of impacts on wildlife andtheir habitats. Many resource agencies have shifted their management approach to a landscape scale to address issuessuch as conservation of biodiversity and habitat fragmentation. To overcome some of the limitations of existingtechnology and provide the detailed information required by studies undertaken to address environmental concernsand evaluate new policies, telemetry systems based on the Global Positioning System (GPS) were developed in the1990s.
Since commercial development of GPS-based telemetry systems for tracking animals began in 1991, a variety ofconfigurations have been designed for use by researchers in different situations. In addition, numerous improvementshave been made to the size and performance of GPS systems and their cost has been dramatically reduced. Theenormous quantities of data generated by these systems clearly present a challenge to data management and analyticalprocedures. Given the variety of configurations and features of current GPS systems, researchers must carefully planand select an appropriate system to address particular biological issues. In this paper I will provide a historicaloverview of the development of GPS-based telemetry systems and the operating features of the various configurationscurrently available to researchers. I will also describe the improvements in cost, size and performance that have beenachieved in the first 10 years since their initial development. I will attempt to identify the key issues that researchersmust consider in selecting an appropriate system to meet their research objectives. Lastly, I will consider theimplications for data management and analysis resulting from the quality and quantity of data attainable from GPS-based telemetry systems.
EARLY DEVELOPMENT
In 1988 the Ontario Ministry of Natural Resources (OMNR) introduced Timber Management Guidelines for theProvision of Moose Habitat as part of a 20-year programme to increase the provincial moose (Alces alces) populationfrom 80,000 to 160,000 animals by the year 2000 (OMNR 1988). The guidelines assist forest and wildlife managersin maintaining or creating, through timber harvesting, the diversity of age classes and species of vegetation thatprovide habitat suitable for moose. The guidelines include specific recommendations concerning the size anddistribution of harvested areas, as well as protecting key features required by moose. In general, application of theguidelines in the Boreal Forest Region of Ontario will maintain the distance to cover for moose at about 200 m.Specific life history requisites of moose such as aquatic feeding areas, mineral licks and calving sites, are additionallyprotected by a 120-m reserve.
To examine the effectiveness of the guidelines and provide increased understanding of timber management effects onmoose populations, the OMNR established the Moose Guidelines Evaluation Project (MGEP) in 1989. The mainobjective of MGEP is to compare habitat use and condition of moose in forest areas where timber has been harvestedaccording to the guidelines and areas harvested by other forestry practices. Initial plans recommended monthly aerialtracking of at least 30 moose fitted with conventional VHF radio collars in each harvest type for 5 years on a studyarea 100 x 100 km in size (Rodgers et al. 1995). To obtain the degree of accuracy needed to evaluate some of thespecific guideline recommendations, 20 of the 60 collared moose would be intensively monitored by ground trackingto obtain their locations 100-150 times each year. The OMNR recognized early in the project that procuringsufficient radio tracking data would be very difficult and costly. There was a clear need for innovation and evaluationof alternative approaches.
An assessment of potential telemetry systems available in the late 1980s was undertaken to identify the mostappropriate technology to meet MGEP requirements. Conventional VHF-based telemetry systems were compared
1

with VHF Omni-directional Ranging (VOR) and Doppler systems, LORAN-C and inverse LORAN systems, spreadspectrum approaches and various satellite systems, including GPS. Of these, a tracking system based on theNAVSTAR GPS was identified as the most efficient and cost-effective way to meet the needs of MGEP. GPS-basedtelemetry systems have the potential to collect large amounts of high quality location data (i.e., errors ≤10 m) withgreat precision (i.e., low variance), 24-hours per day and under all weather conditions, overcoming importantlimitations of conventional VHF-based telemetry (Rodgers et al. 1996). Data are readily imported to a geographicinformation system (GIS) and have the advantage of maintaining the same spatial resolution as habitat mapping dataderived from satellite imagery (e.g., the 30-m resolution of Landsat-5 TM data). Since data are recordedautomatically, human operator errors are minimized and fewer aircraft over-flights are required to obtain animallocations, dramatically reducing overall costs.
In 1992, the OMNR, several Canadian hydroelectric utilities and the Canadian Electrical Association contractedLotek Engineering Inc. (Newmarket, Ontario, Canada) to design and develop a wildlife telemetry system based onGPS (Rodgers and Anson 1994). In co-operation with Hydro Québec and the Québec government, prototype animalunits were placed on wild caribou (Rangifer tarandus) for the first time at the La Grande reservoir in northern Québecduring March 1993. These initial field tests provided valuable information on several operational issues that wererefined in subsequent production units. In February 1994 the first commercial GPS collars were again deployed oncaribou in northern Québec, and for the first time on moose in the MGEP study area in northwestern Ontario(Rodgers et al. 1995, 1996, 1997). Field trials were also undertaken in a tree nursery to determine the performanceof animal units under controlled canopy conditions (Rempel et al. 1995). Results of these early tests verified thepotential of GPS-based telemetry systems to meet the needs of detailed habitat-resource utilization studies of wildlifeand led to further refinements in production units. In February 1995, GPS collars were deployed on 60 adult femalemoose in the MGEP study area in northwestern Ontario.
CURRENT SYSTEMS
GPS units attached to animals store data such as geographic coordinates, or GPS measurements, i.e. "pseudoranges"and satellite identification numbers from which coordinates can be calculated following "differential correction",dates and times of location estimates and optional sensor information, until they can be retrieved. Three data retrievaloptions were considered during the development of the first GPS units in the early 1990s: (1) store data on boarduntil the unit can be remotely released by a radio-activated "break-away" mechanism or recovered by recapture of theanimal; (2) transmit stored data for retrieval by secondary low earth orbit (LEO) satellite link; or (3) transmit storeddata through a local, user-controlled communication link (Rodgers and Anson 1994; Rodgers et al. 1996, 1998). Allof these configurations are now available for use by researchers in different situations.
Local Communication Link
The first GPS-based telemetry system developed by Lotek Engineering used a local point-to-point communicationlink for data retrieval (Rodgers and Anson 1994; Rodgers et al. 1995, 1996). This option was selected primarilybecause it provides 2-way communication, allowing retrieval of data and diagnostic information (e.g., batterycondition, memory use, etc.), as well as rescheduling of the duty cycle (e.g., changing the number of fixesattempted/day, changing the ratio of day to night fixes, etc.) at the user's convenience. The system consists of remoteGPS units carried by study animals and a "command" unit controlled through a laptop computer operating from avehicle or aircraft. UHF radio modems in both the animal units and the command unit provide the communicationlink within a range of 15 km (ground-to-air). The modem receiver in each animal unit is turned on at specifiedintervals of a unique schedule, in anticipation of a signal from the command unit. When a signal is detected, theanimal unit sends a response in its unique time slot and a communication link may be established. Precise timing ofevents is possible because the animal and command units have identical GPS receivers that provide an absolute timereference obtained from the GPS satellites. Once a communication link has been established, the animal unittransmits its last recorded position, providing a general reference point for navigation during the communicationsession. The laptop computer controls the transmission of data and diagnostic information. After all of theinformation has been received and stored by the computer, the random access memory of the animal unit can becleared and the communication link can be closed.
In addition to a GPS receiver, animal collars are equipped with a standard VHF radio beacon that can be used tolocate animals with conventional direction-finding techniques (Rodgers and Anson 1994; Rodgers et al. 1995, 1996).With an operating range of 15 km (ground-to-air), the VHF beacon provides further navigation support duringcommunication sessions. If the collar's main operating system fails due to battery exhaustion or some other cause, an
2

independent emergency power source for the VHF beacon allows it to serve as an emergency locator for about 90days. A dual-axis motion sensor and a wide-range temperature transducer are also incorporated into animal units.Thus, data stored by each unit include geographic coordinates, date and time of each fix attempt, GPS fix type (i.e.,2- or 3-dimensional) and associated horizontal dilution of precision (an indicator of fix quality), as well as sensorinformation. The first units had a data storage capacity of 3,640 records but did not store GPS measurementsnecessary for differential correction of position estimates (i.e., pseudoranges and satellite identification numbers). Asecond version of these animal units, capable of storing the information necessary for differential correction, wasdeveloped later and has a data storage capacity of 1,680 records.
The operating life of GPS collars is determined primarily by the duty cycle and the size of the battery pack used.However, the first units developed possess a variety of additional power management strategies to extend operatinglife. For example, the modem and VHF beacon can be programmed to turn off during periods when communicationsessions are unlikely (e.g., at night). Clearing the animal unit's memory after data have been transferred and storedremoves redundancy in subsequent communication sessions and increases life expectancy. Scheduling GPS fixes ≤ 4hours apart, whether required or not, alleviates the need for the receiver to acquire new satellite ephemeris data (i.e.,an "almanac"), which can take up to 12 minutes and consume substantial energy. Employing strategies such as these,the first GPS animal units were fitted with a 400 g lithium battery pack that was expected to provide 1 year ofoperation at 8 fix attempts per day (i.e., every 3 hours) with VHF beacon and modem functions available 16hours/day (Rodgers et al. 1995, 1996). A larger, 700g battery pack, expected to provide 2 years of operation was alsoavailable. Based on early field trials (Rodgers et al. 1995, 1998), the life expectancies of these units was downgradedand the small battery pack is now expected to provide 268 days of service at 6 fixes/day (i.e., every 4 hours), whilethe large battery pack may provide 575 days with the same fix schedule. The total weight of these GPS animal units,which were originally designed for caribou and moose, is 1.8 kg with the small battery pack and 2.2 kg with the largebattery pack.
The next GPS-based telemetry system was developed by TVP Positioning AB (Lindesberg, Sweden) and alsoprovided a local communication link to retrieve data stored on animal units. In this system animal units continuouslybroadcast stored data through individual pulse-coded VHF signals to a receiver and data logger during preset timeperiods. Thus, the VHF transmitter functions as both a direction-finding beacon and a radio link for data transfer.The data transmission range when operating on the ground is about 1-5 km and increases to 15-25 km whenoperated from an aircraft. Stored data include geographic coordinates, dates and times of location estimates, sensorinformation (activity and temperature), and battery status. Since communication is unidirectional, the GPS fixschedule and VHF transmission periods must be programmed before units are attached to animals and cannot bechanged without recovery of individual units. Likewise, stored data cannot be cleared from the memory of animalunits after they have been transferred. Consequently, rather than specifying an operational life based on time, theseunits are rated to provide different numbers of records based on battery capacity. The GPS fix schedule and VHFtransmission periods then determine how long a unit will function in the field. Depending on battery size, animalunits are available in a wide range of sizes from 475 g (plus the weight of the collar material), capable of recording2,000 geographic coordinates (i.e., non-differential data), to 1.8 kg (plus the weight of the collar material), capableof recording 15,000 geographic coordinates.
Satellite Link
In the mid-1990s Telonics Inc. (Mesa, Arizona, USA) developed a system that transfers GPS data via the ServiceARGOS satellite system (Rodgers et al. 1997, 1998; Arthur and Schwartz 1999; Schwartz and Arthur 1999; Bennettet al. 2001; Biggs et al. 2001). Collars attached to animals include a standard platform transmitter terminal (PTT)and a GPS receiver, as well as a VHF beacon. Geographic coordinates with associated dates and times are stored andincorporated into the ARGOS data stream transmitted from the PTT to satellites operated by the U.S. NationalOceanic and Atmospheric Administration (NOAA) and then to Service ARGOS ground stations in Landover (USA)or Toulouse (France). Although GPS location data are provided by the system, ARGOS positioning remains availableand can serve as a backup. Since communication is unidirectional, the GPS fix schedule, VHF beacon, and PTTuplink periods must be programmed before units are attached to animals and cannot be changed without recoveryof individual units. As well, because the longest message that can be transferred by the ARGOS system is 32 bytes,GPS data required for differential correction cannot be transmitted and only 5-7 geographic coordinates can be sentin each ARGOS message. However, GPS data required for differential corrections are actually stored on board theanimal unit and can be used when the unit is recovered. In fact, animal units can store up to 5,300 differentiallycorrectable records. Since the PTT continuously transmits the most recent 5-7 geographic coordinates when turnedon, multiple uplinks of the same information can be obtained, ensuring data integrity. On the other hand, since the
3
oldest GPS location stored for transmission is replaced with each new position estimate, some data may not beimmediately available if the PTT fails to successfully transmit recently stored data before they are overwritten. Onceagain, these data are actually stored in the animal unit and can be downloaded when the unit is recovered. So thislimitation may only be important to studies requiring up-to-date, "real time" location estimates. This concern canalso be addressed by using an ARGOS uplink receiver operated locally from a vehicle or aircraft, or configured forautomated remote data logging, to intercept transmissions (within 1 km) from PTTs (Bennett et al. 2001). In thiscase the system has the same limitations as others that use a local communication link for data retrieval.
The operating life of combined GPS-ARGOS devices is largely determined by the GPS fix rate and the size of thebattery pack used, similar to other GPS animal units, but it also depends on the PTT uplink schedule. For example,a large GPS-ARGOS unit having a total weight of 2.2 kg, allowed 90 sec to attempt 1 GPS location/day, and witha 6 hour ARGOS uplink (900 msec every 200 sec) every 5 days (i.e., 6 hours on, 114 hours off ), has an expectedoperating life of 1,315 days. At 5 GPS location attempts/day and a 6-hour ARGOS uplink each day, the expectedoperating life decreases to 327 days. All else being equal, a smaller GPS-ARGOS unit having a total weight of 1.7kg, attempting 1 GPS location/day with a 6 hour ARGOS uplink every 5 days, has an expected operating life of 584days. At 5 GPS location attempts/day and a 6-hour ARGOS uplink each day, the expected operating life of thesmaller unit decreases to 145 days.
Store-On-Board
The last GPS-based telemetry system to be developed is conceptually the simplest. Differentially correctable GPSdata, or geographic coordinates, along with dates and times of location estimates and optional sensor information arestored on board units attached to animals until the device is remotely released by a radio-activated "break-away"mechanism, or recovered by recapture of the animal (Merrill et al. 1998, Arthur and Schwartz 1999, Schwartz andArthur 1999, Bowman et al. 2000). These units are now available in a variety of configurations from several differentmanufacturers of telemetry equipment. The primary reason for their development was to reduce the size of GPS unitsdeployed on animals. By removing data transmission components such as UHF modems or PTTs, the weight ofearlier animal units was reduced by almost 50%, from the 1.7 - 2.2 kg devices used with elk (Cervus elaphus), bears,caribou, and moose, down to 750 - 950 g units that can be used on wolves (Canis lupus) and white-tailed deer(Odocoileus virginianus). More recently, TVP Positioning AB has introduced a line of GPS units weighing 70 - 900g, suitable for deployment on large birds and small to medium-sized mammals. Similar to other telemetry devices,the total package weight of store-on-board GPS units is determined primarily by the size of the battery pack, whichin turn affects the expected operating life. Store-on-board GPS units have large data storage capacities ranging from2,800 - 5,300 differentially correctable GPS records up to 13,900 non-differential geographic coordinates, dependingon the manufacturer. Hence, even though the operating life of store-on-board units might be specified as, forexample, 743 days at 6 GPS fix attempts/day, seldom, if ever, will the entire data storage capacity of a particulardevice be used. Therefore, store-on-board units are better rated on the basis of the numbers of expected GPS fixattempts for a given battery capacity rather than specifying an operational life based on time. When rated this way,the smallest (70 g) store-on-board GPS units are capable of 200 - 425 GPS fix attempts, while the largest (750 - 950g) units are capable of 4,000 - 9,000 GPS fix attempts. Subsequently, the GPS fix schedule and VHF beaconavailability will determine how long a store-on-board GPS unit will actually function in the field.
The VHF beacon availability and GPS fix schedule of store-on-board units must be programmed before devices areattached to animals and cannot be changed without recovery of individual units. The primary role of the VHFbeacon is to aid recovery of units and to serve as an emergency locator if a unit's main operating system fails, due tobattery exhaustion or some other cause. Since store-on-board units do not have a communication link while in thefield, most devices have several VHF beacon modes that indicate the status of individual units. This might consist ofa simple mortality mode, much like other telemetry devices, that decreases the VHF pulse rate after a specified timedelay if an animal does not move. However, much more sophisticated schemes are available in some units that might,for example, indicate that the last GPS fix attempt was successful by emitting a particular sequence of single anddouble "beeps" (Merrill et al. 1998).
To reduce the risk of injury and stress to study animals, as well as lowering capture costs, telemetry manufacturershave equipped store-on-board GPS units with remote release mechanisms. Depending on the manufacturer, theserelease mechanisms may add 20 - 170 g to the total weight of GPS units. In most cases, the mechanism can beprogrammed to activate on a specific time and date within 2 - 3 years of initial deployment. Alternatively, somemechanisms can also be programmed to drop off automatically as the main system battery nears exhaustion (Merrillet al. 1998). In some devices the mechanism is radio-activated and the release can be triggered from distances of upto 1-2 km (Merrill et al. 1998, Bowman et al. 2000). Typically, the VHF beacon pulse rate of store-on-board GPS
4

units with these mechanisms changes following release (e.g., similar to a mortality mode it may decrease) and maycontinue transmitting for several months to facilitate recovery of the device.
SYSTEM IMPROVEMENTS
Cost
Concerns about the price of using GPS telemetry systems continue (Moen et al. 1996, Arthur and Schwartz 1999,Otis and White 1999), yet a growing number of studies suggest they can be cost effective (Rodgers et al. 1996, 1997;Merrill et al. 1998; Schwartz and Arthur 1999; Bennett et al. 2001; Biggs et al. 2001). The development of store-on-board GPS units has not only dramatically reduced the size of GPS units but has also resulted in more than a50% reduction in the cost of using this new technology. Whereas the first commercially available GPS units with alocal communication link were priced at about US$5,000 and current GPS-ARGOS devices cost about US$4,000(Arthur and Schwartz 1999), store-on-board units are currently available for less than US$2,500. This is less thanthe price of a large animal PTT (Merrill et al. 1998, Schwartz and Arthur 1999) and does not have the additionalcosts of data handling that must be paid to Service ARGOS. Similar to other microelectronics, prices are likely todecline further as cheaper components become available, competition increases among manufacturers of telemetryequipment, and initial investments in the development and production of GPS devices are recovered.
Accuracy and Precision
The accuracy of GPS locations is determined primarily by the synchronization of clocks in the receiver and thesatellites that continuously broadcast spread-spectrum radio signals. For reasons of national security, the U. S.Department of Defense has the ability to degrade the accuracy of civilian GPS receivers by incorporatingunpredictable satellite clock and ephemeris (i.e., orbital information) errors into transmissions. This "selectiveavailability" policy can limit the accuracy of horizontal position estimates to within 100 m of their true location 95%of the time (Wells 1986, Rempel et al. 1995). Selective availability is readily overcome, however, by placing areference GPS receiver (often called a "base station") at a surveyed location and recording deviations from the knowncoordinates of the site (Rempel et al. 1995, Moen et al. 1997). Correction factors can then be computed and appliedto fixes obtained from GPS units carried by individuals within 300 km of the base station. This process, referred toas "differential correction", can reduce location errors to ≤ 10 m (Moen et al. 1997, Rempel and Rodgers 1997).
The U. S. Department of Defense discontinued its selective availability policy on May 2, 2000 (Lawler 2000). As aresult, most civilian GPS receivers should be capable of estimating horizontal positions within 20 m of their truelocation 95% of the time (Wells 1986). Differential correction of GPS data may, therefore, no longer be necessaryfor many GPS applications. However, because differential correction can also remove other sources of error, such asunintentional satellite orbit and clock errors as well as ionospheric and tropospheric errors, it may still improve theprecision of location estimates. With selective availability "turned off", the accuracy of differentially corrected GPSdata is ≤ 10 m, 95% of the time, and mean errors of ≤ 5 m are possible (Janeau et al., this volume). Whether or notthis level of precision is required, will depend on the objectives of specific research projects and it may still benecessary to maintain the same spatial resolution as habitat mapping data derived from current satellite imagery (i.e.,the 8-m resolution of Radarsat-1 data or 15-m resolution of Landsat-7 TM data). Eventually, all users should be ableto obtain 1 - 3 m accuracy, or better, when the U. S. Department of Defense adds a second satellite broadcastfrequency in 2003 that will compensate for ionospheric errors and a third frequency in 2006 that will provide evengreater accuracy (Lawler 2000). Potential users of GPS-based telemetry systems should also be aware, however, thateven though the U. S. Department of Defense has discontinued its selective availability policy on a global scale, theyhave retained the ability to selectively disrupt GPS signals on a regional basis when national security is threatened.Thus, researchers in some parts of the world may be advised to collect data amenable to differential correction, evenif they do not need the greater precision, in the event that selective availability is re-instituted in their study region.
Observational Bias
A potentially significant source of error for habitat use-availability studies using GPS-based telemetry systems is thepossibility that GPS fix attempts might be more or less successful in some habitats than others, depending on thecharacteristics of the forest canopy (Rempel et al. 1995, Moen et al. 1997, Johnson et al. 1998, Rettie andMcLoughlin 1999). The possibility of such observational bias does not seem to have been given serious considerationuntil GPS-based telemetry systems were developed (Johnson et al. 1998). Yet other telemetry systems, such asARGOS PTTs, have a similar potential for observational bias because transmitted radio signals would also have
5
difficulty reaching receivers through forest canopy or might be affected by terrain, resulting in animals goingundetected in some habitats (North and Reynolds 1996). Even conventional tracking of VHF radio signals might bebiased, since this can usually be done only during daylight hours and under appropriate weather conditions (Beyerand Haufler 1994, Rodgers et al. 1996, Arthur and Schwartz 1999, Schwartz and Arthur 1999). VHF telemetrymight also bias results if persistent harassment of study animals caused them to change their normal movement orbehaviour patterns (White and Garrott 1990, Schwartz and Arthur 1999). In fact, it could be argued that GPS-basedtelemetry systems have less potential for observational bias than conventional VHF methods because GPS fixattempts can be made 24 hours/day and under all weather conditions without direct disturbance of study animals(Arthur and Schwartz 1999, Schwartz and Arthur 1999). In addition, the likelihood of obtaining at least a few fixesin seldom used habitats is much greater with GPS systems because fix attempts are made far more frequently(typically ≤ 4 hours apart) than with other systems (sometimes once/day but usually 1-2 times/week). Nonetheless,observational bias is a potentially serious source of error that must be given due consideration in all habitat use-availability studies.
Field trials of the first GPS units, under controlled canopy conditions, demonstrated observation success rates of 97%in the open and ranged from 10 to 92% in pure stands of various boreal forest tree species (Rempel et al. 1995).Moen et al. (1996) obtained similar results (95% in the open and 60-70% under canopy) in a separate study. Rempelet al. (1995) attributed differences in observation rates among forest types to differences in canopy closure and, morespecifically, the density of thick, woody material that can interfere with signal transmission. The observation rates ofsecond generation GPS units improved to 100% in the open and ranged from 71 to 97% in the same forest stands(Rempel and Rodgers 1997). In the MGEP study area, observation rates of units on free-ranging moose improvedmarginally from an average of 66% (Rodgers et al. 1995) to 69% (Rodgers et al. 1998) with the second generationof the device. Dussault et al. (1999) found almost identical observation rates (68.9%) using the same version of GPScollars on free-ranging moose in Québec, and Edenius (1997) recorded slightly higher rates (75%) in Sweden.Devices with different GPS receivers, such as GPS-ARGOS units deployed on elk (69%; Biggs et al. 2001), or store-on-board units on bears (67%; Schwartz and Arthur 1999), wolves, and white-tailed deer (70%; Merrill et al. 1998)have recorded very similar mean observation rates. The observation rates of the GPS units on moose in the MGEPstudy diminished from 69 to 62% over their first 3 years of deployment, then dramatically increased to 75% in theirfourth year with yet another enhanced GPS receiver. Most recently, GPS units on moose recorded averageobservation rates of 98% during their first 7 months of deployment in 2000. Improvements in the observationsuccess rates of GPS units over the last 10 years are the result of better search algorithms in GPS receivers, that allowthem to acquire satellite signals more rapidly than earlier versions, thereby increasing the likelihood of a successfulfix attempt within an allotted time. Observation bias may never be entirely eliminated from GPS-based telemetrysystems, but it certainly appears that this source of error can be minimized and could be less significant than withother telemetry systems.
IMPLICATIONS FOR RESEARCH AND ANALYSIS
The variety of GPS system configurations now available to researchers makes it possible to apply the technology tomost resource selection studies of mammals and some large birds. As always, size of animal units and cost are the keyissues that researchers must consider in selecting an appropriate system to meet their research objectives. However,attention must also be given to the operating life, accuracy of locations, and sampling intensity offered by differentsystems. Whereas those studying birds or small and medium-sized mammals may be restricted by size to store-on-board GPS units, researchers working with large mammals may select from all available configurations. If largemammal data are required in "real time", then GPS-ARGOS units may be the best choice. If data are required lessfrequently or users need the flexibility to alter duty cycles during the course of a study, then GPS units with a localcommunication link may be appropriate. If researchers can wait for their data until study animals are recaptured,then store-on-board GPS units may be suitable. Whichever configuration is selected, researchers must recognize thatGPS-based telemetry is not a panacea and the technology employed in a particular study must be matched againstobjectives.
Although GPS systems have been commercially available for more than 7 years and significant improvements inperformance have been made, the technology must still be considered relatively "new". As such, researchers must beprepared to accept the consequences of premature system failures. They must plan accordingly and make allowancesfor the possible effects of reduced sample sizes in their experimental design. Potential users of GPS systems must resistthe lure of the technology because it is currently "in vogue" or "prestigious" when study objectives can be met moreefficiently with proven systems (Ballard et al. 1995). If the accuracy or sampling intensity of a GPS system is notrequired to meet study objectives, then less expensive and more reliable methods should be used. If a GPS system is
6

selected, then researchers must also be prepared to undertake the higher costs associated with this new technologyand resist the temptation to reduce replication or sampling intensity to save money. Too often, economic concernsrather than firm scientific and statistical principles determine the quality of wildlife studies, and consequently theirvalue (Rodgers et al. 1996). Researchers must strive to develop a robust experimental design to meet their researchobjectives and they must commit themselves to seeing it through. Once that is achieved, they can select a suitabletelemetry system and begin to estimate costs.
During the planning of a study researchers must identify the analytical and statistical procedures they will use tounderstand and interpret their data. GPS-based telemetry systems have the capacity to record enormous amounts ofhighly accurate animal location data, that could present a serious challenge to data management and analysis. Untilrecently, most computer software programs commonly used to analyze animal location data could accept a maximumof 500 position estimates, and only a few could handle 3,000 sets of points (Larkin and Halkin 1994, Lawson andRodgers 1997). These limits are readily exceeded by GPS systems that may record several thousand locations peranimal per year (Rodgers et al. 1996). Some of these earlier programmes have now been upgraded to deal with largerdata sets and to interface with GIS software which is designed to handle large amounts of geographic location data.There have also been a few new analysis programs developed entirely within a GIS framework (Hooge andEichenlaub 1997, Rodgers and Carr 1998). However, little has been done to explore the potential application ofpowerful temporal and spatial statistical algorithms, now available in most GIS software, to analyses of animallocation data. Advances in computer technology have lowered costs, reduced processing time, improved userinterfaces, and provided better statistical and analytical algorithms, all of which makes it attractive for researchers tomake greater use of a GIS to interpret their data and develop new analytical methods (e.g., Ostro et al. 1999, Rettieand McLoughlin 1999).
Ten years ago both White and Garrott (1990) and Kenward (1992) outlined the features that should be incorporatedinto a data analysis system for animal location data. A fully functional system has yet to be developed. In part,progress has been stalled because researchers cannot agree on which analytical methods are most appropriate andbecause new methods are being developed at an increasing rate in response to new technology. Unfortunately, thishas produced such a wide variety of analytical techniques and computer software that comparisons among, and evenwithin, research studies may be invalid or misleading (Lawson and Rodgers 1997). Wildlife researchers still need todevelop a comprehensive data analysis system for animal location data.
GPS systems may allow researchers to improve their discrimination of habitats used and not used by animals, becausethey provide highly accurate position estimates that have the same or better spatial resolution as habitat mappingdata, such as that derived from satellite imagery (Rempel et al. 1995, Rempel and Rodgers 1997). As a result, thereis less chance of incorrectly assigning animal locations to habitat categories when these data are plotted on a habitatmap in a GIS. However, GPS data also have inherent sources of error. Most of the time these errors may be smallrelative to habitat patch size but there is still potential for GPS errors to overlap more than one habitat category. Onepossible solution is to place circular buffers around point locations with a radius greater than or equal to the known(e.g., from GPS units placed at surveyed points in different habitat types) or expected GPS errors (e.g., 10 m fordifferentially corrected data or 20 m for non-differential data). The composition of habitats within buffers can thenbe used to determine selection. This approach is consistent with many of the methods previously used in habitat-selection analyses (Aebischer et al. 1993, Manly et al. 1993, Arthur et al. 1996), as well as the latest techniques basedon discrete choice models (Cooper and Millspaugh 1999). Through examination of changes in habitat composition,circular buffers of varying size may also be used to determine the spatial scale at which individuals select habitats,thereby providing essential information for resource management (Lehmkuhl and Raphael 1993, Thome et al. 1999).
In recent years, several authors have suggested that estimation with confidence intervals might be a more appropriatemethod of comparing use-availability data than statistical tests of hypotheses (Steidl et al. 1997, Cherry 1998,Johnson 1999). Due to the large sample sizes that can be obtained with GPS-based telemetry systems, the standarderrors associated with these confidence intervals may be minimized, thereby providing better estimates andfacilitating such comparisons of use-availability data. Ultimately, the quality and quantity of data that can beobtained with GPS systems may allow researchers to place more emphasis on the biological rather than statisticalsignificance of their location data and perhaps more testing of scientific as opposed to statistical hypotheses (Cherry1998, Gerard et al. 1998, Johnson 1999).
Although GPS-based telemetry systems can acquire large amounts of location data, their capabilities cannot solve theproblem of replication requirements in statistical analyses. Since most studies are concerned with making inferencesabout populations of animals, increasing the number of location estimates for individuals does not solve replicationproblems. In most hypothesis testing of resource selection the appropriate sampling unit is the animal, not the
7

individual locations (Otis and White 1999). As a result, the number of individual animals tracked has more effecton inferences that may be drawn from a particular telemetry study than the number of locations obtained per animal.In fact, collecting too many locations for individuals may cause problems because autocorrelation (i.e., locationstaken too closely in time for them to be statistically independent) can lead to negatively biased estimates of homerange size (Swihart and Slade 1985). On the other hand, several studies suggest that the number of location estimatesobtained per animal may be more important than their independence (Reynolds and Laundre 1990, Minta 1992,McNay et al. 1994, Swihart and Slade 1997, Otis and White 1999, Seaman et al. 1999). Concerns aboutautocorrelation might also be mitigated if researchers collect a representative sample of locations during a specifictime frame and limit their inferences accordingly (Otis and White 1999).
CONCLUSIONS
Most of the problems experienced during the development of GPS-based telemetry systems in their first 10 yearswere also encountered during the development of earlier telemetry systems, such as ARGOS PTTs. Nonetheless, GPSsystems have evolved rapidly to address concerns about their size, cost, and performance. With respect to size, GPSunits attached to animals have been reduced to as little as 70 g through the development of store-on-board units thatuse "EPROMs and chipsets", rather than commercially available GPS boards, to determine locations. Weightreductions of the largest GPS units are also likely, as telemetry manufacturers incorporate the latest commerciallyavailable GPS boards with less than half the voltage requirements of existing devices. This could reduce the size ofthe power supply, and hence GPS units, by at least 50%. On the other hand, the number of GPS position estimatesobtained or the operating life of present GPS units could be almost doubled. Along with reductions in size, the costof GPS systems has also declined by more than 50% and further decreases are likely. The accuracy and precision oflocation estimates has improved 10-fold since the first GPS-based telemetry systems were introduced and even greateraccuracy may be achieved in the next few years. New systems may be developed to transfer GPS data using currentstrategies, but the next generation of GPS systems will probably make use of local cellular phone networks for datatransmission. In spite of all the progress that has been made, and future developments, researchers must keep in mindthat technology such as GPS is simply a tool and cannot substitute for good science. Used judiciously, GPS-basedtelemetry systems have the potential to set new standards in future resource utilization studies of wildlife.
REFERENCES
Aebischer, N. J., P. A. Robertson, and R. E. Kenward. 1993. Compositional analysis of habitat use from animal radio-tracking data. Ecology 74:1313-1325.
Arthur, S. M., B. F. J. Manly, L. L. McDonald, and G. W. Garner. 1996. Assessing habitat selection when availabilitychanges. Ecology 77:215-227.
Arthur, S. M., and C. C. Schwartz. 1999. Effects of sample size on accuracy and precision of brown bear home rangemodels. Ursus 11:139-148.
Ballard, W. B., D. J. Reed, S. G. Fancy, and P. R. Krausman. 1995. Accuracy, precision, and performance of satellitetelemetry for monitoring wolf movements. Pages 461-467 in L. N. Carbyn, S. H. Fritts, and D. R. Seip, editors.Ecology and conservation of wolves in a changing world. Canadian Circumpolar Institute, University of Alberta,Edmonton, Canada.
Bennett, K. D., J. R. Biggs, and P. R. Fresquez. 2001. Determination of locational error associated with globalpositioning system radio collars in relation to vegetation and topography. Western North American Naturalist: inpress.
Beyer, D. E., Jr., and J. B. Haufler. 1994. Diurnal versus 24-hour sampling of habitat use. Journal of WildlifeManagement 58:178-180.
Biggs, J. R., K. D. Bennett, and P. R. Fresquez. 2001. Relationship between home range characteristics and theprobability of obtaining successful global positioning system (GPS) collar positions for elk in New Mexico. WesternNorth American Naturalist: in press.
Bowman, J. L., C. O. Kochanny, S. Demarais, and B. D. Leopold. 2000. Evaluation of a GPS collar for white-taileddeer. Wildlife Society Bulletin 28:141-145.
Cherry, S. 1998. Statistical tests in publications of The Wildlife Society. Wildlife Society Bulletin 26:947-953.
8

Cooper, A. B., and J. J. Millspaugh. 1999. The application of discrete choice models to wildlife resource selectionstudies. Ecology 80:566-575.
Dussault, C., R. Courtois, J-P. Ouellet, and J. Huot. 1999. Evaluation of GPS telemetry collar performance forhabitat studies in the boreal forest. Wildlife Society Bulletin 27:965-972.
Edenius, L. 1997. Field test of a GPS location system for moose (Alces alces) under Scandinavian boreal conditions.Wildlife Biology 3:39-43.
Gerard, P. D., D. R. Smith, and G. Weerakkody. 1998. Limits of retrospective power analysis. Journal of WildlifeManagement 62:801-807.
Hooge, P. N., and B. Eichenlaub. 1997. Animal movement extension to ArcView, ver. 1.1. Alaska Biological ScienceCenter, U.S. Geological Survey, Anchorage, Alaska, USA.
Johnson, B. K., A. A. Ager, S. L. Findholt, M. J. Wisdom, D. B. Marx, J. W. Kern, and L. D. Bryant. 1998.Mitigating spatial differences in observation rate of automated telemetry systems. Journal of Wildlife Management62:958-967.
Johnson, D. H. 1999. The insignificance of statistical significance testing. Journal of Wildlife Management 63:763-772.
Kenward, R. E. 1992. Quantity versus quality: programmed collection and analysis of radio-tracking data. Pages 231-246 in I. G. Priede and S. M. Swift, editors. Wildlife telemetry: remote monitoring and tracking of animals. EllisHorwood, West Sussex, U.K.
Larkin, R. P. and D. Halkin. 1994. A review of software packages for estimating animal home ranges. Wildlife SocietyBulletin 22:274-287.
Lawler, A. 2000. Scientists gain access to sharper GPS signal. Science 288:783.
Lawson, E. J. G., and A. R. Rodgers. 1997. Differences in home-range size computed in commonly used softwareprograms. Wildlife Society Bulletin 25:721-729.
Lehmkuhl, J. F. and M. G. Raphael. 1993. Habitat pattern around Northern Spotted Owl locations on the OlympicPeninsula, Washington. Journal of Wildlife Management 57:302-315.
Manly, B. F. J., L. L. McDonald, and D. L. Thomas. 1993. Resource selection by animals: statistical design andanalysis for field studies. Chapman and Hall, London, U.K.
McNay, S. R., J. A. Morgan, and F. L. Bunnell. 1994. Characterizing independence of observations in movementsof Columbian Black-tailed deer. Journal of Wildlife Management 58:422-429.
Merrill, S. B., L. G. Adams, M. E. Nelson, and L. D. Mech. 1998. Testing releasable GPS radiocollars on wolves andwhite-tailed deer. Wildlife Society Bulletin 26:830-835.
Minta, S. C. 1992. Tests of spatial and temporal interaction among animals. Ecological Applications 2:178-188.
Moen, R., J. Pastor, Y. Cohen, and C. C. Schwartz. 1996. Effects of moose movement and habitat use on GPS collarperformance. Journal of Wildlife Management 60:659-668.
Moen, R., J. Pastor, and Y. Cohen. 1997. Accuracy of GPS telemetry collar locations with differential correction.Journal of Wildlife Management 61:530-539.
North, M. P., and J. H. Reynolds. 1996. Microhabitat analysis using radiotelemetry locations and polytomouslogistic regression. Journal of Wildlife Management 60:639-653.
(OMNR) Ontario Ministry of Natural Resources. 1988. Timber Management Guidelines for the Provision of MooseHabitat. Queen's Printer for Ontario, Toronto, Ontario, Canada.
Ostro, L. E. T., T. P. Young, S. C. Silver, and F. W. Koontz. 1999. A geographic information system method forestimating home range size. Journal of Wildlife Management 63:748-755.
Otis, D. L., and G. C. White. 1999. Autocorrelation of location estimates and the analysis of radiotracking data.Journal of Wildlife Management 63:1039-1044.
9

Rempel, R. S., and A. R. Rodgers. 1997. Effects of differential correction on accuracy of a GPS animal locationsystem. Journal of Wildlife Management 61:525-530.
Rempel, R. S., A. R. Rodgers, and K. F. Abraham. 1995. Performance of a GPS animal location system under borealforest canopy. Journal of Wildlife Management 59:543-551.
Rettie, W. J., and P. D. McLoughlin. 1999. Overcoming radiotelemetry bias in habitat-selection studies. CanadianJournal of Zoology 77:1175-1184.
Reynolds, T. D., and J. W. Laundre. 1990. Time intervals for estimating pronghorn and coyote home ranges anddaily movements. Journal of Wildlife Management 54:316-322.
Rodgers, A. R., and P. Anson. 1994. Animal-borne GPS: tracking the habitat. GPS World 5:20-32.
Rodgers, A. R., and A. P. Carr. 1998. HRE: the home range extension for ArcView. Centre for Northern ForestEcosystem Research, Ontario Ministry of Natural Resources, Thunder Bay, Ontario, Canada.
Rodgers, A. R., R. S. Rempel, and K. F. Abraham. 1995. Field trials of a new GPS-based telemetry system. Pages173-178 in C. Cristalli, C. J. Amlaner, Jr., and M. R. Neuman, editors. Biotelemetry XIII. Proceedings of theThirteenth International Symposium on Biotelemetry. March 26-31, 1995. Williamsburg, Virginia, USA.
Rodgers, A. R., R. S. Rempel, and K. F. Abraham. 1996. A GPS-based telemetry system. Wildlife Society Bulletin24:559-566.
Rodgers, A. R., R. S. Rempel, R. Moen, J. Paczkowski, C. Schwartz, E. J. Lawson, and M. J. Gluck. 1997. GPScollars for moose telemetry studies: a workshop. Alces 33:203-209.
Rodgers, A. R., S. M. Tomkiewicz, E. J. Lawson, T. R. Stephenson, K. J. Hundertmark, P. J. Wilson, B. N. White,and R. S. Rempel. 1998. New technology for moose management: a workshop. Alces 34:239-244.
Schwartz, C. C., and S. M. Arthur. 1999. Radio-tracking large wilderness mammals: integration of GPS and ARGOStechnology. Ursus 11:261-274.
Seaman, D. E., J. J. Millspaugh, B. J. Kernohan, G. C. Brundige, K. J. Raedeke, and R. A. Gitzen. 1999. Effects ofsample size on kernel home range estimates. Journal of Wildlife Management 63:739-747.
Steidl, R. J., J. P. Hayes, and E. Schauber. 1997. Statistical power analysis in wildlife research. Journal of WildlifeManagement 61:270-279.
Swihart, R. K., and N. A. Slade. 1985. Influence of sampling interval on estimates of home-range size. Journal ofWildlife Management 49:1019-1025.
Swihart, R. K., and N. A. Slade. 1997. On testing for independence of animal movements. Journal of Agricultural,Biological, and Environmental Statistics 2:1-16.
Thome, D. M., C. J. Zabel, and L. V. Diller. 1999. Forest stand characteristics and reproduction of Northern SpottedOwls in managed north-coastal California forests. Journal of Wildlife Management 63:44-59.
Wells, D. E., editor. 1986. Guide to GPS positioning. Canadian GPS Associates, Fredericton, New Brunswick,Canada.
White, G. C., and R. A. Garrott. 1990. Analysis of wildlife radio-tracking data. Academic Press, San Diego,California, USA.
10

EVALUATING ELK HABITAT INTERACTIONS WITH GPSCOLLARS
Mark A. Rumble1, Lakhdar Benkobi2, Fredrick Lindzey3 and R. Scott Gamo1
1 USDA Forest Service, Rocky Mountain Research Station, 501 East St. Joe, Rapid City, SD 577012 Department of Rangeland Ecosystem Science, Colorado State University, Fort Collins, CO 805263 USGS, Wyoming Cooperative Fish and Wildlife Research Unit, University of Wyoming, Box 3166, Laramie,
WY 82071, USA
ABSTRACT
Global positioning systems (GPS) are likely to revolutionize animal telemetry studies. GPS collars allow biologists tocollect systematically scheduled data when VHF telemetry data is difficult or impossible to collect. Past studies haveshown that the success of GPS telemetry is greater when animals are standing, or in open habitats. To make effectiveuse of GPS telemetry, biologists need to understand its advantages and disadvantages. Our objectives are to comparedata from GPS and VHF telemetry, present data on the use of activity sensors for estimating behavior and show thatunsuccessful GPS fix attempts can provide insights into the biology of elk. We placed two GPS telemetry collars,capable of remote transmission of data to a command unit, and 44 VHF telemetry collars on adult female (cow) elk(Cervus elaphus). The GPS collars were programmed to take three fixes, three days each week. These GPS collars didnot operate properly. In February 2000, we placed four store-on-board GPS collars from a different manufacturer oncow elk. These collars were programmed to collect 6 - 12 locations each day, with drop-off mechanisms set forDecember 1, 2000. The average success in acquiring fixes was 88%, with 70% 3D locations. Each GPS collarcollected more locations of elk than were obtained by three technicians working >2 yr using VHF telemetry. Tilt-switch activity sensors suggested that elk were feeding in 40% of locations. The data indicated that feeding andbedding occurred in all habitats. As expected, elk appeared to spend more time feeding than bedded in grasslandsduring both daytime and night-time hours. Disparity between the number of feeding and bedding locations ingrasslands was less during night-time. Unsuccessful GPS fix attempts occurred more often when elk were bedded (P< 0.01) and more often during daytime than night-time or the crepuscular periods (P < 0.01). Unsuccessful GPS fixattempts increased in frequency from spring through July and for some animals during the hunting seasons. GPStelemetry was an efficient and effective tool for studying elk habitat.
INTRODUCTION
Global positioning systems (GPS) have created new opportunities. Biologists can easily meet the sample sizerequirements for assessing habitat selection of animals (e.g., Alldredge and Ratti 1986), track animals during night-time or periods of poor weather, receive data by remote transfer, and collect considerable information about animalswithout disturbing them.
Success rates for obtaining GPS locations may be as high as 90% (Dussault et al. 1999), but vary among animalsdepending on habitat (Rempel et al. 1995, Moen et al. 1996, Rempel and Rodgers 1997) and behavior (Bowman etal. 2000). Because there is some bias associated with GPS telemetry, biologists need to understand the character andmagnitude of the bias before deciding if GPS telemetry is useful for a study (e.g., Rumble and Lindzey 1997, Gamoet al. in press). Our objectives were to compare the quantity of data from GPS telemetry to VHF telemetry on freeranging elk (Cervus elaphus), compare elk behavior among habitats during days and nights, and present the usefulnessof unsuccessful GPS location attempts to provide insight into elk biology.
STUDY AREA AND METHODS
Our study was conducted in the limestone plateau of the central Black Hills. Elevations range from approximately915 m to 2207 m. Annual precipitation ranges from 46 to 66 cm (Orr 1959). January is the coldest month withmean daily temperatures from 1.8 to -11oC; July and August are the warmest months with mean daily temperaturesfrom 15 to 29oC. The Black Hills is mostly forested with interspersed grasslands. Ponderosa pine (Pinus ponderosa)is the dominant vegetation type but white spruce (Picea glauca) and quaking aspen (Populus tremuloides) also occur(Hoffman and Alexander 1987).
11

12
In August 1998 and January 1999, we captured 46 adult female (cow) elk. Forty-four were equipped with VHFtelemetry collars and two were equipped with GPS telemetry collars. Three technicians located elk using VHFtelemetry and hand-held yagi antennae year-round from sunrise to just after sunset. When snow was absent,technicians spent three days each week locating animals, resulting in about two locations per month per animal.During winter, we located animals using snowmobiles and an airplane, resulting in approximately one location peranimal per month. The GPS collars were programmed to collect three locations each day (two at night and oneduring day), three days each week (Mon., Wed., Fri.). Data from the GPS collars were stored on the collar until theywere transmitted to a remote command unit, after which data were removed from the collar memory. We conductedremote downloads from collar at irregular intervals. One GPS collar was retrieved in October 1999 from an animalharvested during the hunting season.
In February 2000, we recaptured the elk with a GPS collar and three additional cow elk. These elk were equippedwith store-on-board GPS telemetry units in sealed canisters. Each collar had an electronic release mechanism which,when activated on 1 December 2000, caused the collar to fall off the animal. These collars were programmed toobtain six locations each day from February through to August 20, 12 locations each day (2 hr intervals) from August21 to November 10, and six locations each day from November 11 to December 1. Locations outside the 2-hrintervals varied each month to ensure that one location occurred during each of the two crepuscular periods and twooccurred during each nighttime and daytime. Each collar also had a tilt-switch. During the 10-minute intervalfollowing each location attempt, the tilt-switch was queried at one-second intervals and head-down occurrences weretallied. These were stored in the collar as percent head-down time associated with each GPS location attempt.
We constructed histograms of relative frequency for percent head-down time to assign feeding or non-feedingbedding behavior to elk. Our observations suggest that when elk are not feeding, they are usually bedded. Therefore,we assigned non-feeding behavior as bedded. We used chi square homogeneity tests to evaluate (1) whetherunsuccessful GPS location attempts were independent of activity (feeding or bedding), (2) whether unsuccessfullocation attempts were independent of daily periods (day, night, or crepuscular), and (3) whether feeding andbedding GPS locations were similar among habitats. Elk locations were assigned to habitats using inventory data(Buttery and Gillam 1983) for the Black Hills National Forest in a geographic information system. We determinedsignificant deviations from the expected distributions in the chi square tests by comparing the adjusted standardizedresiduals with the critical values of a Z-statistic after making a Bonferroni correction to α level (Mosteller andParanuk 1985). All tests were considered significant at α = 0.10.
RESULTS AND DISCUSSION
The first two GPS telemetry collars deployed on elk did not operate correctly. The collars were programmed to collect36 locations each month (three each day, three days each week), but the number of locations varied from 0 to 153per month (Table 1). One collar did not obtain a GPS location for more than two months after it was placed on anelk. We cannot explain these apparent malfunctions. During winter, the rate of successful locations for both collarswas poor. We suspect that moisture in the collars and freezing temperatures caused the poor success of these GPScollars during winter. Temperature was not related to success of obtaining GPS locations on moose (Alces alces) inCanada (Dussault et al. 1999). We found it difficult to accomplish remote downloads of data from the collars. Webelieve the signal was blocked when animals walked behind large trees causing the communication link to be broken.The four store-on-board GPS collars we deployed operated correctly. These GPS collars obtained locations on 88%of attempts, with 70% 3D locations (Fig. 1). Biggs et al. (in press) recorded 70% location rates using an earlierversion of GPS units from the same manufacturer.
We obtained 1,811 locations of elk from VHF telemetry from August 1998 to December 2000; 967 of which werevisual observations of collared elk, or elk in the same herd as collared animals. There was no way to estimate accuracyof the latter visual observations, but we believe it was equivalent to a differentially corrected 2D or 3D location withdilution of precision < 7 (approx. ± 20 m, Rempel and Rodgers 1997). The accuracy of 844 VHF locations was onlysufficient for a skilled technician to confidently place the animals in a 4 - 32 ha land unit through the combined useof the telemetry system and topographic features.

13
Col
lar#
Dep
loym
ent
Num
ber
of l
ocat
ions
by
mon
th1
Dat
esJa
n.Fe
b.M
ar.
Apr
.M
ayJu
n.Ju
l.A
ug.
Sep.
Oct
.N
ov.
Dec
.
910
8/98
- 1
/00
30
527
2419
1431
2310
3443
920
8/98
- 1
0/99
1648
153
5123
187
1513
214
1
340
2/00
- 1
1/00
167
178
171
168
154
156
226
330
288
203
1
350
2/00
- 1
1/00
165
174
157
152
146
153
201
314
338
221
1
370
2/00
- 1
1/00
174
181
170
160
155
155
231
323
343
229
1
380
2/00
- 1
1/00
169
177
174
172
149
149
221
327
322
206
1
VH
F8/
98 -
01.
0114
917
016
582
122
163
102
7714
324
223
915
7
Tabl
e 1.
Num
ber
of lo
cati
ons o
btai
ned
from
GPS
and
VH
F te
lem
etry
col
lars
pla
ced
on e
lk in
the
Bla
ck H
ills.
1 Col
lars
910
and
920
wer
e pr
ogra
mm
ed to
col
lect
3 lo
cati
ons
a da
y fo
r 3
days
eac
h w
eek.
Col
lars
340
, 350
, 370
, and
380
wer
e pr
ogra
mm
ed to
col
lect
7 lo
cati
ons
a da
y in
Feb
ruar
y, 6
loca
tion
s a
day
from
Mar
ch-
Aug
ust
20, 1
2 lo
cati
ons
a da
y A
ugus
t 21
to
Nov
embe
r 20
, and
6 lo
cati
ons
a da
y fr
om N
ovem
ber
21 t
o D
ecem
ber
1.

Figure 1. Number of location attempts, total locations, and 3D locations of four store-on-board GPS collars deployed onelk in the Black Hills, South Dakota.
We considered elk to be feeding if the activity sensor recorded >10% head-down position during the 10-minute timeinterval following GPS location attempts (Fig. 2). The most likely error in our behavior assessments would bebrowsing by elk at or above head-level. However, our observations indicate that when browsing, elk frequently selectlow plants also. If estimates of activity made from telemetry are compiled over time and include relative duration,activity of animals can be estimated with >90% accuracy (Gillingham and Bunnell 1985, Hansen et al. 1992).
Figure 2. Frequency histograms of percent of time in head-down position on elk fitted with GPS collars in the Black Hills,South Dakota.
Animal 340
Feeding
1600
1400
1200
1000
800
600
400
200
0
Num
ber
of o
bser
vatio
ns
Percent head-down time
10 20 30 40 50 60 70 80 90 100
Animal 350
Feeding
1600
1400
1200
1000
800
600
400
200
0
Num
ber
of o
bser
vatio
ns
Percent head-down time
10 20 30 40 50 60 70 80 90 100
Animal 370
Feeding
1600
1400
1200
1000
800
600
400
200
0
Num
ber
of o
bser
vatio
ns
Percent head-down time
10 20 30 40 50 60 70 80 90 100
Animal 380
Feeding
1600
1400
1200
1000
800
600
400
200
0
Num
ber
of o
bser
vatio
ns
Percent head-down time
10 20 30 40 50 60 70 80 90 100
3000
2500
2000
1500
1000
500
01 2 3 4
Collar
Num
ber
of G
PS
fixe
s
Total location attempts
Number of locations
Number of 3D locations
14
15
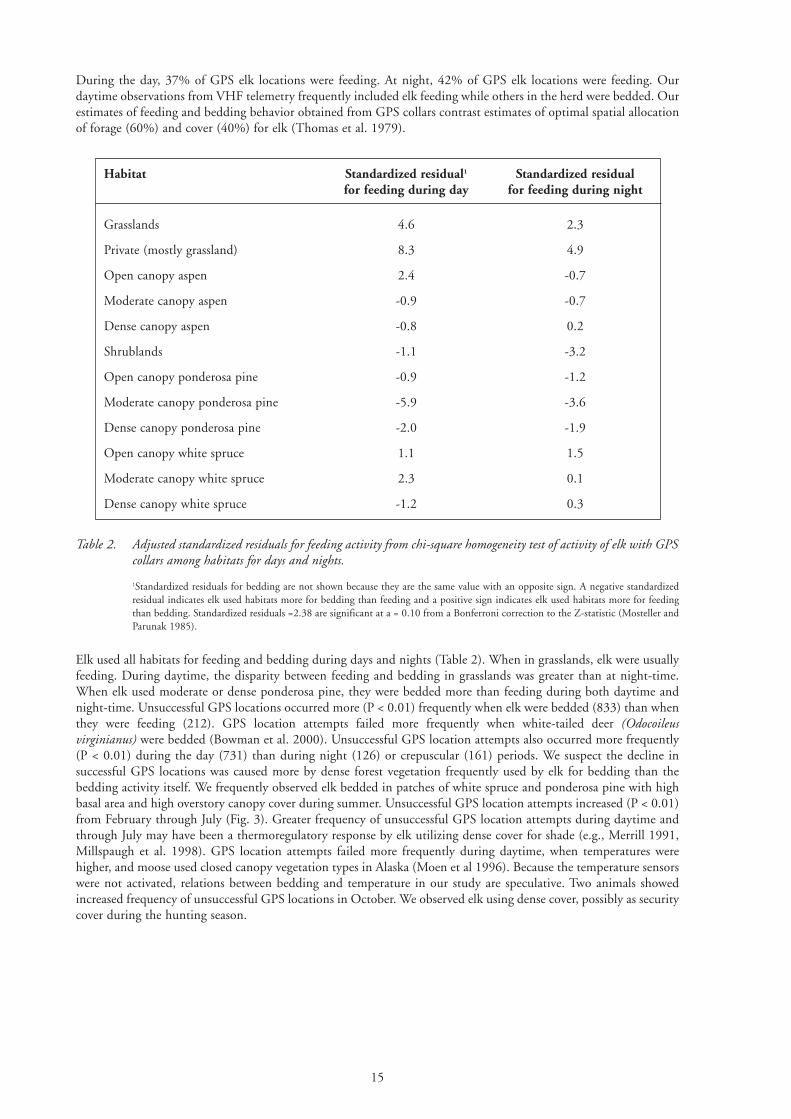
During the day, 37% of GPS elk locations were feeding. At night, 42% of GPS elk locations were feeding. Ourdaytime observations from VHF telemetry frequently included elk feeding while others in the herd were bedded. Ourestimates of feeding and bedding behavior obtained from GPS collars contrast estimates of optimal spatial allocationof forage (60%) and cover (40%) for elk (Thomas et al. 1979).
Table 2. Adjusted standardized residuals for feeding activity from chi-square homogeneity test of activity of elk with GPScollars among habitats for days and nights.
1Standardized residuals for bedding are not shown because they are the same value with an opposite sign. A negative standardizedresidual indicates elk used habitats more for bedding than feeding and a positive sign indicates elk used habitats more for feedingthan bedding. Standardized residuals =2.38 are significant at a = 0.10 from a Bonferroni correction to the Z-statistic (Mosteller andParunak 1985).
Elk used all habitats for feeding and bedding during days and nights (Table 2). When in grasslands, elk were usuallyfeeding. During daytime, the disparity between feeding and bedding in grasslands was greater than at night-time.When elk used moderate or dense ponderosa pine, they were bedded more than feeding during both daytime andnight-time. Unsuccessful GPS locations occurred more (P < 0.01) frequently when elk were bedded (833) than whenthey were feeding (212). GPS location attempts failed more frequently when white-tailed deer (Odocoileusvirginianus) were bedded (Bowman et al. 2000). Unsuccessful GPS location attempts also occurred more frequently(P < 0.01) during the day (731) than during night (126) or crepuscular (161) periods. We suspect the decline insuccessful GPS locations was caused more by dense forest vegetation frequently used by elk for bedding than thebedding activity itself. We frequently observed elk bedded in patches of white spruce and ponderosa pine with highbasal area and high overstory canopy cover during summer. Unsuccessful GPS location attempts increased (P < 0.01)from February through July (Fig. 3). Greater frequency of unsuccessful GPS location attempts during daytime andthrough July may have been a thermoregulatory response by elk utilizing dense cover for shade (e.g., Merrill 1991,Millspaugh et al. 1998). GPS location attempts failed more frequently during daytime, when temperatures werehigher, and moose used closed canopy vegetation types in Alaska (Moen et al 1996). Because the temperature sensorswere not activated, relations between bedding and temperature in our study are speculative. Two animals showedincreased frequency of unsuccessful GPS locations in October. We observed elk using dense cover, possibly as securitycover during the hunting season.
Habitat Standardized residual1 Standardized residualfor feeding during day for feeding during night
Grasslands 4.6 2.3
Private (mostly grassland) 8.3 4.9
Open canopy aspen 2.4 -0.7
Moderate canopy aspen -0.9 -0.7
Dense canopy aspen -0.8 0.2
Shrublands -1.1 -3.2
Open canopy ponderosa pine -0.9 -1.2
Moderate canopy ponderosa pine -5.9 -3.6
Dense canopy ponderosa pine -2.0 -1.9
Open canopy white spruce 1.1 1.5
Moderate canopy white spruce 2.3 0.1
Dense canopy white spruce -1.2 0.3

Figure 3. Histograms of relative frequency for unsuccessful GPS location attempts by month, in the Black Hills, SouthDakota.
CONCLUSIONS
Although our initial experience with GPS telemetry was not successful, the four store on-board collars provided uswith a large and valuable data set from which to evaluate elk habitat use and behavior. We believe the improvedperformance of the latter GPS collars resulted from packaging of the GPS units that prevented moisture frompenetrating into the electronics. Although these four GPS collared elk do not represent a population, theydemonstrate the kinds and quality of data available from GPS. We obtained more data from each GPS collar in 10months than was obtained from three technicians tracking 10 times as many elk with VHF telemetry collars over 2.3years. GPS telemetry also provided data during periods when we could not use VHF telemetry. The benefits of GPScollars and costs of personnel and vehicles in VHF telemetry studies need to be included in the decision process ofwhether to use GPS. We concur with Biggs et al. (in press) that GPS telemetry is more efficient and economic fortracking animals than VHF telemetry. Location schedules and number of locations also should be considered whendeciding which telemetry device to use. In retrospect, we missed a large portion of winter in our study area by placingcollars in the field in early February and having them drop off on December 1. Not having temperature sensorsactivated on the GPS collars restricted our ability to make some inferences from the data. The additional expense oftemperature, activity and mortality sensors are worth the additional costs of $20 to $50 each.
GPS telemetry provides many new opportunities to biologists, but it also contains biases. However, predictable errorsof GPS telemetry that are well understood might be better for some studies than unknown errors of unknownmagnitudes, typical of studies using VHF telemetry. Coupling temperature and activity data with unsuccessful GPSlocation attempts can also provide insights into elk behavior. Our application of GPS telemetry to elk confirmed ourbelief that that elk behavior changes from daytime to night-time. GPS telemetry provided sufficient data for futureanalyses during short periods such as migrations or calving, while maintaining adequate sample sizes (e.g., Alldredgeand Ratti 1986).
ACKNOWLEDGEMENTS
This study was supported by the USDA Forest Service, Black Hills National Forest, South Dakota Department ofGame, Fish and Parks (W-75-R-121), and Rocky Mountain Elk Foundation, under study number RC-933 at theRocky Mountain Research Station. H. Sawyer and Dr. J. R. Biggs reviewed earlier drafts of this manuscript.
Animal 340
Rel
ativ
e F
requ
ency
50
40
30
20
10
0
MonthFeb. Mar. Apr. May Jun. Jul. Aug. Sep. Oct. Nov.
Animal 350
Rel
ativ
e F
requ
ency
40
30
20
10
0
MonthFeb. Mar. Apr. May Jun. Jul. Aug. Sep. Oct. Nov.
Animal 370
Rel
ativ
e F
requ
ency
40
30
20
10
0
MonthFeb. Mar. Apr. May Jun. Jul. Aug. Sep. Oct. Nov.
Animal 380
Rel
ativ
e F
requ
ency
40
30
20
10
0
MonthFeb. Mar. Apr. May Jun. Jul. Aug. Sep. Oct. Nov.
16

17
REFERENCES
Alldredge, J. R., and J. T. Ratti. 1986. Comparison of some statistical techniques for analysis of resource selection. J.Wildl. Manage. 50:157-165.
Biggs, J. R., K. D. Bennett, and P. R. Fresquez. In press. Relationship between home range characteristics and theprobability of obtaining successful global positioning system (GPS) collar positions for elk in New Mexico. WesternN. Amer. Nat.
Bowman, J. L., C. O. Kochanny, S. Demarais, and B. D. Leopold. 2000. Evaluation of a GPS collar for white-taileddeer. Wildl. Soc. Bull. 28:141-145.
Buttery, R. F., and B. C. Gillam. 1983. Forest ecosystems. Pages 43-71. In: R. L. Hoover and D. L. Wills, eds.,Managing forested lands for wildlife. Colo. Div. Wildl. in coop. with U.S. Dept. Agric., For. Serv., Rocky Mtn. Reg.Denver, CO. 459p.
Dussault, C., R. Courtois, J. Oullet, and J. Huot. 1999. Evaluation of GPS telemetry collar performance in habitatstudies in boreal forest. Wildl. Soc. Bull. 27:965-972.
Edenius, L. 1997. Field test of a GPS location system for moose (Alces alces) under Scandinavian boreal conditions.Wildl. Biol. 3:39-43.
Gamo, R. S., M. A. Rumble, F. Lindzey, and M. Stefanich. In press. GPS 3D performance as influenced by foreststructure and topography. International Society of Biotelemetry 15.
Gillingham, M. P., and F. L. Bunnell. 1985. Reliability of motion-sensitive radio collars for estimating activity ofblack-tailed deer. J. Wildl. Manage. 49:951-958.
Hansen, M. C., G. W. Garner, and S. G. Fancy. 1992. Comparison of 3 methods for evaluating activity of Dall'ssheep. J. Wildl. Manage. 56:661-668.
Hoffman, G. R., and R. R. Alexander. 1987. Forest vegetation of the Black Hills National Forest of South Dakotaand Wyoming: a habitat type classification. Res. Pap. RM-276. U.S. Dept. Agric., For. Serv., Rocky Mtn. For. RangeExp. Stn. Fort Collins, CO. 48p
Merrill, E. H. 1991. Thermal constraints on use of cover types and activity time of elk. Appl. Anim. Behav. Sci.29:251-267.
Millspaugh, J. J., K. J. Raedeke, G. C. Brundige, C. C. Willmott. 1998. Summer bed sites of elk (Cervus elaphus) inthe Black Hill, South Dakota: considerations for thermal cover management. Am. Mid. Nat. 139:133-144.
Moen, R., J. Pastor, Y. Cohen, and C. C. Schwartz. 1996. Effects of moose movement and habitat use on GPS collarperformance. J. Wildl. Manage. 60:659-668.
Mosteller, F., and A. Parunak. 1985. Identifying extreme cells in a sizable contingency table: probabilistic andexploratory approaches. Pp. 189 - 223 in D. C. Hoagling, F. Mosteller, and J. W. Tukey, eds. Exploring data tables,trends, and shapes. John Wiley and Sons, New York, NY.
Orr, H. K. 1959. Precipitation and streamflow in the Black Hills. Stn. Pap. RM-44. U.S. Dept. Agric., For. Serv.,Rocky Mtn. For. and Range Exp. Sta. Fort Collins, CO. 25p.
Rempel, R. S., A. R. Rodgers, and K. F. Abraham. 1995. Performance of a GPS animal location system under a borealforest canopy. J. Wildl. Manage. 59:543-551.
Rempel, R. S., and A. R. Rodgers. 1997. Effects of differential correction on accuracy of a GPS animal locationsystem. J. Wildl. Manage. 61:525-530.
Rumble, M. A., and F. Lindzey. 1997. Effects of forest vegetation and topography on global positioning systemcollars for elk. Pages 492-501 in: Amer. Soc. Photo. Remote Sensing, Amer. Congress Surveying. and Mapping, andResource Tech. Inst. Vol. 4. Bethesda, MD.
Thomas, J. W., H. Black, Jr., R. J. Scherzinger, and R. J. Pedersen. 1979. Deer and elk. Pages 104-127. In: J. W.Thomas, ed. Wildlife habitats in managed forests: the Blue Mountains of Oregon and Washington. U.S. Dept.Agric., For. Serv. Agric. Handb. No. 553.


DIURNAL AND NOCTURNAL HABITAT USE BYREINTRODUCED ELK IN EASTERN KENTUCKY,UNITED STATES
Elizabeth G. Springborn and David S. Maehr
Departments of Animal Science and Forestry, University of Kentucky, 205 T.P. Cooper Bld, Lexington, KY 40503, USA
ABSTRACT
After an absence of 150 years, elk (Cervus elaphus) were reintroduced to eastern Kentucky in 1998. The restorationzone is dominated by private lands (commercial and individual) where conflicts between elk and humans can occur.Previous research has found that elk behaviour may change temporarily due to human disturbances. Our goal wasto examine differences in diurnal and nocturnal habitat use by elk and to determine factors influencing individualmovement pathways. GPS radio collars were used on 22 elk, to study elk habitat use and movement from 4 releasesites during 1998, 1999, and 2000. Locations were obtained every three to six hours for up to 13 months per elk.A total of 250 - 2500 locations were obtained for each animal. Slope, aspect, elevation, distance to nearest stream,distance to nearest maintained road and forest or non-forest cover were determined for each location, using ArcViewGIS. Stepwise logistic regression analysis was used to determine which variables best predicted the nocturnal anddiurnal locations of elk. A two-variable model including land use and slope was found to be significant. Elk favourforested cover and steeper slopes during the day and more open habitat and milder slopes at night. To date, most ofthe collared elk (87-90%) have remained within 20 km of their release sites, whereas a few (<5%) have moved morethan 150 km away. Landscape features, such as rugged topography, rivers, and highways, do not present barriers tothe elk that leave the release site, but may influence colonization patterns. Elk prefer to follow topographic contours,rather than move perpendicular to ridgelines and valleys. As such, ridgelines may act as conduits for elk movementsand may help managers predict the direction and extent of colonization.
19


ANIMAL MOVEMENT AND HABITAT USE ESTIMATES FORMOOSE ALCES ALCES FROM GPS TRACKING AND SATELLITE IMAGES
Holger Dettki1 and Lars Edenius2
1 Dept. of Forest Resource Management and Geomatics and Dept. of Animal Ecology, SLU, 901 83 Umeå, Sweden2 Dept. of Animal Ecology, SLU, 901 83 Umeå, Sweden
ABSTRACT
The moose population (Alces alces) has stayed high in Sweden since the early 1980s, with extensive browsing damagereported in managed forest areas. This causes debate among forest owners, hunters, conservationists and wildlifemanagers as to how to mitigate negative effects and achieve sustainable management both of wildlife and forestresources.
Predicting the development of the moose population and modelling forage resources are desirable for developingforestry scenarios with minimal negative effects. In order to achieve this we need a better understanding of theecological patterns of moose movement and habitat use, at different time and spatial scales. These patterns can thenbe analysed in combination with estimates of the amount and distribution of important habitat attributes, derivedfrom satellite imagery and ancillary data.
Between 1995 and 1998, 15 female moose were tracked in the Robertsfors area, in coastal northern Sweden, usingGPS-collars (GPS_1000, Lotek Engineering) and recording about 21,000 positions of which >12,000 weredifferentially corrected. The positions were used to calculate the individual home ranges per season, month and dayusing ArcView GIS software with the Animal Movement Extension.
Using the k-nearest neighbour classifier (kNN) on a Landsat TM scene from 1996, we produced continuous estimatesof tree volume and biomass for forested areas, at a pixel level of 25 x 25 m. From these estimates, tree speciescomposition and volume will be derived as a measure of potential moose habitats: young birch and pine dominatedforest and older spruce forest. These habitat types are hypothesised to be important for food acquisition and cover,respectively. The proportion forage/cover within individual home ranges will be calculated on a seasonal, monthlyand daily basis and compared with data gathered from equal sized random plots, for evaluation of selectivity forspecific combinations of habitat types.
We foresee this as the first step in building a simple, spatially explicit model to describe moose movement and habitatuse, based on vegetation estimation derived from satellite data.
The project is part of the RESE (Remote Sensing for the Environment) project financed by the Foundation forStrategic Environmental Research.
21


GPS TRACKING AND SPATIAL DATA AS A METHOD FORSTUDYING THE USE OF PASTURE BY REINDEER
Jouko Kumpula1, Alfred Colpaert2 and Ulrich Fielitz3
1 Finnish Game and Fisheries Research Institute, Reindeer Research Station, FIN-99910 Kaamanen2 Oulu University, Department of Geography, FIN-90570 Oulu3 Environmental Studies, Am Herberhäuser Weinberge 23, D-37075 Göttingen, Germany
ABSTRACT
The present winter stock of semi-domesticated reindeer in Finland is ca. 200,000 animals. For most of the yearreindeer graze freely, but twice a year they are gathered, for calf marking in summer and for counting and slaughteringin late autumn and early winter. During the last decade, feeding of reindeer in winter has increased markedly inFinland.
The average number of reindeer during the last two decades has been 1.5 times higher than the long-term average.Long-term overgrazing has decreased the condition of lichen (Cladina spp.) pastures. Also, other land uses havechanged the state of the pastures. Forestry has decreased the amount of arboreal lichen (Alectoria, Bryoria spp.)pasture, which used to be an important source of fodder in late winter. Although the condition and amount of winterpasture have decreased, the number of reindeer has been kept at the present level by intensified feeding. Feeding hasalso stabilized stock productivity during the last few years, when unstable weather and snow conditions in winter havebeen common. There is an obvious need to study the impacts of other land uses, as well as weather and snowconditions, on pasture use and the availability of natural food for reindeer.
We tested a GPS-tracking system and satellite image data (Landsat-5 TM) for the study of pasture use by reindeer innorthernmost Finland from 1996-97. Six females and four males carried GPS-receiver collars (weight 750 or 1500g) for 3.5-14.0 months, which recorded their locations 3-8 times per day. The GPS receivers were made byVECTRONIC Aerospace GmbH in Germany. The actual working time of the GPS-receivers varied from 22 to 227days. During that time they collected 3,944 locations. Of all location attempts, 79% were successful. Analyses ofpasture use by reindeer, using classified pasture maps, showed that pasture use by reindeer was dependent on season,vegetation and snow conditions.
The method proved to be an effective way to study pasture use and migration of reindeer. However, GPS-collars forreindeer should be designed to prevent snow and ice accumulation on the collar. Also, the weight of a GPS-receivercollar should not exceed 0.7% of the body weight of a reindeer (weight: 500-600 g), so that it does not disturbforaging behaviour in winter. Since 1999 we have continued to study the pasture use of reindeer in the Ivalo reindeermanagement district (land area 2,641 km2), in northernmost Finland, using a new type of GPS-receiver collar. Thetotal weight of the collar is 550 g and it can take and store, for example, three locations per day over one year. Airtemperature is also measured and stored. The GPS receiver can also be programmed to send the stored data at certainintervals to a ground station (weight 2,600 g). There is also a radio transmitter in each GPS collar. Presently tenreindeer females carry these GPS-receiver collars.
We are also monitoring snow conditions in the study area, taking measurements in December, February and April.We have marked out five equilateral triangles on the study area. The length of one side of each triangle is 3.5 km andthere is a snow measurement site every half kilometer along each side. The aim is to compare the snow conditions indifferent regions and in different vegetation and forest types. Later we will analyse the use of different vegetation andforest types by reindeer. In these analyses, we use the classified satellite images and the digitised forest maps of theFinnish Forest and Park Service.
23


THE FIRST TRACKING RESULTS FROM A FEMALE FREE-RANGING RED DEER (Cervus elaphus L.) FITTED WITH AGPS COLLAR IN ARDENNE, BELGIUM
Alain M. Licoppe1 and Julien Lievens2
1 Université Catholique de Louvain, c/o Centre de Recherche de la Nature, des Forêts et du Bois, Ministère de laRégion wallonne, 23 avenue Maréchal Juin, B-5030 Gembloux, Belgium.
2 Centre de Recherche de la Nature, des Forêts et du Bois, Ministère de la Région wallonne, 23 avenue Maréchal Juin,B-5030 Gembloux, Belgium.
ABSTRACT
A female red deer (Cervus elaphus L.) was tagged with a differential Global Positioning System (GPS) collar (Televilt- SimplexTM) to test the performance of such technology. This experiment was part of a habitat use study in the Saint-Hubert forest in Ardenne, Belgium. The results are based on the data downloaded via the radio link in the GPS-unit. Battery power was sufficient for the GPS receiver to work for a period of 85 days, at a rate of 4 fixes a day.Locations of the animal were related to the different forest stands found within its home range, using GIS. Theperformance of this GPS-based system is described and discussed (GPS 3D-fix success rate = 46% and dilution ofprecision (DOP) values < 6 = 52%)
INTRODUCTION
The aim of this study was to assess the use of GPS technology as a tool to evaluate habitat use by red deer. Traditionalradio telemetry fixes are time consuming to collect and of variable accuracy. The use of GPS collars should allowprogress to be made in the knowledge of red deer movements, with a greater number and accuracy of fixes, especiallywhere differential GPS is used. Nevertheless, forest cover in European temperate forests can constitute a majorlimitation to the success of GPS measurements, unlike radio telemetry measurements. When studying habitat use,this could introduce an important bias, by over-estimating use of open areas in relation to closed canopy forestedareas.
MATERIAL AND METHODS
A red deer female was immobilized by teleanesthesia (Licoppe et al, 2001) on the 28th of March 2000 and fitted witha GPS-SimplexTM collar.
Characteristics and settings of the GPS-unit
The GPS unit used was an 8-channel GPS-SimplexTM (Televilt) medium deer sized collar, working in differentialmode. The unit was equipped with a VHF transmitter, which was used both as a traditional locating beacon and asa radio link for transfer of the coded GPS data to the remote receiving station (data-logger RX900TM-Televilt). Thesedata were then converted to longitude-latitude coordinates using a Window based program (SimpostTM - Televilt).Other data available informations were fix time and measurement quality.
As GPS works in differential mode, all the GPS measurements were 3D positions, with enough information for post-correction of the data. The expected number of fixes, according to the battery power available, was 400.Concurrently, GPS data were collected by a GPS base station situated less than 100 km from the study site, at theUniversité Catholique de Louvain. At this time, the results are not corrected nor complete, since they are only basedon the data downloaded from the collar via the radio link. This kind of unit allows the user to set the frequency ofGPS measurements. The schedule was made as simple and as representative (covering both day and night) as possibleand optimized in relation to the predicted number of satellites visible in the area during the year 2000 (TRIMBLEGPS Mission Planning Interactive Pages at www.trimble.com or Interactive GPS Satellite Prediction atsirius.chinalake.navy.mil). GPS fixes were taken 4 times a day (GMT : 0330h, 0730h, 1900h, 2300h) and 7 days aweek. The downloading of data (the last 125 positions recorded) occurred once a week when the radio beacon wasswitched on.
25
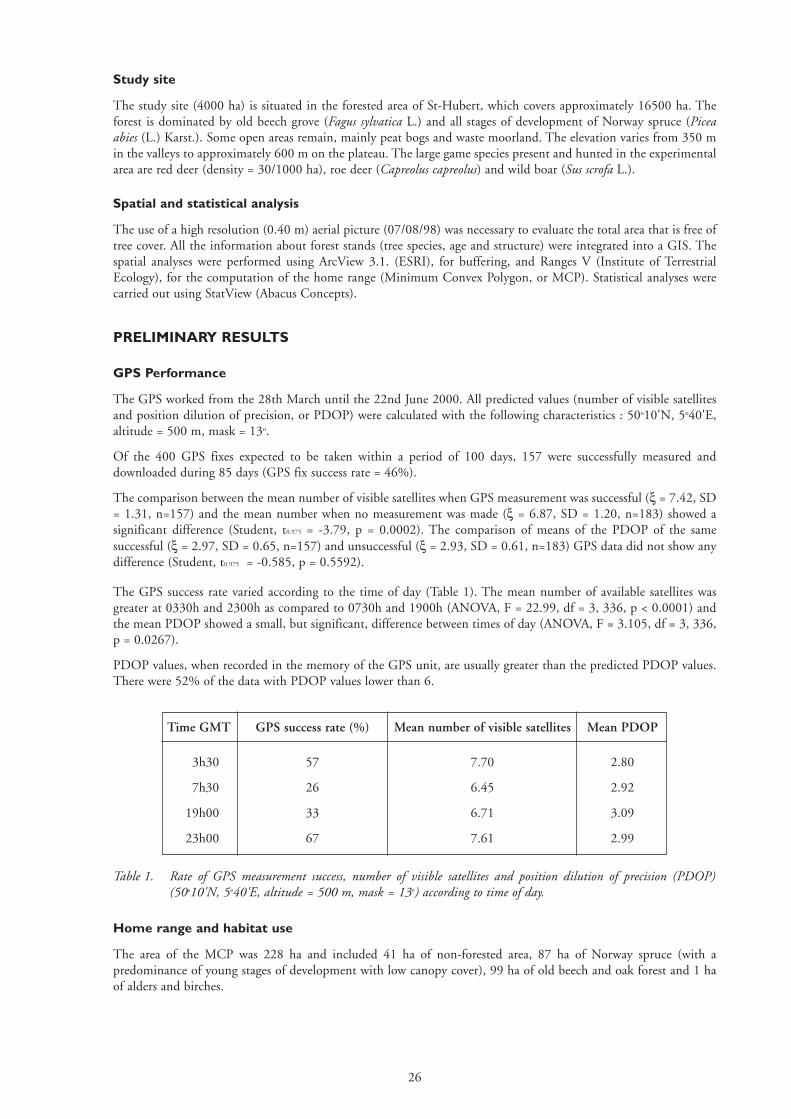
26
Study site
The study site (4000 ha) is situated in the forested area of St-Hubert, which covers approximately 16500 ha. Theforest is dominated by old beech grove (Fagus sylvatica L.) and all stages of development of Norway spruce (Piceaabies (L.) Karst.). Some open areas remain, mainly peat bogs and waste moorland. The elevation varies from 350 min the valleys to approximately 600 m on the plateau. The large game species present and hunted in the experimentalarea are red deer (density = 30/1000 ha), roe deer (Capreolus capreolus) and wild boar (Sus scrofa L.).
Spatial and statistical analysis
The use of a high resolution (0.40 m) aerial picture (07/08/98) was necessary to evaluate the total area that is free oftree cover. All the information about forest stands (tree species, age and structure) were integrated into a GIS. Thespatial analyses were performed using ArcView 3.1. (ESRI), for buffering, and Ranges V (Institute of TerrestrialEcology), for the computation of the home range (Minimum Convex Polygon, or MCP). Statistical analyses werecarried out using StatView (Abacus Concepts).
PRELIMINARY RESULTS
GPS Performance
The GPS worked from the 28th March until the 22nd June 2000. All predicted values (number of visible satellitesand position dilution of precision, or PDOP) were calculated with the following characteristics : 50o10'N, 5o40'E,altitude = 500 m, mask = 13o.
Of the 400 GPS fixes expected to be taken within a period of 100 days, 157 were successfully measured anddownloaded during 85 days (GPS fix success rate = 46%).
The comparison between the mean number of visible satellites when GPS measurement was successful (ξ = 7.42, SD= 1.31, n=157) and the mean number when no measurement was made (ξ = 6.87, SD = 1.20, n=183) showed asignificant difference (Student, t0.975 = -3.79, p = 0.0002). The comparison of means of the PDOP of the samesuccessful (ξ = 2.97, SD = 0.65, n=157) and unsuccessful (ξ = 2.93, SD = 0.61, n=183) GPS data did not show anydifference (Student, t0.975 = -0.585, p = 0.5592).
The GPS success rate varied according to the time of day (Table 1). The mean number of available satellites wasgreater at 0330h and 2300h as compared to 0730h and 1900h (ANOVA, F = 22.99, df = 3, 336, p < 0.0001) andthe mean PDOP showed a small, but significant, difference between times of day (ANOVA, F = 3.105, df = 3, 336,p = 0.0267).
PDOP values, when recorded in the memory of the GPS unit, are usually greater than the predicted PDOP values.There were 52% of the data with PDOP values lower than 6.
Table 1. Rate of GPS measurement success, number of visible satellites and position dilution of precision (PDOP)(50o10'N, 5o40'E, altitude = 500 m, mask = 13o) according to time of day.
Home range and habitat use
The area of the MCP was 228 ha and included 41 ha of non-forested area, 87 ha of Norway spruce (with apredominance of young stages of development with low canopy cover), 99 ha of old beech and oak forest and 1 haof alders and birches.
Time GMT GPS success rate (%) Mean number of visible satellites Mean PDOP
3h30 57 7.70 2.80
7h30 26 6.45 2.92
19h00 33 6.71 3.09
23h00 67 7.61 2.99

Considering the 157 successful GPS fixes, their distribution according to the different forest stands was : 69% inopen area, 20 % in Norway spruce (10% in young and 10% in medium and old stages) and 11% in old beech andoak stands. Within the 31% of locations occurring under canopy cover, 59% were situated at a distance less than 25m from open areas.
The distribution of locations of GPS fixes according to the time of day and the forest type are shown in Table 2.
Table 2. Number of GPS fixes for the female red deer according to forest type and time of day.
DISCUSSION AND CONCLUSION
The final results will be collected and differentially corrected as soon as the collar is removed from the animal. Indifferential mode the GPS-unit uses a lot of battery power, since 3D measurements have to be achieved and requirethe unit to be switched on for a long period of time. The use of a non-differential GPS should allow greater efficiencyin GPS location attempts, although it will be less accurate. The accuracy of traditional, non-differential, GPSmeasurements is significatively better since the Selective Availability was removed by the US Government, on 1stMay 2000. Although the use of differential correction should be maintained in habitat studies requiring very highresolution, in our case it is now considered to be superfluous.
The performance of the GPS-SimplexTM seems to be very dependent on the number of visible satellites. Forest standshave an influence on the efficiency of GPS, by reducing the number of visible satellites. The distribution of animalsin the mature beech forest (10%) seems to be biased, in relation to the large proportion of that type of stand withinthe home range of the tracked animal (40%). High basal area and height of the trees have been shown to affect GPSlocation success (Dussault et al, 1999). The use of open areas increases at night. This could correspond to morenocturnal feeding activity, due to the forest being frequented by tourists.
The next generation of GPS collars should have greater efficiency under tree canopy. Some tests carried out on thenew generation of GPS-SimplexTM (puchased in 2000) in beech forest showed increased efficiency in measurementattempts. If this is confirmed, GPS technology will surely be more profitable than classical VHF transmitters in termsof accuracy, time and money.
REFERENCES
Dussault, C., R.Courtois, J.P.Ouellet and J.Huot. 1999. Evaluation of GPS telemetry collar performance for habitatstudies in the boreal forest. Wildlife Society Bulletin, 27(4) :965-972
Licoppe A., J.Lievens and S. de Crombrugghe. 2001. Tracking red deer in two study areas of the Walloon Region.Forêt wallonne. 49 & 50 : 54-62 (in French).
Time (h GMT) Open area Old beech & oak Old & medium spruce Young spruce Unsuccessful fixes
0330 37 6 3 3 37
0730 7 1 4 10 64
1900 18 3 3 4 58
2300 46 7 5 28
27


29
PERFORMANCE OF STORE-ON-BOARD GPS COLLARS ON ELK,MULE DEER AND MOUNTAIN LIONS IN WYOMING, USA
Frederick Lindzey1, Hall Sawyer2, Charles Anderson2, and Brad Banulis2
1 USGS, Wyoming Cooperative Wildlife Research Unit, Box 3166, University of Wyoming, Laramie, WY 82071,USA
2 Zoology and Physiology Department, University of Wyoming, Box 3166, Laramie, WY 82071, USA
INTRODUCTION
The application of Navigation Satellite Time and Ranging (NAVSTAR) global positioning system (GPS) technologyto track free-ranging animals has provided biologists with a potentially valuable tool. Conventional, VHF-based,radio-telemetry studies often yield biased movement data, because relocation schedules are influenced by daily lightand weather patterns. Also, the tracking of wide-ranging animals often requires use of costly, specially equippedaircraft. GPS collars should provide locations of study animals regardless of weather and daylight patterns and offersufficient spatial coverage to provide accurate locations of most terrestrial mammals. Furthermore, the frequency oflocations theoretically available from GPS collars should allow documentation of fine-grained movement patterns.
Elk (Cervus elaphus nelsoni) have recovered to pre-settlement levels in much of the western United States, but manyof these populations face potential habitat loss as oil and natural gas deposits are developed to meet the nation'senergy needs (VanDyke and Klein 1995). The effect of development on elk populations is poorly understood,restricting the opportunity for design of energy development plans to incorporate measures that would lessen impactson elk.
Mule deer (Odocoileus hemionus) are found throughout western North America. Many populations are migratory,moving seasonally between food-rich, high-elevation summer ranges and more benign lower-elevation, shrub-steppewinter ranges. Biologists are faced with managing not only distinct summer and winter ranges, but also transitionranges, used by deer as they move between their summer and winter ranges. Maintaining the integrity of transitionranges is necessary to ensure the passage of deer between seasonal ranges. In addition, transition ranges often providefoods that result in improved body condition of deer entering winter (Hobbs 1989) and winter foods that sustaincondition of females during their third trimester of pregnancy (Verme and Ullrey 1984). Energy and housingdevelopments threaten to fragment transition ranges in many areas of western North America.
Mountain lions (Puma concolor) were extirpated from eastern North America by the early 1900's, but viablepopulations have persisted in rugged, mountainous areas of the west. The role mountain lions play in the dynamicsof ungulate populations is of interest not only to scientists, but to hunters of ungulates and mountain lions as well.Mountain lions, because they occur in low numbers, are solitary and wide-ranging, have proven more elusive thanmost animals to study. Predation rates, the key to understanding the mountain lion's role in ungulate dynamics andecosystems, have been estimated by intensive tracking efforts (Hornocker 1970) and energetic models (Ackerman etal. 1986)
METHODS
We are studying two adjacent herds of elk along the Piney Front of the Wyoming Mountain Range in westernWyoming. The two herds occupy winter ranges similar in elevation and vegetative composition. The range of thenorthern herd includes 1,136 active oil and gas wells and associated handling facilities and roads, while the range ofthe southern herd is not developed. Our general objective is to document and compare movement and activitypatterns of the two elk herds, to support inferences about the effect of energy development on elk in this habitat.
We captured 15 adult (> 1 year old) female elk from each herd, using helicopter net-gunning and collared each witha Telonics generation 2, store-on-board, GPS collar in winter 2000 (Table 1). The collars were programmed toattempt eight fixes a day during winter and two during summer months. We anticipate a collar life of 2 years. Datahave been retrieved from the collars of elk harvested during the hunting season and these collars fitted on other elk.All collared elk will be captured in spring 2002 to retrieve stored GPS locations.

The Sublette mule deer herd winters south of Pinedale, Wyoming USA, with deer from this wintering complexmigrating as far as 140 kilometers to summer in five mountain ranges in northwestern Wyoming. The primaryobjectives of this study are to document the timing of migration, migratory pathways and areas of concentrated deeruse on the transition range. We captured mule deer on the winter range in 1998 and 1999 using helicopter net-gunning and collared 144 adults (> 1 year old) with VHF radio-telemetry collars and 17 with Telonics generation 1,store-on-board, GPS collars. Collars were programmed to attempt three fixes a day during spring and fall migrationperiods and one a day during summer and winter and were capable of storing 700 locations (Table 1). We locatedcollared deer from an aircraft about once a month and retrieved GPS collars by recapturing these deer each winter.
We captured mountain lions using trained dogs and collared them with either conventional VHF radio-collars orLotek store-on-board GPS collars in the Snowy Mountain Range of southeastern Wyoming. GPS collars wereprogrammed to attempt six fixes daily, with an expected life of 6 months. Data were retrieved by capturing themountain lions, or from lions harvested during the mountain lion hunting season. We first collared mountain lionswith GPS units in the fall of 1999, and recycled these collars onto other lions after data were downloaded and thebattery packs replaced. GPS data retrieved from the collars were used to develop models that would predict predationevents. Field reconnaissance of potential and predicted predation sites, located by homing to specified coordinateswith a hand-held GPS unit, helped develop and verify these models.
RESULTS AND DISCUSSION
GPS collars were retrieved within the year from six of the 30 collared elk. Five were harvested during the elk huntingseason the following fall and the other was killed by a mountain lion soon after being collared. The fix success rate(the percentage of scheduled fix attempts that resulted in a stored location) was higher in winter than summer (Table1). Overstory vegetative cover and rugged terrain common on the summer ranges but not winter ranges, likelycontributed to lower summer success rates. High winter success rates should generate the fine-grained movementdata needed to identify differences between elk using disturbed and undisturbed winter ranges.
Table 1. Performance of GPS store-on-board collars on elk, mule deer and mountain lions in Wyoming USA.
A Analyses based on only the first seven of 17 collars.
Elk Mule Deer Mountain Lions
Collar manufacturer Telonics Telonics Lotek
Model TGW 300 Generation 1 GPS 2000
Number of animals 5 17 10
Programmed fixschedule
winter 8/day 1/25 hrs 6/day
Oct.-Apr. Dec.-Mar. Sep.-Mar.
summer 2/day 1/25 hrs
May-Sep. Jun.-Aug.
migration 3 (1/9hrs)
Apr, May, Oct, Nov.
Percentage of fixessuccessful
overall 85 75 64
winter 92 97A 64
3-d 82 48
summer 77 78A
3-d 61
30

31
Success rates for GPS collars on mule deer averaged about 75%, with the first seven collars downloaded exhibitinghigher success rates in winter than summer (Table 1). Rugged, mountainous topography and over-story vegetativecover, more abundant on summer than winter ranges of mule deer as well as elk, is likely to have contributed to thedifference in seasonal success rates. The frequent locations yielded by GPS collars during the migration periodsresulted in relatively detailed, continuous movement paths in comparison to the fragmented pathways provided bythe sequential VHF radio-telemetry locations.
Ten mountain lions carried GPS collars during the winter. Collars were on individual lions, for from 1to 6 months,with the number of stored locations ranging from 111 to 669. Fix success rates ranged from 40 to 84% and averaged64% (Table 1). The average number of locations for each lion ranged from 2.4 to 5.1 per day. Preliminary analysesof these data suggest that sites where large animals are killed by mountain lions can be identified from the sequentiallocation records provided by GPS collars. Additionally, GPS data from some mountain lions identified areas of useoutside their home ranges, previously estimated from VHF telemetry locations obtained twice-weekly from the air.
CONCLUSIONS
Our studies are ongoing, but preliminary analyses suggest that GPS collars will provide the quality and quantity ofdata needed to address the stated objectives. Although potential biases, associated with relocation schedules beingdictated by light and weather patterns in conventional VHF radio-telemetry programs, are reduced or eliminatedwith the use of GPS collars, biases related to blockage of signals by vegetation or topography (Rempel et al. 1995)remain. Advances in GPS technology are likely to reduce but not eliminate this problem. We used store-on-boardGPS collars because reliable data relay systems were not available when we purchased the collars. Many questionswill require, or profit from, more frequent data retrieval.
Cost is a consideration in the design of most research projects. Our analyses of GPS and VHF telemetry costs in themule deer study, indicated the average cost of each location was considerably less for GPS than VHF, being $8 and$65 respectively. In the brief time we have used GPS collars, collar cost and weight have decreased and total potentiallocations increased, making them not only more affordable, but applicable to a wider range of ecological questionsas well. As the cost of GPS collars is reduced, the sample size issue that often influences the choice between GPS andconventional VHF radio-telemetry approaches will become less of a consideration. GPS collars are, however, simplyanother tool and as such should be chosen based on the unique data needs of the research question being addressed.
ACKNOWLEDGEMENTS
Support for these projects was provided by: Ultra Petroleum, U. S. Bureau of Land Management, U. S. D. A. ForestService, University of Wyoming, Wyoming Game and Fish Department, Rocky Mountain Elk Foundation, MuleDeer Foundation and the Fish and Wildlife Foundation.
REFERENCES
Ackerman, B. B., F. G. Lindzey, and T. P. Hemker. 1986. Predictive energetics model for cougars. Pages 333-352 inCats of the world: biology, conservation and management. National Wildlife Federation, Washington, D. C. USA.
Hobbs, N. T. 1989. Linking energy balance to survival in mule deer: development and test of simulation model.Wildlife Monograph 101.
Hornocker, M. G. 1970. An analysis of mountain lion predation upon mule deer and elk in the Idaho Primitive Area.Wildlife Monograph 21
Rempel, R. S., A. R. Rodgers, and K. F. Abraham. 1995. Performance of a GPS animal location system under borealforest canopy. Journal of Wildlife Management 59:543-551.
Van Dyke, F., and W. C. Klein. 1996. Response of elk in relation to oil wells. Journal of Mammalogy 77:1028-1041.
Verme, L. J., and D. E. Ullrey. 1984. Physiology and nutrition. Pages 91-118 in White-tailed deer: ecology andmanagement. Stackpole Books, Harrisburg, Pennsylvania, USA.


GPS COLLARS WITH REMOTE DOWNLOAD FACILITIES,FOR STUDYING THE ECONOMICS OF MOOSE HUNTING ANDMOOSE-WOLF INTERACTIONS
Barbara Zimmermann, Torstein Storaas, Petter Wabakken, Knut Nicolaysen, Ole Knut Steinset,Michael Dötterer, Hege Gundersen and Harry Petter Andreassen
Hedmark College, Department of Forestry and Wilderness Management, N-2480 Koppang, Norway
ABSTRACT
We used 3 differential GPS (DGPS-SIMPLEXTM) collars on moose (Alces alces) and one non-differential GPS (GPS-SIMPLEXTM) collar on a territorial male wolf (Canis lupus), to assess movement patterns, habitat selection andpredation. All 4 collars were manufactured by Televilt Positioning AB, Sweden and they have in common that thepositioning data is transmitted at pre-programmed times via VHF-coded signals, while also being stored in an on-board memory. We tested the effectiveness of remote data downloads from the ground and evaluated GPSperformance. The 27 downloads from the moose collars were more successful, with 82% of data transferred, than thefirst 12 downloads from the wolf collar. Download success may depend on various factors, such as home range size,animal activity, topography, and habitat. Positioning success rate (38-100%) of the 1,895 unique moose positionsobtained by remote downloads decreased and satellite searching time increased, during the moose study period fromspring to late autumn 2000. There was at the same time a strong diurnal pattern with the poorest GPS performanceat midday. Seasonal and diurnal moose behaviour, habitat selection, atmospheric changes, and battery depletion arefactors that may have contributed to these patterns. The wolf collar had a positioning success rate of 97-99%, witha search time of 34 ± 19 seconds and 70% 3D positions. For our project aims, we consider the combination ofremotely downloadable GPS and GIS very useful for instantaneous visualisation and analysis of data, in order toassess temporary habitat factors, adjust experiments and find prey remains. The presentation of up-to-date data oncolour maps helps to raise local acceptance for our research projects and facilitates sponsoring.
INTRODUCTION
Moose (Alces alces) in southeastern Norway provide an increasingly important source of income in rural areas, wherethere are few alternatives to traditional forestry and agriculture. The aim of increased moose production may havenegative effects from the increased risk of traffic accidents (Gundersen and Andreassen 1998, Gundersen et al. 1998)and damage to forestry and bio-diversity. Predation by a re-colonising wolf (Canis lupus) population (Wabakken etal. 2001) may affect moose production. The project 'Moose Economics' aims to use ecological data to optimise thebenefit-cost ratio and increase the economic value of the moose population in rural Norway (Storaas et al. in press).
Spatial moose and wolf data are important in this context. We are using GPS-technology to 1) analyse moosemovements in relation to habitat, predation and technical installations, 2) build a spatial landscape model of mooseproductivity, 3) experimentally manipulate moose movements away from mortality risks or towards resources, and 4)estimate predation by wolf. In this paper, we present our first experiences with remote downloads and theperformance of 2 different GPS collars systems (Televilt Positioning AB).
Study area
The study area is situated in Hedmark county in south-eastern Norway, close to the border with central parts ofSweden and includes the rural municipalities of Stor-Elvdal, Rendalen and parts of Åmot (61o N, 11o E). Borealconiferous forest dominates the landscape from the valley bottoms at 200-300 meters to the tree line at 900 m abovesea level. Scots pine (Pinus sylvestris), Norway spruce (Picea abies), birch (Betula pubescens, Betula pendula) and aspen(Populus tremula) are the dominant tree species in various mixtures. Most of the forests are managed for a mosaic ofdifferent age-class stands of predominantly Scots pine. Snow covers the area for 5-7 months from October/Novemberto April/May. The surrounding alpine areas rise to 1000-1300 m above sea level.
33

MATERIALS AND METHODS
On March 6, 2000 we immobilised and fitted GPS-collars to 3 female moose, (moose numbers 226, 247 and 502).From previous VHF radio tracking, these were known to be resident moose with their home range including therailway track and main roads in the valley bottom. Major parts of moose home ranges overlapped with a wolf packterritory of unmarked wolves (the 'Koppang Pack'). The scent-marking alpha-pair of this pack has been ground-tracked on snow for several winters to determine the pack's winter territory boundaries (Aronson et al. 2000).
Nearby, a newly established wolf pair (the 'Graafjell Pair') were darted from a helicopter and radio-collared onFebruary 12, 2001. The male was equipped with a GPS-collar, while a conventional VHF radio collar was attachedto the female (Telonics, mod. 500). These two wolves were marked by the Scandinavian Wolf Research Project(SKANDULV) as part of a study on the ecology of the joint Scandinavian wolf population. Several cooperativeScandinavian research institutions run this international project, including Hedmark College (Sand et al. 2000 a,b).
The moose were equipped with differential GPS collars from Televilt Positioning AB (DGPS-SIMPLEXTM). Theyweigh 1.8 kg each and contain 5 D-cell batteries. An internal 8-channel receiver, based on the NAVSTAR GlobalPositioning System, determines the positions. It searches for a 3-D position within a user-set time slot and shutsdown as soon as the position is achieved. The pseudo-range data and ephemeris data for at least 4 visible satellites arestored in an on-board memory. An additional VHF transmitter is used for radio tracking and for remote datadownloads in the field. The most recent 125 positions, with date, time and quality parameters, are stored in atemporary memory and transferred as VHF pulse-coded signals, at pre-programmed times, to a data logger (RX-900,Televilt). The transfer takes 6-7 seconds per position. These uncorrected positioning data are later transformed tolatitude and longitude or UTM coordinates with the SIMPPOST software (Televilt Positioning AB). When the mainbattery voltage is low, a back-up battery takes over to keep the VHF transmitter working, with a unique pulse rate,for a few more months. During this time it is possible to track the animal for recapture and retrieval of the collar.
We programmed the moose GPS-collars to take positions according to two different time schedules. Schedule 1, withone position per hour (24 positions per day), was applied from March 6 to April 9 and after November 26. Thisschedule was thought to cover migration and the hunting season. Schedule 2 was active from April 10 to November26 and consisted of one position every 3 hours (8 per day). The maximum GPS search time was set as 200 seconds.Remote data download was scheduled so that all positions could potentially be downloaded in the field. VHFbeaconing time was reduced to daytime hours during working days. With this schedule we expected the collar torecord 3000 - 4000 positions during the 8-12 months before battery depletion
At the beginning of March 2001, 2 of the 3 moose collars were retrieved from the field. In this paper we will reporton results from the remotely downloaded data from all 3 collars. From the time between the first and last positionin each transmission, we calculated the number of GPS positioning attempts and related this to the potential 120-125 positions per transmission, in order to get an estimate of successful GPS-attempts. For this analysis we excluded5 transmissions with obvious GPS failures. For the seasonal analyses we defined spring as the leafless period up toMay 15, summer as the leaf period up to September 30, and autumn as the leafless period thereafter.
The male wolf of the Gråfjell Pair was equipped with a non-differential GPS-SIMPLEXTM from Televilt PositioningAB. It was programmed with schedule 1 (one position per hour, see above) from February 12 to April 22, and forseveral separate weeks during late summer, autumn and early winter, 2001. In all other periods the collar wasscheduled to take 3 positions per day. For schedule 1, the collar was programmed to remotely transfer the data (6-7seconds per position) weekly in 3 downloads, on 3 consecutive days. The VHF beacon was programmed to transmita signal for 4.5 hours in advance of data transmission, in order to locate the wolf in time. After the remote downloadwas completed, the data were transferred to a GIS (ESRI ArcView 3.2) for visualisation, analysis and to enable furtherplanning of fieldwork.
RESULTS
Remote download of GPS data
In the period after collaring, between March 6 and November 10, 2000, a total of 33 remote data downloads permoose were scheduled. Of those we received 11 transmissions from moose 226, 10 transmissions from moose 247,and 6 transmissions from moose 502. We did not attempt to receive all the transmissions, in order to minimise costs.On average, we received 101 ± 23 positions per transmission, which corresponded to 82% of the 125 possiblepositions. A complete dataset was obtained in 8 out of the 27 transmissions, but in 8 of the transmissions we received
34

35
less than 80% of the positions (Fig. 1). Some data appeared in more than one transmission. In total, we received1895 unique positions: 785 positions for moose 226, 511 positions for moose 247, and 599 positions for moose 502.These positions were spread over the whole period of 247 days from March to November 2000. On 41 separate daysduring this period, no data were available.
Figure 1: Number of remote data downloads (n=27) of the moose collars through VHF-coded signals, in relation to howsuccessfully the data were received by the data logger on the ground.
During the first 4 weeks after February 12, 2001, we attempted to remotely download the wolf GPS data 12 timesfrom the ground (3 times each week). Three times, the wolf was not located in time to receive the data. Six times,less than 50% of the expected data was received, and only 3 attempts resulted in high download rates (86%, 92%,and 100% respectively). The repetitions allowed for combining data from the 3 transmissions within the weeks,resulting in 20%, 32%, 96% and 100% success rates for positioning attempts in week 1, 2, 3, and 4 respectively.Technical and methodological adjustments accounted for most of the improvement in the download rate after thefirst 2 weeks. In total, we recorded 379 unique positions for the wolf during these first 4 weeks.
GPS performance
The following analysis of GPS performance is based on the remotely downloaded data only. The results may bedifferent when all data are taken into account, including data stored in the collar memories, although we do notexpect major changes. We received positions from moose 502 over the whole period, although the GPS unit of moose226 did not achieve any positions during 18 days from July 4 to July 21 and, during September and early October,the GPS unit of moose 247 failed on several occasions and failed totally after October 5.
Figure 2: Proportion of successful positioning attempts in 22 downloads of data from moose 226 (rings and solid lines),moose 247 (shaded rectangles) and moose 502 (triangles and broken lines) during the study period.
% s
ucce
ssfu
l GP
S a
ttem
pts
100
90
80
70
60
50
40
30
20
10
0Mar Apr May June July Aug Sep Oct Nov
month
num
ber
of tr
ansm
issi
ons
proportion of successfully received data
12
10
8
6
4
2
0
0-10
%
11-2
0%
21-3
0%
31-4
0%
41-5
0%
51-6
0%
61-7
0%
71-8
0%
81-9
0%
91-1
00%

36
Moose GPS positioning attempts were successful in 38-100% of the transmission periods and seemed to vary withmoose/collar and time of year (Fig. 2). The GPS unit of moose 226 had the lowest success rate during the wholeperiod, except for June/July (38-72%). The success rates of the two intact moose GPS units decreased in the autumnand were lowest in October/November (Fig.2). More than 80% of the positioning attempts were successful for moose247 in March and June and for moose 502 in March and August (Fig.2).
Figure 3: Number of successful moose positions at different times of day (n = 1540).
The number of successful positioning attempts by the moose GPS units varied with time of the day, with lowestsuccess rate at midday and highest success rate at midnight (Fig. 3). This diurnal pattern was the same during spring,summer and autumn. The satellite search time was up to one minute for 10%, 1-2 minutes for 59% and more than2 minutes for 31% of all successful positions. The search time increased during the study period, and in autumnabout half of the positions were acquired after 2 minutes (Fig.4). The wolf GPS unit acquired positions in 99% (week3) and 97% (week 4) of all attempts. Due to poor download conditions, the success rate was not assessed for the first2 weeks. Mean satellite search time during the first 4 weeks of the study was 34 ± 19 seconds and was longer thanone minute in 7% of all successful positioning attempts. In 70% of all successful attempts, a 3D-position wasacquired. In the remaining 30%, the wolf GPS acquired a 2D-position, but could not locate more satellites duringthe additional time slot of 20 seconds to achieve a 3D position.
Figure 4: GPS search time for 3D moose positions, limited by a time slot of 200 seconds, in relation to season (n=1895)
DISCUSSION
A remote GPS data download facility may be important for various reasons. First of all, positions stored in the GPScollar may be lost due to collar failure, theft of collar or destruction. The moose in our project, for instance, werevery vulnerable to train and car collisions. One of the collared moose was hit and killed by a train in January 2001.By chance, the GPS collar remained undamaged. Large carnivores in general, and in particular the newly establishedwolves, are subject to illegal killing. Poachers are unlikely to return the collars. Secondly, the combination of
prop
ortio
n of
pos
ition
s pe
r s
easo
n
70%
60%
50%
40%
30%
20%
10%
0%<60 60-120 >120
searching time (seconds)
spring n=581
summern=1085
fall n=229
300
250
200
150
100
50
01 4 7 10 13 16 19 22
time of day
num
ber
of p
ositi
ons

remotely downloadable GPS and GIS is useful to analyse and visualise data instantaneously. It is also easier to planand adjust experiments to manipulate moose movements, if data is easily accessible. Temporary habitat factors suchas snow depth or standing biomass are possible to assess over time. As part of a pilot kill-rate study, we checked allclusters of wolf positions shortly after download for prey remains, or alternatively lairs, with the help of handheldGPS units and tracking on snow. To evaluate these clusters of positions in search for prey remains for a kill rate study,is probably less demanding of resources than obtaining the same amount of data by traditional VHF and snowtracking. Moreover, the instantaneous visualisation of the locations is useful to explain the costly technology andresearch aims - partly to raise local acceptance for the project, and partly to find potential sponsors.
Our experiences so far have shown that it is difficult to remotely download complete sets of data, due to problemsin receiving all VHF-coded signals. We suggest that variations in download rate may be due to the distance from theanimals, the topography of the area, the activity of the animals during download and weather conditions. Animalswith large home ranges, who move fast and over long distances, make remote downloads of data even more difficult.The efforts and costs of downloading the wolf GPS data were much higher than those involved in obtaining the sameamount of data from a moose GPS unit. It is important to identify the parameters that make downloads successful,in order to improve the technique. Downloading from a plane or fixed antenna stations are alternatives that have tobe tested. The use of two or more stationary or mobile receiver stations would most likely give a better result, butwill be more expensive. To reduce costs in the case of non-differential SIMPLEX collars, the frequency of remote datadownloads may be reduced, so that more positions can be transferred per download. However, a prolonged downloadtime will increase the risk of the animal moving out of the range of acceptable signal quality.
The satellite search times of the moose GPS units increased during the study period and were highest in autumn,when positioning success rates were lowest. The leaf period from mid-May to the end of September might explainsome of this pattern, as shown by Edenius (1997) for a boreal forest in Sweden, and Moen et al. (1997) and Dussaultet al. (1999) for boreal forests of North America. However, positioning success rate decreased rapidly after leaf fall.This is likely to be an effect of the nearly depleted batteries (Merrill et al. 1998). Another possible explanation isgiven by Edenius (1997), who observed the same decrease during autumn, which is that moose show preference forold forests during autumn, compared to summer, in south-eastern Norway (Hjeljord et al. 1990). Tree height, treediameter and canopy cover have been shown to be negatively correlated with success rate (Moen et al. 1996, Edenius1997, Dussault et al. 1999) and are all positively correlated with age of forest stand. Atmospheric changes inhumidity may also affect positioning success rate (Dussault et al. 1999).
The midday-low in the success rate for moose GPS units may be explained by moose behaviour. The animals maymove to shaded and dense habitats during the warmest hours of the day (Schwab and Pitt 1991), or they may beresting more during day-time than during night-time, in order to avoid predators and increased human disturbance.When resting, the GPS antenna may point away from the sky or be closer to the ground and thereby obtain fewerpositions (Moen et al. 1996, Dussault et al. 1999, Bowman et al. 2000). Diurnal atmospheric changes, such aschanges in temperature (Moen et al. 1996, Dussault et al. 1999), radiation or humidity (Dussault et al. 1999), mayalso affect diurnal GPS performance.
The performance of the GPS collar is improving with every new generation of GPS technology (Dussault et al.1999). Both moose and wolf GPS collars were manufactured in the same year by the same manufacturer and thesame generation of GPS technology was used for the collars (P.A. Lemnell, Televilt Positioning AB, pers. comm.).However, the moose GPS units were differential and stored 3D positions only. If no 3D-position was acquired duringthe time slot of 20 seconds after a successful 2D-position, no position was stored at all. Considering the short searchtime for both 2D and 3D positions by the wolf GPS unit, the success rate of the differential GPS or the 3D/2D ratioof non-differential GPS could be increased substantially if the time slot was prolonged by 10-20 additional seconds.
ACKNOWLEDGMENTS
The municipality of Stor-Elvdal, the Association of Landowners of Stor-Elvdal (Grunneierforeningen Stor-Elvdal),the Regional and National Railway Association (Jernbaneverket), the Road Federation of Hedmark county (StatensVegvesenet) and the National Directorate of Economics and Rural Development (SND) have financed the use ofGPS technology for moose. Costs of GPS-technology for the wolf were covered by funding from the NorwegianResearch Council and the Directorate of Nature Management. Per-Arne Lemnell and Bengt Evertsson of TeleviltPositioning AB gave a lot of helpful technical advice. Students from Hedmark College provided many hours ofvoluntary fieldwork. Landowners and local forest and wildlife managers supported our activities and cooperatedwhenever necessary. Robert Kvalvåg improved the language of the manuscript. Last, but not least, we want to thankAngela Sibbald of the Macaulay Land Use Research Institute for the initiative of a very inspiring conference on theuse of GPS technology in wildlife research in March 2001.
37

REFERENCES
Aronson Å., P.Wabakken, H.Sand, O.K.Steinset, I.Kojola, 2000. Varg i Skandinavia: statusrapport för vintern 1999-2000. Hedmark College, report nr.5: 1-65.
Bowman J.L., C.O. Kochanny, S. Demarais, and B.D. Leopold. 2000. Evaluation of a GPS collar for white-taileddeer. Wildlife Society Bulletin 28: 141-145.
Dussault C., R.Courtois, J.P.Ouellet, and J.Huot, 1999. Evaluation of GPS telemetry collar performance for habitatstudies in the boreal forest. Wildlife Society Bulletin 27: 965-972.
Edenius L. 1997. Field test of a GPS location system for moose Alces alces under Scandinavian boreal conditions.Wildlife Biology 3: 39-43.
Gundersen H. and H.P. Andreassen, 1998. The risk of moose Alces alces collision: A predictive logistic model formoose-train accidents. Wildlife Biology 4: 103-110.
Gundersen H., H.P. Andreassen and T.Storaas, 1998. Spatial and temporal correlates to norwegian moose-traincollisions. Alces 34: 385-394.
Hjeljord O., N.Høvik and H.B. Pedersen, 1990. Choice of feeding sites by moose during summer, the influence offorest structure and plant phenology. Holarctic Ecology 13: 281-292.
Merrill S.B., L.G.Adams, M.E. Nelson and L.D. Mech, 1998. Testing releasable GPS radiocollars on wolves andwhite-tailed deer. Wildlife Society Bulletin 26: 830-835.
Moen R., J.Pastor, Y. Cohen and C.C. Schwartz, 1996. Effects of moose movement and habitat use on GPS collarperformance. Journal of Wildlife Management 60: 659-668.
Moen, R., J. Pastor, and Y. Cohen. 1997. Accuracy of GPS telemetry collar locations with differential correction.Journal of Wildlife Management 61:530-539.
Sand H., H.Andrén, O. Liberg and P.Ahlquist, 2000a. Den skandinaviska vargen - en överlevnadskonstnär. Fauna &Flora 95: 79-91.
Sand H., H.Andrén, O.Liberg, P.Ahlquist and P.Wabakken, 2000b. Telemetry studies of wolves (Canis lupus) inScandinavia: A new research project. Beyond 2000 - Realities of Global Wolf Restoration. Abstracts. InternationalWolf Symposium. Duluth 23-26 Feb. 2000: 66-67.
Schwab F.E. and M.D.Pitt, 1991. Moose selection of canopy cover types related to operative temperature, forage, andsnow depth. Canadian Journal of Zoology 69: 3071-3077.
Storaas T., H.Gundersen, H.Henriksen and H.P. Andreassen, (in press). The economic value of moose - a review.Alces.
Wabakken P., H.Sand, O.Liberg and A.Bjärvall, 2001. The recovery, distribution, and population dynamics of wolveson the Scandinavian peninsula, 1978-1998. Canadian Journal of Zoology 79: 710-725.
38

USING GPS TO STUDY THE EFFECT OF HUMANDISTURBANCE ON THE BEHAVIOUR OF RED DEER STAGS ON A HIGHLAND ESTATE IN SCOTLAND
1Angela M.Sibbald, 1Russell J.Hooper, 1Iain J.Gordon and 2Stewart Cumming.
1 Macaulay Land Use Research Institute, Craigiebuckler, Aberdeen, AB15 8QH, UK2 National Trust for Scotland, Mar Lodge Estate, Braemar, Aberdeenshire, AB35 5YJ, UK
INTRODUCTION
In the highlands of Scotland, recreation is widely viewed as being the human activity that has the greatest impact onthe behaviour of red deer (Cervus elaphus) (Staines & Scott, 1994). However, there is a lack of quantitative data toshow whether disturbance from human recreational activities has a significant effect on the spatial distribution ofdeer or their use of habitats. This has been largely because of the difficulty of making adequate observationalmeasurements of the movements of animals over large areas of land and over long periods of time. Global PositioningSystem (GPS) technology provides a very effective means of overcoming this limitation. This paper describes part ofa two-year study of red deer stags at Mar Lodge Estate in eastern Scotland, in which GPS was used to track themovements of stags from four different herds, for periods of up to 10-months.
Mar Lodge Estate covers an area of just under 30,000 ha and is situated approximately 60 miles west of Aberdeen,in the Grampian region. The estate is owned by the National Trust for Scotland, who encourage public access forhill walking while still managing it as a traditional deer-shooting estate. The regular use of parts of the estate forwalking and the routine collection of data on the number of visitors, make it a suitable environment for studying theeffects of human disturbance on stag behaviour.
MATERIALS AND METHODS
Animals and study area
The study reported here was carried out using data collected from stags in the Glen Lui herd, just one of the herdsin which stags were fitted with GPS collars. Over 200 stags regularly over-winter in Glen Lui, spending most of theirtime there from the beginning of November until the end of June. A well-established vehicle track, also one of themost popular walking routes within the estate, runs through the middle of the glen. This track is about 4 km longand follows the Lui water in a north-westerly direction, from the Linn of Dee to Derry Lodge.
Estimates of the number of people walking through Glen Lui are obtained from automatic "people counters" situatedat the beginning and end of the track. These counters work by recording the total number of times that an infra-redbeam is interrupted, per hour, throughout the day. The number of people walking past the counters are normallyhighest over the summer and lowest during the winter, with around twice as many people per day at weekends thanduring the week in summer (Gardiner, 2000). The main part of this study consisted of following the movements ofanimals in May and June, when visitor numbers are nearing their summer peak and before the stags traditionally startto move away from the glen.
GPS COLLARS
In 1998 and 1999, four stags from the Glen Lui herd were fitted with GPS 1000 wildlife tracking collars (Lotek Inc.Canada). These collars have differential correction and remote download facilities and are also equipped with anactivity sensor, which detects movement of the head in two planes. The collars can store up to 1680 records, eachof which includes a position fix and an integrated activity measure for the time interval since the last fix was made.By downloading data from the collars remotely, around 4500 fixes can be made before the collars have to be removed.
The collars were fitted to stags at the beginning of April in each year and removed the following February.Supplementary food was provided for a few weeks before the animals were handled, so that the stags were accustomed
39

to approaching a vehicle. Individual animals were then immobilized, using darts filled with a tranquilizing drug(Imobilon; Vericore, UK), and the collars fitted. In addition to a basic daily fix schedule with 2-hourly (1998) or 4-hourly fixes (1999), the collars were programmed to take fixes every hour on Sundays and Wednesdays throughoutthe study and every 15 minutes on one Sunday and one Wednesday per month, between May and December, in thefirst year. With these schedules it was necessary to download data remotely onto a portable PC in the field every 2to 3 months, after locating the deer using the unique VHF signals transmitted by each of the collars.
DATA PROCESSING
All GPS fix data were differentially corrected in the laboratory, using N4 Post-processing software (Lotek Inc.Canada) and deer locations calculated. These locations were plotted on maps of the area (Ordnance Survey,Southampton, UK. Crown Copyright) and analyzed using Arcview software (ESRI, California, USA). An informaltest to relate GPS-derived locations to GIS map locations was made by collecting data from three collars,programmed to take fixes every 5 minutes, while they were carried along the Glen Lui track. Using the OrdnanceSurvey data, the average distance of these collars from the track was calculated as 11.3 ± 2.63 m. A further test, wherea collar was left stationary for 2 weeks, while it was scheduled to take a fix every 4 hours, showed 88% of locationslying within 10 m and 63% lying within 5m of the mean value.
The average distances of collared stags from the track were calculated using Arcview, relating GPS fixes to the nearestpoint on the track on each occasion. Total distances moved by collared stags over 24-hour periods were alsocalculated, using the 15-minute fixes taken each month in 1998. Due to problems caused by the loss of some basestation data, which is essential for differential correction, total distances moved could only be calculated using the15-minute data for May, July, October and November. Proportions of time spent by the deer in different vegetationtypes were estimated using GIS-based vegetation maps of the area (Macaulay Land Use Research Institute, 1993).
Although the number of people walking at Mar Lodge varies with time of year and time of day, as well as with dayof the week (Gardiner, 2000), this study was confined to a comparison between days of the week. This is becausethere are no factors likely to affect stag behaviour which are confounded with day of the week, during May and June,other than the number of visitors to the estate.
RESULTS
Daily visitor counts were consistently higher on Sundays than Wednesdays in May and June (192 ± 15.1 v 53 ± 8.0).Figure 1 shows an example of the daily pattern of activity recorded by the track-side counters. Since around 97% ofcounts are normally registered between 0700 and 2100 h (Gardiner, 2000), the data presented here are restricted tothat period of the day, unless otherwise stated.
Figure 1 The mean estimated number of people per hour passing Derry Lodge during Sundays –––– and Wednesdays - - - - in June
The average distance of all collared stags from the track was higher on Sundays than Wednesdays (Figure 2).Although the difference between days was significant for both years (P<0.05), the magnitude of the difference wasmuch greater in 1999 than 1998.
coun
ts
60
50
40
30
20
10
00 4 8 12 16 20 24
hours of the day
40

41
Figure 2 The mean distance of collared stags from the tracks on Sundays and Wednesdays in May and June
Figure 3 shows the average distances and numbers of people counted for successive Sundays and Wednesdays duringMay and June, for each of the four deer in 1999. Using this data set, a significant positive correlation was foundbetween the mean distance of the stags from the track and the number of people counted each day (Pearsoncorrelation = 0.658; P<0.01).
Figure 3 Mean distance of individual stags from the track on Sundays and Wednesdays in May and June 1999
Figure 4 shows the mean proportion of fixes in the five main vegetation categories on Sundays and Wednesdays in1999. The proportion of time spent on smooth grass, which was concentrated in a strip running along the middleof the glen beside the river and the walking track, was lower on Sundays than Wednesdays (20.0% v 32.9%; P<0.05).The stags also spent more of their time in woodland on Sundays than Wednesdays (11.0% v 2.5%: P<0.01). Duringthe overnight period, between 2100 h and 0700 h, the deer spent the same amount of time (12.1%) on the smoothgrass on both Sundays and Wednesdays, but in both cases the majority of time (73.5%) was spent on heather.
Figure 4 Mean proportion of time spent in the different vegetation types on Sundays and Wednesdays in May and June1999
Sunday Wednesday
Smooth grasses
Woodland
Bog
Heather moorland
Nardus and Moliniagrassland
Deer 1800
600
400
200
0s w s w s w s w s w s w s w s w
Days of the week
Dis
tanc
e (m
)
distancefrom track
visitornumbers
Deer 2800
600
400
200
0s w s w s w s w s w s w s w s w
Days of the week
Dis
tanc
e (m
)
Deer 3800
600
400
200
0s w s w s w s w s w s w s w s w
Days of the week
Dis
tanc
e (m
)
Deer 4800
600
400
200
0s w s w s w s w s w s w s w s w
Days of the week
Dis
tanc
e (m
)
400
300
200
100
0
Dis
tanc
e (m
)
Both years 1998 1999

Figure 5 shows the mean distances moved by the collared stags over 24-hour periods, when fixes were taken every 15minutes. The mean distance moved was the same on both days in May, but was significantly greater on Sundays thanWednesdays when the comparison was made over the other three months (P<0.05). The difference was greatest inJuly.
Figure 5 The mean distance travelled over 24 hours on Sundays and Wednesdays estimated from 15-minute fix datain 1998
DISCUSSION
The Glen Lui stags are used to seeing people walking within their home range. The fact that they traditionally spend8 months of the year in and around the glen, shows that they are not unduly disturbed by the activities of visitors.Habituation to disturbance on frequently used tracks has been documented in other wild animals, for example muledeer (Cornett et al. 1979) and grizzly bears (Jope 1985). Nevertheless, this study shows that the behaviour of thestags can still be affected and, due to the particular distribution of the vegetation in the glen, disturbance could affectthe diet that they eat during the early summer.
The apparent effect of disturbance on stag behaviour was much greater in the second year of the study. This resultcould be because the stags chosen to wear GPS collars each year differed in their wariness of people. Although theresults for 1998 confirm the fact that the present level of recreational activity in Glen Lui does not constitute a majordisturbance to the resident population of stags, the second year's data provides fairly strong evidence that theseanimals react to the presence of people. The correlation, on a day-to-day basis, between the mean distance of thestags from the track and the number of people on the track, shows that some stags clearly do change their behaviouras a result of increased human activity.
One of the consequences of moving further away from the track, is that the stags may feed on different vegetationtypes. An area where the vegetation is of highest nutritional value (smooth grass) runs in a strip parallel to the trackand almost all of it lies within 300m of the track. On Sundays in 1999, when the average distance from the trackwas around 350m, the stags inevitably spent a smaller proportion of their time on smooth grass. They did not appearto make up for this by spending more time there the following night, when the track was quiet. However, since nomeasurements of feeding behaviour were made, we can only speculate about the diet composition of the animals.
There are, of course, factors other than human disturbance which affect deer movements, such as the need to shelterand to feed (Grace & Easterbee 1979; Gordon 1989). We know from our GPS measurements that stags may travelseveral kilometres during the course of a day (see Figure 5) and whether or not they respond to the presence ofwalkers on the track will depend on how far they are from the track when walkers appear. An observational studyon the same herd showed that the stags only show significant changes in behaviour when walkers come within 100m(Tidhar, 2000). The same study showed that the stags react most strongly to walkers or cyclists who are accompaniedby dogs and to walkers who wander off the track (Tidhar, 2000). It is quite possible that a single such event mightcause individual animals to move a long distance away from the track on a weekday, even if there is little humanactivity thereafter. By using GPS for collecting animal data, rather than observation, we are not able to link short-term changes in behaviour with actual disturbance events. Although such a link is important for understanding theprocesses involved, the advantage of GPS is that we can measure much longer-term effects which are likely to be moresignificant to the ecology of the animals.
8
6
4
2
0D
ista
nce
(m)
month of the year
May July Oct Nov
42

43
The lack of any day-of-the-week effect on the total distance moved over a 24-hour period in May, while the stagswere based in and around the glen, is also consistent with the results of Tidhar (2000), who found no effect ofdisturbance on the overall distances moved by the stags during 20 min-observation sessions. It seems thatdisturbance from people on the track simply causes stags to retreat 100m or so. Unless they move back, they maynot be disturbed again that day. There is fairly convincing evidence of disturbance, therefore, since there was asignificant linear relationship between the absolute number of people walking along the track each day and the meandistance of the stags from the track in the second year of the study.
The fact that the stags travelled further on the Sunday than the Wednesday in July may be because the animals aremore susceptible to disturbance by walkers once they move away from the glen. Other studies with deer (Schultz &Bailey, 1978; Cassirer et al. 1992) and wild sheep (MacArthur et al. 1982) measured a stronger reaction to the sightof people when disturbance was unexpected. This is also consistent with the finding that walkers leaving the GlenLui track are the most likely to provoke a change in behaviour (Tidhar, 2000).
GPS allowed us to follow the movements of the stags in great detail throughout the year and we know that thedistances travelled between fixes varied enormously. With accurately timed locations and frequent fixes, we can getsome idea of when the deer are resting or feeding and when they make large changes of location. However we cannottell whether any of these individual movements are caused by human disturbance, particularly when the stags are upin the hills, because we have no information about the movements of people. If we could equip hill walkers withGPS receivers and data loggers, we could get a much better idea of the real extent to which stag behaviour is affectedby the activities of visitors to the estate.
ACKNOWLEDGEMENTS
The authors would like to thank the National Trust for Scotland for use of the red deer at Mar Lodge, Alister Clunasfor help and support throughout the project, Peter Holden for provision of visitor data, John Fletcher for dartingservices and the team of Mar Lodge stalkers for help with handling and collaring the stags. Thanks also to GeorgesJaneau and Christophe Adrados for valuable advice on the operation of GPS collars and processing of GPS data. Thework was funded by the Scottish Executive Rural Affairs Department.
REFERENCES
Cassirer, E.F., D.J. Freddy and E.D. Ables. 1992. Elk responses to disturbance by cross-country skiers in YellowstoneNational Park. Wildlife Society Bulletin, 20, 375-381.
Cornett, D.C., W.M. Longhurst, R.E. Hafenfeld, T.P. Hemker and W.A. Williams. 1979. Evaluation of the potentialimpact of proposed recreation development on the Mineral King deer herd. US For. Serv. Gen. Tech. Rep. RM-65.
Gardiner, J. 2000. Analysis of data from automatic people counters in the Cairngorms. Scottish Natural HeritageCommissioned Report F99AA615 (unpublished report).
Grace, J. and N. Easterbee. 1979. The natural shelter for red deer (Cervus elaphus) in a Scottish Glen. Journal ofApplied Ecology, 16, 37-48.
Gordon, I.J. 1989. Vegetation community selection by ungulates on the Isle of Rhum. ll. Vegetation communityselection. Journal of Applied Ecology, 26, 53-64.
Jope, K.L. 1985. Implications of grizzly bear habituation to hikers. Wildlife Society Bulletin, 13, 32-37.
Macarthur R.A., V.Geist, and R.H. Johnston. 1982. Cardiac and behavioural responses of mountain sheep to humandisturbance. Journal of Wildlife Management, 46, 351-358.
Macaulay Land Use Research Institute 1993. The Land Cover of Scotland 1988 (LCS 88). The Macaulay Land UseResearch Institute, Aberdeen.
Schultze, R.D. and J.A.Bailey. 1978. Response of National Park elk to human activity. Journal of WildlifeManagement, 42, 91-100.
Staines, B.W. and D.Scott. 1994. Recreation and red deer: a preliminary review of the issues. Scottish NationalHeritage Review No 31.
Tidhar, D. 2000. Short-term responses of wild red deer Cervus elaphus stags to intense recreational disturbance. MScThesis, University of Aberdeen, UK.


45
A GPS-ASSISTED APPROACH TO MEASURING FINE-SCALEFORAGING PATTERNS OF SMALL MAMMALS
A.D. Kliskey1 and A.E. Byrom2
1 Department of Geography, University of Canterbury, Private Bag 4800, Christchurch, NZ.2 Landcare Research, PO Box 69, Lincoln, NZ.
INTRODUCTION
Quantification of the foraging movements of introduced mammalian predators is important for understandingpredator-prey interactions in countries such as New Zealand where introduced predators are implicated in the declineof native fauna (Rebergen et al. 1998). The measurement of foraging movements, particularly fine-scale movements,is useful for assessing habitat use, for incorporating spatially explicit measures (e.g. proximity), and for determiningpredation risk associated with habitat and topographic features. Fine-scale movements of mammalian predators referto the foraging route of an individual over several hundred metres to a kilometre during a single excursion. Thisinformation fills a gap in what we know of spatial movement patterns obtained through traditional telemetry studiesthat emphasise daily to weekly or even monthly position fixes at a broader landscape-scale (White and Garrett 1990).This paper demonstrates an approach to measuring fine-scale movements of ferrets (Mustelo furo) using globalpositioning systems (GPS) for primary data capture and geographic information systems (GIS) for data processingand analysis.
SYSTEMS FOR FINE-SCALE TRACKING OF ANIMALS
The traditional art of identifying and retracing the tracks of an animal has been widely used in ecology fordocumenting the movements and behaviour of mammals (Murie 1974). Snow-tracking studies have beeninstrumental in determining the functional, numerical and behavioural responses of lynx (Lynx canadensis) to cyclicfluctuations in prey density (O'Donoghue et al. 1997, 1998a, 1998b). Although useful, the approach is limitedprimarily to terrestrial mammals and to regions with snow cover or bare ground cover that provide a continuous setof tracks for a given period of time. A number of techniques have been developed for tracking where animal printsare not readily observed on the ground. Fluorescent markers have been applied to studies of small mammal foragingwith the resulting fluorescent trail able to be tracked with the aid of an ultra-violet light source (Hovland andAndreassen 1995). Spool-and-line tracking has proven particularly effective for tracking small mammals over habitatwhere animal prints would not readily appear (Miles et al. 1981, Boonstra and Craine 1986, Anderson et al. 1988).The trail of thread paid out behind a "spooled" animal is then traced and geographic and ecological characteristicsof the trail recorded. The widespread adoption of VHF telemetry in wildlife studies since 1950 has made significantadvancements in determining home range estimates, daily movements, habitat use, and dispersal movements of alarge range of mammals, fish, birds, and reptiles (Harris et al. 1990, Rodgers et al. 1996). The majority ofbiotelemetry studies involve discontinuous fixes of an individual at discrete or random intervals during a study(Harris et al. 1990). A limited number of studies involve continuous fixes that may provide an approximation of anindividual's travel route - such an approach is restricted to situations where there is minimal chance of losing theanimal due to rapid movements or difficult terrain. Further, many biotelemetry studies based on position fixing bytriangulation involve positional errors that make detailed fine-scale estimates of movement difficult. Studies thatinstead rely on "walk-in" telemetry do provide potentially more accurate position fixes but at the risk of disturbingthe animal. Satellite telemetry systems were first developed in the 1980's providing remote tracking capability forlarge animals (Fancy et al. 1988). The ARGOS system that uses Doppler shift positioning has been used extensivelyto track marine mammals and birds (Priede and French 1981, Taillade 1992). Studies include determination of thehome range of common seals (Phoca vitulina), foraging movements of southern elephant seals (Mirounga leonina),movements of Amazon River dolphins (Sotalia fluviiatilis) (Bishop and Last 1995), foraging patterns of Adeliepenguins (Pygoscelis adeliae) (Davis and Miller 1992), foraging areas of fur seal (Arctocephalus forsteri) (Harcourt andDavis 1997), the migration of Magellanic penguin (Spheniscus magellanius) (Stokes et al. 1997), populationdelineation of polar bears (Ursus maritimus) (Bethke et al. 1996) and wandering albatross (Diomedea exulans)movements in relation to commercial fishing operations (Prince et al. 1992). ARGOS satellite telemetry has provena valuable technique for monitoring long distance movements, such as migrational movements, of large mammals,

birds, and fish. It has not, however, proven capable of measuring fine-scale continuous movements of smaller animals(Rodgers et al. 1996).
Since the mid-1990s GPS telemetry systems have been developed and evaluated for habitat assessment of largeanimals, particularly moose (Alces alces). Studies have examined the effects of differential correction on locationaccuracy (Rempel and Rodgers 1997, Moen et al. 1997), collar performance under forest canopy and other habitatconditions (Rempel et al. 1995, Moen et al. 1996, Dussault et al. 1999), and detailed habitat use (Rodgers et al.1996). GPS telemetry collar designs have also been tested for white-tailed deer (Odocoileus virginianus) and wolves(Canis lupus) (Merrill et al. 1998, Bowman et al. 2000). GPS telemetry provides daily position fixing with sub-100maccuracy under widely varying climatic, topographic and habitat conditions (Rodgers et al. 1996). While this systemhas proven useful for broad-scale studies of large animals, there remain logistical constraints preventing its applicationfor fine-scale studies of small mammals. The size and weight of GPS units are a particular constraint that has meantthat until very recently GPS tracking of an animal with a body weight of less than 20 kg has been difficult, and foran animal weighing less than 10 kg impossible.
METHODS - A "PSUEDO GPS" TELEMETRY SYSTEM
Due to current limitations of GPS telemetry a "psuedo GPS" based tracking system was adopted for tracking andrecording the foraging movements of ferrets in braided riverbeds and semi-arid grasslands of the Mackenzie Basin,New Zealand. Spool-and-line tracking was combined with hand-held GPS position fixing.
We live captured ferrets and used spool-and-line tracking (Anderson et al. 1988) to mark the foraging path of ananimal. We returned to the location of release and followed the spool line while recording the geographic location ofthe spool line as a line feature using a hand-held data-capture GPS unit (Trimble GeoExplorer-2 or GeoExplorer-3).The total length of each spool was approximately 1100 metres. GPS positions were logged at 5- second intervalsresulting in a position fix approximately every 5m along the foraging path. We ensured that positions were recordedat any significant changes in direction along the foraging path. During the GPS capture of the spool line route werecorded vegetation cover, topographic characteristics, and prey characteristics (Table 1). A line segmentation featurewas used to enable changes in each attribute to be recorded for the line feature representing the foraging route of ananimal.
Table 1 Vegetation cover, topography, and prey characteristic attributes recorded for spool line features.
We differentially corrected the GPS data to obtain sub-5 m accuracy in horizontal position (Kaplan 1996) andexported the position and attribute data into a GIS format (ArcView shapefile format). The database that was createdcontained vegetation cover, topography, and prey characteristic attributes for each spool line. The line feature for eachspool line was displayed against a digital aerial photograph background to enable visual interpretation of the foragingmovements. The total distance along a spool line represented by each attribute value was calculated and theproportion of vegetation cover, topographic characteristic, and prey characteristic determined.
Vegetation cover Topography Prey characteristic
Open grassland or moss River bank Rabbit burrow
Open gravel or rock River flat Rabbit carcass
Pasture Terrace slope Animal runway
Scrubland Terrace flat
Forest Toe of terrace
Water Top of terrace
Edge (between cover types) Gully
Dry stream bed
Fence-line
46

Availability of vegetation cover was determined from aerial photography and compared with ferret use of vegetationcover during foraging. We used two spatial measures of predator-prey interaction. First we calculated the nearestdistance from a foraging route to nest locations of ground-nesting birds, and second the average distance from theforaging route to all nests. Banded dotterel (Chararius bicinctus) nest locations were monitored in the field (Norbury1999) and identified and digitised on aerial photographs.
RESULTS - FORAGING MOVEMENTS OF FERRETS
The "psuedo GPS" tracking approach is demonstrated for a female ferret caught and released in early-January 1999toward the end of the bird breeding season. Proximity of nest locations of banded dotterel during the 1998/1999breeding season are shown on the aerial photo (Fig. 1) and provides a graphic representation of the ferret's foragingpath with respect to prey nest locations. Nearest distance from the foraging route to the closest nest was 216m, andthe average nearest distance for all nests was 286m ± 59m. The average distance from the foraging route to all nestswas 502m ± 183m.
Figure 1 Percentage use of vegetation and ground cover by a ferret
The calculation of the proportion of vegetation cover and topographic attributes along the foraging path enableshabitat use by the predator to be measured (Figs 1 and 2). The largest use of vegetation cover was in wild grassland(46%) with considerably less use of gravel, pasture and scrubland (Fig. 1). Notably, 13% of the ferret's use of coverwas in an ecotone or edge between cover types (Fig.1). The ferret's use of topography was dominated by river terraceflat (55%) yet a substantial percentage of use (30%) was attributed to linear features, that is, gullies, river banks, toeof terraces, top of terraces, and fence-lines combined (Fig. 2).
Along the 1km foraging route of this individual two rabbit carcasses were investigated and three rabbit burrowsentered. The ferret made considerable use of animal runways or pathways with approximately 25% of the foragingroute following a runway.
Figure 2 Percentage use of topography by a ferret
DISCUSSION - IMPLICATIONS FOR WILDLIFE RESEARCH
Spool-and-line tracking, coupled with hand-held GPS data capture, provides a useful method for determining andrecording fine-scale foraging movements of small-mammals. The approach demonstrated in this paper highlights
fence-line1% toe of
terrace slope4%
top ofterrace slope
9%terrace slope
15%
river bank13%gully
3%
terrace flat55%
scrubland11%
forest2%
edge (betweencover types)
13%gravel / rock
9%pasture19%
grassland / moss46%
47

48
spatial aspects of predator-prey interactions between introduced mammalian predators and endangered native birds.Important characteristics of this interaction for the introduced ferret in New Zealand that can be determined fromthe approach are detailed habitat and topographic use and proximity of travel path to prey nest locations. Bandeddotterel nest predominantly on open gravel shoals and sparsely vegetated river flats near river channels, while ferretsforage extensively throughout a range a habitat types in braided riverbed landscapes. Initial results from GPS trackingof ferrets suggest that foraging movements near known nest locations are infrequent. A further spatial measure thatcould be calculated using the data derived from this approach is the fractal dimension of the spool line as a measureof the tortuosity of the animal's foraging route (Nams 1997). The "psuedo GPS" tracking system provides astraightforward, though labour intensive, approach for the accurate and detailed collection of fine-scale animalmovement data. Continued developments in GPS telemetry transmitters may eventually allow such data to becollected remotely for small mammals, as is possible for large animals (Rodgers et al. 1996). Such developmentswould be useful for examining other interactions in the Mackenzie Basin such as the spatial proximity of native raptorflight paths to endangered ground nesting bird species, or interactions among different predator species, that are notfeasible with the pseudo GPS approach described here.
ACKNOWLEDGEMENTS
Thanks to the University of Canterbury, the Brian Mason Scientific and Technical Trust, and the Foundation forResearch, Science and Technology for funding this work, and to Richard Heyward, Andrew Crossland, Scott Butcher,Svend Jensen and Department of Conservation staff in Twizel for their assistance.
REFERENCES
Anderson, T.J.C., A.J.Berry, J.N.Amos and J.M. Cook. 1988. Spool-and-line tracking of the New Guiinea spinybandicoot, Echymipera kalibu (Marsupialia, Peramelidae). Journal of Mammalogy, 69: 114-120.
Bethke, R., M.Taylor, S.Amstrup, and F.Messier. 1996. Population delineation of polar bears using satellite collardata. Ecological Applications, 6: 311-317.
Bishop, J. and J.D. Last. 1995. Global radionavigation and location systems for tracking marine mammals.International Journal of Remote Sensing, 16: 1943-1956.
Boonstra, R. and I.T.M. Craine. 1986. Natal nest location and small mammal tracking with a spool and linetechnique. Canadian Journal of Zoology, 64: 1034-1036.
Bowman, J.L., C.O.Kochanny, S.Demarais and B.D. Leopold. 2000. Evaluation of a GPS collar for white-tailed deer.Wildlife Society Bulletin, 28: 141-145.
Davis, L.S. and G.D. Miller. 1992. Satellite tracking of Adelie penguins. Polar Biology, 12: 503-506.
Dussault, C., R.Courtois, J. Ouellet and J.Huot. 1999. Evaluation of GPS telemetry collar performance for habitatstudies in the boreal forest. Wildlife Society Bulletin, 27: 9765-972.
Fancy, S.G., L.F.Pank, D.C.Douglas, C.H.Curby, G.W.Garner, S.C.Amstrup and W.L. Regelin. 1988. Satellitetelemetry: a new tool for wildlife research and management. US Fish and Wildlife Service, Resource Publication 172.55p.
Harcourt, R. and L.Davis. 1997. The use of satellite telemetry to determine fur seal foraging areas. In: MarineMammal Research in the Southern Hemisphere. Vol 1: Status, ecology and medicine. M. Hindell and C. Kemper(eds.). Surrey Beatty & Sons, Sydney, 1997, 137-142.
Harris, S., W.J.Cresswell, P.G.Forde, W.J.Trewhella, T.Woollard and S.Wray. 1990. Home-range analysis usingradio-tracking data - a review of problems and techniques particularly as applied to the study of mammals. MammalReview, 20: 97-123.
Hovland, N. and H.P. Andreassen. 1995. Fluorescent powder as dye in bait for studying foraging areas in smallmammals. Acta Theriologica, 40: 315-320.
Kaplan, E.D. (ed). 1996. Understanding GPS: Principles and Applications. Artech House Publishers, Boston.
Merrill, S.B., L.G.Adams, M.E. Nelson and L.D. Mech. 1998. Testing releasable GPS radiocollars on wolves andwhite-tailed deer. Wildlife Society Bulletin, 26L 830-835.
Miles, M.A., A.A.de Souza and M.M. Povoa. 1981. Mammal tracking and nest location in Brazilian forest with animproved spool-and-line device. Journal of Zoology, 195: 331-347.
Moen, R., J.Pastor, Y.Cohen and C.C. Schwartz. 1996. Effects of moose movement and habitat use on GPS collarperformance. Journal of Wildlife Management, 60: 659-668.
Moen, R., J.Pastor and Y.Cohen, 1997. Accuracy of GPS telemetry collar locations with differential correction.Journal of Wildlife Management, 61: 530-539.
Murie, O.J. 1974. A field guide to animal tracks. Second edition. Houghton Mifflin Company, Boston.
Nams, V.O. 1997. Use of habitat at different spatial scales by red-backed voles. Paper presented at the SeventhInternational Theriological Congress, Acapulco, Mexico, 6-12 September, 1977.
Norbury, G.L. 1999. Predicting predation of braided river birds. In Brown, K.P. Upper Waitaki Basin research andmanagement meeting 1999: objectives, presentations and participants. Project River Recovery Report 99/18,Department of Conservation, Twizel, New Zealand. pp.9.
O'Donoghue, M., S.Boutin, C.J.Krebs and E.J.Hofer, 1997. Numerical responses of coyotes and lynx to thesnowshoe hare cycle. Oikos, 80:150-162.
O'Donoghue, M., S.Boutin, C.J.Krebs, D.L.Murray and E.J.Hofer. 1998a. Behavioural responses of coyotes andlynx to the snowshoe hare cycle. Oikos, 82:169-183.
O'Donoghue, M., S.Boutin, C.J.Krebs, G.Zuleta, D.L.Murray and E.J.Hofer. 1998b. Functional responses ofcoyotes and lynx to the snowshoe hare cycle. Ecology, 79:1193-1208.
Priede, I.G. and J. French. 1991. Tracking of marine mammals by satellite. International Journal of Remote Sensing,12: 667-680.
Prince, P.A., A.G.Wood, T.Barrton and J.P.Croxall.1992. Satellite tracking of wandering albatross (Diomedeaexulans) in the South Atlantic. Antarctic Science, 4: 31-36.
Rebergen, A., R.Keedwell, H.Moller and R.Maloney. 1998. Breeding success and predation at nests of bandeddotterel (Chararius bicinctus) on braided riverbeds in the central South Island, New Zealand. NZ Journal of Ecology.22, 33-41.
Rempel, R.S. and A.R. Rodgers. 1997. Effects of differential correction on accuracy of a GPS animal location system.Journal of Wildlife Management, 61: 525-530.
Rempel, R.S., A.R. Rodgers and K.F. Abraham. 1995. Performance of a GPS animal location system under borealforest canopy. Journal of Wildlife Management, 59: 543-551.
Rodgers, A.R., R.S. Rempel and K.F. Abraham. 1996. A GPS-based telemetry system. Wildlife Society Bulletin, 24:559-566.
Stokes, D.L., P.D. Boersma and L.S. Davis. 1997. Satellite tracking of Magellanic penguin migration. Condor, 100:376-381.
Taillade, M. 1992. Animal tracking by satellite. In Wildlife Telemetry: remote monitoring and tracking of animals.I.G. Priede and S.W. Swift (eds.). Ellis Horwood Ltd, Chichester. pp.149-160.
White, G. and R. Garrett. 1990. Analysis of wildlife radio-tracking data. Academic Press, San Diego.
49


GPS AND ITS USE IN ANIMAL TELEMETRY:THE NEXT FIVE YEARS
Ian A.R. Hulbert
SAC, Hill and Mountain Research Centre, Food Systems Division, Kirkton Farm, Crianlarich, Scotland, FK20 8RU
ABSTRACT
Tracking of animals has been an essential component of human development. Fieldcraft has grown from a trapper'sart into a biologist's science that has been enhanced by the advent of the most recent technology. The constructionof the first VHF radio tags in the early 1950s was crucially dependent on the development of the transistor. However,soon after the launch of the Sputnik and Vanguard satellites in the late 1950s, wildlife biologists began to considerthe possibility of tracking animals from space. Consequently, in 1978, a joint operation between the French NationalSpace Agency and US National Oceanic and Atmospheric Administration created the ARGOS system. ARGOSdepends on an uplink signal from the radio beacon fitted to the animal to one of the ARGOS satellites, before thedata can be retransmitted to a processing centre on earth. Although accuracy is variable, ARGOS was the firstsatellite tracking system that could provide long-term worldwide coverage necessary for management andconservation of many important species. Also in 1978, the first GPS satellites were launched and in 1995 the systembecame fully operational. Unlike ARGOS, however, GPS is simply a navigation tool; only by incorporation ofadditional circuitry has GPS become usable in wildlife telemetry. Nevertheless, GPS is potentially highly accurateand able to provide locations at 1 second intervals, which has enabled biologists to gain a far greater insight intoanimal behaviour than previously available.
Accuracy, precision and signal availability, coupled with tag size and mass, which are ultimately determined by powersupply and microelectronic advances, will be the driving force in GPS telemetry design in the future. Dual frequencyGPS, that enables sub-metre accuracy, will allow extremely detailed analysis of an animal's use of its habitat andperhaps its social behaviour. More sensitive GPS receiving aerials will allow greater deployment on species inhabitingforested and mountainous habitats. Advances in fuel and solar cell technology will raise battery power density whilebattery longevity will be enhanced by the move from 3V to 1V GPS technology. Both advances will enable longerdeployment, greater data acquisition and, if required, the development of smaller tags, all of which will allow a greaterunderstanding of the biology of many terrestrial and marine species. The potential integration of GPS with mobilephone technology and/or ARGOS will provide flexible data retrieval and will assist in gaining a greater understandingof the movement and behaviour of many non-recoverable animals.
GPS satellite telemetry offers many opportunities, but perhaps the greatest are the quality and quantity of datapotentially available combined with an ability to quantify the data unlike any other tracking tool.
INTRODUCTION
Tracking of animals has been an essential component of human development. Although the precise significance ofthe prehistoric cave paintings from Lascaux in France dating from 15,000 years BP remains unknown, people of thattime were clearly tracking and hunting animals for food and perhaps early domestication. Furthermore, the rock artof Alta in Norway, from 4000 years BP, demonstrates that man in these northern latitudes had mastered the art offollowing large herds of reindeer across vast distances and indeed had already partly domesticated these wild animals.However, tracking and hunting of animals is probably best epitomised by the fur trappers and hunters of northernAmerica and in particular the exploits of the Hudson Bay Company. Such fieldcraft has grown from a trapper's artinto a biologist's science that has been enhanced by the advent of the most recent technology. The meticulous fieldtracking of lynx (Lynx lynx) by Haglund (1966), and foxes (Vulpes vulpes) by Murie (1936) and Tinbergen (1965)demonstrate the rewards of systematic tracking, but for many studies, clever deductions were necessary to determineanimal behaviour because so many animals, in particular mammals, elude direct observation. Indeed, apart fromduring the winter months when snow cover provided a suitable substrate for tracks, tracking at any other times ofthe year was limited to mere glimpses of an animal's lifestyle. The development of radio-telemetry and theconstruction of the first VHF radio-tags in the early 1950s represented a revolution in the tools available to wildlifebiologists. Since then technology has progressed rapidly with transmitter weight now down to less than 0.5g and tag
51

complexity greatly enhanced. However, as soon as the Sputnik and Vanguard satellites were launched in 1957 and1958 respectively, wildlife biologists began to consider the possibility of tracking animals from space and a parallelrevolution in the tools available to wildlife biologists was to take place. In this paper, I will provide a brief historicaloverview of the development of satellite based telemetry systems and GPS in particular. I will also describe theimprovements in understanding required by both users and manufacturers in their definitions of accuracy andprecision and how both measures should be recorded. I will then proceed with an overview of potential futuredevelopments in GPS based satellite telemetry. Lastly, I will demonstrate how data derived from GPS based satellitetelemetry systems can be used as a powerful research tool in predicting the behaviour of animals.
SATELLITE TELEMETRY
Approximately 60,000 conventional VHF radio telemetry tags are produced each year (Brian Creswell, Biotrack Ltd.& Dave Ward, Sirtrack Ltd., Personal Communication), However, VHF radio-telemetry is limited to the radio-horizon and consequently most animals fitted with such tags are tracked by foot, car, boat or in some cases by airplane(Kenward 1987). However, these techniques are of limited usefulness with larger animals, which can travel greatdistances in a short time in places inhospitable to man. This was a problem waiting for space technology to solve,which provided the impetus to move from very simple low-cost tags to highly sophisticated and efficienttransmitter/receivers tracked by satellite.
The north-American elk (Cervus elaphus) was the first animal to be tracked from space (Craighead et al. 1972) usingthe early ILRS system. Essentially the distance between the satellite and elk was determined by measuring thepropagation time of a radio frequency pulse in much the same way as radar operates. Knowing the position of thesatellite relative to the earth allowed the location of the elk to be calculated (French 1994).
Almost as soon as the first satellites were launched, NASA was investigating the potential role that satellite systemsmight have for wildlife tracking and the requirements of a number of potential users (Garvin et al 1972). NASA alsolooked closely at the available technology pointing the way towards random access Doppler location. With somelimitations of performance, this principle could work with just one satellite and with care the mass of the animaltransmitter could be kept below 100g (French 1994). Consequently, in 1978, a joint operation by the FrenchNational Space Agency (CNES) and the US National Oceanic and Atmospheric Administration (NOAA), as part ofthe NIMBUS program, created the ARGOS satellite system, making it available for approved experiments, includingwildlife telemetry.
Currently two ARGOS satellites (plus spares) orbit the earth in a polar plane between 830km-870km above the earth,set to maintain their motion synchronous with the sun and as a result they are visible at roughly the same local timeeach day (French 1994). At any instant the ARGOS satellites view a circular area 2500km in diameter. A smalltransmitter known as a Platform Terminal Transmitter (PTT) beacon or tag is attached to the animal or object to betracked. Each tag transmission is uniquely identified and at the satellite these timed transmissions are stored by taperecorders before being relayed back to earth via a radio-uplink command from one of three ground stations. Onceprocessed this data can be accessed round the clock from anywhere in the world, using the world wide web.
Although location error varies between 100m and 4000m (Harris et al 1990, Keating et al 1991, Keating 1994,Britten et al 1999), by its very nature the ARGOS system can handle data on a world scale, bringing difficult workinto the realm of sensible economics for the first time (French 1994). The first work in the UK was on basking shark(Cetorrhinus maximus) (Preide 1983), but others have tracked the wandering albatross (Deomedea exulans) over2000km-15,000km flights (Jouventin & Weimerskirsh 1990). Approximately, 1000 ARGOS PTTs are deployedeach year (Anne-Marie Breonce, CLS ARGOS, Pers. Comm.)
At the same time that the ARGOS satellites were deployed, the first GPS satellites were launched. Engineered byRockwell Collins, over 30 satellites have been put into orbit since 1978 and the system became fully operational in1995. Wildlife can be tracked by incorporation of a GPS unit in a radio-telemetry collar (Rodgers & Anson 1994,Rempel et al 1995, Rodgers et al 1996, Hulbert et al 1998). GPS collars calculate positions with information receivedfrom a set of 24 satellites orbiting the earth (Hurn 1989). Each satellite continuously broadcasts radio-signals toearth and a GPS receiver must simultaneously receive signals from at least 3 satellites to calculate a position.
The potential accuracy of GPS locations is considered to be <1 m (Capaccio et al. 1997), but until May 2000 theiraccuracy was downgraded by a process known as Selective Availability (SA), whereby signal errors were intentionallyinduced by the US Department of Defense (Hurn 1989). Consequently, either uncorrected GPS or post-processeddifferential GPS (Morgan-Owen & Johnston 1995) were conventionally used in mapping or wildlife studies (Edenius1997; Moen et al.1996; Moen et al 1997; Rempel & Rodgers 1997; Webster & Cardina 1997). The accuracy of
52
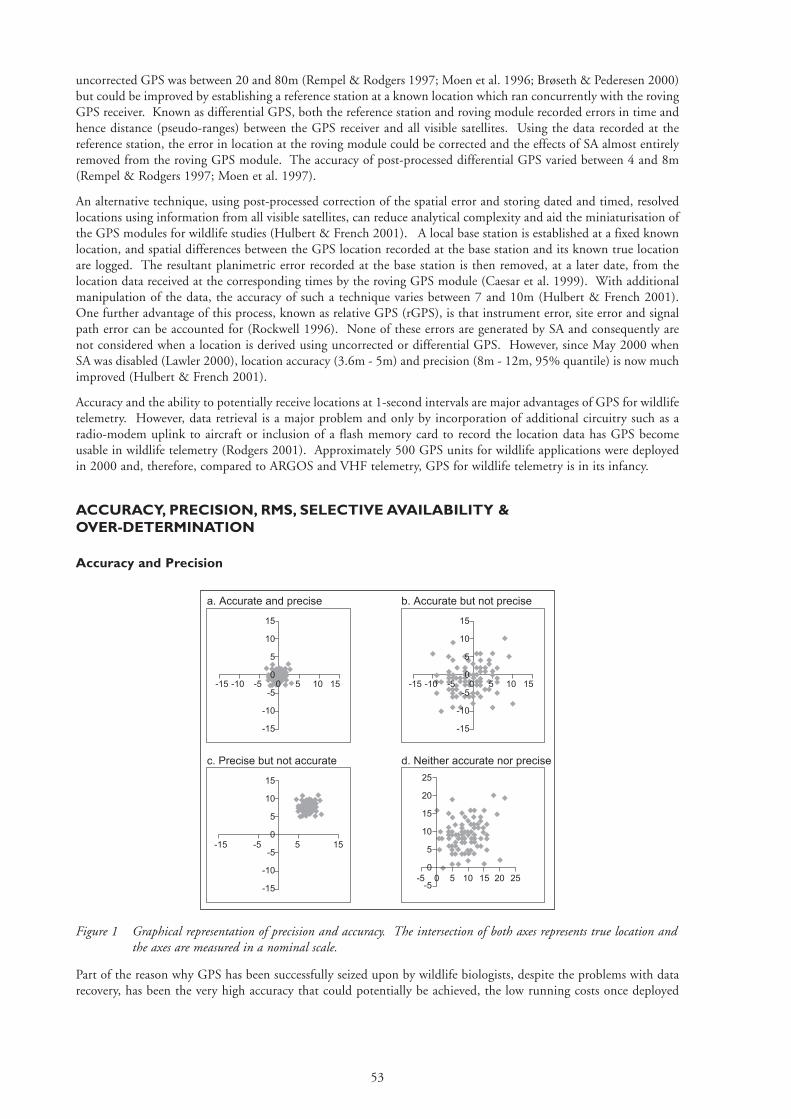
uncorrected GPS was between 20 and 80m (Rempel & Rodgers 1997; Moen et al. 1996; Brøseth & Pederesen 2000)but could be improved by establishing a reference station at a known location which ran concurrently with the rovingGPS receiver. Known as differential GPS, both the reference station and roving module recorded errors in time andhence distance (pseudo-ranges) between the GPS receiver and all visible satellites. Using the data recorded at thereference station, the error in location at the roving module could be corrected and the effects of SA almost entirelyremoved from the roving GPS module. The accuracy of post-processed differential GPS varied between 4 and 8m(Rempel & Rodgers 1997; Moen et al. 1997).
An alternative technique, using post-processed correction of the spatial error and storing dated and timed, resolvedlocations using information from all visible satellites, can reduce analytical complexity and aid the miniaturisation ofthe GPS modules for wildlife studies (Hulbert & French 2001). A local base station is established at a fixed knownlocation, and spatial differences between the GPS location recorded at the base station and its known true locationare logged. The resultant planimetric error recorded at the base station is then removed, at a later date, from thelocation data received at the corresponding times by the roving GPS module (Caesar et al. 1999). With additionalmanipulation of the data, the accuracy of such a technique varies between 7 and 10m (Hulbert & French 2001).One further advantage of this process, known as relative GPS (rGPS), is that instrument error, site error and signalpath error can be accounted for (Rockwell 1996). None of these errors are generated by SA and consequently arenot considered when a location is derived using uncorrected or differential GPS. However, since May 2000 whenSA was disabled (Lawler 2000), location accuracy (3.6m - 5m) and precision (8m - 12m, 95% quantile) is now muchimproved (Hulbert & French 2001).
Accuracy and the ability to potentially receive locations at 1-second intervals are major advantages of GPS for wildlifetelemetry. However, data retrieval is a major problem and only by incorporation of additional circuitry such as aradio-modem uplink to aircraft or inclusion of a flash memory card to record the location data has GPS becomeusable in wildlife telemetry (Rodgers 2001). Approximately 500 GPS units for wildlife applications were deployedin 2000 and, therefore, compared to ARGOS and VHF telemetry, GPS for wildlife telemetry is in its infancy.
ACCURACY, PRECISION, RMS, SELECTIVE AVAILABILITY & OVER-DETERMINATION
Accuracy and Precision
Figure 1 Graphical representation of precision and accuracy. The intersection of both axes represents true location andthe axes are measured in a nominal scale.
Part of the reason why GPS has been successfully seized upon by wildlife biologists, despite the problems with datarecovery, has been the very high accuracy that could potentially be achieved, the low running costs once deployed
15
10
5
0
-5
-10
-15
a. Accurate and precise b. Accurate but not precise
15
10
5
0
-5
-10
-15
-15 -10 -5 0 5 10 15
15
10
5
0
-5
-10
-15
-15 -5 5 15
c. Precise but not accurate d. Neither accurate nor precise
25
20
15
10
5
0
-5-5 0 5 10 15 20 25
-15 -10 -5 0 5 10 15
53

(Lindzey et al 2001) and the ability to work in inhospitable terrain (Haller & Imfeld 2001). However, unless thereis a clear understanding of how accuracy is measured and the units by which is it measured, the future successfulintegration of GPS and wildlife telemetry will continually be hampered. Unlike every other radio-telemetrytechnique, the accuracy and precision of GPS data can be quantified statistically. Precision is defined by the receiveritself, to the fourth decimal of a minute of an arc of longitude. If nothing else were to affect the signals, all locationsat the equator should be within a circle of diameter 180cm (Rockwell 1996). However, at increasing degrees oflatitude to the north and south, this value declines and at 56 degrees north, for example, all locations should bewithin a circle of diameter 100cm. However, by contrast, accuracy is external to the receiver and embodies anelement of mapping error, jitter in the clocks used in the receivers and in the satellites and also includes errorassociated with the atmosphere. Accuracy is therefore a measure against true location. The implications of theseterms for the wildlife biologist are best illustrated in Figure 1. The best scenario would be to achieve highly accurateand precise locations (Fig. 1a), but, more likely, precision has been compromised (Fig. 1b). In some scenarios andespecially where the locations are consistently inaccurate, it may be necessary to add an offset into the data set tobring the locations back to their true position (Figs. 1c & d).
RMS
Conventionally, GPS accuracy and precision values are measured in RMS. In essence, RMS is the root mean squareof a number and for GPS applications equates to the average error measured over a predetermined period of time(Zar 1984). However, as with all statistics, RMS is valueless if the scale (radii or diameters) is not defined and thepopulation size unknown. For satellite GPS telemetry, the population size should equate to a combination of thenumber of successful location attempts at a single known location over a known length of time. Clearly RMScalculated for a known location over a short period can be quite different from RMS calculated over a far longerperiod (Fig 2, a & b) and indeed, depending on the window of time chosen, sub-meter accuracy can even be achieved(Fig 2, c). However, such results are meaningless. In an extensive study of GPS accuracy, Hulbert & French (2001)demonstrated a more meaningful measure of RMS obtained over a 24 hour period using data collected at 5-secondintervals. In such circumstances, mean accuracy was between 3.6 and 5m and precision measured by the 95%quantile was between 8 and12m. It is recommended that all future research should define accuracy as mean errorfrom true location and precision as the value in which 95% of locations are likely to be found.
Figure 2 Latitude (�) in OS Northings (units in meters) at known true location ( ...... ) recorded at 5 second intervalsand plotted against a 30 minute window of time on the 28th September 2000 using a Rockwell 12 Channelreceiver. SA disabled. N=320. Technique described in detail in Hulbert & French (2001).
Selective Availability (SA)
The future of GPS as a wildlife tool has undoubtedly been enhanced by the removal of SA. However, manufacturersstill provide users with differential collars that are supposed to have the ability to correct for errors previously maskedwhen SA was enabled. However, with SA disabled, the errors in accuracy and precision are less than one-third of that
73106
731059
731058
731057
731056
731055
731054
731053
32200 32400 32600 32800 33000 33200 33400 33600 33800 34000Seconds from midnight
Long
itude
in O
S N
orth
ings
(U
nits
in m
eter
s)
a. 30 minutes
b. 2 minutes
c. 10 minutes
54

when SA was enabled (Table 1). Although differential correction can compensate for clock and ephemeris errors,delays due to the ionosphere and troposphere are entirely dependent on the distance between the differentialreference station and the mobile receiver. The greater the distance between the reference station and the mobilereceiver, the greater the likelihood of such errors arising (Rockwell 1996). Other techniques may be more appropriatefor improving accuracy, that do not require expensive and over-developed techniques.
Table 1 The range of errors that impact on GPS accuracy and precision. (c) www.collins.rockwell.com
Over-determination
A cost-effective, non-differential solution that can improve GPS performance and additionally can provide significantimprovements in GPS accuracy and precision, is demonstrated in Table 2. At present all GPS receivers should havethe ability to be pre-programmed to calculate a location from as many visible satellites as possible (known as over-determination) up to a maximum of 5, 8, 12 or 16 satellites, depending on the number of channels available on eachboard. The principle is identical to over triangulating a location using conventional VHF telemetry (Kenward 1987).However, virtually all GPS receivers currently available have been pre-programmed by the manufacturers to calculatea location from the best 3 or 4 satellites, providing 2D or 3D locations respectively, regardless of how many satellitesare actually visible. Clearly as can be seen in Table 2, changing the internal programming of the receiver so that ithas the ability to use more satellites to calculate a location, is a more efficient technique of reducing error. Indeed theability to obtain such data gives the user a better understanding of which satellite configurations need to be discarded,in order to improve accuracy (Hulbert & French 2001).
Table 2 Error in meters from true location for a range of satellite combinations using a 12-channel GPS receiver,programmed to over-determine location by using data from all visible satellites. GPS receiver deployed over 24hours at known true location and data collected every 5 seconds. N = 15,790. Hulbert & French (2001)
Number of satellites used Error in meters from Percentage to calculate a location true location frequency
=4 8.9 0.4
5 6.5 6.3
6 5.6 22.7
7 4.4 36.3
8 5 16.1
9 3.9 10.5
10 5.0 4.8
11 3.5 1.9
12 2.3 1.0
Error type Error in meters
Selective Availability (SA) 30-150m
Ionospheric aberrations 3-30m
Tropospheric variability 3-30m
Ephemeris error 3m
Clock inaccuracies < 1m
Multi-path < 1m
Noise errors +/- 3m
55

FUTURE DEVELOPMENTS
In all fast moving technologies, current components are usually out of date by the time they reach the market place,and the development of GPS for wildlife studies is no exception. In this section I have generally kept within a five-year time span, as developments unforeseen will probably occur beyond five years. Indeed, five years virtually doublesthe current life span of GPS in telemetric studies of wildlife (Rodgers 2001). Nevertheless, several advances are likelyand include 1) further improvements in accuracy and precision, 2) the introduction of Galileo, 3) advances in celland micro-electronic technology and 4) the role that Galileo, ARGOS, satellite telephony, GSM and otherconventional radio-telemetric techniques have in complementing the data obtained using GPS.
Accuracy and precision
Presently, an intense modernisation process is being prepared that will result in substantial benefits for military andnon-military users of GPS satellites. Satellites are being refurbished and there is greater control of their integrity. Suchprogress is being driven by the needs of the most demanding users - civil aviation. Perhaps the most significantadvance that will occur within the next five years, is the introduction of additional frequencies for the non-militaryuser, which will eliminate the refraction errors that occur when the signals travel through the ionosphere. The currentL1 and L2 carrier frequencies will both soon become available to the civilian user and additional L3 carrier frequencywill become available from 2006 (Montgomery 2000). As a result, sub-metre accuracy will eventually be possible,enabling more rigorous setting and testing of hypotheses. For example, improved accuracy should enable betteranalysis of habitat use. Typical VHF radio-triangulation error for wildlife studies can vary between 70-500m(Springer 1979, Schober et al. 1984) and only very broad hypotheses can be tested (Hulbert et al. 1996a, 1996b,2001), although for hand-tracking techniques, where animal location is ultimately confirmed visually, this is notproblem. With current GPS technology, the foraging behaviour of free-ranging animals can be studied at the scaleof 10-20m (Turner et al. 2000, Hulbert et al. unpublished manuscript), but in the near future it may be possible,with clever applications, to work at the scale of the herbivore bite (Penning 1983). This level of detail will provideunprecedented data quality, that may provide the information necessary to determine the mechanistic basis ofherbivore foraging strategies. Sub-metre accuracy recorded at 1-second intervals may also lead to a betterunderstanding of the interactions that occur between individuals of the same species and perhaps between species, asin Mech's (1967) study of a fox tracking a snowshoe hare to a kill. Detailed population studies, that until recentlyrequired vast resources and often were quite impossible, may one day become routine, while studies of neonatalbehaviour, linked with mothering ability and foraging success will enable biologists to gain a better understanding ofwhy some individuals are more successful at foraging than others.
Galileo
During the last decade, the EU tried to become more involved with further developments in GPS (Legat &Hofmann-Wellenhof 2000; Lechner & Baumann 2000). However, the USA declared that GPS must remain undernational control and consequently the EU decided to develop its own system leading to EGNOS, which is widelyconsidered to be a precursor to the future Galileo Global Navigation Satellite System (GNSS). Unlike GPS, Galileowill be an open and global system under international civil control, fully compatible and interoperable with GPS.Galileo users will have access to at least two civilian carrier frequencies, which eliminate ionospheric refraction, andthe basic navigation service will be as good as the modernised GPS. Assuming the EU ratifies the development ofGalileo, the first satellites should be launched in 2003, with full service available from 2008.
Galileo and GPS may, on the one hand, be considered as competitors, but on the other, Galileo will be compatibleand interoperable with GPS, which will involve huge benefits to the civilian user and not least the wildlife biologist.The two systems could be used alternately or in combination, resulting in far better overall performance. Martin &van Diggelen (1997) demonstrated the benefits of combining two Global Navigation Satellite Systems (GPS &Russia's GNSS - GLONASS); improved satellite availability, increased system integrity and improved accuracy. Atpresent a major limitation of GPS occurs within wooded (Phillips et al. 1998, Dussault et al. 1999) and mountainousenvironments (Haller & Imfeld 2001) where the number of satellites visible is usually half, if not less than, thatvisible in open environments. The future integration of GPS and Galileo will therefore provide enormous benefitsto the wildlife community.
Advances in micro-electronic and cell technology
The capabilities of GPS receiving units have progressed rapidly over the last 10 years (Rodgers 2001) and it is likelythat similar progress will be made in the future. It is likely that improvements will first be noticed in antenna design,
56

57
which will become more efficient and receiver components, which will become both more efficient and moresensitive. Efficient antennas will result in a decrease in time to first fix, reducing power demands, while within thenext 12 months GPS receiver manufacturers will replace the current 3V receiver with the 1V receiver which willsimilarly reduce power demands. However, an additional benefit of 1V technology will be the availability of a widerrange of power supplies, all of which are more efficient and less environmentally damaging than the lithium batteriescurrently used. More sensitive receivers will enable applications in environments with a restricted view of the sky,especially studies of animals inhabiting wooded environments where signals from the satellites are attenuated in theleaf canopy. For wildlife applications, GPS locational data usually have to be stored on a flash card within the GPSanimal collar. However recent developments involving onboard memory capable of storing up to 90k locations areavailable (von Hunerbein & Ruter 2001).
However, despite all the rapid advances in micro-electronic technology over the last decade and what is expected inthe next few years, battery technology has been very slow in progressing. Power density has remained low despiteyears of research, although the development of 1V receivers will reduce the problem. Currently, the most efficientbatteries available for conventional VHF radio-telemetry are the zinc-air batteries that simply use air as one of theelectrodes. Commonly used for bird tags, there is a possibility that such batteries may become available to powerGPS units. Recently technology has advanced to such an extent that powerful enough solar powered GPS/ARGOStags are available. Obviously they require daylight to function but, coupled with a rechargeable battery, solar powerwill enable tags to be deployed for extensive periods of time. Probably the most exciting developments in batterypower will come through fuel cells. In simple terms, a fuel cell is an electrochemical energy conversion device withtwo oppositely charged electrodes, that produces electricity, water and heat from a fuel and an oxidant. The fuel usedin fuel cells is hydrogen and the oxidant is air. Unlike batteries, fuel cells do not store energy but rather convertenergy as long as the reactants are being supplied. In practice, the hydrogen will be in the form of a proton exchangemembrane stored onboard the tag, which has free contact with the air. Large manufacturers such as Ballard Inc. andPlug Power Inc. expect such cells to be available in the next 3-5 years. Such advances in antenna and receiver designand battery power will save on additional components and circuitry, will enable more diverse applications and willresult in savings in power consumption which will ultimately result in improved tag design and reduced tag mass.
Figure 3 Locations of one Scottish Blackface hill sheep (y143) occupying a complex habitat mosaic. Data collected at 20minute intervals during the month of July 1998.
Data retrieval
Perhaps the greatest limitation to the universal use of GPS revolves around data retrieval (Rodgers 2001). However,perhaps the most exciting development yet is the future integration of GPS with various other radio technologies.Some manufacturers already produce GPS/ARGOS enabled collars, which locate using GPS and retransmit the datathrough the ARGOS satellites to later download through a PC (Rodgers et al 1997, 1998, Bennet et al 2001, Biggset al 2001). A major limitation however, is that a maximum of 7 locations per day can be transmitted to the satellites.Integration of GPS with satellite telephony or the GSM mobile telephone network may provide another solution to
0 0.1 0.2
Kilometers
Vegetation community groups
Nardus stricta - Juncus squarrosus grasslandCalcareous flushesCalluna - Vaccinium HeathFern dominated communitiesFestuca - Agrostis grasslandJuncus acutiflorus mireMontane moss heathPeatland mire communities

data retrieval. Again such collars are available and essentially, the collar is programmed to determine locations usingGPS and once each day links with the GSM or satellite telephony provider to download the collected data via amodem (Shulte & Fielitz 2001). Finally, it is proposed that Galileo offer a two-way link between the receiver on earthand the satellite (Legat & Hofmann-Wellenhof 2000). The GPS receiver will locate itself and the data will be re-transmitted back to the satellites before further downlink to a ground station. Obviously quite sophisticatedelectronics are involved but do provide a solution to problems retrieving data, especially on animals that can neverbe recaptured again.
GPS: a powerful research tool
With high accuracy and potential location of animals every second, the role of GPS as a powerful research tool cannotbe underestimated. For example, combined with accurate habitat maps at a resolution similar to the accuracy of theGPS data, it is now possible to carry out detailed studies of the foraging behaviour of free-ranging herbivores (Fig.3, Hulbert et al., Unpublished manuscript). In the future, by careful interpretation of the data, it may becomepossible to separate foraging bouts from ruminating bouts. Such data can then be transposed into a modellingenvironment (Beecham & Farnsworth 1998, Farnsworth & Beecham 1999) which will allow for the testing andstrengthening of current computer-based grazing models, to ensure that the applicability of such tools can bewidened. Such models will then provide reliable guidance for future research, provide assistance for a wide range ofpractical situations and consequently support policy decisions at the larger scale.
CONCLUSIONS
GPS satellite telemetry is in its infancy and as a result many problems still need to be resolved, both technically andin its application. For the wildlife biologist, a better understanding of the quality of data that GPS can provide andhow it is measured, is required. Although, the future development of GPS is largely at the mercy of governmentagencies and large commercial users, in particular the military, civil aviation companies and oil companies, thewildlife telemetry companies that produce GPS tags for animals have been and will undoubtedly in the future beinnovative in the products that they provide to biologists. With careful use, the data provided by GPS can beextremely valuable and demonstrates that GPS is an indispensable addition to the many tools available to wildlifebiologist for tracking animals.
ACKNOWLEDGEMENTS
I wish to acknowledge the help and support kindly provided by John French (Mariner Radar Ltd, Lowestoft, UK)while developing SAC's GPS program. I would also like to acknowledge the information provided by Per-ArneLemnell and Tom Alanko (www.positioning.televilt.se), Leszek Meczarski (www.Lotek.com), Paul Howey(www.microwavetelemetry.com), Brian Cresswell (www.biotrack.co.uk), David Ward (www.sirtrack.landcare.cri.nz),Anne-Marie Breonce (www.cls.fr) and Jonathan Beecham (www.sari.mluri.ac.uk). SAC receives financial supportfrom the Scottish Executive Rural Affairs Department.
REFERENCES
Beecham, J.A. & Farnsworth K.D. 1998. Animal foraging from an individual perspective: an object orientatedmodel. Ecological Modeling, 113, 141-156
Bennet K.D., Biggs, J.R. & Fresquez P.R. 2001. Determination of location error associated with global positioningsystem radio collars in relation to vegetation and topgraphy. Western North American Naturalist. In Press.
Biggs, J.R. Bennettt, K.D., Fresque, P.R. 2001. Relationship between home-range characteristics and the probabilityof obtaining successful global positioning (GPS) collar positions for elk in New Mexico. Western North AmericanNaturalist: in press.
Britten, M.W., Kennedy, P.L. & Ambrose, S. 1999. Performance and accuracy evaluation of small satellitetransmitters. Journal of Wildlife Management, 63, 1349-1358.
Brøseth, H. & Pederesen, H. Chr. 2000. Hunting effort and game vulnerability studies on a small scale: a newtechnique combining radio-telemetry, GPS and GIS. Journal of Applied Ecology, 37, 182-190.
Capaccio, S., Lowe, D., Walsh, D.M.A. & Daly, P. 1997. Real-time differential GPS/Glonass trials in Europe usingall-in-view 20 channel receivers. Journal of Navigation, 50, 193-208.
58

Caesar, J., Hermy, M., Vernhagen, R. & Coppin, P. 1999. Appropriateness of the linear correction method for GPSpositional fixes in wildlife studies. Wildlife Biology, 5, 125-128.
Craighead F.C. Craighead, J.J. Cote, C.E. & Buechner H.K. 1972. Satellite and ground radiotracking of elk. Animaloreintation and navigation, NASA Report SP262.
Dussault, C., Courtois, R., Ouellet, J-P. & Huot, J. 1999. Evaluation of GPS telemetry collar performance forhabitat studies in the boreal forest. Wildlife Society Bulletin, 27, 965-972
Edenius, L. 1997. Field test of a GPS location system for moose Alces alces under Scandinavian boreal conditions.Wildlife Biology, 3, 39-43.
Farnsworth, K.D. & Beecham, J.A. 1999. How do grazers achieve their distribution? A continuum of models fromrandom diffusion to the ideal free distribution using biased random walks. American Naturalist 153, 509-526.
French J. 1994. Wildlife telemetry by satellite. Endeavour 18: 32-37
Garvin L.E. Henriksen, S.W. Liskov, N.A. Pascucci R.P. & Ziolowski F. 1972. Satellite wildlife research program,final technical report. NASA Report TR-1424
Haglund B. 1966. Winter habits of the lynx (Lynx lynx L.) and wolverine (Gulo gulo L.) as revealed by tracking inthe snow. Viltrevy 4., 299.
Haller R. & Imfeld S. 2001. Evaluation of GPS-Technology for Tracking Mountain Ungulates: VHF-Transmittersor GPS-Collars. This Volume.
Harris R.B., Fancy S.G., Douglas, D.C., Garner G.W., Amstrup, S.C. McCabe, T.R., Pank, L.F. 1990. Trackingwildlife by satellite: current systems and performance. US Fish and Wildlife Service Fish Wildlife Technical Report30, 53pp.
Hulbert, I.A.R., Iason, G.R., & Racey, P.A. 1996a. Habitat selection in a stratified upland landscape of twolagomorphs with different feeding strategies. Journal of Applied Ecology, 33, 315-324
Hulbert, I.A.R., Iason, G.R., Elston, D.A. & Racey, P.A. 1996b. Home-range sizes in a stratified upland landscapeof two lagomorphs with different feeding strategies. Journal of Applied Ecology, 33, 1479 - 1488.
Hulbert, I.A.R., Wyllie, J.T.B., Waterhouse, A., French, J. & McNulty, D. 1998. A note on the circadian rhythm andfeeding activity of sheep fitted with a lightweight GPS collar. Applied Animal Behaviour Science, 60, 359-364.
Hulbert, I.A.R., Iason, G.R., Mayes R.W. 2001. The flexibility of an intermediate feeder: Dietary selection bymountain hares using faecal n-alkanes. Oecologia In Press.
Hulbert I.A.R & French J 2001. The accuracy of GPS for animal telemetry and habitat mapping. Journal of AppliedEcology, In Press.
Hurn, J. 1989. GPS: a guide to the next utility. Trimble Navigation Ltd, USA.
Jouventin P. & Weimerskirsh H.1990 Satellite tracking of wandering albatrosses. Nature 343 746-749
Keating, K.A., Brewster, W.G. & Key, C.H. 1991. Satellite telemetry : performance of animal tracking systems.Journal of Wildlife Management 55: 160-171.
Keating K.A. 1994. An alternative index of satellite telemetry location error. Journal of Wildlife Management 58:414-421.
Kenward R. 1987. Wildlife Radio Tagging. Equipment, Field Techniques and data analysis. Academic Press, London.
Lawler, A. 2000. Scientists gain access to sharper GPS signal. Science, 288, 783.
Lechner W. & Baumann S. 2000. Glabla navigation satellite systems. Computers and Electronics in Agriculutre 25:67-85.
Legat K. & Hofmann-Wellenhof B. 2000. Galileo or for whom the bell tolls. Earth Planets Space 52, 771-776.
Lindzey, F. Sawyer, H. Anderson C. & Banulis B. 2001. Use of GPS collars to document movement and activitypatterns of mule deer, mountain lions and elk in Wyoming, USA. This Volume.
Martin W. & van Diggelen F. 1997. GPS+GLONASS Technology Into the next generation of Global PositioningTools.
59

Mech L.D. 1967. Telemetry as a technique in the study of predation. Journal of Wildlife Management 31: 492-496.
Murie, A. 1936. Following fox trails. Univ. Mich. Mus. Zool. Misc. Publ. 32: 1-45.
Moen, R., Pastor, J., Cohen, Y. & Schwartz, C.C. 1996.. Effects of Moose movement and habitat use on GPS collarperformance. Journal of Wildlife Management, 60, 659-668.
Moen, R., Pastor, J. & Cohen, Y. 1997. Accuracy of GPS telemetry collar locations with differential correction.Journal of Wildlife Management, 61, 530-539.
Morgan-Owen, G.J. & Johnston, G.T. 1995. Differential GPS positioning. Electronics and CommunicationEngineering Journal, 7, 11-21.
Montgomery, K. 2000. GPS III and Modernization, Newsletter of the Institue of Navigation 10: 7.
Penning,P.D. 1983. A technique to record automatically some aspects of grazing and ruminating behaviour in sheep.Grass and Forage Science 38: 89-96
Phillips K.A., Elvey C.R., Abercrombie C.L. 1998. Applying GPS to the study of primate ecology: a useful tool?American Journal of Primatology 46: 167-172.
Preide I.G. 1983. A basking shark (Cetorrhinus maximus) tracked by satellite together with simultaneous remotesensing. Fisheries Research 22,
Rempel, R.S., Rodgers, A.R. & Abraham, K.F. 1995. Performance of a GPS animal location system under borealforest canopy. Journal of Wildlife Management 59, 543-551.
Rempel, R.S. & Rodgers, A.R. 1997. Effects of differential correction on accuracy of a GPS animal location system.Journal of Wildlife Management, 61, 530-539.
Rockwell 1996. Zodiac GPS Receiver Family Designer's Guide. Rockwell.
Rodgers A.R. 2001.Tracking animals with GPS: the first 10 years. This Volume
Rodgers A.R. & Anson P. 1994. Animal-borne GPS: tracking the habitat. GPS World 5, 20-32.
Rodgers, A.R., Rempel, R.S. & Abraham, K.F. 1996. A GPS-based telemetry system. Wildlife Society Bulletin 24,559-566.
Rodgers, A.R., Remple, R.S., Moen, R., Paczkowski, J., Schwartz, C, lawson, E.J. & Gluck, M.J. 1997. GPS collarsfor moose telemetry studies: a workshop. Alces 33: 203-209.
Rodgers, A.R., Tomkiewicz, S.M., Lawson, E.J., Stephanson, T.R., Hundertmark, K.J., Wilson, P.J., White B.N., &Rempel R.S. 1998. New technology for moose management: a workshop. Alces 34: 239-244.
Schulte, R. & Fielitz U. 2001. High performance GPS Collars, use of the latest available technology. This Volume
Schober, F., Marhold, A. & Sommer, F. 1984. The troublesome errors in common techniques of radio-triangulation.In H.P. Kimmich & H.-J. Klewe (eds) Biotelemetry VIII. Kimmich/Klewe, Nijmegen, Netherlands, pp 379-382.
Springer T.J. 1979. Some source of bias and sampling error in radio-traingulation. Journal of Wildlife Management.43, 926-935
Tinbergen N 1965. Von den Vorratskammern des Rotfusches (Vulpes vulpes L.) Z. Tierpsychol., 22, 119-149.
Turner L.W. Udal, M.C., Larson B.T. & Shearer S.A. 2000. Monitoring cattle behaviour and pasture use with GPSand GIS. Canadian Journal of Animal Science 80, 405-413.
von Hunerbein K. & Ruter E. 2001. A very lightweight flight recorded for homing pigeons based on GPS andexamples of tracks. (This Volume)
Webster, T.M. & Cardina J. 1997. Accuracy of a Global Positioning System (GPS) for weed mapping. WeedTechnology 11: 782-786.
Zar J.H. 1984. Biostatistical Analysis. Prentice Hall International, New Jersey.
60

61
EVALUATION OF GPS-TECHNOLOGY FOR TRACKINGMOUNTAIN UNGULATES:VHF-TRANSMITTERS OR GPS-COLLARS?
Ruedi Haller1, Flurin Filli1 and Stephan Imfeld2
1 Swiss National Park, Chasa dal Parc, 7530 Zernez, Switzerland 2 Department of Geography, GIS Division, University of Zurich, Winterthurerstrasse 190, CH-8057 Zurich
ABSTRACT
In the Swiss National Park (SNP), ungulates are tracked to study interactions of the animals with their environment,although telemetry in the SNP is limited by a number of constraints. A system using fixed VHF antennas wasplanned, established and tested and compared with the use of GPS collars as an alternative. Test results on VHFtelemetry showed an average error in angle of 14.5o, resulting in an average error in distance of 342.9m. The averagedistance error with non-differential GPS was 78.8m. The planned use of fixed VHF antennas in the SNP wasabandonned in favour of GPS collar tracking.
INTRODUCTION
There is a long tradition of research projects on mountain ungulates in the Swiss National Park (SNP). For example,the ungulates have been counted once a year since 1918. In the last 50 years, several studies have been conducted onred deer (Cervus e. elaphus), roe deer (capreolus capreolus), ibex (capra i. ibex) and chamois (rupicapra rupicapra) (Filli2000; Scheurer 1987 and Haller, in prep.). In 1992 a project was initiated to provide the basic information neededfor the management of ibex in the region (Buchli and Abderhalden 1998), in which VHF-Telemetry was used in theSNP for the first time. Today, studies focus on ecosystem development with high densities of ungulate populations(Haller in prep.) and their influence on vegetation succession (Schütz et al. 2000). For this, high positional accuracyand high temporal resolution in data collection is necessary in order to analyse the movements and spatial patternsof distribution of the ungulate species.
In every study area, influences on radio signals are different. Different methods to overcome the problem ofinaccurate bearings have been discussed (White and Garrot 1990), although all locations are based on estimations.Commercial GPS units became available in the late 1980s for private use (Kenward 2001). During the first studies,using NAVSTAR-GPS, some technical reports on accuracy and vegetation influence on fix success were published(Rempel et al. 1995, Moen et al. 1996, Dussault et al. 1999), but the influence of highly structured topography hasnot been investigated so far.
In the SNP, telemetry is limited by a number of constraints. As the SNP is a management category 1 protected area(wilderness area), according to the International Union for the Conservation of Nature (IUCN) classification, onlyminimal human disturbance (including research) is allowed. The common technique of “homing-in” cannot be used.In addition, the highly structured topography and alpine conditions complicate the taking of bearings and themovements of investigators. To gain some knowledge about accuracy and errors due to reflection and bending ofsignals, a test was carried out in our study area with the methods described below. GPS telemetry has often beendiscussed in relation to projects planned for the SNP and some advantages, such as the possibility of high samplingrates and well-defined precision and accuracy, were well known. However, a lack of knowledge of effects due to thetopography and the vegetation prevented the use of GPS up till now. Hence GPS-Telemetry had to be evaluated andcompared with VHF-Telemetry before it could be used in the SNP.
We tested a GPS receiver for positional accuracy in the area and compared the results with those of a VHF telemetrytest conducted at the same time and with the degree of accuracy reported in the literature. Three questions had to beanswered:
(1) How accurate are locations measured with traditional VHF techniques using fixed antenna positions (doubleYagis)?
(2) How accurate is GPS-derived data?
(3) How good is satellite availability with NAVSTAR-GPS in the study area?
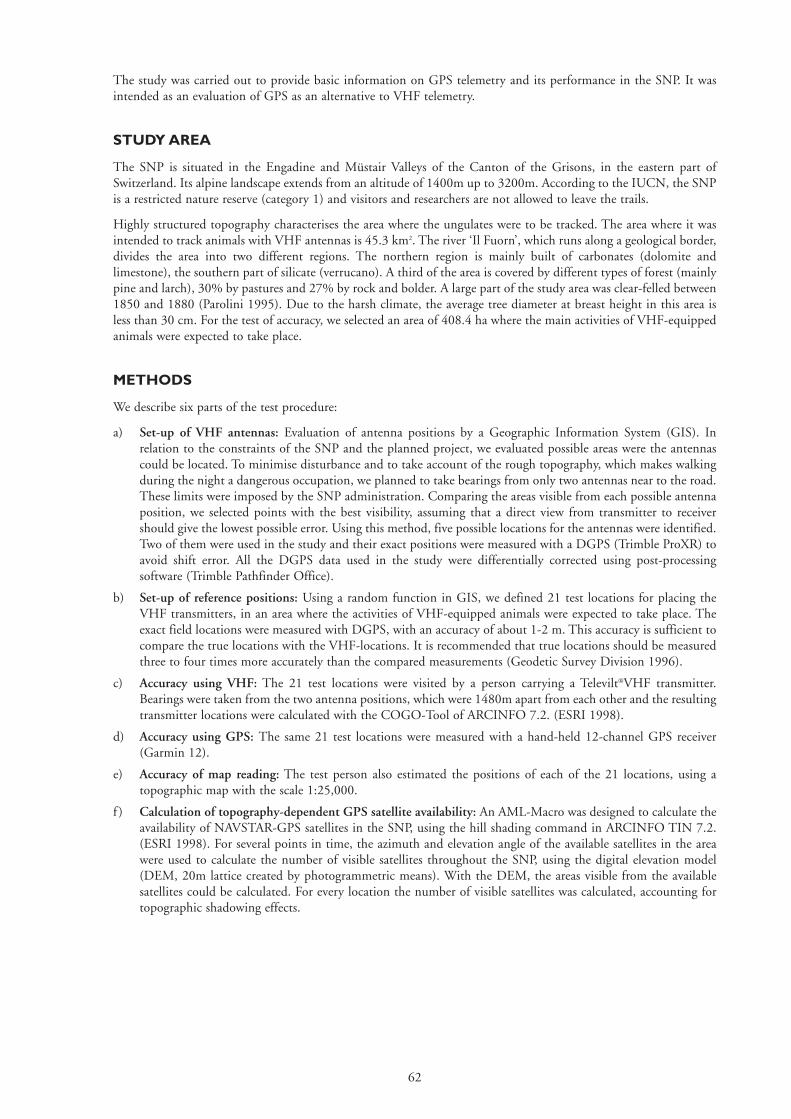
62
The study was carried out to provide basic information on GPS telemetry and its performance in the SNP. It wasintended as an evaluation of GPS as an alternative to VHF telemetry.
STUDY AREA
The SNP is situated in the Engadine and Müstair Valleys of the Canton of the Grisons, in the eastern part ofSwitzerland. Its alpine landscape extends from an altitude of 1400m up to 3200m. According to the IUCN, the SNPis a restricted nature reserve (category 1) and visitors and researchers are not allowed to leave the trails.
Highly structured topography characterises the area where the ungulates were to be tracked. The area where it wasintended to track animals with VHF antennas is 45.3 km2. The river ‘Il Fuorn’, which runs along a geological border,divides the area into two different regions. The northern region is mainly built of carbonates (dolomite andlimestone), the southern part of silicate (verrucano). A third of the area is covered by different types of forest (mainlypine and larch), 30% by pastures and 27% by rock and bolder. A large part of the study area was clear-felled between1850 and 1880 (Parolini 1995). Due to the harsh climate, the average tree diameter at breast height in this area isless than 30 cm. For the test of accuracy, we selected an area of 408.4 ha where the main activities of VHF-equippedanimals were expected to take place.
METHODS
We describe six parts of the test procedure:
a) Set-up of VHF antennas: Evaluation of antenna positions by a Geographic Information System (GIS). Inrelation to the constraints of the SNP and the planned project, we evaluated possible areas were the antennascould be located. To minimise disturbance and to take account of the rough topography, which makes walkingduring the night a dangerous occupation, we planned to take bearings from only two antennas near to the road.These limits were imposed by the SNP administration. Comparing the areas visible from each possible antennaposition, we selected points with the best visibility, assuming that a direct view from transmitter to receivershould give the lowest possible error. Using this method, five possible locations for the antennas were identified.Two of them were used in the study and their exact positions were measured with a DGPS (Trimble ProXR) toavoid shift error. All the DGPS data used in the study were differentially corrected using post-processingsoftware (Trimble Pathfinder Office).
b) Set-up of reference positions: Using a random function in GIS, we defined 21 test locations for placing theVHF transmitters, in an area where the activities of VHF-equipped animals were expected to take place. Theexact field locations were measured with DGPS, with an accuracy of about 1-2 m. This accuracy is sufficient tocompare the true locations with the VHF-locations. It is recommended that true locations should be measuredthree to four times more accurately than the compared measurements (Geodetic Survey Division 1996).
c) Accuracy using VHF: The 21 test locations were visited by a person carrying a Televilt®VHF transmitter.Bearings were taken from the two antenna positions, which were 1480m apart from each other and the resultingtransmitter locations were calculated with the COGO-Tool of ARCINFO 7.2. (ESRI 1998).
d) Accuracy using GPS: The same 21 test locations were measured with a hand-held 12-channel GPS receiver(Garmin 12).
e) Accuracy of map reading: The test person also estimated the positions of each of the 21 locations, using atopographic map with the scale 1:25,000.
f ) Calculation of topography-dependent GPS satellite availability: An AML-Macro was designed to calculate theavailability of NAVSTAR-GPS satellites in the SNP, using the hill shading command in ARCINFO TIN 7.2.(ESRI 1998). For several points in time, the azimuth and elevation angle of the available satellites in the areawere used to calculate the number of visible satellites throughout the SNP, using the digital elevation model(DEM, 20m lattice created by photogrammetric means). With the DEM, the areas visible from the availablesatellites could be calculated. For every location the number of visible satellites was calculated, accounting fortopographic shadowing effects.

RESULTS
Antenna locations
The area visible from antenna 1 was 223.0ha (54.6% of the study area) and 236.4ha (57.9% of the study area) fromantenna 2. From both antennas, 34.6% of the area was visible.
Table 1: Overview of the locations collected with different methods and their errors in comparison to the true positions.(1) ‘Map’ = positional error in map readings (1:25,000), (2) ‘GPS’ = positional error of non-differential GPSmeasurements (Garmin 12), (3) ‘VHF’ = positional error of VHF bearing and (4) ‘Antenna1 and Antenna 2’= VHF bearing angle errors from antenna 1 and antenna 2
Accuracy using VHF
The study produced an average directional error of 14.5o (± 31.0, n = 20, mean = 14.5o, min 0.1o, max. 63.5o).Antenna 1 had a mean error of 22.4o (± 42.5, min. 0.1o, max 163.4o) and antenna 2 a mean error of 6.5 (±6.2, min0.4o, max. 26.5o). Two bearings from antenna 1 were responsible for the high average error (Figure 2), which isprobably due to signal reflection (Figure 1). Without these outliers the average error would be 7.7o.
Distance error (m) Bearing error (()
ID Map GPS VHF Antenna 1 Antenna 2
16 64.4 8.8 58.2 3.4 26.5
17 34.0 108.7 177.6 5.9 1.1
18 53.9 40.1 523.6 2.8 4.5
31 35.3 37.2 361.1 163.5 4.9
32 13.6 41.9
42 25.7 29.9 120.6 26.5 10.6
44 20.2 8.9 152.0 8.1 7.0
49 46.3 16.8 105.6 4.8 3.8
50 12.9 12.9 229.9 26.6 11.5
51 31.9 26.3 92.1 19.2 2.9
71 6.6 9.2 58.9 0.1 4.7
74 28.5 1001.2 99.0 13.8 9.4
75 14.3 53.6 219.0 10.1 0.4
80 88.3 44.3 776.4 19.3 1.3
81 25.4 15.4 185.6 122.3 1.8
82 10.6 24.4 350.8 1.8 15.9
89 11.0 29.4 1445.9 0.2 5.9
91 60.5 35.0 511.3 4.1 6.8
92 45.3 35.7 516.7 1.8 5.1
93 1.8 41.2 295.6 7.0 0.5
95 54.2 33.0 577.8 7.9 5.7
63

Figure 1: The study area with the two antennas (squares with dot), true locations (black dots) and the correspondingestimated locations with VHF-Telemetry (grey circles). (PK25 used with authorisation of the Swiss FederalOffice of Topography, 2001)
To compare the errors obtained with GPS measurements, distance errors in metres are necessary. To avoiddisturbance, the antennas had to be placed near to the road and therefore some of the bearings were not based onoptimalconstellations. Small errors in bearing could have a large influence on distance errors. Nevertheless, tocompare VHF telemetry with GPS techniques, comparisons in metres had to be made. The mean distance fromobserved locations to the true positions was 342.9m (±. 329.3m, min 58.2m, max 1445.9m).
Figure 2: The error (degrees) of the bearings from the two locations (n=20, mean error = 14.5o) are shown. Please notethe logarithmic scale.
Accuracy using GPS
The mean error for non-differential GPS locations was 78.8m. One location had an error of 1001.7m. We assumethis was due to a reading or writing error. Without this outlier, the mean difference was only 32.7m (± 22.2, min8.8m, max 108.7m). During the test, Selective Availability (SA) was still turned on.
Accuracy of map reading
In other projects in the SNP, locations are defined by measuring co-ordinates from topographic maps. Therefore thetesters also had to measure their positions without using GPS. All the testers knew the area well. The mean error inmap reading was 32.6m (± 22.5) with a minimum of 1.8m and a maximum of 88.3m. The accuracy of these typesof measurements is generally high, when there are well-defined topographic features.
GPS satellite availability in the SNP
The above test results show that the accuracy of GPS in this terrain is much higher than that achieved by VHFtelemetry. As it is an alpine area, the availability of satellites for GPS positioning was uncertain and needed to beassessed. The influence of the topography on the visibility of GPS satellites can easily be calculated using standardGIS functions. The calculation of satellite availability was not restricted to the study area, but performed for thewhole SNP for different points in time (Table 2).
1000
100
10
1
0.10 1 10 100 1000
Error (degrees) at Antenna 2
Err
or (
degr
ees)
at A
nten
na 1
64
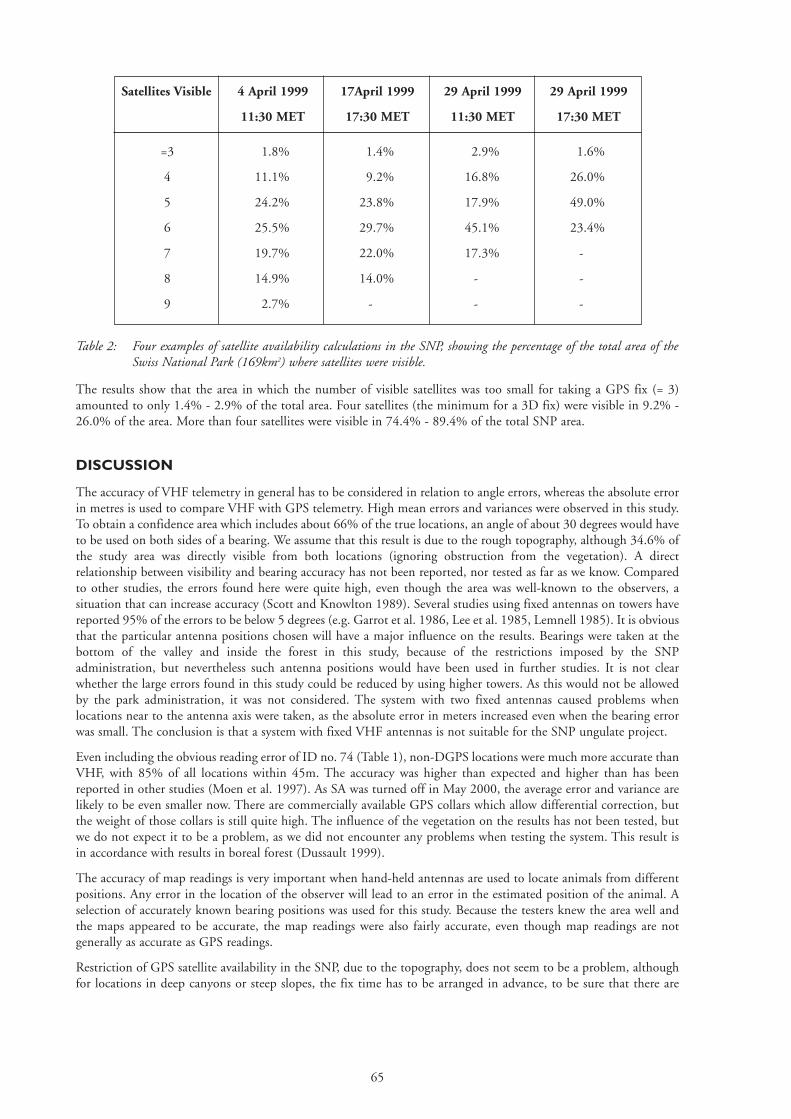
Table 2: Four examples of satellite availability calculations in the SNP, showing the percentage of the total area of theSwiss National Park (169km2) where satellites were visible.
The results show that the area in which the number of visible satellites was too small for taking a GPS fix (= 3)amounted to only 1.4% - 2.9% of the total area. Four satellites (the minimum for a 3D fix) were visible in 9.2% -26.0% of the area. More than four satellites were visible in 74.4% - 89.4% of the total SNP area.
DISCUSSION
The accuracy of VHF telemetry in general has to be considered in relation to angle errors, whereas the absolute errorin metres is used to compare VHF with GPS telemetry. High mean errors and variances were observed in this study.To obtain a confidence area which includes about 66% of the true locations, an angle of about 30 degrees would haveto be used on both sides of a bearing. We assume that this result is due to the rough topography, although 34.6% ofthe study area was directly visible from both locations (ignoring obstruction from the vegetation). A directrelationship between visibility and bearing accuracy has not been reported, nor tested as far as we know. Comparedto other studies, the errors found here were quite high, even though the area was well-known to the observers, asituation that can increase accuracy (Scott and Knowlton 1989). Several studies using fixed antennas on towers havereported 95% of the errors to be below 5 degrees (e.g. Garrot et al. 1986, Lee et al. 1985, Lemnell 1985). It is obviousthat the particular antenna positions chosen will have a major influence on the results. Bearings were taken at thebottom of the valley and inside the forest in this study, because of the restrictions imposed by the SNPadministration, but nevertheless such antenna positions would have been used in further studies. It is not clearwhether the large errors found in this study could be reduced by using higher towers. As this would not be allowedby the park administration, it was not considered. The system with two fixed antennas caused problems whenlocations near to the antenna axis were taken, as the absolute error in meters increased even when the bearing errorwas small. The conclusion is that a system with fixed VHF antennas is not suitable for the SNP ungulate project.
Even including the obvious reading error of ID no. 74 (Table 1), non-DGPS locations were much more accurate thanVHF, with 85% of all locations within 45m. The accuracy was higher than expected and higher than has beenreported in other studies (Moen et al. 1997). As SA was turned off in May 2000, the average error and variance arelikely to be even smaller now. There are commercially available GPS collars which allow differential correction, butthe weight of those collars is still quite high. The influence of the vegetation on the results has not been tested, butwe do not expect it to be a problem, as we did not encounter any problems when testing the system. This result isin accordance with results in boreal forest (Dussault 1999).
The accuracy of map readings is very important when hand-held antennas are used to locate animals from differentpositions. Any error in the location of the observer will lead to an error in the estimated position of the animal. Aselection of accurately known bearing positions was used for this study. Because the testers knew the area well andthe maps appeared to be accurate, the map readings were also fairly accurate, even though map readings are notgenerally as accurate as GPS readings.
Restriction of GPS satellite availability in the SNP, due to the topography, does not seem to be a problem, althoughfor locations in deep canyons or steep slopes, the fix time has to be arranged in advance, to be sure that there are
Satellites Visible 4 April 1999 17April 1999 29 April 1999 29 April 1999
11:30 MET 17:30 MET 11:30 MET 17:30 MET
=3 1.8% 1.4% 2.9% 1.6%
4 11.1% 9.2% 16.8% 26.0%
5 24.2% 23.8% 17.9% 49.0%
6 25.5% 29.7% 45.1% 23.4%
7 19.7% 22.0% 17.3% -
8 14.9% 14.0% - -
9 2.7% - - -
65

enough satellites visible. However, this is not possible when using GPS collars on animals, so that some bias may beintroduced into the observations. The influence of the vegetation not has been included in the GIS calculations inthis study, as it is not considered to be a problem in the SNP.
ACKNOWLEDGEMENTS
We would like to thank Swiss National Park authorities for supporting the project, Fadri Bott, Mario Conradin andEliane Leuzinger for their help during field work.
REFERENCES
Brunies, S. 1923. Steinwildaussetzung im Schweizerischen Nationalpark. Nationalzeitung. Nr.305.
Buchli, C. and W. Abderhalden. 1998. Das Steinbockprojekt Albris/Schweizerischer Nationalpark (SNP). Zeitschriftfür Jagdwissenschaft 44(2): 102-107.
Dussault, C., R. Courtois, J. P. Ouellet and J. Huot. 1999. Evaluation of GPS telemetry collar performance forhabitat studies in the boreal forest. Wildlife Society Bulletin 27(4): 965-972.
ESRI. 1998. Ardoc Version 7.2.. Environmental Systems Research Institute Inc., Redlands, California.
Filli, F. 2000. Huftiere in einem alpinen Lebensraum. Internal Report. Zernez, Swiss National Park.
Garrot, R. A., G. C. White, R. M. Bartmann and D. L. Weybright. 1986. Reflected signal bias in biotelemetrytriangulation systems. Journal of Wildlife Management 50(4): 747-752.
Geodetic Survey Division. 1996. Accuracy Standards for Positioning. Geodetic Survey Division, Natural ResourcesCanada, Ottawa.
Haller, H. in prep. Der Rothirsch Cervus elaphus im Schweizerischen Nationalpark und seiner Umgebung:Historische Grundlagen, Entwicklung im 20. Jahrhundert und alpine Charakteristik. Nationalparkforschung in derSchweiz. Zernez.
Kenward, R. E. 2001. A manual for wildlife radio tagging. Academic Press, San Diego, California.
Lee, J. E., G. C. White, R. A. Garrott, R. M. Bartmann and A. W. Alldredge. 1985. Accessing accuracy of aradiotelemetry system for estimating animal locations. The Journal of Wildlife Management 49(3): 658-663.
Lemnell, P. A. 1985. Recent development of automatic radio tracking and transmission of coded information inwildlife research. XVIIth Congress of the International Union of Game Biologists, Brussels, September 17-21. pp.1005-1026.
Scott, L. M. and F.F. Knowlton. 1989. Observer performance in known and blind radio-telemetry accuracy tests. TheJournal of Wildlife Management 53(2):340-342.
Moen, R., J. Pastor, Y. Cohen and C. C. Schwartz. 1996. Effects of moose movement and habitat use on GPS collarperformance. The Journal of Wildlife Management 60(3):659-668.
Moen, R., J. Pastor and Y. Cohen. 1997. Accuracy of GPS telemetry collar locations with differential correction. TheJournal of Wildlife Management 61(2):530-539.
Rempel, R. S., A. R. Rogdgers and K. F. Abraham. 1995. Performance of a GPS animal location system under borealforest canopy. The Journal of Wildlife Management 59(3):543-551
Parolini, J. D. 1995. Zur Geschichte der Waldnutzung im Gebiet des heutigen Schweizerischen Nationalparks. PHDthesis ETH. Zürich. 227pp.
Scheurer, T. 1987. Materialien zur bisherigen und zukünftigen Nationalparkforschung. Arbeitsberichte zurNationalparkforschung. Swiss National Park. Zernez. 133pp.
Schütz, M., B. O. Krüsi and P. J. Edwards (eds). 2000. Succession research in the Swiss National Park from Braun-Blanquet’s permanent plots to models of long-term ecological change. Nationalparkforschung in der Schweiz. Zernez
White, G. C. and R. A Garrot. 1990. Analysis of Wildlife Radio-Tracking Data. Academic Press, New York
66

ESTABLISHING GPS TECHNOLOGY IN THE UNGULATERESEARCH PROJECT IN THE SWISS NATIONAL PARK - FIRST RESULTS
Ruedi Haller and Flurin Filli
Swiss National Park, Chasa dal Parc, CH-7530 Zernez, Switzerland
ABSTRACT
Research projects on mountain ungulates have a long tradition in the Swiss National Park. Since 1998 GPS-collarshave been used to support the following topics: (a) monitoring the ungulates to obtain a better understanding of thespatio-temporal use of the habitat and (b) studying interactions between the animals and the vegetation.
After the decision to use GPS-technology, the first animal was equipped with a GPS-collar in autumn 1998. Anappropriate time schedule was set up and tested in an experimental phase. Locations explaining the seasonaldistribution of animals will be observed by taking fixes once a week, and daily migration within the home range willbe observed by taking fixes every 30 minutes for 24 hours. Battery power of the first generation of GPS-collarssufficed for only 32 percent (H625) and 48 percent (H615) of the expected lifetime and indicates a high variability.This may have been due to the harsh winter conditions, with temperatures as low as -30 oC.
After widening the acquisition time for a GPS-fix from 120 to 180 seconds, the proportion of successful fixes rosefrom 33.6% (97 of 288 expected locations) to 80% (193 of 240 expected locations). This result includes missingvalues due to data transmission by VHF-techniques, because up until today it has not been possible to recapture acollared animal. The amount of GPS-data that can be stored in the animal unit may be higher.
These results from red deer are very promising. In winter-time, data can be collected that is as good as in summer,which is not the case with VHF-telemetry. We collected 250 locations (57.8 percent of expected fixes) of animalH625 with GPS-techniques, compared with 122 (H602) and 107 (H605) obtained with VHF-transmitters duringthe same time period.
After the elimination of selective availability, habitat studies will be much more accurate and therefore more detailed,which is absolutely necessary in small research areas like the Swiss National Park. A test with the GPS-collars showeda mean error of 27.9m from the exact position. The advantages of using GPS-techniques are less labour-intensefieldwork, higher positional accuracy, collection of data in winter-time, better control of sampling schedules andfewer disturbances for the animals.
Introduction of GPS-techniques to collect wildlife data in the Swiss National Park was successful. The nextgeneration of GPS-collars used in the Swiss National Park will be able to store a higher number of fixes.
67


GPS PERFORMANCE IN A TEMPERATE FOREST ENVIRONMENT
Georges Janeau, Christophe Adrados, Jean Joachim & Dominique Pépin.
Institut de Recherche sur les Grands Mammifères, Institut National de la Recherche Agronomique, B.P. 27, F-31326Castanet-Tolosan, Cedex, France.
ABSTRACT
Twelve 6-channel, differential GPS collars (Lotek Engineering. Inc.) were tested in the Parc National des Cévennes,Southern France, to assess canopy effects on fix success, in preparation for a study of spatial distribution and habitatuse by red deer (Cervus elaphus L.).
The fix status (unsuccessful, 2D or 3D fixes) of locations obtained was compared under six different canopy typesand in the open field. All the collars were shoulder-borne at a speed of about 3 km per hour and over 997 fixes weretaken. Our results confirm that the taller the trees, the poorer the GPS performance. In deciduous forest, GPSperformance is better during the leafless season. Snow accumulation on the branches of the taller coniferous trees hasa negative effect on fix success.
From GPS-collared animals monitored in the same study area, we obtained 82.5% of possible fixes (2D and 3D)from 23,667 attempts. These data also confirm that GPS performance is better during the leafless season, but therewas considerable variability in fix success amongst animals that were tracked simultaneously. We also found that ashort fix-interval provides better GPS performance.
Key words GPS, GPS performance, red deer, temperate forest.
INTRODUCTION
The effects of tree canopy cover and topography may limit the performance of GPS receivers, because the frequencyused to broadcast data from satellites to GPS receivers is very high (1,575.42 MHz) (Wells 1986) consequently thewavelength is very short (about 20 cm) (Rempel et al. 1995). Most of the published studies dealing with GPSperformance in relation to such obstruction problems were conducted in boreal forests (Rempel et al. 1995; Moenet al. 1996; Edenius1997; Moen et al. 1997; Dussault et al.1999). GPS performance was found to decrease as treesgot taller (Rempel et al. 1995, Rogers et al. 1996; Dussault et al. 1999) and as canopy closure (Rempel et al.1995),tree density (Rempel and Goadsby 1992; Rempel et al. 1995) and tree basal area (Edenius1997; Dussault et al. 1999)increased. GPS performance was found to increase during the leafless period (Edenius 1997; Moen et al. 1997;Dussault et al.1999). Snow accumulation on tree branches did not affect signal reception (Dussault et al.1999).
In temperate forests trees are often taller than in boreal forests, but GPS performance in such environments has notbeen reported, except for preliminary results (Janeau et al. 1998). For this reason we tested the performance of GPScollars in 6 dominant temperate forest types in our study area. We chose to test moving collars, as suggested byRempel et al. (1995).
The aim of this study was to test the performance of GPS in temperate forest in relation to fix success, according tothe stand size, to the leaf effect for deciduous stands and to snow impact. To carry out this work we also determinedthe fix status of collars worn by free-ranging red deer.
METHODS
The field study was conducted in the Cévennes National Park, in southern France (44o19' N, 03o45' E). The terrainis mountainous and the elevation ranges from 800 m to 1400 m. About 80% of the area is covered by forest.
For the tests we used twelve, 6-channel, GPS 1000 collars, software version 2.11, processed using GPS Host, version3.06, supplied by Lotek Engineering Inc. The collars were carried on the shoulder (because the human body providesa ground plane underneath the GPS antenna), at a speed of about 3 km per hour, in each of the six forest habitats(Table 1) and in an open field situation with a complete view of the sky. Tests were carried out during the leaf season
69
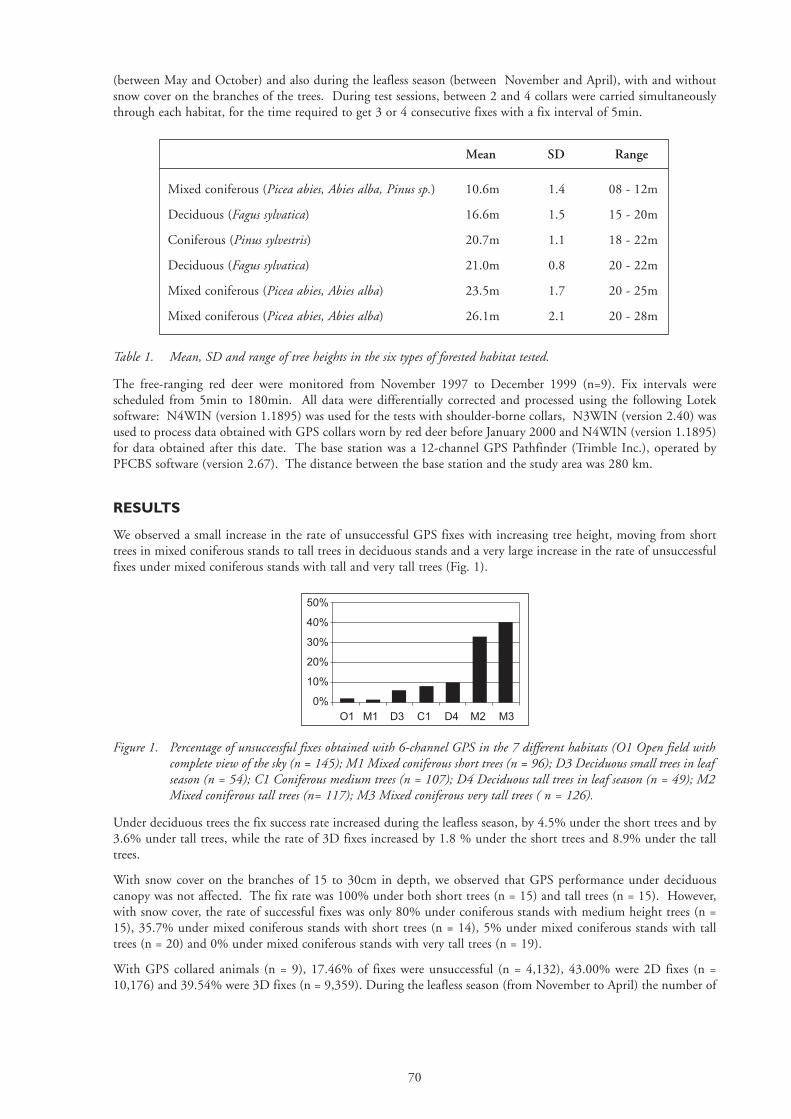
(between May and October) and also during the leafless season (between November and April), with and withoutsnow cover on the branches of the trees. During test sessions, between 2 and 4 collars were carried simultaneouslythrough each habitat, for the time required to get 3 or 4 consecutive fixes with a fix interval of 5min.
Table 1. Mean, SD and range of tree heights in the six types of forested habitat tested.
The free-ranging red deer were monitored from November 1997 to December 1999 (n=9). Fix intervals werescheduled from 5min to 180min. All data were differentially corrected and processed using the following Loteksoftware: N4WIN (version 1.1895) was used for the tests with shoulder-borne collars, N3WIN (version 2.40) wasused to process data obtained with GPS collars worn by red deer before January 2000 and N4WIN (version 1.1895)for data obtained after this date. The base station was a 12-channel GPS Pathfinder (Trimble Inc.), operated byPFCBS software (version 2.67). The distance between the base station and the study area was 280 km.
RESULTS
We observed a small increase in the rate of unsuccessful GPS fixes with increasing tree height, moving from shorttrees in mixed coniferous stands to tall trees in deciduous stands and a very large increase in the rate of unsuccessfulfixes under mixed coniferous stands with tall and very tall trees (Fig. 1).
Figure 1. Percentage of unsuccessful fixes obtained with 6-channel GPS in the 7 different habitats (O1 Open field withcomplete view of the sky (n = 145); M1 Mixed coniferous short trees (n = 96); D3 Deciduous small trees in leafseason (n = 54); C1 Coniferous medium trees (n = 107); D4 Deciduous tall trees in leaf season (n = 49); M2Mixed coniferous tall trees (n= 117); M3 Mixed coniferous very tall trees ( n = 126).
Under deciduous trees the fix success rate increased during the leafless season, by 4.5% under the short trees and by3.6% under tall trees, while the rate of 3D fixes increased by 1.8 % under the short trees and 8.9% under the talltrees.
With snow cover on the branches of 15 to 30cm in depth, we observed that GPS performance under deciduouscanopy was not affected. The fix rate was 100% under both short trees (n = 15) and tall trees (n = 15). However,with snow cover, the rate of successful fixes was only 80% under coniferous stands with medium height trees (n =15), 35.7% under mixed coniferous stands with short trees (n = 14), 5% under mixed coniferous stands with talltrees (n = 20) and 0% under mixed coniferous stands with very tall trees (n = 19).
With GPS collared animals (n = 9), 17.46% of fixes were unsuccessful (n = 4,132), 43.00% were 2D fixes (n =10,176) and 39.54% were 3D fixes (n = 9,359). During the leafless season (from November to April) the number of
50%
40%
30%
20%
10%
0%O1 M1 D3 C1 D4 M2 M3
Mean SD Range
Mixed coniferous (Picea abies, Abies alba, Pinus sp.) 10.6m 1.4 08 - 12m
Deciduous (Fagus sylvatica) 16.6m 1.5 15 - 20m
Coniferous (Pinus sylvestris) 20.7m 1.1 18 - 22m
Deciduous (Fagus sylvatica) 21.0m 0.8 20 - 22m
Mixed coniferous (Picea abies, Abies alba) 23.5m 1.7 20 - 25m
Mixed coniferous (Picea abies, Abies alba) 26.1m 2.1 20 - 28m
70
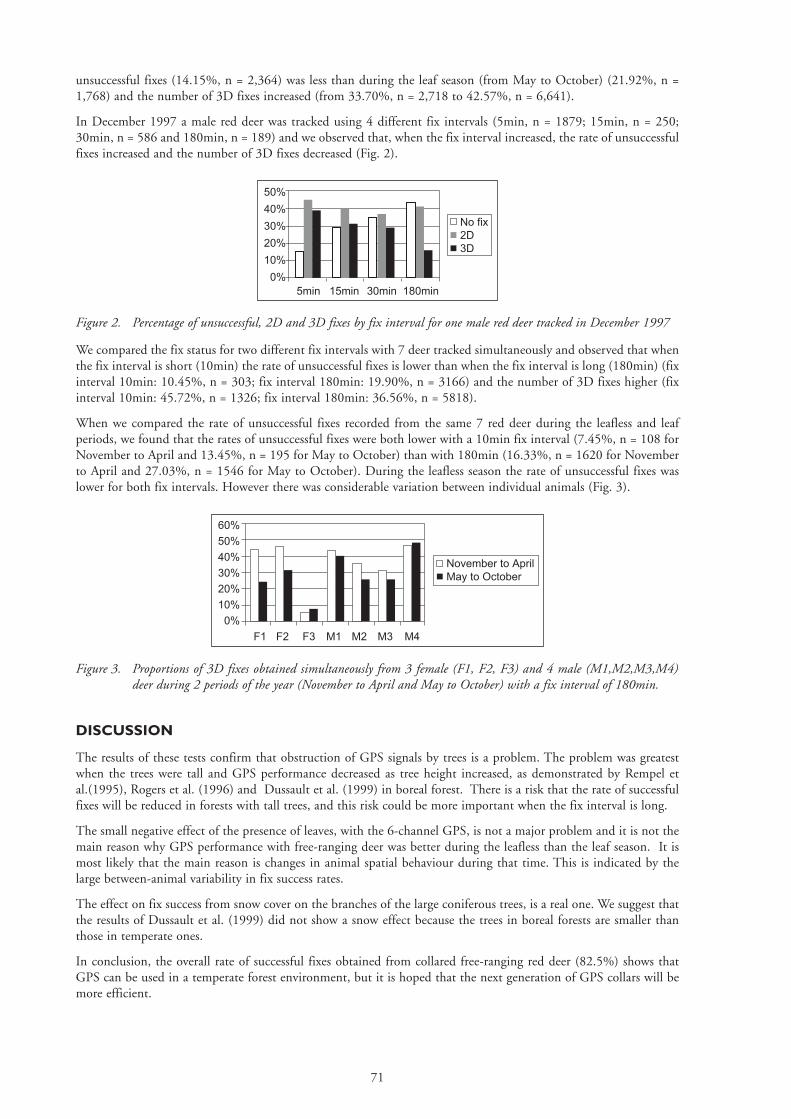
unsuccessful fixes (14.15%, n = 2,364) was less than during the leaf season (from May to October) (21.92%, n =1,768) and the number of 3D fixes increased (from 33.70%, n = 2,718 to 42.57%, n = 6,641).
In December 1997 a male red deer was tracked using 4 different fix intervals (5min, n = 1879; 15min, n = 250;30min, n = 586 and 180min, n = 189) and we observed that, when the fix interval increased, the rate of unsuccessfulfixes increased and the number of 3D fixes decreased (Fig. 2).
Figure 2. Percentage of unsuccessful, 2D and 3D fixes by fix interval for one male red deer tracked in December 1997
We compared the fix status for two different fix intervals with 7 deer tracked simultaneously and observed that whenthe fix interval is short (10min) the rate of unsuccessful fixes is lower than when the fix interval is long (180min) (fixinterval 10min: 10.45%, n = 303; fix interval 180min: 19.90%, n = 3166) and the number of 3D fixes higher (fixinterval 10min: 45.72%, n = 1326; fix interval 180min: 36.56%, n = 5818).
When we compared the rate of unsuccessful fixes recorded from the same 7 red deer during the leafless and leafperiods, we found that the rates of unsuccessful fixes were both lower with a 10min fix interval (7.45%, n = 108 forNovember to April and 13.45%, n = 195 for May to October) than with 180min (16.33%, n = 1620 for Novemberto April and 27.03%, n = 1546 for May to October). During the leafless season the rate of unsuccessful fixes waslower for both fix intervals. However there was considerable variation between individual animals (Fig. 3).
Figure 3. Proportions of 3D fixes obtained simultaneously from 3 female (F1, F2, F3) and 4 male (M1,M2,M3,M4)deer during 2 periods of the year (November to April and May to October) with a fix interval of 180min.
DISCUSSION
The results of these tests confirm that obstruction of GPS signals by trees is a problem. The problem was greatestwhen the trees were tall and GPS performance decreased as tree height increased, as demonstrated by Rempel etal.(1995), Rogers et al. (1996) and Dussault et al. (1999) in boreal forest. There is a risk that the rate of successfulfixes will be reduced in forests with tall trees, and this risk could be more important when the fix interval is long.
The small negative effect of the presence of leaves, with the 6-channel GPS, is not a major problem and it is not themain reason why GPS performance with free-ranging deer was better during the leafless than the leaf season. It ismost likely that the main reason is changes in animal spatial behaviour during that time. This is indicated by thelarge between-animal variability in fix success rates.
The effect on fix success from snow cover on the branches of the large coniferous trees, is a real one. We suggest thatthe results of Dussault et al. (1999) did not show a snow effect because the trees in boreal forests are smaller thanthose in temperate ones.
In conclusion, the overall rate of successful fixes obtained from collared free-ranging red deer (82.5%) shows thatGPS can be used in a temperate forest environment, but it is hoped that the next generation of GPS collars will bemore efficient.
60%
50%
40%
30%
20%
10%
0%
F1 F2 F3 M1 M2 M3 M4
November to AprilMay to October
50%
40%
30%
20%
10%
0%5min 15min 30min 180min
No fix2D3D
71

72
REFERENCES
Dussault C., R.Courtois, J.P.Ouellet, and J.Huot, 1999. Evaluation of GPS telemetry collar performance for habitatstudies in the boreal forest. Wildlife Society Bulletin, 27(4): 965-972.
Edenius L., 1997. Field test of a GPS location system for Moose Alces alces under Scandinavian boreal conditions.Wildlife Biology, 3(1): 39-43.
Janeau G., J.M.Angibault, B.Cargnelutti, J.Joachim, D.Pépin and F.Spitz, 1998. Le Global Positioning System (GPS)et son utilisation (en mode différentiel) chez les grands mammifères : principes, précision, limites, contraintes etperspectives. Arvicola, Actes "Amiens 97" : 19-24.
Moen R., J.Pastor, Y.Cohen and C.C.Schwartz, 1996. Effects of Moose movement and habitat use on GPS collarperformance. Journal of Wildlife Management, 60(3): 659-668.
Moen R., J.Pastor and Y.Cohen, 1997. Accuracy of GPS telemetry collar locations with differential correction.Journal of Wildlife Management, 61(2): 530-539.
Rempel R.S., and J.M.Goadsby, 1992. An evaluation of GPS under boreal forest canopy cover. In : Geographicinformation seminar. Ontario Ministry of Natural Resources, Toronto: 164 -172.
Rempel R.S., A.R.Rodgers and K.F.Abraham, 1995. Performance of a GPS animal location system under borealforest canopy. Journal of Wildlife Management, 59(3): 543-551.
Rodgers A.R., R.S.Rempel and K.F.Abraham, 1996. A GPS-based telemetry system. Wildlife Society Bulletin, 24(3):559-566.
Wells, D.E., Editor. 1986. Guide to GPS positioning. Canadian GPS Association, Fredericton, N.B. 567pp.

IS IT STILL NECESSARY TO USE GPS IN DIFFERENTIAL MODESINCE THE ELIMINATION OF SELECTIVE AVAILABILITY?
Georges Janeau1, Christophe Adrados1 and Irène Girard2
1 Institut National de la Recherche Agronomique/Institut de Recherche sur les Grands Mammifères B.P. 27, F-31326Castanet-Tolosan Cedex France.
2 Parc National de la Vanoise, B.P. 705, F-73007 Chambéry, Cedex, France.
ABSTRACT
At the beginning of May 2000, the United States' Department of Defence removed the artificial degradation of GPSsatellite signals, called Selective Availability (SA), thus removing the largest source of error in calculating GPSlocations. The aim of this work was to assess the effect of SA elimination on location accuracy, for both non-differential and differential GPS, the latter's function being to remove SA perturbation. Data were collected beforeand after SA removal from GPS collars used for tracking animals, with and without differential corrections, and alsofrom a reference base station. Locations were allocated, before analysis, to various classes according to satellitegeometry (DOP) and fix status (2- or 3-dimensional). For each kind of GPS receiver and period, we calculated ageometric centre using only the most accurate locations (3-dimensional with DOP <5). We then analysed distancesbetween each location and these centres. SA elimination improved accuracy for non-differential GPS collars,whatever the DOP and the fix status. Similar results were obtained from the base station. For differential GPScollars, location accuracy was improved for the 2D locations which had the lowest DOP values. Even if the gain inaccuracy is greater for uncorrected GPS data, locations obtained with differential GPS receivers are still moreaccurate, because differential correction can remove other sources of error like satellite clock error, ionospheric andtropospheric delay and ephemeris error. Thus, the choice of differential or non-differential GPS collars for trackinganimals will still depend on the accuracy needed in biological studies.
Key words DGPS, GPS, location error, selective availability.
INTRODUCTION
The main reason for using differential GPS collars before Selective Availability (SA) elimination was to obtainaccurate locations (Rodgers & Anson 1994, Moen et al. 1997, Rempel & Rodgers 1997, Janeau et al. 1998). But,for a biologist, the use of differential GPS is more difficult than the use of non-differential GPS because thedifferential mode requires more technical capacity, more time for data processing and the extra costs involved inrunning a base station. The aim of this work is to show the effect of SA elimination on fix accuracy to help otherbiologists to make the right choice about which GPS mode to use for their particular projects.
METHODS
We recorded locations before and after SA elimination from : (i) a 12-channel GPS Pathfinder (Trimble Inc., USA)in non-differential mode (fix interval 5sec.); (ii) 8-channel GPS Collars Simplex (Televilt AB., Sweden) in non-differential mode (fix interval 6mn); (iii) 8-channel GPS collars 1000 (Lotek Eng. Inc., Canada) in differential mode(fix interval 5mn; distance between base station and GPS collars = 420 km). We determined location error as thedistance between each observed location and an estimated true location calculated as the geometric centre of the mostaccurate locations (3D locations with DOP < 5).
73

Figure 1 : Location error (m) for successive locations of a 12-channel GPS base station (from Trimble Inc.) in non-differential mode, one month before and one month after SA elimination (fix interval 5 sec.).
RESULTS
From GPS reference base station (non-differential mode)
We recorded 4320 locations before and after SA elimination (Fig. 1). All of these were 3D locations with DOP values< 5. The mean location error was 23.9 m with SA (SD = 15.0; max = 94.8 m) and 1.4 m without SA (SD = 0.73;max = 3.1 m).
From non-differential GPS collars
We collected 354 and 339 locations, respectively, before and after SA elimination (Fig. 2). The mean location errorfor 2D locations with DOP < 5 was 81.9 m with SA (SD = 104.9; max = 776.9 m; n = 96) and 13.1 m without SA(SD = 17.1; max = 160.1 m; n = 108). For 2D locations with DOP ( 5, the mean error was 206.4 m with SA (SD= 140.9; max = 693.5 m; n = 41) and 27.9 m without SA (SD = 13.6; max = 62.8 m; n = 29).
For 3D locations with DOP < 5, the mean location error was 48.3 m with SA (SD = 34.5; max = 230.9 m; n = 176)and 8.8 m without SA (SD = 5.9; max = 27.1 m; n = 151). For 3D location with DOP ( 5, the mean location errorwas 68.0 m (SD = 45.7; max = 191.2 m; n = 41) and 10.1 m without SA (SD = 7.3; max = 43.2 m; n = 51).
Figure 2 : Boxplot for location error (m) obtained with non-differential 8-channel GPS (from Televilt AB.) for 2D and3D locations before and after SA elimination (box, vertical bars and white dot show respectively interquartilerange, lower and upper limits and mean).
From differential collars
475 and 654 locations were recorded before and after SA elimination (Fig. 3). The mean location error for 2Dlocations with DOP < 5 was 8.4 m (SD = 6.8; max = 30.2 m; n = 66) and 3.4 m without SA (SD = 2.7; max = 9.8m; n = 9). For 2D locations with DOP ( 5, the mean error was 77.8 m with SA (SD = 260.6; max = 1441.4 m; n =30) and 27.2 m without SA (SD = 23.6; max = 61.9 m; n = 6).
30
20
10
0
2D 3D
Loca
tion
erro
r (m
)
SA no SA SA no SA
100
50
0Lo
catio
n er
ror
(m)
SA no SA
74

For 3D locations with DOP < 5, the mean location error was 4.6 m with SA (SD = 3.1; max = 17.6 m; n=196) and4.1 m without SA (SD = 2.2; max = 12.5 m; n = 280). For 3D locations with DOP ( 5, the mean location error was8.6 m (SD = 12.5; max = 107.4 m, n = 183) and 5.8 m without SA (SD = 9.9; max = 171.8 m; n = 359).
Figure 3 : Boxplot for location error (m) obtained with differential 8-channel GPS (from Lotek Inc.) for 2D and 3Dlocations, before and after SA elimination (box, vertical bars and white dot show respectively interquartilerange, lower and upper limits and mean).
CONCLUSIONS
The influence of SA elimination is greater for non-differential GPS than for differential GPS. Fixes obtained indifferential mode are still the most accurate, with less variation, because this mode corrects for other sources of error,such as satellite clock error, ionospheric and tropospheric delays and ephemeris error (Trimble Navigation Ltd. 1996,Lotek Engineering Inc. 2000). Consequently, the biologist's choice will still depend on the fix accuracy needed.
REFERENCES
Janeau G., J.M.Angibault, B.Cargnelutti, J.Joachim, D.Pépin & F.Spitz, 1998. Le Global Positioning System (GPS)et son utilisation (en mode différentiel) chez les grands mammifères : principes, précision, limites, contraintes etperspectives. Arvicola, Actes "Amiens 97" : 19-24.
Lotek Engineering Inc. 2000. N4 Differential post-processing software. Use's Manual. Lotek Engineering Inc.,Newmarket, Canada, 21 p.
Moen R., J.Pastor & Y.Cohen, 1997. Accuracy of GPS telemetry collar locations with differential correction. Journalof Wildlife Management, 61(2) : 530-539.
Rempel R.S. and A.R.Rodgers, 1997. Effects of differential correction on accuracy of a GPS animal location system.Journal of Wildlife Management, 61(2) : 525-530.
Rodgers A.R. and P.Anson, 1994. Animalborne GPS : tracking the habitat. GPS World, 5 : 20-32.
Trimble Navigation Ltd. 1996. Mapping systems - General reference. Trimble Navigation Ltd., Sunnyvale,California, USA.
400
300
200
100
0
2D 3D
Loca
tion
erro
r (m
)
SA no SA SA no SA
75


77
MEASURING DIET COMPOSITION AND FOOD INTAKE BYMOOSE IN THE SWEDISH BOREAL FOREST: INTEGRATINGGPS AND FAECAL MARKER TECHNOLOGIES
Bob Mayes1, Glenn Iason1, Neil White2 and Thomas Palo2
1 Macaulay Land Use Research Institute, Aberdeen UK2 Swedish University of Agricultural Sciences, Umeå, Sweden
INTRODUCTION
A widely-used method for determining dietary intake in domestic herbivores relies on comparing the faecalconcentrations of natural hydrocarbons (odd-chain n-alkanes), originating from herbage cuticular wax, with those ofan even-chain alkane (usually dotriacontane, C32) which is orally dosed at a known rate (Mayes et al., 1986). Sincethe hydrocarbon patterns in plant-wax differ between plant species, the dietary plant species composition ofherbivores grazing simple swards, such as temperate grass pastures, can be determined from the hydrocarbon patternsfound in the faeces (Dove & Mayes, 1996). Thus concurrent diet composition and intake measurements can be madeusing the hydrocarbons as faecal markers. The use of additional plant wax compounds, such as long-chain fattyalcohols, may allow diet composition to be estimated in herbivores foraging in more complex vegetationenvironments (Oliván et al., 1999), including boreal forest. These methods have hitherto not been applied to wildruminants, because of the need to administer a daily oral dose to measure intake, to locate the animals in order tocollect faeces and to sample vegetation which is representative of that ingested. However, intraruminal controlled-release devices (CRDs) have been developed to deliver an indigestible marker (chromic oxide) at a constant andpredictable rate, over a period of a few weeks, for estimation of faecal output in grazing ruminants (Laby et al., 1984).More recently, CRDs containing even-chain alkanes for the purpose of intake estimation have been tested in sheep(Dove et al., in press) and versions of the device are now commercially available for use in sheep and cattle (CaptecAlkane®). If such a device could be used to administer even-chain alkane to wild ruminants such as moose andanimals located with sufficient accuracy to permit collection of samples of faeces and vegetation, then both dietcomposition and intake could be determined. Use of GPS technology is of potential benefit in aiding studies ofruminant nutritional ecology.
This study describes the use of faecal marker methods, in combination with GPS measurements, to estimate dietcomposition and intake in wild moose living in the boreal forest in the Robertsfors area (near Umeå) of NorthernSweden. Preliminary details of this study have been reported elsewhere (European Commission, 1998).
MATERIALS AND METHODS
During the respective winters of 1997 and 1998, during periods of snow cover, three moose cows and four bulls wereimmobilised and fitted with GPS collars (Model GPS-1000, Lotek Inc. Canada). At the same time a CRD, designedto deliver 360mg of C32 alkane per day, was inserted into the rumen by stomach tube. To facilitate insertion, the'butterfly wings' of the CRD were bent upwards and embedded in ice to form a bullet shape. After recovery fromthe anaesthetic, the moose were released and GPS fixes were taken every 6h for home-range estimation. Morefrequent fixes (every 20 min in 1997 and every 30 min in 1998) were taken on selected days, in order to locate theanimals so that faecal samples could be collected from the ground. This procedure required rapid processing andcorrection of data after downloading from the collars. On some occasions faecal samples from GPS-collaredindividuals could be identified in the field, either where the GPS-collared animal was solitary, or where an imprintof the collar was visible in the snow at a bedding site. After initial location, snow-tracking provided the opportunityto collect a series of sequential faecal samples from the same animal.
Vegetation was sampled from the stands and understorey that were seen to have been browsed by moose. Materialfor marker analysis was sampled so as to be representative of that removed by moose. In the study area, the mainvegetation consisted of Scots pine (Pinus Sylvestris), birch (Betula pendula and B. pubescens), willow (Salix Caprea),aspen (Populus tremula), rowan (Sorbus aucuparia) and a range of ericaceous dwarf shrubs. Norway spruce (Piceaabies) was also prevalent, but there was no evidence of it having been browsed.

Similar procedures were planned for the summer of 1998, but since only one collar was operational, faeces weresampled for diet composition estimates only. Because accurate location of moose tracks was not possible, fresh faeces(which were uncolonised by invertebrates) were collected on a number of occasions from 50m x 50m areassurrounding the previous days' locations of the collared moose.
The samples of faeces and vegetation were analysed for n-alkanes and long-chain fatty acids using gaschromatographic methods described by Oliván et al. (1999). Since C32 alkane is naturally present in faeces at verylow concentrations, individual faeces samples were identified as having originated from moose given CRDs by thepresence of C32 at levels greater than 20 mg/kg DM. Diet composition was estimated from the n-alkane or fattyalcohol concentrations in the faeces and vegetation samples, using the 'Eatwhat' least-squares algorithm of Dove andMoore (1995). The faecal marker concentrations were adjusted to account for their incomplete recovery in faeces,using recovery rates obtained by Mayes et al. (1986) for alkanes and Ashton (1998) for fatty alcohols. Intakeestimates were made using the double-marker method of Mayes et al. (1986), using the release rate of the dosed C32
alkane (360 mg/d) quoted by the manufacturer (K.J.Ellis personal communication).
RESULTS
Winter
Table 1. Estimates of diet composition and intake of alkane-dosed moose in the winters of 1997 and 1998, obtainedusing faecal markers and GPS to locate faeces and browsed vegetation.
Year/ Sample Number of samples Diet composition Daily intake Dosed collection (%DM) (kg DM) ofmoose date Of dosed moose dosed moose
identity
Total From dosed Birch Pine SD mean SDmoose (mean) (mean)
1997
515 10: 3: 97 37 4 0 100 0.0 3.0 0.18
13: 3: 97 14 8 0 100 0.0 3.2 0.09
810 18: 3: 97 1 1 0 100 - 3.4 -
21: 3: 97 7 7 0 100 0.0 3.6 0.13
25: 3: 97 10 10 0 100 0.0 4.2 0.74
28: 3: 97 6 6 0 100 0.0 5.1 1.18
1998
BD 24: 2: 98 15 13 13 87 2.8 3.5 0.60
6: 3: 98 6 6 5 95 1.6 4.1 0.34
11: 3: 98 10 10 7 93 1.9 4.2 0.30
5B 27: 2: 98 39 10 0 100 0.8 5.2 0.54
28: 2: 98 2 1 2 98 - 4.8 -
10: 3: 98 23 5 0 100 0.1 6.6 0.87
CO 24: 2: 98 13 9 20 80 2.8 2.3 0.33
2: 3: 98 13 13 19 81 2.1 3.3 0.20
3: 3: 98 3 2 17 83 4.5 3.4 0.53
78

Since the GPS data indicated that the home ranges of individual moose which had been dosed with CRDs did notoverlap, it was possible to identify the animals which had produced the faeces containing C32 alkane. However, onsome occasions, a high proportion of faeces samples were found not to have originated from the dosed animals.Estimates of diet composition and intake were obtained for two cows in 1997 and three bulls in 1998 (Table 1). Thedietary n-alkane contents of the faeces from all of the dosed moose were very low, yet contained high levels of thesecondary alcohol, 10-nonacosanol; this pattern of wax compounds was similar to that of Scots pine and indicatedlittle birch or juniper in the diet. Because of the low levels of dietary alkanes, diet composition was estimated usingonly the faecal alcohols. Scots pine was clearly the main component of the diet for all of the moose which werestudied, with birch comprising the remainder (Table 1).
Intake was estimated using the C32 alkane from the CRD as the dosed marker and 10-nonacosanol as the naturalmarker, with appropriate recovery corrections (see above). The estimates of intake were compatible with resultsobtained from captive moose.
Summer
Of the 34 faecal samples collected in summer 1998, only three were confirmed as having originated from the moosebull given the CRD. Thus only diet composition was estimated for the summer period. As the faeces contained highlevels of plant-wax alkanes, diet composition estimates (Table 2) were obtained by carrying out least-squarescalculations using the alkane contents of vegetation and faeces. In early summer, birch, willow, aspen and rose-baywillow herb (Chamaenerion angustifolium) were the main dietary components, with the birch and willow herb beingreplaced by rowan as summer progressed. Other constituents included Vaccinium species and a trace of heather(Calluna vulgaris). There was no evidence of ingestion of Scots pine.
Table 2. Diet composition of moose at Robertsfors during three summer months, determined using plant n-alkanes asfaecal markers. Means ± SD are expressed as % of dry matter in the diet.
AThe two Betula species and the Salix spp. together with Populus tremula were considered as single components, because their alkaneprofiles were very similar to one another.
DISCUSSION
The results of this work demonstrate that dietary composition and intake can be measured in wild moose, usingdosed and natural plant-wax compounds as faecal markers and GPS collars to give the locations of the animals. Theboreal forest in winter was an ideal environment for carrying out initial feasibility tests of this approach. Not onlywere the diets of moose at this time very simple, but the ability to accurately locate and describe moose movementsfrom snow tracks was of great value in checking the accuracy and precision of acquired GPS data. Furthermore, faeceswere easy to find and the low winter temperatures retarded their decomposition rate.
There are a number of reasons why intake and diet composition measurements in the boreal forest are more difficultto make in the summer. There are many more plant species available to moose as potential food sources. Also, moose-tracking and location of faeces are more difficult. In order to track animals with as good a resolution as that achieved
Month (number of faecal samples)
Species June (9) August (6) September (18)
ABetula pendula + B. pubescens 36.0 ±13.9 6.7±8.6 0.2±0.2
Sorbus aucuparia 0.0±0.0 26.9±17.2 43.7±13.9
ASalix spp + Populus tremula 30.9±14.0 39.1±13.0 33.8±19.7
Calluna vulgaris 0.0±0.0 0.6±0.5 1.9±0.5
Vaccinium vitis idaea 0.6±1.1 1.6±1.6 3.1±3.8
Vaccinium myrtillus 5.7±6.2 17.0±10.2 13.0±11.7
Chamaenerion angustifolium 26.6±20.7 8.1±19.6 4.3±15.6
79

by snow-tracking, locational information of much greater accuracy and precision than that currently provided byGPS collars would be necessary. In the summer, faeces rapidly become colonised by dung beetles and otherinvertebrates and decomposition by bacteria and fungi are also likely. Thus although the effect of faecaldecomposition on marker patterns is not known, it is clear that faeces samples should be as fresh as possible. It maybe possible to locate fresh moose faeces in undergrowth using trained dogs, but such an approach has yet to beexplored.
The estimates of diet composition obtained in this study were made using the assumptions that the respective faecalrecoveries of alkanes and fatty alcohols were the same as those obtained in sheep and goats. Similar assumptions werenecessary to estimate intake, with the additional assumption that the release rate of C32 alkane from the CRD was360 mg/d. Whilst the derived estimates of intake were within the expected range, the method needs to be validatedin moose for these diets. A small validation test with two captive moose, offered Scots pine and birch and dosed withalkane-containing CRDs, indicated that accurate estimates of the composition of the winter diet could be obtainedusing fatty alcohols as markers. Furthermore, reasonable estimates of intake were obtained using C32 alkane and 10-noncosanol as respective dosed and dietary markers (European Commission, 1998). These results suggest that themeasurements made in wild moose in winter were reasonable, but a larger validation study is needed to fully evaluatethe techniques used.
In the present study, GPS collars were used to provide details of the whereabouts of specific moose the day beforeeach faeces collection. Such data were found to be sufficiently accurate and precise in winter to allow relevant snowtracks and faeces to be found. Cross-referencing the location of faecal samples with the GPS-determined route of theforaging animal also provided the possibility to identify the timing of the defaecations. Although not exploited in thepresent study, such information could allow measurements of nutritional parameters, such as rate of passage ofdifferent forages, to be made.
The fact that the home ranges of the moose fitted with collars and dosed with CRDs did not overlap, enabled positiveidentification of the source of each faecal sample from the presence of C32 alkane. The process of screening faecessamples from their alkane patterns was not particularly onerous. Thus, in order to estimate intakes of individualmoose within a group, it is feasible to dose with CRDs containing a unique alkane for each animal, to allowidentification of specific faeces samples.
This work was jointly funded by the European Union Nuclear Fission Safety Programme (Contract no F14P-CT96-0039) and the Scottish Executive Environment and Rural Affairs Department.
REFERENCES
Ashton, C.J. 1998. Evaluation of plant alcohols and sterols as potential faecal markers for estimating dietcomposition in free-ranging herbivores. Msc Thesis, Aberdeen University.
Dove, H. and R.W. Mayes. 1996. Plant wax components: a new approach to estimating intake and diet compositionin Herbivores. Journal of Nutrition 126:13-26.
Dove, H. and A.D. Moore. 1995. Using a least-squares optimisation procedure to estimate diet composition basedon the alkanes of plant cuticular wax. Australian Journal of Agricultural Research 46:1535-1544.
Dove, H., R.W. Mayes, C.S. Lamb and K.J. Ellis. Factors influencing the release rate of alkanes from an intraruminal,controlled release device, and the resultant accuracy of intake estimation in sheep. Australian Journal of AgriculturalResearch (In press.)
European Commission,1998. An integrated approach to radionuclide flow in semi-natural ecosystems underlyingexposure pathways to man (LANDSCAPE) Final Report Research Contract no F14P-CT96-0039 EuropeanCommission Nuclear Fission Safety Programme
Laby, R.H., C.A. Graham, S.R. Edwards and B. Kautzner. 1984. A controlled release intraruminal device for theadministration of fecal dry-matter markers to the grazing ruminant. Canadian Journal of Animal Science(Supplement) 64:337-338.
Mayes, R.W. C.S. Lamb and P.M. Colgrove. 1986. The use of dosed and herbage n-alkanes as markers for thedetermination of herbage intake. Journal of Agricultural Science, Cambridge 107:161-170.
Oliván, M., H. Dove, R.W. Mayes and S.E. Hoebee. 1999. Recent developments in the use of alkanes and otherplant wax components to estimate intake and diet composition in herbivores. Revista Portuguesa de Zootecnia VI:1-25.
80

ANALYSIS AND APPLICATION OF FINE SCALE MOVEMENT DATA
Patrick Andrew Zollner
Forestry Science Lab, North Central Research Station, USDA Forest Service, 5985 Hwy K, Rhinelander, WI, 54501,USA
ABSTRACT
A critical ecological process affecting the population viability of threatened and endangered species in human-impacted landscapes is movement within the habitat mosaic and the colonization of new habitat by dispersinganimals. However, studies that monitor animal movement, with the spatial accuracy and temporal frequency neededto address these questions, are often not logistically feasible, or when possible they are prohibitively expensive. AsGlobal Positioning System (GPS) telemetry hardware is becoming lighter, more energy efficient, better suited toforested environments and more affordable, it is creating an opportunity to address these questions. Scientists willsoon be able to use this technology to investigate the population level consequences of the spatial arrangement ofcritical habitat on a landscape. Such applications of GPS telemetry technology, to questions that exceed traditionalapproaches of estimating home range areas and habitat selection, will require biologists to use new analyticaltechniques. These approaches involve statistical analyses of the characteristics of movement paths and the use of thisinformation in the development of spatially explicit simulation models. I will review three methods for analyzingfine scale movement pathways (fractal dimension, path sinuosity, correlated random walk) and discuss the strengthand weakness of each of these approaches. I will then illustrate how fine scale movement data can be used toparameterize a spatially explicit simulation of dispersal, which can in turn be used to examine the consequences ofthe spatial arrangement of habitat across a landscape. The fine scale movement data used in this case study wascollected on four woodland species of small mammals found in the Midwestern United States (fox squirrel, graysquirrel, eastern chipmunk, and white-footed mouse) using tracking spools. However, the same analyses can be usedon data collected with GPS telemetry to describe the movement pathways and parameterize simulation models. Inthis case study, the movement data is used to build a model that simulates each of these species searching for a newwoodlot in an agricultural matrix and compares the sensitivity of each species to different quantities of woodedhabitat. Contrary to predictions based upon neutral landscape models, the ability of these four species to successfullydisperse across a virtual landscape did not dramatically decline at a critical threshold close to 20% of the landscapecontaining habitat. Instead, each species exhibited a unique threshold and these values ranged from greater than 50%(white-footed mouse) to less than 10% of the landscape (fox squirrel). Thus, consistent with empirical observationsthe simulation suggests that these species should respond to various levels of habitat loss differently. I will concludeby discussing how this approach of developing simulation models, based upon studies of fine scale movementscollected with GPS collars, can be applied to other questions. For example, data on movements can be combinedwith simulations in landscapes that are more complex than the simple case study. Furthermore, by incorporatingpopulation dynamics into such models we can examine the implications of management alternatives for the viabilityof populations.
81


83
HRE:THE HOME RANGE EXTENSION FOR ARCVIEWTM
Arthur R. Rodgers and Angus P. Carr
Ontario Ministry of Natural Resources, Centre for Northern Forest Ecosystem Research, Thunder Bay, Ontario,Canada P7B 5E1
INTRODUCTION
The Home Range Extension (HRE) includes software that extends ArcViewTM to analyze home ranges of animals.This is accomplished entirely within a geographic information system (GIS), which provides a common and relativelyfamiliar interface for analyses performed on telemetry fixes and subsequent home range polygons. The program hasbeen written for novice GIS users who already understand basic wildlife telemetry issues and who are familiar withthe concept of a "home range". The user should be able to perform all the analyses of their point data within ArcViewand the HRE.
MINIMUM SYSTEM REQUIREMENTS
The HRE requires ArcView 3.1 or 3.2, running under Windows NT 4.0 or Windows 95/98.
WHERE TO GET THE HRE
The HRE can be downloaded from: http://blue.lakeheadu.ca/hre/.
WHY USE THE ARCVIEW GIS?
Home range analyses comprise a wide variety of techniques and approaches. Just as there has been a proliferation ofhome range analysis models, there has been a proliferation of home range analysis software. Many of the older DOS-based programs have a cumbersome interface that requires batch files or data manipulation to be carried out withtext editors or database programs. Most do not include more recent home range models (e.g., kernel methods) andmany do not allow export of home range polygons to a GIS for habitat analyses, or restrict analyses to fewer than1,000 animal locations at a time. Although these limitations may be acceptable to studies involving conventionalradio-tracking of animals, automated equipment such as GPS-based telemetry systems (Rodgers et al. 1996) caneasily generate enormous quantities of data that cannot be entirely analyzed by these previous software programs. Theability to use large data sets and carry out all required home range analyses within a single software environment wasour primary reason for developing the HRE within the ArcView GIS.
DATA TYPES SUPPORTED BY THE HRE
Since the HRE was originally developed for use with LOTEK GPS collars, it has a direct import filter for data filesproduced by their GPSHOST and N3WIN software (.DAT files). The HRE also provides direct import of data fromService Argos Data Collection and Location System (DCLS) files, dBASE and Excel database files, or ASCII text files.If necessary, location data can be converted from milliseconds to UTM units of your choice (NAD 27 or NAD 83).Multiple files for individual animals can be merged and are automatically checked for duplicate records. Habitat data,based on satellite imagery, forest resource inventory maps, aerial photography, etc., can be added in the normalArcView way.
DATA EXPLORATION WITH THE HRE
There are two major exploratory data analysis tools available in the HRE; basic ArcView queries and "Moose On ALeash" (MOAL). "Moose On A Leash" is a data animation tool. The purpose of this tool is to show the movementsof the animal over time, not just the positions. The MOAL option allows you to interactively step through selectedpoints one-at-a-time and determine the distance moved and elapsed time between consecutive fixes.
84
DATA ANALYSIS WITH THE HRE
Calculating Interfix Times and Distances
Although the MOAL option allows you to step through selected points one-at-a-time and determine the distancemoved and elapsed time between consecutive fixes, you may want to calculate and save multiple interfix distancesand elapsed times, as well as cumulative values for these variables. With these data you can calculate average distancemoved between fixes, average elapsed time between fixes, speed of movement, total distance moved in a given period,and so on. The HRE adds the calculation of multiple interfix distances and times to the Field menu of ArcView.
Calculating Home Ranges
The HRE currently includes 2 types of home range analysis models: minimum convex polygons (MCPs) and kernelmethods. Because different computer software programs may produce large differences in home range estimates basedon these models (Lawson and Rodgers 1997), we have attempted to provide all of the options offered in earlierprograms for calculation of the estimators and values input for various parameters.
Minimum Convex Polygons
"Percent" minimum convex polygons (%MCPs) (Michener 1979), sometimes referred to as "probability polygons"(Kenward 1987), "restricted polygons" (Harris et al. 1990), or "mononuclear peeled polygons" (Kenward andHodder 1996), can be generated for a subset of fixes using one of several percentage selection methods available inthe HRE. These methods include both the exclusion of points from a calculated (e.g., mean) or user-specified (e.g.,nest site) location, and an ordering criterion based on the amount of area each point contributes to the %MCP(White and Garrott 1990). A polygon is then generated from the subset of points.
Kernel Methods
The HRE includes both fixed and adaptive kernel methods. The kernel function used in the HRE is the standardbivariate normal (i.e., Gaussian) curve. Polygons may be calculated from either the kernel densities or volumes of thecurve under different portions of the utilization distribution. Several automated and subjective methods of findingthe "best" smoothing factor (standard bivariate normal, least squares cross-validation, biased cross-validation, user-specified) are provided in the HRE. Both Schoener's index and the Swihart and Slade index, used to determine theindependence of observations, are calculated in conjunction with kernel analyses.
Analyzing Habitat Use and Home Range Overlap
Determination of habitat types used by an animal is relatively straightforward in a GIS using an overlay function.The "habitat used by the animal" is the geometric intersection of "the habitat" with "the area used by the animal" asdescribed by a polygon resulting from one of the MCP or kernel methods. A habitat map can be produced fromsatellite imagery, forest resource inventory maps, aerial photography, etc. The HRE supports habitat maps createdwith a UTM coordinate system using the NAD 83 or NAD 27 spheroid. Determination of areas of overlap betweenhome ranges is achieved by the same methods used for analyzing habitat within home range polygons.
REFERENCES
Harris, S., W. J. Cresswell, P. G. Forde, W. J. Trewhella, T. Woollard, and S. Wray. 1990. Home-range analysis usingradio-tracking data - a review of problems and techniques particularly as applied to the study of mammals. MammalReview 20:97-123.
Kenward, R. 1987. Wildlife radio tagging. Academic Press, London, UK.
Kenward, R. E., and K. H. Hodder. 1996. RANGES V: an analysis system for biological location data. Institute ofTerrestrial Ecology, Furzebrook Research Station, Wareham, UK.
Lawson, E. J. G., and A. R. Rodgers. 1997. Differences in home-range size computed in commonly used softwareprograms. Wildlife Society Bulletin 25:721-729.
Michener, G. R. 1979. Spatial relationships and social organization of adult Richardson's ground squirrels. CanadianJournal of Zoology 57:125-139.
Rodgers, A. R., R. S. Rempel, and K. F. Abraham. 1996. A GPS-based telemetry system. Wildlife Society Bulletin24:559-566.
White, G. C., and R. A. Garrott. 1990. Analysis of wildlife radio-tracking data. Academic Press, San Diego,California, USA.

VIRTUAL FENCING - A PRESCRIPTION RANGE ANIMALMANAGEMENT TOOL FOR THE 21ST CENTURY
D. M. Anderson
USDA, Agricultural Research Service, Jornada Experimental Range; P. O. Box 30003, MSC 3JER, NMSU; LasCruces, NM 88003-8003 U.S.A.
Trade names used in this publication are solely for the purpose of providing specific information. Mention of a trade namedoes not constitute a guarantee, endorsement, or warranty of the product by the U.S. Department of Agriculture over otherproducts not mentioned.
ABSTRACT
Managing free-ranging animals to utilize forage resources efficiently remains a worldwide challenge as we enter the21st century. Optimum forage utilization requires herbivores be periodically moved commensurate with thelandscape's productivity. Stationary conventional fencing in the form of wood, wire or stone has been tried aloneand in combination with many other tools and techniques to positively affect animal distribution and forageutilization, yet none consistently permit flexible management in real time. Virtual fencing has the potential toautomate animal management and provide autonomous animal control in real time. Virtual fencing systems requirethat animals wear an electronics package that includes hardware, software and an antenna to receive Radio Frequency(RF) signals. A patented virtual fence device will be described that uses RF signals emanating from navigationsatellites of the Global Positioning System (GPS). These signals are used to locate the animal's geographic location,which can be logged at programmable intervals of ≥ 1 second. Furthermore, these signals are used to build virtualfences that can be programmed to take any geometrical shape, be manipulated in space and time and can surroundareas as well as individuals. The unit's Geographic Information System (GIS) data continuously compares theanimal's location and its angle of approach to that of the closest virtual fence. Should an animal attempt to penetratea virtual fence, algorithms within the unit's central processing unit determine the suite of programmable cues to beapplied to either the animal's right or left side to maximize the animal's distance of separation from a virtual fencein the least amount of travel. The cues are applied in a ramped fashion, beginning with the least and progressing tothe most aversive, depending upon how near the animal is to the virtual fence. Using this approach, the animaldetermines the intensity of cuing necessary to elicit a change in its behaviour. However, if the animal fails to respondat the highest level of cuing, the unit has been built to shut down in a fail-safe manner to prevent ineffective andunnecessary stress to the animal. In this device electronic generated audio sound and shock replace visual cues toproduce movement. Virtual fencing capitalizes on low stress handling principles, in which the animal's innatebehaviour is to move away from a stimulus that has penetrated its fight-flight zone. Recently a prototype device inthe form of a neck-saddle was evaluated to establish the proof-of-concept that bilaterally applied cues will change notonly a cow's location but also its direction of travel. Preliminary tests suggest virtual fencing will control beef cattlein a humane and reproducible manner. However, more research is required to determine how virtual fencing willoptimally benefit resource stewardship, using both domestic and wildlife species. Virtual fencing utilizing GPStechnology and bilateral cuing will provide a novel tool for bringing prescription animal management to reality inthe 21st century.
Key words: Wireless fencing, Global Positioning System (GPS), Geographical Information System (GIS), livestock,wildlife, animal control
INTRODUCTION
Managing animals has challenged man since the dawn of civilization (Holy Bible). With approximately 4 x 10⁹ cattle,sheep, goats, camels, buffaloes, pigs, horses, mules and asses (FAO 1999) on 13 x 109 ha of land (FAO 1987) animaldistribution remains the second most critical challenge after establishing a proper stocking rate (Holechek et al. 1998;Ratliff 2000). Animal distribution impacts the intensity and frequency of defoliation, which together determine netherbage growth following defoliation and herbage intake during defoliation (Parsons 1988) as well as the landscape'spotential for future herbage growth by influencing erosion and the watershed itself (Kauffman and Krueger 1984).
85

Improving animal distribution (Fig. 1) may increase livestock production yet the additional profit gained may bepartially or totally eliminated due to the costs associated with improving distribution (Conner 1991). Fencing is justone approach that has been used to manage animal distribution. This paper focuses on managing free-ranginganimals using virtual fencing, a prescription tool to unlock ecologically sound and flexible plant and animalhusbandry in the 21st century.
Figure 1 Factors influencing free-ranging animal distribution.
WHAT IS AN INVISIBLE FENCE?
An invisible fence is an electronically generated 3-dimensional boundary that may take any geometrical shape toenclose an area, as well as surround individual animals, but is unseen by the eye. Invisible fences can only controlanimals that are wearing equipment capable of capturing and using electronic signals. The majority of signals usedin invisible fences are radio frequencies (RF) between 3kHz and 300 giga Hz (Yarnall and Yarnall 1996). However,some systems utilize near infrared energy (McCarney et al. 1997) or compressional wave beams (Bianco and Ehren1997).
Invisible fences use sensory cues other than sight to produce a change in an animal's behaviour. These cues must beaversive enough to cause animals to alter their behaviour through innate instinct and/or training. Using cues to alterbehaviours has been investigated under the topic of instrumental animal conditioning (Kimble 1961).Chemoreceptors, mechanoreceptors or thermoreceptors individually, or in some combination, must be stimulated tokeep an animal from crossing the invisible boundary. Large animals can be controlled using audio cues in the formof whistles, beeps or a combinations of sounds (Albright et al 1966; Ames and Arehart 1972; Fury 1976; Gonda andVancuza 1982; Heffner and Heffner 1983; Custer 1995) including the human voice (Yarnell and Yarnell 1996; Kimet al. 1997). In addition, electric shock alone and in combination with audio cues have also been used to manageanimals (Miles 1951; Karn and Lorenz 1984; Martin et al. 1989; Gonda and Farkas 1989; McDade et al. 1993;Markus et al. 1998b).
Cues used in currently available invisible fencing devices are not easily changed once established (Touchton andPeinetti 1995) and appear limited to only a few preset levels (Gonda and Farkas 1989). However, most commercialinvisible fencing devices contain safety features to prevent inhumane cuing thus promoting optimum animal welfare(Mench and van Tienhoven 1986; Stricklin 1989; Arave and Albright 1998).
The first commercial invisible fencing system was designed for containing pets and was patented in 1974 by RichardPeck, owner of the Invisible Fence® Company (Wayne, PA). His system was also the first system tried on livestock.In 1987 unattended domestic goats were successfully confined on leafy spurge (Euphorbia esula) using his electronicdog collar (Fay et al. 1989). Shortly thereafter Quigley et al. (1990) used dog training collars manufactured by Tri-Tronics® (Tucson, AZ) to train steers to avoid a specific area; this was accomplished in less than two days. Recentlycollars manufactured by Tri-Tronics® were successfully used to control heifers in Canadian field and pen trials(Markus et al. 1998a). Rose (1991) proposed a signal transmitter/receiver system for activating an electronic noseclip to control cattle. Electronic ear tags using audio sound and electric shock cues, manufactured by AgriTechElectronics (Chanute, KS) were evaluated in 1992 in Texas and Nevada and found to be 90% effective in preventingcross bred yearling steers and heifers from entering a zone of exclusion (Tiedemann et al. 1999). In all the livestocktrials mentioned the RF signals originated from ground-based transceivers that transmitted unlicenced low power
Influences on Animal Distribution
Animals PhysicalDevelopments
Behaviors Husbandry AbioticFactors
Plants
Age
Breed
Class
PhysiologicalState
Species
Fencing
Minerals
Shade
Water
Bonding
Predation
SocialFacilitation
Burning
Fertilization
Herding
RotationalGrazingStrategies
Climate/Weather
Topography
Landscapes
Quality
Quantity
Species
86
high frequency signals. Such systems would require many transceivers if the topography is undulating and this maybe a reason these systems never gained widespread acceptance for managing livestock on large pastures.
THE GLOBAL POSITIONING SYSTEM (GPS)
Many of the line-of-sight limitations of ground-based RF systems disappear when RF signals originate from satellites,such as those of the Global Positioning System (GPS; Hurn 1993; Herring 1996), the Global Navigation SatelliteSystem (GLONASS; Almanac 2000; Krüger et al. 1994; Herring 1996; Langley 1998) or the proposed Europeanpublic-private Galileo Global Navigation Satellite System (GNSS; Gallimore and Maini 2000). With satellitetechnology have come devices that can control both animal location and direction of movement (Manning 1998;Anderson and Hale 2001). Though ground-based transceivers are not required, other challenges arise with satellite-generated RF signals, including those from forest vegetation canopy which may (Spruce et al. 1993; Rempel et al.1995) or may not (Bennett et al. 1997; Biggs et al. 1997) affect the signal's reception.
Technically, GPS is simple in concept but incredibly complex in implementation. The current GPS system was notfully operational until the 1990's even though it was developed in the late 1960's and early 1970's for precise timingand space-based navigation by the US Navy and Air Force, respectively, (McNeff 1999). World-wide geographiclocations are available from the 28 GPS satellites or 9 Russian GLONASS satellites (Almanac 2000). The GPSsatellites circle the earth twice each day (11 hr 58 min/orbit) at an altitude of about 20,000 km in one of six orbitsat an inclination of 55o (Krüger et al. 1994). To obtain very precise and accurate locations, a minimum of foursatellite signals must be available (Hurn 1993). Prior to 12:00 A M on May 2, 2000, the signal available tocommercial users had been distorted by the military for security reasons. This distortion was known as selectiveavailability (SA) and limited civilian accuracy to no more than ± 100 m (Lang 1997). Removal of SA improvedaccuracy to ± 20m (Anonymous 2000; Divis 2000). For higher accuracy Differential Global Positioning Systems(DGPS; Hurn1995; Moen et al. 1997) technology can be used.
The first study that employed GPS to locate animals was begun in March 1994 using collars designed andmanufactured by Lotek Engineering Inc. (Newmarket Ontario, Canada; Rodgers and Lawson 1997). To date GPSsystems have been used to successfully track domestic sheep (Roberts et al. 1995; Rutter et al. 1997) and cattle (Udalet al. 1998; Udal et al. 1999) as well as numerous wildlife species (Austin and Pietz 1997) to accuracies never beforepossible (Tomkiewicz 1997). Recently shock collars for training dogs (Files 1999) and devices to control largeanimals (Marsh 1999; Anderson and Hale 2001) have incorporated GPS technology.
THE FIGHT-FLIGHT ZONE
The key to controlling animals using invisible fencing is to administer appropriate cue(s) at the appropriate time andin the appropriate location and then stop the cue(s) immediately when the appropriate behaviour occurs. The basisfor knowing when, where and how much cuing is required lies in the principles of low stress animal handlingpractices, as advocated by applied animal ethologists including Bud Williams (personal communication), Smith(1998) and Grandin (1999).
All animals have a fight-flight zone or region surrounding the animal that, when penetrated, causes the animal tomove. Fight-flight zones are totally dynamic and constantly changing in size and shape over time even for the sameanimal. Animals that have had their fight-flight zone penetrated on their left side normally move to the right andvice versa. This innate behaviour to move away from a novel cue, regardless of type, is the most common instinctiveinitial defensive gesture shown among all animals (Dusenbery 1992; Smith 1998) and forms the basis by whichanimals are controlled using bilateral virtual fencing.
87

Figure 2 Hypothetical pastoral scenario for controlling free-ranging animals with a patented (Anderson and Hale 2001)virtual fencing device that uses autonomously applied bilateral cues. Radio Frequency (RF) signals from GlobalPositioning Satellites (GPS) are used to determine the geographic location of the instrumented cow and bondedsheep (Anderson 1998) and calculate their distance and subsequent angle of approach to the nearest virtualboundary. Geographic Information System (GIS) software contained in the neck-saddle determines when thecow has penetrated the virtual boundary, sensory cues are then administered to the side of the animal to moveit back into the zone of inclusion with the least travel and stress. The virtual boundary consists of belts inwhich a suite of sensory cues (sound only and sound + shock) are administered depending on the distance thecow is from the virtual center line. The cuing characteristics and belt widths are fully programmable. Builtin safety features prevent inhumane cuing as well as algorithms for administering sensory cues to turn the animalback toward the zone of inclusion should the animal cross into the zone of exclusion. The virtual center linecan deviate from the boundary line used initially to establish the virtual center line by ± 10 to 25 m usingcommercial GPS equipment (Shaw et al. 2000).
WHAT IS BILATERAL VIRTUAL FENCING?
The virtual fence with electronically generated bilateral cuing capabilities involves a patented (Anderson and Hale2001) method (Fig. 2) and prototype apparatus (Fig. 3). Virtual boundaries of various shapes can be created that aremovable in time and space and can be created around individual animals as well as delineating areas using RF signalsfrom GPS satellites. The invention controls animal location and direction of movement using several characteristicsnot previously available in other invisible fencing systems. First, stimuli are applied bilaterally and autonomouslyusing the RF signals emanating from GPS satellites. With this technology animals can be located as well as havingtheir direction of movement controlled. Second, the cues (audio sound and electric shock) are programmed to rampin a stepwise fashion, beginning with faint sounds and or small electric shock which would feel like a tingle. Thesecues are then programmed to progress to much louder sounds and or electric shock similar to that found in devicesmarketed for managing large animals. Electric shock is only administered if movement of the animal in theappropriate direction has not been detected by the system's microprocessor, following application of the sound cue(s)that cover a variable range of frequencies to accommodate various hearing abilities. If, after applying electric shock,the animal still refuses to change location within a programmable time or distance, the unit will automatically shutdown preventing undue stress to the animal. The repertoire of available cues provides a wide range of stimuli to whichan animal can react, allowing the animal to choose the appropriate level of stimulation to get movement to anappropriate location where cuing stops. Third, cues are fully programmable making it possible to have different cueson the right side compared to the left side.
The current prototype virtual fencing device is housed in a neck-saddle that attaches to the animal's neck withadjustable belting (Fig. 3). The electronics compartment located atop the saddle positions the GPS antenna skyward,contains the battery necessary to provide power and houses the microprocessor that is the heart of the system'sautonomous functioning. An RF transponder allows interfacing or communicating with similar devices worn byother animals or with a central microprocessor. The microprocessor includes hardware and spatial coordinate systemsoftware for determining the direction and bearing of the moving animal and comparing this with the position of
88

89
the predetermined virtual boundaries using Geographical Information System (GIS; Muehrcke and Muehrcke 1998)data. Once the closest virtual boundary and the distance the animal is from it is known, the side of the animal closestto a virtual boundary is determined together with information on whether the animal has penetrated the virtualboundary. If penetration has taken place, a control signal is initiated for activating the appropriate suite of cues tothe appropriate side of the animal. The GIS system also stores sensor data, GPS data, system parameters as well asan operating system for scheduling software functions including driver routines for the device's peripherals. Thiscapability allows the user to download specific positions (i.e., GPS coordinates) for desired virtual boundaries andupload all logged sensor and GPS data, in order to change the characteristics of the applied stimuli, and/or reprogramthe embedded computer system parameters. Logging the animal's geographic location is programmable at intervalsof ≥ 1 second. On either side of the neck-saddle an acoustic piezo transducer and a pair of spring loaded electrodes,located in the neck region proximal to the head and ear, deliver the sound and electric shock to the right and leftsides, respectively. The electric shock can be administered either in the presence or absence of sound depending onhow the device is programmed.
Determining to which side of the animal the cue(s) are to be applied, is based upon the animal's position with respectto the virtual boundary, the angle of incidence between the animal's direction of travel and the virtual boundary, andthe animal's expected response to the bilateral stimulation. If the animal is within the area of inclusion and the angleof incidence is acute then the cue will be applied on the side of the animal that will move the animal into the obtuseangle it forms with the edge of the virtual boundary (Fig. 2). If the animal has penetrated through the virtualboundary and is in the zone of exclusion, the cue(s) will be directed to the obtuse angle. Algorithms in themicroprocessor determine to which side the cue(s) should be applied in order to maximize the separation of theanimal from the virtual boundary with the minimum change in the animal's bearing. If the animal has penetratedthe virtual boundary approximately perpendicular in its movement or the approach is towards a right angle cornerof two virtual boundaries the side to which the cues are applied is determined entirely randomly by themicroprocessor.
Figure 3 Virtual fence device housed in a neck-saddle worn by a haltered cow. Above the front strap securing the neck-saddle around the animal's neck are a pair of horizontally-spaced, spring-loaded electrodes for administeringelectric shock cues to the animal's right side and directly above them is the peizo transducer, housed in aprotective cylinder, for producing audio sound cue(s). Electronic hardware and software, with batteries forpower, are housed in the rectangular box sitting on the saddle.
MORE ABOUT SENSORY CONTROL
Conventionally we get animals to do our bidding on our time schedule. This is evidenced by the physicalcharacteristic of many fences and the egos of those who built them. However, for virtual fencing to be used optimallya paradigm shift in thinking will be required to allow the animal to meet our goals, but on their time schedule.Patterns of movement vary among species as well as seasonally and diurnally, due to a number of environmental aswell as physiological factors (Arnold and Dudzinski 1978). These factors must be considered in order to determinethe optimum time, location and duration to apply cues. Generally the least amount of force required to get ananimal to change its location would occur when the animal is already moving and not at rest (Fig. 4). Therefore,cuing only moving animals will probably produce the most efficient and least stressful virtual fence control protocol.

Even with this protocol, virtual fences could potentially pose some challenges since animals are aware of theirsurroundings (Piggins and Phillips 1998; Veissier et al. 1998). Canadian research found that animals would notpenetrate an invisible boundary for up to four days following removal of the controlling cues (Markus 1998a). Thissuggests that animals may have associated the cue(s) with various landscape objects at the time that the sensory cue(s)were being applied. Using ramped cues and possibly randomly moving the virtual boundaries periodically, may keepanimal's focused on the cues rather than on associated objects, but this hypothesis awaits scientific evaluation.
Every animal may not need virtual fencing instrumentation to achieve group control, since domestic mammalsevolved from wild species that are social and form groups (Clutton-Brock 1981). Animals that live in groups notonly influence one another's diet (Howery et al. 1998) but also their spatial location. Sheep apparently learn toavoid electric fences through social facilitation, since training a few animals appears to affect the entire flock (Lynchet al. 1992). Fay et al. (1989) demonstrated that most non-collared (control) Spanish goats would not stray morethan 50 m from collared peers restrained inside RF boundaries. However, as the ratio of collared animals decreased,Fay et al. (1989) found the number of non-collared animal "escapes" increased. Anderson (1998) demonstratedevery sheep in a group need not be bonded to cattle if the goal is to have both species of animals remain together inone or more flerds (flocks + herds in which small ruminants have been bonded to cattle; Anderson et al. 1988).Bonded sheep consistently remain with cattle thus eliminating the need for internal conventional sheep tight fencing(Anderson et al. 1994). However, when safety or health issues are the reasons for animal control, systems basedstrictly on manipulating animal behaviour are not adequate in themselves and conventional fencing should be used.
CONCLUSIONS
Real time autonomous management of free-ranging animal distribution will involve combining cutting edgeelectronic technology with animal behaviour. Research to address appropriate protocols for managing free-ranginganimals with virtual fences has just begun. Virtual fencing will be one of many new tools that combines electronicsand animal behaviour to make prescription range animal management a reality in the 21st century.
Figure 4 Sequential photos documenting the response of a foraging cow to bilateral cuing from a virtual fence devicehoused in the neck-saddle. The cow initially grazing south is stimulated on its left side, it turns north (right)and walks away from the cue and subsequently re-establishes grazing in a northerly direction in the presence oftwo calves.
REFERENCES
Albright, J. L., W. P. Gordon, W.C. Black, J.P. Dietrich and W.W. Snyder. 1966. Behavioral response of cows toauditory training. J. Dairy Sci. 49:104-106.
Almanac. 2000. GPS Constellation. GPS World Showcase. 11(8):44-45.
90

Ames, D. R. and L. A. Arehart. 1972. Physiological response of lambs to auditory stimuli. J. Anim. Sci. 34(6):994-998
Anderson, D. M. 1998. Pro-active livestock management - capitalizing on animal behaviour. J. Arid Land Studies7S:113-116.
Anderson, D.M. , C.V. Hulet, W.L. Shupe, J.N. Smith and L.W. Murray. 1988. Response of bonded and non-bonded sheep to the approach of a trained border collie. Appl. Anim. Behav. Sci., 21: 251-257.
Anderson, D. M. and C. S. Hale, inventors; The United States of America as represented by the Secretary ofAgriculture, assignee. 2001. Animal control system using global positioning and instrumental animal conditioning.U.S. patent 6,232,880. May 15. 18p. Int. C17 G08B 23/00.
Anderson, D. M., K. M. Havstad, W. L. Shupe, R. Libeau, J. N. Smith, and L. W. Murray. 1994. Benefits and costsin controlling sheep bonded to cattle without wire fencing. Small Rum. Res. 14:1-8.
Anonymous. 2000. U. S. Government unscrambles GPS signal. Geoworld. 13(6):10.
Austin, J. E. and P. J. Pietz, Chairpersons. 1997. Abstracts from forum on wildlife telemetry, innovations,evaluations and research needs. The Wildlife Society and Biological Resources Division of the U.S. GeologicalSurvey, Snowmass Village, CO. 82 pp.
Arave, C. W. and J. L. Albright. 1998. Animal welfare issues: dairy. AWIC Newsletter 9(1-2):3-10.
Arnold, G. and M. L. Dudzinski. 1978. Ethology of free-ranging domestic animals. Elsevier Scientific PublishingCo., Amsterdam, The Netherlands.
Bennett, K., J. Biggs, and P. R. Fresquez. 1997. Determination of locational error associated with Global PositioningSystem (GPS) Radio Collars in relation to vegetation and topography in North-central New Mexico. Los AlamosNat. Lab Rep. LA-13252-MS.
Bianco, F. J. and L. Ehren, inventors, Elexis Corporation, assignee. 1997. Apparatus for and method of determiningentry of an animal into a barrier region. U. S. Patent 5,640,932. June 24. 17 p. Int Cl6 A01K 15/02.
Biggs, J., K. Bennett, and P. R. Fresquez. 1997. Evaluation of habitat use by Rocky Mountain Elk (Cervus elaphusnelsoni) in North-Central New Mexico using Global Positioning System (GPS) Radio Collars. Los Alamos Nat. LabRep. LA-13279-MS.
Clutton-Brock, J. 1981. Domesticated animals from early times. Univ. of Texas Press. Austin, TX.
Conner, J. R. 1991. Social and economic influences on grazing management Chapter 9. Pages 191-199. In R. K.Heitschmidt and J. W. Stuth eds. Grazing management an ecological perspective. Timber Press. Portland, OR.
Custer, D. A., inventor; DogWatch, Inc., assignee. 1995. Animal control apparatus. U. S. Patent 5,465,687. Nov14. 17 p. Int Cl6 A01K 15/00.
Divis, D. A. 2000. Capitol outlook SA no more GPS accuracy increases 10 fold. Geospatial Solutions. 10(6):18-20.
Dusenbery, D. B. 1992. Sensory ecology. W. H. Freeman and Co. New York, NY.
FAO Land Use as of 1994 [Web Page]., 1987 Sept. 1; Accessed 1998 May 16. Available at: http://apps.fao.org/.
FAO Live Animals as of 1999 [Web Page]., 1999 November 11; Accessed 2000 April 5. Available at: http://apps.fao.org/.
Fay, P. K., V. T. McElligott, and K. M. Havstad. 1989. Containment of free-ranging goats using pulsed-radio-waveactivated shock collars. Appl. Anim. Behav. Sci. 23: 165-171.
Files, J. C., inventor; Files, J. C., assignee. 1999. Animal training and tracking device having global positioningsatellite unit. U. S. Patent 5,857,433. Jan 12. 10 p. Int Cl6 A01K 15/02.
Fury, C. M., inventor; Lawrence Peska Associates, Inc., assignee. 1976. Range triggered animal training system. U.S. Patent 3,980,051. Sept 14. 4p. Int Cl2 A01K 15/00.
Gallimore, J. and A. Maini. 2000. Galileo-the public-private partnership. GPS World. 11(9):58-60, 62-63.
91

Gonda, G. J. and J. Vancaza, Jr., inventors; Tri-Tronics, Inc., assignee. 1982. Animal training apparatus. U. S.Patent 4,335,682. Jun 22. 9 p. Int Cl3 A01K 15/00.
Gonda, G. J. and G. J. Farkas, inventors; Tri-Tronics, Inc., assignee. 1989. Method and apparatus for remote controlof animal training stimulus. U. S. Patent 4,802,482. Feb 7. 8 p. Int Cl4 A61N 1/00.
Grandin, T. 1999. Safe handling of large animals (cattle and horses). Occupational medicine: State of the artreviews. 14(2):1-17.
Heffner, R. S. and H. E. Heffner. 1983. Hearing in large mammals: horses (Equus caballus) and cattle (Bos taurus).Neurosci. 97(2):299-309.
Herring, T. A. 1996. The global positioning system. Sci. Amer. 274(2):44-50.
Holechek, J. L., R. D. Pieper, and C. H. Herbel. 1998. Range management principles and practices. 3rd ed. PrenticeHall Inc., Englewood Cliffs. N. J.
Holy Bible. Ezekiel 34:5-6.
Howery, L.D., F. D. Provenza, G. B. Ruyle, and N. C. Jordan. 1998. How do animals learn if rangeland plants aretoxic or nutritious? Rangelands, 20:4-9.
Hurn, J. 1993. GPS a guide to the next utility. Trimble Navigation. Pt. No. 16778.
Hurn, J. 1995. Differential GPS explained. Trimble Navigation. Pt. No. 23036.
Kauffman, J. B. and W. C. Krueger. 1984. Livestock impacts on riparian ecosystems and streamside managementimplications.. A review. J. Range Manage. 37:430-438.
Karn, J. F. and R. J. Lorenz. 1984. Technique to separate grazing cattle into groups for feeding. J. Range Manage.37:565-566.
Kim, J. S., H. Currie, M. Choi, and H. Y. So, inventors; D. T. Systems Inc., assignee. 1997. Electronic animaltraining system. U. S. Patent 5,605,116. Feb 25. 7p. Int Cl6 A01K 15/02.
Kimble, G. A. 1961. Conditioning and learning. 2nd ed. Appleton-Century-Crofts, Inc. New York, NY.
Krüger, G., R. Springer, and W. Lechner. 1994. Global navigation satellite systems (GNSS). Comp. Elect. Agric.11:3-21.
Lang, A. 1997. Put low-cost GPS Receivers to the test. GIS World. 10(6):36.
Langley, R. B. 1998. Almanac: GLONASS constellation. GPS World Showcase. 9(8): 57.
Lynch, J. L., G. N. Hinch, and D. B. Adams. 1992. The behaviour of sheep biological principles and implicationsfor production. Redwood Press, Melksham. UK.
Manning, C. D. H., inventor; Trimble Navigation, assignee. 1998. Position and physiological data monitoring andcontrol system for animal herding. U. S. Patent 5,791,294. Aug 11. 18 p. Int Cl6 A01K 3/00.
Markus, S., D. W. Bailey, D. Jensen, and M. Price. 1998a. Preliminary evaluation of a fenceless livestock controlsystem. J. Anim. Sci. 76 (Supp. 1): 103 (Abstract).
Markus, S., D. Jensen, D. W. Bailey, and M. Price. 1998b. Effect of location and intensity of electrical shock oncattle movements. J. Anim. Sci. 76 (Supp. 1): 97 (Abstract).
Marsh, R. E., inventor; AgriTech Electronics L. C., assignee. 1999. Fenceless animal control system using GPSlocation information. U.S. patent 5,868,100. Feb 9. 9 p. Int Cl6 A01K 15/02; G08B 23/00.
Martin, M. J. D., D. A. Pritchard, and R. G. A. Stephenson. 1989. Electric shock conditioning of sheep to avoidfeed supplement troughs in field investigations of diet supplementation. Aust. Rangel. J. 111:44-46.
Mench, J. A. and A. van Tienhoven. 1986. Farm animal welfare. Am. Sci. 74:598-603.
McCarney, D. A., F. A. Calabrese, and K. B. Shockey, inventors; Industrial Automation Technologies, Inc., assignee.1997. Animal containment system. U.S. Patent 5,608,381. Mar 4. 20 p. Int Cl6 G08B 13/14.
92
93
McDade, R., S. Pancheri, and V. A. Juliana, inventors; Invisible Fence Company Inc., assignee. 1993. Electrodedevice for an electric shock generator carried on an animal collar . U. S. Patent 5,207,178. May 4. 13p. Int Cl5
A01K 15/00; G08B 23/00.
McNeff, J. 1999. Leadership in satellite navigation and timing: Past success - future challenge, Part I. GPS World.10(10):48-52.
Miles, A. D. 1951. Electric fence for distribution of cattle on a range grazed by sheep and cattle. J. Range Manage.4(4):228-232.
Moen, R. A., J. Pastor, and Y. Cohen. 1997. Accuracy of GPS telemetry collar locations with differential correction.J. Wild. Manage. 61: 530-539.
Muehrcke, P. C. and J. O. Muehrcke. 1998. Map use now with GPS reading, analysis and interpretation. 4th ed.J P Publications Madison, WI.
Parsons, A. J. 1988. The effect of season and management on the growth of grass swards. In: Ed Jones M. B.,Lazenby A. The Grass Crop. 129-178.
Piggins, D. and C. J. C. Phillips. 1998. Awareness in domesticated animals - concepts and definitions. Appl. Anim.Behav. Sci. 57:181-200.
Quigley, T. M., H. R. Sanderson, A. R. Tiedemann, and M. L. McInnis. 1990. Livestock control with electrical andaudio stimulation. Rangelands, 12:152-155.
Ratliff, R. D. 2000. Viewpoint: Utilization & ecosystem function. Rangelands. 22:11-12.
Rempel, R. S., A. R. Rodgers, and K. F. Abraham. 1995. Performance of a GPS animal location system under borealforest canopy. J. Wild. Manage. 59: 543-551.
Roberts, G., A. Williams, J. D. Last, P. D. Penning, and S. M. Rutter. 1995. A low-power post processed DGPSsystem for logging the locations of sheep on hill pastures. Navigation. 42:327-336.
Rodgers, A.R. and E. J. G. Lawson. 1997. Field trials of the Lotek GPS collar on moose. In: Austin, J.E. and P.J.Pietz, Chairpersons. Abstracts from forum on wildlife telemetry innovations, evaluations, and research needs., TheWildlife Society and Biological Resources Division of the U.S. Geological Survey, Snowmass Village, CO. 82 pp.
Rose, A. F. 1991. An alternative to fences. Rangelands, 13:144-145.
Rutter, S. M., N. A. Beresford, and G. Roberts. 1997. Use of GPS to identify the grazing areas of hill sheep.Comput. Elect. Agric. 17:177-188.
Shaw, M., K., Sandhoo, and D. Turner. 2000. Modernization of the global positioning system. GPS World.11(9):36-38, 40, 42, 44.
Smith, B. 1998. Moving 'em - A guide to low stress animal handling. The Graziers Hui. Kamuela, HI.
Spruce, M. D., S. E. Taylor, J. H. Wilhoit, and B. J. Stokes. 1993. GPS tracking of cattle on pasture. Presented atthe December 1993 American Society of Agricultural Engineers Meeting Paper No. 937504. ASAE, 2950 Niles Rd.,St. Joseph, MI 49085-9659 USA.
Stricklin, W. R. 1989. The development of guidelines for the care and use of agricultural animals used in agriculturalresearch and teaching. In: J. W. Driscoll, ed. Animal care and use in behavioral research: regulations, issues andapplications. Anim. Welfare Info. Ctr., Nat. Agr. Lib., Beltsville, MD.
Tiedemann, A. R., T. M.Quigley, L. D. White, W. S. Lauritzen, J. W. Thomas, and M. L. McInnis. 1999. Electronic(Fenceless) control of livestock. U.S. Dept. Agri For Serv. Pac Northwest Res. Stn. PNW-RP-510.
Tomkiewicz, S. M. Jr., 1997. Advancements in the use of GPS technology in obtaining position information fromfree-ranging wildlife. In: Austin, J.E. and P.J. Pietz, Chairpersons. Abstracts from forum on wildlife telemetryinnovations, evaluations, and research needs., The Wildlife Society and Biological Resources Division of the U.S.Geological Survey, Snowmass Village, CO. 82 pp.
Touchton, S. F. and D. L. Peinetti, inventors; Invisible Fence Company, Inc., assignee. 1995. Multi-channel animalcontrol device with external data communication. U. S. Patent 5,435,271. Jul 25. 24 p. Int Cl6 A01K 3/00.

Udal, M. C., L. W. Turner, B. L. Larson, and S. A. Shearer. 1998. GPS tracking of cattle on pasture. Presented atthe July 1998 American Society of Agricultural Engineers Meeting Paper No. 983134. ASAE, 2950 Niles Rd., St.Joseph, MI 49085-9659 USA.
Udal, M. C., L. W. Turner, B. T. Larson, L. J. Driedger, and S. A. Shearer. 1999. Grazing time and assessment forbeef cows on pasture using GPS. J. Anim. Sci. 77 (Supp. 1): 203 (Abstract).
Veissier, I., A. Boissy, R. Nowak, P. Orgeur, and P. Poindron. 1998. Ontogeny of social awareness in domesticherbivores. Appl. Anim. Behav. Sci. 57:233-245.
Yarnall, R. G. Jr. and R. G. Yarnall, Sr., inventors,. Yarnall, R. G. Jr. and. Yarnall, R. G. Sr., assignee. 1996.Electronic confinement system for animals using modulated radio waves. U.S. Patent 5,565,850. Oct 15. 13 p. IntCl6 G08B 23/00.
94

95
A VERY LIGHTWEIGHT FLIGHT RECORDER FOR HOMINGPIGEONS BASED ON GPS
Karen von Hünerbein1 and Eckhard Rüter2
1 Zoologisches Institut, Siesmayerstr. 70, 60323 Frankfurt2 Rüter EPV Systeme GmbH, Lagerstr. 19/10, 32425 Minden
ABSTRACT
In order to learn more about the homing behaviour of homing pigeons (Columba livia) we sought a new method totrack their flight paths with a high temporal and spatial resolution. We chose GPS because of its worldwideavailability, its high accuracy of position fixes and its high rate of position updates. After several years of developmentwe have been able to develop a GPS flight recorder which is light-weight enough for pigeons to fly with. The deviceconsists of a GPS hybrid board, an on-board datalogger, a DC-DC converter, a small patch antenna, a lithum batteryand an additional microprocessor controlling the GPS according to user-defined parameters. The device has a weightof 33g plus 7g for a harness. It can store approximately 12,000 positions and operates for 3 hours. The timeresolution is 1 position per second. The main step for achieving the light weight was the finding of the GPS hybridboard.
In tests on homing pigeons in autumn 1999, released from a site about 30 km away, the device proved to operatereliably and effectively. All pigeons could fly well with the device and returned home on the same day. In summer2000 a series of experiments on pigeons were performed from 2 release sites, yielding more than 100 flight paths.Most pigeons returned successfully, but 3 were lost.
The tracks reveal surprising details of the homing flights, such as initial loops flown immediately after release,deviations from the home direction and the "bee line" and large detours flown by some of the birds. The birds weretracked all the way to the home loft. The GPS flight recorder can be used to track many species of free-flying birds,providing they can be recaptured , although the 3h time of operation may be too short for many applications.
REFERENCES
http://www.rz.uni-frankfurt.de/FB/fb16/akpoev/Karen/Karenneueng.html
Hünerbein K., H.J. Hamann, E. Rüter and W. Wiltschko. 2000. A GPS-based System for Recording the Flight Pathsof Birds. Naturwissenschaften 87:278-279.
Hünerbein K., E. Rüter 2000. Homing In with GPS. Galileo's World, Summer 2000: 14-22.
Hünerbein K., H.J. Hamann, E. Rüter and W. Wiltschko. 2000. A GPS Flight Recorder for Homing Pigeons: FirstTracks of Homing Pigeons. Proceedings of the European Symposium on Global Navigation Satellite Systems , 1.-4.Mai, Edinburgh. Royal Institute of Navigation. London: 807-816.
Hünerbein K., H.J. Hamann, E. Rüter & W. Wiltschko. 2000. The GPS Flight Recorder for Homing PigeonsWorks: Design and First results. Conference Proceedings of the European Telemetry Conference 00, May 22nd-25th.Arbeitskreis Telemetrie e.V. Braunschweig: 232-241.

HIGH PERFORMANCE GPS COLLARS, USE OF THE LATESTAVAILABLE TECHNOLOGY
Robert Schulte1 and Ulrich Fielitz2
1 VECTRONIC Aerospace GmbH, Carl-Scheele-Str. 12, D-12489 Berlin, Germany2 Environmental Studies, Am Herberhäuser Weinberge 23, D-37075 Göttingen, Germany
ABSTRACT
In the last five years the VECTRONIC Aerospace GmbH (former Ingenieurb¸ro Schulte) and EnvironmentalStudies have developed several different types of GPS Collars. Due to the miniaturization of electronic componentsin the last few years, the size and the weight of the GPS-collars have been reduced by a factor of more than four,whereas the efficiency has increased.
The newest version of the GPS-Collar has a revolutionary modular concept concerning the GPS Receiver technologyand data communication. Depending on the application, the customer has a choice between 8-channel, 12-channeland 16-channel GPS Receivers. The downloading of position data can be achieved via a cable after retrieval of thecollar, or in the field via wireless data communication. Several different possibilities can be used for the wireless dataexchange. In areas where the use of a ground station (mobile or unmanned / autonomous) is suitable, the licence freeISM (Industrial Scientific Medical) frequency range (433-860-915 MHz) can be used. In areas with good GSM(Global System for Mobile communication) coverage, data transfer can be achieved very easily via SMS (ShortMessage Service). Data can be sent via the world-wide mobile phone network to the user. In areas where theoperation of an autonomous ground station is not practical and there is no GSM coverage, data can alternatively betransmitted via LEO (Low Earth Orbit) satellites to the customer. In recentyears, numerous satellites have beenlaunched for mobile communication services, such as ORBCOMM, TUBSAT and ARGOS.
Depending on the number of collars being used in the same study area, a cheaper alternative to satellitecommunication could be the use of very small UAV's (Unmanned Air Vehicle) as data relay stations.
The intensive use of the latest available technology has resulted in GPS collars with high performance but a low price.These collars have the following features:
� Temperature and activity sensors as standard.
� Powerful combined beacon and data transmitter, with a range of more than 10 km (ground to ground).
� Fast data transmission to the ground station.
� Positions can be programmed by the input of the time and date, with no need to use timetables.
� Continuous logging and storing of temperature and activity information, at regular intervals of five minutesduring the lifetime of the collar.
� More than 100,000 complete datasets, without DGPS information, can be stored in the onboard memory.
� Interface to GSM and satellite transceiver/transmitter.
� Low Weight: less than 500 g. for more than 3,700 positions (with an average Time to First Fix of 1 minute).
� Several different battery packs available.
� Battery pack replaceable by the user.
INTRODUCTION
Based on the field experience with our GPS-Collars 2TD/2TDD (figure 1), a complete new generation of highperformance GPS collars were developed. A detailed diagram of the new collars GPS Plus is shown in figure 2.
97
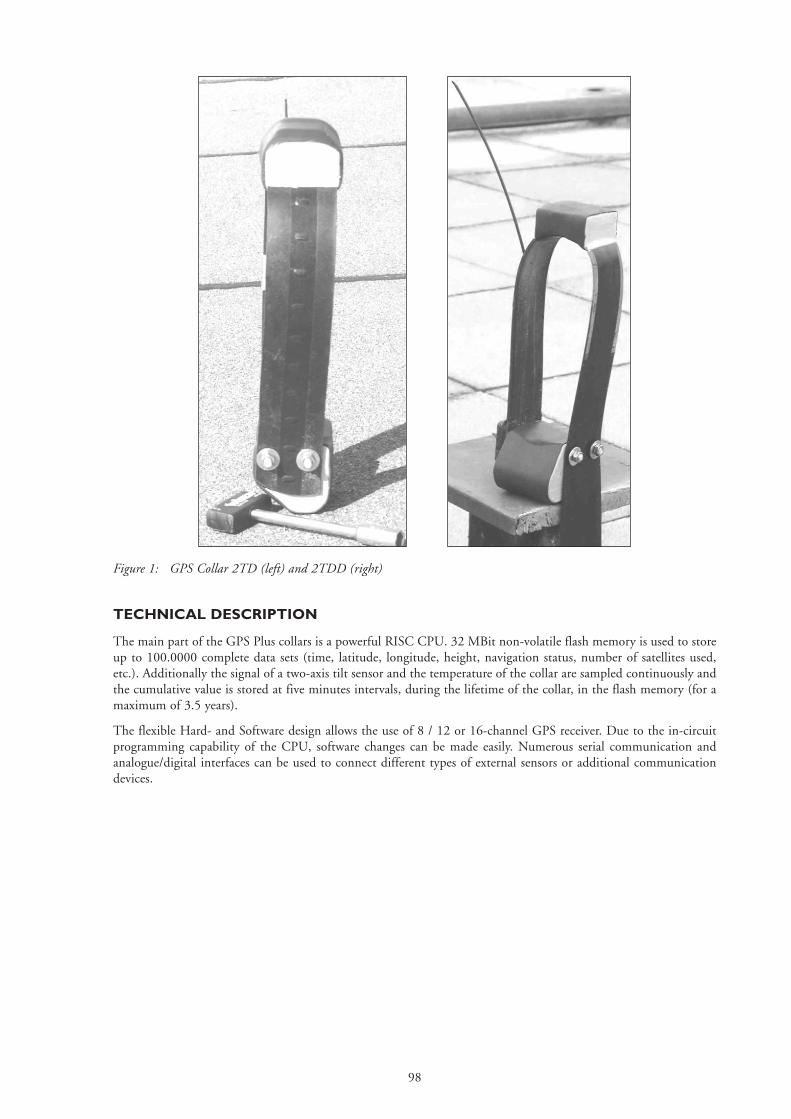
98
Figure 1: GPS Collar 2TD (left) and 2TDD (right)
TECHNICAL DESCRIPTION
The main part of the GPS Plus collars is a powerful RISC CPU. 32 MBit non-volatile flash memory is used to storeup to 100.0000 complete data sets (time, latitude, longitude, height, navigation status, number of satellites used,etc.). Additionally the signal of a two-axis tilt sensor and the temperature of the collar are sampled continuously andthe cumulative value is stored at five minutes intervals, during the lifetime of the collar, in the flash memory (for amaximum of 3.5 years).
The flexible Hard- and Software design allows the use of 8 / 12 or 16-channel GPS receiver. Due to the in-circuitprogramming capability of the CPU, software changes can be made easily. Numerous serial communication andanalogue/digital interfaces can be used to connect different types of external sensors or additional communicationdevices.

99
Figure 2: Diagram of the GPS Plus Collar
A complete, newly designed beacon and data transceiver (bi-directional) is used to transmit the data to anautonomous or to a handheld ground station (figure 3). The mobile handheld ground station can receive the lastcomputed GPS position of the collar and calculate the direction and distance to the collar with its own GPS receiver.The frequency and output power of the transceiver is software programmable and can be changed by the user. Thelicence free ISM (Industrial Scientific Medical) frequency bands (433-860-915 MHz) are used for thecommunication between the collar and the ground station. The beacon transmitter is only switched on by acommand from the ground station for a few minutes. This concept saves power and only the user can activate thebeacon transmitter.
2-axis tilt sensor
Continuoussampling
Temperaturesensor
8 / 12 or 16Channel GPS
Receiver
SCI1 SCI2
Storing of the cumulative countof tilt sensor and temperature
sensor every 5 minutes
Beacon and datatransceiver in thelicense free ISMfrequency bands433 / 860 / 915
MHz
RISC CUP(Reduced Instruction Set Computer)
with 32 MBit Flash Memory
SCI5 SCI4
SCI6 .. SCI nDigital I/O and analogue
interface
SCI1 SCI2 SCI3
DC / DCConverter
Additional (.16)digital I/O /
analogue andSCI interface
lines forexternal sensors(e.g. heartbeat,
etc.)
PC
GSM 900/1800/
GSM 900/1900or
ARGOS / LEOSatellite
TransceiverMain
batteryBackupbattery
GSM Groupe Spécial MobileISM Industrial Scientific and MedicalLEO Low Earth OrbitSCI Serial Communication Interface
Optional
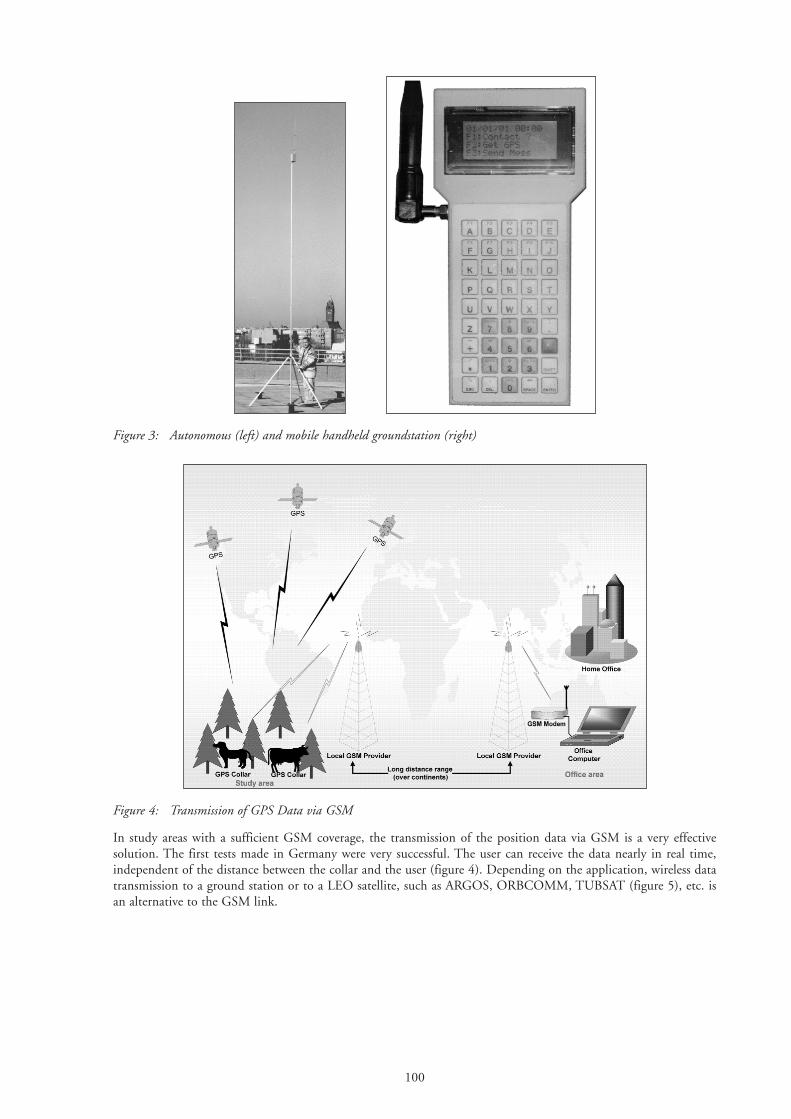
Figure 3: Autonomous (left) and mobile handheld groundstation (right)
Figure 4: Transmission of GPS Data via GSM
In study areas with a sufficient GSM coverage, the transmission of the position data via GSM is a very effectivesolution. The first tests made in Germany were very successful. The user can receive the data nearly in real time,independent of the distance between the collar and the user (figure 4). Depending on the application, wireless datatransmission to a ground station or to a LEO satellite, such as ARGOS, ORBCOMM, TUBSAT (figure 5), etc. isan alternative to the GSM link.
100

Figure 5: The microsatellites TUBSAT-A (left) and TUBSAT-N (right)
Figure 6: Reindeer (Photo: H. Norberg, J. Kumpula) and Ram with GPS Collars
CONCLUSION
The use of the newest available technology is a practical, ecologically sound and cost effective method forinvestigating the spatial locations of animals over time in difficult terrain.
101


GPS SOLUTIONS FROM LOTEK WIRELESS - A NEW APPROACHTO WILDLIFE RESEARCH
Lotek's automatic tracking and monitoring systems provide position and other sensor data ideally suited to wildlifebehaviour and habitat utilisation studies. Based on the Navstar Global Positioning System, Lotek's collars have fieldreplaceable batteries. The GPS_1000 is capable of collecting and storing over 3000 data records, which can beperiodically downloaded with a UHF modem, significantly improving the efficiency and cost-effectiveness of anywildlife study. The remote downloading capability allows decisions to be made promptly and gives instant access tocollected data if required. The GPS_2200 is a more lightweight collar, capable of collecting and storing over 9000data records.
With differential correction, both collars can provide highly accurate position readings with an error of less than 5meters. In addition, each collar has a 2-axis activity sensor to track grazing versus other activities, enabling theresearcher to obtain accurate maps of travel paths and behaviour patterns that previously would not have beenpossible. Furthermore, by using the highly flexible scheduling option, the collars' operation can be customised toparticular research needs.
Lotek's remote release mechanisms for GPS and VHF collars enable the recovery of tracking collars without thecomplexity and expense of catching the animals. In addition, the use of drop-off eliminates undue trauma caused toanimals during the capture process. There are two types of drop-off mechanism: radio release or release by timer.Radio release allows full control and minimises the risk of losing the collar. The remote release mechanisms can befitted to any GPS or VHF collar, old or new, either in the factory or by the customer.
Lotek is very conscious of scientists' needs for a total solution to their wildlife research problems. To address them,Lotek is just about to launch its smallest datalogger - the GPS_3000 (weighing less than 300g), also the GPS_4000,which is a new generation replacement for the GPS_1000 and a software database management tool - BioMap.BioMap will help in data management and, in conjunction with Arcview extensions, will assist in graphical displayand analysis of data.
GPS_1000 TECHNICAL SPECIFICATIONS
The collar contains GPS receiverRadio modemVHF tracking beaconComputer/memory module
Command unit Battery poweredFunction: to command, control and interrogate GPS_1000 collarsInterfaces with PC
Operational life 268 days (small battery pack)(@ 6 fixes/day, @ 25oC ) 575 days (large battery pack)
Data link operating frequency 450-470 MHz
Data format 9,600 baud, direct FM
Approximate range 15 km ground to air, depending on the terrain
VHF beacon frequency Customer specified 148-168 MHz
Operating temperature 30oC to +50oC
Memory retention temperature -50oC to +75oC
Total collar weight 1.8 kg to 2.1 kg (dependent on battery and animal neck size)
Data storage capacity 3,640 locations (non-differential mode)1,640 locations (differential mode)
103

104
GPS_2200LR TECHNICAL SPECIFICATION
Weight about 950g
Housing dimensions 12.0 x 8.6 x 14.6 (cm) (Lgth x Wdth x Hgt)
GPS battery life 5000 fixes(rechargeable batteries)fix taken every 5 minutes 17 daysfix taken every 10 minutes 34 daysfix taken every 15 minutes 52 dayslarge lithium (non-rechargeable) 9000 fixessmall lithium (non-rechargeable) 4000 fixes
VHF Beacon life >2 years
Data storage capacity 10,423 locations (non-differential mode)5,028 locations (differential mode)
Optional sensors TemperatureMortalityRecovery2-Axis Activity
VHF range 140-175MHz
Operating temperature range -30oC to +50oC
Data retention range -50oC to +75oC
Field programmable GPS & Beacon Schedule & Mortality Delay
Field upload GPS & Beacon Schedule, Satellite Almanac & Mortality Delay
Field download Data & Diagnostics
REMOTE RELEASE MECHANISM TECHNICAL SPECIFICATION
Weight 170 grams
Expected life radio activated version - 24 months
time only version - 36 months
Radio activation range 200 m (line of sight)
Receiver sensitivity -55dBm
Radio frequency 447.225 Mhz
Transmission power 30dBm into 50 ohm load
Time Resolution 2 week increments*
Time programming at Lotek only**
Time drift 1 hour per year
* Activation by relative time function (not absolute time) is initiated when a magnet is removed from themechanism
** Once a time is programmed into the mechanism at Lotek, it cannot be changed unless the electronics arereplaced

105
GPS_1000, GPS_2200 and GPS_3000 tracking collars
Lotek Wireless115 Pony Drive, Newmarket, Ontario, Canada, L3Y 7B5Phone: (905)-836-6680Fax: (905)-836-6455e-mail: [email protected] site: www.lotek.com


107
DISCOVER THE FULL POWER OF GPS WITH TELEVILT GPS COLLARS.
Televilt is an international corporation with more than 28 years of experience in telemetry equipment manufacturing.All Televilt products are built with Scandinavian quality and environmental sensitivity. Every component is chosenfor the best strength-to-weight ratio and performance, guaranteeing a high-end GPS collar.
Two GPS systems are available, GPS-SimplexTM and GPS-PosrecTM
GPS-SimplexTM incorporates a modern, ultra-fast GPS receiver with a slim collar design. The result is a GPS collarthat acquires a high rate of position fixes in a lighter package than offered elsewhere on the market. But the real keyto this spectacular product is its fast remote data download. Together with a repetition system, remote download ofall data from the collar is easy.
A VHF beacon, activity and mortality sensors are standard. A programmable drop off device is also available.Changing the user-replaceable battery pack is easy. There is no need to return the collar to Televilt for batteryreplacement.
GPS-PosrecTM is a unique concept in the realm of GPS collars. As with GPS-Simplex(TM) a modern ultra-fast GPSreceiver lays the groundwork for a very lightweight, store-on-board unit. Delivered already programmed, the unit isonly 15 minutes away from deployment. The unit includes a VHF beacon, activity and mortality sensors and dropoff as standard features. Units are available from 70 grams.
Televilt GPS collars are in use all over the world: elephant in Mali, grizzly in Canada, caribou in Canada, ibex inSwitzerland, jaguar in Mexico, lion in Botswana, moose in Finland, red deer in Belgium, reindeer in Norway, wolfin Brazil, mountain lion in USA, leopard in Tanzania and much more.
GPS-SIMPLEXTM - TECHNICAL SPECIFICATIONS
General
For accurate positioning of medium and large mammals GPS-Simplex(TM) is based on the Global Positioning System(GPS). It features user-programmable functions and user replaceable batteries. For small mammals and birds, referto Televilt's GPS-Posrec(TM) series.
GPS receiving system
12 channels, active antenna
Data stored
Time, latitude /longitude, 2D/3D, HDOP
Output
Time, latitude/longitude, 2D/3D, (WGS84, [degrees.minutes.seconds.fractions]) ASCII text file.
Storage capacity
60,000 positions available from January 1, 2002, 15.000 positions on models sold prior to January 1, 2002
Positioning capacity
Up to 60,000 positions. Maximum 7.500 positioning attempts for each 1D-cell installed in battery pack at 0 C and60 seconds GPS receiver on time.
VHF transmitter
TXH-3 for tracking and remote data reporting. Includes activity and mortality sensors with signal pulse ratemodulation and a recovery pulse rate indicating a change over to the back-up battery.

Remote data reporting
Pulse coded VHF signals to RX-900 receiving system, 2.5 seconds/ Position
User interface
Simplex Project Manager (SPM) includes:
Simplex Communicator: Connects GPS-Simplex(TM) collar with PC for setting the GPS-receiver parameters, viewingreal time satellite coverage and download/upload of activity parameters.
Simplex Scheduler: Creates programming file containing the activity parameters for GPS positioning, remote GPSdata reporting and VHF beaconing.
RX-900 Communicator: Exports stored data from the RX-900 to the PC. Connects RX-900 with PC for import andexport of data.
Simplex Data Viewer: Converts and displays the data exported from the RX-900 into latitude/longitude format.Displays data retrieved directly from the collar.
Programmable functions: GPS positioning, maximum satellite search time, VHF beaconing, remote data report,number of report repetitions.
Collar types
Type H and type P.
H (herbivore) generally external VHF antenna. P (predator) generally internal VHF antenna and reinforced belting.Adjustable +/- 10% around a mean neck circumference. Special collars and applications available according tocustomer specifications.
Battery units
User-replaceable. Waterproof connection to electronic housing. Five standard sizes: 1C, 1D, 2D, 3D and 5D allincluding a back-up battery for VHF transmitter performance from 3 to 8 months depending upon size.
Programming unit
To enable programming and data download, this hardware connects the GPS-Simplex(TM) collar to PC serial port.Powered by a 3.5V Lithium cell or external AC/DV adapter (110-240V).
Options
Drop-off: Factory programmable up to 4 years delay. Customer-programmable and remote drop-off available inNovember 2001.
Temperature: An external temperature logger available from October 2001.
Coloration: to visibly distinguish collars. Available from September 2001.
108

GPS-Simplex collars: herbivore collar (with antenna) and predator collar
TVP Positioning AB, TeleviltBandygatan 2, 711 34 Lindesberg, SwedenPhone +46 581 171 95 fax +46 581 171 96, e-mail: [email protected] web site: www.positioning.televilt.se
109


111
Geert AartsSea Mammal Research UnitGatty Marine LaboratoryUniversity of St. AndrewsST ANDREWSKY16 8LB+44 1334 [email protected]
Vsevolod AfanasyevBritish Antarctic SurveyHigh CrossMadingley RoadCAMBRIDGECB3 OET+44 1223 [email protected]
Tom AlankoTVP Positioning ABPO BOX 53SE-71122SWEDEN+46 581 171 [email protected]
Dean M AndersonUS Department of Agriculture-Agriculture Research ServiceJornada Experimental RangePO Box 30003, MSC 3JERNMSU Las CrucesNEW MEXICO, USA 88003-8003+505 646 [email protected]
Barry BomerSalford Electronic Consultants LtdTechnology HouseLissadel StreetSALFORDM6 6AP+44 161 278 [email protected]
Casper BonyongoUniversity of BristolMammal Research UnitSchool of Biological SciencesWoodland RoadBRISTOLBS8 1UG+44 117 928 [email protected]
Chris BrooksUniversity of BristolMammal Research UnitSchool of Biological SciencesWoodland RoadBRISTOLBS8 1UG+44 117 928 [email protected]
Nigel ButcherRSPBThe LodgeSandyBEDFORDSHIRESG19 2DL+44 1767 [email protected]
Peter CramNorthern Woodland ConsultancyTorramhorGlassel RoadBANCHORYAB31 4FE+44 1330 [email protected]
Brian CresswellBiotrack Ltd52 Furzebrook RoadWarehamDORSETBH20 5AX44 1929 [email protected]
Davide CsermelyUniversita di ParmaDipartiment Biologia Evolutiva eFunzionaleParco Area delle Scienze, 11A43100PARMA, ITALY+39 052 [email protected]
Robert DaviesOxford UniversityDepartment of ZoologyOxford UniversitySouth Parks RoadOXFORDOX1 3PS+44 1865 [email protected]
Holger DettkiSwedish University of AgriculturalScience (SLU)Remote Sensing LaboratoryDepartment of Forest ResourceManagement and Geomatics, SE-90183 UmeåSWEDEN+46 90 786 [email protected]
Stephen EllwoodOxford UniversityDepartment of ZoologyOxford UniversitySouth Parks RoadOXFORDOX1 3PS+44 1865 [email protected]
Hans ErhardThe Macaulay InstituteCraigiebucklerABERDEENAB15 8QH+44 1224 [email protected]
Iain GordonThe Macaulay InstituteCraigiebucklerABERDEENAB15 8QH+44 1224 [email protected]
Ruedi HallerSwiss National ParkChasa dal ParcCH-7530 ZernezSWITZERLAND+41 81 856 12 [email protected]
Stephen HarrisUniversity of BristolSchool of Biological SciencesWoodland RoadBRISTOLBS8 1UG+44 117 9289000 x [email protected]
DELEGATE LIST

112
Russell HooperThe Macaulay InstituteCraigiebucklerABERDEENAB15 8QH+44 1224 [email protected]
Iain HopeDeer Commission for ScotlandKnowsley82 Fairfield RoadINVERNESSIV3 5LH+44 1463 231 [email protected]
Ian HulbertScottish Agricultural CollegeHill and Mountain Research CentreSAC Kirkton FarmCRIANLARICHFK20 8RU+44 1838 40 02 [email protected]
Glenn IasonThe Macaulay InstituteCraigiebucklerABERDEENAB15 8QH+44 1224 [email protected]
Stephan ImfeldDepartment of GeograpyUniversity of Z¸richWinterthurerstrasse 190CH-8057 Z¸richSWITZERLAND+41 1 635 52 [email protected]
Justin IrvineCentre for Ecology and HydrologyHill of BrathensBanchoryAB31 4BY+44 1330 [email protected]
Georges JaneauINRA/IRGMB.P.27 F-31326Castanet -Tolosan CedexFRANCE+33 5 61 28 54 [email protected]
Andy KliskeyUniversity of CanterburyDepartment of GeographyPrivate Bag 4800ChristchurchNEW ZEALAND+64 3 [email protected]
Jouko KumpulaFinish Game and Fisheries ResearchInstituteReindeer Research StationFIN-99910 KaamanenFINLAND+358 205 751 [email protected]
Indra LamootUniversity of GhentInstitute for Nature ConservationKliniekstraat 25B-1070BrusselsBELGIUM+32 2 558 18 [email protected]
Per-Arne LemnellTVP Positioning ABPO BOX 53SE-71122SWEDEN+46 581 171 [email protected]
Alain LicoppeUCL-EFORAvenue Maréchal Juin 23B-5030 GemblouxBELGIUM+32 81 [email protected]
Frederick LindzeyUniversity of WyomingWyoming Cooperative ResearchUnitDepartment of Zoology &PhysiologyBox 3166, LARAMIEWY 82071 USA+307 766 [email protected]
Vincent LynchSalford Electronic Consultants LtdTechnology HouseLissadel StreetSALFORDM6 6AP+44 161 278 [email protected]
Liam MartinWillana LifesciencesAshburn House4 Derbyshire RoadSALE, CheshireM33 3EG+44 161 282 [email protected]
Robert MayesThe Macaulay InstituteCraigiebucklerABERDEENAB15 8QH+44 1224 [email protected]
Leszek MeczarskiLotek Wireless Inc115 Pony DriveNewmarketONTARIOCANADA L3Y 7B5+905 836 [email protected]
Niall MooreCentral Science LaboratorySand HuttonYORKYO19 5QR+44 1904 [email protected]
Sander OomThe Macaulay InstituteCraigiebucklerABERDEENAB15 8QH+44 1224 [email protected]
Shaila RaoThe Macaulay InstituteCraigiebucklerABERDEENAB15 8QH+44 1224 [email protected]

113
Arthur RodgersOntario Ministry of NaturalResourcesCentre for Northern ForestEcosystem Research955 Oliver Road, Thunder BayOntarioCANADA P7B 5E1+807 343 [email protected]
Hugh RoseBritish Deer SocietyTrianComrie PerthshirePH6 2HZ+44 1764 [email protected]
Olav RosefTelemark University College3800 BoNORWAY+47359 [email protected]
Mark RumbleUSDA Forest Service, RockyMountain Research Station501 East St. Joe, Rapid CitySouth Dakota, 50071, USA+605 394 [email protected]
Mark RutterInstitute of Grassland andEnvironmental ResearchNorth WykeOkehamptonDEVONEX20 2SB+44 1837 [email protected]
Barbara SchiellySwiss Federal Research InstituteWSLDivision BiodiversityZuercherstrasse 111CH-8903 BirmensdorfSWITZERLAND+41 1 739 25 [email protected]
Robert SchulteVECTRONIC Aerospace GmbHCarl-Scheele-Str. 12D-12489 BerlinGERMANY+49 30 6789 [email protected]
Angela SibbaldAnimal Ecology in GrazedEcosystemsThe Macaulay InstituteCraigiebucklerABERDEEN AB15 8QHScotland UKTel: +44 (0) 1224 498200 Ext 2423Fax: +44 (0) 1224 [email protected]
Elizabeth SpringbornDept. of Forestry, University ofKentucky205 T. P. Cooper BldLexingtonKY 40503, USA+859 [email protected]
Paul ThompsonUniversity of AberdeenDepartment of ZoologyLighthouse Field StationGeorge StreetCromarty IV11 8YJ+44 1381 [email protected]
Jean-Pierre TremblayNSERC of Canada - AnticostiForest ProductsDepartment de biologie, Faculteedessciences et de geniePavillon Alexandre-Vachon,Universite LavalSainte-Foy Quebec, CANADA,G1K 7P4+418 656 [email protected]
Roger TroutForest Research AgencyWildlife and Ecology BranchAlice Holt LodgeWrecclesham, FarnhamSURREYGU10 4LF+44 1420 [email protected]
Eugene Ungar The Volcani Center, IsraelDepartment of Natural ResourcesInstitute of Field CropsPOB 6, Bet DaganISRAEL [email protected]
Karen von HunerbeinUniversity of FrankfurtInstitute of ZoologySiesmayer Str 7060323 FRANKFURT/MAINGERMANY+49 69 7982 [email protected]
Petter WabakkenHedmark CollegeDepartment of Forestry andWilderness ManagementEvenstadN-2480 KOPPANGNORWAY+47 62 46 48 [email protected]
Tony WoakesUniversity of BirminghamSchool of BiosciencesBIRMINGHAMB15 2TT+44 121 414 [email protected]
Barbara ZimmermannHedmark CollegeDepartment of WildernessManagement and ForestryEvenstadN-2480 [email protected]
Patrick ZollnerNorth Central Research StationU.S. Forest ServiceForestry Science Lab5985 Hwy KRhinelander WI, 54501USA+715 362 [email protected]
