tracer tests for the investigation of heterogeneous porous … stream hydraulic tracer tests... ·...
TRANSCRIPT

Tracer tests for the investigation of heterogeneous porous media
and stochastic modelling of flow and transport—a review
of some recent developments
Thomas Ptak*, Matthias Piepenbrink, Eugeniu Martac
Center for Applied Geoscience, University of Tubingen, Sigwartstrasse 10, D-72076 Tubingen, Germany
Received 1 June 2003; revised 9 January 2004
Abstract
In heterogeneous porous aquifers, simulations and predictions of groundwater flow and solute (contaminant) transport
require detailed knowledge of aquifer parameters and their spatial distribution. In most cases this information cannot easily be
obtained at acceptable expenses. In general, subsurface investigation techniques are applied only at borehole locations, and the
parameter values measured have to be regionalized in order to obtain continuous parameter fields. Geophysical measurements
very often yield unsatisfactory results due to resolution, detection range and parameterisation problems. In such situations tracer
tests offer the possibility to efficiently investigate the aquifer between the wells and to characterize the relevant aquifer
properties based on effective parameter values. Tracer tests can be performed at laboratory and field-scales with depth
integrated (two-dimensional) or multilevel (three-dimensional) set-ups, and under natural or forced hydraulic gradient
conditions. Both non-reactive and reactive tracer compounds can be used. This contribution covers and gives examples on the
following topics: depth integrated and three-dimensional natural and forced gradient tracer test methods together with their
fields of application at different transport scales, novel tracer compounds and applications, high resolution multilevel–
multitracer methods and high resolution multilevel–multitracer equipment, as well as approaches to evaluate tracer
experiments and to quantify tracer transport. In this way the paper shows some recent trends in tracer based subsurface
investigation and emphasizes the advantages and importance of modern tracer testing.
q 2004 Published by Elsevier B.V.
Keywords: Groundwater; Solute transport; Subsurface investigation; Tracer testing; Stochastic modelling
1. Introduction
It is generally accepted that tracer testing is a
very efficient and versatile multipurpose method to
characterize subsurface properties and to investigate
the spreading of both non-reactive and reactive solutes
in groundwater at the whole range of investigation
scales, i.e. from the laboratory scale in the order of
centimeters to the regional field-scale in the order of
kilometers. Due to lacking information on subsurface
transport behavior, tracer testing very often even
becomes a prerequisite to obtain reliable groundwater
transport model predictions. A typical example is the
identification of the main transport path of contaminants
Journal of Hydrology 294 (2004) 122–163
www.elsevier.com/locate/jhydrol
0022-1694/$ - see front matter q 2004 Published by Elsevier B.V.
doi:10.1016/j.jhydrol.2004.01.020
* Corresponding author. Tel.: þ49-7071-2975238; fax: þ49-
7071-5059.
E-mail address: [email protected] (T. Ptak).

(the so called contaminant plume centreline) within
natural attenuation studies (e.g. Bockelmann et al.,
2003).
There is principally a large variety of application
possibilities: tracer test methods can be applied for
classical subsurface investigation purposes yielding
effective transport parameters (transport velocity,
porosity, and dispersivity), which may describe non-
reactive as well as reactive (contaminant) transport
processes within an aquifer. Information on subsur-
face structure (preferential flow paths, and structural
anisotropy) can be obtained as well. This information
may for example be used to set up and calibrate
deterministic flow and transport models. Tracer test
methods have also been applied to identify contami-
nation pathways, to test the connectivity of different
aquifer layers, etc. (e.g. Kass, 1998).
Tracer tests provide a database (tracer break-
through curves and their statistical moments respect-
ive derived transport parameters) too, which can be
applied for testing of forward transport predictions
obtained from deterministic or stochastic model
approaches, for the reduction of prediction uncer-
tainty within stochastic modelling frameworks, or for
the development and application of inverse stochastic
flow and transport modelling methods.
Recent applications, employing novel tracer com-
pounds and tracer test instrumentation, have focused
for example on the characterization of subsurface
contamination with residual NAPL phase, on the
quantification of the biodegradation potential in case
of subsurface contamination with organic contami-
nants, on the quantification of mineral (Fe3þ) phases
in the context of feasibility studies for the implemen-
tation of natural attenuation protocols, on testing of
reactive barriers for groundwater cleanup, on the
delineation of wellhead protection zones etc.
Out of the numerous application possibilities, this
paper focuses on a summary of examples of some
recent developments in the field of tracer testing and
tracer based subsurface investigation, emphasizing
the advantages and importance of modern tracer
testing. It does not aim at providing a complete
overview of all possible tracer testing approaches and
related methods (e.g. borehole dilution methods), set-
ups and evaluation procedures, which would require
the size of a textbook. The paper covers the following
topics: depth integrated and multilevel natural
and forced gradient tracer test methods together with
their advantages and disadvantages, their fields of
application at different transport scales, difficulties
encountered due to subsurface heterogeneity, novel
tracer compounds and examples of their application,
high resolution multilevel–multitracer methods and
high resolution multilevel–multitracer equipment, as
well as approaches to evaluate non-reactive and
reactive tracer experiments and to quantify tracer
transport. The focus of our tracer testing is mainly on
applications in unconsolidated porous media at field-
scale. However, for the testing and development of
innovative tracer compounds, as well as for the
investigation of (reactive) transport processes, the
experiments have to be at first performed at laboratory
scale. Therefore both applications at laboratory and
field-scales will be shown in this paper.
2. Aquifer heterogeneity, scale hierarchy,
and implications for tracer testing
Looking at Fig. 1, which shows an outcrop of a
heterogeneous alluvial sand and gravel aquifer, it
becomes evident that the aquifer properties, defined
for ‘point scale’, i.e. for very small representative
elementary volumes (REVs) compared to the inves-
tigated aquifer domain, are variable in space. This
variability is observed for both physical (hydraulic
conductivity and porosity) as well as for hydrogeo-
chemical (e.g. sorption capacity) and microbiological
aquifer properties.
It is not surprising that aquifer structural proper-
ties, such as size, position and amount of clay
lenses, sand and gravel layers, and the resulting
distribution of hydraulic conductivity, porosity and
Fig. 1. Outcrop of a heterogeneous alluvial sand and gravel aquifer
(Klingbeil, 1998).
T. Ptak et al. / Journal of Hydrology 294 (2004) 122–163 123

hydrogeochemical parameters significantly control
groundwater flow and spreading of solutes (e.g.
Dagan, 1989; Gelhar, 1993).
A typical manifestation of this physical aquifer
heterogeneity is overall anisotropy of hydraulic
conductivity, even though the local, point scale
hydraulic conductivities are isotropic (e.g. Gelhar
and Axness, 1983; Vert et al., 1999). Another well
investigated effect of physical aquifer heterogeneity is
macrodispersion (e.g. Dagan, 1989; Ptak and Teutsch,
1992; Gelhar, 1993). It has been observed in field
tracer experiments, that dispersivities estimated at
field-scale may be several orders of magnitude higher
compared to laboratory-scale dispersivities (e.g.
Gelhar, 1986; Dagan, 1989), and that they may
increase with transport distance. The reason is that
at field-scale, compared to mechanical dispersion at
pore level, the differential advection due to the field-
scale heterogeneities, i.e. preferential flow around low
conductivity zones, tends to increase the spreading of
a solute plume.
Chemical aquifer heterogeneity can be recognized
at laboratory scale for example from different sorption
properties for different lithological components and
grain size fractions of aquifer material (Grathwohl
and Kleineidam, 1995; Ptak and Strobel, 1998;
Karapanagioti et al., 1999; Kleineidam et al., 1999;
Rugner et al., 1999), and at field-scale for example
from an enhanced spreading of solutes (e.g. Burr et al.,
1994; Ptak and Schmid, 1996). Another effect of
physical and chemical aquifer heterogeneities is the so
called makrokinetic sorption behavior, which is
characterized by an effective retardation factor
increasing with time, even though the solute is locally
at sorption equilibrium (Miralles-Wilhelm and
Gelhar, 1996; Ptak and Kleiner, 1998). Teutsch et al.
(1998) have shown, that in case of a chemically
heterogeneous fluvial sand and gravel aquifer, the
mean arrival time of a kinetically sorbing solute is
controlled by sandy aquifer zones with a relatively
medium hydraulic conductivity, and not necessarily
by the high conductivity preferential flow paths
formed by gravels. The effects of microbiological
heterogeneities have been investigated for example by
Miralles-Wilhelm et al. (1997). The authors have
shown that in a heterogeneous aquifer the correlations
of retardation and biodegradation parameters with
hydraulic conductivity may significantly control
the field-scale dispersion process. The effective
decay rate may be significantly reduced compared to
the mean. It follows that subsurface heterogeneities
have to be considered when tracer-based investigation
strategies are developed, when measured data are
evaluated and when model simulations using tracer
data have to be performed.
If heterogeneity and its effects on spreading of
solutes have to be investigated by tracer tests, it is
necessary to consider at first the relations of the
investigation scale (characterized by the size of the
investigated aquifer domain), the scale of heterogen-
eity (characterized by the typical size of aquifer
structural elements), and the detection scale of the
investigation method (characterized by the size of the
aquifer domain covered by the investigation method).
A comprehensive discussion on scale problems is
given e.g. by Dagan (1986), Neuman (1990), Teutsch
et al. (1990), Di Federico and Neuman (1998), and
Zlotnik et al. (2000).
In most cases the aquifer material may be treated as
homogeneous, if the heterogeneity scale is much
smaller compared to the investigation scale. On the
other hand, heterogeneity becomes relevant, if the
heterogeneity scale is in the order of the investigation
scale. Homogeneity is assumed for instance in most
laboratory column and/or tank experiments, where the
heterogeneity scale is characterized by the (constant)
grain size. Deterministic approaches are then applied
to evaluate the measured data and to quantify aquifer
parameters.
At a regional investigation scale, mostly in the
order of kilometers, the strong near-source irregula-
rities in solute spreading may tend to average out, if
the characteristic heterogeneity scale becomes much
smaller compared to the investigation scale. It may
then become admissible to use constant effective
aquifer parameters, defined for relatively large aquifer
portions (e.g. transmissivities from large-scale pump-
ing tests, constant macrodispersivities, effective
retardation factors) for the quantification of flow and
transport. This approach of defining parameters for
‘large-scale REVs’ is the fundamental principle of
deterministic flow and transport modelling at a
regional scale.
However, in many situations typical for hydro-
geological practice, for instance planning of subsur-
face remediation activities, the investigation scale
T. Ptak et al. / Journal of Hydrology 294 (2004) 122–163124

required is in the order of tens to hundreds of meters.
This near-source, intermediate scale will mostly
correspond to only a few (or even a single or less)
characteristic heterogeneity lengths. Here, a strongly
irregular solute spreading and a scale dependence of
effective transport parameters (for instance effective
macrodispersivities increasing with transport dis-
tance) can be expected as a consequence of aquifer
parameter variability. In such a situation, to resolve
the heterogeneity structure, the detection scale of the
investigation method should be smaller compared to
the heterogeneity scale. Unfortunately, to obtain a
characterization of aquifer parameter distributions
detailed enough for a deterministic model, the costs of
investigation would become prohibitively high. The
reason is that in general the construction of expensive
monitoring wells is required. Finally, due to the
usually limited number of measurements available, a
parameter uncertainty remains after investigation.
To illustrate the effects of aquifer heterogeneity
and the problems of investigating and characterizing
solute transport in groundwater at an intermediate
investigation scale, where the heterogeneity scale is in
the order of the transport distance, Fig. 2 shows the
distribution of transport velocities estimated from a
natural gradient tracer test (NGTT) with a transport
distance of up to about 60 m and depth integrated
sampling (Ptak and Teutsch, 1994a). Due to aquifer
heterogeneity, it was impossible to find one common
transport parameter set for the entire ensemble of the
measured breakthrough curves. For the illustration
purpose, the transport velocities were therefore
estimated for each individual measured breakthrough
curve, assuming individual transport paths within the
aquifer and the transport direction to be parallel to the
line connecting the injection and the breakthrough
curve monitoring wells (the resulting transport
directions are within the range of possible direction
estimates based on hydraulic head measurements).
The transport velocities range from 6.2 to 18.0 m/d.
This variety of values was measured at monitoring
wells separated by a distance of only 12 m.
This example clearly shows that in heterogeneous
aquifers site assessment and transport predictions
based on parameter values obtained at a limited
number of borehole locations may be highly uncer-
tain. Due to the variability of aquifer parameters at the
intermediate scale and the resulting irregular solute
spread, the investigation results may highly depend on
the number and position of monitoring wells.
Consequently, to overcome the difficulties in
dealing with aquifer heterogeneity, improved or new
tracer investigation and measurement techniques as
well as data interpretation and flow and transport
simulation methods are needed.
3. Tracer test techniques
Tracer testing is an integral investigation method
as it allows to estimate effective parameters describ-
ing non-reactive and reactive transport processes
within an aquifer or aquifer material (in case of
laboratory experiments) between the tracer injection
and sampling locations. Out of the numerous
approaches for tracer testing in heterogeneous aqui-
fers, two fundamentally different strategies can be
recognized.
Firstly, the application of tracer tests at local scale
and estimation of point scale (very small REV)
subsurface parameters. This approach is employed
mainly in small-scale laboratory (column and tank)
experiments or in small-scale field investigations
using for example the dipole flowmeter test tracer
Fig. 2. Distribution of transport velocities in a heterogeneous porous
aquifer (length of arrow indicates value of velocity; Ptak and
Teutsch, 1994a).
T. Ptak et al. / Journal of Hydrology 294 (2004) 122–163 125

combined with tracer injection and detection (Sutton
et al., 2000). The resulting small-scale measurements
are employed for example for gaining understanding
of non-reactive and reactive transport processes, for
testing of process based transport model code
formulations, and for transport model predictions,
which however, due to the remaining parameter
uncertainty after investigation in case of hetero-
geneous aquifers, should be performed within a
stochastic modelling framework. It should be men-
tioned that, considering aspects of hydrogeological
practice, the efforts to obtain a sufficient database on
local scale tracer transport can be expected too high
for standard field-scale modelling purposes.
Secondly, the direct measurement of effective
subsurface parameters at field-scale. This approach
may be applied especially in many situations of
hydrogeological practice, where the costs to obtain
the amount of input data needed for stochastic
simulations, the efforts with respect to the geosta-
tistical data analysis, and the computation time
become prohibitively high, or if some input
parameters (for instance concentrations within the
contaminant source zone) cannot be described using
geostatistical methods. It may also be applied, if
administrative authorities are not willing to accept
stochastic variability of model predictions respect-
ive probabilistic model results. Of course, as
mentioned above, the results can be used for more
demanding tasks such as testing of forward transport
predictions obtained from stochastic model
approaches, for the reduction of prediction uncer-
tainty within stochastic modelling frameworks, for
the development and application of inverse stochas-
tic flow and transport modelling methods etc. as
well (e.g. Ezzedine and Rubin, 1996; Rubin et al.,
1997; Woodbury and Rubin, 2000; Fernandez-Gar-
cia et al., 2002).
Fig. 3 summarizes the approaches for using tracer
test based data.
Principally, tracer tests can be performed under
natural hydraulic gradient conditions in an undis-
turbed groundwater flow field, or under forced
gradient conditions, induced by groundwater pumping
or groundwater/tracer solute injection. In the exper-
iments, tracer solution is injected into a well/labora-
tory column, and tracer breakthrough curves are
measured in monitoring wells/at column outlets.
The detection scale is defined by the transport distance
between the tracer injection and monitoring locations.
Depending on the experimental set-up, depth inte-
grated or multilevel breakthrough curves can be
obtained in the field.
A variety of tracer compounds can be used. They
can behave both non-reactive, i.e. as ideal tracers, and
also reactive. Non-reactive, ideal tracers are used if
the transport of solutes is investigated, which are not
subject to degradation and/or interaction with the
subsurface material. Depending on the site specific
subsurface conditions, ideal tracers might be for
example salt based tracers such as Chloride (e.g.
NaCl), Bromide (e.g. NaBr), fluorescent tracers such
as Fluoresceine, Eosine, Pyranine, Sodium –
Naphthionate, Tinopal, radioactive tracers such as1H3HO, 82Br if the decay is accounted for, dissolved
gas tracers such as He or H2, environmental isotopes
and chemicals, or particle tracers such as (natural,
dyed, or fluorescent) spores, fluorescent microspheres,
or other drift particles. Before selection of a
conservative tracer compound laboratory testing
should be performed to prove ideal or almost ideal
tracer behavior. Of course, also aspects of environ-
mental and administrative law have to be considered.
Then, in most countries only a few compounds remain
legal for injection in field experiments, mainly salt
tracers and some fluorescent tracers. In Germany for
example, it is practically impossible to use radioactive
tracers and Rhodamine compounds (except Amidor-
hodamine G) within field experiments. If new tracers
(especially the reactive tracers described below), not
known yet to the administration, are planned for
injection within field experiments, lengthy and
tedious procedures to obtain permission for their use
are required. It would be beyond the scope of this
paper to summarize the physical and chemical
properties of all (standard) tracers and the com-
pound-specific analytical methods to estimate tracer
concentrations. Comprehensive information, includ-
ing aspects of the use of bacteria and phages as
tracers, is given for instance in the textbook by Kass
(1998). Reactive tracers will be treated in sections
following below, focusing on some new
developments.
Standard approaches for evaluation of the
measured breakthrough curves (mainly in terms of
transport velocities and dispersivities), based for
T. Ptak et al. / Journal of Hydrology 294 (2004) 122–163126

example on fitting of analytical solutions of the
transport equation, or on computing of concentration
(temporal or spatial) moments (which can be related
to transport parameters), or on inverse numerical
modelling would be beyond the scope of this paper as
well.
In most cases, information on tracer solute
transport is available in terms of measured concen-
tration time series, i.e. breakthrough curves, at
monitoring locations. Procedures to obtain transport
parameters from fitting analytical solutions of the
transport equation to the breakthrough curves are
Fig. 3. Approaches for using tracer test based data.
T. Ptak et al. / Journal of Hydrology 294 (2004) 122–163 127

described for example in Fried (1975), Kreft and
Zuber (1978), Sauty (1980), Fetter (1993) or Dome-
nico and Schwartz (1990).
Evaluation approaches based on temporal
moments of measured breakthrough curves are
summarized for example in Kreft and Zuber (1978),
Valocchi (1985), Ptak and Teutsch (1994a), Ptak
(1995), and Ptak et al. (1996). A method of temporal
moments to interpret solute transport with sorption
and degradation is presented by Pang et al. (2003).
Spatial moments (e.g. Kreft and Zuber, 1978;
Freyberg, 1986; Goltz and Roberts, 1987; Dagan,
1990; Garabedian et al., 1991; Rajaram and Gelhar,
1991; Adams and Gelhar, 1992) require the measure-
ment of concentration values within a solute plume
and the application of interpolation techniques. The
difficulty to be managed is that due to the usually
limited number of concentration measurement
locations, especially in heterogeneous aquifers the
computation of spatial moments cannot be performed
reliably enough. It could be shown that in hetero-
geneous aquifers, even with an extremely dense
monitoring network (e.g. Freyberg, 1986; Garabedian
et al., 1991) the interpolation procedure can lead to
bias in the moment (Barry and Sposito, 1990) and in
the solute flux estimates.
3.1. Natural gradient tracer tests
In a NGTT at field-scale, the tracer solution is
injected continuously, over a limited period, or pulse-
like into the undisturbed groundwater flow field.
Depth integrated or multilevel breakthrough curves
are then measured in monitoring wells positioned in a
downstream direction. A prerequisite for a successful
experimental design is therefore knowledge about the
approximate mean transport direction. Also, for
planning of sampling activities, the approximate
average transport velocity should be known in
advance.
The investigation scale of NGTTs is not limited by
principle, however the experimental efforts may
become too high if the transport velocity is relatively
small, and the transport distance to be investigated is
relatively large. Furthermore, if the mean ground-
water flow direction is shifting due to changes of
boundary conditions, the evaluation of the measured
breakthrough curves may become difficult. Another
disadvantage of the NGTT approach applied in
heterogeneous aquifers is that a huge amount of
monitoring wells may become necessary to reliably
characterize the solute plume and its development.
An example of such extensive efforts needed for a
small to medium investigation scale (5–50 m) is
provided in Rugge et al. (1999). A continuous
injection NGTT was carried out in the anaerobic
part of a leachate plume downgradient of the
Grindsted landfill in Denmark. Bromide and 18
xenobiotic compounds were injected over 195 days,
with the aim of surveying the transport of a
continuous plume. At each 5 m distance downgradient
from the injection wells, between 4 and 12 monitoring
wells were sampled over a period of 924 days. One
result of the conducted moment analysis was, that
bromide showed decreasing transport velocities over
time. This was explained by the observed varying flow
conditions and the heterogeneity of the sandy aquifer.
A series of well-known large-scale NGTTs was
performed in USA and Canada. These include the
experiments at Cape Cod, Massachusetts, at the
Columbus site, Ohio, and at the Canadian Forces
Base Borden, Ontario. All those experiments are
based on extensive sampling networks, enabling some
of the most detailed site characterizations reported in
the literature.
At Cape Cod, the disposal of treated sewage
produced a 2.5 mi long contaminant plume (com-
posed of hydrocarbons, detergents, metals, nitrate and
specific microbes) in the sand and gravel aquifer. This
aquifer was investigated in detail by more than 1000
hydraulic conductivity measurements, derived from
core material permeameter (Wolf, 1988; Wolf et al.,
1991) and borehole flowmeter tests (Hess, 1989).
During NGTTs involving both conservative and
reactive tracers (Garabedian et al., 1991; LeBlanc
et al., 1986, 1987, 1991), groundwater was sampled
by more than 650 observation wells, each with
sampling ports over 15 vertically different levels
allowing an accurate definition of the 3D plume
development. The extensive subsurface investigation
program has provided a good basis for a reliable
characterization of the spatial and temporal behavior
of non-reactive and reactive solute plumes, and for the
related investigation of non-reactive and reactive
transport processes in the subsurface, of density
and recharge effects, and of natural attenuation of
T. Ptak et al. / Journal of Hydrology 294 (2004) 122–163128

the sewage plume (e.g. Ezzedine and Rubin, 1997;
Zhang et al., 1998; LeBlanc et al., 1999; LeBlanc,
2001; Moench et al., 2001; Davis et al., 2001a, b; Hess
et al., 2002a, b; Shinga et al., 2003; Walter and
Masterson, 2003). For example, in a multispecies
reactive tracer test, Hess et al. (2002) studied the
dispersive transport of Bromide and Nickel. The focus
was on effects of spatially variable chemical con-
ditions within the aquifer as well as on transverse and
longitudinal dispersivities.
The Macrodispersion Experiment (MADE) site at
the Columbus Air Force Base, Mississippi, is a typical
example of an aquifer located in highly heterogeneous
fluvial deposits. Tracer tests were performed aiming at
the investigation of solute spreading under highly
heterogeneous subsurface conditions. The aquifer has
a saturated thickness of 10–12 m and consists mainly
of unconsolidated sand and gravel materials. Charac-
terization of the site employed 2451 permeability
measurements (based on slug tests, grain size analysis,
pumping tests, laboratory core testing, and flowmeter
tests), surface and borehole geophysics, hydrofacies
mapping, as well as water level measurement in more
than 100 monitoring wells. Rehfeldt et al. (1992)
concluded that data from flowmeter tests provide the
most direct and successful measure of hydraulic
conductivity ðKÞ: The variance of lnðKÞ; s2lnK ; is as
high as 4.4. At first in 1986, a conservative tracer
experiment was performed by a 48 h pulse injection of
10 m3 of groundwater containing Bromide and three
organic tracers (pentafluorobenzoic acid, o-trifluoro-
methylbenzoic acid, and 2,6-difluorobenzoic acid).
Over a 20-months period, seven sampling campaigns
were performed to delineate the tracer plume at
approximately 1–4 months intervals using an exten-
sive 3D sampling well network (Boggs et al., 1992).
The tracer plumes showed highly irregular, asym-
metric, non-Gaussian patterns (Zheng and Gorelick,
2001; 2003), and it was concluded that solute
transport at the MADE site appears to be dominated
by preferential flow paths resulting from aquifer
heterogeneity at decimeter and smaller scales, and
that a large portion of the aquifer acts like a series of
immobile reservoirs. Many other publications were
released on modelling of flow and solute transport
within the performed NGTTs (e.g. Adams and Gelhar,
1992; Harvey and Gorelick, 2000; Feehley et al.,
2000). Zheng and Jiao (1998) reported the simulated
plume being more sensitive to the way the hydraulic
conductivity field is interpolated from the measured
data than to the dispersivity value. Their transport
model with longitudinal dispersivities in the range of
1–5 m reasonably reproduced the observed plume to
a certain concentration limit, but failed to reproduce
the significant spreading of the tracer at diluted
concentrations as observed in the field. This shows
possible difficulties in modelling solute transport in
highly heterogeneous aquifers. Such modelling
requires a characterization and quantification of
transport processes, aquifer parameters and aquifer
structural properties at a high resolution. Here,
specifically designed tracer tests can significantly
help to improve the solute transport modelling efforts.
One of the most known field-scale NGTTs was
conducted at the Borden experimental site between
1982 and 1984. 12 m3 a of solution containing two
inorganic tracers (Chloride and Bromide) and five
organic compounds were injected as a pulse into the
shallow, unconfined sandy aquifer. A very dense, three-
dimensional array of monitoring points was used to
record breakthrough curves and to monitor plume
development. The experiments are discussed exten-
sively in the literature (e.g. Mackay et al., 1986;
Freyberg, 1986; Sudicky, 1986; Roberts et al., 1986;
Sposito and Jury, 1988; Rajaram and Gelhar, 1991;
Brusseau,1992; Cvetkovic andDagan, 1994; Burret al.,
1994; Miralles-Wilhelm and Gelhar, 1996). Many of
the publications focus on characterizing the spatial
variability of the hydraulic conductivity field and on the
spatial and temporal behavior of non-reactive tracer
transport. Only a few of them focus on the transport of
the reactive, organic solutes with a significant non-ideal
transport behavior. Rate-limited sorption (Sposito and
Jury, 1988; Cvetkovic and Dagan, 1994) and diffusive
mass transfer (Goltz and Roberts, 1988; Thorbjarnarson
and Mackay, 1994) were the first reasons thought to
explain the non-ideal transport. Brusseau and
Srivastava (1997) postulated a coupled effect of non-
linear sorption and enhanced spreading caused by
variable hydraulic conductivity and spatially variable
sorption (especially for their negative correlation) to be
a major cause of the enhanced longitudinal spreading,
observed for the organic solute plumes in comparison to
the conservative plumes.
A tracer study carried out in a heterogeneous aquifer
closely located to Grenoble, France, focused on
T. Ptak et al. / Journal of Hydrology 294 (2004) 122–163 129
characterizing dispersion as a function of the spatial
structure of the hydraulic conductivity field (Courtois
et al., 2000). A deterministic interpretation of field-
scale NGTT data and a geostatistical analysis of the
spatial structure of the hydraulic conductivity field,
followed by a spatial moment analysis of stochastic
particle trajectories, produced similar dispersivity
values (reaching an asymptotic limit of 6 m after a
50 m travel distance, i.e. about ten correlation lengths).
A field-scale NGTT conducted at Krauthausen,
Germany, involved three different conservative and
reactive tracers: Bromide, Fluoresceine and Lithium
(Vereecken et al., 2000). Bromide was used as
conservative tracer, and Fluoresceine and Lithium
were regarded as reactive tracers in the heterogeneous
aquifer. In laboratory batch experiments and column
tests a sorption behavior of Fluoresceine and Lithium
according to a Freundlich isotherm was determined.
The solute plume evolution was surveyed for
398 days for Bromide and 449 days for Fluoresceine
and Lithium. A spatial moment analysis applied to the
Bromide plume emphasized a longitudinal effective
dispersivity of about 3.64 m, which is a bigger value
than the one observed at the Borden site. This result
corresponds with the higher heterogeneity and
variance of ln(K) (0.84–1.08 compared to 0.29 at
Borden).
The NGTT technique was also extensively applied
to test analytical solutions from stochastic transport
theory (e.g. Sudicky, 1986; Freyberg, 1986; Rehfeldt
et al., 1989; Hess et al., 1992; Fiori, 1998), or to test
numerical stochastic transport model predictions (e.g.
Ptak and Teutsch, 1992).
An example of application of the multilevel NGTT
method for direct investigation of transport behavior
and effective transport parameters in a contaminated
heterogeneous aquifer at a former gasworks site is
described in Bosel et al. (2000) and Herfort and Ptak
(2002). Here, the NGTT served in a multitracer
version for the identification of main transport paths,
for the investigation of transport velocities, and to
obtain probability density functions (pdfs) of travel
time, which are a prerequisite for the application of a
new Lagrangian stochastic transport model called
SMART (Finkel et al., 1997). In this multitracer
NGTT, to maximize gain of information and to
reduce the experimental effort, four different tracers
(Fluoresceine, Eosine, Sodium–Naphthionate, and
Sodium–Bromide) were injected at four different
locations. Bromide concentrations were analysed by
ion chromatography (IC), and the concentrations of
the fluorescent tracers were measured in parallel using
a further developed fluorimetric separation method
(Kleiner, 1997), where the concentrations of the
individual tracers are determined from the evaluation
of synchronous fluorescence scans (Behrens, 1982)
employing pH shifting. This tracer testing proved to
be essential for the evaluation of natural attenuation
rates at field-scale and for the quantification of the
natural attenuation potential at the investigated site
(Bockelmann et al., 2003).
Possible fields of application, considering the
advantages and disadvantages of the NGTT method,
are summarized in Table 1. To overcome some of the
disadvantages, it may be reasonable to perform tracer
tests under forced gradient conditions.
3.2. Forced gradient tracer tests
Forced gradient tracer tests (FGTTs) can be
performed in a convergent, in a divergent, in a dipole
type groundwater flow field, or with a subsequent
application of divergent and convergent flow con-
ditions (push–pull tests). Due to the forced gradient,
well-defined experimental conditions are obtained,
the effects of natural gradient variations are mini-
mized, and the tracer test duration is reduced
compared with natural gradient tracer experiments.
In the divergent flow field approach, groundwater
is injected into an injection well at a constant rate,
and, after a quasi-steady-state flow field is estab-
lished, the tracer mass is added continuously, over a
limited period, or instantaneously, and mixed within
the injection well across the entire length of the
selected injection section. Surrounding monitoring
wells are then used to measure depth integrated or
multilevel tracer breakthrough curves. Measure-
ments can be obtained in all directions using only
a single tracer.
In the convergent flow field approach, groundwater
is pumped out of a extraction well, the tracer is
injected continuously, over a limited period, or
instantaneously into surrounding wells, and break-
through curves are measured usually at the extraction
location. Using a flow separation technique (Ptak and
Schmid, 1996; see also text below), it is also possible
T. Ptak et al. / Journal of Hydrology 294 (2004) 122–163130

Table 1
Tracer test techniques and possible application for subsurface investigations (þcorresponds to a suitable application, the numbers in brackets
refer to comments/explanations in the bottom part of the table), considering the advantages and disadvantages of the NGTT and FGTT methods
Natural gradient tracer tests (NGTT)1,2,3 Forced gradient tracer tests (FGTT)6,7
Depth integrated
sampling
Multilevel
sampling
Depth integrated
sampling
Multilevel
sampling
Investigation of main
transport direction under
natural conditions
þ þ 28 28
Proof of postulated position
of contaminant sources
þ þ 28 28
Spatial distribution of tracer
transport times (for stochastic
transport modelling)
2 þ 2 þ
Investigation of spatial
distribution of transport
parameters
2 þ 2 þ
Investigation of aquifer
structure, connectivity,
detection of preferential
flow paths and spreading
zones
2 (þ)4 2 þ
Validation of transport model
predictions
þ þ þ þ
Estimation of effective transport
parameters describing non-reactive
solute transport (non-reactive tracers)
þ þ þ þ
Estimation of hydrogeochemical
aquifer properties and effective
transport parameters describing
reactive solute transport
(reactive tracers)
(þ)5 (þ)5 þ þ
Applicability for differential
multitracer investigations
(simultaneous use of non-reactive
and reactive tracers)
(þ)5 (þ)5 þ þ
Advantages Disadvantages
NGTT Detection scale not limited in principle 1. Relatively long duration of
experiment
2. Evaluation possibly difficult due to
varying hydrogeological boundary
conditions
3. Detection of tracer plume and
calculation of mass balance proble-
matic
4. Dense monitoring well network
required
5. In most cases not suitable for
use of reactive tracers due to the
resulting long duration of
experiment
(continued on next page)
T. Ptak et al. / Journal of Hydrology 294 (2004) 122–163 131

to measure multilevel breakthrough curves within
the pumping well itself. If different flow directions
have to be considered, different tracers can be used.
In the dipole flow field approach (two-well or
interwell test), groundwater is extracted from a well,
and re-injected into another well. The tracer is
introduced into the infiltration well, or an injection
well within the dipole (pulse like, continuously, or
pulse like with recirculation), and monitored at the
extraction well and/or dedicated sampling locations
between the wells. In a symmetrical set-up, the
groundwater extraction and infiltration rates are the
same. The nature of the dipole flow field may require
relative long experimental times to obtain a satisfying
tracer recovery. Tracer recovery may be improved in
an asymmetrical set-up by increasing the extraction
rate compared to the infiltration rate.
In the divergent and convergent flow field
approach (single-well push–pull test), the tracer
solution is injected into a well, sometimes followed
by the injection of clean water to force the tracer out
of the well, and then extracted from the same well.
The advantage of the aforementioned convergent,
dipole type, and push–pull test approaches is the
possibility of obtaining (high) tracer mass recovery
rates.
To obtain a high temporal and (three-dimensional)
spatial resolution, on-line measurement equipment
can be used, e.g. multilevel fiber optic fluorimeters for
fluorescent tracers (Ptak and Schmid, 1996; see
below), ion selective probes for salt tracers, or gas
diffusion membranes with a mass spectrometer, or an
electron capture detector for dissolved gas tracers.
Effective transport parameters are then obtained from
the evaluation of the measured breakthrough curves
(see also Section 3). The detection scale of the forced
gradient experiments can be easily controlled by the
pumping or infiltration rates.
Chen et al. (1999), for example, used tracer tests in
a radially convergent flow field to evaluate transverse
dispersivity. Fernandez-Garcia et al. (2002) used
convergent-flow tracer tests in an experimental tank
to study the applicability of effective transport
parameters based on an equivalent homogeneous
aquifer assumption.
Other applications of the FGTT technique in a
highly heterogeneous aquifer as a direct subsurface
investigation method using non-reactive tracers are
described in Ptak and Teutsch (1994a), Ptak (1995),
and Ptak et al. (1996). FGTTs with both divergent
and convergent flow fields were applied to
investigate the aquifer structure by identifying
preferential flow paths and estimating anisotropy
of solute spreading, connectivity of layers, and
spatial variability of effective transport parameters
from multilevel breakthrough curves. As a result,
Table 1 (Continued)
Advantages Disadvantages
FGTT Relatively short duration of experiment
(especially with induced radially
symmetric groundwater flow)
6. Detection scale limited
Effects of hydraulic gradient variations
effectively reduced
7. Treatment of pumped groundwater
sometimes necessary (convergent,
dipole type and push–pull flow
patterns)
Possibility to consider several transport
directions using only one tracer
compound (divergent flow pattern)
8. No natural groundwater flow during
experiment
Possibility to calculate mass balance
(convergent, dipole type and push–pull
flow patterns)
Use of reactive tracer compounds
manageable at affordable expenses
T. Ptak et al. / Journal of Hydrology 294 (2004) 122–163132

a significantly improved geological model of the
subsurface could be obtained.
The interwell set-up was used for example by
Nelson and Brusseau (1996), and Annable et al.
(1998a, b) to detect non-aqueous phase liquids in an
aquifer. The single-well push–pull technique was
employed for instance by Istok et al. (1997) and
Haggerty et al. (1998) for the in situ determination of
microbial metabolic activities and reaction rate
coefficients in groundwater.
Further forced gradient tracer tests and details on
dipole type and push–pull FGTTs will be presented in
Sections 3.5.2 and 3.5.3 below, dealing with reactive
tracers.
As for the NGTT method, possible fields of
application, considering the advantages and disad-
vantages of the FGTT method are summarized in
Table 1. Table 1 is based on information from
literature and on the authors’ experience gathered
during numerous tracer tests, and is intended to
provide an overview and general suggestions for the
application of the different tracer testing methods. Of
course, depending on site specific conditions and aims
of an experiment, other applications, combinations
and set-ups are possible.
It should also be taken into account, that different
tracer test types may yield different transport
parameters such as longitudinal dispersivity. Tiede-
man and Hsieh (2003) evaluated simulated forced
gradient tracer tests in heterogeneous aquifers. Their
results show that for the forced gradient tests, a radial
flow test tends to yield the smallest longitudinal
dispersivity, an equal strength two-well test tends to
yield the largest longitudinal dispersivity, and an
unequal strength two-well test tends to yield inter-
mediate values due to the different aquifer portions
sampled by the different experiments. Results also
indicate that longitudinal dispersivity estimated from
forced-gradient tests generally underestimates longi-
tudinal dispersivity that characterizes solute dis-
persion under natural-gradient flow. The only
exceptions are for equal and unequal strength two-
well tests with large well separation distance con-
ducted in aquifers with a low degree of heterogeneity.
To avoid difficulties based on different transport
parameter values from different tracer test set-ups,
a stochastic modelling approach can be used,
suitable for the simulation of solute transport within
heterogeneous aquifers without the need to introduce
macrodispersivity values or relations for the scale
dependence of dispersivity (see Section 4).
The decision whether a Dirac pulse, finite pulse or
a step tracer input function is applied depends mainly
on practical considerations. For relative short trans-
port distances and high transport velocities, it may
become difficult to create a Dirac type input function,
as the tracer injection time may become significant
compared to the tracer transport time. Then a step
input function might be a better approach. However,
for relatively long transport distances a step input
might yield prohibitively high experimental efforts
and costs due to the amount of tracer solution needed
and the time required for the continuous tracer solute
injection. Then a Dirac pulse or finite pulse type tracer
injection might be the better approach, even though a
higher initial concentration of the tracer solution will
be required to account for the concentration decrease
during transport. A careful experimental design
employing numerical transport simulations is
suggested to find the optimal solution.
During the assessment of aquifer transport proper-
ties via both NGTT and FGTT, a number of factors
(e.g. injection duration, flow rate, well-bore mixing
and dilution effects, local distortion of the flow field
around the injection well, tracer capture in the well
bore) can cause the tracer input function to depart
from the assumed theoretical injection profiles (Dirac
pulse, finite pulse or step functions), which might lead
to incorrect interpretation of the test. While injection
duration and flow rates are usually under control, the
other factors that are related to well and aquifer
interactions are more difficult to deal with. Neglecting
the influence of the actual injection conditions can
lead to two types of error (Rentier et al., 2002): (i) the
values of the fitted parameters can be far from reality,
(ii) the identification of the main active transport
processes can be strongly biased. For example, an
observed extended tailing and attenuation of the tracer
breakthrough curve could erroneously be attributed to
a kinetic sorption process or the occurrence of a dual
porosity effect, when actually they are the result of the
delayed release of the tracer, captured in the well at
the end of the injection. To overcome some of the
aforementioned limitations, Brouyere (2000) and
Rentier et al. (2002) proposed a new conceptual and
numerical approach, which can be easily implemented
T. Ptak et al. / Journal of Hydrology 294 (2004) 122–163 133

in any existing flow and transport simulator, allowing
to model the injection conditions of a tracer in a well
during field tracer tests.
3.3. Multitracer approach and DNA sequence based
tracers
As described above in the section dealing with the
application of the NGTT technique, to reduce exper-
imental efforts and to maximize gain of information
from the generally costly tracer experiments, multiple
tracers can be used within one experiment (Bosel et al.,
2000; Herfort and Ptak, 2002). Then, groundwater
samples have to be analysed for multiple tracers.
However, due to the physical and hydrogeochemical
properties of the usually used fluorescent, gas or salt
tracers, and the resulting limitations of the tracer
analysis procedures, the maximum number of different
tracer compounds that can be used in parallel would
usually amount to about 8–10, and different analytical
techniques such as fluorescence spectrometry, wet
chemistry, ion chromatography and mass spectrometry
would become necessary, requiring high experimental
efforts. However, in the last years special tracing
techniques involving synthetic DNA (deoxyribonu-
cleic acid) molecules with individually coded infor-
mation were developed (Alestrom, 1995). With such
new tracer compounds it becomes principally possible
to perform multitracer experiments with a theoretically
unlimited number of tracer injection locations.
DNA is constituted by a sequence of subunits
called nucleotides, specific in size and internal order
(Knippers, 2001). Every nucleotide is made up of
nitrogenous bases (adenine-A, guanine-G, cytosine-C
and thymine-T) and a sugar skeleton. Because the
complementary cytosine (C) and guanine (G) are
bound by three hydrogen bonds, compared to only two
bonds for the other pairs adenine (A)–thymine (T),
the percentage of GC is a measure of the stability of
the molecule. In nature, mostly double stranded
molecules occur, with nucleotides disposed on two
opposite strands. Normally, the DNA is a very long
molecule (1 mm) compared to its very small diameter
(20 £ 10210 m). Therefore the rather fragile double
strands of the DNA molecule can be easily broken
apart.
Shorter or longer fragments of single stranded
nucleotide sequences can be designed by chemical
synthesis. The difference compared to the natural
single stranded DNA molecules consists in the
molecule length (90 nucleotides for the presented
field case study), which is several orders of magnitude
shorter than the natural molecules.
As the DNA molecule is an anion, with a negative
charge synthetically adapted to the requirements
(Knippers, 2001), sorption of DNA molecules is
dependent on the aquifer material type as well as
physical and chemical properties of the groundwater.
It has been proved that adsorption to clay minerals
is several orders of magnitude higher than to sand
grains. Adsorption to sand is directly related to
pH, salt content and cationic valence (Lorenz and
Wackernagel, 1987). More adsorption was
monitored with increasing presence of bivalent
cations Ca2þ and Mg2þ than of monovalent Naþ.
All studies point out a minimum of adsorption for
neutral pH conditions (Lorenz and Wackernagel,
1987; Aardema et al., 1983). Adsorption was found
to be fast compared to desorption (Lorenz and
Wackernagel, 1987) and temperature independent.
Degradation of DNA molecule seems to be enhanced
by the presence of bacterial activity. Consequently,
further research is needed with respect to adsorption
and degradation of DNA molecules in the subsurface,
depending on site specific physical and hydrogeo-
chemical conditions.
The presence of DNA is proven by regular
polymerase chain reaction analysis (PCR), a routine
method commonly used in forensic medicine and
biology. With new methods it is even possible to
quantify the number of identical DNA molecules in
one sample (quantitative PCR). Theoretically, the
detection limit goes down to one molecule (Watson
et al., 1992). In addition to a practically unlimited
number of different DNA sequences, meaning differ-
ent tracers, the extremely low detection limit
represents another huge advantage of using synthetic
single stranded DNA molecules for tracing purposes
in groundwater, compared to traditional tracers. The
synthetic DNA molecules are usually available in
1 ml ampoules, which contain 1016–1018 identical
molecules. Even if adsorbed, degraded and diluted
under subsurface transport conditions by a factor of
1014–1015 (which is much more than expected during
standard hydrogeological applications), the tracers
still remain easily detectable.
T. Ptak et al. / Journal of Hydrology 294 (2004) 122–163134

3.3.1. Examples of DNA tracer application
One of the first experiments designed to test the
mobility and migration of DNA coded molecules
within sandy aquifers was performed at the Morrepen-
3 research site, closely located to Gardermoen Oslo
airport in Norway (Sabir et al., 1999a, b). In a forced
gradient steady state flow regime, a combination of
Sodium–Chloride (NaCl) and a single stranded DNA
tracer was injected into an unconfined sandy aquifer.
The distance between the injection and pumping wells
was 12 m. The migration of the solute plumes was
investigated with 38 multilevel monitoring wells, out
of which 35 were installed over a 5 m £ 5 m area. The
results of analyses showed an overlapping of the
plumes, with a general trend of DNA molecules being
detected farther away and at greater depths compared
to the chloride anions. The reason was the high
detection sensitivity of the PCR method (as low as
only a few identical DNA molecules), compared to
the chloride anions, with detection limits several
orders of magnitude higher. The experiment demon-
strated that specially designed DNA molecules can be
recorded in a variety of depths and distances from the
injection point and therefore be used for groundwater
tracer testing purposes.
The possibility to encode a considerable amount of
specific information creates the chance to generate a
practically infinite number of different DNA tracers.
Colleuille and Kitterod (1998) used five differently
labelled DNA tracers to delineate preferential flow-
paths and to prove contaminant source location.
The use of different DNA codes for several
horizontally and vertically differentiated injection
points and a subsequent injection of the different
tracers can quantify solute transport in space and time.
In a DNA tracer injection in fractured hard rocks
performed within the Romeriksporten railway tunnel
project in Norway (Sabir et al., 2000a, b), it was
possible to determine the degree of connection
between the excavation and a surface water body, as
well as to estimate the travel time of water in the
fractured rock.
A similar study (Sabir et al., 2000a, b) carried out
at Holmedal, Sogn and Fjordane, Norway, proved the
usefulness of such tracers in a study of connectivity
between wells drilled in fractured rocks, together with
a first assessment of groundwater velocity within
fractures.
3.3.2. Development of a quantitative DNA tracing
approach
In the previous studies, the investigations were
performed in a qualitative manner only. Therefore, a
quantitative approach is presently being developed,
allowing the measurement of DNA breakthrough
curves and the estimation of effective transport
parameters. This research is performed at the
Lauswiesen experimental site located closely to the
city of Stuttgart (Fig. 4), where the topic of drinking
water well protection zones is presently under
investigation.
At the test site, a quite regular sequence of upper
clay, followed by highly conductive (mean
K ¼ 8:8 £ 1023 m/s) quaternary sand and gravel
deposits, is found. The saturated aquifer thickness
is about 5 m. The groundwater has a neutral pH
(7.0–7.2), a moderate content of bivalent cations
(Ca2þ: 100–150 mg/l, Mg2þ: 20–30 mg/l), and a low
microbiological activity. Therefore no significant
adsorption and degradation of DNA molecules is
expected.
3.3.2.1. Laboratory testing. To test the new DNA
tracers and the newly applied technique to measure
quantitative breakthrough curves, three laboratory
column experiments using undisturbed core samples
(50 cm length, 10 cm diameter) from the Lauswiesen
test site were conducted in a first step. Sodium–
Bromide was used as a conservative reference tracer.
The flow rate was adjusted in a way to obtain a
transport velocity within the columns of about
14.4 m/d, which is comparable to the transport
velocities expected in the subsequent field tracer
test. For all three tests the injected tracer volume was
40 ml, containing 2.79 £ 109 (DNA tracer no. 1)
respectively 2.64 £ 1010 (DNA tracer no. 2) identical
DNA molecules. The samples were analysed by ion
chromatography (Bromide) and quantitative PCR
(DNA tracers). Fig. 5 shows examples of measured
DNA and Bromide breakthrough curves. One should
note that the peak of the DNA breakthrough curve
arrives earlier compared to Bromide. The higher
transport velocity of the DNA tracer, compared to the
conservative Bromide tracer, could be possibly
explained by size exclusion effects and resulting
selective flowpaths, with larger diameters and there-
fore higher transport velocities, detected by the DNA
T. Ptak et al. / Journal of Hydrology 294 (2004) 122–163 135

tracers due to their relatively larger molecule size. The
results are supported by previous studies (Sabir et al.,
1999a, b).
3.3.2.2. Field experiment. To reproduce the flow
situation of a drinking water well field, the first
quantitative DNA field tracer experiment at the
Lauswiesen site was run under convergent flow forced
gradient conditions (set-up shown in Fig. 4; G1, G3:
fully screened DNA injection wells; F0: pumping and
DNA monitoring well; B1: additional DNA monitor-
ing well). Due to the high aquifer heterogeneity
(variance s2lnðKÞ ¼ 2:97; based on laboratory-scale
sieve analyses), the tracer test was performed in a
multilevel set-up (see below) with four sampling
sections in vertical direction.
The two different DNA tracers (1016 single
stranded molecules, 90 nucleotides each), tested in
the laboratory experiments, were injected together
with Sodium–Bromide and Sodium–Naphthionate as
reference tracers at the two injection wells (G1, G3),
which results in an overall transport scale of the
experiment of about 10 m. Examples of breakthrough
curves are shown in Fig. 6. Fig. 6 presents according
to our knowledge a first example of quantitatively
measured DNA breakthrough curves at field-scale. It
is seen, that at field-scale earlier peak concentration
arrival times of the DNA tracer compared to Bromide
are not necessarily observed. Other field-scale break-
through curves, however, still indicate earlier peak
concentration arrival times of the DNA tracers
compared to Bromide. This supports the above-
mentioned laboratory experiments, regarding the
behavior of the used DNA tracer as a relatively long
Fig. 4. The Lauswiesen experimental site and monitoring network.
Fig. 5. Example of measured laboratory column breakthrough
curves for Bromide and a DNA tracer.
T. Ptak et al. / Journal of Hydrology 294 (2004) 122–163136

molecule, which is therefore possibly subject to the
aforementioned pore size exclusion effects.
The first results of the field experiment show that it
is feasible to measure DNA breakthrough curves in
aquifer materials using quantitative PCR analysis.
Due to the possibility of using practically an unlimited
number of different DNA tracers with a very low
detection limit within one multitracer experiment,
quantitative DNA tracing may become a powerful
tool for (three-dimensional) subsurface investigation
at a variety of transport scales. More detailed
laboratory and field experiments directed towards a
better understanding and quantification of transport,
adsorption and degradation processes of the synthetic
single stranded DNA molecules, depending on the soil
type and hydrogeochemical conditions, will help to
improve mass balance calculations, and applicability
of the DNA tracer method.
3.4. High resolution multilevel multitracer sampling
and concentration measuring equipment
At some field sites with a high degree of
heterogeneity, a three-dimensional subsurface charac-
terization may become necessary, i.e. the measure-
ment of depth-differentiated multilevel breakthrough
curves. Multilevel sampling systems (e.g. Ptak et al.,
2000) may be installed for this purpose. However,
especially at sites with deep aquifers and coarse
aquifer material, monitoring well installation costs
may become a limiting factor. To allow multilevel
Fig. 6. Example of measured field-scale breakthrough curves for
Bromide and a DNA tracer (tracer no. 2).
Fig. 7. Multilevel sampling within pumping wells (Ptak and Schmid, 1996).
T. Ptak et al. / Journal of Hydrology 294 (2004) 122–163 137

groundwater sampling also within fully screened
pumping wells, avoiding installation of additional
costly monitoring wells when performing forced
gradient transport experiments, a flow separation
technique was introduced (Ptak and Schmid, 1996;
Fig. 7) and further improved at the Lauswiesen
experimental site for the application in large diameter
pumping wells (Fig. 8).
In this multilevel set-up, the screen within a
pumping well is divided into individual measuring
sections using a slotted-wall multilevel packer (Fig. 7).
Each section can be equipped for instance with fiber-
optic probes for on-line in situ fluorescence spectrum
measurements (for example if the transport velocity is
relatively high, making round the clock frequent
sampling necessary), and/or other probes yielding
chemical and/or physical parameters. Mixing pumps
can be provided in order to obtain parameter values
representative for the entire section thickness.
Additional groundwater sampling tubes allow taking
(level integrated) multilevel groundwater samples.
In order to avoid vertical flow within the gravel pack
during the multilevel sampling procedure, geotextile
clay seals (Ptak et al., 2000) can be installed within
the gravel pack of the wells.
3.5. Multitracer forced gradient transport
experiments for the investigation of physical
and hydrogeochemical aquifer properties
If the FGTT approach is used to investigate reactive
transport processes, at least two tracers, a non-reactive
and one or more reactive, are injected simultaneously
at the same location into the aquifer. Since all tracers
experience the same (heterogeneous) hydraulic con-
ductivity field, the relative difference in the transport
behavior of the tracers (e.g. higher second order
temporal moments of reactive tracer breakthrough
curves compared to the non-reactive ones, relative
retardation etc.) is only a statement of the reactive
transport processes within the aquifer. Fig. 9 shows the
principle of this differential multitracer testing
approach in a multilevel version. The multilevel
version allows in addition the investigation of three-
dimensional structural properties such as preferential
flow paths, connectivity, structural anisotropy etc.
The reactive tracer is chosen with respect to the
reactive transport process investigated. Then, the
parameter characterizing the reactive transport pro-
cess can be deduced from the relative retardation of
the reactive tracer with respect to the non-reactive
tracer, if the relationship between the retardation
factor and the process parameter(s) is known.
3.5.1. Application of multitracer forced gradient
transport experiments for the investigation of
subsurface structural properties, surface sorption,
and scale effects
The above multitracer forced gradient technique
was initially applied for the investigation of surface
sorption, of effective field-scale retardation at trans-
port distances of up to 33 m, and of scale effects
related to reactive transport within three convergent
groundwater flow experiments using a non-reactive
(Fluoresceine) and a reactive, surface-sorbing fluor-
escent tracer (Rhodamine WT) (Ptak and Schmid,
1996; Ptak and Strobel, 1998; Ptak and Kleiner,
1998). Using Rhodamine WT as a reactive tracer,
sorption onto mineral surfaces can be investigated,Fig. 8. Multilevel sampler for large diameter pumping wells.
T. Ptak et al. / Journal of Hydrology 294 (2004) 122–163138

which is relevant for example for the transport of
polar/ionizable groundwater contaminants, e.g. some
pesticides. Since surface sorption is the dominating
reactive transport process, the field experiments
described here are interfacial tracer tests, where the
interface between the aquifer material and ground-
water is investigated.
The multitracer experiments were performed at the
Horkheimer Insel test site, which is located in
Germany in the Neckar valley, about 70 km north of
Stuttgart. The heterogeneous aquifer at the test site is
formed by a 2.5–4 m thick sequence of poorly sorted
alluvial sand and gravel deposits of holocene age,
with a mean hydraulic conductivity of 0.012 m/s and a
variance s2lnðKÞ of 2.34. The field experiments are
described in detail in Ptak and Schmid (1996) and
Kleiner (1997). Three different transport distances
between tracer injection and observation wells were
used in order to examine the scale dependence of the
effective field-scale retardation factor. Table 2
summarizes the experimental parameters.
To test the sorption properties of the two tracers,
Fluoresceine and Rhodamine WT, laboratory batch
experiments were performed using aquifer material
from the test site (Ptak and Strobel, 1998). Since
aquifer sediments are a heterogeneous mixture of
different lithocomponents with different grain size
fractions, sorption isotherms were measured for the
individual lithocomponents as well as for the
individual grain size fractions of aquifer material
samples of about 5 cm thickness. In the batch
experiments, no significant sorption of Fluoresceine
could be observed for the concentrations encountered
during the field experiments. On the other hand,
Rhodamine WT is known to be sorbing onto mineral
surfaces (e.g. Sabatini and Austin, 1991). In the
batch experiments, Rhodamine WT sorption equili-
brium concentrations ceq were achieved very fast
Table 2
Experimental parameters
Experiment TT9 TT10 TT11
Transport distance (m) 8.9 12.8 32.7
Pumping rate (l s21) 3.02 3.02 3.3
Fluoresceine injected (g) 10 20 102
Rhodamine WT injected (g) 8 16 102
Multilevel measurements Yes Yes No
Vertical resolution (m) 0.3 0.3 –
Temporal resolution (min) 1 1 5
Fig. 9. Forced gradient multilevel–multitracer approach (Ptak and Kleiner, 1998).
T. Ptak et al. / Journal of Hydrology 294 (2004) 122–163 139

(after maximally about 30 min), which is typical for
surface sorption, and no significant kinetic behavior
was observed at the anticipated time scale of the field
tracer experiments (7–14 days).
To estimate the Rhodamine WT retardation factors
from the multilevel breakthrough curves, temporal
moments equations were applied. The nth temporal
moment is defined as (e.g. Kreft and Zuber, 1978):
Mn;t ¼ð1
0tncðr; tÞ dt ð1Þ
where tðsÞ is the time, c (kg/m3) the concentration and
r (m) is the transport distance. Then the arrival time of
the center of mass is given by the first normalized
moment, m ¼ M1;t=M0;t: Using the first normalized
moment a mean effective transport velocity can be
defined, �veff ¼ r=m: Assuming that Fluoresceine is an
ideal tracer, an effective field-scale retardation factor
R (–) can be defined for each set of two corresponding
breakthrough curves:
R ¼v�veff Fluoresceine
v�veff Rhodamine WT
¼mRhodamine WT
mFluoresceine
ð2Þ
The values of R are in the range between 1.27 and 1.40
for TT9, and between 1.26 and 1.37 for TT10, when
individual multilevel breakthrough curves are com-
pared. This variability indicates the heterogeneity of
the aquifer. The arithmetically averaged retardation
factors (after Cvetkovic and Shapiro, 1990) are 1.35
for TT9 and 1.32 for TT10. For TT11 with the largest
transport scale investigated, an effective retardation
factor R of 2.17 is obtained.
3.5.1.1. Comparison of retardation factors measured
at different scales, scale effects. The results obtained
from the tracer tests show that for near-source
investigations, where the solute travelled only a few
correlation lengths of the subsurface structure, the
scale dependence of non-reactive and reactive trans-
port parameters has to be taken into account, even if
the reactive process is at local equilibrium.
The scale dependence of e.g. macrodispersivity
values is well-known and investigated (e.g. Gelhar
and Axness, 1983; Dagan, 1989; Gelhar et al., 1992;
Rajaram and Gelhar, 1995; Ptak and Teutsch, 1992;
Ptak and Teutsch, 1994a).
The increase of field-scale retardation factors of
organic compounds with time respective transport
distance was attributed to the relatively slow process
of intraparticle diffusion (e.g. Roberts et al., 1986;
Ball and Roberts, 1991). In the multitracer FGTTs
discussed here, an increase of the effective field-scale
retardation factor of the surface sorbing tracer
(Rhodamine WT), also called macrokinetic sorption
behavior (Miralles-Wilhelm and Gelhar, 1996), was
observed, even though sorption equilibrium was
achieved very fast within laboratory batch exper-
iments, without any significant sorption kinetics at the
time scale of the tracer experiments (7–14 days).
Therefore a high Damkoehler number, i.e. the ratio of
hydrodynamic residence time and characteristic time
of the sorption process, was obtained.
The observed sorption macrokinetics of the sorbing
tracer Rhodamine WT can thus be explained as a
consequence of physical and chemical aquifer hetero-
geneities. Within the tracer experiments at small-scale
(8.9 and 12.8 m), in the heterogeneous aquifer most of
the tracer mass was transported in highly conductive
preferential pathways, since the horizontal correlation
length of the hydraulic conductivity field at the test site
is in the order of 10 m (Ptak and Teutsch, 1994b),
which is about the transport distance of the two
experiments. Therefore, the probability for connected
preferential pathways between the pumping and
injection wells is relatively high for the small transport
distances. Within the intermediate transport distance
tracer experiment (32.7 m), the probability for dis-
continuities in the high conductivity preferential
transport zones increases, since the horizontal corre-
lation length of about 10 m is smaller compared to the
transport distance of 32.7 m. The tracer has therefore to
pass low conductivity aquifer zones, too. Such low
conductivity zones are generally composed of finer
grains compared to the high conductivity zones. From
the batch experiments using the reactive tracer (Ptak
and Strobel, 1998), it could be shown that the sorption
capacity is inversely related to aquifer material grain
size, and (at the test site investigated) independent of
the lithological composition. Then, if surface sorption
is controlling the reactive transport process, higher
sorption capacities are obtained within the lower
conductivity aquifer zones with a higher specific
surface. Since the tracer is hydrodynamically mixed
into lower conductivity zones, as the transport distance
becomes larger compared to the hydraulic conductivity
correlation length, the effective retardation factor
T. Ptak et al. / Journal of Hydrology 294 (2004) 122–163140

increases with travel distance. It could be shown, based
on a comparison of characteristic time scales and on
parameter studies, that during the experiments diffu-
sion is insignificant both at grain scale as well as at the
scale of low conductivity, clayey zones. Fig. 10
summarizes the conceptual model to explain the
observed sorption macrokinetics.
3.5.1.2. Investigation of effective aquifer material
grain diameters. From the batch experiments using
Rhodamine WT, the following relationship between
sorption capacity and grain size, based on a
Freundlich isotherm model, could be established:
KDi ¼1
ni
KFric
1ni
21
eq ¼ 0:85 £ 0:132 d21:0i c0:8521
eq ð3Þ
where KDi (l/kg) is the distribution coefficient at
sorption equilibrium (i.e. the derivative of the
Freundlich isotherm with respect to the equilibrium
concentration), KFriððl=kgÞ1=niÞ is the Freundlich
coefficient, ceq (mg/l) is the equilibrium concentration,
n21i (–) is the Freundlich exponent of a grain size
fraction i; and di is the representative diameter (mm)
of i: It could also be shown that it is not necessary to
regard the lithological composition (quartz, Jurassic
and Triassic limestones, Keuper and Bunter sand-
stones, calcite) as an aquifer property controlling the
surface sorption of Rhodamine WT. Using Eq. (3), the
effective field-scale retardation factors R observed in
the tracer experiments can be expressed as:
R ¼ 1 þrb
uKDeff
with:
KDeff¼ 0:85 £ 0:132 d21:0
eff c0:8521eq ð4Þ
where rb (kg/m) is the bulk density of the aquifer
material and u (–) is the porosity. Then, from Eq. (4),
Fig. 10. Conceptual model explaining sorption macrokinetics of compounds sorbing on mineral surfaces (Ptak and Kleiner, 1998).
T. Ptak et al. / Journal of Hydrology 294 (2004) 122–163 141

the effective diameter deff (mm) of the aquifer
material grains within the tracer transport paths can
be estimated. The relationship between the measured
field-scale retardation factor R and the effective grain
diameter as described by Eq. (4) is graphically
depicted in Fig. 11. It is seen from Fig. 11 that for
the concentrations encountered within the tracer
experiments the retardation factor does not strongly
depend on the equilibrium concentration, which is due
to the Freundlich exponent close to one. If in a first
evaluation step the weak concentration dependence is
neglected, the measured field-scale retardation factors
yield effective grain diameters of about 3 mm for the
small-scale experiments TT9 and TT10, and of about
0.9 mm for the larger scale experiment TT11. The
effective grain diameter is indicated by the crossings
of the measured retardation factors R (horizontal
straight lines in Fig. 11) and the R values estimated
using Eq. (4) (curves in Fig. 11). The decrease of the
effective grain diameter with transport distance is in
accordance with the discussion of the macrokinetic
sorption behavior presented above, which states that
for the longer transport distance the tracer has to pass
also aquifer zones with a relatively low hydraulic
conductivity, which are composed of finer grains.
This estimated grain diameter can be used for
example to predict the retardation of groundwater
contaminants sorbing to the surface of aquifer
material grains. Usually it is difficult to obtain field
data on the transport of such contaminants, since due
to law regulations it is in general impossible to use the
contaminants directly for field experiments. Then, if
the relationship of the distribution coefficient and the
grain size is known for a specific surface sorbing
contaminant (for instance from laboratory measure-
ments), the retardation factor can easily be predicted
from the estimated grain diameter, and its scale
dependence can be taken into account.
Of course, other tracer types can be applied in the
multitracer technique as well, for example interfacial
tracers to estimate the effective surface of residual
NAPLs and/or partitioning tracers to estimate the
residual NAPL saturation, or biodegradable tracers to
investigate biological processes and/or biodegrada-
tion of contaminants.
3.5.2. Application of multitracer forced gradient
transport experiments for the quantification
of NAPL phases
Contaminant release from residual, non-aqueous
phase liquids (NAPLs) into groundwater depends on
the composition of the NAPL, the NAPL volume and
the interfacial area between NAPL and groundwater.
The determination of these essential source zone
parameters with common sampling methods such as
core sampling and well logging provides only point
scale data at discrete locations, thereby suffering from
the principal problem to yield values that are only
averages over very small aquifer volumes. Spatially
more extensive site characterization methods, such as
geophysical techniques, are often difficult or even
impossible to be used as means of determining the
amount of NAPL present without knowing the initial
geophysical properties of the site before it was
contaminated.
This chapter describes controlled experiments of in
situ multitracer partitioning and interfacial tracer tests
(PITTs) at laboratory scale, which allow the integral
determination of the NAPL (here a coal tar DNAPL)
amount and distribution throughout the water satu-
rated subsurface area that is flushed during the
experiment.
Partitioning tracer tests (PTTs) as employed in
these experiments were initially developed in oil
reservoir engineering using both single well tests
(Tomich et al., 1973; Sheely, 1978) and interwell tests
(Tang, 1992). Here, a typical single well test is carried
out by injecting a certain tracer slug of a dissolved
primary partitioning tracer (ethyl acetate) into a
formation that is at residual oil saturation. The initial
Fig. 11. Retardation factor as a function of the effective grain
diameter and measured effective field-scale retardation factors
(shown as horizontal straight lines) (Ptak and Kleiner, 1998).
T. Ptak et al. / Journal of Hydrology 294 (2004) 122–163142

tracer slug is then followed by a slug of tracer free
water. Afterwards the well is shut in. During the
residence period in the formation (at elevated oil
reservoir temperatures and negligible drift due to
typically very small background flow velocities) a
portion of the primary tracer (ethyl acetate) hydro-
lyzes to form the secondary non-partitioning tracer
(ethyl alcohol). Finally, the well is pumped and the
concentrations of both tracers are measured during the
extraction phase. Residual crude oil saturation is
determined by the delayed arrival of the partitioning
tracer (ethyl acetate) breakthrough curve relative to
the non-partitioning tracer (ethanol) breakthrough
curve and their correlation to the independently
obtained distribution coefficients. At potentially
NAPL contaminated, typical shallow aquifers, the
above described single-well set-up cannot be realized
due to insufficient hydrolyzation rates which are a
result of the lower formation temperatures, and due to
an excessive drift of the injected tracer body which is
a result of the typically higher background flow
velocities. Additionally it should be mentioned that
this method may suffer from the limitations (non-
uniqueness of interpreted parameters) of single-well
push–pull tests (Hall, 1993; Hall, 1996; Haggerty
et al., 1998; Schroth et al., 2001; Novakowski et al.,
1998; Kunstmann et al., 1997). The interwell PTTs
conducted by Tang (1992) overcome these limitations
by injecting tritiated water as non-partitioning tracer
and tritiated n-butanol as well as 14C labeled i-amyl
alcohol as partitioning tracers in one well and
extracting it at the other. The determination of
residual crude oil saturation was again based on
distribution coefficients and the relative separation of
the two breakthrough curves. However, according to
Chen and Knox (1997) the applicable residual crude
oil saturation for both kinds of oil reservoir engineer-
ing tests ranged from 20 to 40%.
As mentioned above the injection of two solutes
with different partitioning properties made the method
much more robust but it also terminated the potential
application as single well tests (at least for the
classical arrival-time based evaluation concept). Two
tracers with different distribution coefficients will start
to separate as soon as they leave the well bore and are
transported through a residual oil bearing aquifer. But
if the flow direction is subsequently reversed by
pumping from the same well, the separation may
disappear again as the tracers return to the well bore,
i.e. the arrival times of the partitioning and of the non-
partitioning tracer at the well may be identical.
Therefore a reasonable way to conduct PTTs employ-
ing a single well bore (in combination with the
classical arrival-time based evaluation) is using a
vertical circulation well set-up, for example as
presented by Chen and Knox (1997) and Brooks
et al. (2002). In their most recent single well push–
pull PTT study Istok et al. (2002) used a new approach
given by Schroth et al. (2001) to estimate the residual
saturation based on an increase in apparent dispersion
observed in extraction-phase breakthrough curves.
The presence of NAPL is indicated by an increase in
apparent dispersion of the partitioning tracer relative
to the non-partitioning tracer. However, they had to
admit that additional research is needed to verify the
ability of this method to quantify NAPL saturations.
The concept of interwell PTTs to detect residual
crude oil saturation has been modified and applied for
the detection and quantification of residual NAPL
phase at contaminated field sites by several research-
ers (Jin et al., 1995; Wilson and Mackay, 1995;
Nelson and Brusseau, 1996; Jin et al., 1997; Annable
et al., 1998b; Gierke et al., 1999; Nelson et al.; 1999a,
b; Young et al., 1999; Brooks et al., 2002). Meanwhile
PTTs are quite frequently used for the assessment of
various in situ clean-up methods (e.g. surfactant and
alcohol flushing) applied at field-scale (Cain et al.,
2000; Young et al., 1999; Brooks et al., 2002;
Meinardus et al., 2002; Rao et al., 2000; Rao et al.,
1997; Sillan et al., 1998; Jawitz et al., 2000). The
theoretical studies of James et al. (1997), James et al.
(2000), and Zhang and Graham (2001a, b) focused on
the performance optimization of PITTs under non-
ideal conditions (e.g. non-uniform flow fields and
hydrogeochemically heterogeneous aquifers). Wilson
et al. (2000) present a mathematical model for the
simulation of PTTs. In contrast to the quite often
applied UTCHEM-code (Brown et al., 1994; Delshad
et al., 1996) modelling under local equilibrium
assumption (Jin et al., 1995; Jin et al., 1997; Young
et al., 1999), which thereby omits the governing mass
transfer limitations, their (Wilson et al., 2000) process
based model includes the kinetically limited mass
transport of the partitioning tracer from and to the
NAPL, and is therefore potentially capable to fit
T. Ptak et al. / Journal of Hydrology 294 (2004) 122–163 143

the highly asymmetrical breakthrough curves that
were obtained in many PTT studies.
The determination of NAPL-water interfacial areas
via interfacial tracer tests (ITTs) is a quite recent
development (Saripalli et al., 1997; Saripalli et al.,
1998; Annable et al., 1998a; Kim et al., 1999).
Experiments with subsequent runs of both, PTTs and
ITTs were conducted by Annable et al. (1998a) and
Dai et al. (2001).
First laboratory experiments with PITTs (combin-
ing both partitioning and interfacial tracers in one run)
and a complex multicomponent NAPL (tar oil) were
conducted by Setarge et al. (1999).
Due to the convincing concept the PTT and ITT
methodology originating in the saturated zone
branched rapidly and is meanwhile also available for
different applications in the vadose zone. Deeds et al.
(1999, 2000) used perfluorocarbon gas tracers for the
determination of NAPL saturation in an air/water/
NAPL system situated in the unsaturated zone.
Mariner et al. (1999) investigated a comparable
system (air/water/NAPL), but used an additional
tracer (difluoromethane) that was suitable for the
determination of water saturation. Nelson et al.
(1999a, b) conducted gas-phase partitioning tracer
experiments for the measurement of soil water content
in a well controlled lysimeter study (air/water). The
air/water system at various degrees of saturation was
also investigated employing a PTT by Vulava et al.
(2002). The effective air–water interfacial area in
partially saturated media was the target parameter in
the studies of Kim et al. (1997) and Anwar et al.
(2000). Both authors used a surfactant as interfacial
tracer. While Kim et al. (1997) conducted classical
column studies and recorded tracer breakthrough
curves, Anwar et al. (2000) had to sacrifice and
extract their columns (after the injection of the tracer)
to obtain their results.
The same concept but a different tracer philosophy
is the background of the PTT experiments performed
by Hunkeler et al. (1997) and Semprini et al. (2000).
While all aforementioned studies used artificial
tracers these authors used a naturally occurring
radioactive isotope, 222Rn, that is found in ground-
water as a dissolved gas, as partitioning tracer to
detect and quantify residual NAPLs in contaminated
aquifers. Due to its non-polarity 222Rn has a high
affinity to partition into NAPLs. The field applications
rely on observable decreases in 222Rn concentrations
in areas with residual NAPL present, compared to its
background concentrations in the surrounding uncon-
taminated areas. Recently, Davis et al. (2002)
presented a single well, push – pull tracer test
methodology using 222Rn to quantify TCE residual
saturations. The computation of the NAPL saturation
was based on an increased apparent dispersion of222Rn relative to the conservative tracer (Bromide)
that was recorded during the extraction phase when
residual NAPL was present.
3.5.2.1. Retardation factor. The PITT consists of an
injection of a suite of partitioning, interfacial and
conservative tracers into a well (column inlet) and the
recovery of the tracer solution at an extraction well
(column outlet). While the conservative tracers will
stay unaffected by the presence of DNAPL, the
reactive compounds (partitioning and interfacial
tracers) undergo retardation due to their absorption
and adsorption behavior. The result is a chromato-
graphic separation of the tracers that can be recorded
at the extraction well. The higher the affinity to the
DNAPL phase the better is the separation of the
individual breakthrough curves (BTCs). This effect is
quantified by the retardation factor R (–) which is
defined as:
Rreactive ¼mreactive
mconservative
ð5Þ
where m is the first normalized temporal moment of
the respective tracers at a monitoring location. For a
pulse-type experiment this is given by Eq. (6),
(according to Valocchi, 1985; Jin et al., 1995):
m ¼
ð1
0t
CðtÞ
C0
dtð1
0
CðtÞ
C0
dt
2tp
2ð6Þ
where CðtÞ is the monitored tracer concentration
(either reactive or conservative tracer) that is normal-
ized by its input concentration C0; t is the experimen-
tal time and tp=2 is the time correction-term for the
duration of the tracer-pulse injection ðtpÞ:
3.5.2.2. Retardation of partitioning tracers. The
dimensionless equilibrium partitioning coefficient
T. Ptak et al. / Journal of Hydrology 294 (2004) 122–163144
KNW (–) is defined as:
KNW ¼CN
CW
ð7Þ
where CN (g/cm3) is the concentration of the tracer in
the DNAPL and CW (g/cm3) is the concentration of
the tracer in the water phase. Conservative tracers
have a partitioning coefficient of zero.
The general equation of partitioning tracer retar-
dation ðRPARTÞ can be written as (Nelson and
Brusseau, 1996; Setarge et al., 1999):
RPART ¼mPART
mconservative
2 1 þKNWSn
1 2 Sn
þrdKd
nð8Þ
where Sn; rd; Kd; and n denote the DNAPL residual
saturation (–), the bulk density of the aquifer material
(g/cm3), the solid– water distribution coefficient
(cm3/g) and the water filled porosity (–), respectively.
If the tracers are not adsorbed by the aquifer material
ðKd ¼ 0Þ the last term equals zero, and thus the
retardation factor depends solely on Sn and KNW:
Because the retardation factor for each partitioning
tracer is a function of both the partitioning coefficient
of the tracer and the average DNAPL residual
saturation of the contaminated aquifer, Sn can only
be determined by measuring RPART for tracers with
known partitioning coefficient, KNW:
If the average residual saturation is unknown,
which is most likely for all field tests, a whole suite of
partitioning tracers with varying partitioning coeffi-
cients should be used to ensure, that at least one
breakthrough curve will have sufficient separation
(1:2 , RPART , 4; recommended by Jin et al., 1997)
from the conservative tracer breakthrough curve, to
calculate Sn: Additional breakthrough curves with
sufficient separation increase the confidence level of
the PITT results.
3.5.2.3. Retardation of interfacial tracers. As an
interfacial tracer, for example a surfactant such as
Sodium Laurylethersulfate (SLES) can be used. The
interfacial accumulation of SLES can be described by
the Gibbs sorption isotherm (Adamson, 1982):
G ¼ 21
2RT
dg
dC
� �C ð9Þ
where G; g; C; R; and T denote the interfacial
adsorption (mmol/cm2), the DNAPL–water interfacial
tension (dynes/cm), the concentration of surfactant
(mmol/cm3), the universal gas constant (dyne
cm/mmol K) and the absolute temperature (K). The
DNAPL–water interfacial tension ðgÞ can be measured
as a function of concentration using the drop-weight
method (Earnshaw et al., 1996).
The equilibrium interfacial adsorption coefficient,
KIFT (cm), can be determined by the following
equation (Saripalli et al., 1998):
KIFT ¼ 21
2RT
dg
dC
� �����CIFT
ð10Þ
KIFT can be calculated for a given surfactant
concentration ðCIFTÞ and varies with the slope of the
g versus C plot, which was obtained by the drop
weight method (Fig. 13). When pulse input tracer tests
are applied, a constant KIFT value can be estimated in
a first approximation by using the maximum inter-
facial tracer concentration of each breakthrough curve
(Annable et al., 1998a).
The general equation of interfacial tracer retar-
dation ðRIFTÞ can be written as (Saripalli et al., 1998):
RIFT ¼mIFT
mconservative
¼ 1 þANWKIFT
uþ
rdKd
uð11Þ
where ANW; rd; Kd; and u denote the DNAPL–water
interfacial area (cm2/cm3), the bulk density of the
aquifer material (g/cm3), the solid–water distribution
coefficient (cm3/g) and the volumetric water content
(–), respectively. If the interfacial tracer adsorption
by the aquifer material is negligibly small ðKd < 0Þ;
the last term equals zero and thus the retardation
factor depends only on ANW and KIFT:
By measuring the retardation factor of the
interfacial tracer, the DNAPL–water interfacial area
can be estimated if the adsorption isotherm for the
interfacial accumulation is known.
3.5.2.4. Materials and methods. In our laboratory
column and tank PITT experiments, the alcohols
4-Methyl-2-Pentanol (4M2P), 1-Hexanol (1HEX)
and 2,4-Dimethyl-3-Pentanol (2,4DM3P) were used
as partitioning tracers. They are easily detected by
GC-FID analysis, even in the presence of high
contaminant concentrations in the water. The anionic
surfactant Sodium Laurylethersulfate (SLES, see also
above) was used as interfacial tracer and was analyzed
by IC conductivity measurements. Isopropanol (IPA)
T. Ptak et al. / Journal of Hydrology 294 (2004) 122–163 145

and Sodium Chloride (NaCl) were used as conserva-
tive tracers. NaCl was quantified by conductivity
measurements.
As DNAPL, an industrial coal tar (Rutgers,
Germany) with a density of 1.2 g/cm3 was employed
in all types of experiments. Well-graded sand from the
River Rhine quaternary alluvium (1–2 mm diameter)
was used to fill the laboratory tank and columns.
The specific objectives of the experiments were:
(1) evaluation of the suitability of the combined PITT
for complex multicomponent DNAPLs (here coal tar),
(2) improvement and evaluation of the PITT-based
determination of coal tar saturation in dependence of
different flow velocities, and (3) improvement and
evaluation of the PITT-based determination of the
specific DNAPL/water interfacial areas of three
different DNAPL distributions.
3.5.2.5. Batch experiments and drop-weight method.
Batch experiments were performed to determine the
equilibrium partitioning coefficients of the alcohols
and the tar oil which were used in the laboratory
studies. The results are shown in Fig. 12 and Table 3.
Table 3
Summary of results from the batch, column and large-scale tank experiments
Experiment # /Tracer ! NaCl IPA 4M2P 1HEX 2,4DM3P SLES
Batch Experiments
KNW (–) 0 0.8 3.2 9.6 16 –
KIFT (cm) – – – – – 9.73 £ 1025–9.24 £ 1024
Column Experiments
Column # 8b, Sn: 20%, DNAPL blobs, va: 6.1 m/d
Rd (–) expected 1 1.2 1.8 3.4 5.0 n.d.
Rd (–) measured 1.11 1.00 1.30 1.79 1.94 1.09
Sn (%) calculated 0 0 8.6 7.6 5.5 –
ANW (cm2/cm3) calc. – – – – – 86
Column # 8c, Sn: 20%, DNAPL blobs, va: 3.5 m/d
Rd (–) expected 1 1.2 1.8 3.4 5.0 n.d.
Rd (–) measured 1.16 1.00 1.45 2.03 2.59 1.09
Sn (%) calculated 0 0 12.3 9.7 9.0 –
ANW (cm2/cm3)calc. – – – – – 76
Column # 9b, Sn: 20%, DNAPL coatings, va: 1.9 m/d
Rd (–) expected 1 1.2 1.8 3.4 5.0 n.d.
Rd (–) measured 1.08 1.00 1.52 2.69 3.85 2.69
Sn (%) calculated 0 0 14.2 15.0 14.9 –
ANW (cm2/cm3)calc. – – – – – 884
Large-scale tank Experiments
Well # C, Sn: 5%, DNAPL blobs, va: 5 m/d
Rd (–) expected 1 1.04 1.16 – 1.84 n.d.
Rd (–) measured 1 1.006 1.014 – 1.028 1.04
Sn (%) calculated 0 0.7 0.4 – 0.17 –
ANW (cm2/cm3) calc. – – – – – 24
Fig. 12. Partitioning of 4-Methyl-2-Pentanol in aqueous and
DNAPL phases.
T. Ptak et al. / Journal of Hydrology 294 (2004) 122–163146

Fig. 13 shows the results from the drop-weight
method, which was applied to measure the DNAPL-
water interfacial tension versus interfacial tracer
concentration for the Sodium Laurylethersulfate
(SLES) tracer. The obtained interfacial tension data
were fitted by the following procedure (Annable et al.,
1998a):
g ¼ 1 2C
CMCFIT
� �b" #ðgmax 2 gminÞ þ gmin ð12Þ
where CMCFIT (mmol/cm3) and b (–) are the fitting
factors. gmin and gmax (dynes/cm) are the minimum
and maximum interfacial tensions measured. This
function was differentiated to estimate the local slope
at the desired CIFT concentration. The introduction of
this derivative into Eq. (10) gives the respective
interfacial adsorption coefficient:
KIFT ¼bðgmax 2 gminÞ
2RTðCMCFITÞb
Cb21 ð13Þ
With gmin ¼ 10:74 dynes/cm, gmax ¼ 46:74 dynes/cm,
CMCFIT ¼ 0:0045 mmol/cm3 and b ¼ 0:45 the corre-
sponding KIFT values for the varying CIFT values were
in the range of 4.7 £ 1024–7.6 £ 1024 cm (Fig. 13,
Tab. 3).
3.5.2.6. Column experiments. All PITTs were con-
ducted as pulse type experiments in glass columns
(6 cm diameter, 15 cm length) filled with sand (River
Rhine quaternary alluvium, 1–2 mm diameter) con-
taining a tar oil residual saturation ðSnÞ of exactly
20%. The flow-velocity was varied between 1.9 and
6.1 m/d to evaluate the influence of non-equilibrium
transport (Tab. 3). A further series of columns
contained DNAPL as grain-coatings, as blobs, and
as pools/ganglia at the same residual DNAPL
saturation ðSn ¼ 20%Þ; in order to study the influence
of the different types of DNAPL distribution on the
measured breakthrough curves. The varying
DNAPL–water interfacial area of these experimental
set-ups was used to get a first validation of interfacial
tracer data (Figs. 14 and 15 and Table 3).
In column #9a containing the DNAPL pool zone
the breakthrough curve of the interfacial tracer SLES
is not retarded with respect to the conservative tracer
NaCl (Fig. 14), while in column #9b containing the
DNAPL coatings the SLES breakthrough curve is
strongly retarded comparing to the conservative tracer
NaCl (Fig. 15). This behavior was anticipated as the
DNAPL – water interfacial area of the DNAPL
pool is more or less negligible in comparison to the
interfacial area of the DNAPL coatings. Further-
more, these results show that the employment of
Fig. 13. Measurement of interfacial tension of Sodium Laurylether-
sulfate (SLES) using the drop-weight method.
Fig. 14. Breakthrough curve of SLES passed through a DNAPL
pool zone.
Fig. 15. Breakthrough curve of SLES passed through DNAPL
coatings.
T. Ptak et al. / Journal of Hydrology 294 (2004) 122–163 147

the interfacial tracer technique enables to distinguish
between the two most extreme contaminant distri-
bution scenarios which (even when the same amount
of NAPL is present) will result in completely different
time scales when it comes to DNAPL dissolution/site
remediation.
3.5.2.7. Large-scale tank experiment. Additional
pulse type PITTs were conducted in a large-scale
tank (8 m £ 3 m £ 1 m), filled with sand (1–2 mm),
by continuous injection/pumping to create a forced
gradient flow field. The withdrawal rate was 1.6 times
the injection rate. The injection and extraction wells
were only partially penetrating, separated by 0.6 m
and aligned in the direction of the flow field (5 m/d).
The wells were located just at the edge of a tar oil blob
zone (0.5 m £ 1 m £ 1 m, Sn : 5%). Results are
summarized in Table 3.
The results of the PITTs were in general agreement
with the current understanding of partitioning and
interfacial tracer behavior. Suitability of the PITT was
proven for the complex multicomponent mixtures
(coal tar/tar oil) which can be found at former
gasworks sites.
The combination of interfacial and partitioning
tracers during the PITT studies not only determined
the DNAPL saturation, it also clearly distinguished
between major different DNAPL distribution geome-
tries (tar oil coatings vs. blob zone), which are
important parameters concerning (1) the prediction of
the long-time behavior of the source zone and (2) the
feasibility of in situ remediation techniques. However,
the PITT-determined tar oil residual saturation of each
experiment conducted during this study was smaller
than the actual DNAPL volume. This is believed to be
a coupled effect of non-equilibrium tracer transport
(resulting in strongly asymmetric breakthrough
curves) and the interpretation of pulse-type tests
using the method of temporal moments. Despite the
theoretical independence of the first moment of mass
transfer limitations, spreading and asymmetry (the
second and third moments) will increase with
increasing mass transfer limitations (Valocchi, 1985;
Brooks et al., 2002; Imhoff et al., 2003). Both is likely
to increase truncation errors which consequently
result in underestimation of the DNAPL saturation.
It should be noted, that all column experiments
conducted in this study showed clear mass transfer
limitations (highly asymmetric breakthrough curves)
of partitioning tracers into the quite viscous coal tar,
and, due to the unavoidable truncation of the break-
through curve tailings by the detection limit of the
individual tracer substances, a reduced tracer retar-
dation was recorded. Consequently, a smaller DNAPL
saturation compared to the actual one was calculated.
The observed slow mass transfer kinetics may
cause limitations of the applicability of PITTs at coal
tar contaminated field sites. Therefore, overall residual
coal tar saturationshouldexceed5%toobtainsignificant
retardation of the tracers used in this study. The
approximate location and extension of the zone of
residualDNAPLsaturationshouldbeknowninadvance,
and the flow velocity should be smaller than 5 m/d to
approach conditions closer to equilibrium. Also,
improved evaluation approaches, based for example on
fitting of solutions from process-based formulations of
the partitioning tracer transport (e.g. based on the model
of Wilson et al., 2000), should be developed to account
for the truncation of the breakthrough curves.
3.5.3. Application of multitracer forced gradient
transport experiments for the investigation
of microbial activities
Istok et al. (1997) proposed a single well push–pull
method for the in situ determination of microbial
respiration rates in groundwater. They injected test
solutions containing a tracer (Bromide) and one or
more reactive solutes (O2, NO32, SO4
22), selected to
investigate specific microbial activities. During the
following residence time in the aquifer (which has to
be varied depending on the kinetics of the microbial
process) a portion of the injected reactant was
consumed. The breakthrough curves and the mass
recovery recorded during the subsequent extraction
phase were used to calculate the quantities of
consumed reactants and newly formed products, and
finally to obtain the microbial respiration rates.
Based on the above approach, Schroth et al. (1998)
successfully quantified the horizontal and spatial varia-
bility of aerobic respiration and denitrification rates in a
petroleum hydrocarbon contaminated aquifer.
Haggerty et al. (1998) developed a simplified
method of push–pull test data analysis providing
first-order reaction rate coefficients form measured
non-reactive and reactive breakthrough curves.
They also presented an example of field-scale
T. Ptak et al. / Journal of Hydrology 294 (2004) 122–163148

application to estimate reaction rate coefficients for
microbiological denitrification in a petroleum-con-
taminated aquifer.
However, following Istok et al. (1997), it has to be
taken into account that also non-biological processes
may contribute to the consumption of the reactive
solutes, and, as electron acceptors are added during
the tests, the actual reaction rates may be smaller
compared to the estimated ones. Therefore a good
understanding of the investigated hydrogeochemical/
microbiological system is a prerequisite for the
interpretation of the experimental data.
3.5.4. Application of multitracer forced gradient
transport experiments for the investigation
of longitudinal and transverse mixing
Natural attenuation (mainly biodegradation) of
organic pollutants in groundwater is usually con-
trolled and limited by transverse mixing of electron
donors and acceptors at the contaminant plume fringe
(Grathwohl et al., 2001; Thornton et al., 2001). The
quantification of parameters characterizing subsurface
mixing processes (i.e. dispersivities both in longitudi-
nal and especially in the transverse directions) is a
prerequisite for the prediction of natural attenuation.
Therefore a number of forced gradient bench scale
tank experiments with tracers/surrogate reactants
were performed by different researchers in order to
investigate fringe mixing processes. Obtaining the
required high-resolution data at field-scale is very
difficult due to the resulting monitoring efforts.
Therefore well-controlled laboratory experiments are
most suitable for the investigation of fundamental
processes at plume fringes and for the validation of
numerical models dealing with natural attenuation.
As the transverse mixing zone at the plume fringe
is usually very thin (on the order of cm, i.e. the
concentration gradients are very steep) it can easily be
disturbed by conventional sampling methods. There-
fore measurements based on non-invasive imaging
techniques are especially advantageous. Some
examples of such (two-dimensional) visualization
experiments reported in literature are given in the
following. As this is a quite new field of application of
reactive tracers, the focus is on suitable tracer
substances and reactions.
Gramlin et al. (2002) experimentally quantified the
longitudinal mixing process of a transient plume front
in a 30 cm long translucent 2D tank filled with a
transparent aquifer matrix (cryolite) by imaging an
instantaneous colorimetric Cu/EDTA complexation
reaction:
Na2EDTA22
clear
þCuSO4light blue
¼2NaþþCuEDTA22
dark blueþSO22
4
Huang et al. (2003) used a novel combination of
non-invasive imaging with an oxygen sensitive
fluorescent indicator to investigate the biodegradation
processes occurring at the fringe of a solute plume
(acetate) within a 15.6 cm long, 3 mm thin transparent
2D tank filled with quartz sand and spiked with
suitable bacteria. The fluorescence of the used
fluorescent indicator (Ru(phen)3Cl2) is quenched in
the presence of oxygen. The consumption of oxygen
by the biodegradation of the contaminant (acetate)
was monitored by exciting the fluorescence indicator
with UV light and recording the emission with a CCD
camera.
Theodoropoulou et al. (2003) performed visual-
ization experiments in transparent glass-etched
strictly 2D pore networks (14.5 cm length) to estimate
the longitudinal and transversal dispersion coeffi-
cients as functions of the Peclet number. They
monitored the pH-indicator based color changes
during the mixing of two different HCl solutions.
pH changes are induced by dispersive mixing of the
more concentrated acid solution (0.43 M) with the
more dilute one (0.03 M). At these concentrations
the HCl solutions are completely dissociated (as H30þ
and Cl2), and pH depends only on dilution by
dispersion.
Oates (2003) used a complexation reaction
between molybdate and a chelating agent with the
commercial name Tiron (1,2-dihydroxybenzene-3,5-
disulfonic acid), which is colourless in aqueous
solution, to investigate plume fringe mixing. At a
certain pH range (6 , pH , 7) molybdate (Mo)
exists as mono-anions, MoO422, which are colourless
in solution. Tiron (Ti) will chelate up to two
molybdate anions in two consecutive steps:
Ti þ Mo ¼ TiMo
TiMo þ Mo ¼ TiMo2
In the experiments, Tiron (0.05 M) and molybdate
(0.025 M) were mixed and buffered at pH 6.1 using
succinate (0.13 M). pH was adjusted with NaOH to
T. Ptak et al. / Journal of Hydrology 294 (2004) 122–163 149

a final pH of 6.1. The mixing of the two clear solutions
produces a wine-red solution, which progressively
appears orange and then yellow as the solution gets
diluted by dispersion. The reaction products can be
optically quantified using absorbance spectrometry.
This tracer technology is presently being tested,
improved and implemented for different plume and
subsurface scenarios. The resulting mixing par-
ameters will be used for numerical reactive transport
modelling, and the predicted plume development will
be compared with field observations.
4. Example of tracer test data application in the
context of stochastic simulations: modelling
of non-reactive and reactive tracer transport in
heterogeneous aquifers based on a geostatistical
facies approach
An appropriate modelling approach, suitable for
the simulation of solute transport within hetero-
geneous aquifers, has to render the observed scale
dependence of (non-reactive and reactive) transport
parameters, for instance macrodispersivities or field-
scale retardation factors. It should be able to upscale
measurements (for example effective parameters from
tests at small-scale (order of cm to m) to a larger
intermediate scale (order of 100 m)), and it should not
require a priori equations for the scale dependence of
the effective retardation factor, or of other parameters
describing reactive transport. The reason is that the
formulation of such equations is generally difficult in
practice, requiring costly measurements, and the
equation parameters are mostly only valid for the
specific site and the transport scales investigated.
The modelling approach should also account for
concentration dependent distribution coefficients, i.e.
non-linear sorption isotherms, or kinetic reactive
processes, such as e.g. intraparticle diffusion and
sorption within intraparticle pores.
Simulation results should also be possible for the
near-source, non-ergodic stage of solute plume
development, where single realizations of the trans-
port process are likely to deviate from the ensemble
mean behavior (which can for example be described
using closed form solutions from stochastic theory).
Near-source transport problems, where the
solutes travelled only a few correlation lengths of
the subsurface structure, are especially relevant for the
planning of aquifer remediation activities. The
modelling approach should finally account for
the remaining parameter uncertainty due to the fact,
that a deterministic description of the aquifer
parameter distribution is practically impossible in
the case of heterogeneous aquifers.
In a three-dimensional numerical Monte Carlo type
stochastic flow and transport modelling framework,
the above restrictions do not apply. Complex
boundary conditions and flow fields can be con-
sidered, and principally any type of reactive processes
can be introduced, independent of the complexity of
mathematical process descriptions. Due to its flexi-
bility and advantages, a Monte Carlo type numerical-
stochastic modelling approach, summarized in the
following, was developed for modelling of flow and
(non-reactive and reactive) transport in heterogeneous
porous aquifers.
4.1. Separation of aquifer material into lithological
components and grain size fractions for laboratory
experiments to estimate hydrogeochemical aquifer
parameters
In stochastic reactive transport modelling studies,
chemical aquifer properties are often treated as
constants, or introduced using (theoretical) relation-
ships describing a correlation of hydraulic conduc-
tivity and chemical parameters (e.g. Cvetkovic and
Shapiro, 1990; Bellin et al., 1993; Tompson, 1993;
Burr et al., 1994; Bellin and Rinaldo, 1995; Bosma
et al., 1996; Miralles-Wilhelm and Gelhar, 1996;
Tompson et al., 1996). However, it is generally very
difficult to establish such correlation relationships
from measurements. Another serious drawback of
using simple correlation relationships is that the
chemical parameter field is forced to have the same
structural properties like the hydraulic conductivity
field. This outcome may be not justified, since it is
well known that aquifer sediments are in general a
heterogeneous mixture of different lithocomponents
and different grain size fractions (e.g. Grathwohl and
Kleineidam, 1995), and that both the lithological
composition and the grain size may affect the
interaction of reactive solutes with the aquifer
material and therefore control reactive transport
behavior.
T. Ptak et al. / Journal of Hydrology 294 (2004) 122–163150

An approach to correctly describe the interaction of
reactive solutes with the aquifer material, may be
based on decomposing of aquifer material into
lithological components and grain size fractions and
performing laboratory batch experiments. Using this
approach, hydrogeochemical aquifer parameters are
characterized as functions of grain size and lithologi-
cal properties.
The batch experiments allow the investigation of
sorption kinetics, measurement of sorption isotherms
and derivation of point scale hydrogeochemical and
transport parameters (for example apparent diffusion
coefficients, retardation factors). Relationships of
hydrogeochemical parameters and characteristic
properties of the aquifer material can be established
and introduced into (stochastic) flow and transport
models (Ptak, 1997a).
The separation approach was applied for organic
contaminants (Grathwohl and Kleineidam, 1995;
Karapanagioti et al., 1999; Kleineidam et al., 1999;
Rugner et al., 1999; Ptak and Liedl, 2002), where the
dominant reactive process is intraparticle diffusion, as
well as for fluorescent tracers (Ptak and Strobel,
1998), being sorbed on mineral surfaces. As an
example, Fig. 16 shows the sorption isotherms
(Freundlich type) for the fluorescent tracer Rhoda-
mine WT.
If the sorption parameters are known for each
lithocomponent, and if the typical lithological compo-
sition is known for each grain size class, it is possible to
describe the sorption behavior of solutes in the bulk
sample (Grathwohl and Kleineidam, 1995). Using
aquifer material from the Neckar River valley in
Stuttgart, Germany, it could be shown, that the
lithological composition of a grain size class is
independent of the sedimentological facies (sand,
gravel, etc.) where the sample was taken from. This
strongly simplifies the characterization of hydrogeo-
chemical aquifer properties. If the relation of grain size
and lithological composition has been established for a
specific type of aquifer, then the hydrogeochemical
properties and their spatial distribution can be estimated
from the relatively easily to be obtained grain size
distribution curves (Ptak, 1997a; Herfort et al., 1998).
4.2. Numerical-stochastic simulations based on
categorical (facies) variables
The Monte Carlo type transport modelling tech-
nique comprises three main steps. First, a geostatis-
Fig. 16. Example of sorption isotherms of Rhodamine WT for different lithocomponents obtained from a 2–4 mm grain size fraction (Ptak and
Strobel, 1998).
T. Ptak et al. / Journal of Hydrology 294 (2004) 122–163 151

tical analysis of grain size distribution curves obtained
from aquifer material core samples is performed.
Second, equiprobable three-dimensional realizations
of the spatial distribution of grain size distribution
curves are generated using an indicator-based geos-
tatistical simulation approach. From the simulated
grain size distribution curves, obtained at each nodal
position of the simulation domain, local hydraulic
conductivity values and chemical aquifer parameters
are estimated. Third, flow and transport simulations
are performed within each generated aquifer realiz-
ation, with initial and boundary conditions and
geometry according to the field situation. This yields
again an ensemble of realizations of both non-reactive
and reactive transport process outcomes, which can be
compared for instance with field measurements. The
three steps are described more detailed in the
following and summarized in Fig. 17 for the example
of instantaneous surface sorption.
4.2.1. Geostatistical analysis of grain size distribution
curves
In a heterogeneous aquifer, usually different
sedimentary texture classes with different degrees of
spatial continuity like for instance gravel, sand, clay
etc. can be identified. Instead of analyzing hydraulic
conductivities, data on the sedimentary texture can be
used directly for an indicator-based structural analysis
of the aquifer as well. Since sedimentary structural
elements respective sedimentological facies are
considered directly, it is believed that this approach
is more related to geology compared to an analysis
based on derived physical properties of the aquifer
material.
To classify sedimentary texture, categorical vari-
ables may be defined based on measured grain size
distribution curves. These categorical variables
describe qualitative attributes of the individual aquifer
material samples, respective the type of sedimentolo-
gical facies, i.e. they indicate if a sample contains
gravel, or sand etc. In the analysis, out of the ensemble
of N measured grain size distribution curves (obser-
vations), curves with similar properties are clustered
into M groups (M clusters) with the multivariate
statistical method of K-means clustering (McQueen,
1967). Each grain size distribution curve is discretized
into P classes, represented by class variables, which
describe the mass fractional contributions of individual
grain size fractions to the total sample mass (Fig. 17).
After clustering, binary categorical variables
ðcluster1 2 clusterMÞ are defined for each observation.
Since categorical variables are exclusive, one of these
M variables is assigned the value 1 and the remaining
are assigned the value 0, thus yielding M binary data
sets, one for each cluster. Then, the statistics (mean
and variance) of the P class variables are computed for
each of the M clusters.
Subsequently, the spatial correlation of the M
categorical variables is investigated by computing
experimental indicator variograms and fitting vario-
gram models in vertical and horizontal directions
(Fig. 17).
4.2.2. Generation of three-dimensional hydraulic
conductivity and chemical parameter fields
In the next step, the experimental histogram of the
clusters ðcluster1 2 clusterMÞ and the cluster vario-
gram models are used to generate Q equiprobable
three-dimensional realizations of the categorical
variable (facies) field. The conditional sequential
indicator simulation method (SIS) for categorical
variables (Deutsch and Journel, 1992) is applied.
Compared to Gaussian approaches, the advantage of
indicator-based approaches is that they offer the
possibility to consider more than one covariance
structure and therefore to better represent structural
properties of extreme values within the pdf. It is no
more required to assume, in contrary to sedimentolo-
gical expert knowledge, that aquifer portions with
different hydraulic properties, i.e. high conductivity
gravel zones forming preferential flow paths and low
conductivity silt/clay zones forming flow barriers,
have the same spatial structure. With the indicator
approach, analysis and simulation is no more
restricted to a log–normal type of pdf.
Each cluster from the simulated categorical
variable field represents a mean grain size distri-
bution curve (Fig. 17), consisting of the means of the
P class variables. The means of these class variables
are then perturbed with a normally distributed
random component following the individual class
variable statistics estimated from the measurements.
The resulting simulated grain size distribution curves
are then evaluated in terms of local hydraulic
T. Ptak et al. / Journal of Hydrology 294 (2004) 122–163152
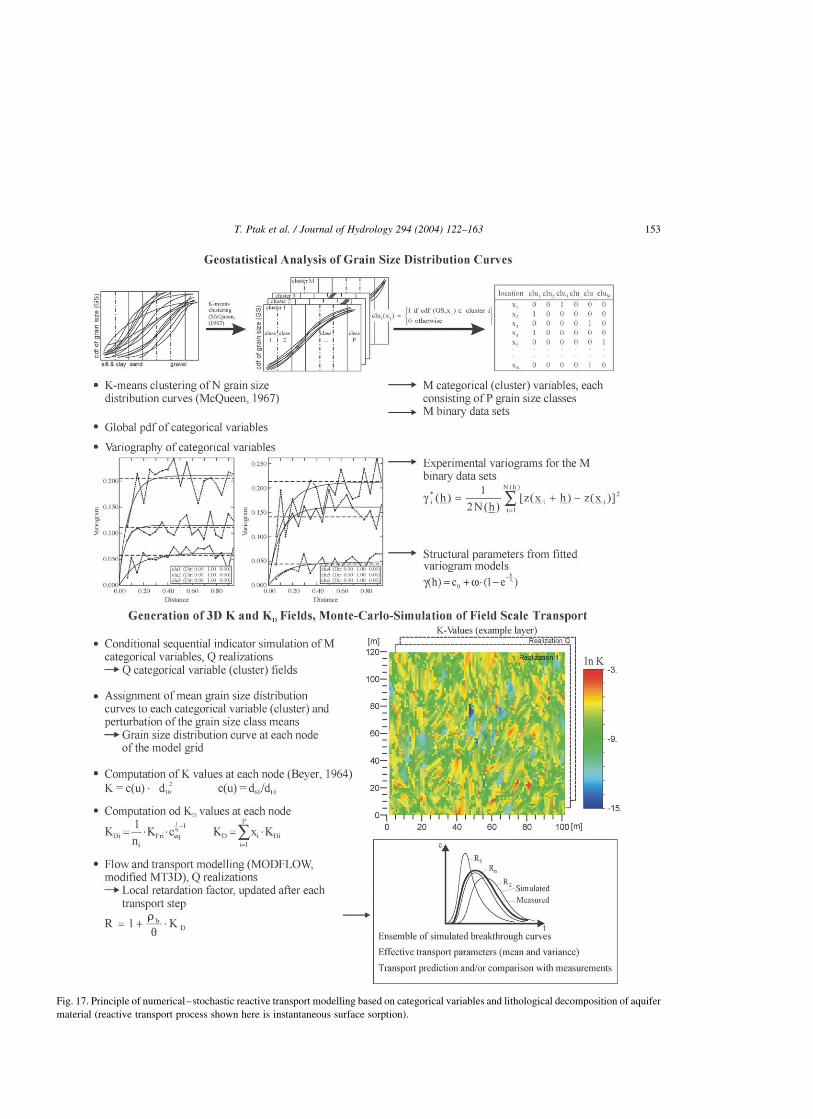
Fig. 17. Principle of numerical–stochastic reactive transport modelling based on categorical variables and lithological decomposition of aquifer
material (reactive transport process shown here is instantaneous surface sorption).
T. Ptak et al. / Journal of Hydrology 294 (2004) 122–163 153
conductivity values K and local chemical
parameters.
In case of the example shown in Fig. 17, which
deals with the stochastic simulation of the Fluor-
esceine and Rhodamine WT multitracer forced
gradient transport experiment in a radially conver-
ging flow field and a transport distance of 8.9 m
(see above), hydraulic conductivity K was obtained
using Beyer’s (1964) empirical relationship
between hydraulic conductivity and grain size
distribution.
The reactive process investigated was instan-
taneous surface sorption of a reactive tracer
(Rhodamine WT) onto mineral surfaces (see also
sections above). Using the approach of decomposing
the aquifer material into different grain size frac-
tions and lithocomponents, it could be shown for
Rhodamine WT and the aquifer material investi-
gated, that it was not necessary to regard the
lithological composition as an aquifer property
controlling the sorption process (see also above).
A relationship describing the distribution coefficient
KDi of a grain size class i could be established based
on a Freundlich isotherm model (Fig. 17). The local
effective KD value at each node of the model
domain was then obtained using a weighting
function for the individual contributions KDi shown
in Fig. 17 (xi is the mass fractional contribution of
each grain size fraction i to the total sample mass).
To illustrate the simulation results, Fig. 17 also
shows a section from a layer of the generated
hydraulic conductivity field, where the heterogeneity
and the structural anisotropy obtained from the SIS
simulation can be recognized.
4.2.3. Flow and transport simulations
In this step of the Monte Carlo approach, flow and
transport is computed for each aquifer realization, i.e.
for each three-dimensional hydraulic conductivity/
chemical parameter field, in order to obtain a
stochastic ensemble of results for transport predic-
tions and/or comparison with transport measurements.
In the multitracer forced gradient transport exper-
iment discussed here, the two tracers, Fluoresceine
(non-reactive) and Rhodamine WT (reactive), were
injected simultaneously into the same monitoring
well. According to the conditions within the field test,
a steady state flow field was computed for each
stochastic aquifer realization first, using the program
code MODFLOW (McDonald and Harbaugh, 1984).
Subsequently, for each aquifer realization break-
through curves were simulated at the pumping well
for Fluoresceine without sorption and for Rhodamine
WT with sorption, using an extended version of the
program MT3D (Zheng, 1991). Simulation routines
were added to the MT3D code to consider the grain
size based description of the sorption process, which
is finally introduced by a retardation factor R (Fig. 17;
rb is the bulk density and u is the porosity). The
retardation factor is updated after each transport step
due to its concentration dependence. A variable
effective porosity, following a correlation function
of porosity (estimated from permeameter measure-
ments) with hydraulic conductivity, was used for the
transport calculations.
It should be mentioned here, that principally any
reactive transport process such as intraparticle diffu-
sion and sorption within intraparticle pore space (Ptak
and Liedl, 2002), or (bio-)degradation etc. can be
simulated using this new approach, depending on the
transport model code used. And of course lithological
properties can be introduced as well, if for instance the
relation of grain size class and lithological compo-
sition has been established for a specific type of
aquifer (Herfort et al., 1998).
To give an example of results from the forward
simulation based on measured input parameters,
Fig. 18 shows for both tracers Fluoresceine and
Rhodamine WT the comparison of measured and
simulated vertical profiles of peak concentration
values at the pumping well.
A problem arises in the comparison of numerical
stochastic transport simulation results with field tracer
test measurements due the fact, that a single
realization outcome, i.e. the measurements, have to
be compared with a stochastically simulated ensem-
ble. It has to be considered that within a highly
heterogeneous aquifer at the small to intermediate,
near-source transport scale investigated here, an
ergodic stage of solute plume development cannot
be expected. Therefore single realizations of the
transport process are likely to deviate from the
ensemble mean behavior. Another difficulty to be
managed is that due to the usually limited number of
concentration measurement locations, in highly het-
erogeneous aquifers a computation of concentration
T. Ptak et al. / Journal of Hydrology 294 (2004) 122–163154

isolines or spatial moments cannot be performed
reliably enough. Therefore, the comparison of simu-
lated and measured tracer transport was performed
using breakthrough curves. This model testing
approach is based on effective transport parameters
obtained from breakthrough curves either directly
(peak concentration, peak concentration arrival time
etc.), or from the calculation of temporal moments, or
from fitting analytical solutions to the breakthrough
curves (mean transport velocity, longitudinal disper-
sivity, etc.). Each measured and numerically simu-
lated breakthrough curve is evaluated individually.
Then, effective transport parameters derived from one
measured breakthrough curve are compared with a
stochastic ensemble of breakthrough curve par-
ameters, which were numerically simulated at
locations within the model domain corresponding to
the measurement positions within the field tracer test.
The variance of a parameter within the simulated
ensemble is a measure of model input uncertainty.
Aquifer heterogeneity is evident from a spatial
variability of the transport parameters.
A numerical stochastic model outcome in a non-
ergodic transport situation can be regarded as
satisfying and reliable, if the measured parameter
values are within the stochastically simulated ensem-
ble, and if the outcome is unbiased, i.e. if there is no
systematic deviation of simulated and measured
parameter values. Deviation measures can be defined
to test this condition (e.g. Ptak, 1997b). With respect
to prediction capability, one would like the most
frequently simulated parameter value (which is the
ensemble mean in case of a symmetric distribution) to
come close to the actually measured value. However,
as explained before a stochastic simulation under non-
ergodic conditions cannot be rejected as wrong if this
condition is not fulfilled.
In Fig. 18 the measured peak concentration values
are mostly close to the arithmetic ensemble means and
mostly within the range of the numerically simulated
concentration values. A deviation of measured trans-
port parameters from their corresponding stochastic
arithmetic ensemble means can be expected, because
the measurements were performed in a near source,
non-ergodic stage of tracer plume development. The
measured concentrations tend to be smaller compared
to the simulated ensemble means. The deviations are
larger for Fluoresceine. This might be caused by
biodegradation of Fluoresceine, which was already
observed in former tracer experiments (e.g. Kass,
1998). The prediction uncertainty is smaller for
Rhodamine WT compared to Fluoresceine. A possible
reason for this is the enhanced spread of the Rhodamine
WT plume due to sorption, which is recognized from
Fig. 18. Example of comparison of measured and simulated breakthrough curve peak concentrations (Ptak, 1997a).
T. Ptak et al. / Journal of Hydrology 294 (2004) 122–163 155

the normalized second central temporal moments of the
Rhodamine WT breakthrough curves, being about
a factor 12 higher compared to Fluoresceine. Due to the
enhanced spread of the Rhodamine WT plume, its
irregularities, caused by aquifer heterogeneity, are
already more averaged out compared with the Fluor-
esceine plume. Similar results can be obtained also for
another effective transport parameters.
Following the simulation results, it is believed that
the flexible numerical stochastic transport simulation
technique based on facies characterization and
categorical variables can be successfully applied in
highly heterogeneous porous aquifers. The geostatis-
tical approach using sequential indicator simulation of
categorical variables allows the generation of
spatially variable hydraulic conductivity and chemical
parameter fields, without the need for a priori
correlation functions of hydraulic conductivity and
chemical parameters, or for assumptions about the
spatial structure of chemical parameters. The stochas-
tic simulation technique presented therefore offers a
broad field of applications.
5. Conclusions
The described tracer test methods offer a lot of
application possibilities. The recorded multilevel–
multitracer breakthrough curves can for example
serve to estimate aquifer transport parameters, to
characterize subsurface heterogeneity and subsurface
structure at different scales, to identify potential
contamination pathways, to delineate wellhead pro-
tection zones and, to perform upscaling studies, to test
and condition transport predictions obtained from
deterministic or stochastic model approaches, to
provide a database for development and testing of
new modelling approaches etc. Using the proposed
multilevel–multitracer set-up, information with a
high temporal and spatial resolution can be obtained
at acceptable expenses.
New reactive tracers, applied in a multitracer set-
up together with non-reactive tracers, allow the
characterization of reactive transport processes in
the subsurface and of residual NAPL phases. Due to
the possibility of using practically an unlimited
number of different tracers with a very low detection
limit within one multitracer experiment, quantitative
DNA tracing may become a powerful tool for (three-
dimensional) subsurface investigation at a variety of
transport scales. More detailed laboratory and field
experiments are needed to achieve a comprehensive
understanding and quantification of the (reactive)
tracer–aquifer material interaction processes and to
establish evaluation procedures and modelling tools
for the interpretation of the measurements.
Following the experiences, it is believed that the
flexible numerical Monte Carlo type stochastic
transport simulation technique based on categorical
variables can be successfully applied in hydraulically
and hydrogeochemically highly heterogeneous porous
aquifers. The geostatistical approach using sequential
indicator simulation of categorical variables (facies)
allows the generation of spatially variable hydraulic
conductivity, porosity and hydrogeochemical par-
ameter fields, without the need for an apriori
correlation function of hydraulic conductivities and
parameters characterizing reactive transport such as
e.g. distribution coefficients. The stochastic simu-
lation technique can consider multiple reactive
transport processes, e.g. surface sorption, diffusion,
(bio-)degradation, dissolution etc. It therefore offers
many possibilities of further development and appli-
cations, for example for the testing of upscaling of
laboratory measurements to the field-scale, for the
investigation of scale dependence of effective par-
ameters describing reactive transport, or for the
planning of remediation activities.
The research and development activities may yield
a set of subsurface investigation and modelling tools,
which can be finally applied by industry and
consultants as standard methods in hydrogeological
practice.
Acknowledgements
The authors greatly acknowledge the financial
support by the Projekt Wasser-Abfall-Boden (PWAB)
Baden-Wurttemberg, by the German Science Foun-
dation (DFG priority program 546: ‘Geochemical
processes with long-term effects in anthropogenically
affected seepage- and groundwater’), grant GR 971/6,
and by the EU, contract No. EVK1-CT-1999-00041.
T. Ptak et al. / Journal of Hydrology 294 (2004) 122–163156

References
Aardema, B.W., Lorenz, M.G., Krumbein, W.E., 1983. Protection
of sediment-adsorbed transformation DNA against enzymatic
inactivation. Appl. Environ. Microbiol. 46, 417–420.
Adams, E.E., Gelhar, L.W., 1992. Field study of dispersion in a
heterogeneous aquifer. 2. Spatial moments analysis. Water
Resour. Res. 28(12), 3293–3307.
Adamson, A.W., 1982. Physical Chemistry of Surfaces, Wiley, New
York.
Alestrom, P., 1995. Novel method for chemical labelling of objects,
International Patent Application No. PCT/IB95/01144 and
Publication No. WO 96/17954.
Annable, M.D., Jawitz, J.W., Rao, P.S.C., Dai, D.P., Kim, H.K.,
Wood, A.L., 1998a. Field evaluation of interfacial and
partitioning tracers for characterization of effective NAPL–
water contact areas. Ground Water 36(3), 495–502.
Annable, M.D., Rao, P.S.C., Hatfield, K., Graham, W.D., Wood,
A.L., Enfield, C.G., 1998b. Partitioning tracers for measuring
residual NAPL: field-scale test results. J. Environ. Engng
124(6), 498–503.
Anwar, A.H.M.F., Bettahar, M., Madzubayashi, U., 2000. A method
for determining air/water interfacial area in variably saturated
porous media. J. Contam. Hydrol. 43, 129–146.
Ball, W.P., Roberts, P.V., 1991. Long-term sorption of halogenated
organic chemicals by aquifer material. 2. Intraparticle diffusion.
Environ. Sci. Technol. 25, 1237–1249.
Barry, D.A., Sposito, G., 1990. Three-dimensional statistical
moment analysis of the Stanford/Waterloo Borden tracer data.
Water Resour. Res. 26(8), 1735–1747.
Behrens, H., 1982. Verfahren zum quantitativen Nachweis von
nebeneinander vorliegenden Fluoreszenztracern (Method to
quantify mixtures of fluorescent tracers). Beitr. Geol.
Schweiz—Hydrol. 28(I), 39.5.
Bellin, A., Rinaldo, A., 1995. Analytical solutions for transport of
linearly adsorbing solutes in heterogeneous formations. Water
Resour. Res. 31(6), 1505–1511.
Bellin, A., Rinaldo, A., Bosma, W.J.P., van der Zee, S.E.A.T.M.,
Rubin, Y., 1993. Linear equilibrium adsorbing solute transport
in physically and chemically heterogeneous porous formations.
1. Analytical solutions. Water Resour. Res. 29(12), 4019–4030.
Beyer, W., 1964. Zur Beschreibung der Wasserdurchlassigkeit von
Kiesen und Sanden. Zeitschr. f. Wasserwirtschaft-Wassertech-
nik 14, 165–168.
Bockelmann, A., Zamfirescu, D., Ptak, T., Grathwohl, P., Teutsch,
G., 2003. Quantification of mass fluxes and natural attenuation
rates at an industrial site with a limited monitoring network: a
case study. J. Contam. Hydrol. 60, 97–121.
Boggs, J.M., Young, S.C., Beard, L.M., Gelhar, L.W., Rehfeldt,
K.R., Adams, E.E., 1992. Field study of dispersion in a
heterogeneous aquifer. 1. Overview and site description.
Water Resour. Res. 28, 3281–3291.
Bosel, D., Herfort, M., Ptak, T., Teutsch, G., 2000. Design,
performance, evaluation and modeling of a natural gradient
multitracer transport experiment in a contaminated heterogeneous
porous aquifer. Tracers and Modelling in Hydrogeology, IAHS
Publication No. 262, ISBN. 1-901502-21-X, pp. 45–51.
Bosma, W.J.P., van der Zee, S.E.A.T.M., van Duijn, C.J., 1996.
Plume development of a nonlinearly adsorbing solute in
heterogeneous porous formations. Water Resour. Res. 32(6),
1569–1584.
Brooks, M.C., Annable, M.D., Rao, P.S.C., Hatfield, K., Jawitz,
J.W., Wise, W.R., Wood, A.J., Enfield, C.G., 2002. Controlled
release, blind tests of DNAPL charcterization using partitioning
tracers. J. Contam. Hydrol. 59, 187–210.
Brouyere, S., 2000. Modelling the injection of a tracer in a well: a
new mathematical and numerical approach. Tracers and
Modelling in Hydrogeology, IAHS Publication No. 262,
ISBN. 1-901502-21-X, pp. 25-31.
Brown, C.L., Pope, G.A., Abriola, L.M., Sepehrnoori, K., 1994.
Simulation of surfactant-enhanced aquifer remediation. Water
Resour. Res. 30(2), 2959–2977.
Brusseau, M.L., 1992. Transport of rate-limited sorbing solutes in
heterogeneous porous media: application of a one-dimensional
multi-factor nonideality model to field data. Water Resour. Res.
28(9), 2485–2497.
Brusseau, M.L., Srivastava, R., 1997. Nonideal transport of reactive
solutes in heterogeneous porous media. 2. Quantitative analysis
of the Borden natural-gradient field experiment. J. Contam.
Hydrol. 28, 115–155.
Burr, D.T., Sudicky, E.A., Naff, R.L., 1994. Nonreactive and
reactive solute transport in three-dimensional heterogeneous
porous media: Mean displacement, plume spreading, and
uncertainty. Water Resour. Res. 30(3), 791–815.
Cain, R.B., Johnson, G.R., McCray, J.E., Blanford, W.J., Brusseau,
M.L., 2000. Partitioning Tracer tests for evaluating remediation
performance. Ground Water 38(5), 752–761.
Chen, J.-S., Chen, Ch.-S., Gau, H.-S., Liu, Ch.-W., 1999. A two-
well method to evaluate transverse dispersivity for tracer tests in
a radially convergent flow field. J. Hydrol. 223, 175–197.
Chen, L., Knox, R.C., 1997. Using vertical circulation wells for
partitioning tracer tests and remediation of DNAPLs. Ground.
Water. Monit. Remediat. 17(3), 161–168.see also pp. 1069-
3629.
Colleuille, H., Kitterod, N.O., 1998. Forurensning av drikkevanns-
bronn pa Sundreoya I Al kommune. Resultat av sporstoff-
forsok, Norwegian Water Resources and Energy Directorate
Report 18 (in Norwegian).
Courtois, N., Gerbaux-Francois, O., Grenier, C., Maugis, P.,
Mouche, E., de Fouquet, C., Goblet, P., Ledoux, E., 2000.
Characterization of dispersion in an alluvial aquifer by tracing
techniques and stochastic modelling, Calibration and Reliability
in Groundwater Modelling (Proceedings of the ModelCARE 99
Conference held at Zurich, Switzerland, September 1999),
IAHS Publ. No. 265, 2000.
Cvetkovic, V., Dagan, G., 1994. Transport of Kinetically sorbing
solute by steady random velocity in heterogeneous porous
formations. J. Fluid. Mech., 265, 189–215
Cvetkovic, V.D., Shapiro, A.M., 1990. Mass arrival of sorptive
solute in heterogeneous porous media. Water Resour. Res.
26(9), 2057–2067.
Dagan, G., 1989. Flow and Transport in Porous Formations,
Springer, Berlin.
T. Ptak et al. / Journal of Hydrology 294 (2004) 122–163 157

Dagan, G., 1990. Transport in heterogeneous porus formations:
Spatial moments, ergodicity, and effective dispersion. Water
Resour. Res. 26(6), 1281–1290.
Dai, D., Barrango, J.R., F, T., Illangasekare, T.H., 2001. Partition-
ing and Interfacial tracers for differentiating NAPL entrapment
configuration: column scale investigation. Environ. Sci. Tech-
nol. 35(24), 4894–4899.
Davis, B.M., Istok, J.D., Semprini, L., 2002. Push–pull partitioning
tracer tests using radon-222 to quantify non-aqueous phase
liquid contamination. J. Contam. Hydrol. 58, 129–146.
Davis, J.A., Hess, K.M., Coston, J.A., Kent, D.B., Joye, J.L.,
Brienen, P., Campo, K.W., 2001. Multispecies reactive tracer
test in a sand and gravel aquifer, Cape Cod, Massachusetts—
Part I. Experimental design and transport of bromide and nickel-
EDTA tracers. US Environmental Protection Agency, Office of
Research and Development, EPA/600/R-01/007a, 38 p.
Davis, J.A., Coston, J.A., Kent, D.B., Hess, K.M., Joye, J.L.,
Brienen, P., and Campo, K.W., 2001. Multispecies reactive
tracer test in a sand and gravel aquifer, Cape Cod, Massachu-
setts—Part II. Transport of chromium (VI) and lead-, copper-,
and zinc-EDTA tracers. US Environmental Protection Agency,
Office of Research and Development, EPA/600/R-01/007b, 47
p.
Deeds, N., Pope, G.A., McKinney, G.C., 1999. Vadose Zone
characterisation at a contaminated field site using partitioning
interwell tracer technology. Environ. Sci. Technol. 33(16),
2745–2751.
Deeds, N.E., McKinney, D.C., Pope, G.A., 2000. Laboratory
characterization of non-aqueous phase liquid/tracer interaction
in support of a vadose zone partitioning interwell tracer test.
J. Contam. Hydrol. 41, 193–204.
Delshad, M., Pope, G.A., Sepehrnoori, M., 1996. A compositional
simulater for modelling surfactant-enhanced aquifer remedia-
tion. J. Contam. Hydrol. 23, 303–327.
Deutsch, C.V., Journel, A.G., 1992. GSLIB Geostatistical Software
Library and User’s Guide, Oxford University Press, New York,
340 pp..
Di Federico, V., Neuman, S.P., 1998. Transport in multiscale log
conductivity fields with truncated power variograms. Water
Resour. Res. 34(5), 963–973.
Domenico, P.A., Schwartz, F.W., 1990. Physical and Chemical
Hydrogeology, Wiley, New York.
Earnshaw, G.C., Johnson, E.G., Carroll, B.G., Doyle, P.G., 1996.
The drop volume method for interfacial tension determination:
an error analysis. J. Colloid Interface Sci. 177, 150–155.
Ezzedine, S., Rubin, Y., 1996. A geostatistical approach to the
cinditional estimation of spatially distributed solute concen-
tration and notes on the use of tracer data in the inverse problem.
Water Resour. Res. 32(4), 853–861.
Ezzedine, S., Rubin, Y., 1997. Analysis of the Cape Cod tracer data.
Water Resour. Res. 33(1), 1–11.
Feehley, C.E., Zheng, C., Molz, F.J., 2000. A dual-domain mass
transfer approach for modeling solute transport in hetero-
geneous porous media—application to the MADE site. Water
Resour. Res. 36(9), 2501–2515.
Fernandez-Garcia, D., Sanchez-Villa, X., Illangasekare, T.H., 2002.
Convergent-flow tracer tests in heterogeneous media: combined
experimental–numerical analysis for determination of equival-
ent transport parameters. J. Contam. Hydrol. 57, 129–145.
Fetter, C.W., 1993. Contaminant Hydrogeology, McMillan, New
York.
Finkel, M., Liedl, R., Teutsch, G., 1997. Modelling coupled reactive
transport of PAH and surfactants. In: McDonald, A.D.,
McAleer, M. (Eds.), MODSIM97, International Congress on
Modelling and Simulation, Proceedings, vol. 2., pp. 566–571.
Fiori, A., 1998. Computation of concentration statistical moments in
aquifer transport: Approximations and application to field
experiments. In: Herbert, M., Kovar, K. (Eds.), Groundwater
Quality: Remediation and Protection, vol. 250. IAHS, pp.
559–565.
Freyberg, D.L., 1986. A natural gradient experiment on solute
transport in a sand aquifer: 2. Spatial moments and the advection
and dispersion of nonreactive tracers. Water Resour. Res. 22,
2069–2082.
Fried, J.J., 1975. Groundwater Pollution, Elsevier, Amsterdam, 330 p.
Garabedian, S.P., LeBlanc, D., Gelhar, L.W., Celia, M.A., 1991.
Large-scale natural gradient tracer test in sand and gravel. Cape
Cod, Massachusetts: 2. Analysis of spatial moments for a
nonreactive tracer. Water Resour. Res. 27(5), 911–924.
Gelhar, L.W., 1986. Stochastic subsurface hydrology from theory to
applications. Water Resour. Res. 22(9), 135S–145S.
Gelhar, L.W., 1993. Stochastic Subsurface Hydrology, Prentice
Hall, Englewood Cliffs.
Gelhar, L.W., Axness, C.L., 1983. Three dimensional stochastic
analysis of macrodispersion in aquifers. Water Resour. Res.
19(1), 161–180.
Gelhar, L.W., Welty, C., Rehfeldt, K.R., 1992. A critical review of
data on field-scale dispersion in aquifers. Water Resour. Res.
28(7), 1955–1974.
Gierke, J.S., Sanders, D.L., Perram, D.L., 1999. Laboratory studies
of aqueous partitioning tracer tests for measuring nonaqueous
phase liquid volumes. Water Environ. Res. 71(4), 465–474.
Goltz, M.N., Roberts, P.V., 1987. Using the method of moments to
analyze three-dimensional diffusion-limited solute transport
from temporal and spatial perspectives. Water Resour. Res.
23(8), 1575–1585.
Goltz, M.N., Roberts, P.V., 1988. Simulations of physical none-
quilibrium solute transport models: application to a large-scale
field experiment. J. Contam. Hydrol. 3(1), 37–63.
Gramlin, C.M., Harvey, C.F., Meigs, L.C., 2002. Reactive transport
in porous media: a comparison of model prediction with
laboratory visualization. Environ. Sci. Technol. 36, 2508–2514.
Grathwohl, P., Kleineidam, S., 1995. Impact of heterogeneous
aquifer materials on sorption capacities and sorption dynamics
of organic contaminants, Groundwater Quality: Remediation
and Protection, IAHS Publ. 225, pp. 79–86.
Grathwohl, P., Klenk, I.D., Eberhardt, C., Maier, U., 2001. Steady
State Plumes: Mechanisms of Transverse Mixing in Aquifers.
In: Seiler, Wohnlich (Eds.), New approaches Characterizing
Groundwater Flow, Proceedings of the XXXI IAH Congress,
Munich, 10-14 Sept, Balkema, pp. 89–93.
Haggerty, R., Schroth, M.H., Istok, J.D., 1998. Simplified method of
push–pull test data analysis for determining in situ reaction rate
coefficients. Ground Water 36(2), 314–324.
T. Ptak et al. / Journal of Hydrology 294 (2004) 122–163158

Hall, S.H., 1993. Single well tracer tests in aquifer characterisation.
Groundwater Monitoring and Remediation Spring 1993,
118–124.
Hall, S.H., 1996. Practical single well tracer methods for aquifer
testing. Workshop at the 10th National Outdoor Action
Conference and Exposition, May 1996, Las Vegas.
Harvey, C., Gorelick, S.M., 2000. Rate-limited mass transfer or
macrodispersion: which dominates plume evolution at the
Macrodispersion Experiment (MADE) site? Water Resour.
Res. 36(3), 637.
Herfort, M., Ptak, T., 2002. Multitracer-Versuch im kontaminierten
Grundwasser des Testfeldes Sud. Grundwasser 1(7), 31–40.
Herfort, M., Ptak, T., Hummer, O., Teutsch, G., Dahmke, A., 1998.
Testfeld Sud: Einrichtung der Testfeldinfrastruktur und Erkun-
dung hydraulisch-hydrogeochemischer Parameter des Grund-
wasserleiters. Grundwasser 3(4), 159–166.
Hess, K.M., 1989. Use of a borehole flowmeter to determine spatial
heterogeneity of hydraulic conductivity and macrodispersion in
a sand and gravel aquifer, Cape Cod, Massachusetts. In: Molz,
F.J., Melville, J.G., Guven, O. (Eds.), Proceedings of the
Conference on New Field Techniques for Quantifying the
Physical and Chemical Properties of Heterogeneous Aquifers,
Dallas, Texas, March 20–23, 1989, National Water Well
Association, Dublin, OH, pp. 497–508.
Hess, K.M., Davis, J.A., Kent, D.B., Coston, J.A., 2002a. Multi-
species reactive tracer test in an aquifer with spatially variable
chemical conditions, Cape Cod, Massachusetts—Dispersive
transport of bromide and nickel. Water Resour. Res. 38(8),
36.1–36.17.
Hess, K.M., Davis, J.A., Kent, D.B., Coston, J.A., 2002b. Multi-
species reactive tracer test in an aquifer with spatially variable
chemical conditions, Cape Cod, Massachusetts: Dispersive
transport of bromide and nickel. Water Resour. Res. 38(8),
36.1–36.16.
Hess, K.M., Wolf, S.H., Celia, M.A., 1992. Large-scale natural
gradient tracer test in sand and gravel, Cape Cod, Massachu-
setts: 3. Hydraulic conductivity variability and calculated
macrodispersivities. Water Resour. Res. 28(8), 2011–2027.
Huang, W.E., Oswald, S.E., Lerner, D.N., Smith, C.C., Zheng, Ch.,
2003. Dissolved oxygen imaging in a porous medium to
investigate biodegradation in a plume with limited electron
acceptor supply. Environ. Sci. Technol. 37(9), 1905–1911.
Hunkeler, D., Hoehn, E., Hohener, P., Zeyer, J., 1997. 222Rn as a
partitioning tracer to detect diesel fuel contaminatio in aquifers:
laboratory study and field observations. Environ. Sci. Technol.
31(11), 3180–3187.
Imhoff, P.T., Pirestani, K., Jafapour, Y., Spivey, K.M., 2003. Tracer
interaction effects during partitioning tracer tests for NAPL
detection. Environ. Sci. Technol. 37(7), 1441–1447.
Istok, J.D., Humphrey, M.D., Schroth, M.H., Hyman, M.R.,
O’Reilly, K.T., 1997. Single-Well, push pull test for in situ
determination of microbial activities. Ground Water 35(4),
619–631.
Istok, J.D., Field, J.A., Schroth, M.H., Davis, B.M., Dwarakanath,
V., 2002. Single-well push–pull partitioning tracer tests for
NAPL detection in the subsurface. Environ. Sci. Technol.
36(12), 2708–2716.
James, A.I., Graham, W.D., Hatfield, K., Rao, P.S.C., 1997. Optimal
estimation of residual non-aqueous phase liquid saturations
using partitioning tracer concentration data. Water Resour. Res.
33(12), 2621–2636.
James, A.I., Graham, W.D., Hatfield, K., Rao, P.S.C., Annable,
M.D., 2000. Estimation of spatially variable residual
nonaqueous phase liquid saturation in nonuniform flow fields
using partitioning tracer data. Water Resour. Res. 36(4),
999–1012.
Jawitz, J.W., Sillan, R.K., Annable, M.D., Rao, P.S.C., Warner, K.,
2000. In situ alcohol flushing of a DNAPL source zone at a dry
cleaner site. Environ. Sci. Technol. 34(17), 3722–3729.
Jin, M., Delshad, M., Dwarakanath, V., McKinney, D.C., Pope,
G.A., Sepehrnoori, K., Tilburg, C.E., Jachson, R.E., 1995.
Partitioning tracer test for detection, estimation and remediation
performance assessment of subsurface nonaqueous phase
liquids. Water Resour. Res. 31(5), 1201–1211.
Jin, M., Butler, G.W., Jackson, R.E., Mariner, P.E., Pickens, J.F.,
Pope, G.A., Brown, C.L., McKinney, D.C., 1997. Sensitivity
models and design protocol for partitioning tracer tests in
alluvial aquifers. Ground Water 35(6), 964–972.
Karapanagioti, H.K., Sabatini, D.A., Kleineidam, S., Grathwohl, P.,
Ligouis, B., 1999. Phenanthrene sorption with heterogeneous
organic matter in a landfill aquifer material. Phys. Chem. Earth
B 24(6), 535–541.
Kass, W., 1998. Tracing Techniques in Geohydrology, A.A.
Balkema, Rotterdam.
Kim, H., Rao, P.S.C., Annable, M.D., 1997. Determination of
effective air–water interfacial area in partially saturated porous
media using surfactant adsorption. Water Resour. Res. 33(12),
2705–2711.
Kim, H., Rao, P.S.C., Annable, M.D., 1999. Consistency of the
interfacial tracer technique: experimental evaluation. J. Contam.
Hydrol. 40, 79–94.
Kleineidam, S., Rugner, H., Grathwohl, P., 1999. Impact of grain
scale heterogeneity on slow sorption kinetics. Environ. Toxic.
Chem. 18(8), 1673–1678.
Kleiner, K., 1997. Fluorimetrische Untersuchungen zur Analyse
von Multitracer-Proben und Tracer-Experimente zur Ermittlung
des Retardationsfaktors im Feldversuch, Diplomarbeit, Institut
fur Geologie und Palaontologie, Lehrstuhl fur Angewandte
Geologie, Universitat Tubingen.
Klingbeil, R., 1998. Outcrop analogue studies—Implications for
groundwater flow and contaminant transport in heterogeneous
glaciofluvial quaternary deposits, PhD Thesis, Faculty of
Geoscience, University of Tuebingen.
Knippers, R., 2001. Molekulare Genetik, Thieme, Stuttgart.
Kreft, A., Zuber, A., 1978. On the physical meaning of the
dispersion equation and its solutions for different initial
and boundary conditions. Chem. Engng Science 33,
1471–1480.
Kunstmann, H., Kinzelbach, W., Marschall, P., Li, G., 1997. Joint
inversion of tracer tests using reversed flow fields. J. Contam.
Hydrol. 26, 215–226.
LeBlanc, D.R., 2001. Density and recharge effects during the
Cape Cod natural-gradient tracer test. Massachusetts Institute
of Technology, Department of Civil and Environmental
T. Ptak et al. / Journal of Hydrology 294 (2004) 122–163 159

Engineering, Cambridge, Massachusetts, unpublished MS
thesis, 246 p.
LeBlanc, D.R., Garabedian, S.P., Quadri, R.D., Morin, R.H.,
Teasdale, W.E., Paillet, F.L., 1986. Hydrogeologic controls on
solute transport in a plume of sewage-contaminated ground
water. In: Ragone, S.E., (Ed.), US Geological Survey Program
on Toxic Waste—Groundwater Contamination, Proceedings of
the second technical meeting, Cape Cod, Massachusetts,
October 21–25, 1985, US Geological Survey Open-File Report
86-481, pp. B-7–B-12.
LeBlanc, D.R., Garabedian, S.P., Wood, W.W., Hess, K.M., Quadri,
R.D., 1987. Natural-gradient tracer test in sand and gravel—
Objective, approach, and overview of tracer movement. In:
Franks, B.J., (Ed.), US Geological Survey Program on Toxic
Waste—Groundwater Contamination, Proceedings of the third
technical meeting, Pensacola, Florida, March 23–27, 1987, US
Geological Survey Open-File Report 87-109, pp. B-9–B-12.
LeBlanc, D.R., Garabedian, S.P., Hess, K.M., Gelhar, L.W., Quadri,
R.D., Stollenwerk, K.G., Wood, W.W., 1991. Large-scale
natural-gradient tracer test in sand and gravel, Cape Cod,
Massachusetts-1, Experimental design and observed tracer
movement. Water Resour. Res. 27(5), 895–910.
LeBlanc, D.R., Hess, K.M., Kent, D.B., Smith, R.L., Barber, L.B.,
Stollenwerk, K.G., Campo, K.W., 1999. Natural restoration of a
sewage plume in a sand and gravel aquifer, Cape Cod,
Massachusetts. In: Morganwalp, D.W., Buxton, H.T. (Eds.),
US Geological Survey Toxic Substances Hydrology Program,
Proceedings of the Technical Meeting, Charleston, South
Carolina, March 8–12, 1999, Volume 3 of 3, Subsurface
Contamination from Point Sources, US Geological Survey
Water Resources Investigations Report 99-4018C, pp.
245–259.
Lorenz, M.G., Wackernagel, W., 1987. Adsorption of DNA to sand
and variable degradation rates of adsorbed DNA. Appl. Environ.
Microbiol. 53(12), 2948–2952.
Mackay, D.M., Freyberg, D.L., Roberts, P.V., 1986. A natural
gradient experiment on solute transport in a sandy aquifer: 1.
Approach and overview of plume movement. Water Resour.
Res., 22, 2017–2029.
Mariner, P.E., Jin, M., Studer, J.E., Pope, G.A., 1999. The first
vadose zone partitioning interwell tracer test for nonaqueous
phase liquid and water residual. Environ. Sci. Technol. 33(16),
2825–2828.
McDonald, M.G., Harbaugh, A.W., 1984. A modular three-
dimensional finite-difference groundwater flow model. USGS
Open-File Report 83-875, National Center Reston, Virginia,
USA.
McQueen, J., 1967. Some methods for classification and analysis of
multivariate observations. Fifth Berkeley Symp. Mathem. Stat.
Prob. 1, 281–298.
Meinardus, H.W., Dwarakanath, V., Ewing, J., Hirasaki, G.J.,
Jackson, R.E., Jin, M., Ginn, J.S., Londergan, J.T., Miller, C.A.,
Pope, G.A., 2002. Performance assessment of NAPL remediation
in heterogeneous alluvium. J. Contam. Hydrol. 54, 173–193.
Miralles-Wilhelm, F., Gelhar, L.W., 1996. Stochastic analysis of
sorption macrokinetics in heterogeneous aquifers. Water
Resour. Res. 32(6), 1541–1549.
Miralles-Wilhelm, F., Gelhar, L.W., Kapoor, V., 1997. Stochastic
analysis of oxygen-limited biodegradation in three-dimension-
ally heterogeneous aquifers. Water Resour. Res 33(6),
1251–1263.
Moench, A.F., Garabedian, S.P., LeBlanc, D.R., 2001. Estimation
of hydraulic parameters from an unconfined aquifer test
conducted in a glacial outwash deposit, Cape Cod, Massachu-
setts. US Geological Survey Professional Paper 1629, 69 p.
Nelson, N.T., Brusseau, M.L., 1996. Field study of the partitioning
tracer method for detection of dense nonaqueous phase liquid in
a Trichlorethene-contaminated aquifer. Environ. Sci. Technol.
30(9), 2859–2863.
Nelson, N.T., Brusseau, M.L., Carlson, T.D., 1999a. A gas phase
parttioning tracer method for the in situ measurement of soil
water content. Water Resour. Res. 35(12), 3699–3707.
Nelson, N.T., Oostrom, M., Wietsma, T.W., Brusseau, M.L., 1999b.
Partitioning tracer method for the insitu measurement of
DNAPL saturation: influence of heterogeneity and sampling
method. Environ. Sci. Technol. 33(22), 4046–4053.
Neuman, S.P., 1990. Universal scaling of hydraulic conductivities
and dispersivities in geologic media. Water Resour. Res. 26(8),
1749–1758.
Novakowski, K.S., Lapcevic, P.A., Voralek, J.W., Sudicky, E.A.,
1998. A note on a method for measuring the transport properties
of a formation using a single well. Water Resour. Res. 34(5),
1351–1356.
Oates, P.M., 2003. Personal communication.
Pang, L., Goltz, M., Close, M., 2003. Application of the method of
temporal moments to interpret solute transport with sorption and
degradation. J. Contam. Hydrol. 60, 123–134.
Ptak, T., 1995. Einsatz und Auswertung von Tracerversuchen in
heterogenen Grundwasserleitern. Z. dt. geol. Ges. 146,
152–160.
Ptak, T., 1997a. Evaluation of reactive transport processes in a
heterogeneous porous aquifer within a non-parametric numeri-
cal stochastic transport modelling framework based on sequen-
tial indicator simulation of categorical variables. In: Soares, A.,
et al. (Eds.), geoENV I—Geostatistics for Environmental
Applications, Kluwer Academic, Dordrecht, pp. 153–164.
Ptak, T., 1997b. Evaluation of non-parametric and parametric
stochastic simulations of flow and transport in groundwater
based on sieve analyses and flowmeter hydraulic conductivity
data sets. In: Pawlowsky-Glahn, V., (Ed.), Proceedings of
IAMG’97, International Association for Mathematical Geology,
CIMNE, Barcelona, Spain, pp. 842–847.
Ptak, T., Kleiner, K., 1998. Application of multilevel–multitracer
transport experiments for the investigation of hydraulic and
hydrogeochemical aquifer properties, Groundwater Quality:
Remediation and Protection, IAHS Publication No. 250, ISSN
0144-7815, pp. 343–351.
(full paper on accompanying CD-ROM, 9 pages), ISBN 90-805649-
4-XPtak, T., Liedl, R., 2002. Modeling of reactive contaminant
transport in hydraulically and hydrogeochemically hetero-
geneous aquifers using an upscaling approach based on
sedimentological facies. In: Findikakis, A.N., (Ed.), Bridging
the Gap between Measurements and Modeling in Hetero-
geneous Media, International Groundwater Symposium IAHR,
T. Ptak et al. / Journal of Hydrology 294 (2004) 122–163160
IAHS and ASCE/EWRI, March 25–29, 2002, Berkeley,
California, IAHR, Madrid, Spain, pp. 425–429.
Ptak, T., Schmid, G., 1996. Dual-tracer transport experiments in a
physically and chemically heterogeneous porous aquifer:
Effective transport parameters and spatial variability.
J. Hydrol. 183(1-2), 117–138.
Ptak, T., Strobel, H., 1998. Sorption of fluorescent tracers in a
physically and chemically heterogeneous aquifer material. In:
Arehart, G.B., Hulston, J.R. (Eds.), Water–Rock Interaction,
Balkema, Rotterdam, pp. 177–180.
Ptak, T., Teutsch, G., 1992. Macrodispersivity in highly hetero-
geneous porous aquifers. In: Hotzl, H., Werner, A. (Eds.),
Tracer Hydrology, Balkema, Rotterdam, pp. 149–155.
Ptak, T., Teutsch, G., 1994a. Forced and natural gradient tracer tests
in a highly heterogeneous porous aquifer: Instrumentation and
measurements. J. Hydrol. 159, 79–104.
Ptak, T., Teutsch, G., 1994b. A comparison of investigation
methods for the prediction of flow and transport in highly
heterogeneous formations. In: Dracos, T.H., Stauffer, F. (Eds.),
Transport and Reactive Processes in Aquifers, Balkema,
Rotterdam, pp. 157–164.
Ptak, T., Schad, H., Hofmann, B., Teutsch, G. und Kobus, H., 1996.
Methoden zur Erkundung und zur Simulation von Stromung und
Transport in heterogenen Aquiferen, Berichte Umweltforschung
Baden-Wurttemberg, FZKA-PWAB 17, September 1996, ISSN
1432-167X, 152 S.
ISBN 1-57477-095-0Ptak, T., Schirmer, M., Teutsch, G., 2000.
Development and performance of a new multilevel groundwater
sampling system. In: Wickramanayake, G.B., Gavaskar, A.R.,
Kelley, M.E., Nehring, K.W. (Eds.), Risk, Regulatory and
Monitoring Considerations: Remediation of Chlorinated and
Recalcitrant Compounds, Battelle Press, Columbus, OH, USA,
pp. 95–102.
Rajaram, H., Gelhar, L.W., 1991. Three-dimensional spatial
moments analysis of the Borden tracer test. Water Resour.
Res. 27(6), 1239–1251.
Rajaram, H., Gelhar, L.W., 1995. Plume-scale dependent dispersion
in aquifers with a wide range of scales of heterogeneity. Water
Resour. Res. 31(10), 2468–2482.
Rao, P.S.C., Annable, M.D., Kim, H., 2000. NAPL source zone
characterisation and remediation technology performance
assessment: recent developments and applications of tracer
techniques. J. Contam. Hydrol. 45, 63–78.
Rao, P.S.C., Annable, M.D., Sillan, R.K., Dai, D., Hatfield, K.,
Graham, W.D., Wood, A.L., Enfield, C.G., 1997. Field-scale
evaluation of in situ cosolvent flushing for enhanced aquifer
remediation. Water Resour. Res. 33(12), 2673–2686.
Rehfeldt, K.R., Gelhar, L.W., Southard, J.B., Dasinger, A.M., 1989.
Estimates of macrodispersivity based on analyses of hydraulic
conductivity variability at the MADE site, EN-6405, Research
Project 2485-5, EPRI, Palo Alto, California, USA.
Rehfeldt, K.R., Boggs, J.M., Gelhar, L.W., 1992. Field study of
dispersion in a heterogeneous aquifer. 3. Geostatistical analysis
of hydraulic conductivity. Water Resour. Res. 28, 3309–3324.
Rentier, C., Brouyere, S., Dassargues, A., 2002. Integrating
geophysical and tracer test data for accurate solute transport
modeling in heterogeneous media, Groundwater Quality:
Natural and Enhanced Restoration of Groundwater Pollution,
IAHS Publication No. 275, ISBN 1-901502-86-4, pp. 3–10.
Roberts, P.V., Goltz, M.N., Mackay, D.M., 1986. A natural gradient
experiment on solute transport in a sandy aquifer. 3. Retardation
estimates and mass balances for organic solutes. Water Resour.
Res. 22, 2047–2058.
Rubin, Y., Cushey, M.A., Wilson, A., 1997. The moments of the
breakthrough curves of instantaneously and kinetically sorbing
solutes in heterogeneous geologic media: Prediction and
parameter inference from field measurements. Water Resour.
Res. 33(11), 2465–2481.
Rugge, K., Bjerg, P.L., Pedersen, J.K., Mosbaek, H., Christensen,
T.H., 1999. An anaerobic field injection experiment in a landfill
leachate plume, Grindsted, Denmark. Water Resour. Res. 35(4),
1231–1246.
Rugner, H., Kleineidam, S., Grathwohl, P., 1999. Long term
sorption kinetics of Phenanthrene in aquifer materials. Environ.
Sci. Technol. 33(10), 1645–1651.
Sabatini, D.A., Austin, T.A., 1991. Characteristics of Rhodamine
WT and Fluorescein as adsorbing ground-water tracers. Ground
Water 29(3), 341–349.
Sabir, I.H., Torgersen, J., Gaut, S., Alestrom, P., Colleuille, H.,
Pedersen, T.S., Kitterod, N.O., Haldorsen, S., 2000a. Synthetic
DNA tracers: examples of their application in water related
studies, Tracers and Modelling in Hydrogeology (Proceedings
of the TraM’2000 Conference held at Liege, Belgium, May
2000), IAHS Publ. No. 262.
Sabir, I.H., Torgersen, J., Gaut, S., Alestrom, P., Colleuille, H.,
Pedersen, T.S., Kitterod, N.O., Haldorsen, S., 2000b. Synthetic
DNA tracers: examples of their application in water related
studies, Tracers and Modelling in Hydrogeology (Proceedings
of the TraM’2000 Conference held at Liege, Belgium, May
2000), IAHS Publ. No. 262 2000.
Sabir, I.H., Torgersen, J., Haldorsen, S., Alestrom, P., 1999a.
DNA tracers with information capacity and high detection
sensitivity tested in groundwater studies. Hydrogeol. J. 7(3),
264–272.
Sabir, I.H., Torgersen, J., Haldorsen, S., Alestrom, P., 1999b. DNA
tracers with information capacity and high detection sensitivity
tested in groundwater studies. Hydrogeol. J. 7(3), 264–272.
Saripalli, K.P., Kim, H.K., Annable, M.D., Rao, P.S.C., 1997.
Measurement of specific fluid–fluid interfacial areas of
immiscible fluids in porous media. Environ. Sci. Technol.
31(3), 932–936.
Saripalli, K.P., Rao, P.S.C., Annable, M.D., 1998. Determination of
specific NAPL–water interfacial areas of residual NAPLs in
porous media using the interfacial tracers techniques. J. Contam.
Hydrol. 30, 375–391.
Sauty, J.P., 1980. An analysis of hydrodispersive transfer in
aquifers. Water Resour. Res. 16(1), 70–81.
Schroth, M.H., Istok, J.D., Conner, G.T., Hyman, M.R., Haggerty,
R., O’Reilly, K.T., 1998. Spatial variability in in situ aerobic
respiration and denitrification rates in a petroleum contaminated
aquifer. Ground Water 36(6), 924–937.
Schroth, M.H., Istok, J.D., Haggerty, R., 2001. In situ evaluation of
solute retardation using single-well push–pull tests. Adv. Water
Resour. 24, 105–117.
T. Ptak et al. / Journal of Hydrology 294 (2004) 122–163 161

Semprini, L., Hopkins, O.S., Tasker, B.R., 2000. Laboratory, field and
modeling studies of Radon-222 as a natural tracer for monitoring
NAPL contamination. Trans. Porous Media 38, 223–240.
Setarge, B., Danzer, J., Klein, R., Grathwohl, P., 1999. Partitioning
and interfacial tracers to characterize non-aqueous phase liquids
(NAPLs) in natural aquifer material. Phys. Chem. Earth B 24(6),
501–510.
Sheely, C.Q., 1978. Description of field tests to determine residual
oil saturation by single-well tracer method. J. Petrol. Technol.
Feb. 1978, 194–202.
Shinga, K., Binley, A.M., Lane, J.W., Jr., Gorelick, S.M., 2003.
Electrical imaging of tracer migration at the Massachusetts
Military Reservation, Cape Cod. In: Symposium on the
Application of Geophysics to Engineering and Environmental
Problems (SAGEEP), San Antonio, Texas, Proceedings, April
6–10, 2003. Denver, Colorado, Environmental and Engineering
Geophysics Society, CD-ROM, 27 p.
Sillan, R.K., Annable, M.D., Rao, P.S.C., Dai, D., Hatfield, K.,
Graham, W.D., Wood, A.L., Enfield, C.G., 1998. Evaluation of
in situ cosolvent flushing dynamics using a network of spatially
distributed multilevel samplers. Water Resour. Res. 34(9),
2191–2202.
Sposito, G., Jury, W.A., 1988. The lifetime probability density
function for solute movement in the subsurface zone. J. Hydrol.
102, 503–518.
Sudicky, E.A., 1986. A natural gradient experiment on solute
transport in a sand aquifer: spatial variability of hydraulic
conductivity and its role in the dispersion process. Water
Resour. Res. 22, 2069–2082.
Sutton, D.J., Kabala, Z.J., Schaad, D.E., Ruud, N.C., 2000. The
dipole-flow test with a tracer: a new single-borehole tracer test
for aquifer characterization. J. Contam. Hydrol. 44, 71–101.
Tang, J.S., 1992. Interwell tracer tests to determine residual oil
saturation to waterflood at Judy Creek BHL A Pool. J. Can.
Petrol. Technol. 31(8), 61–70.
Teutsch, G., Ptak, T., Schad, H., Decker, H.M., 1990. Vergleich und
Bewertung direkter und indirekter Methoden zur hydrogeolo-
gischen Erkundung kleinraumig heterogener Strukturen. Z. dt.
geol. Ges. 141, 376–384.
Teutsch, G., Klingbeil, R., Kleineidam, S., 1998. In: Herbert, M.,
Kovar, K. (Eds.), Numerical modelling of reactive transport
using aquifer analogue data, Groundwater Quality: Remediation
and Protection, IAHS Publ. 250, pp. 381–390.
Theodoropoulou, M.A., Karoutsos, V., Kaspiris, C., Tsakiroglou,
C.D., 2003. A new visualization technique for the study of
solute dispersion in model porous media. J. Hydrol. 274,
176–197.
Thorbjarnarson, K.W., Mackay, D.M., 1994. A forced-gradient
ex994): A forced-gradient experiment on solute transport in the
Borden aquifer. III. Nonequilibrium transport of the sorbing
organic compounds. Water Resour. Res. 30(2), 401–419.
Thornton, S.F., Quigley, S., Spence, M.J., Banwart, S.A., Bottrell,
S., Lerner, D.N., 2001. Processes controlling the distribution
and natural attenuation of dissolved phenolic compounds in a
deep sandstone aquifer. J. Contam. Hydrol. 53, 233–267.
Tiedeman, C.R., Hsieh, P.A., 2003. Evaluation of simulated forced-
gradient tracer tests in heterogeneous aquifers: different test
types yield different longitudinal dispersivity estimates. In:
MODFLOW and MORE 2003—understanding through model-
ling, Conference Proceedings, Poeter, Zheng, Hill Doherty,
International Ground Water Modeling Center (IGWMC),
Colorado School of Mines, www.mines.edu/igwmc/, pp. 264–
268.
Tomich, J.F., Dalton, R.L., Deans, H.A., Shallenberger, L.K., 1973.
Single well tracer method to measure residual oil saturation.
J. Petrol. Technol. 1973, 211–218.
Tompson, A.F.B., 1993. Numerical simulation of chemical
migration in physically and chemically heterogeneous porous
media. Water Resour. Res. 29(11), 3709–3726.
Tompson, A.F.B., Schafer, A.L., Smith, R.W., 1996. Impacts of
physical and chemical heterogeneity on cocontaminant trans-
port in a sandy porous medium. Water Resour. Res. 32(4),
801–818.
Valocchi, A.J., 1985. Validity of the local equilibrium assumption
for modelling sorbing solute transport through homogeneous
soils. Water Resour. Res. 21(6), 808–820.
Vereecken, H., Doring, U., Hardelauf, H., Jaekel, U., Hashagen, U.,
Neuendorf, O., Schwarze, H., Seidemann, R., 2000. Analysis of
solute transport in a heterogeneous aquifer: the Krauthausen
field experiment. J. Contam. Hydol. 45, 329–358.
Vert, M., Ptak, T., Biver, P., Vittori, J., 1999. Geostatistical
generation of three-dimensional aquifer realizations using the
conditional SIS approach with direction trends imposed on
variogram models. In: Gomez-Hernandez, J.J., et al. (Eds.),
geoENV II—Geostatistics for Environmental Applications,
Kluwer Academic, Dordrecht, pp. 343–354.
Vulava, V.M., Perry, E.B., Romanek, C.S., Seaman, J.C., 2002.
Dissolved gases as partitioning tracers for determination of
hydrogeological parameters. Environ. Sci. Technol. 36(2),
254–262.
Walter, D.A., Masterson, J.P., 2003. Simulation of advective flow
under steady-state and transient recharge conditions, Camp
Edwards, Massachusetts Military Reservation, Cape Cod,
Massachusetts. US Geological Survey Water-Resources Inves-
tigations Report 03-4053, 51 p.
Watson, J.D., Gilman, M., Witkowski, J., Zoller, M., 1992.
Recombinant DNA, second ed., WH Freeman, New York.
Wilson, D.J., Burt, R.A., Hodge, D.S., 2000. Mathematical
Modeling of column and field dense nonaqueous phase liquid
tracer tests. Environ. Monitor. Assess. 60(4), 181–216.
Wilson, R.D., Mackay, D.M., 1995. Direct detection of residual
nonaqueqeous phase liquid in the saturated zone using SF6 as a
partitioning tracer. Environ. Sci. Technol. 29, 1255–1258.
Wolf, S.H., 1988. Spatial variability of hydraulic conductivity in a
sand and gravel aquifer. Massachusetts Institute of Technology,
Department of Civil Engineering, Cambridge, Massachusetts,
Unpublished ME Thesis, 118 p.
Wolf, S.H., Celia, M.A., Hess, K.M., 1991. Evaluation of hydraulic
conductivities calculated from multi-port permeameter
measurements. Ground Water 29(4), 516–525.
Woodbury, A.D., Rubin, Y., 2000. A full-Bayesian approach to
parameter inference from tracer travel time moments and
investigation of scale effects at the Cape Cod experimental site.
Water Resour. Res 36(1), 159–171.
T. Ptak et al. / Journal of Hydrology 294 (2004) 122–163162

Young, C.M., Jackson, Jin, M., Londergan, J.T., Mariner, P.E.,
Pope, G.A., Anderson, F.J., Houk, T., 1999. Characterization of
a TCE DNAPL zone in alluvium by partitioning tracers.
Groundwater Monitor. Remediat. 19(1), 84–94.
Zhang, H., Schwartz, F.W., Wood, W.W., Garabedian, S.P.,
LeBlanc, D.R., 1998. Simulation of variable-density flow and
transport of reactive and nonreactive solutes during a tracer test
at Cape Cod, Massachusetts. Water Resour. Res. 34(1), 67–82.
Zhang, Y., Graham, W.D., 2001a. Partitioning tracer transport in a
hydrogeochemically heterogeneous aquifer. Water Resour. Res.
37(8), 2037–2048.
Zhang, Y., Graham, W.D., 2001b. Spatial characterization of a
hydrogeochemically heterogeneous aquifer using partitioning
tracers: optimal estimation of aquifer parameters. Water Resour.
Res. 37(8), 2049–2063.
Zheng, C., Jiao, J.J., 1998. Numerical simulation of tracer tests in a
heterogeneous aquifer. J. Environ. Engng 124(6), 510–516.
Zheng, C., Gorelick, S.M., 2001. Effect of decimeter-scale prefer-
ential flow paths on solute transport: implications for groundwater
remediation. In: Thornton, S.F., Oswald, F. (Eds.), Groundwater
Quality: Natural and Enhanced Restoration of Groundwater
Pollution, IAHS Publication No. 275, pp. 463–469.
Zheng, C., Gorelick, S.M., 2003. Analysis of the effect of
decimeter-scale preferential flow paths on solute transport.
Ground Water 41(2), 142–155.
Zheng, Ch., 1991. MT3D: A Modular Three-Dimensional Transport
Model, SS Papadopulos and Associates, Inc., Rockville, Mary-
land, USA.
Zlotnik,V.,Zurbuchen,B.,Ptak,T.,Teutsch,G.,2000.Supportvolume
and scale effect in hydraulic conductivity: Experimental aspects.
Geological Society of America, Boulder, Colorado, Special Paper
348. In: Zhang, D., Winter, C.L. (Eds.), Theory, Modeling, and
Field Investigation in Hydrogeology: A Special Volume in Honor
of Shlomo P. Neuman’s 60th Birthday, pp. 215–231.
T. Ptak et al. / Journal of Hydrology 294 (2004) 122–163 163