practice guide for tracer tests
TRANSCRIPT

RREEPPUUBBLLIICC OOFF LLEEBBAANNOONN CCoouunncciill ffoorr DDeevveellooppmmeenntt aanndd
RReeccoonnssttrruuccttiioonn CCDDRR BBeeiirruutt
FFEEDDEERRAALL RREEPPUUBBLLIICC OOFF GGEERRMMAANNYY FFeeddeerraall IInnssttiittuuttee ffoorr GGeeoosscciieenncceess
aanndd NNaattuurraall RReessoouurrcceess BBGGRR
HHaannnnoovveerr
TTEECCHHNNIICCAALL CCOOOOPPEERRAATTIIOONN PPRROOJJEECCTT NNOO..:: 22000088..22116622..99
PPrrootteeccttiioonn ooff JJeeiittaa SSpprriinngg
SSppeecciiaall RReeppoorrtt NNoo.. 33
PPrraaccttiiccee GGuuiiddee ffoorr TTrraacceerr TTeessttss
Ballouneh January 2011

German-Lebanese Technical Cooperation Project Protection of Jeita Spring
Practice Guide for Tracer Tests
page 2
Author: Dr. Armin Margane, Jean Abi-Risk (both BGR) Commissioned by: Federal Ministry for Economic Cooperation and
Development (Bundesministerium für wirtschaftliche Zusammenarbeit und Entwicklung, BMZ)
Project: Protection of Jeita Spring BMZ-No.: 2008.2162.9 BGR-Archive No.: xxxxxxx Date of issuance: January 2011 No. of pages: 45

German-Lebanese Technical Cooperation Project Protection of Jeita Spring
Practice Guide for Tracer Tests
page 3
Table of Contents 1 INTRODUCTION ......................................................................................................... 5 2 TRACER TEST CONCEPT AND PLANNING FOR THE TEST ................................. 5 3 MONITORING SITE .................................................................................................... 6 4 SELECTION AND PREPARATION OF INJECTION SITES AND TRACER
INJECTION .............................................................................................. 6 5 MONITORING DATA REGISTRATION ..................................................................... 6 5.1 OPERATING THE FLUOROMETER....................................................................... 7 5.2 FLUOROMETER CALIBRATION........................................................................... 9 5.2.1 Preparing the calibration solutions .............................................................................. 9 5.2.2 Calibration ............................................................................ 11 5.2.3 Creating a calibration file ............................................................................ 17 5.2.4 Confirmation of Test Result ............................................................................ 22 6 DILUTION TESTS ..................................................................................................... 22 7 REFERENCES........................................................................................ 26 ANNEX 1 Using the Albillia GGUN FL30 Fluorometers ANNEX 2 Synchronizing Date and Time for the Albillia GGUN FL30
Fluorometers List of Figures Figure 1: Corrupt file ................................................................................................... 8 Figure 2: Tracer Solutions for Calibration of Fluorometer ......................................... 10 Figure 3: Preparing Tracer Solutions for Calibration................................................. 11 Figure 4: Processing of Samples for Calibration of Fluorometer .............................. 13 Figure 5: Suggested file structure ............................................................................. 14 Figure 6: Word document for import of mv and ppb values ...................................... 15 Figure 7: Result of Calibration using Calibration for Tracer 1 ................................... 17 Figure 8: Calibration of instrument 531 with 100 ppb Na-Naphthionate ................... 18 Figure 9: Excel File with Averages of Values needed for the Calibrat.dat File ......... 19 Figure 10: Final CALIBRAT.DAT file......................................................................... 21

German-Lebanese Technical Cooperation Project Protection of Jeita Spring
Practice Guide for Tracer Tests
page 4
List of Abbreviations asl Above mean sea level AVSI Italian NGO BMZ German Ministry of Economic Cooperation and Development CDR Council for Development and Reconstruction, Lebanon CPT Cone penetration test DEMN Digital elevation model EIA Environmental impact assessment EIB European Investment Bank, Brussels FAO Food and Agriculture Organization, Rome FC Financial cooperation GW groundwater IGN Institut Geographique National, France KfW German Bank for Reconstruction and Development, Germany LRA Litani River Authority, Lebanon MAPAS Company operating Jeita Grotto, Lebanon MCM Million cubic meters MoEW Ministry of Energy and Water, Lebanon SWE Snow water equivalent TC Technical cooperation UNDP United Nations Development Program UTM Universal transverse mercator WEBML Water Establishment Beirut and Mount Lebanon WW Wastewater WWTP Wastewater treatment plant

Federal Institute for Geosciences and Natural Resources
_____________________________________________________________________________List of Project Reports.doc 1
List of Reports prepared by the Technical Cooperation Project Protection of Jeita Spring Report No. Title Date Published Technical Reports
1 Site Selection for Wastewater Facilities in the Nahr el Kalb Catchment ̶General Recommendations from the Perspective of Groundwater Resources Protection
January 2011
2 Best Management Practice Guideline for Wastewater Facilities in Karstic Areas of Lebanon ̶ with special respect to the protection of ground- and surface waters
March 2011
3 Guideline for Environmental Impact Assessments for Wastewater Facilities in Lebanon ̶ Recommendations from the Perspective of Groundwater Resources Protection
November 2011
4 Geological Map, Tectonics and Karstification of the Jeita Spring Catchment
In progress
5 Hydrogeology of the Groundwater Contribution Zone of Jeita Spring
In progress
6 Water Balance for the Groundwater Contribution Zone of Jeita Spring using WEAP including Water Resources Management Options and Scenarios
In progress
7 Groundwater Vulnerability Mapping in the Jeita Spring Catchment
In Progress
Special Reports 1 Artificial Tracer Tests 1 - April 2010
(prepared with University of Goettingen)
July 2010
2 Artificial Tracer Tests 2 - August 2010 (prepared with University of Goettingen)
November 2010
3 Practice Guide for Tracer Tests January 2011 4 Proposed National Standard for
Treated Domestic Wastewater Reuse for Irrigation
July 2011
5 Artificial Tracer Tests 4B - May 2011 (prepared with University of
September 2011

Federal Institute for Geosciences and Natural Resources
_____________________________________________________________________________List of Project Reports.doc 2
Report No. Title Date Published Goettingen)
6 Artificial Tracer Tests 5A - June 2011 (prepared with University of Goettingen)
September 2011
7 Mapping of Surface Karst Features in the Jeita Spring Catchment
October 2011
8 Monitoring of Spring Discharge and Surface Water Runoff in the Jeita Spring Catchment
In Progress
9 Soil Survey in the Jeita Spring Catchment
November 2011
10 Mapping of the Irrigation System in the Jeita Catchment
In Progress
11 Artificial Tracer Tests 5C - September 2011 (prepared with University of Goettingen)
February 2012
12 Stable Isotope Investigations in the Jeita Spring Catchment
In Progress
13 Micropollutant Investigations in the Jeita Spring Catchment
In Progress
14 Guideline for Gas Stations - Recommendations from the Perspective of Groundwater Resources Protection
February 2012
15 Tritium - Helium Investigations in the Jeita Spring Catchment
In Progress
16 Hazards to Groundwater and Assessment of Pollution Risk in the Jeita Spring Catchment
In Progress
Reports with KfW Development Bank (jointly prepared and submitted to CDR)
1 Jeita Spring Protection Project Phase I - Regional Sewage Plan
October 2011
2 Jeita Spring Protection Project - Feasibility Study - Rehabilitation of Transmission Channel Jeita Spring Intake – Dbaye WTP
In Progress
3 Jeita Spring Protection Project - Environmental Impact Assessment for the Proposed CDR/KfW Wastewater Scheme in the Lower Nahr el Kalb Catchment
In Progress

German-Lebanese Technical Cooperation Project Protection of Jeita Spring
Practice Guide for Tracer Tests
page 5
1 Introduction This manual is addressed to scientists, engineers or technicians who would want to conduct tracer tests and use the equipment bought by the project for tracer tests or are using a similar equipment in one of our projects. It explains
• how to calibrate and use the instruments (Albillia GGUN-FL30 fluorometers)
• how to develop a concept for a tracer test • what is needed to prepare it • what is needed to conduct it
This document is not intended to replace scientific guidance, such as e.g. documented in LEIBUNDGUT et al. (2009) but provides a number of useful tips. It is based on experiences made during the Tracer tests conducted in the Nahr el Kalb catchment/Lebanon for the delineation of groundwater protection zones and for the identification of suitable sites for wastewater facilities (MARGANE, 2011; DOUMMAR el al., 2010a; DOUMMAR el al., 2010b).
2 Tracer Test Concept and Planning for the Test Tracer tests usually focus on proving a hydrogeological connection between two points and estimating travel times in the unsaturated and saturated zones. The concept should take into consideration the overall geological, hydrogeological conditions in the area. All possible pathways along karst cavities, faults and fractures, highly pervious geological units, geological boundaries and leakages across aquifers should be considered. Use tracer substances which are not subject to sorption, are chemically and biologically stable and are easily to be detected at low enough contents. If using the Albillia GGUN-FL30, the peak should reach at least 1 ppb. The amount of tracer substance should be large enough to produce such a peak. The project successfully used uranine, Na-naphthionate and amidorhodamine G. Remember that all formulas for calculating the amount of tracer needed give only rough estimates, especially in karst systems. As we experienced, not all tracers are always readily available. Be careful were to order because the quality (composition, purity) of the tracer substance can highly vary. Also transport may not always be easy (international transport regulations). Especially if taking manual samples, you will need a lot of human resources and a number of cars to carry out the test.

German-Lebanese Technical Cooperation Project Protection of Jeita Spring
Practice Guide for Tracer Tests
page 6
3 Monitoring Site Often the location where to install the fluorometer will depend on where you can do so without the instrument/data logger being damaged, stolen/ vandalized or the data logger being flooded. In this respect the data cable should be long enough to position the data logger in a dry and safe place. The monitoring site should be located on one of the main assumed pathways. Choose a site where water flow is neither turbulent nor stagnant. There should be no major gains or losses in the vicinity of the site which are assumed to come from another source.
4 Selection and Preparation of Injection Sites and Tracer Injection
Avoid injection sites where there is a risk that the tracer might not be sufficiently infiltrating into the underground (thickness, texture of alluvial/colluvial deposits). In this respect it might be required to remove part of the alluvium/colluvium. If not injected into a sinkhole or natural depression, a pit should be dug to allow for flushing with suffficient amounts of water (40-60 m³). The injection site must be reachable by machines for preparation of the site and water tankers for flushing.
5 Monitoring Data Registration Most convenient is the registration of data using a fluorometer in combination with a data logger, such as the Albillia GGUN-FL30 described hereafter. It registers data in several different time intervals of between 2 seconds to 15 minutes. If not enough instruments are available, you will have to do manual sampling as suitable time intervals. Since in many cases tracer arrival is fairly difficult to predict, it would be best to choose short enough time intervals (depending on travel time and distance from injection). Under conditions in Lebanon, where the injection site was located between 5 km and 20 km from the monitoring site, hourly sampling was required. Prepare a place (box) for storage of samples so that they are not exposed to light before they can be processed. Sampling bottles of 100 ml will be large enough (the Albillia fluorometer holds 20 ml). Procedures for automatic data recording are noted in the following chapters.

German-Lebanese Technical Cooperation Project Protection of Jeita Spring
Practice Guide for Tracer Tests
page 7
5.1 Operating the Fluorometer Time: The fluorometer should be synchronized with the PC time at least before every test (it is recommended to deactivate internet synchronization and changes between summer/winter time). In some instruments the internal clock may differ from PC-time by several minutes after a month. Baseline: To avoid that the baseline exceed the value of 13 mv the fluorometer should not be near any metallic objects, power lines, etc. The manufacturer recommends not to operate the fluorometer near a notebook connected to a charger (such as would be necessary for calibrations or measurement of manual samples). However, we can not confirm that this has any influence on the readings. CF-cards: remember that only CF-cards of 1 GB or less capacity work with the Albillia datalogger. Format your CF-cards every now and then to avoid problems. Concerning CF-card readers, we've tried a good dozen different ones. They will all be broken after some time as a kind of built-in limitation but it is highly recommended not to use the cheap Chinese stuff. You would risk breaking the pins in the CF-card adapter of your logger. An this problem would be much more severe. Several times the CF-cards contained false data (Figure 1), produced by the instrument for unknown reasons. These have to be corrected manually in the TXT file created by the fluorometer (delete or correct line). Sometimes cards will stop registering data, also for unknown reasons, which is why we recommend collecting data as often as possible and change batteries after about one week (if on 2 min time interval) in order not to loose data. Batteries: there are 6 V and 12 V batteries in use for the GGUN-FL30. You'll have to experiment how long your batteries last using different sampling intervals (using 2 minutes the 12 V battery lasts approximately 2 weeks). It will, however, not be of much help for you if the CF card is malfunctioning during that time. Clean the measurement chamber inside the fluorometer every once in a while, especially if water has a high turbidity. Sediments inside the fluorometer will have a negative influence on measurements and you will clearly see that sometimes.

German-Lebanese Technical Cooperation Project Protection of Jeita Spring
Practice Guide for Tracer Tests
page 8
Figure 1: Corrupt file
Installation of the fluorometer: you will frequently have to remove the fluorometer. Therefore we recommend not to fix it too tight. We made good experience using nylon cords attached with cable ties. Fix the fluorometer at least at two points, better four, especially if you have to assume high currents at times. For measurement of manual samples use the following procedure: - sort samples first by station, then by date/time,

German-Lebanese Technical Cooperation Project Protection of Jeita Spring
Practice Guide for Tracer Tests
page 9
- run the measurements by the fluorometer calibrated for this station, - collect (at least) three values for each sample, - note the time (PC-time = fluorometer time) in a related spreadsheet, - evaluate the related TXT-file, extracted from the logger - another option is the use the USB connection cable and register the MV file directly in \programs\FLUO [date#instrument.MV] and evaluate this file later on - correlate data from the PPB-file, created by the program FLUO, with samples in your spreadsheet.
5.2 Fluorometer calibration (Albillia GGUN-FL30: http://www.albillia.com/FL30e.html) Calibration of the fluorometer before each tracer test is a must. According to the manufacturer a calibration may last for up to 6 months. Each fluorometer must be calibrated separately for each station you might be using it. Note that calibration is a time consuming process and might take several days, depending on the number of fluorometers, stations and repeat calibrations. Repeat your calibration (at least once) in order to be sure your calibration is correct.
5.2.1 Preparing the calibration solutions You have to calibrate your fluorometer to obtain correct readings for a tracer value for the specific type of water you work on (other than explained in the manual) . Each time you use a new tracer substance or even batch of the same tracer you have to do a new calibration (especially if you are not sure that the composition is always exactly the same > which it isn't ) ! Normally you prepare three solutions using the water from each site where you measure of 1 ppb, 10 ppb, 100 ppb for each tracer that you plan using and for each instrument that might be used (remember that instruments might fail sometimes in the midst of a test and that you might need to continue recording at an important location with another instrument; therefore it's usually better to calibrate all instruments you've got for all possible uses). So quite often you will need 30 and more samples to be processed with different instruments ! And this will take a lot of time ! Our calibrations usually took three days each. You will need:
• high-precision balance (max ~200 g; e.g. Mettler-Toledo ML 203)

German-Lebanese Technical Cooperation Project Protection of Jeita Spring
Practice Guide for Tracer Tests
page 10
• one 500 ml Erlenmeyer flask for each 1 g/l tracer solution (keep until calibration is final) > one for each tracer, one for each station (steps 1)
• at least two 500 ml Erlenmeyer flasks for steps 2 and 3 • at least two 100 ml graduated cylinder glasses • automatic pipette (e.g. Eppendorff 10 ml) • or glass pipettes 5 ml • sampling bottles 100-200 ml
step 1: 0.500 g (tracer) in 500 ml (spring water) >> 1g/l step 2: 5 ml 1 g/l in 500ml >> 10 mg/l step 3: 5 ml 10 mg/l in 500ml >> 100 ppb (store 2 packs for calibration;
keep 1 bottle to prepare 1/10 ppb solutions if required later) step 4: 10 ml 100 ppb in 100ml >> 10 ppb (store 90 ml for calibration) step 5: 10 ml 10ppb in 100ml >> 1 ppb (store 100 ml for calibration) (or use 5 ml 100 ppb in 500 ml) Calculate before you start preparing those solutions how much of each solution you might need. The interior of the fluorometer must not be filled to the brim. It holds approx. 20 ml but 15 ml is enough.
Figure 2: Tracer Solutions for Calibration of Fluorometer

German-Lebanese Technical Cooperation Project Protection of Jeita Spring
Practice Guide for Tracer Tests
page 11
Figure 3: Preparing Tracer Solutions for Calibration
5.2.2 Calibration
1- Preparing fluorometer for tests:
- synchronize with PC-time (see manual) - connect fluorometer to a data logger and the data logger to your
computer - set USB-port to serial port 1 ! (or change in .DAT file) - Set data logger to < 2 0 3 1 1 0 > (10 s interval)
SR A B C D - Install a full battery voltage >12V and insert the right SD card specified
for this fluorometer. - Copy the correct calibrat.dat file to FLUO – program folder (which will
be used when opening the FLUO program; check that the correct number is displayed in the starting screen)
- Take out both fluorometer caps and block it from the bottom with the rubber stopper.

German-Lebanese Technical Cooperation Project Protection of Jeita Spring
Practice Guide for Tracer Tests
page 12
- clean the interior of the fluorometer well before you start and each time you use different solutions ! (I recommend using solutions with the same tracer starting with 1 ppb for all sites, then going up to 10 ppb, then going up to 100 ppb > this way you don't have to clean the interior all the time but just after these measurements)
Recommended measuring sequence: instrument 1 tracer 1 a) uranine loc-1 1 ppb b) uranine loc-2 1 ppb c) uranine loc-3 1 ppb d) uranine loc-4 1 ppb > e) uranine loc-1 10 ppb f) uranine loc-2 10 ppb g) uranine loc-3 10 ppb h) uranine loc-4 10 ppb > e) uranine loc-1 100 ppb f) uranine loc-2 100 ppb g) uranine loc-3 100 ppb h) uranine loc-4 100 ppb > instrument 1 tracer 2 i) Amido G loc-1 1 ppb j) Amido G loc-2 1 ppb k) Amido G loc-3 1 ppb l) Amido G loc-4 1 ppb > m) Amido G loc-1 10 ppb n) Amido G loc-2 10 ppb o) Amido G loc-3 10 ppb p) Amido G loc-4 10ppb > q) Amido G loc-1 100 ppb r) Amido G loc-2 100 ppb s) Amido G loc-3 100 ppb t) Amido G loc-4 100 ppb > then for tracer three then for instrument 2 ...

German-Lebanese Technical Cooperation Project Protection of Jeita Spring
Practice Guide for Tracer Tests
page 13
Figure 4: Processing of Samples for Calibration of Fluorometer

German-Lebanese Technical Cooperation Project Protection of Jeita Spring
Practice Guide for Tracer Tests
page 14
Figure 5: Suggested file structure

German-Lebanese Technical Cooperation Project Protection of Jeita Spring
Practice Guide for Tracer Tests
page 15
Figure 6: Word document for import of mv and ppb values

German-Lebanese Technical Cooperation Project Protection of Jeita Spring
Practice Guide for Tracer Tests
page 16
2- Prepare file structure and blank Word-files (Figure 5) 3- Start the calibration tests from the solution of lowest concentration. - Fill water into the fluorometer and cover it with a cap so that no light will
get in (this is recommended by the manufacturer but you will see that there is no difference whether you do so or not).
- Start a "new acquisition" in Fluo program on your PC and turn on the data logger.
- Stop testing after 10 measurements (90 s). - Copy millivolt (mv) results then ppb results to a Word file prepared by
the instrument number and the location name and date of calibration, tracer name and concentration (Figure 2).
- Do the same for every tracer type and every concentration in the same word file for the same instrument and the same spring.
Note that what is displayed in the FLUO program is the ppb values based on the previous calibration ! To see the results using the new calibration you first have to modify the calibrat.dat file, then evaluate the ACSII-file (MV extension) created in the directory Programs > FLUO (110128#531.MV in Figure 4). This procedure is also quite tedious. You first have to save the MV-file under a specific name so that you can identify which values are for which station and note in which sequence and at what time you performed which calibration. It may sometimes be easier to perform another complete set of measurements for the instrument after calibration based on the modified calibrat.dat and then see whether your measurements fit. To see the measurement results using the calibration you just did you have to use the following procedure:
• prepare new calibrat.dat based on current measurements (see below) • copy new calibrat.dat file to \programs\fluo\ • start FLUO using MV-file created during calibration (Figure 7) • correct for turbidity (usually 1) and display as lin / auto • rename PPB file created for this instrument / tracer / station / date so
that you'll be able to clearly identify it later [e.g. 531_U-ORCO_Jeita_30-01-2010.PPB]
• check in the related PPB file that values for 1 ppb and 10 ppb fit (subtracting the water value !)
• repeat the same procedure for tracers 2, 3, ...

German-Lebanese Technical Cooperation Project Protection of Jeita Spring
Practice Guide for Tracer Tests
page 17
Figure 7: Result of Calibration using Calibration for Tracer 1 Note that there can be quite some differences in the MV values for the same instrument and station during repeat measurements conducted only a few hours after the first measurement. We have not yet found out why.
5.2.3 Creating a calibration file
- Save the Word file (Figure 6) as ASCII TXT file under the same name - Open Microsoft Excel program and open the saved TXT file, from <all
files>, <delimited> <space>. - Insert lines for averages, format columns value as numbers with 2
digits, and set the date column format. - Create mv average for every column (=average(….,…) and mark
needed values by color (Figure 9).

German-Lebanese Technical Cooperation Project Protection of Jeita Spring
Practice Guide for Tracer Tests
page 18
Figure 8: Calibration of instrument 531 with 100 ppb Na-Naphthionate

German-Lebanese Technical Cooperation Project Protection of Jeita Spring
Practice Guide for Tracer Tests
page 19
Figure 9: Excel File with Averages of Values needed for the Calibrat.dat File
- Go to the previous calibrat.dat file, copy it to your calibration folder, rename it as calibrat.old.dat, rename a copy of it as calibrat.new.dat and edit this new one by changing values inside.
- Change for the (100 ppb) the mv values using the average for every specified tracer (Figure 10)
EX: Uranine L1 average of mv value for 100 ppb

German-Lebanese Technical Cooperation Project Protection of Jeita Spring
Practice Guide for Tracer Tests
page 20
L2 average of mv value for 100 ppb L3 average of mv value for 100 ppb L4 average of mv value for 100 ppb - then go down following every tracer number (tracer 1 is e.g. uranine …)
and change average mv value for the 100 ppb, 10 ppb, 1 ppb - Save changes to the file and close it. - Rename a copy of it as calibrat.dat to be saved as final version. - Copy it to the specified folder for this schneggi on your PC, and in the
specified SD card replacing the previous calibrat.dat file

German-Lebanese Technical Cooperation Project Protection of Jeita Spring
Practice Guide for Tracer Tests
page 21
Figure 10: Final CALIBRAT.DAT file

German-Lebanese Technical Cooperation Project Protection of Jeita Spring
Practice Guide for Tracer Tests
page 22
5.2.4 Confirmation of Test Result To confirm that your calibration procedure was right, you have to test some or all your solutions and the 10 ppb and 100 ppb values should have a fairly good match.
GOOD LUCK ! <><><><> Bonne Chance ! <><><><> Viel Erfolg !
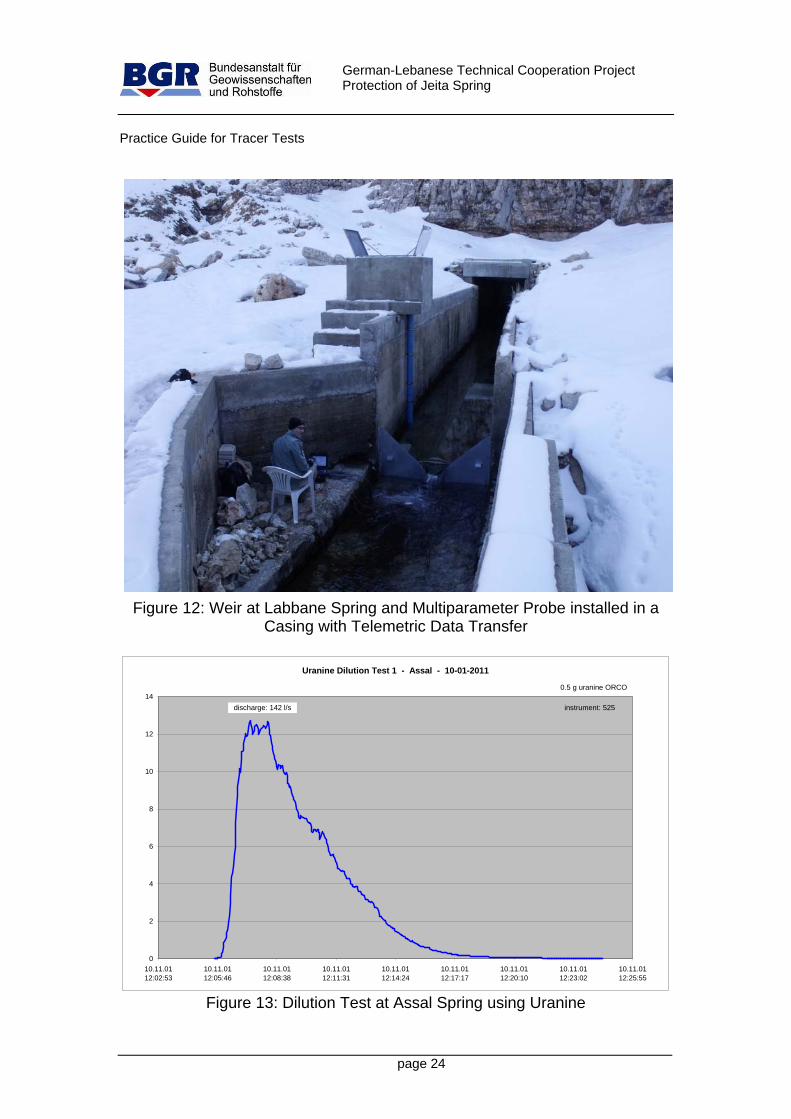
6 Dilution Tests In many cases measurements of flow will be much easier and more correct using dilution tests, compared with conventional measurements. We used dilution tests to calibrate flows at stations with a well defined section where we installed multiparameter probes (InSitu Troll 9500) to measure (among others) the water level. Sometimes weirs had to be installed to have enough space to register data when flow becomes very low (Figure 11). When amounts of flow are relatively low or flow velocity in a well defined section is high, dilution tests can be done using salt to calibrate those spring flow gauging stations. We used between 1 and 10 kg salt for such individual test. However, for each measurement a correlation between electric conductivity and NaCl needs to be established because this correlation will change over time (15). The distance between injection and monitoring was usually between 20 m (Labbane, Figures 11 and 12, and Assal springs) and 165 m (Kashkouch spring). Here dilution tests were done using salt and uranine, achieving mostly a close match. When amounts of flow are higher and/or flow velocities are relatively low, like e.g. in the Jeita cave, salt could not be used. In such cases dilution tests we done using uranine (Daraya tunnel, Jeita). In Jeita (1 m³/s to 20 m³/s) the best results were achieved when the distance between injection and monitoring was > 300 m. Then of course it must be insured that there are no gains or losses along this flow path. In all cases where flow must be monitored in an irregular section or a section with irregular flow, dilution tests are the only means to correctly determine the amount of flow. Electric conductivity (EC) was measured using a WTW 3430 online instrument. It has the option to take EC readings at manually defined intervals and store them in the instrument. Data can then be read out via USB memory stick. Alternatively measurements can directly be read out to the notebook via

German-Lebanese Technical Cooperation Project Protection of Jeita Spring
Practice Guide for Tracer Tests
page 23
a USB connection (standard camera cable; Figure 11). Sometimes, e.g. if it rains, it may not be advisable using automatic registration to a notebook. We used both methods depending on the actual conditions at the station.
Figure 11: Flow measurements at Labbane Spring using Uranine and Salt
German-Lebanese Technical Cooperation Project Protection of Jeita Spring
Practice Guide for Tracer Tests
page 24
Figure 12: Weir at Labbane Spring and Multiparameter Probe installed in a Casing with Telemetric Data Transfer
Uranine Dilution Test 1 - Assal - 10-01-2011
0
2
4
6
8
10
12
14
10.11.0112:02:53
10.11.0112:05:46
10.11.0112:08:38
10.11.0112:11:31
10.11.0112:14:24
10.11.0112:17:17
10.11.0112:20:10
10.11.0112:23:02
10.11.0112:25:55
discharge: 142 l/s instrument: 525
0.5 g uranine ORCO
Figure 13: Dilution Test at Assal Spring using Uranine

German-Lebanese Technical Cooperation Project Protection of Jeita Spring
Practice Guide for Tracer Tests
page 25
Salt Dilution Tests - Assal - 10-01-2011
200
250
300
350
400
450
10.01.2011 12:00:00 10.01.2011 12:07:12 10.01.2011 12:14:24 10.01.2011 12:21:36 10.01.2011 12:28:48 10.01.2011 12:36:00 10.01.2011 12:43:12
discharge: 123 l/s
discharge: 125 l/s
3 kg salt each
Figure 14: Dilution Test at Assal Spring using Salt
Calibration Assal 10-01-2011
y = 0.000516x - 0.116626
0
0.05
0.1
0.15
0.2
0.25
0.3
0 100 200 300 400 500 600 700 800
EC [µS/cm]
NaC
l [m
g/l]
Figure 15: Calibration for NaCl-EC at Assal Spring

German-Lebanese Technical Cooperation Project Protection of Jeita Spring
Practice Guide for Tracer Tests
page 26
7 References DOUMMAR, J., MARGANE, A., JIN, Y., GEYER, T. & SAUTER, M. (2910a):
Protection of Jeita Spring – Artificial Tracer Tests – April 2010. –German-Lebanese Technical Cooperation Project Protection of Jeita Spring, Special Report No. 1, 33 p.; Ballouneh/Lebanon & Goettingen/Germany.
DOUMMAR, J., MARGANE, A., GEYER, T. & SAUTER, M. (2910b): Protection of Jeita Spring – Artificial Tracer Tests – August 2010. –German-Lebanese Technical Cooperation Project Protection of Jeita Spring, Special Report No. 2, 27 p.; Ballouneh/Lebanon & Goettingen/Germany.
LEIBUNDGUT, C., MALOSZEWSKI, P., KUELLS, K. (2009): Tracers in Hydrology. – 415 p.; Chichester (Willey-Blackwell).
MARGANE, A. (2011): Site Selection for Wastewater Facilities in the Nahr el Kalb Catchment - General Recommendations from the Perspective of Groundwater Resources Protection. – German-Lebanese Technical Cooperation Project Protection of Jeita Spring, Technical Report No.1, 152 p.; Ballouneh/Lebanon.

German-Lebanese Technical Cooperation Project Protection of Jeita Spring
ANNEX 1: Using the Albillia GGUN FL30 Fluorometers
page 1
ANNEX 1: Using the Albillia GGUN FL30 Fluorometers
1 Introduction This instruction guide is directed to potential users of the Albillia GGUN FL30 fluorometers purchased by the German-Lebanese Technical Cooperation Project Protection of Jeita spring from the company Albillia (www.albillia.com).
Practical experience gained by the project while using these fluorometers made it necessary to prepare this instruction guide in order to ensure the sustainable and successful usage of the fluorometers. A related training course was conducted for WEBML laboratory staff.
2 Notebook Preparation The following steps are required before running a dilution or tracer test: S1 Install the software (Fluo) and create a shortcut on the desktop S2 Create a shortcut to "Fluo" on your desktop S3 Create a data folder where you’ll collect all your data for tracer and
dilution tests and create a shortcut for this folder on your desktop e.g.: "\Tracer test 4B\discharge" for dilution test during a tracer test or e.g.: "\Tracer test 4B\tracer test" for collecting tracer test data during a
tracer test S4 Create a folder inside the data folder named by each location where you
measure : e.g. "1 _531_Jeita", where 1 = number of monitoring station 531 = serial number of instrument Jeita = location name copy “cal.dat” and “calibrat.dat” files (prepared after each calibration;
note that calibrations should be carried out every 6 months or before each major tracer test)
S5 Create subdirectories for every date and time you collect data : J_531_dil-test_13-02-2012 (data for dilution test collected on 13-02-
2012) S6 You have to change your regional settings in the (>Control Panel\All
Control Panel Items\Region and Language) in order to read date and time correctly (YY/MM/DD hh:mm:ss)

German-Lebanese Technical Cooperation Project Protection of Jeita Spring
ANNEX 1: Using the Albillia GGUN FL30 Fluorometers
page 2
Figure 1: Shortcut on Desktop to Folder with Dilution Test Data during Tracer Test 4B
(C:\Data\Lebanon\4_project area\5_groundwater\tracer tests\Tracer Test 4A NB3\1_Naber el Assal (531)\Discharge\raw data\A_531_dil-tests_30-03-2011)

German-Lebanese Technical Cooperation Project Protection of Jeita Spring
ANNEX 1: Using the Albillia GGUN FL30 Fluorometers
page 3
2 Equipment Needed to Collect Data from a Fluorometer The personnel in charge for collecting data from a fluorometer must have a robust backpack for notebook compatible with field conditions of water and mud, and this backpack must contain the following (Figure 2):
Figure 2: Field Equipment
1 The notebook installed with the software like in chapter 1 2 A CF card reader (good quality) and a spare card reader 3 A charged 12V battery to replace it in the fluorometer 4 Cleaning tools for the optics of the fluorometer (screw driver and a
special cylindrical brush) provided with every fluorometer

German-Lebanese Technical Cooperation Project Protection of Jeita Spring
ANNEX 1: Using the Albillia GGUN FL30 Fluorometers
page 4
3 Collecting Data S7 Open the fluorometer’s data logger, wait for the red light to be off, turn off
(lift switch to turn off) the data logger and take out the CF card S8 Run the notebook, plug the card reader and insert the CF card in it (be
careful with the pins, especially in the logger !) S9 Copy from the CF card (Figure 3) the files to the subdirectory (Figure 4)
which you created in S5: • .TXT files (there may be several TXT files > file name contains date and time when started: e.g. 02171352.txt = 17 FEB 2012 13:52) (Note that date & time in this TXT file is as follows : YY:MM:DD hh:mm:ss) • cal.dat (this file lets the logger know which fluorometer is in use) • Calibrat.dat (this file lets the program Fluo know which fluorometer and calibration was used)
Figure 3: Contents of CF Card

German-Lebanese Technical Cooperation Project Protection of Jeita Spring
ANNEX 1: Using the Albillia GGUN FL30 Fluorometers
page 5
Figure 4: Copy Files from Logger to Notebook
S9 Copy “calibrat.dat” from CF card of new location on your notebook to the
Fluo program folder, click replace the old “calibrat.dat” (Figure 5), this file lets the program Fluo know which fluorometer was used.
Figure 5: Copy calibrat.dat to Fluo Program Folder

German-Lebanese Technical Cooperation Project Protection of Jeita Spring
ANNEX 1: Using the Albillia GGUN FL30 Fluorometers
page 6
S10 Open Fluo program (for windows 7 you may have to run it as administrator), you will see on the top right corner the ID number of the fluorometer (Figure 6)
Figure 6: Fluo Program Window
(top right in blue: fluorometer type, fluorometer number, file name)
S11 Go to the menu on the bottom of the window, click “Read Flash Card” (Figure 7)

German-Lebanese Technical Cooperation Project Protection of Jeita Spring
ANNEX 1: Using the Albillia GGUN FL30 Fluorometers
page 7
Figure 7: Extracting data from CF card
S12 A new window appears, click on “Extract last data from card”, another
window appears for browsing the location of the file to read. Go to computer\removable disk and select the .TXT file (Figure 8) (usually it’s the .TXT file at the end of the list)
Figure 8: Browsing the CF card to select the .TXT file

German-Lebanese Technical Cooperation Project Protection of Jeita Spring
ANNEX 1: Using the Albillia GGUN FL30 Fluorometers
page 8
S13 Another window appears where you have to name and save an .MV file (saving the information from the .TXT file as milli Volt) (Figure 9), use the same name as the folder you created in step S5; after extracting data click “Quit”
Figure 9: Saving the .MV file
S14 Go to the bottom menu again and click on “Process mV”, a window appears (Fluo folder) where you have to select the last .MV file you created (if you sort by date modified it will be on the top of the list) to be processed to .PPB file (Figure 10); after clicking “OK”, a graphic appears showing the tracer concentration in ppb.
S15 If you recorded three tracers, all three tracers will appear. For dilution
tests, however, you are only interested in the one you used. You will therefore uncheck those not used, e.g. Eosin and Naphthionate. Then click on "Log" and next on "Auto". This will adjust your concentration scale so you can better interpret the result. Then adjust "Turb. sensitivity", which depends on the turbidity of the water (usually between 0.01 and 1). The selected number is okay, when the curve at the end shows some tailing as in Figure 11.

German-Lebanese Technical Cooperation Project Protection of Jeita Spring
ANNEX 1: Using the Albillia GGUN FL30 Fluorometers
page 9
Figure 10: processing mv file to ppb
Figure 11: Adjustment of Turbidity Sensitivity

German-Lebanese Technical Cooperation Project Protection of Jeita Spring
ANNEX 1: Using the Albillia GGUN FL30 Fluorometers
page 10
S16 Go to Fluo folder, copy the last 2 files created, the “.MV” and the “.PPB” files that have the same name you specified in steps S5 and S13 (Figure 12), then paste those in the folder created in step S5 (Figure 13) so that you have all resulting files for one test in the same folder.
Figure 12: Copy “MV” and “PPB” Files from Fluo Program Folder

German-Lebanese Technical Cooperation Project Protection of Jeita Spring
ANNEX 1: Using the Albillia GGUN FL30 Fluorometers
page 11
Figure 13: Paste .MV and .PPB Files to the created Subdirectory of the
Dilution Test
S16 Go back to the flash card, select the .TXT files and the GIGALOG.ADC file and delete them from the card but leave the two .DAT files (Figure 14). Remove the card from the card reader and reinsert into the data logger, change the battery and run the data logger again if needed.
(Remark: If you leave the previous .TXT and .ADC files on the CF card, data recording would be appended to the previous .TXT file, unless the settings of the logger were changed, e.g. to a different time interval or number of tracers)

German-Lebanese Technical Cooperation Project Protection of Jeita Spring
ANNEX 1: Using the Albillia GGUN FL30 Fluorometers
page 12
Figure 14: Cleaning the CF card

German-Lebanese Technical Cooperation Project Protection of Jeita Spring
ANNEX 2: Synchronizing Date and Time for the Albillia GGUN FL30 Fluorometers
page 1
ANNEX 2 : Synchronizing Date and Time for the Albillia GGUN FL30 Fluorometers
1 Time Settings of the Reference PC/Notebook When you conduct tracer tests or dilution tests, date and time must be synchronized with a standard time so that all fluorometers are using the same data and time before the start of the test. Usually you will use one PC or notebook as a reference which gives you this standard time. For this PC or notebook you have to disable internet time synchronization (Figure 1) and uncheck "automatically adjust clock for daylight saving time" (Figure 2).
Figure 1: Disabling Internet Synchronization for the Reference PC/Notebook

German-Lebanese Technical Cooperation Project Protection of Jeita Spring
ANNEX 2: Synchronizing Date and Time for the Albillia GGUN FL30 Fluorometers
page 2
Figure 2: Disabling Daytime Saving for the Reference PC/Notebook
2 Installation of Giga Term Program To synchronize the clock of the Fluorometer, you need to install the software “Giga Term” (provided with the Fluo program by Albillia). Create a shortcut to Giga Term and place it on your desktop.
3 Equipment needed for Time Synchronization For time synchronization you need (Figure 3):
• A serial cable provided with the fluorometer (the grey cable) • A serial to USB converter cable (the black cable) and • A notebook with the Giga Term program
In order to carry out the synchronization, the fluorometer needs to be connected via the cable to the logger. The serial cable and serial to USB adapter need to link the logger with the PC/notebook. The CF card needs to be removed from the logger.

German-Lebanese Technical Cooperation Project Protection of Jeita Spring
ANNEX 2: Synchronizing Date and Time for the Albillia GGUN FL30 Fluorometers
page 3
Figure 3: Equipment needed for Time Synchronization
Albillia provides a MAXXTRO U232-P9 serial (RS232) to USB adapter. A driver needs to be installed designated for the operating system you are using ! This driver may need to be downloaded from the internet (www.maxxtro.ch). Once installed check the COM port in use. To do so access the device manager (Figure 4). To change the COM port (Figure 5): right-click on serial on USB port > properties > port settings > advanced > com port number > select com port

German-Lebanese Technical Cooperation Project Protection of Jeita Spring
ANNEX 2: Synchronizing Date and Time for the Albillia GGUN FL30 Fluorometers
page 4
Figure 4: Access Device Manager
Figure 5: Change Serial Port of USB to Serial Adapter

German-Lebanese Technical Cooperation Project Protection of Jeita Spring
ANNEX 2: Synchronizing Date and Time for the Albillia GGUN FL30 Fluorometers
page 5
4 Time Synchronization For time synchronization of the logger use the follow steps:
S1 Switch data logger off, remove CF card and adjust the second switch from the left to "1" by pressing once on the button below the display (Figure 6; the switch has no label).
> remember to return the "synchronization switch" back to "0" after successful synchronization !
S2 Plug the serial cable in the RS232 port of the data logger and link it with the USB converter to the PC.
S3 Start the “Giga Term” program (you may need to run it as administrator for windows 7), click on “tcp\ip” drop-down menu and choose the correct COM port (see device manager). Be sure that the baud rate in the next drop-down menue is set to “9600”, then check “ouvrir” (Figure 7).
Figure 6: Adjustment of Time Synchronization Switch on Logger

German-Lebanese Technical Cooperation Project Protection of Jeita Spring
ANNEX 2: Synchronizing Date and Time for the Albillia GGUN FL30 Fluorometers
page 6
Figure 7: COM Port Settings in the Giga Term Program
S4 Click on the first yellow box on the left “Charger a partir de Gigalog” (arrow up). Some lines will appear in the main window ending with no cf.
Figure 8: Read-out of Time from Logger

German-Lebanese Technical Cooperation Project Protection of Jeita Spring
ANNEX 2: Synchronizing Date and Time for the Albillia GGUN FL30 Fluorometers
page 7
S5 Click on the watch icon (fifth yellow icon from the left) “envoyer date et l’heure a Gigalog”, three lines appear in the main window ending with “ok” (they show you the time difference between the previous and the current time setting).
S6 Now your fluorometer is synchronized with your PC. Quit “Giga term” program, switch off the data logger, unplug the serial to USB cable, reinsert the CF card in the data logger and put the time synchronization switch back to “0”.