tracer study concepts and principles · 2018-03-19 · health, nursing, pharmacy study program)...
TRANSCRIPT

COMPARISON OF MAIN RESULTS OF TRACER STUDY
UNIVERSITAS INDONESIA 2010 AND 2011
Ahmad Syafiq and Sandra Fikawati Career Development Center Universitas Indonesia

Introduction
Since 2010, Tracer Study Universitas Indonesia (TSUI) has been conducted with specific characteristics:
censal (not sampling),
self-administered online data collection (no paper and interview),
standardized instrument (questionnaire), and
regular (implemented yearly)

Introduction
Number of population:
- TSUI 2010 was 5276 graduates
- TSUI 2011 was 5564 graduates
The number of undelivered cases:
- TSUI 2010 was 6%
- TSUI 2011 was 13% Response rate:
- TSUI 2010 was 55% (net)
- TSUI 2011 was 48%
Data completeness:
- TSUI 2010 was 74%
- TSUI 2011 was 78%

Introduction
Themes covered in TSUI include socio-biographic aspect, learning experiences, transition to work, employment situation, and competencies and work.
Selected variables in each theme are presented in this paper.
Variable selection was based on current issues in higher education especially in Indonesia.
Due to different questionnaires used in the studies (TSUI 2011 used International Core Questionnaire developed by Unitrace), not all variables could be compared.

Socio-biography
In term of gender, TSUI 2011 showed that 55% respondents of TSUI 2011 are female.
There were more female than male in most faculties, except for Faculty Engineering, Faculty of Computer Sciences, Faculty of Law, and Faculty of Economics where male are predominant (76%, 69%, 56%, and 51%, respectively).
Around 60% of graduates came from Jakarta (capital of Indonesia; UI is located in Depok, in the outskirt of Jakarta), while around 30% came from other places in Java island, 8.8% from Sumatera island, and the rest were from other areas in Indonesia.

Gender
n= 2038
6

High School Location
59.0%
30.2%
8.8%
0.6% 0.5% 0.4% 0.3% 0.1%0%
20%
40%
60%
80%
100%
Jakarta Jawa Sumatera Bali & NT Kalimantan Sulawesi Papua Malukun= 2019
7

Sociobiography
Parental education background of TSUI 2011 respondents were mostly high school (for both father and mother, around 30% father and 37% mother), followed by bachelors (28% father, 20% mother).
Graduates whose parents have low and very low education background (not finished junior high school or lower) were 7% (father) and 9% (mother).
These figures is important to determine the equality aspect of higher education and the data shown that UI entrance was not limited to those highly educated population.
However, this is to be compared with situation in other universities in Indonesia before firm conclusion could be drawn.

Fathers’ Education
29.9%
27.7%
14.1%
11.7%
5.1%
3.5%
2.7%
1.7%
0.9%
0.8%
0.7%
0.5%
0.3%
0.2%
0% 20% 40% 60% 80% 100%
Complete high school
Higher education complete
Postgraduate complete
Technical level complete
Complete junior high school
Higher education incomplete
Complete primary school
Incomplete primary school
Incomplete high school
Technical level incomplete
Incomplete Junior High School
Postgraduate incomplete
Do not know
Without educationn= 2025
9

37%
20%
15%
8%
6%
6%
3%
2%
2%
1%
1%
0%
0%
0%
0% 10% 20% 30% 40% 50% 60% 70% 80% 90% 100%
Complete high school
Higher education complete
Technical level complete
Complete junior high school
Complete primary school
Complete postgraduate
Higher education incomplete
Incomplete primary school
Incomplete high school
Incomplete junior high …
Technical level incomplete
Do not know
Without education
Incomplete postgraduate
Mothers’ Education
n= 2025
10
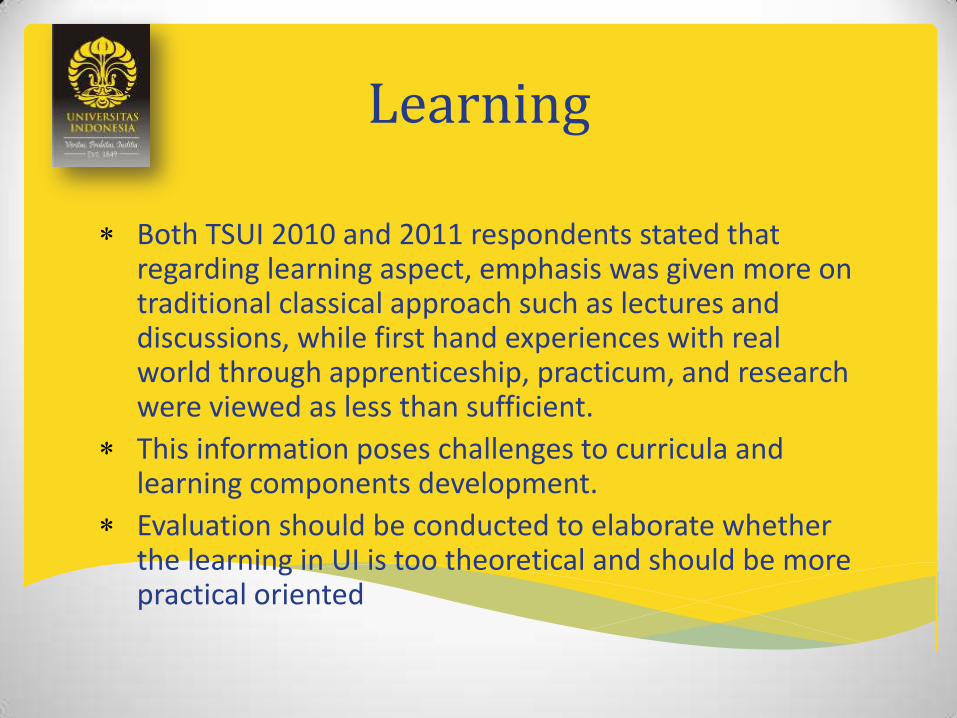
Learning
Both TSUI 2010 and 2011 respondents stated that regarding learning aspect, emphasis was given more on traditional classical approach such as lectures and discussions, while first hand experiences with real world through apprenticeship, practicum, and research were viewed as less than sufficient.
This information poses challenges to curricula and learning components development.
Evaluation should be conducted to elaborate whether the learning in UI is too theoretical and should be more practical oriented

4.27
4.01
3.30
3.23
2.96
2.82
1 2 3 4 5
Lectures
Discussions
Demonstrations
Practical exercises/Field work
Participation in research projects/project based
Internship
Emphasis of Learning Aspects by Study Program
n= 2010
n= 2027
n= 2000
n= 2008
n= 2005
n= 2016
Not At All Very high

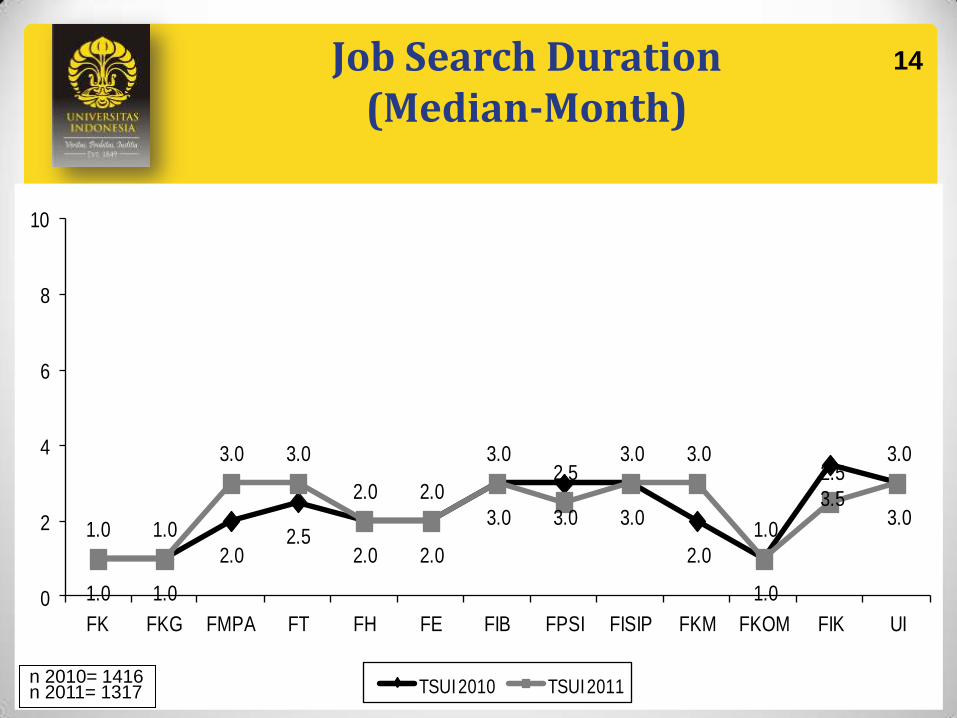
Employability
One of main indicators of graduate employability is the duration of job search period.
Both TSUI 2010 and TSUI 2011 showed that for UI graduates in general; the median of job search duration was 3 months. There were variations and differences among faculties by year.
- Consistently, Faculties of Medicine, Dentistry, and Computer Sciences have the shortest duration of 1 month in both studies.
It is noted that both studies reveal: - Internet is the main method of job searching, this reflects the importance of information technology in today generation. - Other popular methods of job search include: - Information from career center at university and faculty level, - Advertisement in newspaper or magazine, and - Connection through family, friend, and or lecturer.
1.0 1.0
2.02.5
2.0 2.0
3.0 3.0 3.0
2.0
1.0
3.53.0
1.0 1.0
3.0 3.0
2.0 2.0
3.02.5
3.0 3.0
1.0
2.53.0
0
2
4
6
8
10
FK FKG FMPA FT FH FE FIB FPSI FISIP FKM FKOM FIK UI
TSUI 2010 TSUI 2011
Job Search Duration (Median-Month)
n 2010= 1416 n 2011= 1317
14
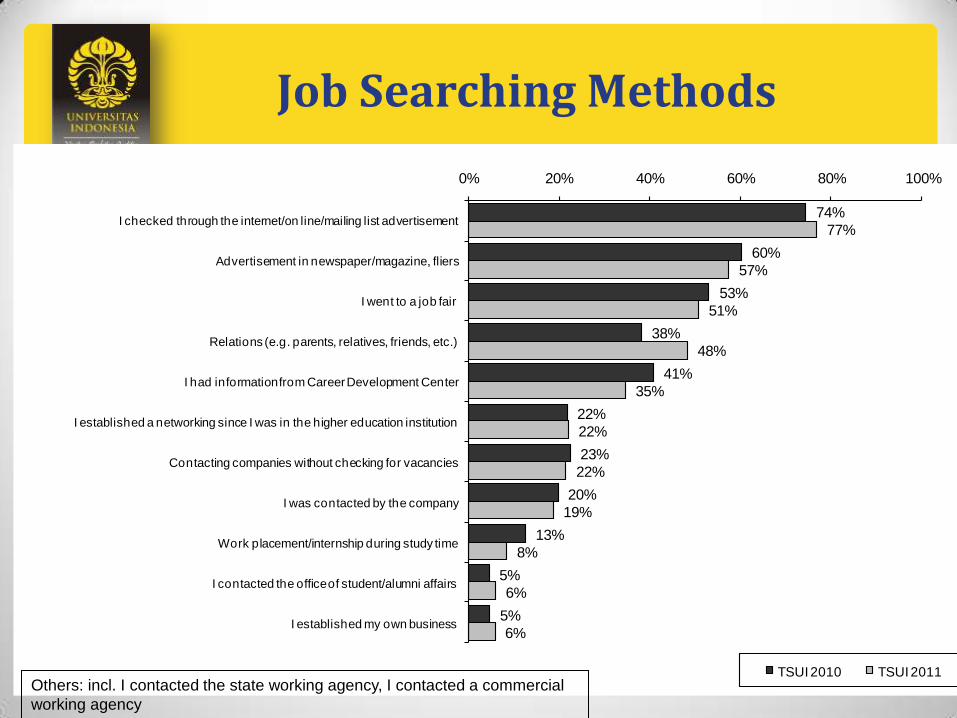
74%
60%
53%
38%
41%
22%
23%
20%
13%
5%
5%
77%
57%
51%
48%
35%
22%
22%
19%
8%
6%
6%
0% 20% 40% 60% 80% 100%
I checked through the internet/on line/mailing list advertisement
Advertisement in newspaper/magazine, fliers
I went to a job fair
Relations (e.g. parents, relatives, friends, etc.)
I had information from Career Development Center
I established a networking since I was in the higher education institution
Contacting companies without checking for vacancies
I was contacted by the company
Work placement/internship during study time
I contacted the office of student/alumni affairs
I established my own business
TSUI 2010 TSUI 2011
Job Searching Methods
Others: incl. I contacted the state working agency, I contacted a commercial
working agency

Employability
The pattern of employability was almost similar but self-employed increased slightly.
- Private institutions (TSUI 2010 65.0%, TSUI 2011 60.9%),
- Government institutions (TSUI 31.9%, TSUI 2011 33.6%)
- Self-employed (TSUI 2010 3.1%, TSUI 2011 5.5%).
Work challenge (around 35%) is the main consideration in choosing the first job, followed by salary (30%) and other benefits.

32%
65%
3%
35%
60%
5%
0%
20%
40%
60%
80%
100%
Public Employer Private Employer Self Employer
TSUI 2010 TSUI 2011
Type of Current Employer
n 2010= 1618
n 2011= 1841
17

Main Consideration to Select Job
33.9%30.3%
6.5% 6.2% 5.2% 4.6% 4.5% 4.2% 3.2% 1.5%
%
20%
40%
60%
80%
100%
Challenges in
the job
Salary Proximity to
house
Scholarship
opportunity
Experience Benefits Matchness
with discipline
Others Interest Company
reputation
n= 1379
18

Competencies
Regarding acquired and required competencies, most respondents had a positive perception (positive gap) for most of competencies, meaning that they acquired more than the requirements in their work.
The closest gaps between acquirement and requirement were for skills beyond cognition such as communication and negotiating skills.
The only negative gap was found for research competence.
The results pointed to the importance of other key skills needed by students as to survive in the world after higher education.

Knowledge of your field(s) or
discipline(s)
Knowledge of other field(s) or
discipline(s)
General knowledge
Internet skills
Computer skills
Critical thinking
Research skills
Learning ability
Communication skills
Working under pressure
0
1
2
3
4
5
6
7
8
9
10
1 2 3 4 5
Competencies after Graduation Application in World of Work
Competencies (1)
Very low Very high
20

Time management
Working independently
Team work ability
Problem-solving ability
Negotiation
Analytical ability
Tolerance
Adaptability
Loyalty and integrety
Working with people of different cultures
and backgrounds
0
1
2
3
4
5
6
7
8
9
10
1 2 3 4 5
Competencies after Graduation Application in World of Work
Competencies (2) 21
Very low Very high

Leadership
Responsibility
Initiative
Project/program management
Ability to present ideas and information
Ability to write reports and documents
Ability to continuously learn
0
1
2
3
4
5
6
7
1 2 3 4 5
Competencies after Graduation Application in World of Work
Competencies (3) 22
Very low Very high

Link and Match
Link and match indicators of horizontal and vertical matches among respondents in both studies are close to expectation
Horizontal matches were 20% in TSUI 2010 and 16% in TSUI 2011,
Vertical matches were over qualification of 6.6% in TSUI 2010 and 5.3% in TSUI 2011
23

Horizontal Mismatch
20%16%
0%
20%
40%
60%
80%
100%
TSUI 2010 TSUI 2011
n 2010= 1752 n 2011= 858
24

Vertical Mismatch
27.6%
65.8%
6.6%
29.4%
65.3%
5.3%
0%
20%
40%
60%
80%
100%
Under Education Matched Over Education
TSUI 2010 TSUI 2011
n 2010= 1762 n 2011= 1513
25

Link and Match
The most horizontally matched is faculties in the health sciences cluster (Faculties of Medicine, Dentistry, Public Health, Nursing, Pharmacy Study Program)
Followed by faculties within science and technology cluster (Faculties of Engineering, Computer Sciences, and Mathematics and Natural Sciences), and
Then faculties in social-humanities cluster (Faculties of Social and Political Sciences, Economics, Law, Psychology, and Humanities).
The interpretation of match should be taken carefully due to different nature of different discipline and their closeness to the profession.
26

Horizontal Mismatch Based on Cluster
n 2010= 1762 n 2011= 1513
25.3%
15.9%
7.4%
18.5%15.2%
9.6%
0%
10%
20%
30%
40%
50%
60%
70%
80%
90%
100%
Humanities Science Technology Health
TSUI 2010 TSUI 2011n 2010= 1752 n 2011= 1527
27

Conclusion
TSUI 2010 is better than TSUI 2011 in terms of undelivered rate and response rate, but TSUI 2011 is better in term of data completion
TSUI 2010 and TSUI 2011 are indifferent for variables related to learning process and transition to employment, i.e. learning aspect emphasis, job search duration, method to find job, type of employer, and acquired and required competencies.
Regarding link and match, TSUI 2011 shows better matching than TSUI 2010 both horizontally and vertically.
Overall, for the selected variables, TSUI 2010 and 2011 results are consistent and the results provide an optimistic promise for UI graduates.
28

29