trace elements analysis of echinacea purpurea—herbal medicinal
TRANSCRIPT
Short communication
Trace elements analysis of Echinacea purpurea*/herbalmedicinal
Slavica Razic a,*, Antonije Onjia b, Branislav Potkonjak c
a Faculty of Pharmacy, University of Belgrade, Vojvode Stepe 450, 11211 Belgrade, Yugoslaviab Vinca Institute of Nuclear Sciences, P.O. Box 522, 11001 Belgrade, Yugoslavia
c Institute for Chemistry, Technology and Metallurgy, Karnegijeva 4, 11001 Belgrade, Yugoslavia
Received 13 January 2003; received in revised form 5 June 2003; accepted 6 June 2003
Abstract
Elemental composition of Echinacea purpurea (Asteracae), grown in Serbia under strongly controlled conditions, has
been studied. To distinguish elemental patterns of different parts of the plant, the content of Zn, Fe, Cu, Mn, Ca, Mg,
Sr, Ni, and Li in root versus upper plant parts were determined, by flame atomic absorption and flame atomic emission
spectrometry. Analyses of the mentioned elements in soil and in an ethanolic extract of E. purpurea were made, too. The
trace element data were evaluated by multivariate methods, i.e. principal component analysis and hierarchical cluster
analysis. This revealed two groups of elements (I: Fe, Cu, Mn, Li; II: Ca, Mg, Zn, Ni), while trace element profiles of
root, stem, leaves, and flowers of this plant differed significantly. However, no significant difference in the trace element
patterns between the summer and the autumn harvest samples was found.
# 2003 Elsevier B.V. All rights reserved.
Keywords: Echinacea purpurea ; Trace elements; Atomic absorption spectrometry; Atomic emission spectrometry; Chemometrics
1. Introduction
Echinacea purpurea (Asteraceae), also known as
the purple coneflower, is an herbal medicine with
positive effects on various immune parameters [1].
It is usually used in supportive therapy of colds
and chronic infections of the respiratory and the
lower urinary tract. Although many of the active
compounds of E. purpurea have been identified,
the mechanism of its action remained unknown [2].
Specifically, there are some recent literature data
on the determination of numerous molecular
constituents of this plant [3�/11] and also on the
Echinacea products activity [12]. But, as far as
trace and minor elements determination in this
medicinal plant is concerned, the data are still
missing. These elements are essential for normal
growth of plants, their protection against plant
viruses, immunity and the completion of the life
cycle [13,14].
The objective of this study was to quantify the
content of various elements that might be respon-
* Corresponding author. Present address: Faculty of
Pharmacy, Institute of Analytical Chemistry, University of
Belgrade, P.O. Box 146, 11001 Belgrade, Yugoslavia. Fax: �/
381-11-4889-397.
E-mail address: [email protected] (S. Razic).
Journal of Pharmaceutical and Biomedical Analysis
33 (2003) 845�/850 www.elsevier.com/locate/jpba
0731-7085/03/$ - see front matter # 2003 Elsevier B.V. All rights reserved.
doi:10.1016/S0731-7085(03)00338-8
sible for some properties of Echinacea, such as itsimmunostimulatory and anti-inflammatory activ-
ities. Investigated elements were chosen (Zn, Fe,
Cu, Mn, Ca, Mg, Sr, Ni and Li) according to their
role and importance in many biological mechan-
isms.
Quantitative determination of the mentioned
elements in different parts of E. purpurea , grown
in the eastern part of Serbia (samples from thesummer and autumn harvests of 2001), as well as
within the soil itself, was performed. In addition,
an evaluation of their distribution in plant tissues
was discussed.
In order to provide a better insight into the
elemental pattern, a common chemometrics ap-
proach to data analysis was used. Several multi-
variate methods have been used to analyze thedata sets obtained by chemical measurement of
trace elements in various plants [15,16]. However,
except one article [6] dealing with multivariate
analysis of organic compounds data set, there are
no data on trace elements in E. purpurea analyzed
by means of chemometrics. Principal component
analysis and cluster analysis were used in this work
to study the association of nine trace elements inE. purpurea and to evaluate their distribution
between different parts of this plant.
2. Experimental
2.1. Solutions and reagents
Standard solutions were prepared by dilution of
single-element standards (1000 mg/ml) obtained
from Merck (Darmstadt, Germany) with 1 M
HCl. Concentrations of these working standard
solutions (five standards for each element) were in
the linear calibration range of each element. All
acids (HCl, HNO3, HClO4 and HF) used in this
work were purchased from Merck and were ofreagent grade quality. All aqueous solutions and
dilutions were prepared with bidistilled water.
2.2. Sample preparation
E. purpurea cultivated in eastern Serbia, under
strongly controlled conditions, was collected in
July (summer harvest) and in autumn (the end ofSeptember and the beginning of October) in 2001.
The roots (root samples were collected in autumn
only) were slightly washed in field and again in
laboratory with bidistilled water in order to
remove soil; each plant sample was cut into five
parts, stored in brown paper bags, and dried at
105 8C until constant weight was obtained. All
samples were then ground through a stainless steelmill. An ethanolic extract of E. purpurea commer-
cially available at the Serbian market was used,
too. The plant samples were prepared according to
AOAC 975.03 and 985.01 methods [17]. Accu-
rately weighted samples of roots, steams, leaves,
flowers and herbs (�/1 g each) and 10 ml of the
extract were slightly heated on a hot plate at 100�/
120 8C, for 15 min, then placed into a furnace andfurther heated at 500 8C for 2 h. After cooling, ten
drops of bidistilled water and then 4.0 ml of 8 M
HNO3 were added into each sample, slightly
heated on the hot plate to dryness then placed in
the furnace at 500 8C, for 1 h. After cooling, 10 ml
of 6M HCl was added in each sample and the
contents were quantitatively transferred into 50 ml
volumetric flasks.Soil samples (�/0.2 g) were totally decomposed
in a mixture of concentrated acid (5 ml of HClO4
and 10 ml of HF) by gentle heating for 20 min at
100�/120 8C. Ten milliliters of HF was added into
the samples twice into the samples during digestion
for additional 40 min. Beside ‘total’ decomposi-
tion, the soil samples were leached with 0.1 M HCl
(30 min at 100 8C), and the contents werequantitatively transferred to 25 ml volumetric
flasks. This second procedure was employed in
order to ‘simulate’ acid soil.
2.3. Instrumentation
Samples were analysed for Zn, Fe, Cu, Mn, Ca,
Mg, Sr and Ni by flame atomic absorption
spectrometry (AAS) and for Li by flame atomicemission spectrometry (AES), using a Perkin�/
Elmer Model 403 atomic spectrometer (Perkin�/
Elmer, Norwalk, USA). The operating parameters
and the analyte characteristics are given in Table 1.
The signals were measured with the background
correction (deuterium lamp) at optimal flame
S. Razic et al. / J. Pharm. Biomed. Anal. 33 (2003) 845�/850846

heights. Ionization was controlled by adding 5 ml
(10 g/l CsCl�/100 g/l La) buffer solution (Merck,
p.a.) to all samples and standards. The concentra-
tions of different elements in these samples were
determined by the external standard method usingthe corresponding calibration curves. The em-
ployed AAS and AES methods are not only
sufficiently sensitive but enable cost-benefit analy-
sis to be made [18].
2.4. Data analysis
The statistical data processing was performed by
using the SPSS software package, using thelogarithmically transformed trace element concen-
tration data set. The principal component analysis
and the hierarchical cluster analysis were applied
to analyze trace element patterns in different parts
of the Echinacea plant and its ethanolic extract,
and to relate them with the soil composition.
3. Results and discussion
The biological effects of estimated elements (Zn,
Fe, Cu, Mn, Ca, Mg, Sr, Ni and Li) in living
systems strongly depend on their concentration
[14,19] and thus should be carefully controlled
[20], especially when herbs and their products are
used in human medicine as it is the case with
Echinacea. Trace element concentrations in plants
vary widely with the soil type, pH, fertilizer and
organic content, climate, species, etc. To distin-
guish the elemental pattern of different parts of
this plant, grown in Serbia, under strongly con-
trolled conditions, the content of Zn, Fe, Cu, Mn,
Ca, Mg, Sr, Ni and Li in root versus upper plant
parts were determined. In addition, the soil
samples and the ethanolic extract of Echinacea
were analyzed, too.
The concentrations of nine trace elements in E.
purpurea , expressed on a dry weight basis, are
listed in Table 2. Each result is the mean value of
five sample measurements. The relative standard
deviations were in the range from 0.2 to 2.5%
confirming good reproducibility of the applied
method. The results obtained after ‘total’ decom-
position of the soil samples are too high (Cu*/50.1
mg/g, Fe*/29.8 mg/g, Li*/51.0 mg/g, Mg*/6.85
mg/g, Mn*/945 mg/g, Ni*/22.8 mg/g, Sr*/87.5 mg/
g, Zn*/50.8 mg/g and Ca*/9.55 mg/g) to be taken
into account in data evaluation. This large differ-
ence between the soil and plant concentrations
could be explained by the fact that the root
absorption mechanism is not able to absorb all
the elements in their total amount.
The concentration of trace elements decreases as
follow: Ca�/Mg�/Fe�/Mn�/Cu�/Zn�/Sr�/
Table 1
Operating conditions and analyte characteristics
Element l b (nm) Slit (nm) Flame type CCc (mg/ml) Ranged (mg/ml) DLe (mg/ml)
Cu 324.8 0.7 A�/Ac 0.077 5.0 0.012
Fe 248.3 0.2 A�/Ac 0.110 6.0 0.03
Mn 279.5 0.2 A�/Ac 0.052 2.0 0.01
Zn 231.9 0.7 A�/Ac 0.018 1.0 0.01
Ni 232.0 0.2 A�/Ac 0.140 2.0 0.04
Lia 670.8 0.7/1.4 A�/Ac 0.035 3.0 0.01
Sr 460.7 0.2/0.4 N�/Ac 0.110 5.0 0.05
Mg 285.2 0.2 N�/Ac 0.036 0.50 0.01
Ca 422.7 0.2 N�/Ac 0.048 5.0 0.012
A�/Ac: air�/acetylene; N�/Ac: nitrous oxide-acetylene.a Emission intensity measured by AESb Wavelength.c Characteristic concentration (sensitivity).d Linear range.e Detection limits obtained under experimental conditions.
S. Razic et al. / J. Pharm. Biomed. Anal. 33 (2003) 845�/850 847
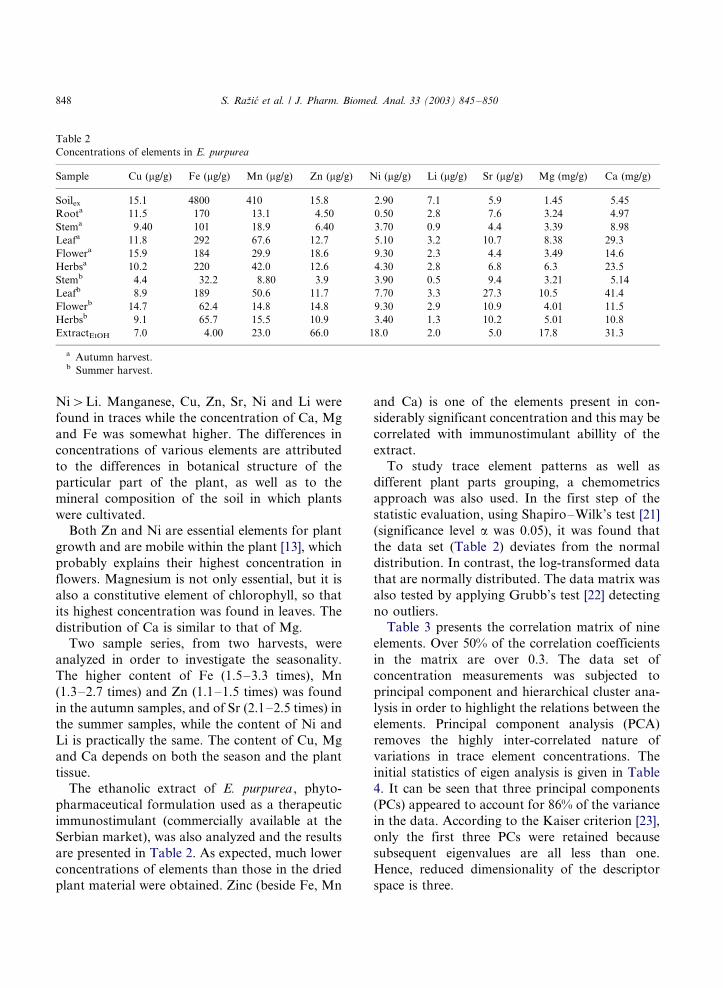
Ni�/Li. Manganese, Cu, Zn, Sr, Ni and Li were
found in traces while the concentration of Ca, Mg
and Fe was somewhat higher. The differences in
concentrations of various elements are attributed
to the differences in botanical structure of the
particular part of the plant, as well as to the
mineral composition of the soil in which plants
were cultivated.Both Zn and Ni are essential elements for plant
growth and are mobile within the plant [13], which
probably explains their highest concentration in
flowers. Magnesium is not only essential, but it is
also a constitutive element of chlorophyll, so that
its highest concentration was found in leaves. The
distribution of Ca is similar to that of Mg.
Two sample series, from two harvests, were
analyzed in order to investigate the seasonality.
The higher content of Fe (1.5�/3.3 times), Mn
(1.3�/2.7 times) and Zn (1.1�/1.5 times) was found
in the autumn samples, and of Sr (2.1�/2.5 times) in
the summer samples, while the content of Ni and
Li is practically the same. The content of Cu, Mg
and Ca depends on both the season and the plant
tissue.
The ethanolic extract of E. purpurea , phyto-
pharmaceutical formulation used as a therapeutic
immunostimulant (commercially available at the
Serbian market), was also analyzed and the results
are presented in Table 2. As expected, much lower
concentrations of elements than those in the dried
plant material were obtained. Zinc (beside Fe, Mn
and Ca) is one of the elements present in con-
siderably significant concentration and this may be
correlated with immunostimulant abillity of the
extract.
To study trace element patterns as well as
different plant parts grouping, a chemometrics
approach was also used. In the first step of the
statistic evaluation, using Shapiro�/Wilk’s test [21]
(significance level a was 0.05), it was found that
the data set (Table 2) deviates from the normal
distribution. In contrast, the log-transformed data
that are normally distributed. The data matrix was
also tested by applying Grubb’s test [22] detecting
no outliers.Table 3 presents the correlation matrix of nine
elements. Over 50% of the correlation coefficients
in the matrix are over 0.3. The data set of
concentration measurements was subjected to
principal component and hierarchical cluster ana-
lysis in order to highlight the relations between the
elements. Principal component analysis (PCA)
removes the highly inter-correlated nature of
variations in trace element concentrations. The
initial statistics of eigen analysis is given in Table
4. It can be seen that three principal components
(PCs) appeared to account for 86% of the variance
in the data. According to the Kaiser criterion [23],
only the first three PCs were retained because
subsequent eigenvalues are all less than one.
Hence, reduced dimensionality of the descriptor
space is three.
Table 2
Concentrations of elements in E. purpurea
Sample Cu (mg/g) Fe (mg/g) Mn (mg/g) Zn (mg/g) Ni (mg/g) Li (mg/g) Sr (mg/g) Mg (mg/g) Ca (mg/g)
Soilex 15.1 4800 410 15.8 2.90 7.1 5.9 1.45 5.45
Roota 11.5 170 13.1 4.50 0.50 2.8 7.6 3.24 4.97
Stema 9.40 101 18.9 6.40 3.70 0.9 4.4 3.39 8.98
Leafa 11.8 292 67.6 12.7 5.10 3.2 10.7 8.38 29.3
Flowera 15.9 184 29.9 18.6 9.30 2.3 4.4 3.49 14.6
Herbsa 10.2 220 42.0 12.6 4.30 2.8 6.8 6.3 23.5
Stemb 4.4 32.2 8.80 3.9 3.90 0.5 9.4 3.21 5.14
Leafb 8.9 189 50.6 11.7 7.70 3.3 27.3 10.5 41.4
Flowerb 14.7 62.4 14.8 14.8 9.30 2.9 10.9 4.01 11.5
Herbsb 9.1 65.7 15.5 10.9 3.40 1.3 10.2 5.01 10.8
ExtractEtOH 7.0 4.00 23.0 66.0 18.0 2.0 5.0 17.8 31.3
a Autumn harvest.b Summer harvest.
S. Razic et al. / J. Pharm. Biomed. Anal. 33 (2003) 845�/850848

One of the main objectives of PCA is to identify
factors that are substantively meaningful. In this
case, the first principal component shows a high
positive correlation with variables Ni, Zn, and the
second principal component a high correlation
with variables Li, Mn, Cu and Fe. The third
principal component comprises Li, Mn, Fe and Sr.
Fig. 1 illustrates principal component plot in
rotated space in which the elements can be
clustered.
A graphical depiction of different plant parts
groupings was obtained by means of hierarchical
cluster analysis (HCA) of standardized concentra-
tions using Ward’s method [24] as an amalgama-
tion rule and the squared Euclidean distance as a
measure of the proximity between samples. A
dendrogram is shown in Fig. 2. As a result of
applying HCA to the principal component score
matrix, the parts split to two main groups. Never-
theless, the soil and Echinacea extract are well
separated from other plant parts, while the extract
is more similar to one of the groups.
Generally, both principal component analysis
and cluster analysis certified that there is a
correlation between trace elements in E. purpurea .
However, no clear difference between the summer
and the autumn harvest was observed.
E. purpurea was analyzed in order to get some
useful information to be used in the preparation of
drugs from this plant material. As there are no
reports in literature on the trace element content in
Echinacea, this paper should be considered as a
contribution to that course. Being far from know-
ing exactly the mechanisms of action and the
formation of active constituents of this medicinal
plant, a direct link between the elemental content
and its curative effect remains to be established.
Table 3
The correlation matrix of trace element data (Pearson correlation)
Cu Fe Mn Zn Ni Li Sr Mg
Fe 0.61
Mn 0.49 0.77
Zn 0.22 �/0.25 0.34
Ni �/0.07 �/0.42 0.06 0.74
Li 0.75 0.62 0.77 0.42 �/0.02
Sr �/0.17 0.05 �/0.02 �/0.22 0.02 0.12
Mg �/0.33 �/0.63 �/0.20 0.54 0.55 �/0.04 0.31
Ca 0.01 �/0.26 0.15 0.61 0.66 0.24 0.34 0.87
Table 4
Eigen analysis of the correlation matrix
Variable Eigenvalue Cumulative
Cu 3.4018 0.378
Fe 3.0425 0.716
Mn 1.3117 0.862
Zn 0.5458 0.922
Ni 0.4066 0.968
Li 0.2544 0.996
Sr 0.0267 0.999
Mg 0.0099 1.000
Ca 0.0005 1.000
Fig. 1. Principal component plot in rotated space.
S. Razic et al. / J. Pharm. Biomed. Anal. 33 (2003) 845�/850 849

4. Conclusion
E. purpurea from eastern Serbia exhibits two
different elemental distribution patterns within the
plant. Flowers contain the highest concentration
of Cu, Zn and Ni, while the concentration of Mg,
Ca, Fe, Mn, Li and Sr is the highest in leaves. In
order to develop a stronger basis to estimated the
curative effects of E. purpurea , the extract has tobe investigated both in terms of elemental compo-
sition and biochemical make-up.
References
[1] J.A. Duke, Handbook of Medicinal Herbs, 2nd ed., CRC
Press, Boca Raton, FL, 2002.
[2] S. Persival, Biochem. Pharmacol. 60 (2000) 155�/158.
[3] K. Gowniak, G. Zgorka, M. Kozyra, J. Chromatogr. A
730 (1�/2) (1996) 25�/29.
[4] N.B. Perry, J.W. Van Klink, E.J. Burgess, G.A. Parmen-
ter, Planta Med. 63 (1) (1997) 58�/62.
[5] X.G. He, L.Z. Lin, M.W. Bernart, L.Z. Lian, J. Chroma-
togr. 815 (2) (1998) 205�/211.
[6] D. Lienert, E. Anklam, U. Panne, Phytochem. Anal. 9 (2)
(1998) 88�/98.
[7] J. Tekel, S. Tahotna, S. Vaverkova, J. Pharmaceut.
Biomed. Anal. 16 (1998) 753�/758.
[8] X.G. He, L.Z. Lin, M.W. Bernart, L.Z. Lian, J. Chroma-
togr. A 815 (1998) 205�/211.
[9] E.B. Perry, E.J. Burgess, V.L. Glennie, J. Agric. Food
Chem. 49 (2001) 1702�/1706.
[10] M. Ganzera, P. Pujol, L. Walker, I.A. Khan, Pharmazie 56
(2001) 552�/553.
[11] E.A. Abourashed, I.A. Khan, J. Pharm. Sci. 90 (2001)
817�/822.
[12] H. Wagner, Environ. Health Perspect. 107 (1999) 779�/
781.
[13] J.P. Bennett, E. Chiriboga, J. Coleman, D.M. Waller, Sci.
Tot. Environ. 246 (2000) 261�/269.
[14] F.K. Ennever, in: W.A. Hayes (Ed.), Principles and
Methods of Toxicology, Raven Press, New York, 1994,
pp. 417�/431.
[15] J. Qi, S. Feng, X. Yang, X. Lu, J. Zhou, H. Xu, J. Guan,
Chem. J. Internet 3 (7) (2001) 31�/41.
[16] A. Carlosena, J.M. Andrade, X. Tomas, E. Fernandez, D.
Prada, Talanta 48 (1999) 795�/802.
[17] AOAC 975.03 and 985.01, Metals in Plants and Pet Foods,
Official Methods of Analysis of AOAC International, 17th
ed., Arlington, Gaithersburg, MD, 2002.
[18] L.H.J. Lajunen, Spectrochemical Analysis by Atomic
Absorption and Emission, Royal Society of Chemistry,
Cambridge, 1992, pp. 230�/233.
[19] D.A. Schuschke, J.T. Saari, F.N. Miller, D.G. Lominadze,
J. Trace Elem. Exp. Med. 9 (1996) 63�/72.
[20] A. Jacob, in: N.W. Tietz (Ed.), Textbook of Clinical
Chemistry, Saunders, Philadelphia, PA, 1994, pp. 965�/
980.
[21] S.S. Shapiro, M.B. Wilk, Biometrika 52 (1965) 591�/611.
[22] F.E. Grubbs, Technometrics 11 (1) (1969) 1�/21.
[23] H.F. Kaiser, Educ. Psychol. Meas. 20 (1960) 141�/151.
[24] J.H. Ward, J. Am. Stat. Assoc. 58 (1963) 236�/244.
Fig. 2. Dendrogram of cluster analysis of E. purpurea .
S. Razic et al. / J. Pharm. Biomed. Anal. 33 (2003) 845�/850850